Article

Bats in the Urban Desert: Acoustic Diversity and Community Composition Along an Urban–Rural Gradient in Tacna, Peru

by
Mauricio Salas-Salinas
1,2,3,*,
Francisco L. Quispe-Huacca
1,2,3,
Jessica L. Curo-Mamani
1,2,3,
Maria C. Soto-Rojas
1,2,3,
Alexander A. Torres-Auccapuri
1,2,3,
Estéfany M. Choque-Condori
1,2,3,
Mayrin R. Hañari-Nina
1,2,3,
Arlette M. Estrada-Lupaca
1,2,3,
Franco E. Linghán-Marca
1,2,3,
Lizeth A. M. Ari-Gutierrez
1,2,3,
Emmir O. Chavez-Cayo
1,2,3,
Giovanni Aragón-Alvarado
1,2,3 and
Ruth M. Mamani-Contreras
1,2,3
1
Programa de Conservación de Murciélagos de Peru (PCMP), Tacna C.P. 23000, Peru
2
Colección Biológica de Tacna, Universidad Nacional Jorge Basadre Grohmann, Avenida Miraflores S/N, Ciudad Universitaria, Tacna C.P. 23000, Peru
3
Laboratorio de Ecología Integrativa, Escuela Profesional de Biología Microbiología, Facultad de Ciencias, Universidad Nacional Jorge Basadre Grohmann, Avenida Miraflores S/N, Ciudad Universitaria, Tacna C.P. 23000, Peru
*
Author to whom correspondence should be addressed.
Urban Sci. 2026, 10(8), 474; https://doi.org/10.3390/urbansci10080474
Submission received: 30 April 2026 / Revised: 27 June 2026 / Accepted: 2 July 2026 / Published: 17 August 2026
(This article belongs to the Section Urban Environment and Sustainability)

Abstract

Urban expansion generates habitat fragmentation, light pollution, and vegetation loss, driving biodiversity decline globally. Insectivorous bats are particularly suited to track these changes: their taxonomic and functional diversity, combined with their differential sensitivity to landscape configuration and roost availability, makes them reliable bioindicators of urbanization impacts. This study characterized bat acoustic diversity and community composition along an urban–rural gradient in Tacna, Peru, using passive acoustic monitoring. Twenty-three stations equipped with autonomous ultrasonic recorders were established between December 2024 and April 2025. Sonotype identification was validated through linear discriminant analysis (DFA), achieving 94.47% accuracy by Leave-One-Out Cross-Validation (LOOCV). Nine sonotypes were identified, seven Molossidae and two Vespertilionidae; Myotis atacamensis showed the highest detection frequency across all districts. Diversity indices were highest in the peri-urban zone of Pocollay (S = 8; H′ = 1.664) and lowest in Gregorio Albarracín (S = 4; H′ = 0.964). The high dissimilarity between Pachía and the urban core of Tacna (BC = 0.817) points to marked compositional differences linked to urbanization intensity. Records of Nyctinomops laticaudatus and N. macrotis constitute the first documentation for the urban area of Tacna. These results suggest urban and peri-urban sectors may function as ecological oases for bat sonotypes within a hyperarid matrix, providing a baseline for evaluating the role of green spaces, landscape connectivity, and artificial lighting in arid cities.

1. Introduction

The urban expansion projected at approximately 1.2 million km2 by 2030 places differential pressure on terrestrial carbon reservoirs and global biodiversity [1], generating spatial gradients in which light pollution, anthropogenic noise, and vegetation cover loss intensify toward urban centers and diminish toward the rural periphery [2]. Nocturnal artificial illumination alters bat foraging schedules, shifting activity toward more pronounced crepuscular peaks in urban areas [3], producing an ecological filter that negatively selects against slow-flying species dependent on dense vegetation and emitting low-intensity echolocation calls [2]—suggesting that insectivorous bats may serve as empirical models for tracking functional landscape degradation.
That pressure is reconfigured in arid landscapes, where bat communities already face baseline physiological and ecological constraints absent in more productive biomes. Species adapted to these systems operate under narrow energetic and hydric margins—smaller bodies, lower energy consumption, greater renal water retention, and reliance on ambient heat for torpor recovery [4]—and their distribution responds to two interrelated spatial scales: at the regional level, water availability and temperature define which areas can sustain viable populations; at the local level, the size and accessibility of water bodies regulate how many species can share these areas [5,6]. This balance is maintained through vertical space partitioning and selective use of water source types, a pattern further shaped by non-desert species expanding into arid zones through human land-use change [5,7]. Urbanization thus does not simply add pressure onto a resilient system: it compounds pre-existing constraints already operating near species tolerance limits.
Insectivorous bats are not only taxonomically but also ecologically diverse, occupying multiple trophic levels. Their differential sensitivity to habitat loss and fragmentation makes them particularly suitable landscape change indicators. Urban bat assemblages respond differentially to landscape configuration, roost availability, proximity to foraging areas, and anthropogenic disturbance, and in highly populated areas, the near-complete occupation of space for housing and economic activities leaves little room for roosting or foraging [8]. These responses are acoustically detectable: land-use change and degradation reduce biophonic complexity and increase anthropogenic noise, reflecting declines in species richness and disruptions in ecological interactions [9]. Given their particular sensitivity to habitat conversion and climate change [10], bats constitute the taxonomic group most extensively studied using passive acoustic monitoring [9].
Passive acoustic monitoring (PAM) has broad applicability across all major terrestrial vertebrate classes [11]; bats account for 50% of the terrestrial PAM literature—far exceeding birds (20%), anurans (12%), and non-flying mammals (6%) [12]—because detailed species richness data from PAM exist primarily for bats and birds, while automated identification methods for other groups remain under development [11,12]. This methodological maturity and the nocturnal and cryptic habits of bats make them uniquely suited for acoustic surveys in logistically constrained environments, especially in South America, identified as a major gap in global PAM coverage [12], where acoustic monitoring enables estimation of bat richness and activity across large areas without capture limitations in arid landscapes [13,14]. Low-cost recorders increase detectability of rare species and discriminate up to 18 sonotypes in savannas [14,15]. However, call identification remains a limitation, as overlapping or low-intensity signals require DFA validation [16,17]. Echolocation libraries allow species confirmation without capture—the Sonozotz Project documented 50% of Mexico’s species [18]—but equivalent resources in South American urban deserts remain scarce, limiting identification accuracy and understanding of urban responses.
The diversity of bat foraging strategies—from open-air hunters to substrate gleaners—implies differentiated responses to urban landscape structure [19,20]. Community richness tends to decline with increasing urban intensity through loss of sensitive species and the concentration of acoustic activity in few tolerant ones, although richness peaks may occur in suburban zones [21]; however, that pattern is not universal: Starik et al. [22] documented an unexpected richness increase near the urban core interpreted as a peri-urban buffer zone effect, and Briones-Salas et al. [23] found maximum taxonomic and functional diversity at the most urbanized site—evidence that urbanization does not follow a single predictable pattern but rather produces context-dependent outcomes shaped by local biogeographic conditions, making assessment of both richness and functional composition necessary in each study system.
Globally, urban bat studies have evolved toward analytical frameworks integrating Hill numbers [24], but in South America, that advance has not been distributed uniformly: research has concentrated in tropical and Amazonian ecosystems, leaving Pacific desert landscapes systematically underrepresented. Diversity indices calibrated exclusively in tropical systems may not capture the ecological dynamics of arid systems, where baseline constraints on richness and activity are structurally different. Alencastre-Santos et al. [25] documented urbanization effects on community composition in the Brazilian Cerrado, and Mena et al. [26] represent the only prior PAM study along an arid coastal urban gradient in Peru; in the Tacna region specifically, records remain limited to rural faunal inventories: Aragón & Aguirre [27] reported eight species, and Flores-Quispe et al. [28] described aspects of Mormopterus kalinowskii’s natural history, with neither incorporating an urban gradient perspective. This city concentrates these absences acutely: a biogeographically relevant border city with Chile and Bolivia, with 396,180 inhabitants across four districts [29] and extreme aridity that may function as an ecological barrier structuring assemblages differently from other Neotropical systems—making it not merely a geographic extension of existing gradients but a structurally distinct context where the interaction between aridity and urbanization as compounding filters remains empirically uncharacterized.
Mena et al. [26] documented that bat richness and occupancy decrease with increasing artificial light intensity along arid coastal urban gradients in central Peru. Based on this evidence, we hypothesized that bat acoustic diversity and community composition would differ among districts according to urbanization intensity estimated from existing demographic and land-use data, with higher sonotype richness and assemblage evenness in rural and peri-urban districts (Pachía and Pocollay) than in intermediate and consolidated urban districts (Gregorio Albarracín and Tacna). To test this hypothesis, this study characterized the acoustic diversity and community composition of insectivorous bat assemblages along an urban–rural gradient in Tacna, Peru, using passive acoustic monitoring. The specific objectives were (1) to identify the sonotypes present in four districts with varying degrees of urbanization through bioacoustic characterization and the construction of a local sound library, addressing the critical deficit of acoustic reference repositories for bat sonotypes in arid South America; (2) to evaluate acoustic separability among sonotypes using Discriminant Function Analysis (DFA) with Leave-One-Out Cross-Validation (LOOCV), providing a statistically robust framework for call identification in desert urban environments; (3) to compare alpha diversity among districts using classical indices and rarefaction of Hill numbers standardized by acoustic detections, enabling unbiased diversity comparisons across districts with unequal sampling effort; and (4) to describe beta diversity patterns in community composition among districts using the Bray–Curtis dissimilarity matrix.

2. Materials and Methods

2.1. Study Area and Passive Acoustic Monitoring

Peru comprises 24 administrative regions; Tacna, located in the far southwest, is one of four provinces within the homonymous region. The province of Tacna holds the highest regional population density, with approximately 306,363 inhabitants, of whom 288,875 reside in urban areas—a proportion that varies markedly across its 11 constituent districts [30]. The valley in which the city is situated presents semi-arid conditions with a coastal climate: temperatures range between 12.5 °C and 23.4 °C, and annual precipitation does not exceed 33.4 mm [31,32]. This extreme aridity is not a peripheral factor: it defines the physiological limits within which bat communities can persist in this landscape.
Within this climatic and demographic context, four districts were selected to represent contrasting stages of habitat transformation. Pachía (PAC), with 2062 inhabitants, is classified as rural; its land-use centers on small-scale agriculture, predominantly vegetable cultivation in plots interspersed with light-material dwellings. Pocollay (POC), with 18,627 inhabitants, combines an urban core with peri-urban strips where vegetable and grape cultivation coexist. Gregorio Albarracín (GAL), with 122,247 inhabitants, is the most densely populated district, with a built environment that is almost exclusively residential. Tacna (TAC), with 79,920 inhabitants, constitutes the commercial center of the province and presents a consolidated urban fabric; based on population density, contiguous housing density, and number of inhabitants per spatial unit—criteria established by the Peruvian National Institute of Statistics and Informatics (INEI) [30]—each district was assigned an urbanization intensity category for the purposes of this study: non-urbanized (Pachía), low urbanization (Pocollay), intermediate urbanization (Gregorio Albarracín), and consolidated urbanization (Tacna). This classification reflects not only population size but also the degree of urban infrastructure consolidation, centrality, and historical development of each district. The PAC–POC–GAL–TAC sequence thus defines a continuous urbanization gradient, which this study uses as the primary structuring variable of the analysis. Although Pocollay and Tacna share administrative boundaries, sampling stations were positioned to minimize potential overlap in bat movement between districts; since insectivorous bats routinely travel several kilometers per night, the acoustic communities of adjacent districts cannot be considered fully independent, and this spatial dependence should be taken into account when interpreting compositional differences along the gradient. The geographic coordinates and sampling effort for each station are provided in Supplementary Table S1; satellite images of the sampling sites for each district are presented in Supplementary Figures S1–S4.
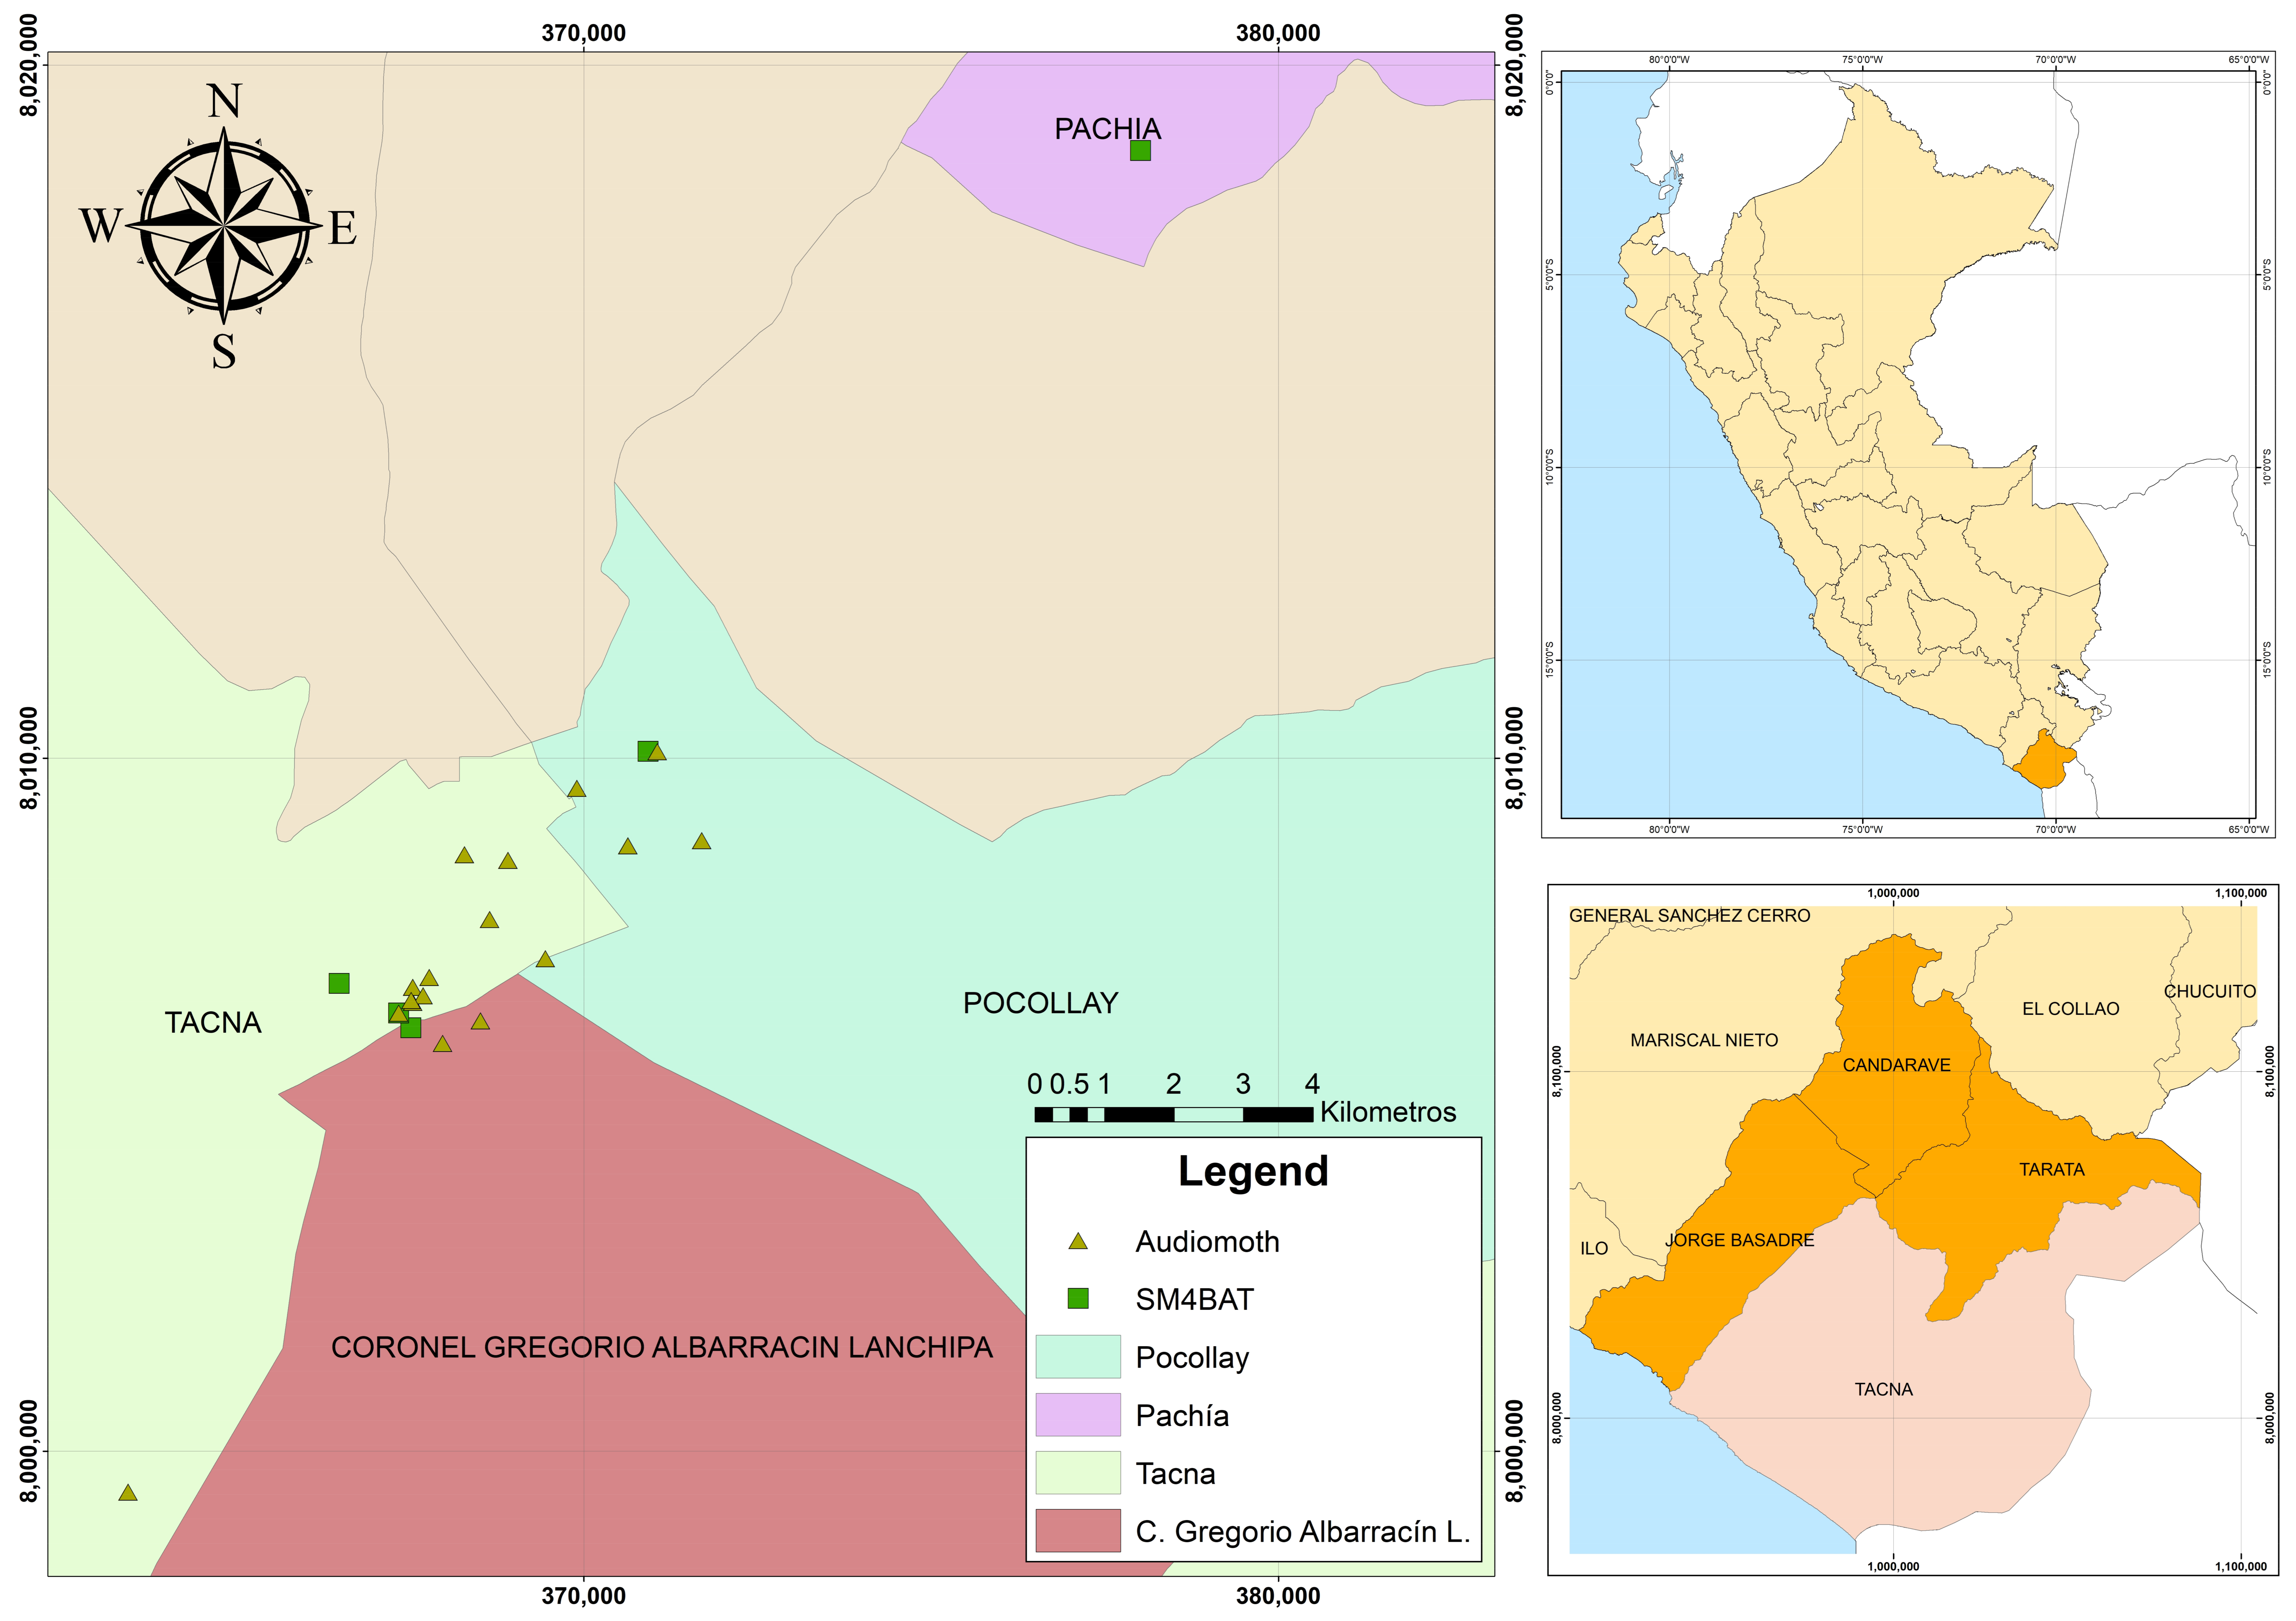
Sampling was conducted between December 2024 and April 2025, during a seasonally favorable period characterized by warmer and more humid local conditions, when bat activity may increase in response to greater food resource availability and improved climatic suitability [33]. The 23 sampling stations (Figure 1) were distributed along the urbanization gradient described above, at elevations between 306 and 1040 m a.s.l., spanning the four evaluated districts: 1 in Pachía (PAC), 6 in Pocollay (POC), 2 in Gregorio Albarracín (GAL), and 15 in Tacna (TAC). The unequal distribution of stations reflected actual differences among districts in the availability of green areas, agricultural zones, urban structures, and accessible sites for equipment deployment. Since the objective was to characterize bat assemblages along a real urban–rural gradient—rather than to compare districts under an identical number of stations—sampling effort was adjusted to the availability of potential habitats and the particular conditions of each district.
Passive acoustic monitoring (PAM) combined two autonomous recorders: SM4BAT-FS, manufactured by Wildlife Acoustics (Maynard, MA, USA), and AudioMoth 1.2.0, developed by Open Acoustic Devices (Southampton, UK).The former was selected for being a full-spectrum, programmable, and compact recorder that is considerably more cost-accessible than commercial systems, enabling the deployment of a greater number of units and broadening the spatial coverage of the sampling design. It incorporates a MEMS microphone with a typical sensitivity of approximately −38 dBV/Pa at 1 kHz, a value that supports its utility for autonomous acoustic recording in biodiversity studies [34,35]. The latter was included for its superior detection capacity for ultrasonic signals, associated with the use of specialized low-noise microphones such as the SMM-U2, whose design provides a higher signal-to-noise ratio and allows detection of weaker or more distant calls compared with previous ultrasonic microphones; it also operates with a trigger-based recording system that initiates capture automatically when signals exceed configured acoustic parameters, including minimum frequency threshold and minimum pulse duration [35,36]. These devices together allowed an operational balance between cost-accessibility, spatial coverage, and acoustic detection capacity along the evaluated urbanization gradient.
Recording intervals were set between 18:00 and 06:00 h, covering the period from dusk to dawn to document bat acoustic activity on a nightly basis [37,38]. Both devices operated in full-spectrum mode, configured at a sampling rate of 256 kHz and 16-bit WAV format, with filters applied according to the hardware capabilities of each model [39]. The AudioMoth recorded in five-minute cycles with one effective recording minute per cycle, whereas the SM4BAT-FS captured each bat pass detected by the microphone using a trigger-based system, applying a minimum frequency threshold of 16 kHz and a minimum pulse duration of 1.5 ms. All units were inspected before deployment and at the end of each sampling period to verify correct operation, recording performance, battery status, and the absence of physical damage or malfunctions.
Audio files were processed in Kaleidoscope Pro v.5.1.8 (Maynard, MA, USA), with manual review of each search-phase call. A sequence was retained only if it met all of the following criteria: at least five contiguous pulses, a signal-to-noise ratio ≥10 dB, no saturation, and a complete spectral structure; calls corresponding to approach or terminal phases were systematically discarded [40]. Sonograms and oscillograms were generated with a frequency range of 8–120 kHz, an FFT size of 1024, and a window of 512 points [39]. Each recording meeting these criteria was treated as an independent acoustic detection [14], and its associated metadata—sampling location, date and time, geographic coordinates, recording device, and field notes—were stored in Microsoft Excel files structured for this purpose [41]. All validated audio files and their associated metadata were deposited in Zenodo, an open-access digital repository, and made publicly available [42].
Figure 1. Map of the study area showing the 23 acoustic sampling stations distributed across the districts of Pachía, Pocollay, Gregorio Albarracín, and Tacna, Tacna Region, Peru. Departmental, provincial, and district boundaries obtained from the INEI [43]; scale 1:100,000.
Urbansci 10 00474 g001
The term sonotype was used in this study instead of species to refer to operational acoustic units grouping taxa with indistinguishable or partially overlapping echolocation calls [14]. Since no captures or direct taxonomic validations were performed, acoustic identifications were not treated as species-level confirmations but as assignments to these units supported by manual call review and comparison with published bioacoustic descriptions and bat sound libraries from Peru and adjacent regions [16,44,45,46]; all acoustic units applied corresponded to those previously described in the literature and were not defined from the dataset generated in this study. Assignment considered pulse morphology, harmonic structure, and extracted acoustic variables grouped into two dimensions: spectral, comprising initial frequency (IF), final frequency (FF), and peak frequency (PF), and temporal, including pulse duration (PD) and interpulse interval (IP). Pulse morphology was further classified as frequency modulated (FM), quasi-constant frequency (QCF), or constant frequency (CF), along with the number of harmonics present in each call [16,47].

2.2. Statistical Analysis

For each acoustic unit, the mean and standard deviation of the measured acoustic parameters were calculated, along with the number of acoustic detections assigned to each sonotype and its corresponding call structure [16]. These data were used to construct a reference sound library for the study area.
Acoustic separability among sonotypes was evaluated using Discriminant Function Analysis (DFA), implemented with the MASS package in R 4.5.2 [48]. This approach operated as a supervised classification method in which the measured acoustic variables—IF, FF, PF, PD, and IP—served as predictor variables and the predefined sonotypes represented the response groups. Since acoustic classification may involve call overlap and subjective interpretation, the DFA provided an objective statistical framework for assessing group separability and strengthening inferences about community composition along the urbanization gradient. Model performance was assessed using Leave-One-Out Cross-Validation (LOOCV), a method widely used to estimate predictive capacity in small datasets [49]. Sonotypes preliminarily attributed to H. montanus, Lasiurus sp., and N. laticaudatus were excluded from LOOCV because fewer than five acoustic detections were available for each (n < 5), thereby avoiding unstable classification estimates.
Alpha diversity was estimated using the vegan package [50], through calculation of sonotype richness, the Shannon and inverse Simpson indices, and Pielou’s evenness. Standardization was performed by individual-based rarefaction standardized to 27 acoustic detections using Hill numbers, allowing diversity comparisons among sampling units at a common sample size and reducing biases associated with unequal sampling effort and differences in the number of acoustic detections among districts [51]. This procedure was implemented using the iNEXT package [52], which estimates diversity through rarefaction and extrapolation based on Hill numbers, incorporating relative sonotype abundances to produce comparable diversity estimates across sampling units [24]. Graphs were generated using the ggplot2 package [53]. Beta diversity among districts was assessed using Bray–Curtis dissimilarity, calculated with the vegan package [50]; since only a single sampling unit was available in some districts, the analysis was conducted descriptively from the dissimilarity matrix, without applying formal statistical significance tests.

3. Results

3.1. Composition and Acoustic Activity by District

The study recorded a total of 1939 h of audio, from which 24,799 audio files were obtained. Of these, 386 met the quality criteria and were assigned to the families Vespertilionidae (n = 2 sonotypes) and Molossidae (n = 7 sonotypes), corresponding to the following: Histiotus montanus (Philippi & Landbeck, 1861) (n = 2), Myotis atacamensis (Lataste, 1892) (n = 201), Lasiurus sp. (n = 1), Promops davisoni Thomas, 1921 (n = 86), Tadarida brasiliensis (I. Geoffroy Saint-Hilaire, 1824) (n = 51), Mormopterus kalinowskii (Thomas, 1893) (n = 20), Nyctinomops laticaudatus (É. Geoffroy Saint-Hilaire, 1805) (n = 3), Nyctinomops aurispinosus (Peale, 1848) (n = 5), and Nyctinomops macrotis (Gray, 1839) (n = 17) (Table 1).
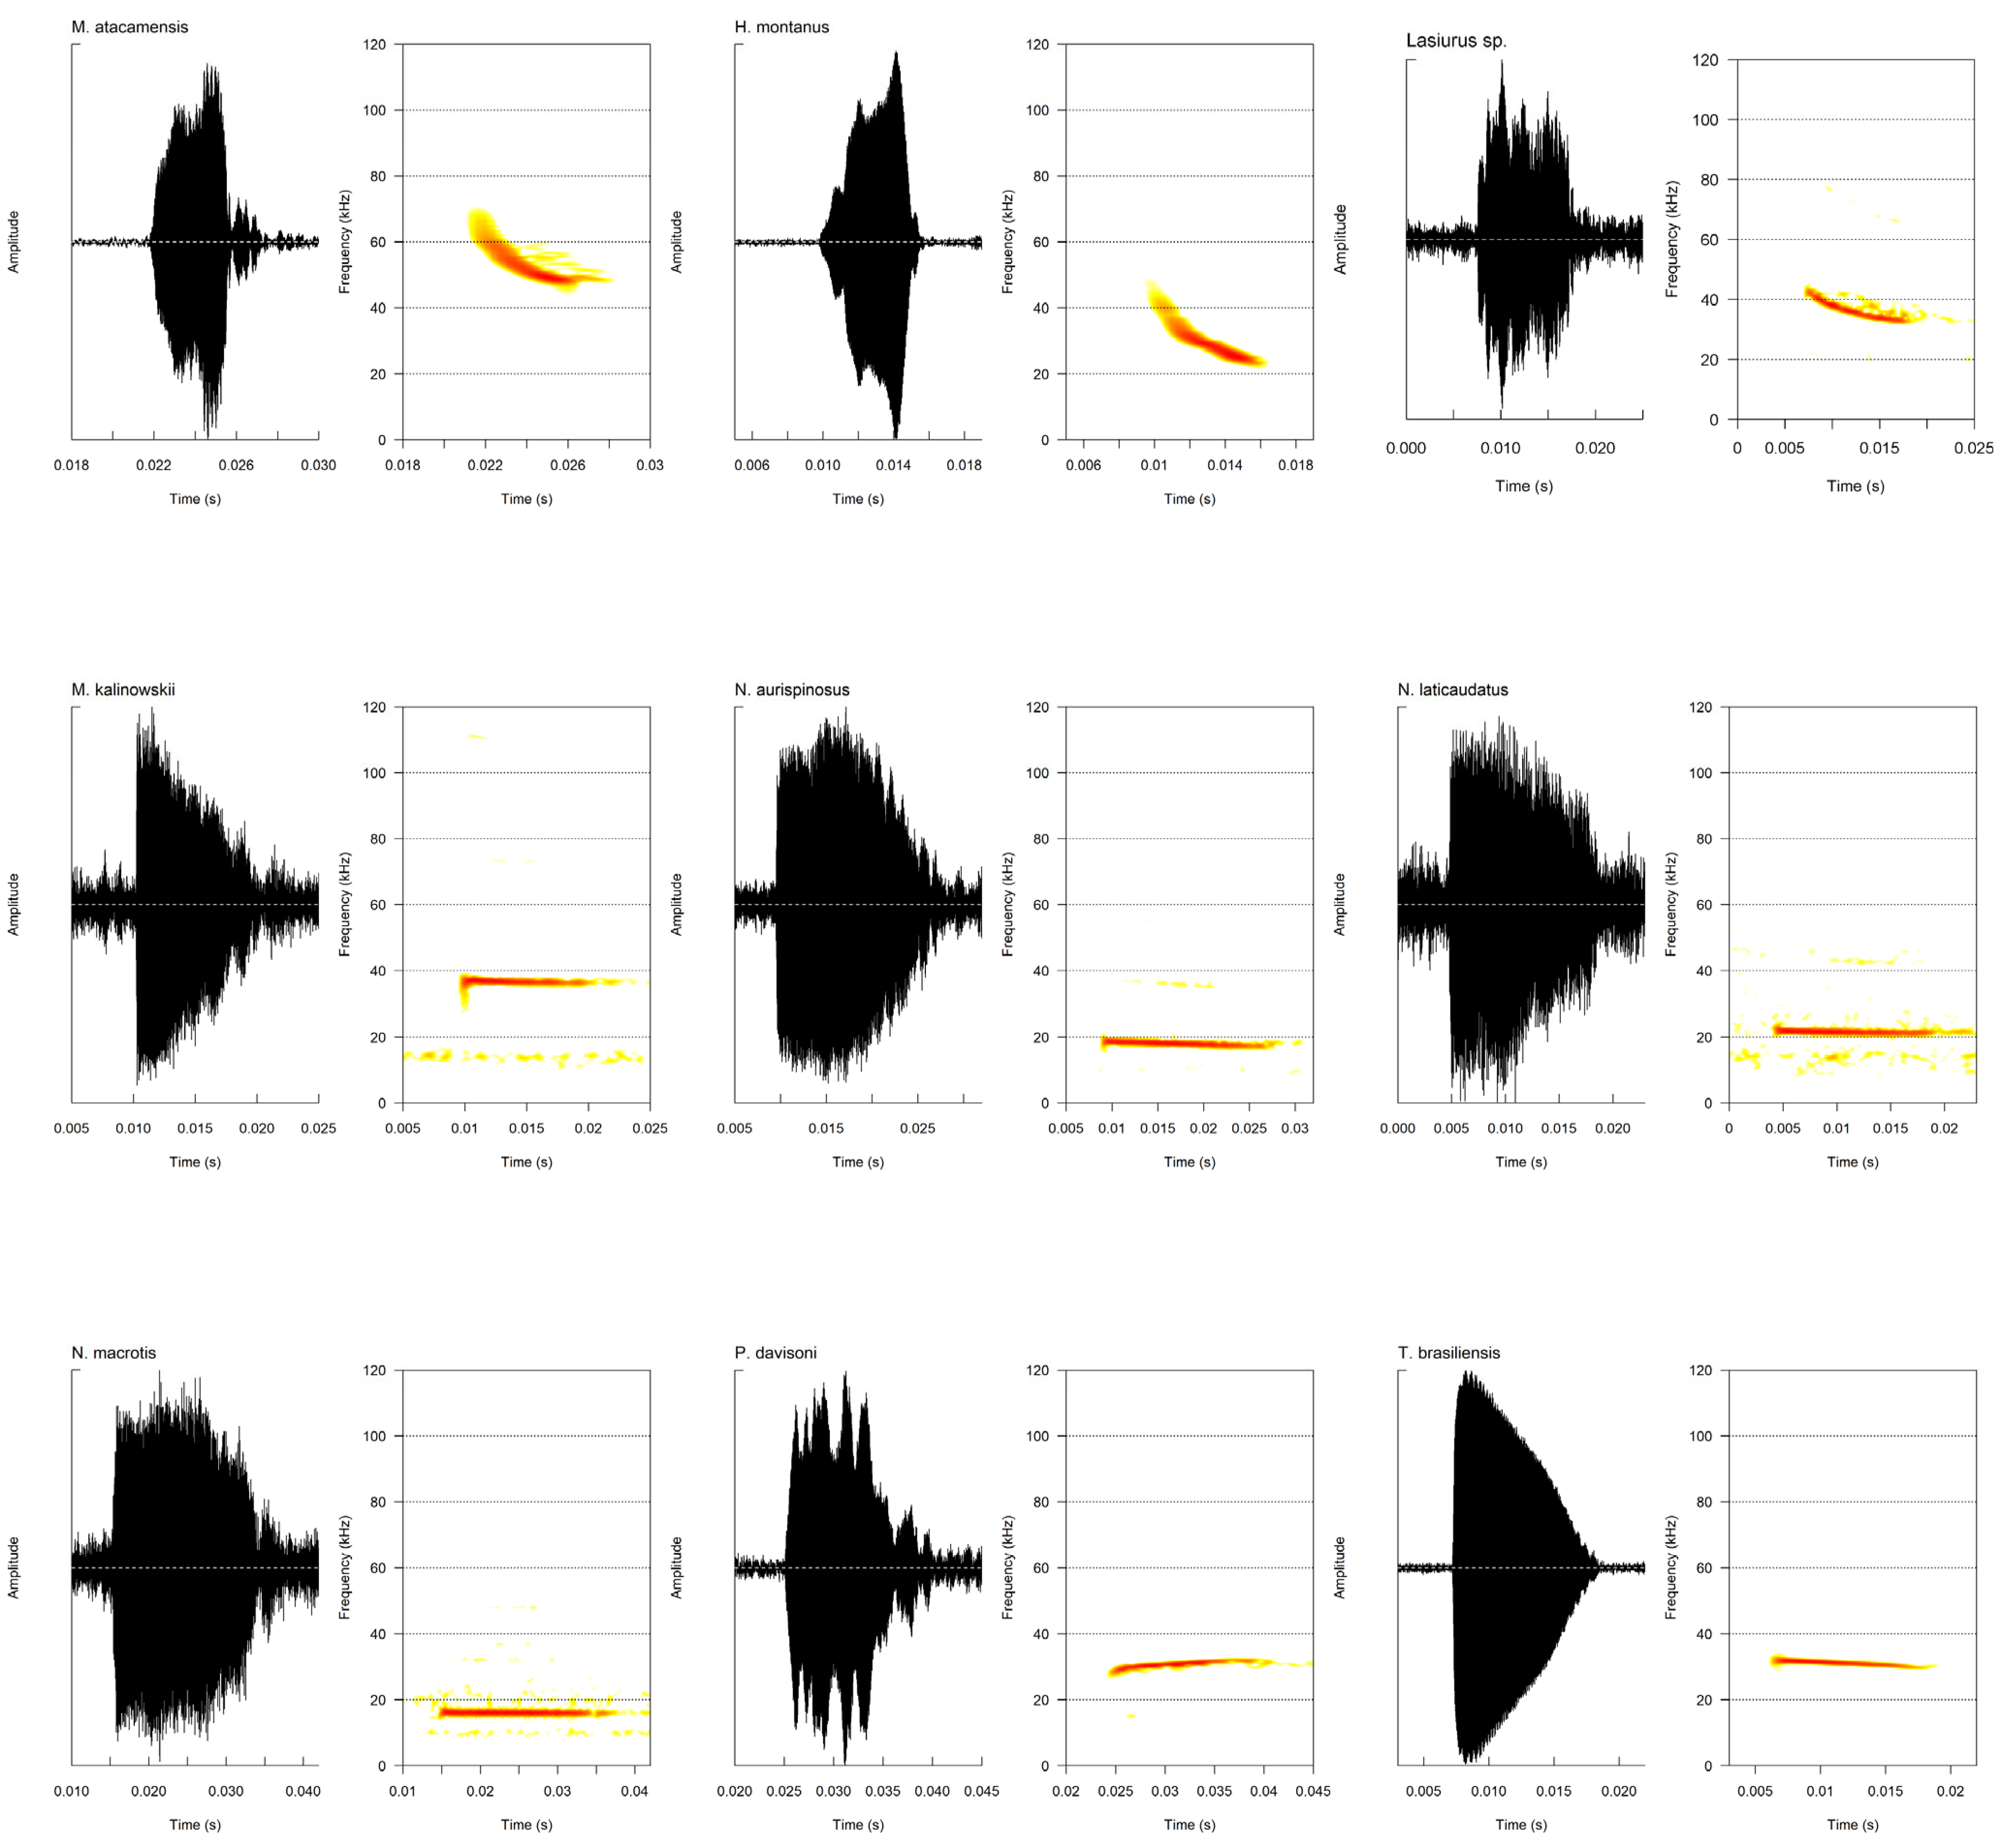
Calls were characterized by the QCFd component in the family Molossidae, with the exception of P. davisoni, whose signals exhibited only the QCFa component; in contrast, the FMd component predominated in the family Vespertilionidae (Figure 2). Marked interspecific differences were observed between the two families: vespertilionids recorded peak energy frequencies (PF) above 33 kHz and pulse durations (PD) between 3 and 7 ms, while molossids showed PFs below 38 kHz and PDs between 10 and 18 ms. The sonotypes with the lowest acoustic activity corresponded to the genus Nyctinomops and the single acoustic detection assigned to Lasiurus sp.
The sonotype with the highest number of acoustic detections across all four districts was Myotis atacamensis, followed by P. davisoni and T. brasiliensis. Analysis of spatial distribution indicated that in PAC and POC, a greater sonotype richness was recorded, with the additional presence of sonotypes of the genus Nyctinomops, M. kalinowskii, and T. brasiliensis, whereas in GAL and TAC, acoustic activity showed greater concentration in the first two sonotypes. PAC recorded the lowest number of acoustic detections (27) and TAC the highest (236), distributed across four urbanization categories: rural (PAC), low urbanization (POC), intermediate urbanization (GAL), and consolidated urbanization (TAC) (Table 2).

3.2. Acoustic Separability Among Sonotypes

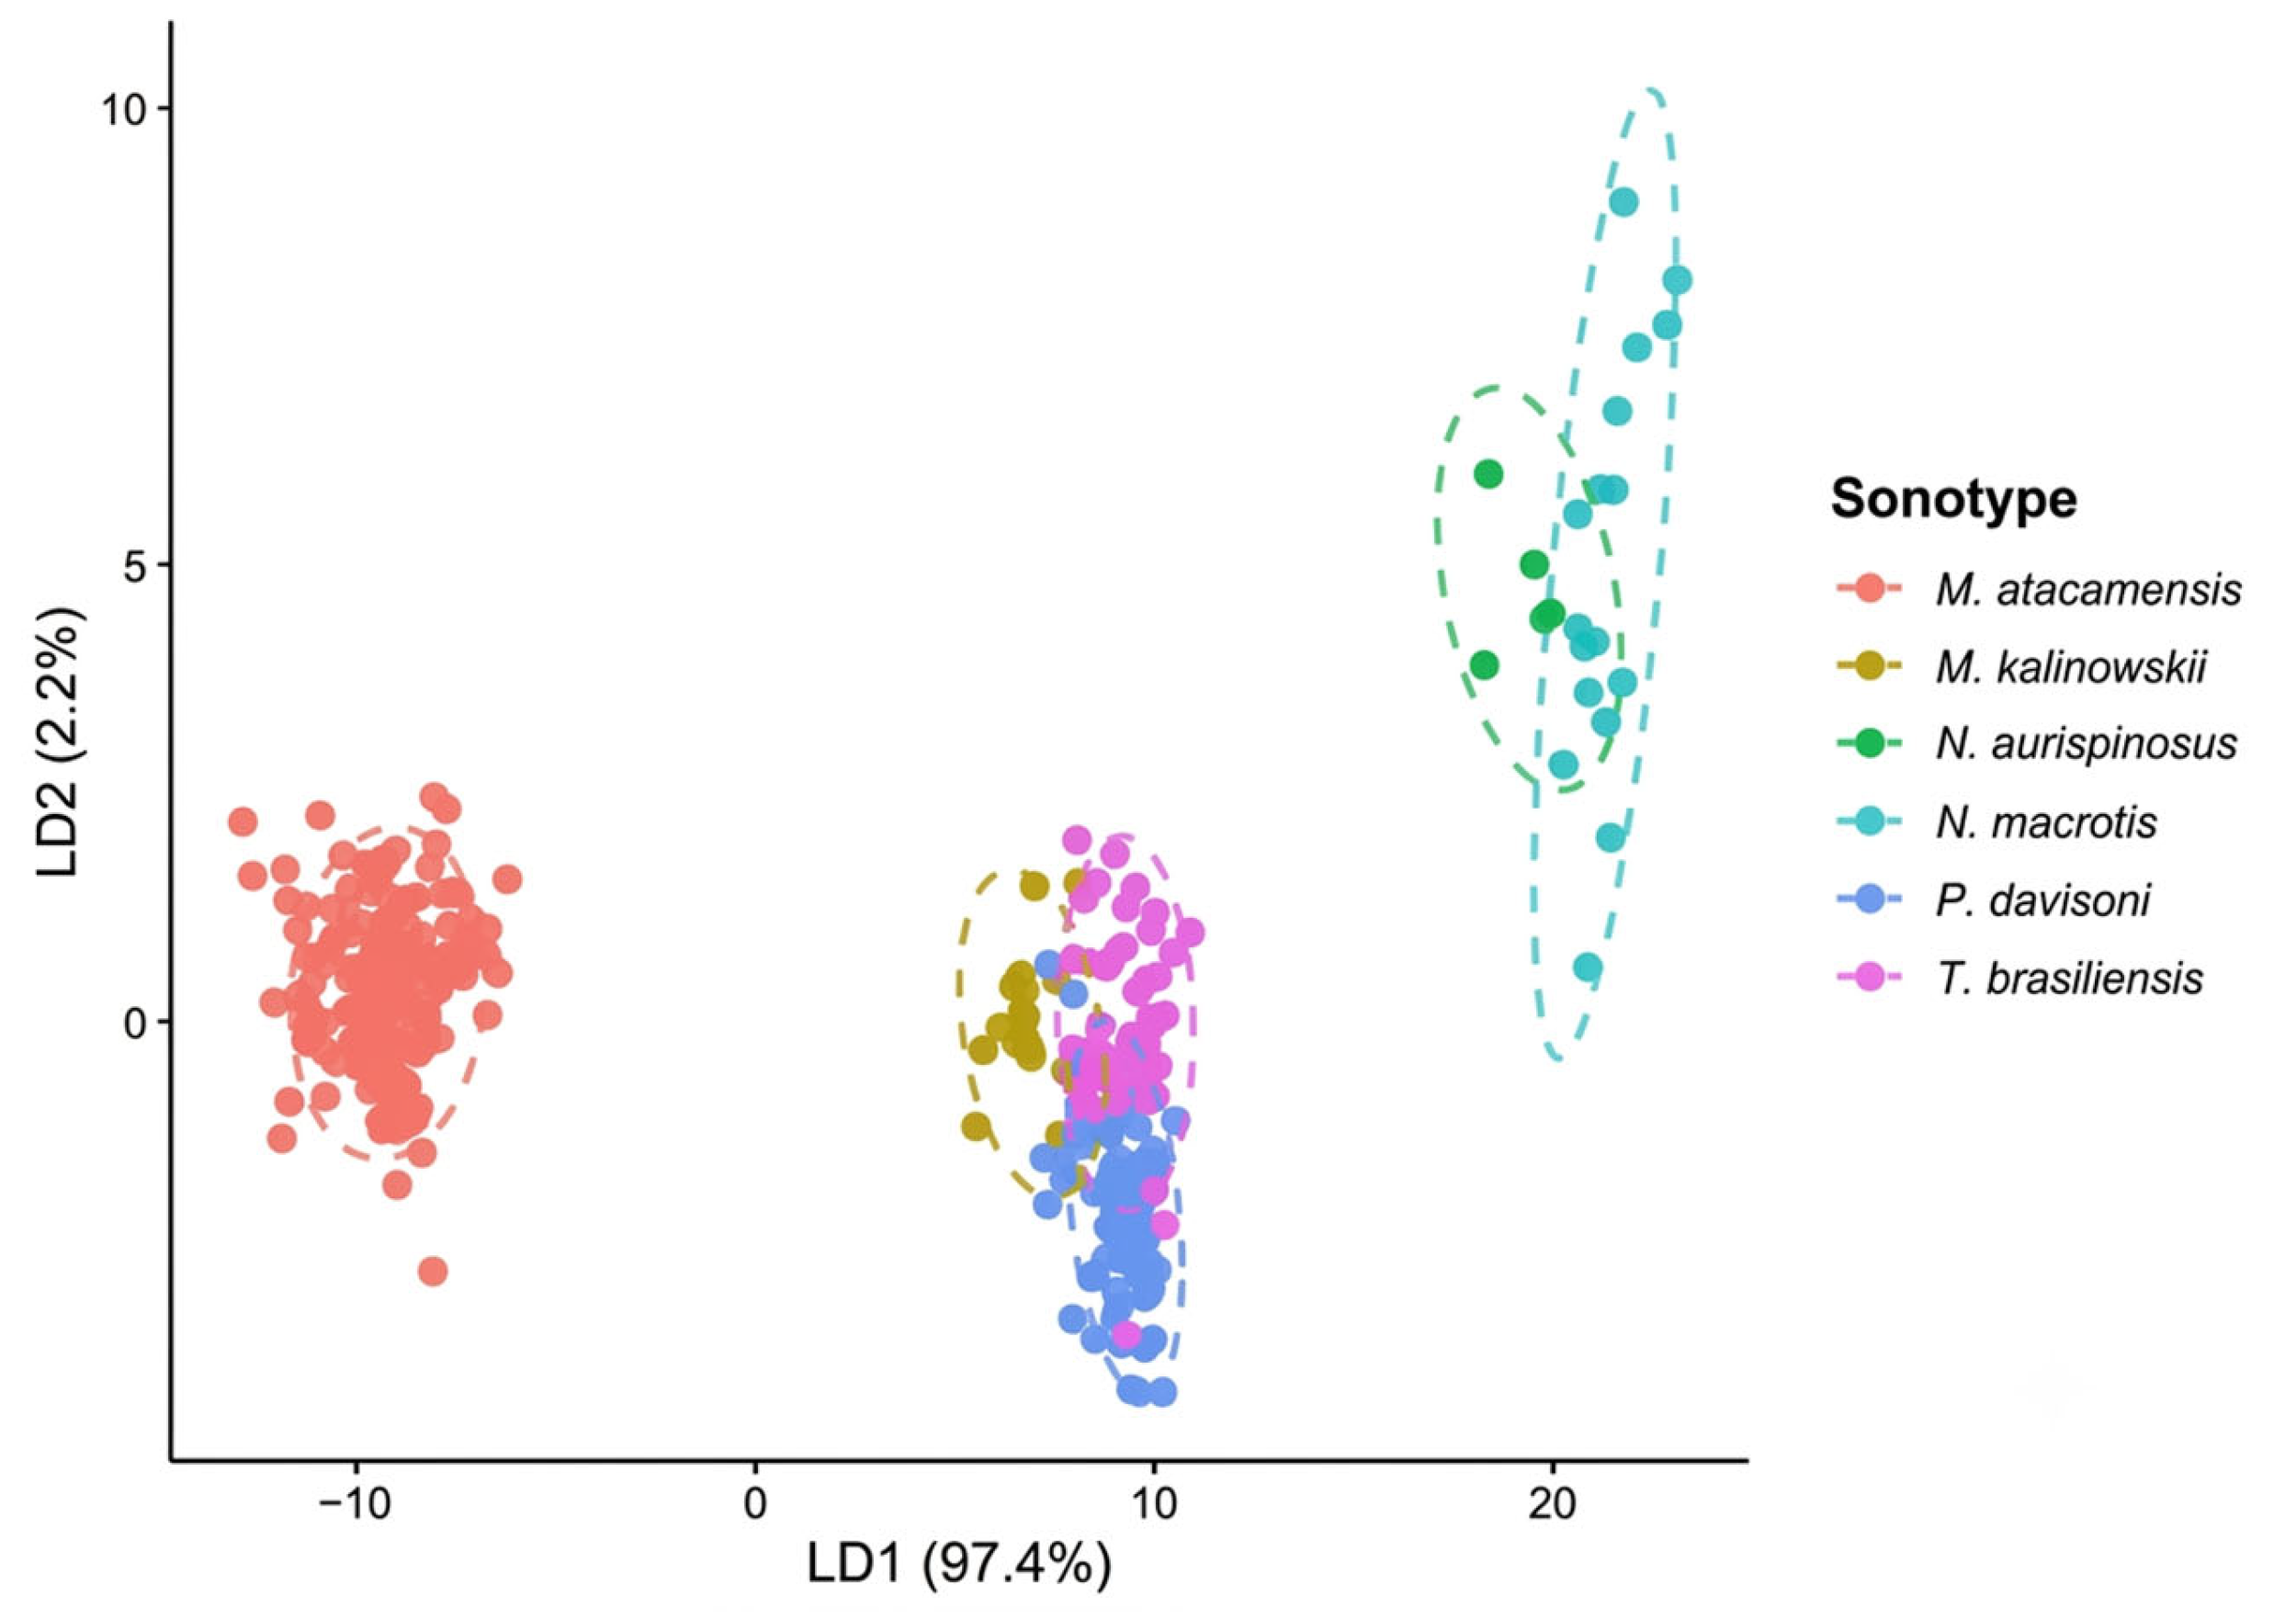
DFA revealed clear multivariate separation among the identified sonotypes (Figure 3). The first linear discriminant (LD1) explained 97.4% of the total variation and was determined primarily by spectral variables, with FF as the most significant predictor, followed by IF, PF, and PD. The second linear discriminant (LD2) explained 2.2% of the remaining variation and was primarily associated with pulse duration and final frequency, enabling differentiation of sonotypes within each family based on the length and temporal structure of their signals. Together, these functions supported a differentiated acoustic characterization of each sonotype, reinforcing the validity of the identifications along the evaluated urbanization gradient (Table A1).
LOOCV applied to the discriminant model based on the described spectral and temporal variables showed an overall accuracy of 94.47%. Classification was correct in 100% of cases for M. atacamensis (n = 201); N. aurispinosus also achieved 100%, although this result should be interpreted with caution given the low number of acoustic detections available for this sonotype (n = 5). Promops davisoni (91.8%) and Tadarida brasiliensis (90.1%) both exceeded 90% accuracy. The sonotypes with the lowest classification accuracy were M. kalinowskii and N. macrotis, with 75% and 76.4%, respectively, reflecting the proximity of their discriminating parameters and constituting a limitation to be considered when interpreting these acoustic detections (Table A2).

3.3. Alpha Diversity Indices

Alpha diversity indices showed marked differences among the evaluated districts (Table 3). Pachía recorded six sonotypes (S = 6) and exhibited the highest evenness value among the districts (J′ = 0.821; H′ = 1.471; 1/D = 3.66), indicating a relatively uniform distribution of acoustic activity across the assemblage. The three sonotypes with the highest acoustic activity were T. brasiliensis (40.7%), M. atacamensis (22.2%), and M. kalinowskii (22.2%), with relatively similar contributions (n = 27 acoustic detections).
Pocollay exhibited the highest sonotype richness (S = 8), as well as the highest values for the Shannon index (H′ = 1.664) and the inverse Simpson index (1/D = 4.36), along with high evenness (J′ = 0.800), positioning it as the most diverse acoustic assemblage in the study. Acoustic activity was distributed relatively evenly among sonotypes, with Myotis atacamensis (35.5%), Tadarida brasiliensis (21.1%), and Promops davisoni (21.1%) as the most frequently detected (n = 76 acoustic detections).
Gregorio Albarracín recorded four sonotypes (S = 4) and presented the lowest diversity values (H′ = 0.964; 1/D = 2.27; J′ = 0.695), with acoustic activity strongly concentrated in M. atacamensis (55.3%) and P. davisoni (36.2%), which together accounted for 91.5% of the total acoustic detections (n = 47 acoustic detections). Although the evenness value (J′ = 0.695) is moderate in absolute terms, it should be interpreted in light of the low sonotype richness and the marked imbalance in acoustic detection frequency among sonotypes.
The Tacna district recorded seven sonotypes (S = 7) but exhibited considerably lower values for the Shannon index (H′ = 1.150), inverse Simpson (1/D = 2.36), and evenness (J′ = 0.591). Myotis atacamensis accounted for 60.2% of acoustic detections, followed by P. davisoni with 22.5%; these two sonotypes represented 82.7% of the total (n = 236 acoustic detections).
When standardized to 27 acoustic detections (Table 4), corresponding to the smallest sample (Pachía; n = 27), Pocollay and Pachía recorded nearly identical sonotype richness values (q0 = 6.305 and q0 = 6.000, respectively); Pocollay nonetheless exceeded Pachía across the higher diversity orders (q1 = 4.794 vs. 4.355; q2 = 4.029 vs. 3.663), reflecting a more proportional distribution of acoustic detections among sonotypes. Gregorio Albarracín recorded the lowest values across all orders (q0 = 3.648; q1 = 2.544; q2 = 2.225), with four sonotypes detected (S = 4); the relatively narrow gap between q1 and q2 indicates moderate evenness in the distribution of acoustic activity among detected sonotypes, while wider confidence intervals reflect the smaller sample size relative to the other districts. Tacna presented intermediate values across all Hill numbers (q0 = 4.473; q1 = 2.870; q2 = 2.258), with a pronounced drop between q0 and q1 reflecting an unequal distribution of acoustic detection frequency among sonotypes.

3.4. Beta Diversity

The Bray–Curtis dissimilarity matrix revealed marked compositional differences among the four districts (Table 5). The lowest dissimilarity was recorded between Gregorio Albarracín and Pocollay (BC = 0.252); the four sonotypes recorded in Gregorio Albarracín (M. atacamensis, M. kalinowskii, P. davisoni, and T. brasiliensis) were also present in Pocollay, which additionally recorded four sonotypes absent from Gregorio Albarracín (Lasiurus sp., N. aurispinosus, N. laticaudatus, and N. macrotis).
Pachía recorded the highest dissimilarity values relative to the more urbanized districts, with BC = 0.817 compared to Tacna and BC = 0.730 compared to Gregorio Albarracín. H. montanus was detected exclusively in Pachía (two acoustic detections), whereas P. davisoni was absent from Pachía but exhibited a concentration of acoustic activity in Tacna (53 acoustic detections) and Gregorio Albarracín (17 acoustic detections). N. aurispinosus was recorded in Pachía (one acoustic detection), Pocollay (three acoustic detections), and Tacna (one acoustic detection).
Pocollay presented intermediate dissimilarity values relative to both Pachía (BC = 0.515) and Tacna (BC = 0.545), reflecting the co-occurrence of sonotypes characteristic of more urbanized districts (M. atacamensis, P. davisoni, T. brasiliensis) and of the rural district (N. aurispinosus, N. macrotis). The comparison between Tacna and Gregorio Albarracín yielded a dissimilarity value of BC = 0.668; although both districts share the same sonotypes, Tacna recorded greater sonotype richness through the additional presence of N. laticaudatus (2 acoustic detections) and N. macrotis (11 acoustic detections).

4. Discussion

This study recorded nine of the twenty sonotypes documented for Tacna, representing 45% of the sonotypes identified in southwestern Peru [16]. Although direct comparison between species identified by conventional methods and acoustically defined sonotypes requires caution—as both represent operationally distinct units—previous inventories had identified up to 11 species in the department [27,54,55,56], none of which included N. laticaudatus or N. macrotis, both acoustically detected here for the first time in the urban area of Tacna. This finding extends the known chiropterological records for the department and underscores the utility of bioacoustic monitoring for detecting rare or difficult-to-sample species that conventional methods may overlook. These results also suggest the feasibility of passive acoustic methods in complex urban environments, despite the structural challenges of artificial surfaces, physical barriers, and habitat fragmentation characteristic of such ecosystems [20,26].
The sonotype richness recorded in this study is higher than that reported in individual tropical cities surveyed in Vietnam—six species in Ho Chi Minh City and four in Tra Vinh—although Pham et al. [57] themselves note that urban species richness in those systems is low relative to forested or protected areas. In contrast, Starik et al. [22] identified nine species and three additional sonotypes (12 acoustic entities in total) in the Berlin–Brandenburg urban gradient, a figure somewhat higher than the richness recorded here, though direct comparison is constrained by the marked differences in landscape context and bat fauna between both regions. While comparisons across biogeographic regions must be interpreted with caution given differences in sampling effort, methods, and baseline species pools, these contrasts suggest that hyperaridity may impose structural constraints on assemblage richness that compound the effects of urbanization—a hypothesis that warrants explicit testing in future studies incorporating environmental variables. A notable feature of the Tacna assemblage in this context is the strong representation of Molossidae, a pattern that may help explain its compositional distinctiveness relative to both tropical and temperate urban systems.
High Molossidae representation is consistent with observations from arid zones in northern Chile, where fast-flying bats with low-frequency calls constitute an important component of local assemblages [58], and aligns with reports along urban–natural gradients in Latin America: in Mexico, Sánchez et al. [59] recorded high acoustic activity of Promops centralis, a species typical of open spaces, suggesting that such environments may favor bats adapted to fast flight and aerial foraging. The relevance of Tacna as a study system lies therefore not only in its methodology but in the geographic and biogeographic gap it addresses: a hyperarid coastal urban system in southern Peru with a Molossidae-prevalent assemblage for which no prior acoustic baseline existed—a gap consistent with the exclusively conventional methods reported for the region [27,56].
The acoustic parameters recorded for each sonotype were consistent with published descriptions for their respective families [16,19,28,45,60,61], supporting the validity of the assignments. The acoustic parameters of the Lasiurus sp. sonotype are consistent with those of the family Vespertilionidae; given prior records of L. arequipae in urban environments of the region [56,62], assignment at the genus level was based on these acoustic characteristics, although the scarcity of acoustic detections prevented identification at the species level [55]. Regarding H. montanus, the PF recorded in this study differs from previously reported descriptions for this parameter, which indicate mean values close to 30 kHz [16,45]; however, considerable acoustic variability has been documented within the group, with PF values between 24.9 and 36 kHz [63], suggesting notable plasticity in this trait. H. montanus is also the only species of the genus reported acoustically in southwestern Peru [16]. Despite the low number of acoustic detections and the observed difference in PF, the acoustic and biogeographic evidence supports the probable assignment of the sonotype defined in this study to that species.
Although the limited number of acoustic detections means that the taxonomic assignment of these sonotypes should be considered preliminary, the available ecological evidence and regional acoustic surveys support their plausible occurrence within the study area. Dietary studies have shown that H. montanus exhibits a marked preference for Lepidoptera, whereas M. atacamensis and M. kalinowskii have more generalized diets [64], a difference that may contribute to the lower detectability of H. montanus in urban environments. Likewise, an acoustic survey conducted in southwestern Peru reported similarly low detection frequencies for both Nyctinomops and Lasiurus, suggesting that these genera are naturally infrequent in acoustic inventories of the region [16]. For Nyctinomops, this pattern is consistent with its high-altitude flight behavior, apparent preference for lepidopteran prey, and use of buildings and rock crevices as roosts [55]. In the case of Lasiurus, the genus has been documented using tree branches as temporary roosts in agricultural and riparian habitats, including urban areas [56], which are habitat characteristics that resemble those of Pocollay, where the sonotype was recorded. Collectively, these ecological traits and regional acoustic records indicate that the occasional detection of these sonotypes is consistent with their known natural history, although their taxonomic identity should be confirmed through additional acoustic detections or complementary evidence.
The discriminant model achieved an overall accuracy of 94.47% under LOOCV, consistent with recent studies of acoustic reference libraries in the region where LOOCV has confirmed the robustness of LDA models at similar accuracy levels and where FF, PF, and PD have been identified as the parameters with the greatest separatory capacity among sonotypes [47]; comparable studies in other regions have achieved even higher levels of separation at the functional group level [65]. Among these variables, PF is the most widely used acoustic parameter for sonotype identification in Neotropical bats and has been described as apparently less susceptible to biases derived from recording technique and technology [17]. The consistency of these parameters as discriminatory variables suggests their robustness for acoustic monitoring across urbanization gradients in arid environments. The perfect classification obtained for M. atacamensis may be associated with its being the smallest species among Myotis inhabiting Chile, with records from Arequipa in southern Peru to northern Chile, in xeric and desert zones between 990 and 3475 m a.s.l. [66]; given that body size is inversely proportional to echolocation frequencies, smaller species tend to reach higher PF values [67]. The high classification accuracy achieved for P. davisoni and T. brasiliensis may be associated with the morphological distinctiveness of their call components relative to other molossids recorded in the study [16]. In contrast, the lower classification accuracy observed for M. kalinowskii and sonotypes of the genus Nyctinomops reflects the acoustic similarity among their representatives—a known limitation in molossid identification that has been documented in other regional studies [16].
The discriminant analysis recovered clear separation between both families, determined primarily by spectral variables along LD1. Pulse duration was the trait that most sharply distinguished them: Vespertilionidae sonotypes combined shorter pulses with higher peak and final frequencies, while Molossidae sonotypes presented systematically longer pulses at lower frequencies. This contrast follows the well-documented link between higher-frequency, shorter calls and foraging in structurally complex spaces, as opposed to lower-frequency, longer-duration signals characteristic of open-space foraging [17,60]. The family-level separation recovered here therefore reflects an ecological adaptation linked to habitat use and foraging strategy, rather than taxonomic identity alone [19].
Since environmental variables such as vegetation cover, artificial light intensity, water availability, and habitat connectivity were discussed but not directly quantified, the associations described below are interpreted as a working hypothesis of environmental filtering rather than as demonstrated causal effects. Unlike the negative responses documented for the genus Myotis under anthropogenic disturbance in wetter Neotropical contexts [68], M. atacamensis showed a concentration of acoustic activity in the urban core—a divergence that does not appear to be a sampling artifact but rather reflects a set of functional traits that may favor its persistence in transformed environments: broad ecological plasticity; documented foraging around artificial lighting; use of crevices and abandoned structures as roosts; and slow, highly maneuverable flight that allows operation in both vegetated and open spaces [69]. Its distribution is restricted to arid and semi-arid environments of southern Peru and northern Chile, where natural habitats are already severely fragmented [45], suggesting differential tolerance to disturbance relative to its congeners in wetter environments—a hypothesis that could not be tested here because landscape variables were not measured. Taken together, the species-specific response to urbanization, conditioned by wing morphology, foraging strategy, and flexibility in roost use [21,26], positions M. atacamensis among urban adapter species capable of persisting up to certain disturbance thresholds [22].
The acoustic presence of molossids such as T. brasiliensis, P. davisoni, M. kalinowskii, and Nyctinomops spp. aligns with the broader tolerance attributed to this family [19,70]. In such contexts, urban structures may act as alternative roosts when fragmentation and loss of vegetation cover reduce the availability of natural sites [71].
Across the four districts, alpha diversity appears to vary in association with the degree of habitat transformation, consistent with urbanization intensity as a structuring factor [72]. The gradient does not follow a simple linear progression, as the diversity peak occurs in the peri-urban zone rather than at the rural extreme, with the minimum corresponding to the most urbanized districts.
Pocollay emerged as the most diverse district along the gradient. Its peri-urban character—combining active cultivation of vegetables, grapes, maize, and alfalfa [73] with incipient urban development—appears to support a more balanced distribution of acoustic activity among sonotypes than observed in consolidated urban districts, encompassing sonotypes characteristic of both urban districts and the rural extreme. This pattern aligns with the higher diversity documented in peri-urban landscapes relative to consolidated urban cores [22,25], although direct extrapolation of findings obtained in humid tropical biomes to an arid coastal landscape requires interpretive caution. In arid environments, prey availability may be enhanced by the concentration of insects associated with nearby crops [74] and by the presence of riparian habitats and water bodies, which aggregate nocturnal insect biomass and constitute preferred foraging areas [75]; additionally, urban–rural transition zones exhibit some of the highest foraging activity rates, possibly due to the concentration of insects attracted to lighting at landscape edges [19]. The presence of adobe or rammed-earth structures (4%) and precarious buildings (9.6%) [30] could offer potential roost sites with physical characteristics similar to those used by bats in other urban contexts [71], although this association remains speculative in the absence of direct roost surveys. Collectively, Pocollay functions as a transition zone in which peri-urban environmental heterogeneity sustains both foraging and the movement of disturbance-sensitive sonotypes among habitat patches [8,22].
Pachía, at the rural end, shows the most equitable distribution of acoustic activity among sonotypes, consistent with its low population density and agricultural matrix: in arid ecosystems, rural sites tend to exhibit greater richness and a broader acoustic space, as urbanization fragments habitat, increases light pollution, and reduces connectivity among green areas [26], such that habitat heterogeneity under low urban pressure favors coexistence without any sonotype showing prevalent acoustic activity [21]. At the opposite end of the gradient, Gregorio Albarracín—with approximately 99.73% of its territory under urban land-use following rapid residential expansion [30]—represents the most transformed condition: habitat reduction and fragmentation limit both foraging sites and available roosts [76], and the loss of vegetation cover restricts food resources and shelter, leaving only sonotypes with greater functional tolerance to maintain appreciable activity, while disturbance-sensitive sonotypes face progressive exclusion from the most transformed sectors of the gradient [72,77,78].
Tacna occupies an intermediate position that introduces an important distinction within the gradient: despite exhibiting relatively high sonotype richness—exceeded only by Pocollay—it shows the lowest evenness, with acoustic activity concentrated in a reduced number of sonotypes. This decoupling between richness and evenness is consistent with patterns documented in highly urbanized environments, where a reduced number of tolerant sonotypes account for the majority of acoustic detections [21,72]: richness may remain relatively high, but assemblage structure is simplified. With more than 99% of its population in urban areas [29] and scarce native vegetation, persistent activity appears to be sustained by urban parks and green spaces, which, albeit limited in extent, increase habitat quality and accessibility within the matrix [25,72,79], and by prey concentration around artificial lighting, which benefits sonotypes capable of exploiting such aggregations [21,25]. The contrast between Tacna’s richness and its low evenness, against Pocollay’s combination of high richness and high evenness, suggests that along the gradient, urbanization may not only reduce sonotype numbers in its most consolidated sectors but also reorganize prevalence within the assemblage, favoring a reduced core of tolerant sonotypes—a pattern that warrants formal testing in future studies incorporating landscape variables.
Beta diversity patterns complemented this picture by revealing marked differences in acoustic community composition among districts. The lowest dissimilarity observed in this study was recorded between Gregorio Albarracín and Pocollay: the sonotypes registered in the most urbanized district were also present in Pocollay, although the latter encompassed additional sonotypes absent from Gregorio Albarracín. This pattern may be interpreted as a progressive loss of sonotypes toward more urbanized environments without incorporation of new ones, consistent with an impoverishment process associated with the selective non-random exclusion of sensitive sonotypes documented along bat urbanization gradients [78] and with processes in which sites with fewer sonotypes constitute subsets of those with greater sonotype richness—a pattern analogous to that documented at the species level [80].
Pachía exhibited the greatest compositional differences relative to urban districts, including the exclusive record of H. montanus and the absence of sonotypes with high acoustic representation in consolidated urban districts. This differentiation suggests qualitatively distinct assemblages at each extreme of the gradient. In arid environments, where native vegetation is scarce even outside the city, differences between the rural and urban extremes of the gradient could be particularly pronounced, given that baseline conditions may already limit regional diversity.
Pocollay showed intermediate dissimilarity values relative to both extremes, encompassing sonotypes present in urban districts as well as sonotypes recorded in the rural district—reflecting the characteristic heterogeneity of peri-urban landscapes, where sonotypes with differing habitat requirements may coexist [21]. Compositional variation among districts suggests a directional shift along the gradient, with more urbanized districts tending toward assemblages with higher representation of sonotypes with broader habitat tolerance—a trend consistent with the taxonomic homogenization documented in Neotropical bat assemblages under urbanization gradients [23]. The absence of a formal beta diversity partition analysis prevents definitively distinguishing between differential loss and compositional replacement components, an avenue that future studies with broader sampling coverage per district could formally evaluate.
The results should be interpreted considering that acoustic activity does not directly reflect population abundance and that sampling corresponded to a single temporal period. Acoustic identification may additionally involve uncertainty for some assigned sonotypes, particularly sonotypes of the genus Nyctinomops, for which classification accuracy was comparatively lower. The environmental variables that could mediate the observed patterns, including vegetation cover, artificial light intensity, water availability, and habitat connectivity, were inferred from district-level demographic and land-use data and published evidence but were not directly measured at each sampling station; for this reason, the gradient among districts is treated as a proxy for urbanization intensity, and the diversity differences reported here should be read as associations rather than effects directly attributable to a single environmental factor. The unequal distribution of stations among districts, with Pachía represented by a single station, could introduce sampling biases in diversity comparisons; to minimize this potential bias, all alpha diversity estimates were standardized to a minimum of 27 acoustic detections—corresponding to Pachía—ensuring that comparisons reflect differences in assemblage composition rather than sampling effort. A further limitation concerns recording equipment: deployment was conditioned by theft and vandalism risk, with AudioMoth units placed in exposed public areas of highly urbanized zones, while SM4BAT-FS units were restricted to secured urban parks. As device type was not distributed uniformly along the gradient, differences in microphone sensitivity and noise filtering [81] are partially confounded with urbanization intensity, and contrasts in acoustic activity and sonotype richness between more urbanized matrices and sites with greater vegetation cover should be read within the detection limits of the equipment deployed at each site.
Future studies incorporating a greater number of sampling units per district, direct measurements of landscape attributes, and a balanced allocation of device types along the gradient could contribute to clarifying the mechanisms that structure bat assemblages along urban gradients in arid zones. Integrating environmental variables such as vegetation cover, artificial light intensity, and habitat connectivity as explicit predictors—rather than as district-level proxies—would allow the filtering processes suggested here to be formally tested.
The confirmed presence of bat assemblages within the urban matrix of Tacna points to a broader management gap: standardized protocols for human–bat conflict situations in urban environments remain limited in Peru, and the acoustic baseline documented here could provide technical grounding for national and local conservation authorities seeking to develop evidence-based urban bat management guidelines.


5. Conclusions

This study documented nine bat sonotypes along an urban–rural gradient in Tacna, southern Peru—including the first acoustic detection of Nyctinomops laticaudatus and Nyctinomops macrotis in the urban area of Tacna—and constructed a local sound library that contributes directly to addressing the deficit of acoustic reference repositories for bat sonotypes in arid South America. The discriminant model achieved 94.47% accuracy under LOOCV, supporting passive acoustic monitoring as a reliable and cost-accessible tool for bat inventories in arid urban environments.
Alpha and beta diversity patterns varied along the urbanization gradient, with the highest diversity in Pocollay and the lowest in Gregorio Albarracín. In a hyperarid landscape such as Tacna, these results suggest that certain urban and peri-urban sectors may function as ecological oases for some bat sonotypes, concentrating food resources and roosting opportunities within a desert matrix. Likewise, the acoustic patterns observed may reflect the differential use of these resources by sonotypes with high dispersal capacity, rather than representing fully isolated communities. These findings highlight the need for future studies to evaluate the role of green spaces, roost availability, landscape connectivity, and artificial lighting in arid cities.

Supplementary Materials

The following supporting information can be downloaded at: https://www.mdpi.com/article/10.3390/urbansci10080474/s1. Table S1: Geographic information and acoustic sampling effort for each sampling site in Tacna, southern Peru; Figure S1: Location of the acoustic sampling sites in Pocollay District, Tacna, Peru; Figure S2: Location of the acoustic sampling sites in Tacna District, Tacna, Peru; Figure S3: Location of the acoustic sampling sites in Gregorio Albarracín Lanchipa District, Tacna, Peru; Figure S4: Location of the acoustic sampling sites in Pachía District, Tacna, Peru.

Author Contributions

Conceptualization, M.S.-S., F.L.Q.-H., J.L.C.-M., M.C.S.-R., A.A.T.-A., E.M.C.-C., M.R.H.-N., A.M.E.-L., F.E.L.-M., L.A.M.A.-G., E.O.C.-C., G.A.-A. and R.M.M.-C.; Methodology, M.S.-S., F.L.Q.-H., J.L.C.-M., M.C.S.-R., A.A.T.-A., E.M.C.-C., M.R.H.-N., A.M.E.-L., F.E.L.-M., L.A.M.A.-G. and E.O.C.-C.; Formal Analysis, M.S.-S. and F.L.Q.-H.; Investigation, G.A.-A. and R.M.M.-C.; Data Curation, M.S.-S., F.L.Q.-H., J.L.C.-M., M.C.S.-R., A.A.T.-A., E.M.C.-C., M.R.H.-N., A.M.E.-L., F.E.L.-M., L.A.M.A.-G. and E.O.C.-C.; Writing—Original Draft Preparation, M.S.-S. and F.L.Q.-H.; Writing—Review and Editing, J.L.C.-M., M.C.S.-R., A.A.T.-A., E.M.C.-C., M.R.H.-N., A.M.E.-L., F.E.L.-M., L.A.M.A.-G., E.O.C.-C., G.A.-A. and R.M.M.-C.; Visualization, M.S.-S. and F.L.Q.-H.; Supervision, G.A.-A. and R.M.M.-C.; Validation, G.A.-A. and R.M.M.-C. All authors have read and agreed to the published version of the manuscript.

Funding

This research was funded by the Universidad Nacional Jorge Basadre Grohmann (UNJBG), Tacna, Peru, through the Vice-Rectorate for Research (Vicerrectorado de Investigación) via the Research Seedbeds Program (Semilleros de Investigación), grant number Resolución Rectoral N° 13768-2024-UNJBG. The APC was funded by the Universidad Nacional Jorge Basadre Grohmann (UNJBG).

Data Availability Statement

The data supporting the reported results are openly available in Zenodo at https://doi.org/10.5281/zenodo.19862158.

Acknowledgments

During the preparation of this manuscript, the authors used DeepL (version accessible at deepl.com) for the purposes of translating the original text from Spanish into English. The authors have reviewed and edited the output and take full responsibility for the content of this publication.

Conflicts of Interest

The authors declare no conflicts of interest. The funders had no role in the design of the study; in the collection, analyses, or interpretation of data; in the writing of the manuscript; or in the decision to publish the results.

Appendix A

Table A1. Standardized coefficients of the discriminant functions for the five acoustic parameters included in the Discriminant Function Analysis (DFA). Coefficients with greater absolute values indicate stronger contributions of the corresponding acoustic parameter to sonotype discrimination within each linear discriminant function (LD).
ParameterLD1 (97.4%)LD2 (2.2%)
Initial Frequency (IF)−2.8811.8912
Final Frequency (FF)−3.6581−4.4563
Peak Frequency (PF)−1.91311.4247
Pulse Duration (PD)1.6001−2.6007
Interpulse Interval (IP)0.38661.6401
Table A2. Confusion matrix and Leave-One-Out Cross-Validation (LOOCV) classification results of the Discriminant Function Analysis (DFA) for six sonotypes represented by more than five recordings. Rows correspond to observed sonotype assignments and columns to DFA-predicted classifications obtained through LOOCV. Diagonal values represent correctly classified recordings, whereas off-diagonal values indicate misclassifications. Only sonotypes represented by more than five recordings were included in the validation procedure to avoid unstable classification estimates associated with limited sample size.
SonotypesIdentifications
M. atacamensisM. kalinowskiiN. aurispinosusN. macrotisP. davisoniT. brasiliensis
M. atacamensis20100000
M. kalinowskii0150023
N. aurispinosus005000
N. macrotis0041300
P. davisoni0400793
T. brasiliensis0000546
n201199138652
Accuracy per sonotype (%)1007510076.4791.8690.19

References

  1. Seto, K.C.; Güneralp, B.; Hutyra, L.R. Global Forecasts of Urban Expansion to 2030 and Direct Impacts on Biodiversity and Carbon Pools. Proc. Natl. Acad. Sci. USA 2012, 109, 16083–16088. [Google Scholar] [CrossRef] [Scilit]
  2. Gili, F.; Newson, S.E.; Gillings, S.; Chamberlain, D.E.; Border, J.A. Bats in Urbanising Landscapes: Habitat Selection and Recommendations for a Sustainable Future. Biol. Conserv. 2020, 241, 108343. [Google Scholar] [CrossRef] [Scilit]
  3. Rivero-Monteagudo, J.; Mena, J.L. Hourly Activity Patterns of the Insectivorous Bat Assemblage in the Urban–Rural Landscape of Lima, Peru. J. Mammal. 2023, 104, 770–782. [Google Scholar] [CrossRef] [Scilit]
  4. Conenna, I.; Muñoz-Garcia, A.; Korine, C. Physiological and Behavioural Strategies of Bats From Arid Environments. Mammal Rev. 2025, 55, e70005. [Google Scholar] [CrossRef] [Scilit]
  5. Razgour, O.; Persey, M.; Shamir, U.; Korine, C. The Role of Climate, Water and Biotic Interactions in Shaping Biodiversity Patterns in Arid Environments across Spatial Scales. Divers. Distrib. 2018, 24, 1440–1452. [Google Scholar] [CrossRef] [Scilit]
  6. Dalhoumi, R.; El Mokni, R.; Ouni, R.; Beyrem, H.; Aulagnier, S. Bats of the Tunisian Desert: Preliminary Data Using Acoustic Identification and First Record of Taphozous Nudiventris in the Country. Diversity 2023, 15, 1108. [Google Scholar] [CrossRef] [Scilit]
  7. Rainho, A.; Ferreira, D.F.; Makori, B.; Bartonjo, M.; Repas-Gonçalves, M.; Kirakou, S.; Maghuwa, F.; Webala, P.W.; Tomé, R. Guild Vertical Stratification and Drivers of Bat Foraging in a Semi-Arid Tropical Region, Kenya. Biology 2023, 12, 1116. [Google Scholar] [CrossRef] [Scilit] [PubMed]
  8. Gutiérrez-Granados, G.; Rodríguez-Zúñiga, M.T. Bats as Indicators of Ecological Resilience in a Megacity. Urban Ecosyst. 2024, 27, 479–489. [Google Scholar] [CrossRef] [Scilit]
  9. Gitau, C.; Kettel, E.; Abrahams, C.; Webala, P.W.; Uzal, A. The Role of Ecoacoustics in Monitoring Ecosystem Degradation and Restoration. Restor. Ecol. 2025, 33, e70168. [Google Scholar] [CrossRef] [Scilit]
  10. Mac Aodha, O.; Gibb, R.; Barlow, K.E.; Browning, E.; Firman, M.; Freeman, R.; Harder, B.; Kinsey, L.; Mead, G.R.; Newson, S.E.; et al. Bat Detective—Deep Learning Tools for Bat Acoustic Signal Detection. PLoS Comput. Biol. 2018, 14, e1005995. [Google Scholar] [CrossRef] [Scilit] [PubMed]
  11. Hoefer, S.; McKnight, D.T.; Allen-Ankins, S.; Nordberg, E.J.; Schwarzkopf, L. Passive Acoustic Monitoring in Terrestrial Vertebrates: A Review. Bioacoustics 2023, 32, 506–531. [Google Scholar] [CrossRef] [Scilit]
  12. Sugai, L.S.M.; Silva, T.S.F.; Ribeiro, J.W.; Llusia, D. Terrestrial Passive Acoustic Monitoring: Review and Perspectives. Bioscience 2019, 69, 15–25. [Google Scholar] [CrossRef] [Scilit]
  13. Roemer, C.; Haquart, A.; López-Baucells, A.; Besnard, A. Current Frontiers in the Passive Acoustic Monitoring of Bats. Methods Ecol. Evol. 2025, 16, 2534–2544. [Google Scholar] [CrossRef] [Scilit]
  14. López-Baucells, A.; Yoh, N.; Rocha, R.; Bobrowiec, P.E.D.; Palmeirim, J.M.; Meyer, C.F.J. Optimizing Bat Bioacoustic Surveys in Human-modified Neotropical Landscapes. Ecol. Appl. 2021, 31, e02366. [Google Scholar] [CrossRef] [Scilit] [PubMed]
  15. Gumede, L.; Comley, J.; Schmitt, M.H.; Stears, K.; Parker, D.M. Using Acoustic Monitoring to Assess Insectivorous Bat Richness and Activity in a Sub-Tropical Savanna. Biotropica 2025, 57, e70082. [Google Scholar] [CrossRef] [Scilit]
  16. Ugarte-Núñez, J.A. Clave de Identificación Por Ecolocación de 20 Especies de Murciélagos Del Suroeste de Perú. Cienc. Desarro. 2020, 27, 37–48. [Google Scholar] [CrossRef] [Scilit]
  17. Arias-Aguilar, A.; Hintze, F.; Aguiar, L.M.S.; Rufray, V.; Bernard, E.; Pereira, M.J.R. Who’s Calling? Acoustic Identification of Brazilian Bats. Mammal Res. 2018, 63, 231–253. [Google Scholar] [CrossRef] [Scilit]
  18. Zamora-Gutierrez, V.; Ortega, J.; Avila-Flores, R.; Aguilar-Rodríguez, P.A.; Alarcón-Montano, M.; Avila-Torresagatón, L.G.; Ayala-Berdón, J.; Bolívar-Cimé, B.; Briones-Salas, M.; Chan-Noh, M.; et al. The Sonozotz Project: Assembling an Echolocation Call Library for Bats in a Megadiverse Country. Ecol. Evol. 2020, 10, 4928–4943. [Google Scholar] [CrossRef] [Scilit] [PubMed]
  19. Jung, K.; Kalko, E.K.V. Adaptability and Vulnerability of High Flying Neotropical Aerial Insectivorous Bats to Urbanization. Divers. Distrib. 2011, 17, 262–274. [Google Scholar] [CrossRef] [Scilit]
  20. Dwyer, J.M.; Moore, M.S.; Lewis, J.S. Trade-offs in Habitat Use and Occupancy of Bats across the Gradient of Urbanization and Seasons. Ecosphere 2024, 15, e4884. [Google Scholar] [CrossRef] [Scilit]
  21. Russo, D.; Ancillotto, L. Sensitivity of Bats to Urbanization: A Review. Mamm. Biol. 2015, 80, 205–212. [Google Scholar] [CrossRef] [Scilit] [PubMed]
  22. Starik, N.; Gygax, L.; Göttert, T. Unexpected Bat Community Changes along an Urban–Rural Gradient in the Berlin–Brandenburg Metropolitan Area. Sci. Rep. 2024, 14, 10552. [Google Scholar] [CrossRef] [Scilit] [PubMed]
  23. Briones-Salas, M.; Medina-Cruz, G.E.; Martin-Regalado, C.N. Taxonomic, Functional, and Phylogenetic Diversity of Bats in Urban and Suburban Environments in Southern México. Diversity 2024, 16, 527. [Google Scholar] [CrossRef] [Scilit]
  24. Chao, A.; Gotelli, N.J.; Hsieh, T.C.; Sander, E.L.; Ma, K.H.; Colwell, R.K.; Ellison, A.M. Rarefaction and Extrapolation with Hill Numbers: A Framework for Sampling and Estimation in Species Diversity Studies. Ecol. Monogr. 2014, 84, 45–67. [Google Scholar] [CrossRef] [Scilit]
  25. Alencastre-Santos, A.B.; Gonçalves, R.; Correia, L.L.; Brito, D.; Oprea, M.; Vieira, T.B. The Effect of Urbanization on Species Composition and Trophic Guilds of Bats (Mammalia, Chiroptera) in the Brazilian Savanna. Braz. J. Biol. 2024, 84, e275828. [Google Scholar] [CrossRef] [Scilit] [PubMed]
  26. Mena, J.L.; Rivero, J.; Bonifaz, E.; Pastor, P.; Pacheco, J.; Aide, T.M. The Effect of Artificial Light on Bat Richness and Nocturnal Soundscapes along an Urbanization Gradient in an Arid Landscape of Central Peru. Urban Ecosyst. 2022, 25, 563–574. [Google Scholar] [CrossRef] [Scilit]
  27. Aragón, A.G.; Aguirre, Q.M. Distribución de Murciélagos (Chiroptera) de La Región Tacna, Perú. Idesia 2014, 32, 119–127. [Google Scholar] [CrossRef] [Scilit]
  28. Flores-Quispe, M.; Calizaya-Mamani, G.; Portugal-Zegarra, G.; Aragon Alvarado, G.; Pacheco-Castillo, J.; Rengifo, E.M. Contributions to the Natural History of Mormopterus Kalinowskii (Chiroptera: Molossidae) in the Southwest of Peru. Therya 2019, 10, 343–352. [Google Scholar] [CrossRef] [Scilit]
  29. Instituto Nacional de Estadística e Informática. Compendio Estadístico Tacna 2024; Oficina Departamental de Estadística e Informática: Tacna, Peru, 2024. [Google Scholar]
  30. Instituto Nacional de Estadística e Informática. Perú: Perfil Sociodemográfico. Informe Nacional; Instituto Nacional de Estadística: Lima, Peru, 2017.
  31. Instituto Geofísico del Perú (IGP). El Clima en el Perú: Tacna. Available online: http://met.igp.gob.pe/clima/HTML/tacna.html (accessed on 30 May 2026).
  32. Gobierno Regional de Tacna. Estudio Especializado de Servicios Ecosistémicos de La Región Tacna; Gobierno Regional de Tacna: Tacna, Peru, 2021.
  33. Giménez, A.L.; Grech, M.G.; De Paz, Ó. Exploring the Effects of Climatic and Environmental Heterogeneity on the Spatial Activity of Patagonian Bats. BMC Ecol. Evol. 2025, 25, 83. [Google Scholar] [CrossRef] [Scilit] [PubMed]
  34. Hill, A.P.; Prince, P.; Piña Covarrubias, E.; Doncaster, C.P.; Snaddon, J.L.; Rogers, A. AudioMoth: Evaluation of a Smart Open Acoustic Device for Monitoring Biodiversity and the Environment. Methods Ecol. Evol. 2018, 9, 1199–1211. [Google Scholar] [CrossRef] [Scilit]
  35. Kunberger, J.M.; Long, A.M. A Comparison of Bat Calls Recorded by Two Acoustic Monitors. J. Fish Wildl. Manag. 2023, 14, 171–178. [Google Scholar] [CrossRef] [Scilit]
  36. Perks, S.J.; O’Connell, M.J.; Goodenough, A.E. Comparing Passive Acoustic Monitoring Bat Data from Commercial and Open-source Detectors: Evidence to Support Best Practice. Ecol. Solut. Evid. 2025, 6, e70103. [Google Scholar] [CrossRef] [Scilit]
  37. Britzke, E.R.; Gillam, E.H.; Murray, K.L. Current State of Understanding of Ultrasonic Detectors for the Study of Bat Ecology. Acta Theriol. 2013, 58, 109–117. [Google Scholar] [CrossRef] [Scilit]
  38. Barboza, K.; Aguirre, L.F.; Kalko, E.K.V. Protocolo Estandarizado Para Obtener El Registro y El Análisis de Llamadas Emitidas Por Murciélagos. Rev. Cienc. Tecnol. 2006, 5, 9–13. [Google Scholar]
  39. Brinkløv, S.M.M.; Macaulay, J.; Bergler, C.; Tougaard, J.; Beedholm, K.; Elmeros, M.; Madsen, P.T. Open-source Workflow Approaches to Passive Acoustic Monitoring of Bats. Methods Ecol. Evol. 2023, 14, 1747–1763. [Google Scholar] [CrossRef] [Scilit]
  40. McBurney, T.S.; Segers, J.L. Guide for Bat Monitoring in Atlantic Canada; Canadian Wildlife Health Cooperative (CWHC): Saskatoon, SK, Canada, 2021. [Google Scholar]
  41. Martinez Medina, D.; Sánchez, J.; Zurc, D.; Sánchez, F.; Otálora-Ardila, A.; Restrepo-Giraldo, C.; Acevedo-Charry, O.; Hernández Leal, F.; Lizcano, D.J. Estándares Para Registrar Señales de Ecolocalización y Construir Bibliotecas de Referencia de Murciélagos En Colombia. Biota Colomb. 2021, 22, 36–56. [Google Scholar] [CrossRef] [Scilit]
  42. Salas Salinas, O.M.; Quispe Huacca, F.L.; Curo Mamani, J.L.; Soto Rojas, M.; Choque Conodori, E.M.; Torres Auccapuri, A.A.; Hañari Nina, M.R.; Estrada Lupaca, A.M.; Linghán Marca, F.E.; Chavez Cayo, E.O.; et al. Acoustic Reference Library of Insectivorous Bats along an Urban–Rural Gradient in a Desert City of Southern Peru (Tacna, 2024–2025). Version 1. Zenodo, 2026. Available online: https://zenodo.org/records/19862158 (accessed on 30 May 2026).
  43. GPS PERÚ, G.E.O. Límite Distrital Actualizado-INEI-Descargar Shapefile Gratis + Mapa Web. Available online: https://www.geogpsperu.com/2019/05/limite-distrital-actualizado-inei.html (accessed on 30 May 2026).
  44. Siles, L.; Peñaranda, D.; Pérez-Zubieta, J.C.; Barboza, K. Los Murciélagos de La Ciudad de Cochabamba. Rev. Boliv. Ecol. Conserv. Ambient. 2005, 18, 51–64. [Google Scholar]
  45. Ossa, G.; Forero, L.; Novoa, F.; Bonacic, C. Caracterización Morfológica y Bioacústica de Los Murciélagos (Chiroptera) de La Reserva Nacional Pampa de Tamarugal. Biodiversidata 2015, 4, 21–29. [Google Scholar]
  46. Pacheco, V.; Graham-Angeles, L.; Diaz Peña, S.R.; Hurtado, C.M.; Ruelas, D.; Cervantes Zevallos, O.K.; Serrano Villavicencio, J.E. Diversidad y Distribución de Los Mamíferos Del Perú Por Departamentos y Ecorregiones I. Rev. Peru. Biol. 2020, 27, 289–328. [Google Scholar] [CrossRef] [Scilit]
  47. González Noschese, C.S.; Olmedo, M.L.; Pérez, M.J.; Díaz, M.M. First Characterisation of Bat Echolocation Calls in Argentina. Bioacoustics 2025, 34, 530–550. [Google Scholar] [CrossRef] [Scilit]
  48. Venables, W.N.; Ripley, B.D. Modern Applied Statistics with S; Springer: New York, NY, USA, 2002; ISBN 978-1-4419-3008-8. [Google Scholar]
  49. Lumumba, V.; Kiprotich, D.; Mpaine, M.; Makena, N.; Kavita, M. Comparative Analysis of Cross-Validation Techniques: LOOCV, K-Folds Cross-Validation, and Repeated K-Folds Cross-Validation in Machine Learning Models. Am. J. Theor. Appl. Stat. 2024, 13, 127–137. [Google Scholar] [CrossRef] [Scilit]
  50. Oksanen, J.; Simpson, G.L.; Blanchet, F.G.; Kindt, R.; Legendre, P.; Minchin, P.R.; O’Hara, R.B.; Solymos, P.; Stevens, M.H.H.; Szoecs, E.; et al. Vegan: Community Ecology Package. CRAN: Contributed Packages. Available online: https://CRAN.R-project.org/package=vegan (accessed on 1 July 2026).
  51. Hurlbert, S.H. The Nonconcept of Species Diversity: A Critique and Alternative Parameters. Ecology 1971, 52, 577–586. [Google Scholar] [CrossRef] [Scilit] [PubMed]
  52. Hsieh, T.C.; Ma, K.H.; Chao, A. iNEXT: Interpolation and Extrapolation for Species Diversity. CRAN: Contributed Packages. Available online: https://CRAN.R-project.org/package=iNEXT (accessed on 1 July 2026).
  53. Wickham, H. Ggplot2; Springer International Publishing: Cham, Switzerland, 2016; ISBN 978-3-319-24275-0. [Google Scholar]
  54. Flores, M.G.; Mamani, G.C.; Pacheco, V.; Alvarado, G.A. Distribution of Promops Davisoni Thomas, 1921 (Chiroptera: Molossidae) in Peru with a New Record and Southward Range Extension. Check List 2015, 11, 1573. [Google Scholar] [CrossRef] [Scilit]
  55. Portugal-Zegarra, G.; Flores-Quispe, M.; Calizaya-Mamani, G.; Aragón Alvarado, G. New Record of Nyctinomops Aurispinosus with an Update of Its Known Distribution. Therya Notes 2020, 1, 67–76. [Google Scholar] [CrossRef] [Scilit]
  56. Mamani-Contreras, R.; Aragón-Alvarado, G. First Record of Lasiurus Arequipae in the Department of Tacna, Perú. Therya Notes 2021, 2, 143–146. [Google Scholar] [CrossRef] [Scilit]
  57. Pham, L.K.; Van Tran, B.; Le, Q.T.; Nguyen, T.T.; Voigt, C.C. Description of Echolocation Call Parameters for Urban Bats in Vietnam as a Step Towards a More Integrated Acoustic Monitoring of Urban Wildlife in Southeast Asia. Diversity 2021, 13, 18. [Google Scholar] [CrossRef] [Scilit]
  58. Rodríguez-San Pedro, A.; Allendes, J.; Ossa, G. Updated List of Bats of Chile with Comments on Taxonomy, Ecology, and Distribution. Biodivers. Nat. Hist. 2016, 2, 16–39. [Google Scholar]
  59. Sánchez, M.S.; de Araújo, C.B.; Boeris, J.M.; Serafini, V.N.; Taffarel, A.; Martí, D.A. Habitat Use and Temporal Activity of the Big Crested Mastiff Bat (Promops Centralis, Molossidae) along an Urban-Natural Gradient: A Bioacoustics Approach. J. Mammal. 2025, 106, 733–744. [Google Scholar] [CrossRef] [Scilit]
  60. Arévalo-Cortés, J.; Tulcan-Flores, J.; Zurc, D.; Montenegro-Muñoz, S.A.; Calderón-Leytón, J.J.; Fernández-Gómez, R.A. Description of the Echolocation Pulses of Insectivorous Bats with New Records for Southwest Colombia. Mammal Res. 2024, 69, 231–244. [Google Scholar] [CrossRef] [Scilit]
  61. Chaverri, G.; Quirós, O.E. Variation in Echolocation Call Frequencies in Two Species of Free-Tailed Bats According to Temperature and Humidity. J. Acoust. Soc. Am. 2017, 142, 146–150. [Google Scholar] [CrossRef] [Scilit] [PubMed]
  62. Málaga, B.A.; Díaz, D.R.; Arias, S.; Medina, C.E. Una Especie Nueva de Lasiurus (Chiroptera: Vespertilionidae) Del Suroeste de Perú. Rev. Mex. Biodivers. 2020, 91, 599–602. [Google Scholar] [CrossRef] [Scilit]
  63. Rodríguez-Posada, M.E.; Morales-Martínez, D.M.; Ramírez-Chaves, H.E.; Martínez-Medina, D.; Calderón-Acevedo, C.A. A New Species of Long-Eared Brown Bat of the Genus Histiotus (Chiroptera) and the Revalidation of Histiotus Colombiae. Caldasia 2021, 43, 221–234. [Google Scholar] [CrossRef] [Scilit]
  64. Lanchipa-Ale, T.; Aragón-Alvarado, G. Ensamble de Murciélagos En El Valle de Ite, Región Tacna, Perú. Idesia 2018, 36, 83–90. [Google Scholar] [CrossRef] [Scilit]
  65. Taylor-Boyd, H.; Fuentes-Montemayor, E.; Monadjem, A.; Cooper-Bohannon, R.; Montauban, C.; Mata, V.A.; Rebelo, H.; Kangwa, B.; Mateke, C.; Park, K. Acoustic Parameters of Bat Echolocation Calls in Zambia: A Collaborative Effort to Develop a Call Library for Non-Invasive Research and Monitoring. Acta Chiropt. 2025, 27, 111–124. [Google Scholar] [CrossRef] [Scilit]
  66. Novaes, R.L.M.; Pedro, A.R.-S.; Saldarriaga-Córdoba, M.M.; Aguilera-Acuña, O.; Wilson, D.E.; Moratelli, R. Systematic Review of Myotis (Chiroptera, Vespertilionidae) from Chile Based on Molecular, Morphological, and Bioacoustic Data. Zootaxa 2022, 5188, 430–452. [Google Scholar] [CrossRef] [Scilit] [PubMed]
  67. Castro, M.G.; Amado, T.F.; Olalla-Tárraga, M.Á. Correlated Evolution between Body Size and Echolocation in Bats (Order Chiroptera). BMC Ecol. Evol. 2024, 24, 44. [Google Scholar] [CrossRef] [Scilit] [PubMed]
  68. Meramo, K.; Ovaskainen, O.; Bernard, E.; Silva, C.R.; Laine, V.N.; Lilley, T.M. Contrasting Effects of Chronic Anthropogenic Disturbance on Activity and Species Richness of Insectivorous Bats in Neotropical Dry Forest. Front. Ecol. Evol. 2022, 10, 822415. [Google Scholar] [CrossRef] [Scilit]
  69. Ugarte-Núñez, J. Morfología Alar y Ecolocación Del Murciélago de Atacama Myotis Atacamensis (Chiroptera: Vespertilionidae), Con Comentarios Sobre Su Conservación, Uso de Hábitat y Distribución. SciELO Preprints 2020. Available online: https://preprints.scielo.org/index.php/scielo/preprint/view/1151/version/1229 (accessed on 1 July 2026). [CrossRef] [Scilit]
  70. Barreda, S. Uso de Hábitat de Los Murciélagos Insectívoros En Un Bosque Artificial de La Molina y Alrededores (Lima, Perú). Mammal Notes 2021, 7, 195. [Google Scholar] [CrossRef] [Scilit]
  71. Pérez-García, C.; Bernal-Contreras, K.; Ramírez-Castellanos, D.M.; Buitrago-Valenzuela, D.C.; Ceballos-Ladino, L.A.; Sánchez-Barrera, F. Edificios Usados Como Refugios Por Murciélagos En Un Campus Universitario Del Piedemonte Llanero de Colombia. Orinoquia 2019, 23, 109–120. [Google Scholar] [CrossRef] [Scilit]
  72. Printz, L.; Jung, K. Urban Areas in Rural Landscapes—The Importance of Green Space and Local Architecture for Bat Conservation. Front. Ecol. Evol. 2023, 11, 1194670. [Google Scholar] [CrossRef] [Scilit]
  73. Municipalidad Distrital de Pocollay. Plan de Desarrollo Local Concertado Del Distrito de Pocollay 2017–2021; Municipalidad Distrital de Pocollay: Tacna, Peru, 2017.
  74. Aguiar, L.M.S.; Bueno-Rocha, I.D.; Oliveira, G.; Pires, E.S.; Vasconcelos, S.; Nunes, G.L.; Frizzas, M.R.; Togni, P.H.B. Going out for Dinner—The Consumption of Agriculture Pests by Bats in Urban Areas. PLoS ONE 2021, 16, e0258066. [Google Scholar] [CrossRef] [Scilit] [PubMed]
  75. Threlfall, C.G.; Law, B.; Banks, P.B. Influence of Landscape Structure and Human Modifications on Insect Biomass and Bat Foraging Activity in an Urban Landscape. PLoS ONE 2012, 7, e38800. [Google Scholar] [CrossRef] [Scilit] [PubMed]
  76. Rosero-Taramuel, J.L.; Mejía-Fontecha, I.Y.; Marín-Ramírez, A.; Marín-Giraldo, V.; Ramírez-Chaves, H.E. Urban and Peri-Urban Bats (Mammalia: Chiroptera) in Manizales, Colombia: Exploring a Conservation Area in Sub-Andean and Andean Ecosystems. Mammalia 2023, 87, 545–556. [Google Scholar] [CrossRef] [Scilit]
  77. Santos Bezerra, R.H.; Bocchiglieri, A. Bat Community Structure in Urban Green Areas of Northeastern Brazil. Mastozool. Neotrop. 2024, 31, e01033. [Google Scholar] [CrossRef] [Scilit]
  78. Jung, K.; Threlfall, C.G. Trait-Dependent Tolerance of Bats to Urbanization: A Global Meta-Analysis. Proc. R. Soc. B Biol. Sci. 2018, 285, 20181222. [Google Scholar] [CrossRef] [Scilit] [PubMed]
  79. Hale, J.D.; Fairbrass, A.J.; Matthews, T.J.; Sadler, J.P. Habitat Composition and Connectivity Predicts Bat Presence and Activity at Foraging Sites in a Large UK Conurbation. PLoS ONE 2012, 7, e33300. [Google Scholar] [CrossRef] [Scilit] [PubMed]
  80. Soininen, J.; Heino, J.; Wang, J. A Meta-analysis of Nestedness and Turnover Components of Beta Diversity across Organisms and Ecosystems. Glob. Ecol. Biogeogr. 2018, 27, 96–109. [Google Scholar] [CrossRef] [Scilit]
  81. Schmidt, N. Field Protocol for the North American Bat Monitoring Program in the Pacific Northwest; PNW NABat Field Reference Manual; Oregon State University-Cascades: Bend, OR, USA, 2022. [Google Scholar]
Figure 2. Spectrogram and oscillogram of the recorded sonotypes.
Urbansci 10 00474 g002
Figure 3. Discriminant Function Analysis applied to the bioacoustic parameters of the recorded sonotypes.
Urbansci 10 00474 g003
Table 1. Sound library of urban bats recorded in the districts of Tacna, Peru. IF = Initial Frequency; FF = Final Frequency; PF = Peak Frequency; BW = Bandwidth; PD = Pulse Duration; IP = Interpulse; FMd = Downward Modulated Frequency; FMa = Upward Modulated Frequency; QCFd = Downward Quasi-Constant Frequency; QCFa = Upward Quasi-Constant Frequency; N = number of acoustic detections.
Family/SonotypeComponentHarmonicNIFFFPFBWPDIP
Vespertilionidae
Histiotus montanusFMd2235.66 ± 0.822.6 ± 0.6123.9 ± 1.1413.05 ± 0.196.24 ± 0.42255.89 ± 21.49
Myotis atacamensisFMd120162.91 ± 4.1249.45 ± 1.852.3 ± 2.2513.37 ± 4.693.81 ± 0.7576.54 ± 14.33
Lasiurus sp.FMd1143.731.7134.5611.99.53138.84
Molossidae
Promops davisoniQCFa18630.25 ± 0.6432.42 ± 0.6931.31 ± 0.632.17 ± 0.6213.44 ± 1.45234.61 ± 51.23
Tadarida brasiliensisQCFd15131.77 ± 1.0930.06 ± 0.930.88 ± 0.861.71 ± 1.0211.81 ± 1.24232.21 ± 52.36
Mormopterus kalinowskiiFMa-QCFd12034.81 ± 1.1432.58 ± 1.1633.65 ± 1.292.23 ± 0.7910.87 ± 1.03208.23 ± 48.26
Nyctinomops laticaudatusQCFd1321.8 ± 0.2120.6 ± 0.3521 ± 0.441.2 ± 0.1513.56 ± 0.38384.55 ± 22.35
Nyctinomops aurispinosusQCFd1519.99 ± 0.5217.42 ± 0.6818.6 ± 0.422.57 ± 0.614.65 ± 1.04532.79 ± 83.46
Nyctinomops macrotisQCFd11717.26 ± 0.4515.99 ± 0.4216.52 ± 0.371.27 ± 0.315.96 ± 1.05637.66 ± 199.84
Table 2. Sonotype records in the four districts of Tacna Province. PAC = Pachía (n = 1); POC = Pocollay (n = 6); GAL = Gregorio Albarracín (n = 2); TAC = Tacna (n = 15). n = number of sampling stations.
Family/SonotypeDistricts
Pachía (n = 1)Pocollay (n = 7)Gregorio Albarracín (n = 3)Tacna (n = 12)
Vespertilionidae
Histiotus montanus2
Myotis atacamensis62726142
Lasiurus sp. 1
Molossidae
Promops davisoni 161753
Tadarida brasiliensis1116222
Mormopterus kalinowskii6725
Nyctinomops laticaudatus 1 2
Nyctinomops aurispinosus13 1
Nyctinomops macrotis15 11
TOTAL SONOTYPES6847
TOTAL RECORDS277647236
Table 3. Alpha diversity indices of bat acoustic activity by district in Tacna, Peru.
DistrictNRichness (S)Shannon (H′)Inverse Simpson (1/D)Pielou (J′)
Pachía2761.4713.660.821
Pocollay7681.6644.360.8
Gregorio Albarracín4740.9642.270.695
Tacna23671.152.360.591
Table 4. Bat sonotype diversity (Hill numbers q0–q2) standardized to 27 acoustic records across districts of Tacna. Values estimated using the estimated function in iNEXT 3.0. D = Hill number diversity; CI = confidence interval. q = 0: species richness; q = 1: exponential of Shannon entropy; q = 2: inverse Simpson concentration.
Districtq = 0—Sonotype Richnessq = 1—Shannon Diversityq = 2—Simpson Diversity
D95% CID95% CID95% CI
Pachía6(3.97–8.03)4.355(2.72–5.99)3.663(2.46–4.87)
Pocollay6.305(5.42–7.19)4.794(4.10–5.49)4.029(3.34–4.71)
Gregorio Albarracín3.648(2.68–4.62)2.544(2.07–3.02)2.225(1.82–2.63)
Tacna4.473(4.04–4.91)2.87(2.60–3.15)2.258(1.95–2.57)
Table 5. Bray–Curtis dissimilarity matrix of bats recorded across the four districts of Tacna, Peru.
ComparisonBray–Curtis Dissimilarity
Gregorio Albarracín—Pocollay0.2520
Gregorio Albarracín—Tacna0.6678
Gregorio Albarracín—Pachía0.7297
Pocollay—Pachía0.5146
Pocollay—Tacna0.5449
Pachía—Tacna0.8175
Disclaimer/Publisher’s Note: The statements, opinions and data contained in all publications are solely those of the individual author(s) and contributor(s) and not of MDPI and/or the editor(s). MDPI and/or the editor(s) disclaim responsibility for any injury to people or property resulting from any ideas, methods, instructions or products referred to in the content.