Spatial Correlation Network Assessment of the New Quality Productive Forces Among 283 Chinese Cities: Network Characteristics and Structural Resilience Features

Abstract
1. Introduction
2. Theoretical Foundations
2.1. Theoretical Basis
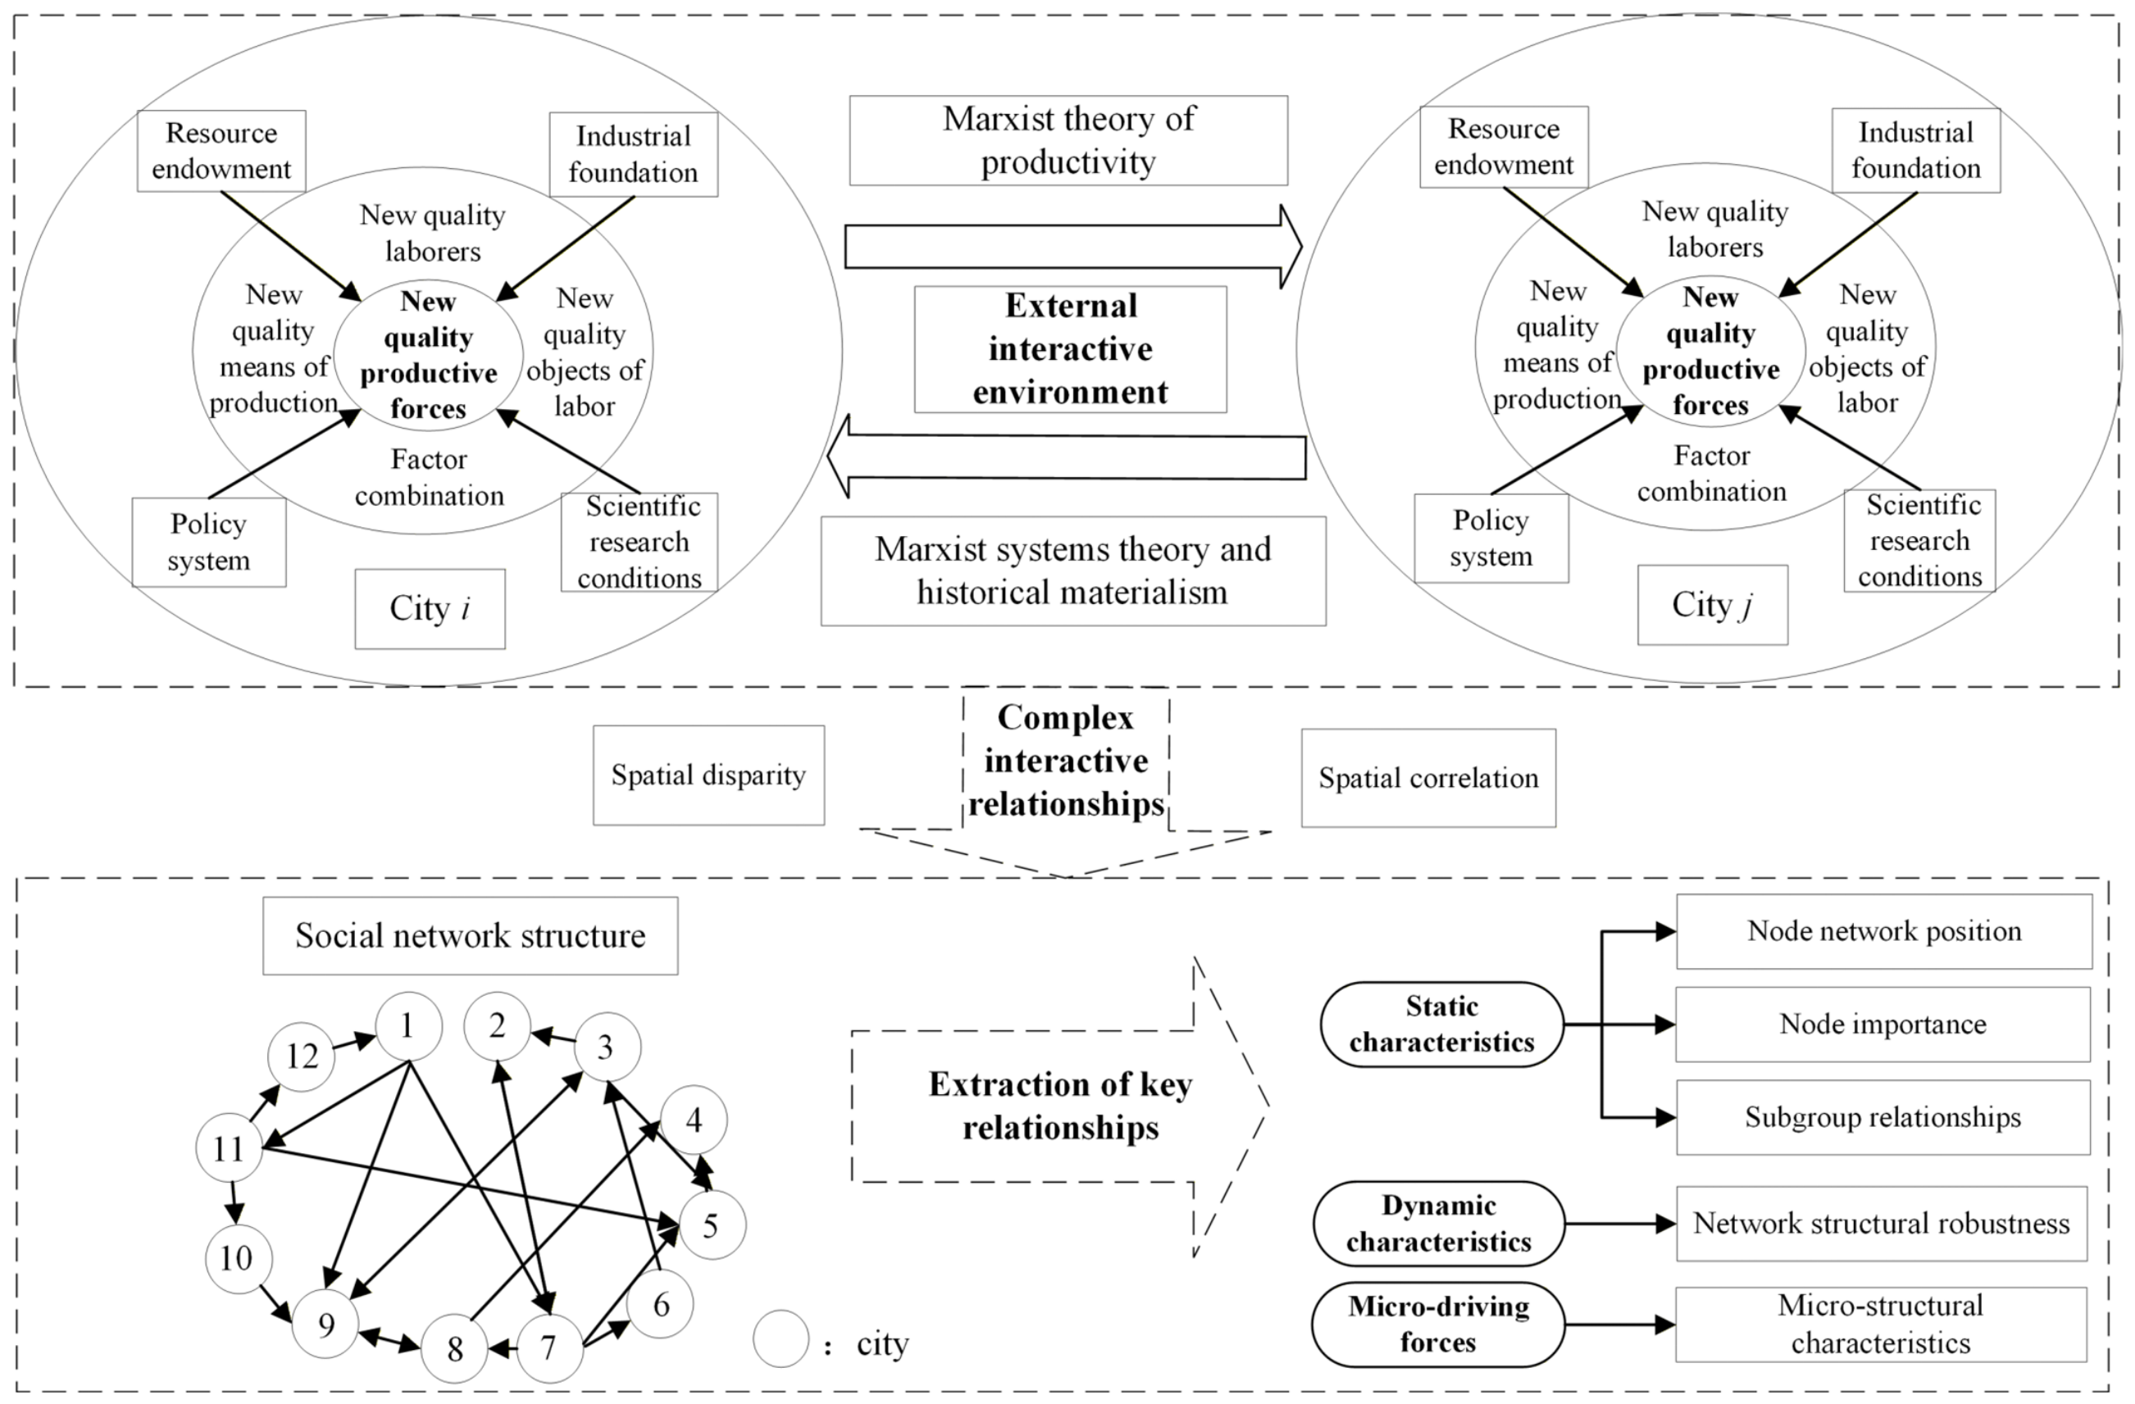
2.2. Logical Mechanism
3. Methodology
3.1. Analytic Strategy
3.2. Construction of NQPF Spatial Correlation Network
3.3. Network Characteristic Measurement Methods
3.4. Sample Description and Data Sources
4. Results
4.1. Static Network Characteristics Analysis
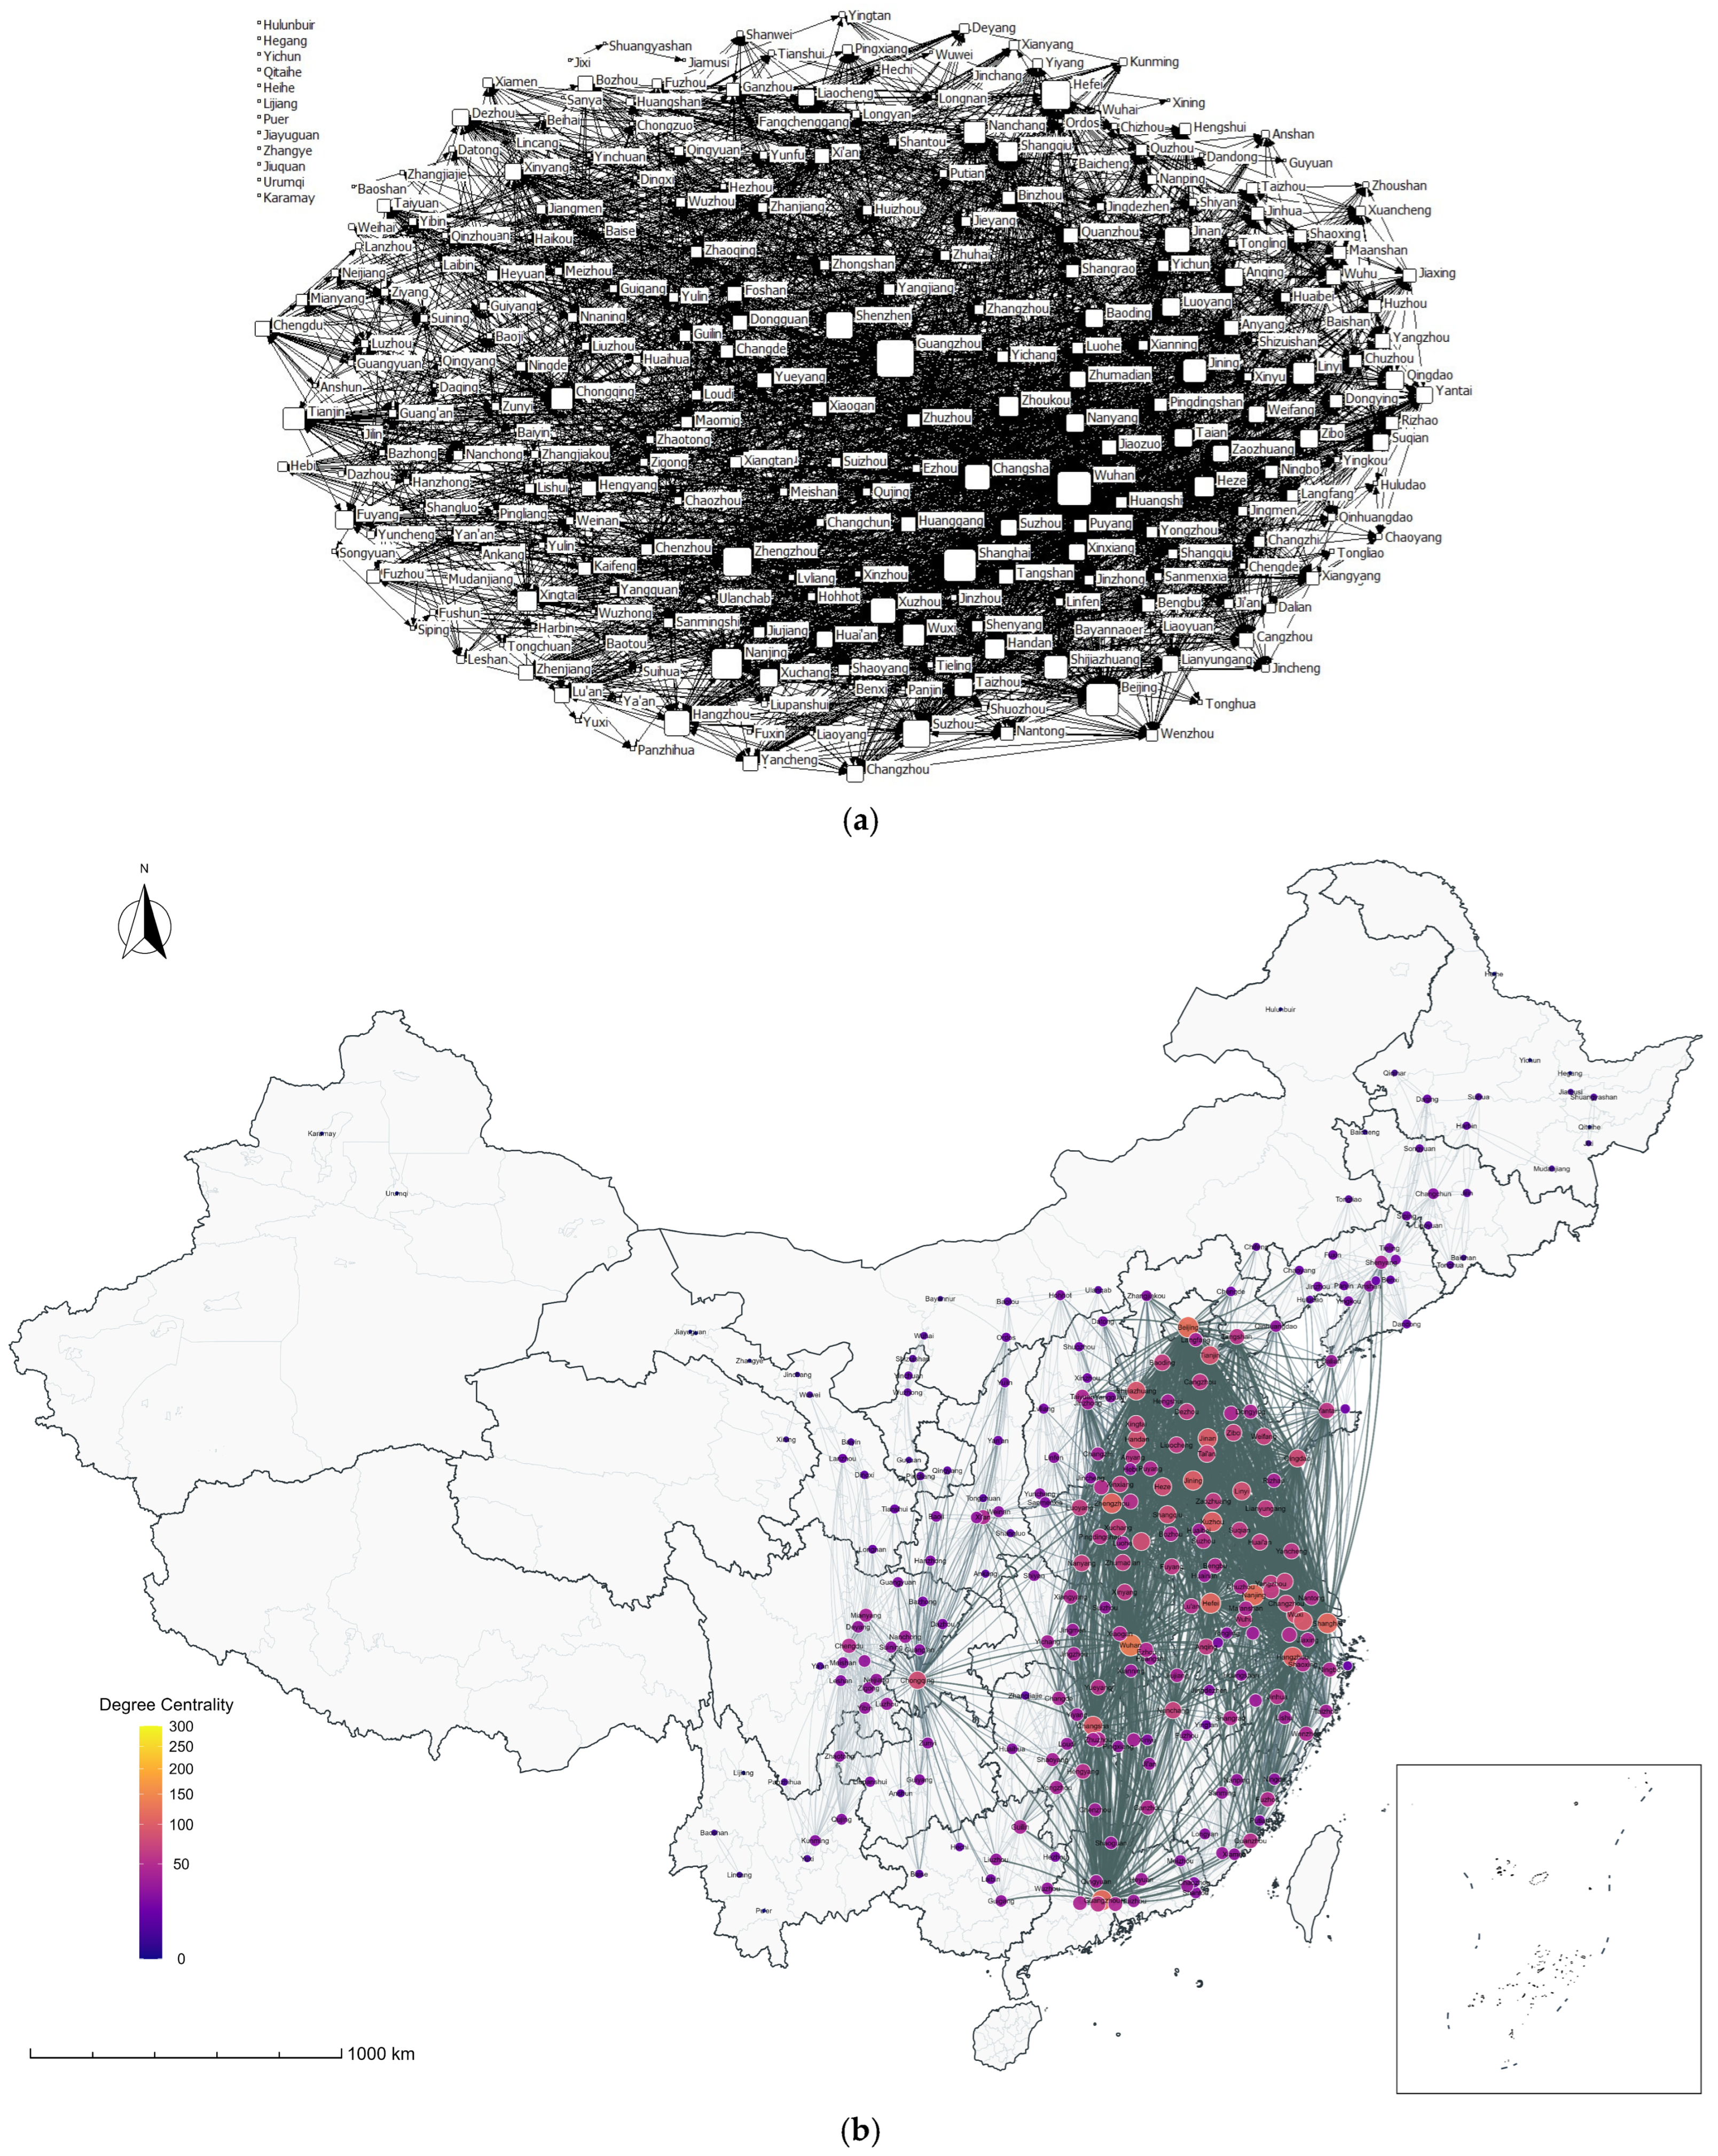
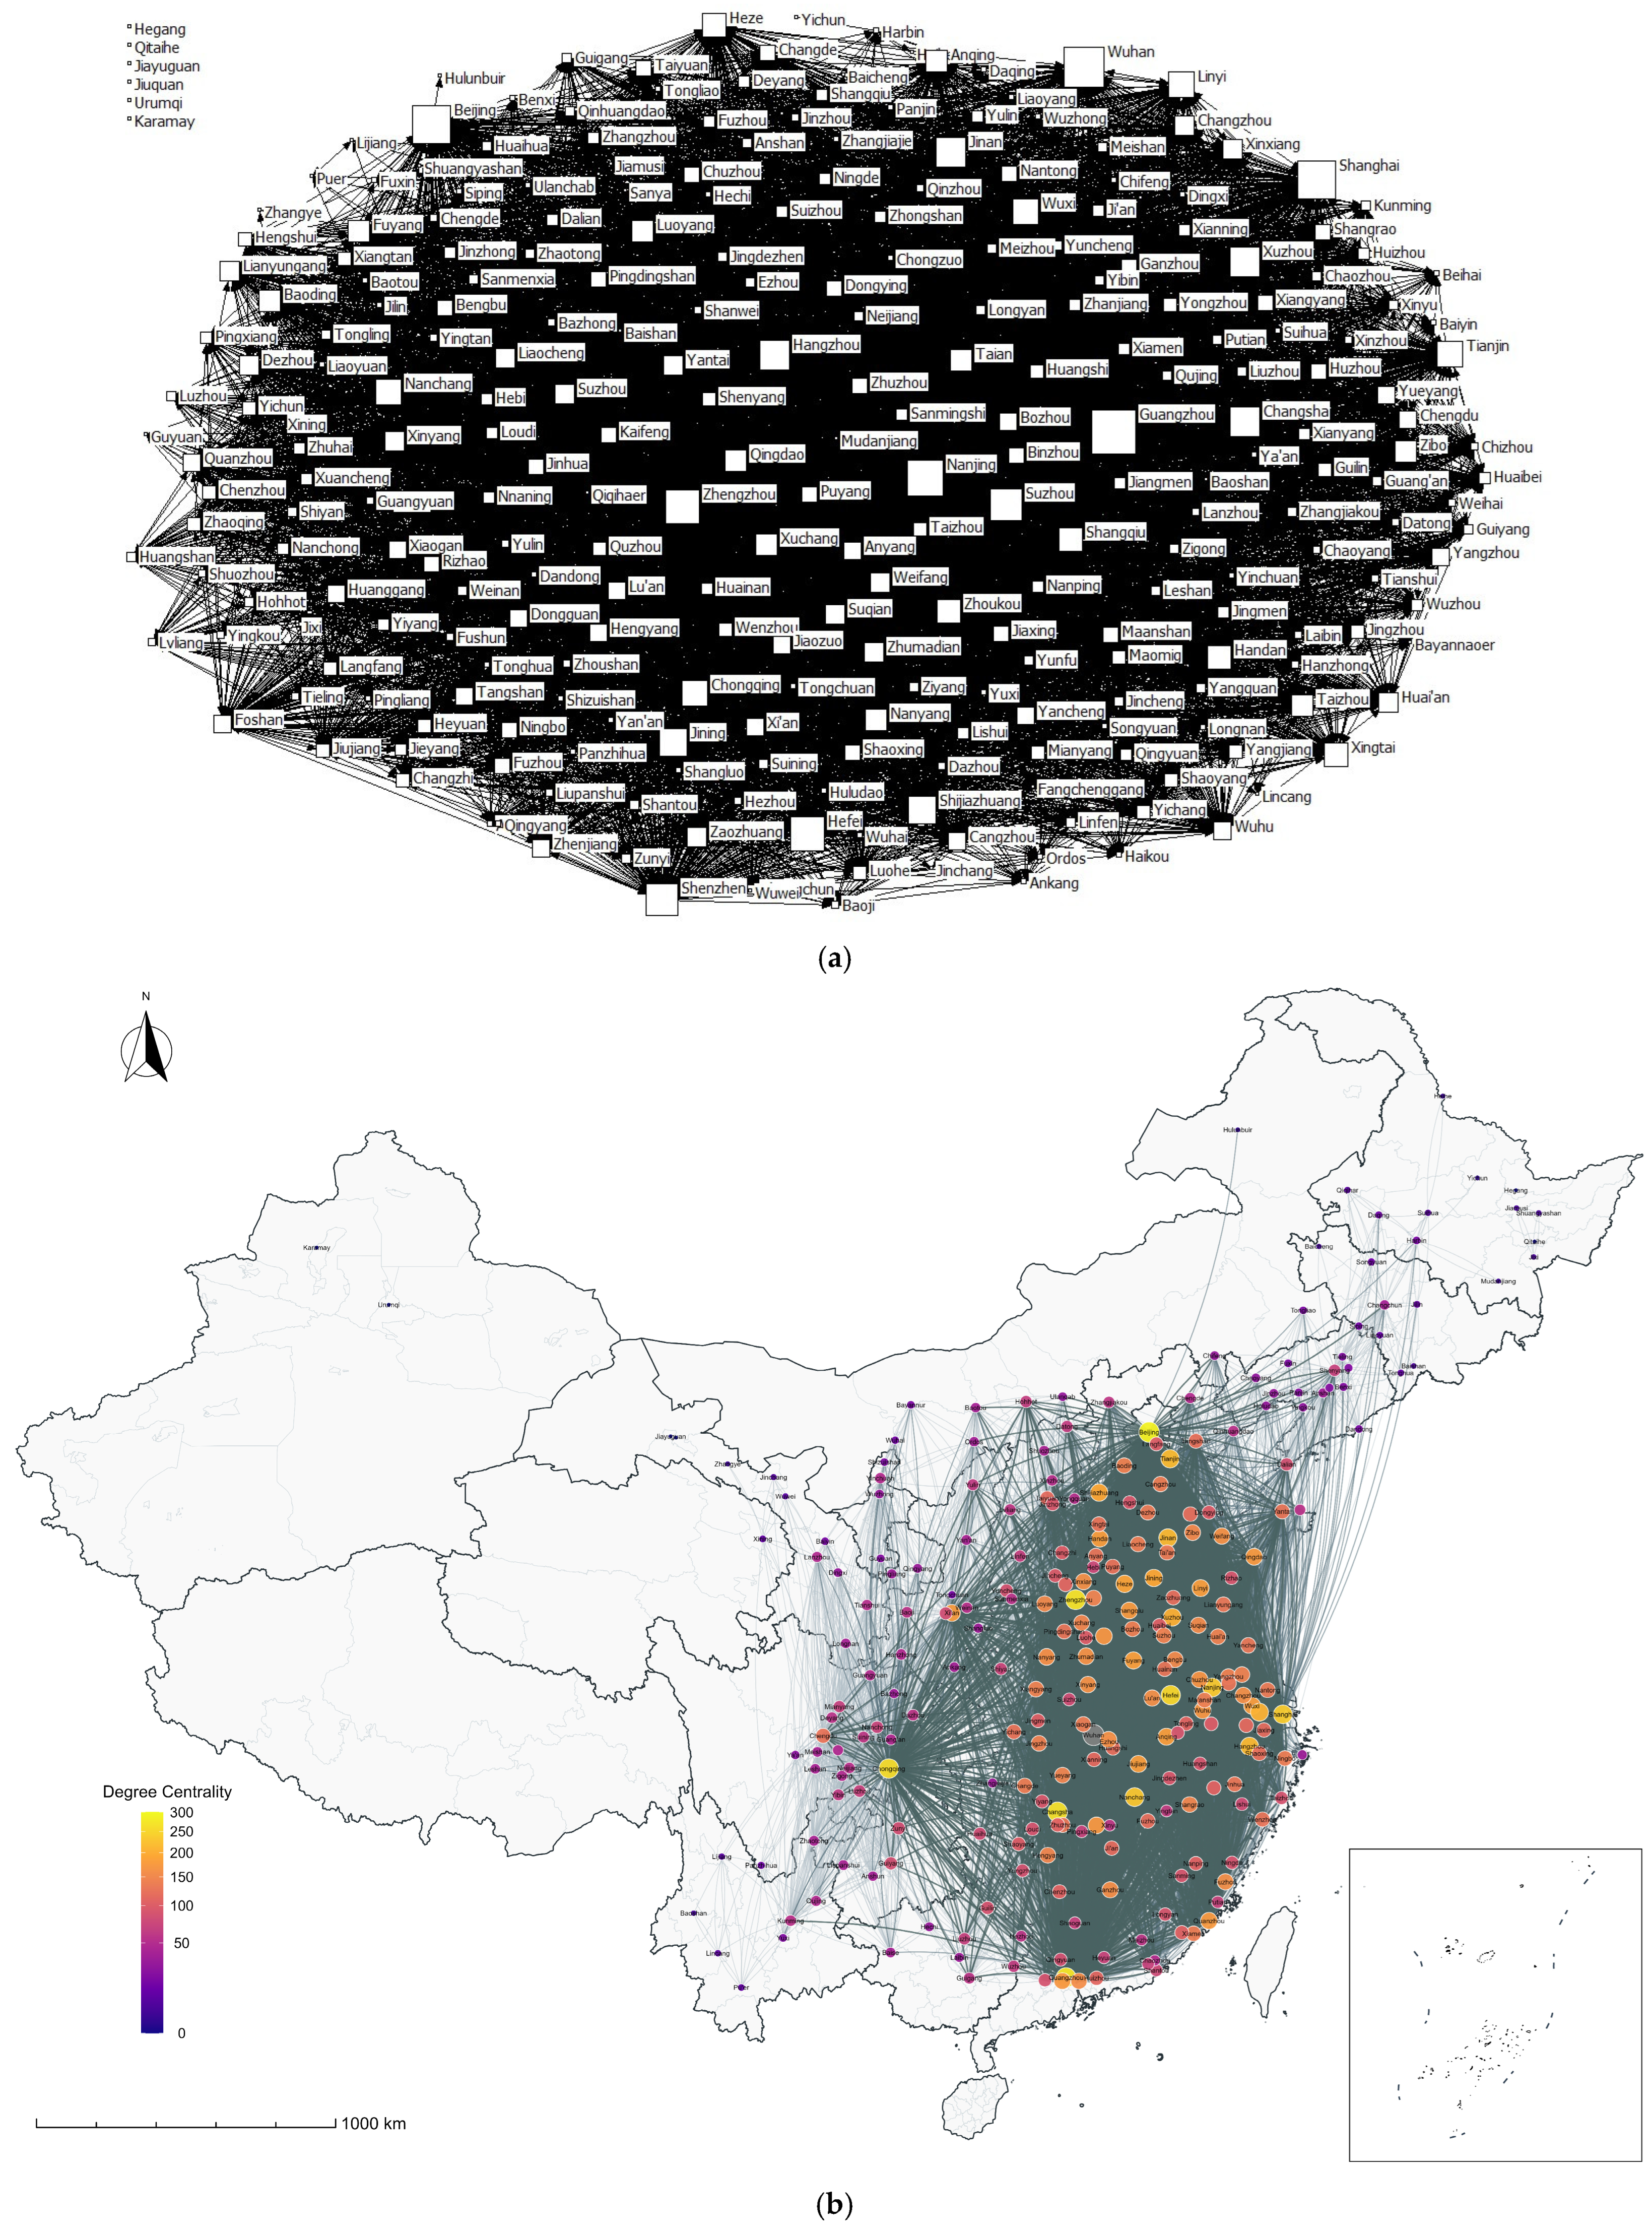
4.1.1. Topological Structure and Evolution
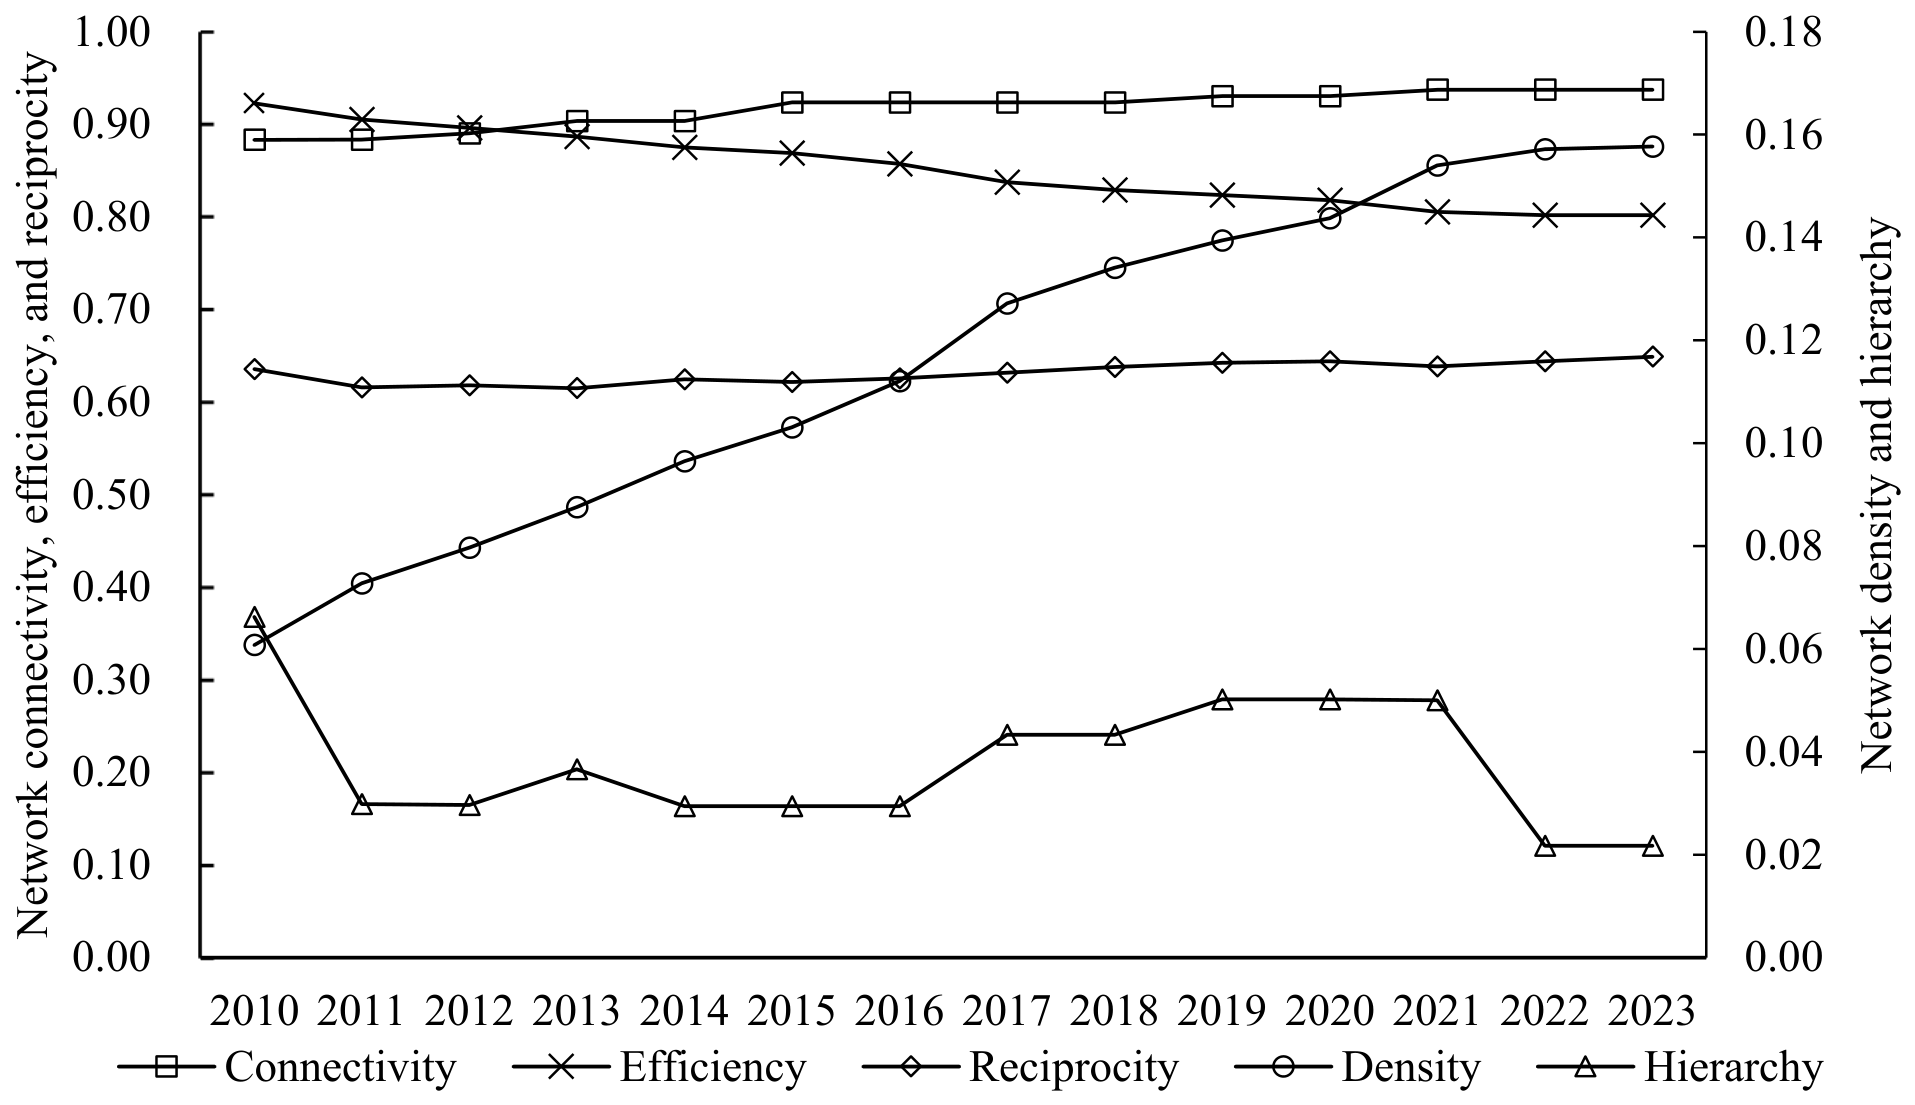
4.1.2. Overall Network Structure Characteristics
4.1.3. Centrality Analysis of Key Nodes
4.1.4. Group Clustering Characteristics
4.2. Dynamic Network Characteristic Measurement and Analysis
4.2.1. Measurement of Network Resilience Characteristics
4.2.2. Identification of Motif Type Characteristics
5. Discussion
6. Conclusions and Policy Implications
6.1. Main Conclusions
- (1)
- The NQPF spatial correlation network has evolved from an ultra-low-density type to a low-density type, with the number of isolated nodes dropping sharply and the number of cities participating in spatial interaction increasing significantly. Regarding the overall network properties, it presents a “three highs and one low” pattern, characterized by high correlation degree, high efficiency, and high reciprocity. This indicates that nodes enjoy good connectivity, efficient information transmission, and strong mutual accessibility. However, the extremely low network hierarchy index suggests that a distinct core–periphery structure has not yet formed within the network. Among the top 10 key nodes, the distribution pattern of “agglomeration in the east, increase in the central region, and initial emergence in the west” is prominent. Notably, Chongqing plays a prominent role as an intermediary connecting the urban agglomerations in the central-eastern and western regions.
- (2)
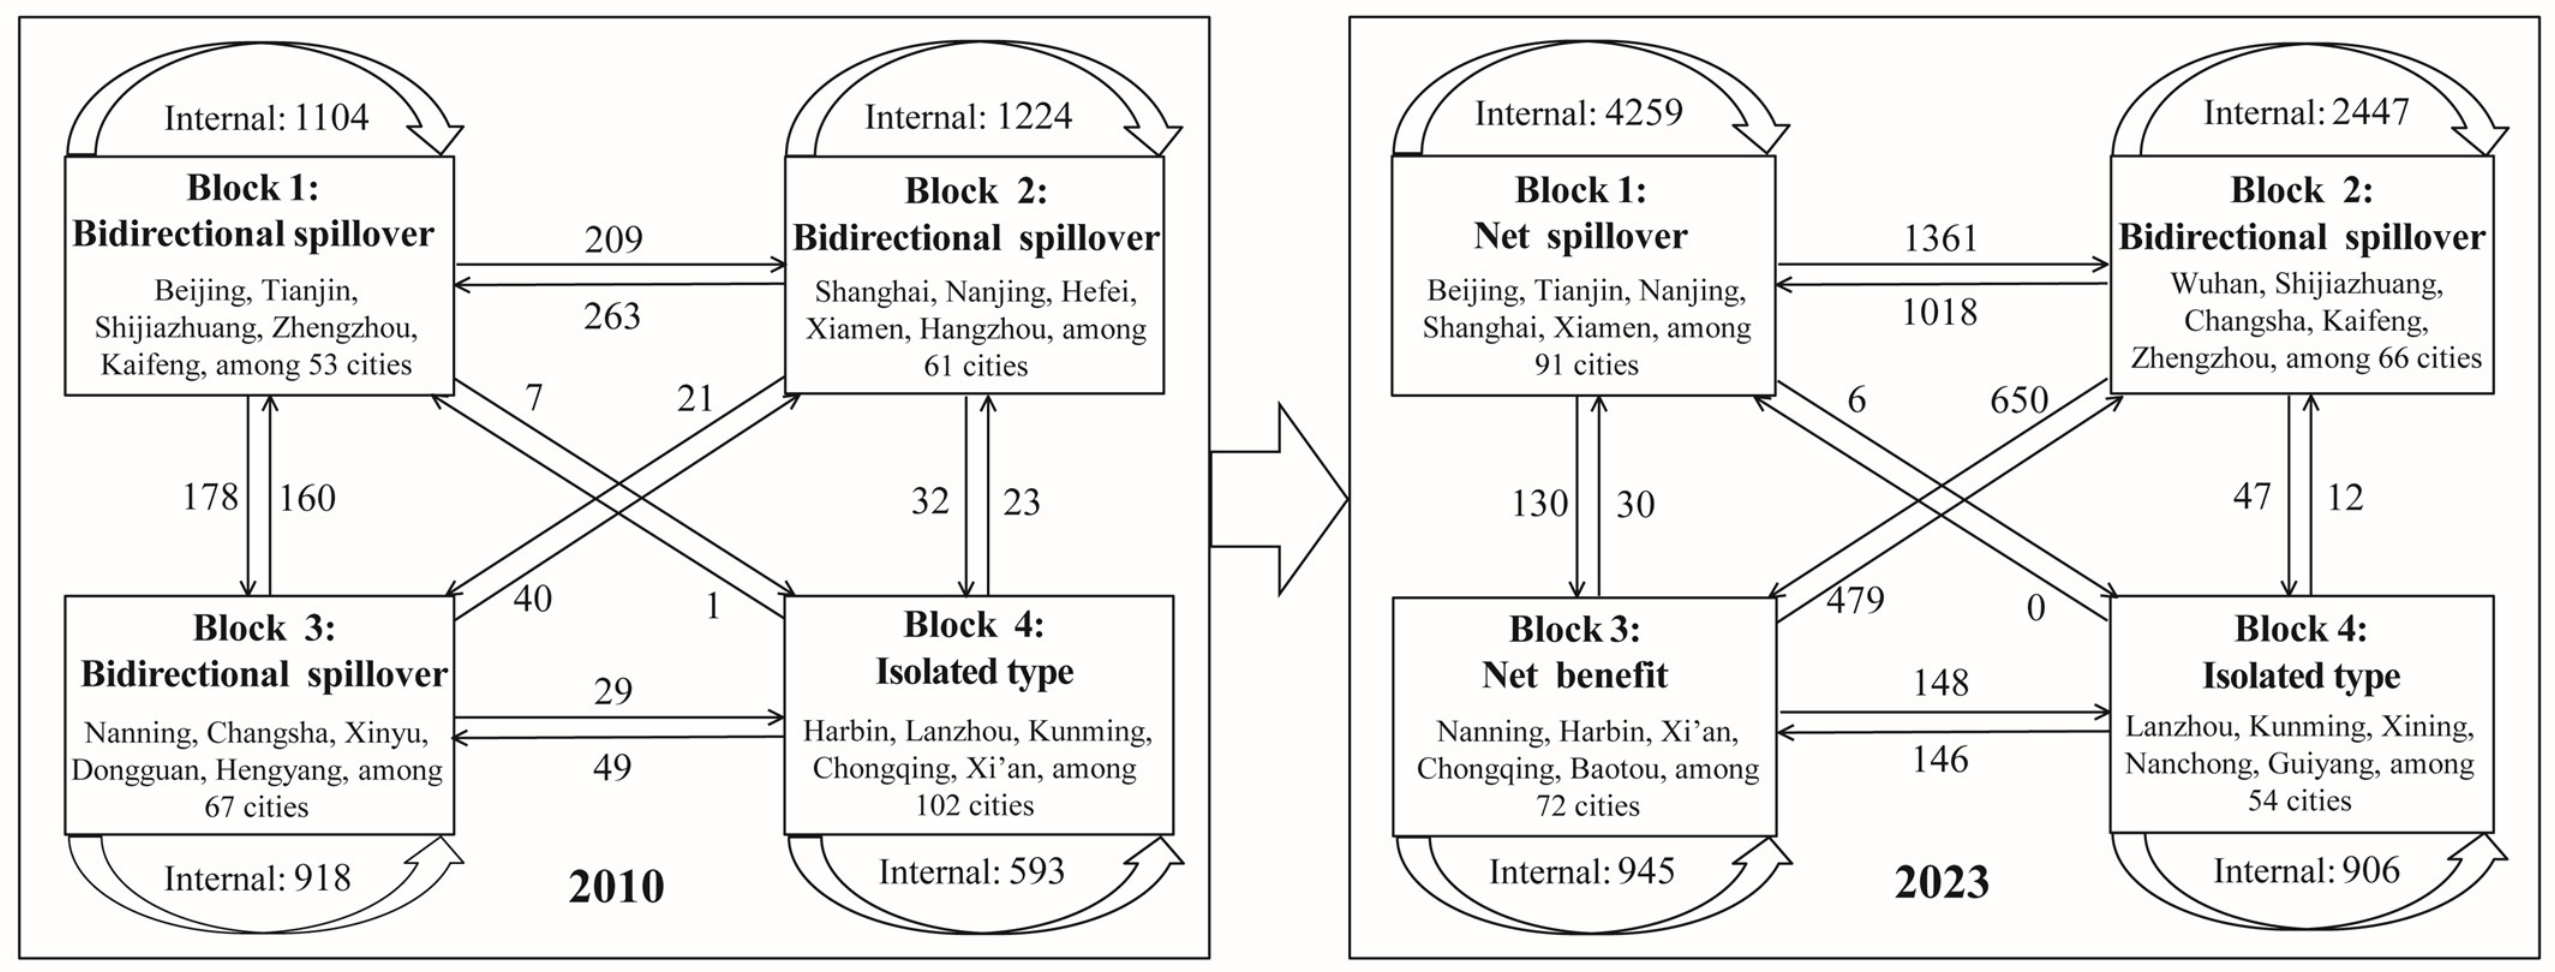
- According to the group clustering analysis results, as the members of the four major blocks undergo continuous adjustments, western cities show stronger model-estimated correlations with the central-eastern regional network. Meanwhile, in the evolution of interactive relationships among the four blocks, interactions between blocks have strengthened, particularly between Block 1 and Block 2, and between Block 2 and Block 3, highlighting the growing intermediary function of Block 2. In contrast, Block 4, dominated by western cities, remains an “isolated group”. While its internal members continue to decrease, its interactive relationships with the other three blocks need to be further strengthened.
- (3)
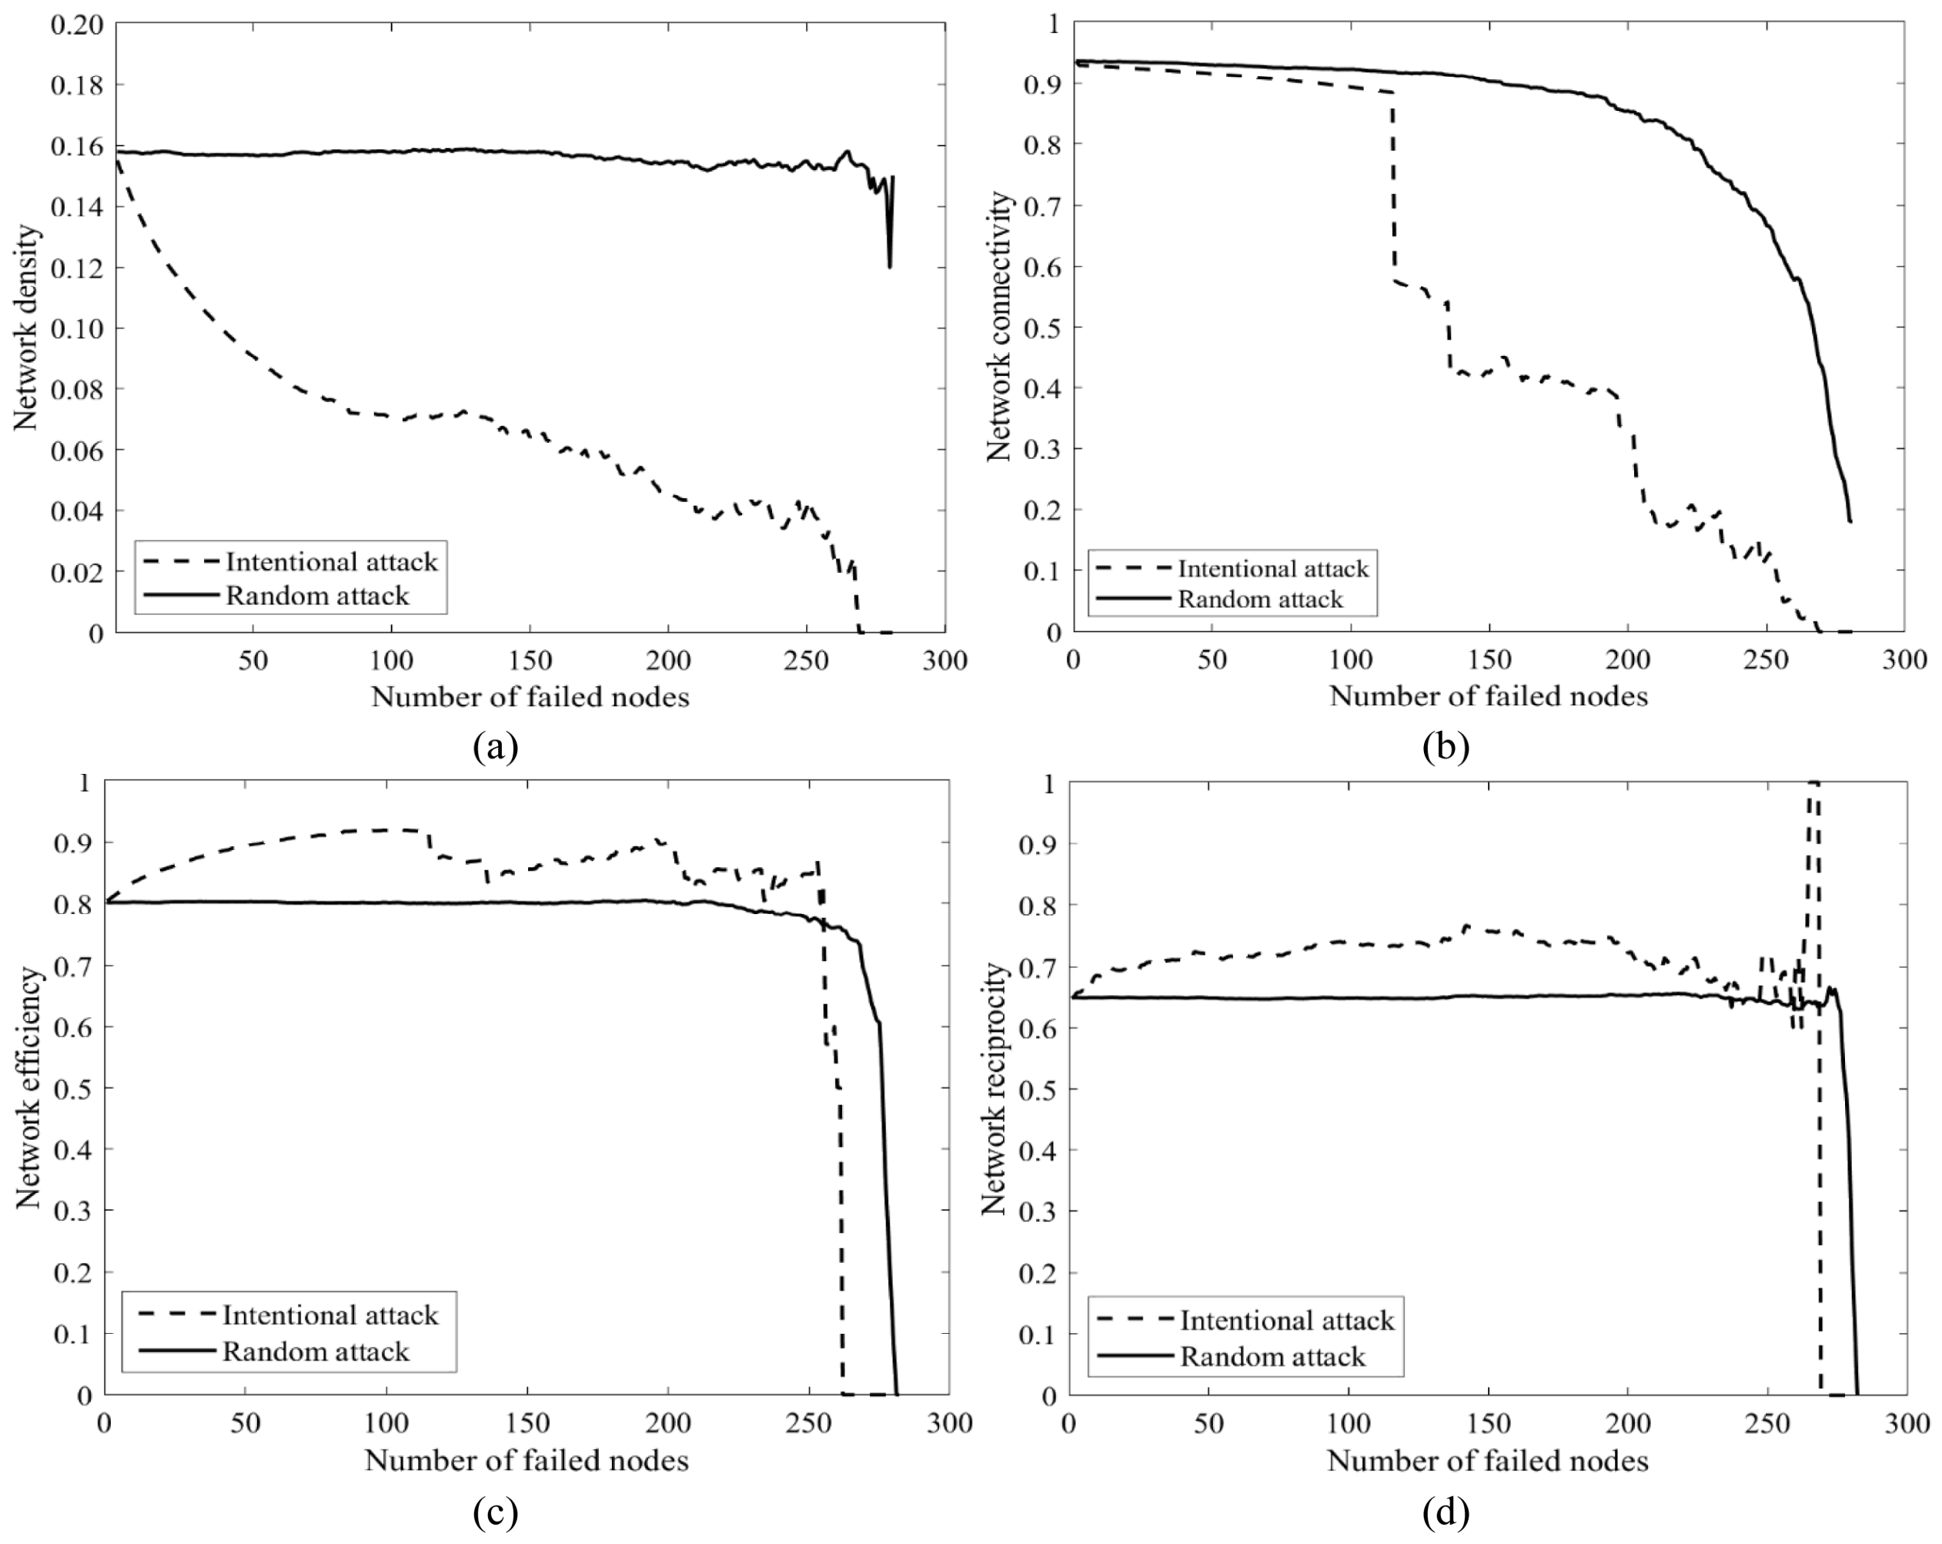
- Simulation results of network properties under node failure scenarios show that the network structure demonstrates stronger resilience under random attacks than under intentional attacks, meaning the network properties have better invulnerability in the context of random attacks. Meanwhile, significant differences exist in the performance of different network indicators. Under intentional attacks, network density and connectivity collapse rapidly, showing obvious “avalanche effects”, whereas network efficiency and reciprocity degree exhibit lagged responses. Under random attacks, all four indicators decline slowly and maintain good stability.
- (4)
- Micro-structural evolution has been shown to present significant differences in motif distribution. The dominant position of motifs with 0 or 1 edge (M1, M2) has been shown to weaken, and the role of structural holes dominated by the combination of “open + closed” types has been continuously enhanced. M1 and M2 are the dominant motif types constituting the network’s micro-structure, and their occurrence probabilities have decreased significantly. In particular, the substantial decline of M1 is mechanically consistent with the rise in overall network density and the transformation from “ultra-low density” to “low density”. However, their cumulative proportion still maintains a dominant position, which significantly restricts the improvement of network density and the formation of a “core-periphery” hierarchical structure. Meanwhile, among the other 13 motif types, the shift from a pattern dominated by open structural holes to one dominated by “open + closed” structural holes is also an important factor driving network evolution.
6.2. Policy Implications
- (1)
- Optimize Core Node Distribution and Enhance Overall Network Connectivity. Network density increased from 0.0608 to 0.1577, while hierarchy was only 0.0217 in 2023, indicating a flattened network structure with strengthening inter-city correlations. Policy should therefore shift from creating a single core to strengthening redundancy and coordination among high-centrality cities. Specifically, cross-regional collaborative development platforms should be established, unified NQPF development plans and standard systems formulated, and inter-city cooperation in technological innovation and industrial upgrading enhanced. Contingency coordination mechanisms among high-centrality cities should be strengthened, and alternative inter-city links developed to reduce reliance on any single core node. Given the outward-oriented estimated correlations of several eastern and central cities, the eastern region should focus on cutting-edge innovation and industrial upgrading, while strengthening technical and talent exchanges with central and western regions. Rising central cities should consolidate their industrial foundations and innovation capabilities to build regional NQPF growth poles. For Chongqing—a western city that has achieved a breakthrough by joining the core node cluster—policy support and resource investment should be increased to support its balanced connector role, and more core nodes should be cultivated.
- (2)
- Implement Differentiated Policies to Optimize Inter-Block Correlation Patterns. Block analysis shows that Block 1 expanded from 53 to 91 cities while Block 4 contracted from 102 to 54 between 2010 and 2023, indicating that western cities are gradually participating in the national NQPF spatial correlation structure. According to the 2023 estimated network data, Block 1 sent 1497 external ties and received 1048, exhibiting a pronounced outward-oriented pattern. Policy should therefore prioritize supporting original innovation and key technological breakthroughs in Block 1, while encouraging technology and talent outflows to other blocks. Block 2 showed a near balance of 1852 outgoing and 1715 incoming ties, indicating a bidirectional interaction pattern. Policy should strengthen its transportation hub and logistics center development, improve industrial supporting systems, and fully leverage its structural bridging role between Block 1 and Block 3. Block 3 received 926 and sent 657 ties, with a clear net-receiving pattern indicating that it is in a phase of absorbing external correlations. Policy should formulate tailored industrial support measures and improve conditions for undertaking industrial transfers to enhance its capacity to absorb and transform inflowing resources. Block 4 maintained over 85% of its ties internally, with severe external connection deficits. Policy should establish special coordination mechanisms, increase infrastructure connectivity investment with eastern and central regions, and explore interest-sharing cooperation models to progressively break its structural isolation.
- (3)
- Enhance Network Structural Resilience and Prevent Systemic Risks. The study indicates that the failure of core nodes under intentional attacks may trigger “avalanche effects”, whereas a multi-center structure demonstrates stronger robustness due to redundant connections under random attacks. Therefore, it is essential to construct a dual resilience mechanism featuring “core node protection plus distributed redundancy”. First, integrate core node protection with the development of multi-center collaborative networks. While emphasizing core node development, strengthen the construction of multi-center networks to improve overall network stability and reduce the risk of cascading collapse caused by core node failure. For example, cultivate multiple competitive industrial clusters within key sectors to form a mutually supportive network structure. Second, enhance redundant connections within the network. Encourage cities to establish more cooperative ties and increase network redundancy. Strengthen the network’s buffering capacity by promoting additional cooperation projects and co-constructing shared facilities. This will enable the network to maintain effective information transmission and reciprocity in the face of random shocks, preserving its basic functions and structural stability. Third, establish risk early warning and emergency response mechanisms. Develop a risk monitoring system for the urban NQPF network to track its operational status in real time. Formulate contingency plans detailing response measures for different risk scenarios. This will improve the network’s risk resistance and recovery capabilities, mitigate damage from intentional attacks, and ensure the stable development of urban NQPF.
- (4)
- Promote Upgrading of Micro-Level Correlation Patterns and Facilitate Multi-City Synergistic Interactions. Motif analysis shows that M1 and M2 motifs still accounted for 90.14% of total triads in 2023, while fully connected M15 accounted for only 1.42%, indicating considerable potential for improving the intensity of spatial interactions at the micro level, and that fully bidirectional multi-city correlation patterns have not yet been established. Policy should selectively support verifiable multi-city correlation patterns rather than pursue an undifferentiated increase in tie counts. On one hand, through multiple measures such as fiscal subsidies, tax reductions, and prioritized project approvals, cross-regional collaboration initiatives encompassing industry-university partnerships, research-education linkages, and industry-university-research integration should be actively promoted to reduce isolated nodes and unidirectional links, creating conditions for bidirectional and multi-dimensional interactive relationships. On the other hand, institutional and infrastructure mechanisms for the cross-regional flow of NQPF factors should be improved, with particular emphasis on constructing spatial circulation channels between western cities and eastern-central cities. By fully leveraging opportunities presented by 5G network construction and big data center development, western cities should be provided with greater access to high-quality factor resources, facilitating the transition of micro-level correlation patterns from isolation and unidirectionality toward bidirectional and multilateral synergy.
Author Contributions
Funding
Institutional Review Board Statement
Informed Consent Statement
Data Availability Statement
Acknowledgments
Conflicts of Interest
References
- Fan, C.; Zheng, Q. The new qualitative forms of new quality productive forces and its development strategy. Econ. Theory Bus. Manag. 2024, 44, 1–14. [Google Scholar] [CrossRef] [Scilit]
- Feng, G.; Lv, J. The intrinsic mechanism and legal approach to the innovative allocation of production factors. Wuhan Univ. J. (Philos. Soc. Sci.) 2025, 78, 16–27. [Google Scholar]
- Ma, R.; Wang, H.; Yan, Z. New quality productivity: Profound connotation, formation background and implementation path. J. Beijing Jiaotong Univ. (Soc. Sci. Ed.) 2025, 24, 10–17. [Google Scholar]
- Fan, J.; Chen, D.; Li, J.; Guo, R.; Chen, Z. Regional characteristics and layout laws of new quality productive forces: A study on developing new quality productive forces according to local conditions from a geographical perspective. Geogr. Sci. 2025, 45, 47–60. [Google Scholar]
- Chen, S.; Cui, C.; Dong, J.; Qu, A.; Shao, C. Implementation of the sustainable development goals in urban agglomeration: Progress and synergies. Environ. Impact Assess. Rev. 2026, 116, 108102. [Google Scholar] [CrossRef] [Scilit]
- Tao, F.; Zhang, H.; Hu, J.; Xia, X.H. Dynamics of green productivity growth for major Chinese urban agglomerations. Appl. Energy 2017, 196, 170–179. [Google Scholar] [CrossRef] [Scilit]
- Sun, J.; Zhang, Z.; Yin, S. Characteristics and strategic choices of regional economic development towards Chinese modernization. J. Beijing Adm. Inst. 2025, 1, 1–11. [Google Scholar]
- Huang, Q.; Sheng, F. New productive forces system: Factor characteristics, structural bearing and functional orientation. Reform 2024, 2, 15–24. [Google Scholar]
- Xu, X.; Li, S.; Li, T. Data factor empowers the formation of new quality productive forces: Logic, mechanisms, and pathways. Comp. Econ. Soc. Syst. 2024, 6, 41–50. [Google Scholar]
- Xi, S.; Yan, K.; Zhang, B.; Li, Y.; Guan, C. Revitalizing oil-gas resource-based cities: Unveiling spatial heterogeneity and life cycle dynamics of sustainable development capacity. Habitat Int. 2026, 167, 103649. [Google Scholar] [CrossRef] [Scilit]
- Ye, Q.; Zhang, X.; Zeng, G.; Cao, Z.; Zhou, S. The spatial distribution and synergistic effect of different innovation activities in Chinese cities: An analysis based on technology, design, and market activities. Appl. Geogr. 2025, 176, 103527. [Google Scholar] [CrossRef] [Scilit]
- Deng, W.; Li, S.; Wei, G.; Bai, L.; Liu, Y. Analyzing industry ecological sustainability from the perspective of spatial association network: A case study of the urban agglomeration in the middle reaches of the Yangtze River. Ecol. Indic. 2025, 170, 113071. [Google Scholar] [CrossRef] [Scilit]
- Gao, F. The logic, multidimensional connotation and current significance of “new quality productivity”. China Rev. Political Econ. 2023, 14, 127–145. [Google Scholar]
- Gu, H. New characteristics and new requirements of new high-quality productivity force during Chinese path to modernization system integration. Contemp. World Social. 2024, 5, 25–34. [Google Scholar]
- Xie, F.; Jiang, N.; Kuang, X. Marx’s theory on productive forces and the development of new quality productive forces. J. Renmin Univ. China 2024, 38, 1–13. [Google Scholar]
- Bai, Y.; Yan, X.; Wang, Z. New quality productivity empowers the construction of modern industrial system: A study based on the perspective of factor composition. China Soft Sci. 2024, 12, 21–34. [Google Scholar]
- Zhong, Y.; Lai, H.; Zhang, L.; Guo, L.; Lai, X. Does public data openness accelerate new quality productive forces? Evidence from China. Econ. Anal. Policy 2025, 85, 1409–1427. [Google Scholar] [CrossRef] [Scilit]
- Ji, X.; Zhang, Z.; Li, Z.; Zhang, Y. Spatiotemporal evolution characteristics and driving factors of the spatial correlation network structure of China’s new quality productive forces. Resour. Sci. 2025, 47, 373–388. [Google Scholar] [CrossRef] [Scilit]
- Wang, F.; Tu, X.; Yang, Z.; Tian, Z.; Yin, Q. Spatial and temporal characteristics and differentiation mechanisms of new quality productive forces development in China. Environ. Sustain. Indic. 2025, 27, 100645. [Google Scholar] [CrossRef] [Scilit]
- Shi, Y.; Wang, X.; Zhang, T. Dynamic evolution and trend forecasting of new quality productive forces development levels in Chinese urban agglomerations. Sustainability 2025, 17, 1559. [Google Scholar] [CrossRef] [Scilit]
- Mi, G.; Zhang, M.; Dai, P. The spatial correlation characteristics and ecological environment improvement effects of the development level of new quality productivity in the Yangtze River delta urban agglomeration. J. Financ. Econ. Theory 2026, 1, 85–98. [Google Scholar]
- Huang, J.; Lu, H.; Liu, H. Spatial correlation network structure characteristics and influencing factors of new quality productive forces in China. Areal Res. Dev. 2025, 44, 1–7. [Google Scholar]
- Ran, P.; Jin, X.; Frazier, A.E.; Yu, D.; Xia, C.; Hu, Z.; Hu, H. From local to national networks: Evolution and drivers of interprovincial linkages of construction land use efficiency in China. Environ. Impact Assess. Rev. 2026, 117, 108177. [Google Scholar] [CrossRef] [Scilit]
- Dey, A.K.; Gel, Y.R.; Poor, H.V. What network motifs tell us about resilience and reliability of complex networks. Proc. Natl. Acad. Sci. USA 2019, 116, 19368–19373. [Google Scholar] [CrossRef] [Scilit] [PubMed]
- McDonnell, M.D.; Yaveroğlu, Ö.N.; Schmerl, B.A.; Iannella, N.; Ward, L.M. Motif-role-fingerprints: The building-blocks of motifs, clustering-coefficients and transitivities in directed networks. PLoS ONE 2014, 9, e114503. [Google Scholar] [CrossRef] [Scilit] [PubMed]
- Ma, N.; Li, H.; Wang, Y.; Feng, S.; Shi, J.; Wang, K. Interaction pattern features and driving forces of intersectoral CO2 emissions in China: A network motif analysis. Resour. Conserv. Recycl. 2019, 149, 391–412. [Google Scholar] [CrossRef] [Scilit]
- Si, R.; Jia, P.; Li, H.; Zhao, X. Assessing the structural resilience of the global crude oil maritime transportation network: A motif-based approach from network to ports. J. Transp. Geogr. 2025, 123, 104123. [Google Scholar] [CrossRef] [Scilit]
- Chin, T.; Li, Z.; Huang, L.; Li, X. How artificial intelligence promotes new quality productive forces of firms: A dynamic capability view. Technol. Forecast. Soc. Change 2025, 216, 124128. [Google Scholar] [CrossRef] [Scilit]
- Zhang, X.; Ma, Y. The Necessity, scientificity and focus of developing new quality productive forces in accordance with local conditions. J. Beijing Univ. Technol. (Soc. Sci. Ed.) 2024, 24, 118–130. [Google Scholar]
- Zhang, J.; Shan, Y.; Jiang, S.; Xin, B.; Miao, Y.; Zhang, Y. Study on the coordinated development degree of new quality productivity and manufacturing carbon emission efficiency in provincial regions of China. Environ. Dev. Sustain. 2024, 28, 8601–8635. [Google Scholar] [CrossRef] [Scilit]
- Wang, J.; Wang, R. New quality productivity: Index construction and spatiotemporal evolution. J. Xi’an Univ. Financ. Econ. 2024, 37, 31–47. [Google Scholar]
- Dong, X.; Jiang, G.; Qu, Y.; Yang, Y. Connect and grow: Spatial correlation network and risk regulation pattern of rural settlement health. Land Use Policy 2026, 162, 107906. [Google Scholar] [CrossRef] [Scilit]
- Li, X.; Qiu, Y.; Lin, C. Spatial network structure characteristics and dynamic evolution mechanisms of carbon emissions in the construction industry: An empirical study of East China coastal cities. Sustain. Cities Soc. 2025, 130, 106625. [Google Scholar] [CrossRef] [Scilit]
- Liu, H.; Zhang, Y.; Sun, Y. The spatial network structure of China’s regional development and its transmission lags based on development and life index (DLI). Chin. J. Popul. Sci. 2015, 4, 60–71+127. [Google Scholar]
- Liu, J. Lectures on Whole Network Approach: A Practical Guide to UCINET, 2nd ed.; Truth & Wisdom Press: Shanghai, China; Shanghai People’s Publishing House: Shanghai, China, 2014. [Google Scholar]
- Li, S.; Chen, Y.; Hou, C.; Peng, W. Resilience assessment and optimization of ecological networks under multi-scenario disturbances: A 40-year analysis in Northwest China’s agro-pastoral transition zone. J. Clean. Prod. 2026, 538, 147323. [Google Scholar] [CrossRef] [Scilit]
- Wu, G.; Liu, X.; Pu, Y.; Feng, L. Global iron ore trade network resilience assessment and shock response patterns of critical economies. Resour. Policy 2025, 108, 105675. [Google Scholar] [CrossRef] [Scilit]
- Burt, R.S. Structural Holes: The Social Structure of Competition; Harvard University Press: Cambridge, MA, USA, 1992. [Google Scholar]
- Milo, R.; Shen-Orr, S.; Itzkovitz, S.; Kashtan, N.; Chklovskii, D.; Alon, U. Network motifs: Simple building blocks of complex networks. Science 2002, 298, 824–827. [Google Scholar] [CrossRef] [Scilit] [PubMed]
- Wang, Y.; Wang, C.; Wang, W.; Sun, X. Formation of structural holes in R&D context: The effect of inventors’ knowledge abilities and patenting output. J. Knowl. Manag. 2024, 29, 752–788. [Google Scholar] [CrossRef] [Scilit]
- Zhang, Y.; Tian, H.; Man, L. Knowledge broker from the perspective of structural hole: Theoretical framework, internal tensions and relief paths. China Soft Sci. 2025, 1, 147–156. [Google Scholar]
- Benson, A.R.; Gleich, D.F.; Leskovec, J. Higher-order organization of complex networks. Science 2016, 353, 163–166. [Google Scholar] [CrossRef] [Scilit] [PubMed]
- Cao, H.; Li, Y.; Qiu, W. Research on stock asset pricing based on investor interaction network motif. Manag. Rev. 2024, 36, 3–16. [Google Scholar]
- Jia, C.; Han, H.; Wan, Y.; Lv, Y. Network destruction resistance based on network motif feature. Complex Syst. Complex. Sci. 2017, 14, 43–50. [Google Scholar]
- Liu, Q.; Chen, R.; Gao, Q.; Yue, W. Improving sustainable development performance of new energy industry through green innovation network evolution empowered by digitalization: Based on temporal exponential random graph model. Energy Convers. Manag. 2025, 324, 119253. [Google Scholar] [CrossRef] [Scilit]
- Li, F.; Liu, J.; Jiang, L. Spatiotemporal change of strategic emerging industries in northeast China and influencing factors. Prog. Geogr. 2022, 41, 541–553. [Google Scholar] [CrossRef] [Scilit]
- Shao, S.; Ge, L.; Zhu, J. How to achieve the harmony between humanity and nature: Environmental regulation and environmental welfare performance from the perspective of geographical factors. J. Manag. World 2024, 40, 119–146. [Google Scholar]
- Zhao, T.; Zhang, Z.; Liang, S. Digital economy, entrepreneurship and high-quality economic development: Empirical evidence from urban China. J. Manag. World 2020, 36, 65–76. [Google Scholar]
- Huang, Q.; Yu, Y.; Zhang, S. Internet development and productivity growth in manufacturing industry: Internal mechanism and China experiences. China Ind. Econ. 2019, 8, 5–23. [Google Scholar]
- Guo, F.; Wang, J.; Wang, F.; Sun, T.; Zhang, X.; Cheng, Z. Measuring China’s digital financial inclusion: Index compilation and spatial characteristics. China Econ. Q. 2020, 19, 1401–1418. [Google Scholar]
- Wasserman, S.; Faust, K. Social Network Analysis: Methods and Applications; Cambridge University Press: Cambridge, UK, 1994. [Google Scholar]
- Wang, T.; Zhou, Y.; Wang, G.; Liu, B. Development level and spatial association characteristics of energy-related new quality productive forces. China Popul. Resour. Environ. 2026, 36, 103–116. [Google Scholar]
- Han, J.; Zhang, F.; Huang, L.X.R. Measurement of new quality productive forces, spatial spillover effects, and internal and external driving mechanisms. Stat. Res. 2026, 43, 67–79. [Google Scholar]
- Xu, Q.; Dong, Y.; Zhong, M. Analysis of spatial correlation network of urban digital economy in China. Inf. Technol. Dev. 2025, 31, 837–859. [Google Scholar] [CrossRef] [Scilit]
- Yang, W.; Yan, M.; Wang, X.; Shi, J. Study on the Spatial Association Network Structure of Urban Digital Economy and Its Driving Factors in Chinese Cities. Systems 2025, 13, 322. [Google Scholar] [CrossRef] [Scilit]
- Li, Y.; Sun, K.; Ma, H. Review and Prospects of Research on Chinese Urban Innovation Network. Econ. Geogr. 2024, 44, 67–78. [Google Scholar]
- Liu, J.; Zhu, T. Resilience and Vulnerability to Sustainable Urban Innovation: A Comparative Analysis of Knowledge and Technology Networks in China. Sustainability 2026, 18, 317. [Google Scholar] [CrossRef] [Scilit]
- Chen, H.; Chen, P.; Zeng, G. Networking Characteristics and Innovation Effects of Complementary Technological Cooperation Among Chinese Cities. Growth Change 2025, 56, e70071. [Google Scholar] [CrossRef] [Scilit]



| Study | Spatial Scope | Primary Focus | Distinction of the Present Study |
|---|---|---|---|
| Ji et al. [18] | Chinese provinces | Network evolution and determinants | National city sample with node-removal robustness and motif analyses |
| Mi et al. [21] | Yangtze River Delta cities | Network structure and environmental effects | National scope with node-removal robustness and motif analyses |
| Huang et al. [22] | Chinese provinces | Network structure and determinants | City-level sample with node-removal robustness and motif analyses |
| This study | 283 Chinese cities, 2010–2023 | Topology, centrality, blocks, robustness, and motifs | National city-level integration of these established tools |
| New-Quality Elements | First-Level Indicators | Specific Indicators and Calculation Formulas | Direction | Weight |
|---|---|---|---|---|
| New-Quality Laborers | Talent Quality | Number of College Students Enrolled/Total Population | + | 4.292% |
| Average Years of Education | + | 0.953% | ||
| Income Level | Per Capita Gross Regional Product | + | 4.328% | |
| Average Wage of Employees | + | 2.411% | ||
| Employment Concept | Proportion of Employees in the Tertiary Industry | + | 1.609% | |
| Entrepreneurial Activity | + | 0.677% | ||
| New-Quality Objects of Labor | Emerging Strategic Industries | Number of Enterprises in Emerging Strategic Industries | + | 39.313% |
| Future Industries | Robot Installation Density | + | 6.207% | |
| Green Environmental Protection | Green Coverage Area/Total Area | + | 12.252% | |
| Environmental Regulation Intensity | + | 1.125% | ||
| Pollution Reduction | Industrial Wastewater Discharge | − | 0.081% | |
| Industrial Sulfur Dioxide Emission | − | 0.082% | ||
| Industrial Smoke and Dust Emission | − | 0.009% | ||
| Comprehensive Utilization Rate of Industrial Solid Waste | + | 0.036% | ||
| Harmless Treatment Rate of Domestic Garbage | + | 0.035% | ||
| New-Quality Means of Labor | Infrastructure | Highway Mileage | + | 0.191% |
| Proportion of Word Frequency of Digital Infrastructure in Government Work Reports | + | 0.078% | ||
| Energy Consumption | Total Energy Consumption | − | 0.350% | |
| Clean Energy Consumption | + | 0.474% | ||
| Scientific and Technological Innovation | Number of Authorized Patents/Total Population | + | 20.445% | |
| Science and Technology Expenditure/Fiscal Expenditure | + | 2.977% | ||
| Digitalization Level | Digital Economy Index | + | 2.075% |
| Network Property Indicators | Specific Calculation Formulas | Symbol Meanings |
|---|---|---|
| Network Density | L denotes the number of actually existing relationships in the network; N denotes the node scale | |
| Network Connectivity | V denotes the number of unreachable node pairs; N denotes the node scale | |
| Network Efficiency | M denotes the actual number of redundancies; Mmax denotes the maximum possible number of redundancies | |
| Network Reciprocity | Lb denotes the number of directed ties from i to j for which the reverse tie from j to i also exists; L denotes the total number of directed ties. | |
| Network Hierarchy | S denotes the number of symmetric reachable node pairs; Smax denotes the maximum scale | |
| Node Out-Degree | i and j denote cities; Aij is the binary directed tie from i to j. | |
| Node In-Degree | i and j denote cities; Aji is the binary directed tie from j to i. | |
| Node Degree Centrality | OutDegi and InDegi denote the out-degree and in-degree of city i, respectively. |
| Top 10 Cities | 2010 | Top 10 Cities | 2023 | ||||||
|---|---|---|---|---|---|---|---|---|---|
| Degree Centrality | Out- Degree | In- Degree | Role | Degree Centrality | Out- Degree | In- Degree | Role | ||
| Wuhan | 135 | 79 | 56 | Exporter | Wuhan | 309 | 181 | 128 | Exporter |
| Beijing | 121 | 78 | 43 | Exporter | Beijing | 288 | 190 | 98 | Exporter |
| Nanjing | 120 | 74 | 46 | Exporter | Guangzhou | 271 | 190 | 81 | Exporter |
| Guangzhou | 117 | 94 | 23 | Exporter | Zhengzhou | 268 | 161 | 107 | Exporter |
| Shanghai | 112 | 80 | 32 | Exporter | Changsha | 264 | 172 | 92 | Exporter |
| Hefei | 111 | 67 | 44 | Exporter | Chongqing | 259 | 135 | 124 | Broker |
| Zhengzhou | 108 | 67 | 41 | Exporter | Hefei | 252 | 154 | 98 | Exporter |
| Hangzhou | 104 | 61 | 43 | Exporter | Shenzhen | 247 | 196 | 51 | Exporter |
| Xuzhou | 103 | 47 | 56 | Broker | Shanghai | 236 | 178 | 58 | Exporter |
| Jining | 100 | 49 | 51 | Broker | Nanjing | 234 | 154 | 80 | Exporter |
| Year | Block | Density Matrix | Image Matrix | ||||||
|---|---|---|---|---|---|---|---|---|---|
| Block 1 | Block 2 | Block 3 | Block 4 | Block 1 | Block 2 | Block 3 | Block 4 | ||
| 2010 | Block 1 | 0.4006 | 0.0646 | 0.0501 | 0.0013 | 1 | 1 | 0 | 0 |
| Block 2 | 0.0813 | 0.3344 | 0.0051 | 0.0051 | 1 | 1 | 0 | 0 | |
| Block 3 | 0.0451 | 0.0098 | 0.2076 | 0.0042 | 0 | 0 | 1 | 0 | |
| Block 4 | 0.0002 | 0.0037 | 0.0072 | 0.0576 | 0 | 0 | 0 | 0 | |
| 2023 | Block 1 | 0.5200 | 0.2266 | 0.0198 | 0.0012 | 1 | 1 | 0 | 0 |
| Block 2 | 0.1695 | 0.5704 | 0.1368 | 0.0132 | 1 | 1 | 1 | 0 | |
| Block 3 | 0.0046 | 0.1008 | 0.1849 | 0.0381 | 0 | 1 | 1 | 0 | |
| Block 4 | 0.0000 | 0.0034 | 0.0376 | 0.3166 | 0 | 0 | 0 | 1 | |
| Order Number | Schematic Drawing | 2010 | 2023 | ||
|---|---|---|---|---|---|
| Frequency | Probability (%) | Frequency | Probability (%) | ||
| M1 |  | 2,982,456 | 79.80 | 2,085,961 | 55.81 |
| M2 |  | 689,677 | 18.45 | 1,283,137 | 34.33 |
| M3 |  | 1498 | 0.04 | 3873 | 0.10 |
| M4 |  | 1357 | 0.04 | 5043 | 0.13 |
| M5 |  | 8449 | 0.23 | 42,468 | 1.14 |
| M6 |  | 686 | 0.02 | 4325 | 0.12 |
| M7 |  | 17,009 | 0.46 | 92,317 | 2.47 |
| M8 |  | 0 | 0.00 | 0 | 0.00 |
| M9 |  | 7305 | 0.20 | 30,249 | 0.81 |
| M10 |  | 2515 | 0.07 | 18,559 | 0.50 |
| M11 |  | 375 | 0.01 | 1978 | 0.05 |
| M12 |  | 11,056 | 0.30 | 61,614 | 1.65 |
| M13 |  | 1699 | 0.05 | 12,841 | 0.34 |
| M14 |  | 6223 | 0.17 | 42,287 | 1.13 |
| M15 |  | 7276 | 0.19 | 52,929 | 1.42 |
| Total | — | 3,737,581 | 100.00 | 3,737,581 | 100.00 |
Disclaimer/Publisher’s Note: The statements, opinions and data contained in all publications are solely those of the individual author(s) and contributor(s) and not of MDPI and/or the editor(s). MDPI and/or the editor(s) disclaim responsibility for any injury to people or property resulting from any ideas, methods, instructions or products referred to in the content. |
© 2026 by the authors. Licensee MDPI, Basel, Switzerland. This article is an open access article distributed under the terms and conditions of the Creative Commons Attribution (CC BY) license.
Share and Cite
Zhao, Q.; Jia, D. Spatial Correlation Network Assessment of the New Quality Productive Forces Among 283 Chinese Cities: Network Characteristics and Structural Resilience Features. Urban Sci. 2026, 10, 475. https://doi.org/10.3390/urbansci10080475
Zhao Q, Jia D. Spatial Correlation Network Assessment of the New Quality Productive Forces Among 283 Chinese Cities: Network Characteristics and Structural Resilience Features. Urban Science. 2026; 10(8):475. https://doi.org/10.3390/urbansci10080475
Chicago/Turabian StyleZhao, Qiaozhi, and Ding Jia. 2026. "Spatial Correlation Network Assessment of the New Quality Productive Forces Among 283 Chinese Cities: Network Characteristics and Structural Resilience Features" Urban Science 10, no. 8: 475. https://doi.org/10.3390/urbansci10080475
APA StyleZhao, Q., & Jia, D. (2026). Spatial Correlation Network Assessment of the New Quality Productive Forces Among 283 Chinese Cities: Network Characteristics and Structural Resilience Features. Urban Science, 10(8), 475. https://doi.org/10.3390/urbansci10080475