Article

Assessing the Effects of Urbanization on Soil Hydrology in Hungary

1
Institute of Environmental Sciences, Hungarian University of Agriculture and Life Sciences, 2100 Gödöllő, Hungary
2
Doctoral School of Natural Sciences, Hungarian University of Agriculture and Life Sciences, 2100 Gödöllő, Hungary
*
Author to whom correspondence should be addressed.
Urban Sci. 2026, 10(7), 373; https://doi.org/10.3390/urbansci10070373
Submission received: 31 December 2025 / Revised: 26 May 2026 / Accepted: 5 June 2026 / Published: 2 July 2026
(This article belongs to the Special Issue Climate Change and Sustainable City Design)

Abstract

While the effects of urbanization are widely studied, the effects of soil sealing, particularly in the case of Hungary, have only received limited attention in recent years. Our study aimed at understanding the underutilized capacity of urban soils at the national level. We have applied a 20 m resolution, spatially explicit daily water balance-based methodology to calculate the potential water dynamics for the top 75 cm of the soils currently covered by urban fabric in Hungary, for the time period of 1971–2024. We aimed to utilize primarily publicly available data and open-source software to support further use and development. Our results indicated that these (currently sealed) soil surfaces could allow between 0.14 and 0.29 km3 of water to infiltrate into the soil, equaling about 7% of the estimated annual water withdrawal in Hungary. The on-site evaporation from these surfaces would produce about 400 PJ of total cooling service annually, corresponding to an average of 145 MJ/m2. Our findings highlighted the water storage potential of soils in Hungary, particularly in urban areas, supporting the future application of nature-based solutions and blue-green infrastructure.

1. Introduction

As urbanization becomes more and more a global challenge, methods of combating its effects are gaining interest. Our study focuses on a specific, but highly significant part of urbanization: soil sealing.
While the effects of urbanization have been observed as early as the 19th century [1], its underlying processes and effects are still widely studied. As our global society advances, urbanization is accelerating, and its effects are increasingly explored, but the complexity of the systems connected to it still requires further study. Urbanization can profoundly affect ecosystems [2,3]. One of the most widely known effects of urbanization is its influence on local climate, widely known as the urban heat island effect (UHI) [4]. However, a recent study suggested that alternative indicators might be more suitable in describing these effects [5]. The expansion of built-up areas is not only affecting temperature, but it also influences the water cycle—including humidity, cloud formation, and soil water dynamics [6]—as well as human psychology and physiology [7].
To address these challenges, many new fields of research and engineering have emerged in the past decades [8]. The incorporation of nature-based solutions into urban systems is becoming increasingly popular [9], often connected to green-blue infrastructure [10,11].
Soil sealing in Hungary and the Carpathian Basin is a significant threat to soils, while under the changing climatic conditions, the significance of soils as a water source has long been emphasized [12]. Multiple recent Hungarian studies have highlighted the significance of soil moisture in controlling the UHI effect in Hungarian cities [13,14]. It is important to note that soils in urban environments are heavily affected by human activities and thus might significantly change over time, including physical, hydrological, chemical, and biological properties [15,16,17,18,19]. While understanding and monitoring soil moisture dynamics has become an important topic in Hungary, addressed by a number of studies [20,21,22], they are primarily focusing on rural/natural/agricultural areas and not on urban areas [23]. A study focusing on the development of 12 s-tier towns in Hungary has found that while there was an increase in urban areas from 1990, the development of functional urban areas was not significant from 2012 to 2018 [24]. Larger towns, however, have generally increased in built-up areas by close to 20% [25]. These effects are significant in light of the fact that, according to long-term models, the capital city of Budapest is expected to have a temperature increase of 1.9 °C in the winter months by 2050 [26].
It is also a significant question, how rainwater can access the soil in urban environments at all. The high ratio of covered surface area dramatically limits the locations where infiltration can occur in a city [27,28]. Consequently, infiltration might be very limited and concentrated, e.g., in urban parks [29,30]. These urban green areas might be so important to the urban hydrological cycle that urban parks and green zones operate like infiltration windows, allowing potential groundwater recharge [31].
Another very important phenomenon associated with the soil moisture content of urban soil profiles is runoff [32]. As asphalt and concrete act as an almost impermeable barrier at the soil surface, even the smallest amount of precipitation will prefer to run off rather than infiltrate, causing several problems. The direct, and sometimes dramatic, effect is the occurrence of flash floods, which occur especially during extreme precipitation events [33]. As climate change progresses, dangerous flash floods occur more frequently, such as the ones that happened in Spain in 2025 [32,34]. Another effect is not so obvious, but, over a longer time range, also may pose a significant threat. Since precipitation cannot infiltrate, and the urban sewer system collects and transports this surplus water outside of the local soil system, urban soils essentially lose this water [35,36]. Not surprisingly, urban vegetation also may lose this water. Since extreme precipitation events usually occur during the hotter seasons, the effect of this water deficit can be even more serious, and the introduction of nature-based solutions is a potential mitigation option for these issues [37].
Given the contradictory effects of infiltration and runoff, the ratio of these two phenomena might be one of the most important factors in controlling moisture content in urban soils [38,39,40]. Also, soil sealing, as a characteristic of this ratio, can provide a useful indicator of soil moisture conditions [41,42,43].
It is noteworthy that although our study focuses on Hungary, the trends mentioned above are well known both in Europe [44,45] and in other parts of the world [44,46,47]. It means that, although we investigate the effect of soil sealing in our paper in the Hungarian context, the phenomenon is becoming increasingly significant worldwide.
Most recently, there has been a significant interest in studies focusing on the potential of using nature-based solutions in urban areas in order to mitigate the ever more apparent effects of climate change. While in some cases, urban infrastructure can lead to increased groundwater recharge [48], the continued application of sealed impervious surfaces is expected to further increase runoff, which underscores the importance of the application of permeable materials, as well as other water retention methods [49]. Other studies also emphasize not only the application of blue-green infrastructure, but the significance of the appropriate planning process involved [10,50,51].
The primary objective of our study was to estimate the potential water storage capacity currently unavailable in urban areas of Hungary, due to soil sealing, and provide a methodology for further utilization at the regional level and at higher spatial and temporal scales.

2. Materials and Methods

Our study focuses on urban (i.e., covered/sealed) areas of Hungary, aiming to quantify the “unexploited” hydrological potential of these sealed soils. In order to maximize potential reuse and reapplication, we aimed at utilizing publicly available datasets and open-source software wherever possible.

2.1. Study Area

Our study focuses on the urbanized areas of Hungary. A landlocked country located in Central Europe (45°48′ to 48°35′ N, 16°05′ to 22°58′ E), Hungary’s total area is in the basin of the Danube River. A country mostly represented by lowlands, with only about only 2.1% of the area covered by medium-height mountains [52].
Situated in the northern temperate zone, Hungary’s climate is primarily influenced by continental, oceanic, and Mediterranean climatic zones, with warm summers and cold winters. The wettest year on record was 2010, while the driest in recent decades was 2022. Spatial and temporal distribution of rainfall is uneven, with increasing frequency of extreme events observed in recent years and predicted in future scenarios [53].

2.2. Data Sources

Soil information was primarily obtained from the EU-SoilHydroGrids ver. 1.0 database [54]. This included volumetric water content (%) at saturation (SAT), field capacity (FC), and wilting point (WP) at a 250 m spatial resolution, for the depths. of 0, 5, 15, 30, 60, and 100 cm. In order to approximate runoff/infiltration, additional soil information on soil hydrology (classes) was obtained from the AGROTOPO dataset at a 1:100,000 scale spatial dataset.
Information on soil sealing was obtained from the Ecosystem Map of Hungary [55] at a 20 m × 20 m grid, representing the latest and finest resolution publicly available open dataset on the topic, with the reference year of 2015.
For runoff/infiltration calculation, the 30 m resolution instance of the Copernicus DEM database was utilized as a digital elevation base for calculations [56].
Climatological data covering the whole area of Hungary from 1971 to 2024 were accessed through the HungaroMET Data repository [57]. Homogenized daily datasets at 0.1° spatial resolution were downloaded for precipitation and temperature (minimum, mean, and maximum).
In order to provide a ground-based foundation for our modeling concept, we have utilized publicly available monitoring data from the Operational Drought and Water Scarcity Management System (ODWSMS), maintained by the General Directorate of Water Management of Hungary (OVF) [58]. We have selected 15 stations, distributed around Hungary, to act as a validation dataset for our modeling framework. The ODWSMS dataset contains a continuously growing number of meteorological stations (at the time of the writing of this article, over 120), recording hourly data of multiple parameters. For the purpose of this study, we have utilized the hourly precipitation data (mm) and the hourly soil moisture data (V/V%), the latter recorded at 6 depths (10, 20, 30, 45, 60, and 75 cm). As the ODWSMS is a growing system, monitoring information was not available for every station for the same (full) years. Where available, data were selected for the years 2019–2024.

2.3. Applied Methodology

2.3.1. General Modeling Concepts

In order to estimate lost soil water storage capacity and dynamics under sealed surfaces, we have applied a simple, spatially explicit methodology based on local daily water balance for the top 75 cm of soil, as an assumed active rootzone. The model was governed by the mass balance equation for soil water storage applied as
Δ S W C = I D E T 0
where
SWC—Soil Water Content (mm);
I—Infiltration (mm);
D—Deep percolation/Groundwater recharge (mm);
ET0—reference evapotranspiration (mm).
In order to calculate Runoff (R) and Infiltration (I) from Precipitation (P), we have utilized a dynamic runoff coefficient based on the application of a static runoff coefficient.
The model was applied daily for each unique combination of input variables with a sealed soil surface for each year from 1971 to 2024. The model assumed that initial soil moisture conditions were at FC at the start of each yearly run. As actual vegetation would be impossible to estimate for surfaces currently under urban cover, we have assumed a well-maintained grass cover, corresponding to reference evapotranspiration (ET0).
As sufficient soil information for the calculation of infiltration was not publicly available at the national level, we have decided to follow an approach also utilized by the AquaCrop model, where we calculate runoff (R) first, and infiltration (I) is calculated by subtracting the runoff from precipitation (P) [59]. For the calculation of the runoff coefficient, we have adopted a dynamic runoff coefficient approach that utilizes a static input runoff variable developed specifically for Hungary by Kenessey [60], also recently utilized for studying urban cover [61]. The static runoff coefficients calculated were based on the following equation:
α s t a t i c = α 1 + α 2 + α 3
where
αstatic—static runoff coefficient;
α1—slope component;
α2—soil component;
α3—plant/crop cover component.
The recommended component values are listed in Table 1. As component ranges are provided, mid-range values were assumed for each category (in bold). In the case of crop cover, only grass was assumed, according to the basic assumptions of the study.
The static runoff coefficient was then utilized to calculate the dynamic runoff coefficient (αdyn):
α d y n = α s t a t i c × S W C F C 1.5
Surface runoff was then determined by
R = P × α d y n
and the remaining volume was treated as infiltration (I):
I = P R
Actual evapotranspiration was modeled by adjusting ET0 based on water availability, with a stress coefficient calculated using a linear depletion function between wilting point (WP) and field capacity (FC):
K s = S W C W P F C W P
E T a c t = E T 0 × K s
This approach ensured that as the soil was drying, ETact would decrease, reaching zero at WP.
Deep percolation (representing potential groundwater recharge) was modeled by assuming that excess water above FC would drain at the rate of 15% of the gravitational water storage per day:
D = max 0 , 0.15 × SWC FC
An annual cumulative runoff ratio was calculated:
R u n o f f   C o e f f i c i e n t = R s u m P s u m

2.3.2. Data Preparation

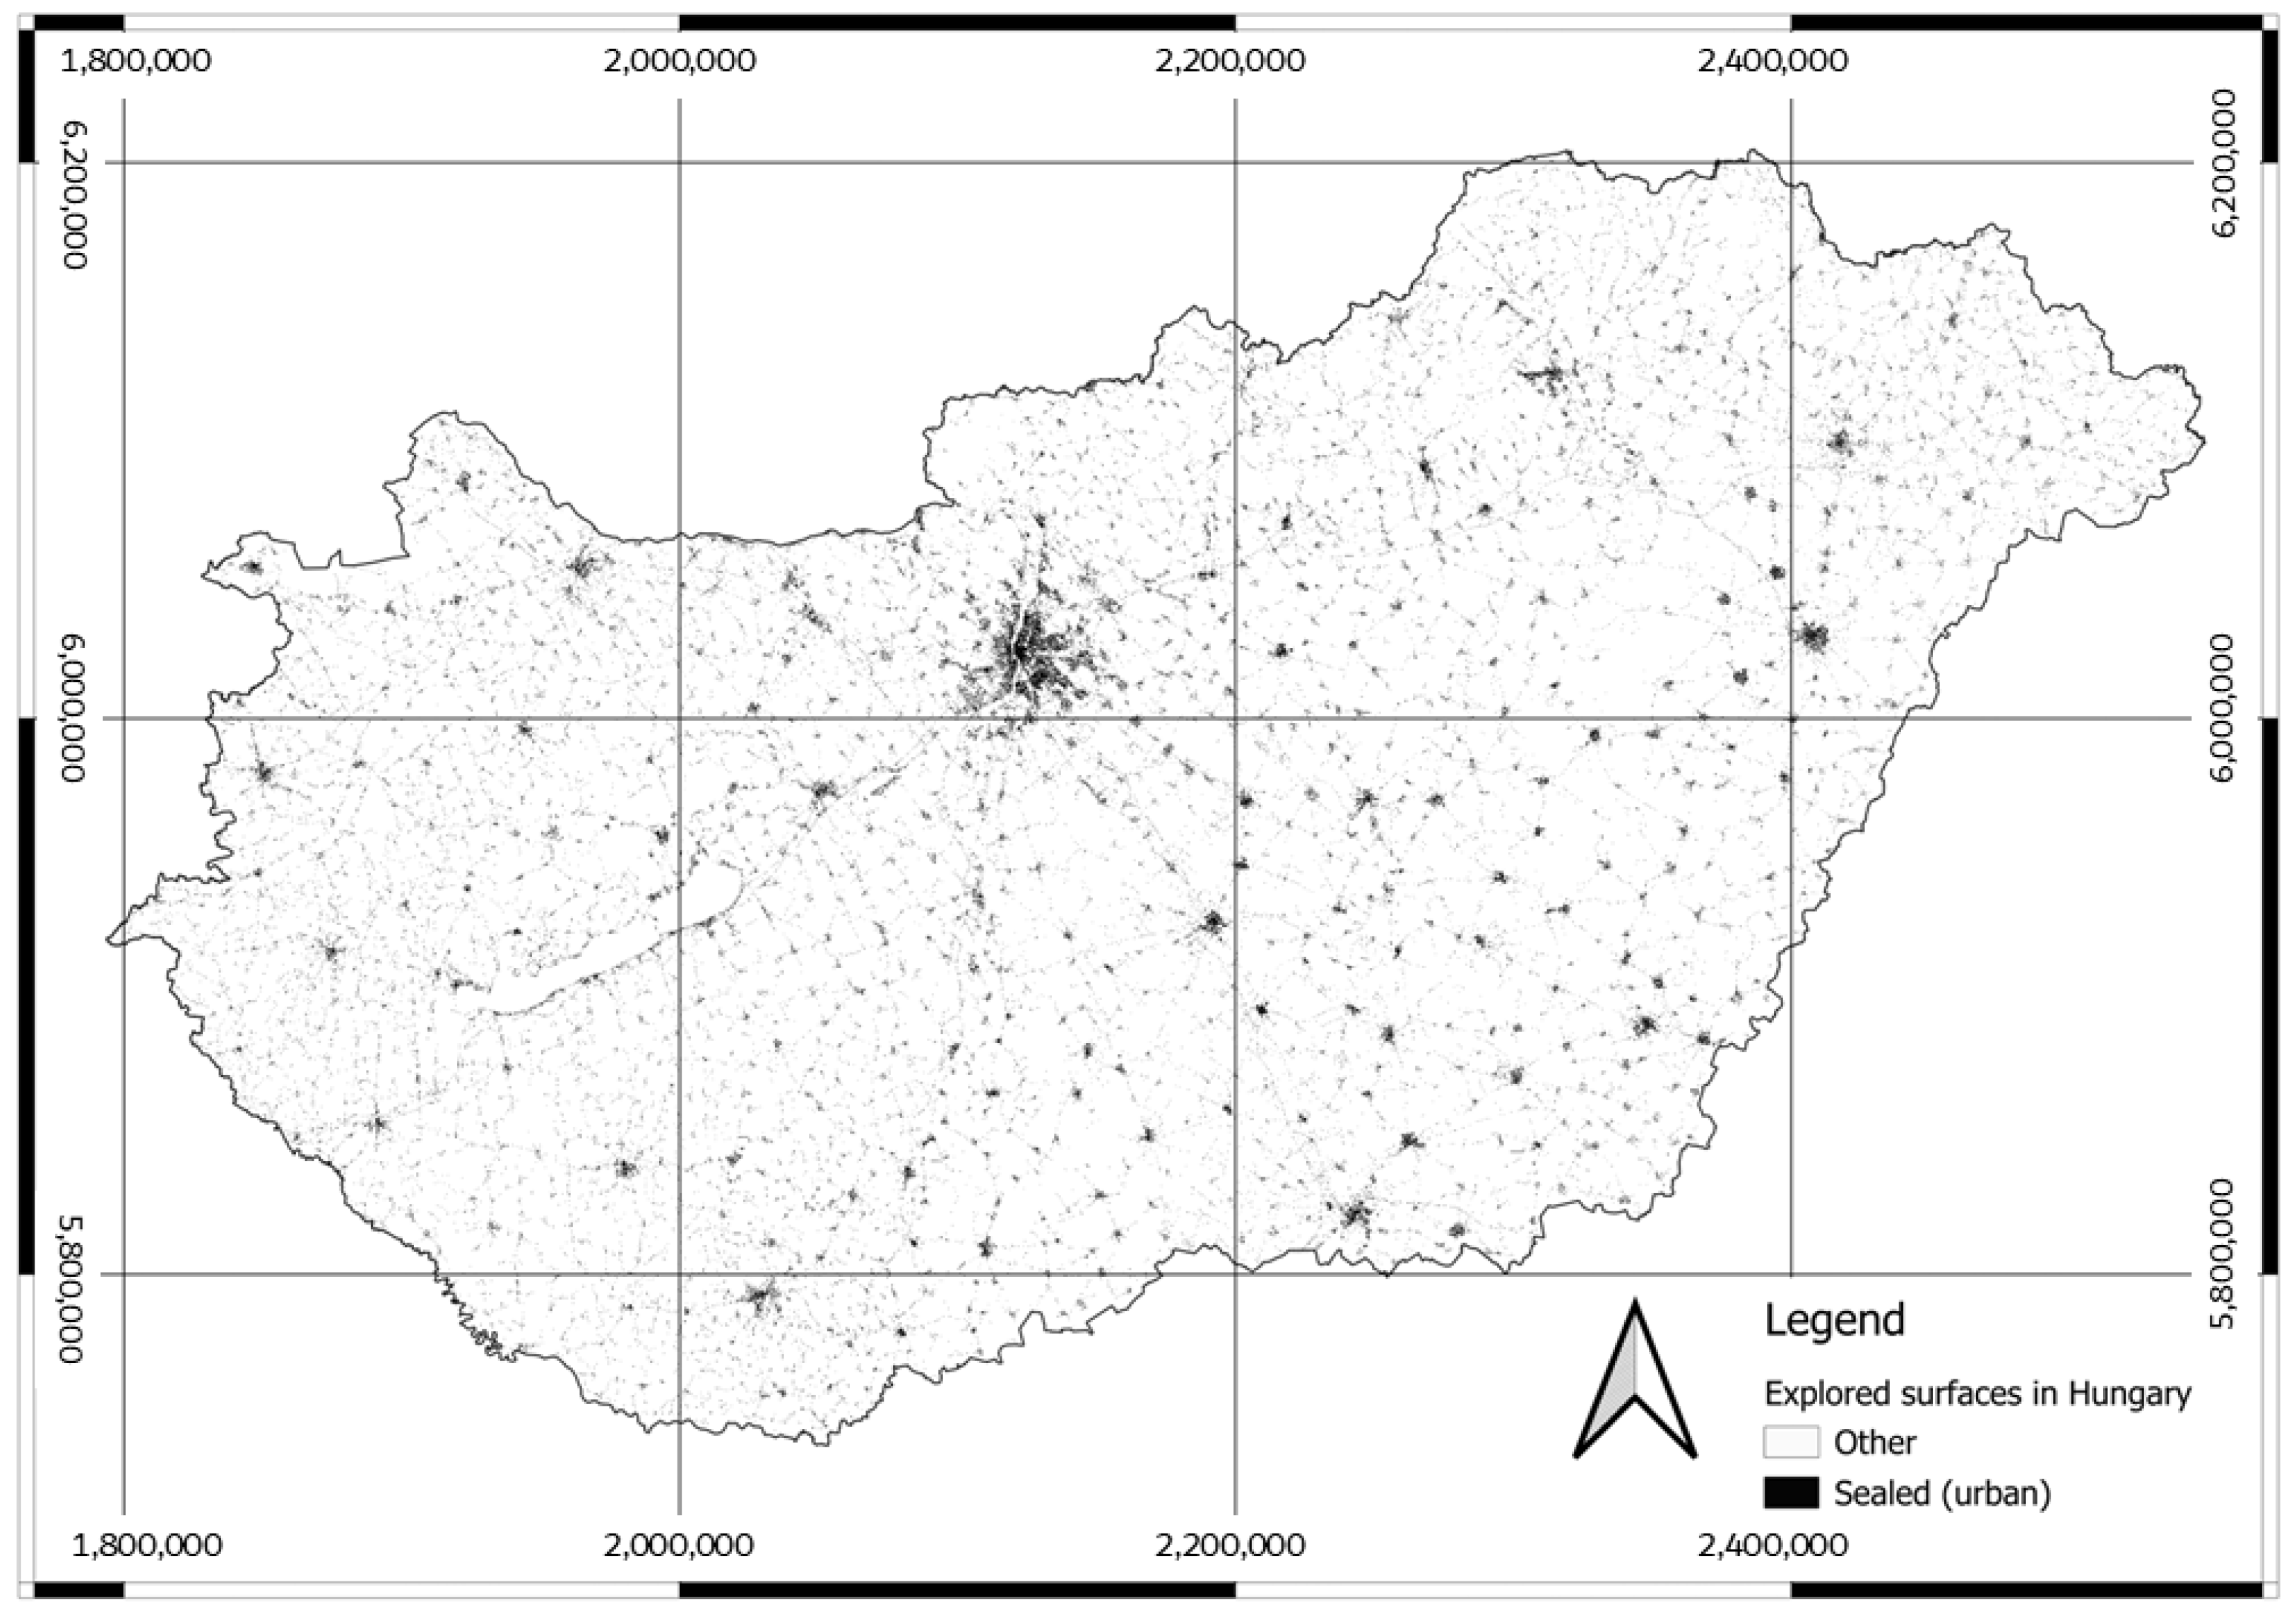
The original 20 m resolution of the National Ecosystem Map of Hungary [55] was used as the target grid, in order to maximize spatial accuracy for urban cover. While the original dataset contains multiple classes, only three of them were relevant in terms of soil sealing. All buildings (small and tall), and roads have been considered as urban “impervious” fabric, including highways. Through the reclassification of the dataset, we have obtained the extent of urban surfaces in Hungary, presented in Figure 1.
As available climate data did not include daily evapotranspiration, we have calculated daily reference evapotranspiration from daily temperature (minimum, mean, and maximum) data according to the Hargreaves method [62]. The grid containing cell IDs for the climate dataset was also resampled (using the nearest neighbor method) for the target 20 m grid.
Soil parameters (SAT, FC, WP) have been mosaicked, resampled (B-spline interpolation), and calculated as weighted mean values for the top 75 cm of the soil profile. Available water (AW) was calculated using the equation.
A W = F C W P
where
AW—wilting point (%v);
FC—field capacity (%v);
WP—wilting point (%v).
To harmonize with precipitation and evapotranspiration units, soil hydrological parameters were also converted to mm (considering the top 75 cm of soil), to simplify calculations and evaluation.
The α1 (slope) component values were calculated based on the Copernicus DEM dataset. The 30 m resolution data was resampled to the target 20 m grid (B-spline interpolation. Slope percentage was calculated using SAGA GIS [63,64].
The α2 (soil) values were estimated based on the AGROTOPO dataset. In order to convert to the target grid, the original vector data was rasterized to the target 20 m grid. As the soil hydrological classes utilized by Kenessey (see Table 1) were different from the classes included in the AGROTOPO dataset, the data have been reclassified according to Table 2.
In the case of crop cover, the assumption was that the soil would be covered by grass, for the best comparability with the reference evapotranspiration (ET0). Thus, an α3 value of 0.17 was assumed in all calculations (Table 1).
Given that the whole area of Hungary at a 20 m resolution would cover approximately 809 million grid cells, instead of raster-based processing, we have utilized a data-reduction strategy by generating unique identifiers for each existing combination of the 3 static (alpha, FC, WP) variables, and the ID value corresponding to the appropriate climate time-series. This has resulted in a 7–10 character long identifier, already containing the values for the static variables (in a percentage form), and properly referencing the climate data. Through this method, we were able to reduce the number to a computationally manageable set of around 50,000 grid cells. This has allowed us to maintain spatial heterogeneity for the whole study region.
Monitoring data from the 15 ODWSMS stations (hourly precipitation and soil moisture data) was recalculated to daily mean values, and weighted soil moisture was calculated for the top 75 cm layer of the soil.

2.3.3. Modeling and Evaluation Framework

Based on initial calibration with in situ data from 3 randomly selected stations, the modeling framework was applied for the 15 ODWSMS stations for the available years (depending on the stations). To evaluate model performance, we have calculated the coefficient of determination (R2), Nash-Sutcliffe efficiency (NSE), and the percent bias (PBIAS), as commonly utilized indicators.
The model was then applied to the full dataset, with annual values calculated for accumulated precipitation (Psum), Runoff (Rsum), Infiltration (Isum), and groundwater recharge (Dsum). Post-processing has removed extreme outliers due to input data inconsistencies and generated national summary statistics (based on the frequency of each unique input data combination) for the total 1971–2024 time period. During this process, additional indicators (Runoff Coefficient, Percolation Ratio, Cooling Energy, and Total Cooling Service) have also been calculated.
Specific Cooling Energy Density was calculated by
S E D = E ¯ s u m × L
where:
SED—Specific Cooling Energy Density (MJ × m−2);
E ¯ s u m —weighted mean of annual evapotranspiration;
L—latent heat of vaporization (≈2.45 MJ × mm−1 × m−2) [66].
Total National Cooling Service was calculated as
C S t o t a l = S E D × n × A c e l l
where:
CStotal—Total Cooling Service (PJ);
SED—Specific Cooling Energy Density (MJ × m−2);
n—the total number of frequency-weighted cells (809 × 106 weighted mean of annual evapotranspiration;
Acell—the total area of a single grid cell (400 m2).
For spatially explicit visualization, we have also generated spatial output files for the years 2010 and 2022. These years have been particularly significant due to their extreme hydrological regimes.

2.3.4. Processing and Analysis

GIS processing of spatial datasets was carried out using QGIS (version 3.40.15) and SAGA GIS (version 9.10.2) software [64,67]. Data preparation, calibration, modeling, and validation, including pre-and post-processing, were applied using scripts in the R environment (version 4.5.1) [68]. Evaluation of the results was also carried out in R and in MS Excel (Microsoft Corp., Seattle, WA, USA).

3. Results

Initial results of the sealed surface area indicated that the total covered area is approximately 2760 km2, accounting for about 2.97% of the total area of Hungary. After data preparation, the model was successfully applied for the years from 1971 to 2024.

3.1. Results of Model Validation

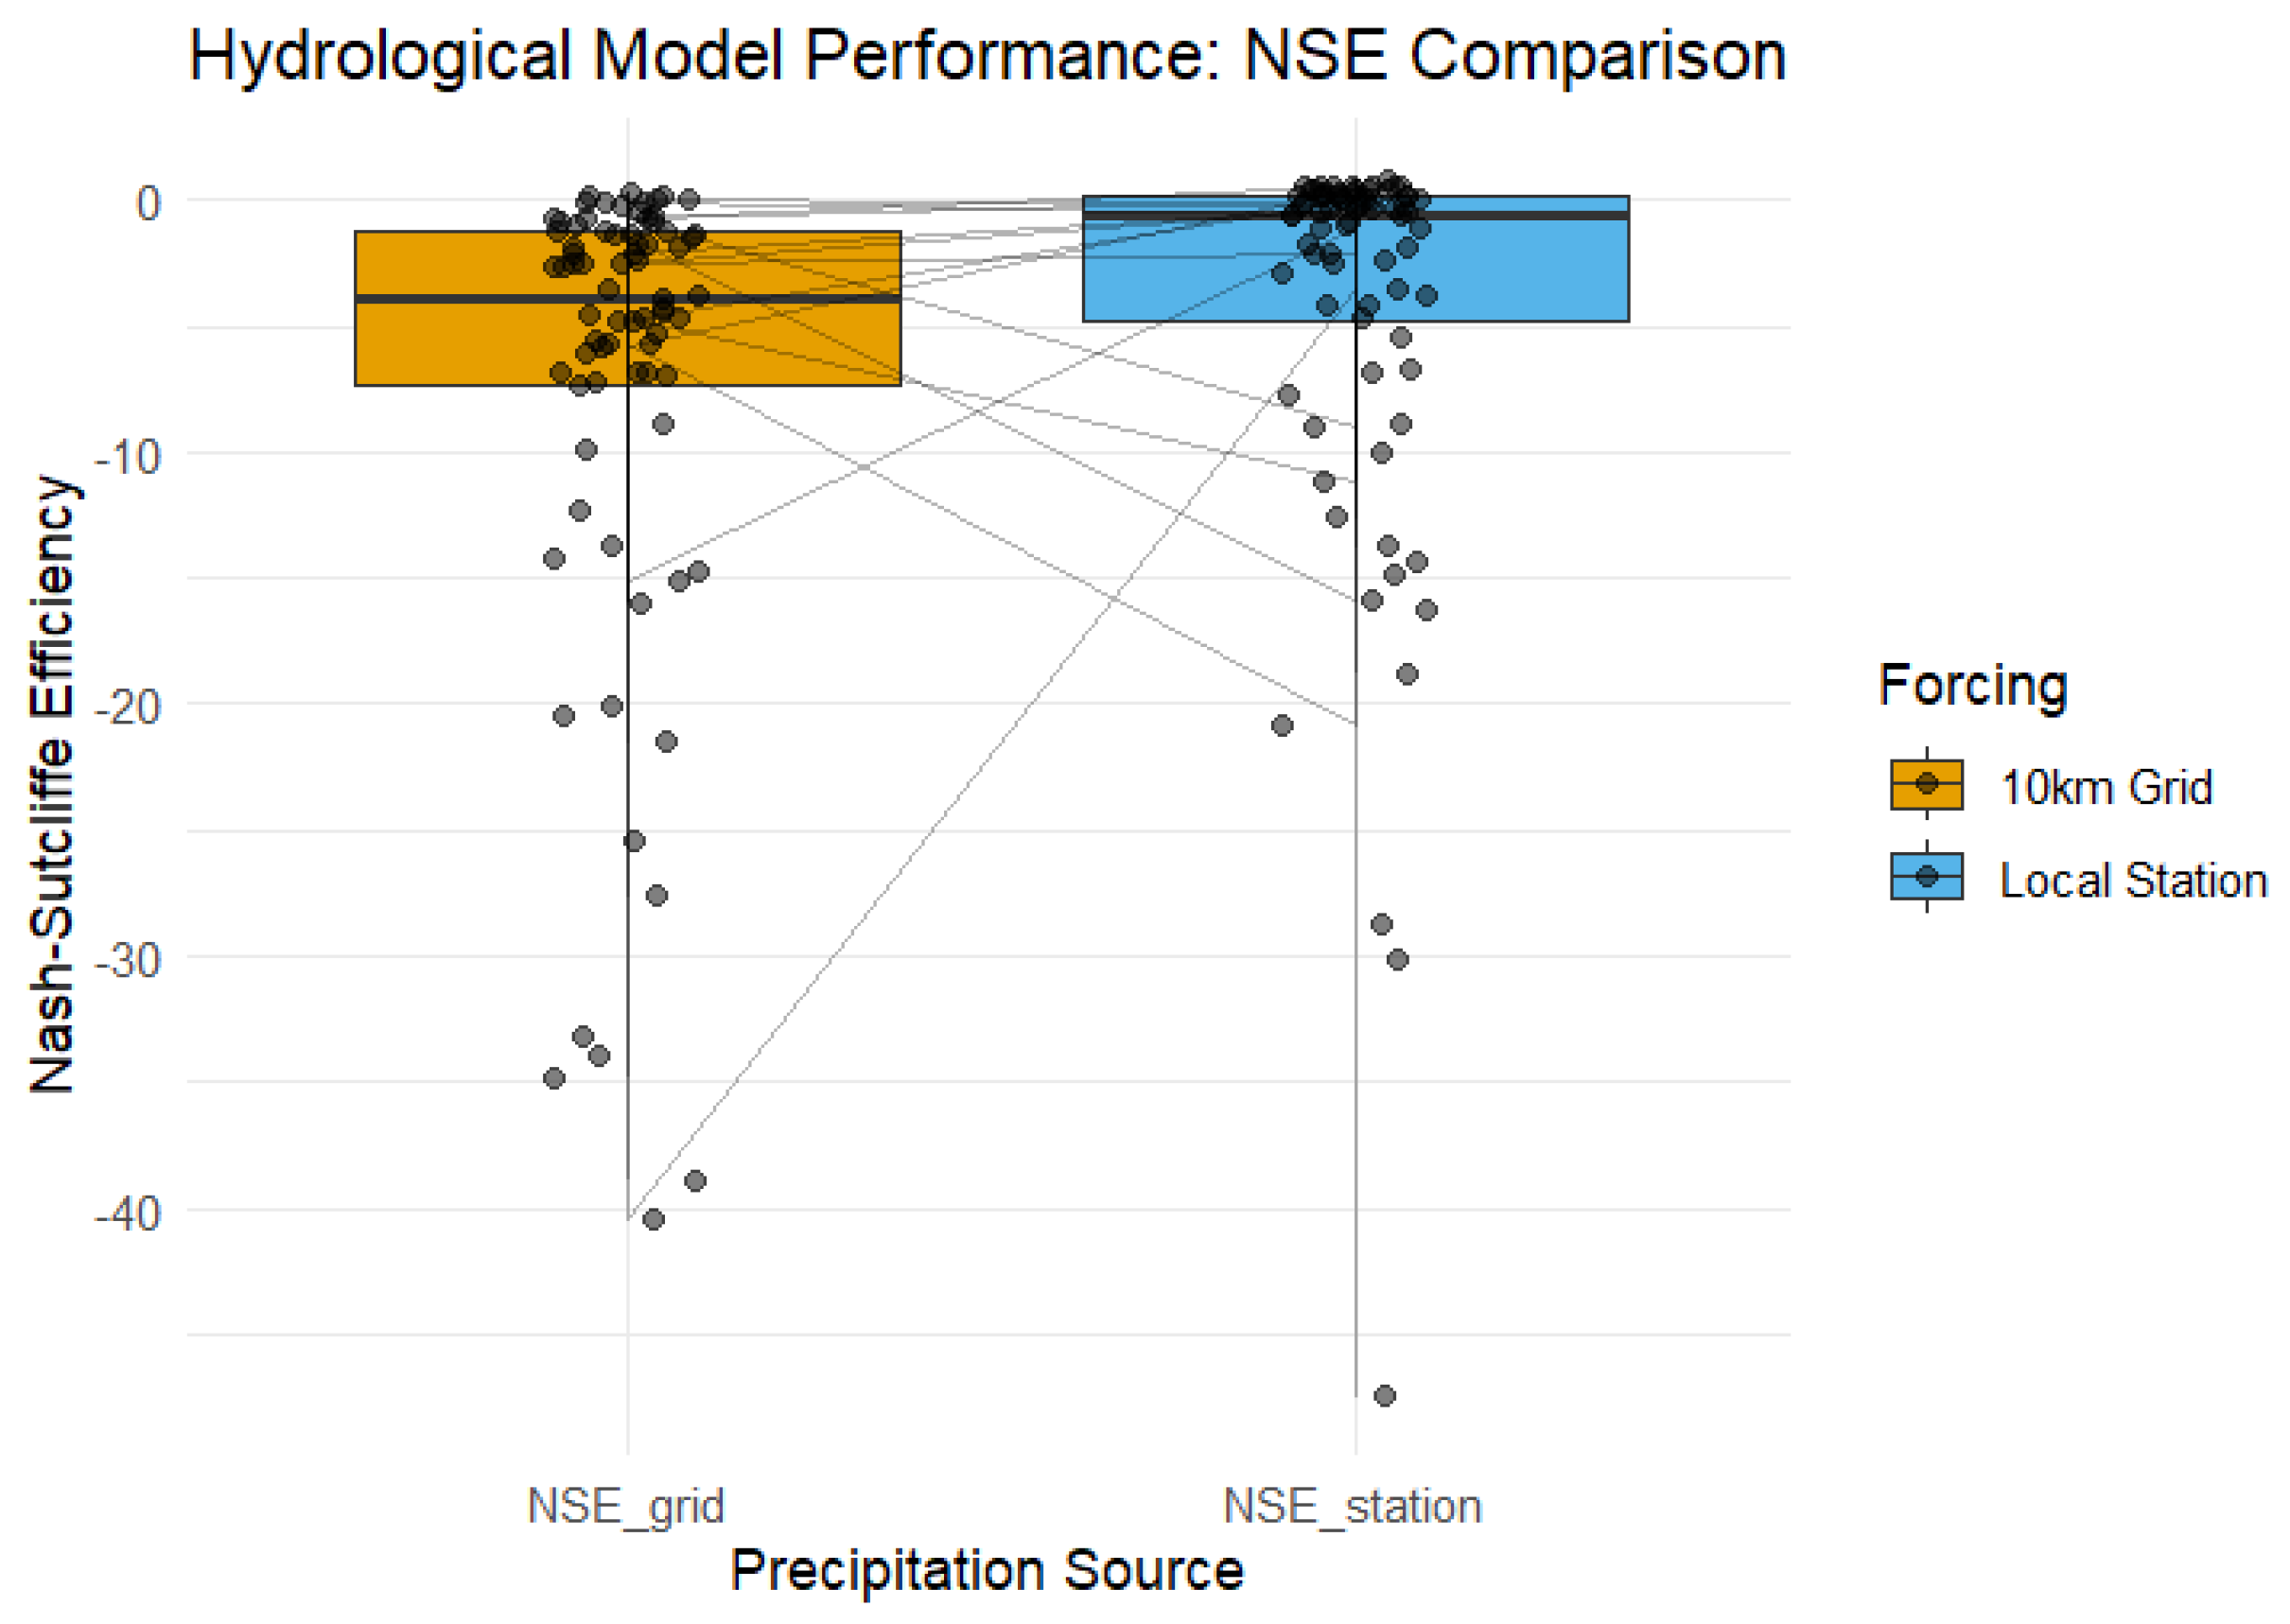
Based on the 15 validation points, we have calculated NSE, R2, and PBIAS indicators. The detailed results are presented in Table S1 (in the Supplementary Files). As a comparison of point-based station data with a 0.1° (approximately 10 km) resolution climate data grid is only expected to achieve limited results, we have also utilized the precipitation data measured at the location of the stations. These results have indicated that model performance has significantly improved with the use of local precipitation data, even though the evapotranspiration data were still derived from the national level dataset. Based on the visualized results, we can observe that while the model did not perform well in predicting soil moisture dynamics at point-based locations, it performed much better when applied to localized data, with improved indicators in most stations and years.
Figure 2 presents the improvement in model performance, as median NSE values have clearly shifted upward, with fewer extreme outliers and correction lines indicating that the majority of the stations have improved in prediction. Similar trends can be observed in the case of the R2 and PBIAS indicators (Figures S1 and S2). These results indicate that while the model failed at predicting local dynamics based on large-scale gridded data, it has performed reasonably better when scale-appropriate data was applied.
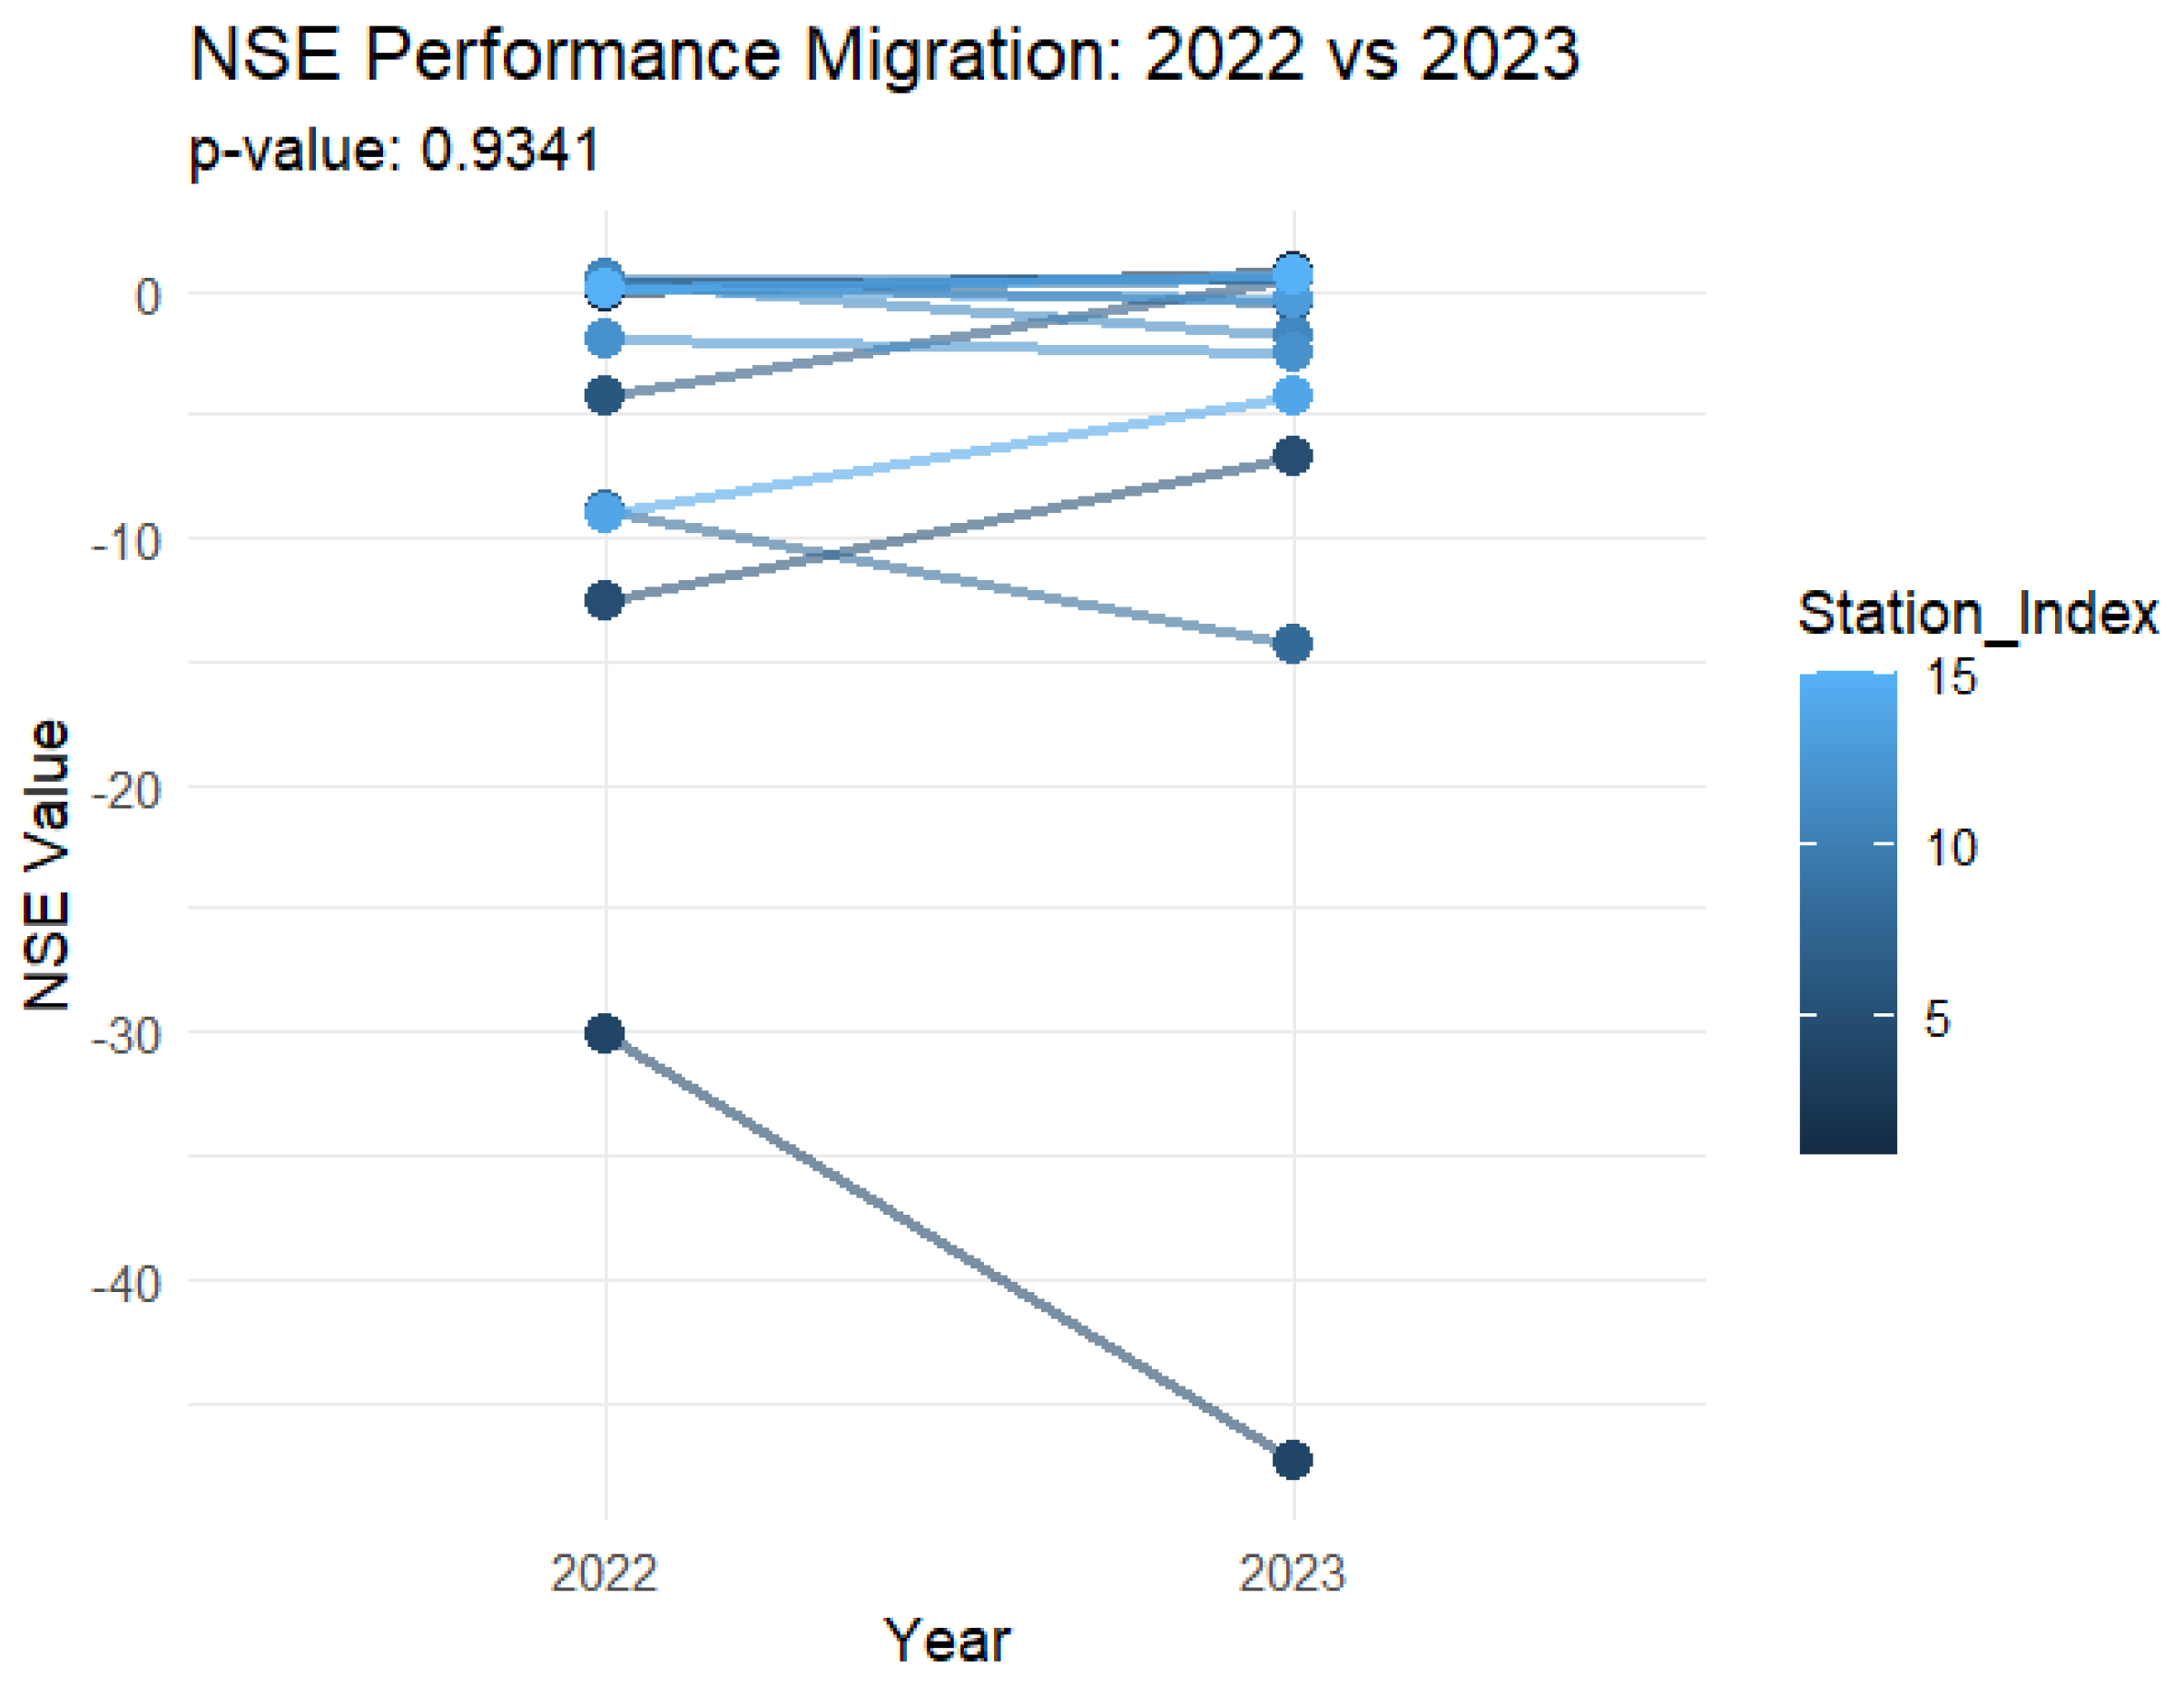
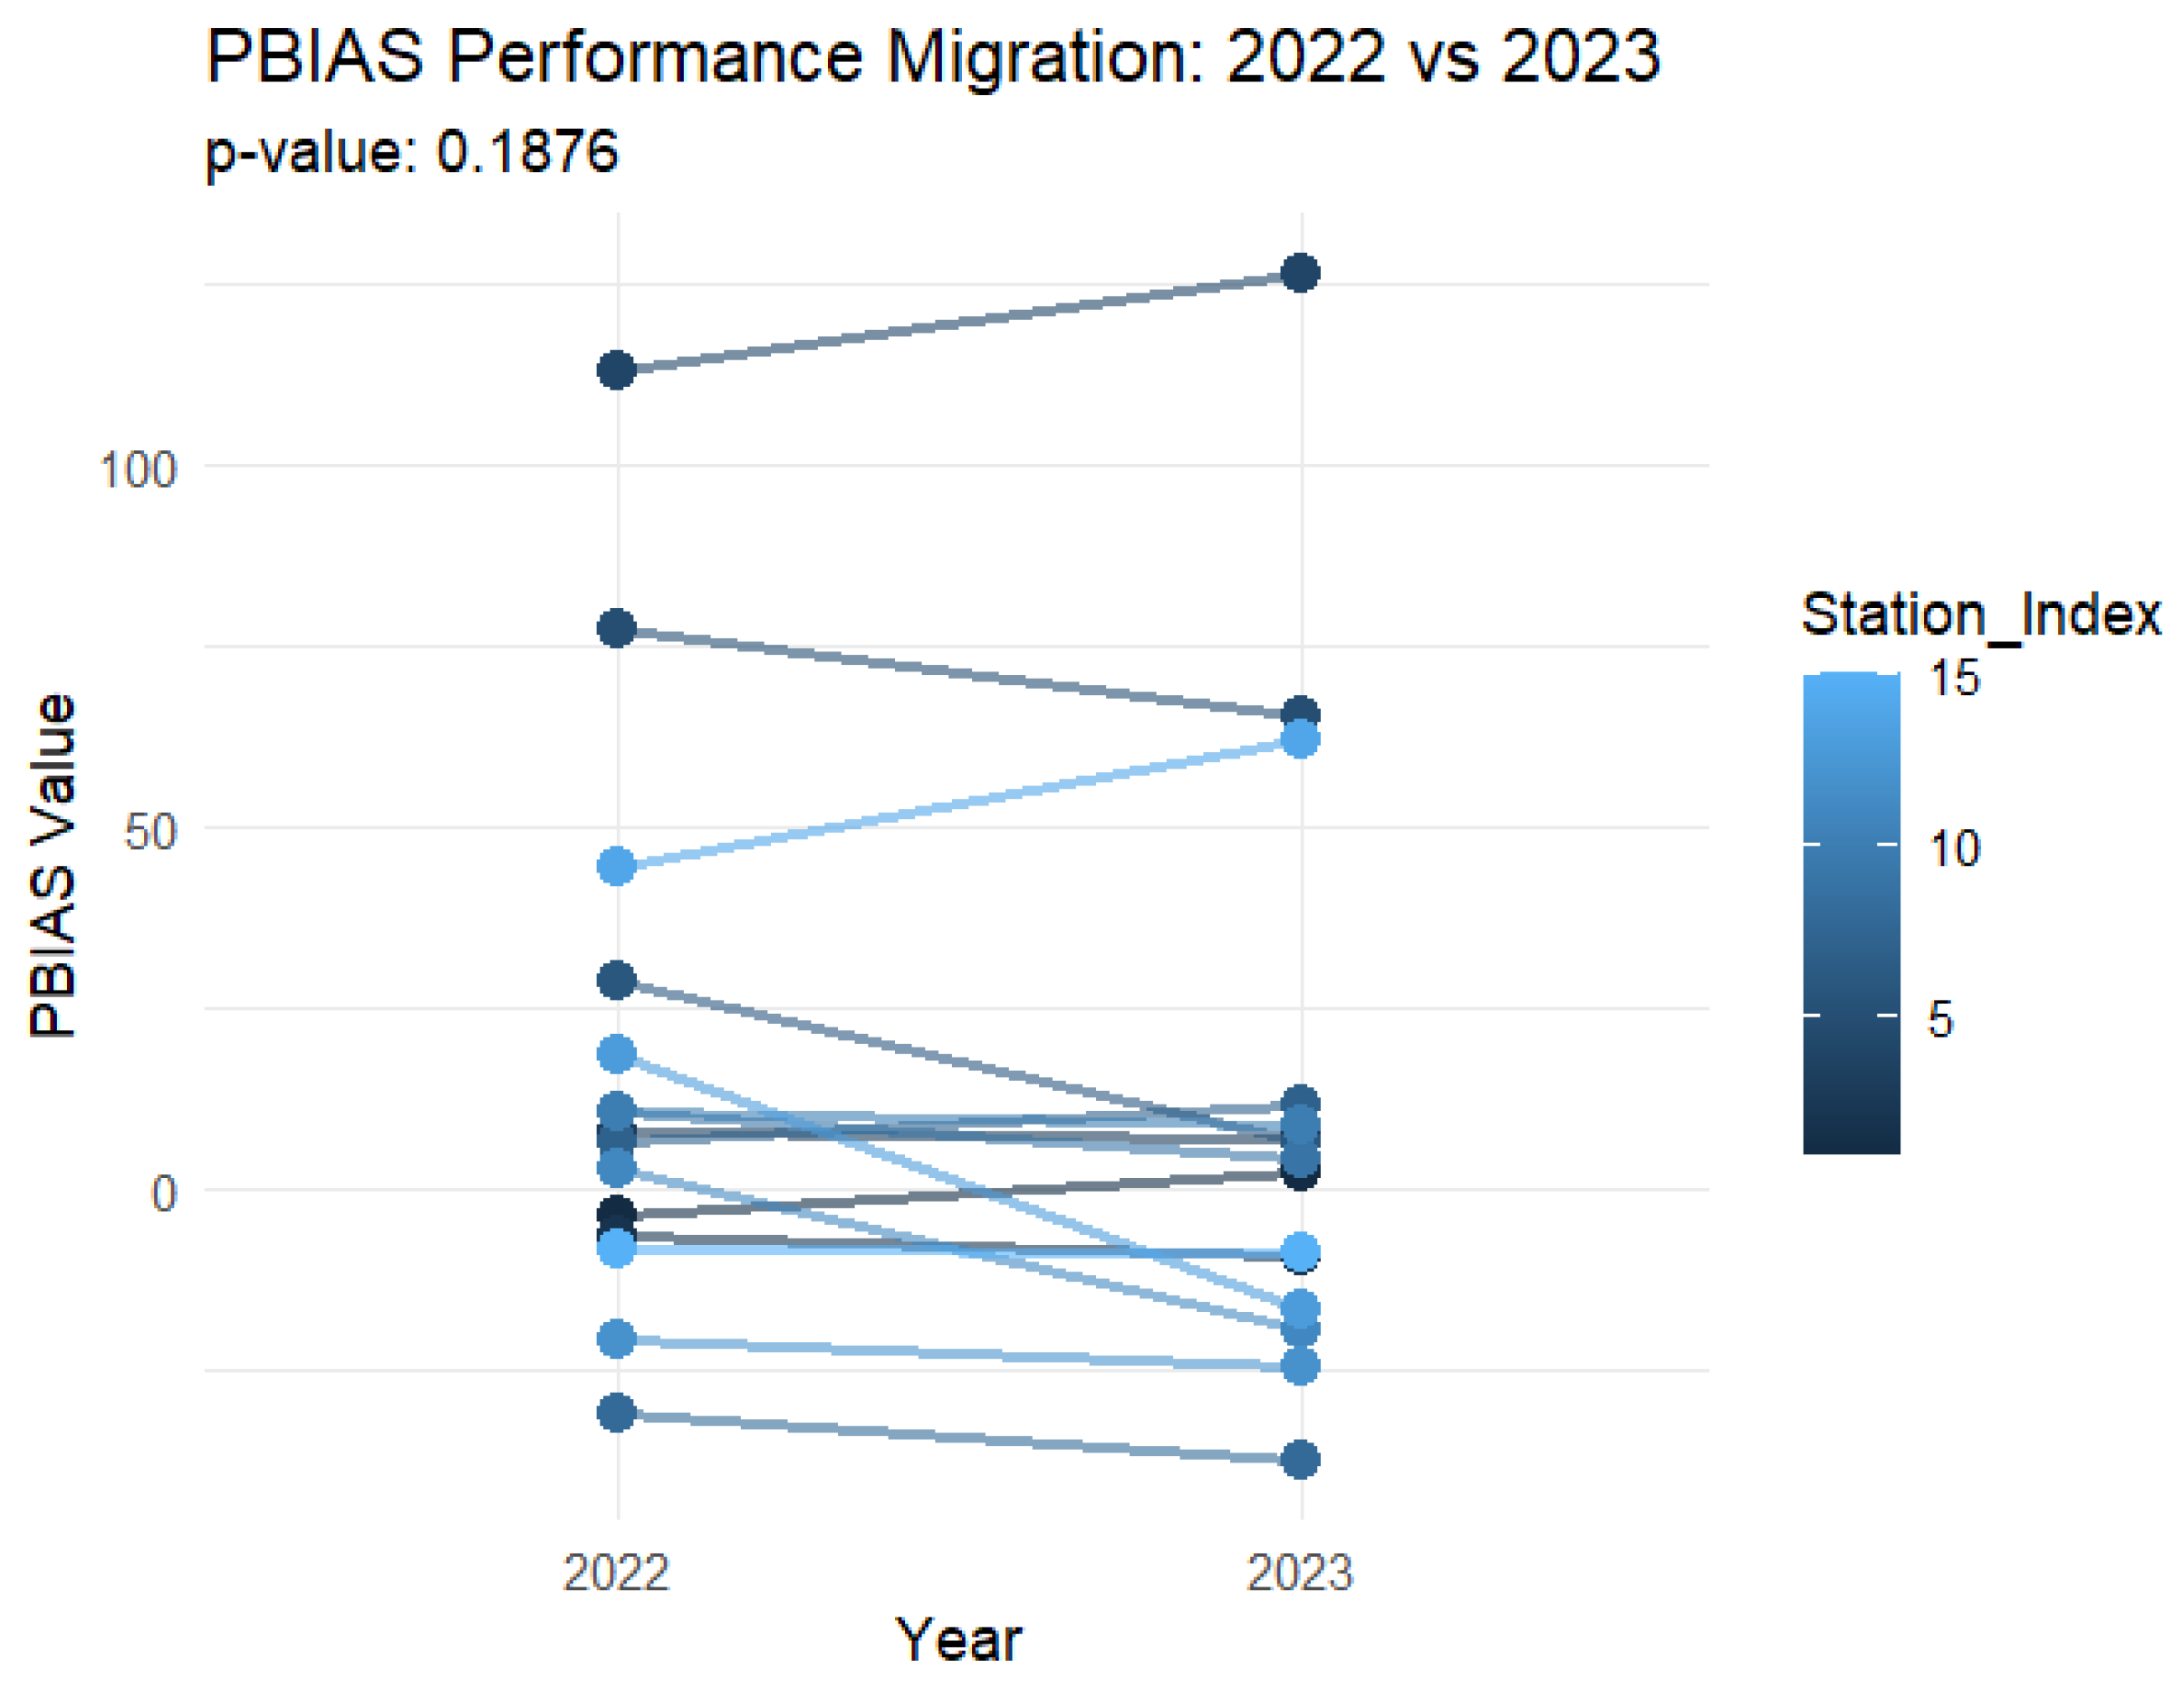
In order to assess if the model performance is affected by the differences in annual precipitation, we have compared an extreme dry (2022) and a reasonably wet (2023) year, using the Wilcoxon signed rank exact test. Based on the results for NSE (V = 58, p = 0.934), the model performance did not differ significantly between these two years, across the 15 stations (Figure 3). While the difference between the two years is more pronounced in the case of the PBIAS, the results (V = 58, p = 0.188) are still not a significant difference between the two years (Figure 4).
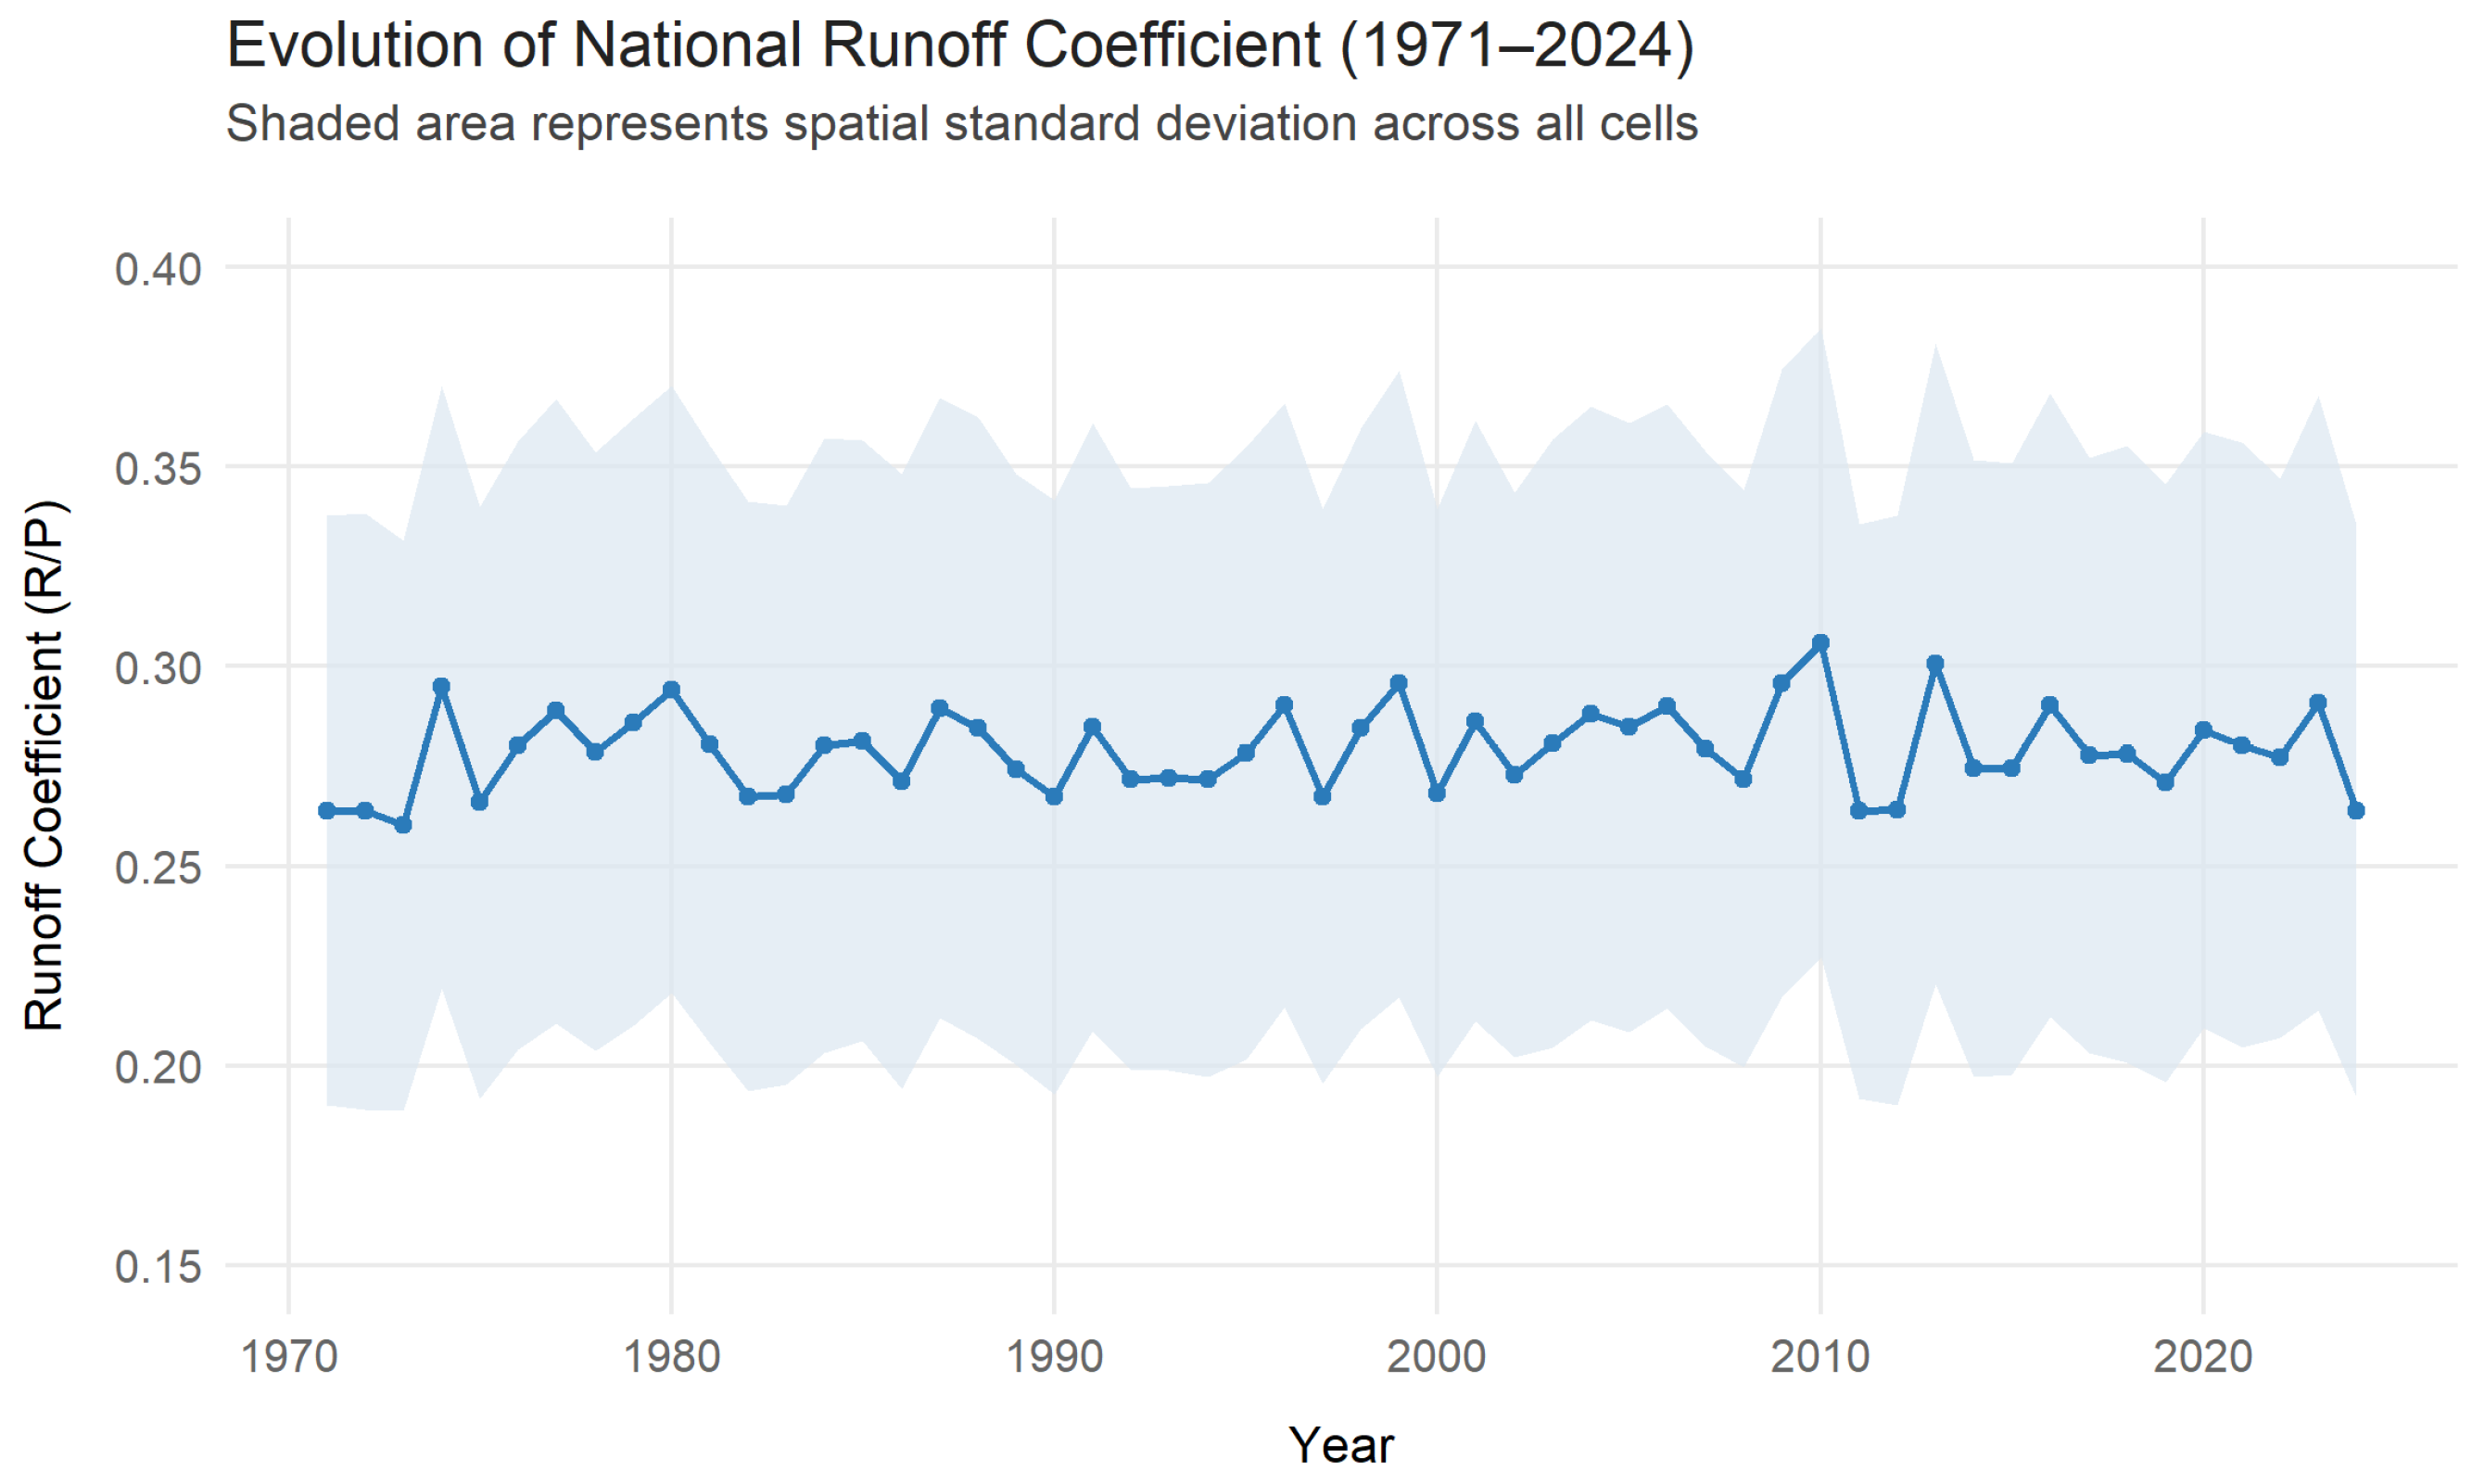
Figure 5 presents the time series of the calculated annual runoff coefficient, with the range also present. The figure indicates that the annual runoff primarily depends on the constant influencing factors, and less so on the actual infiltration rates.
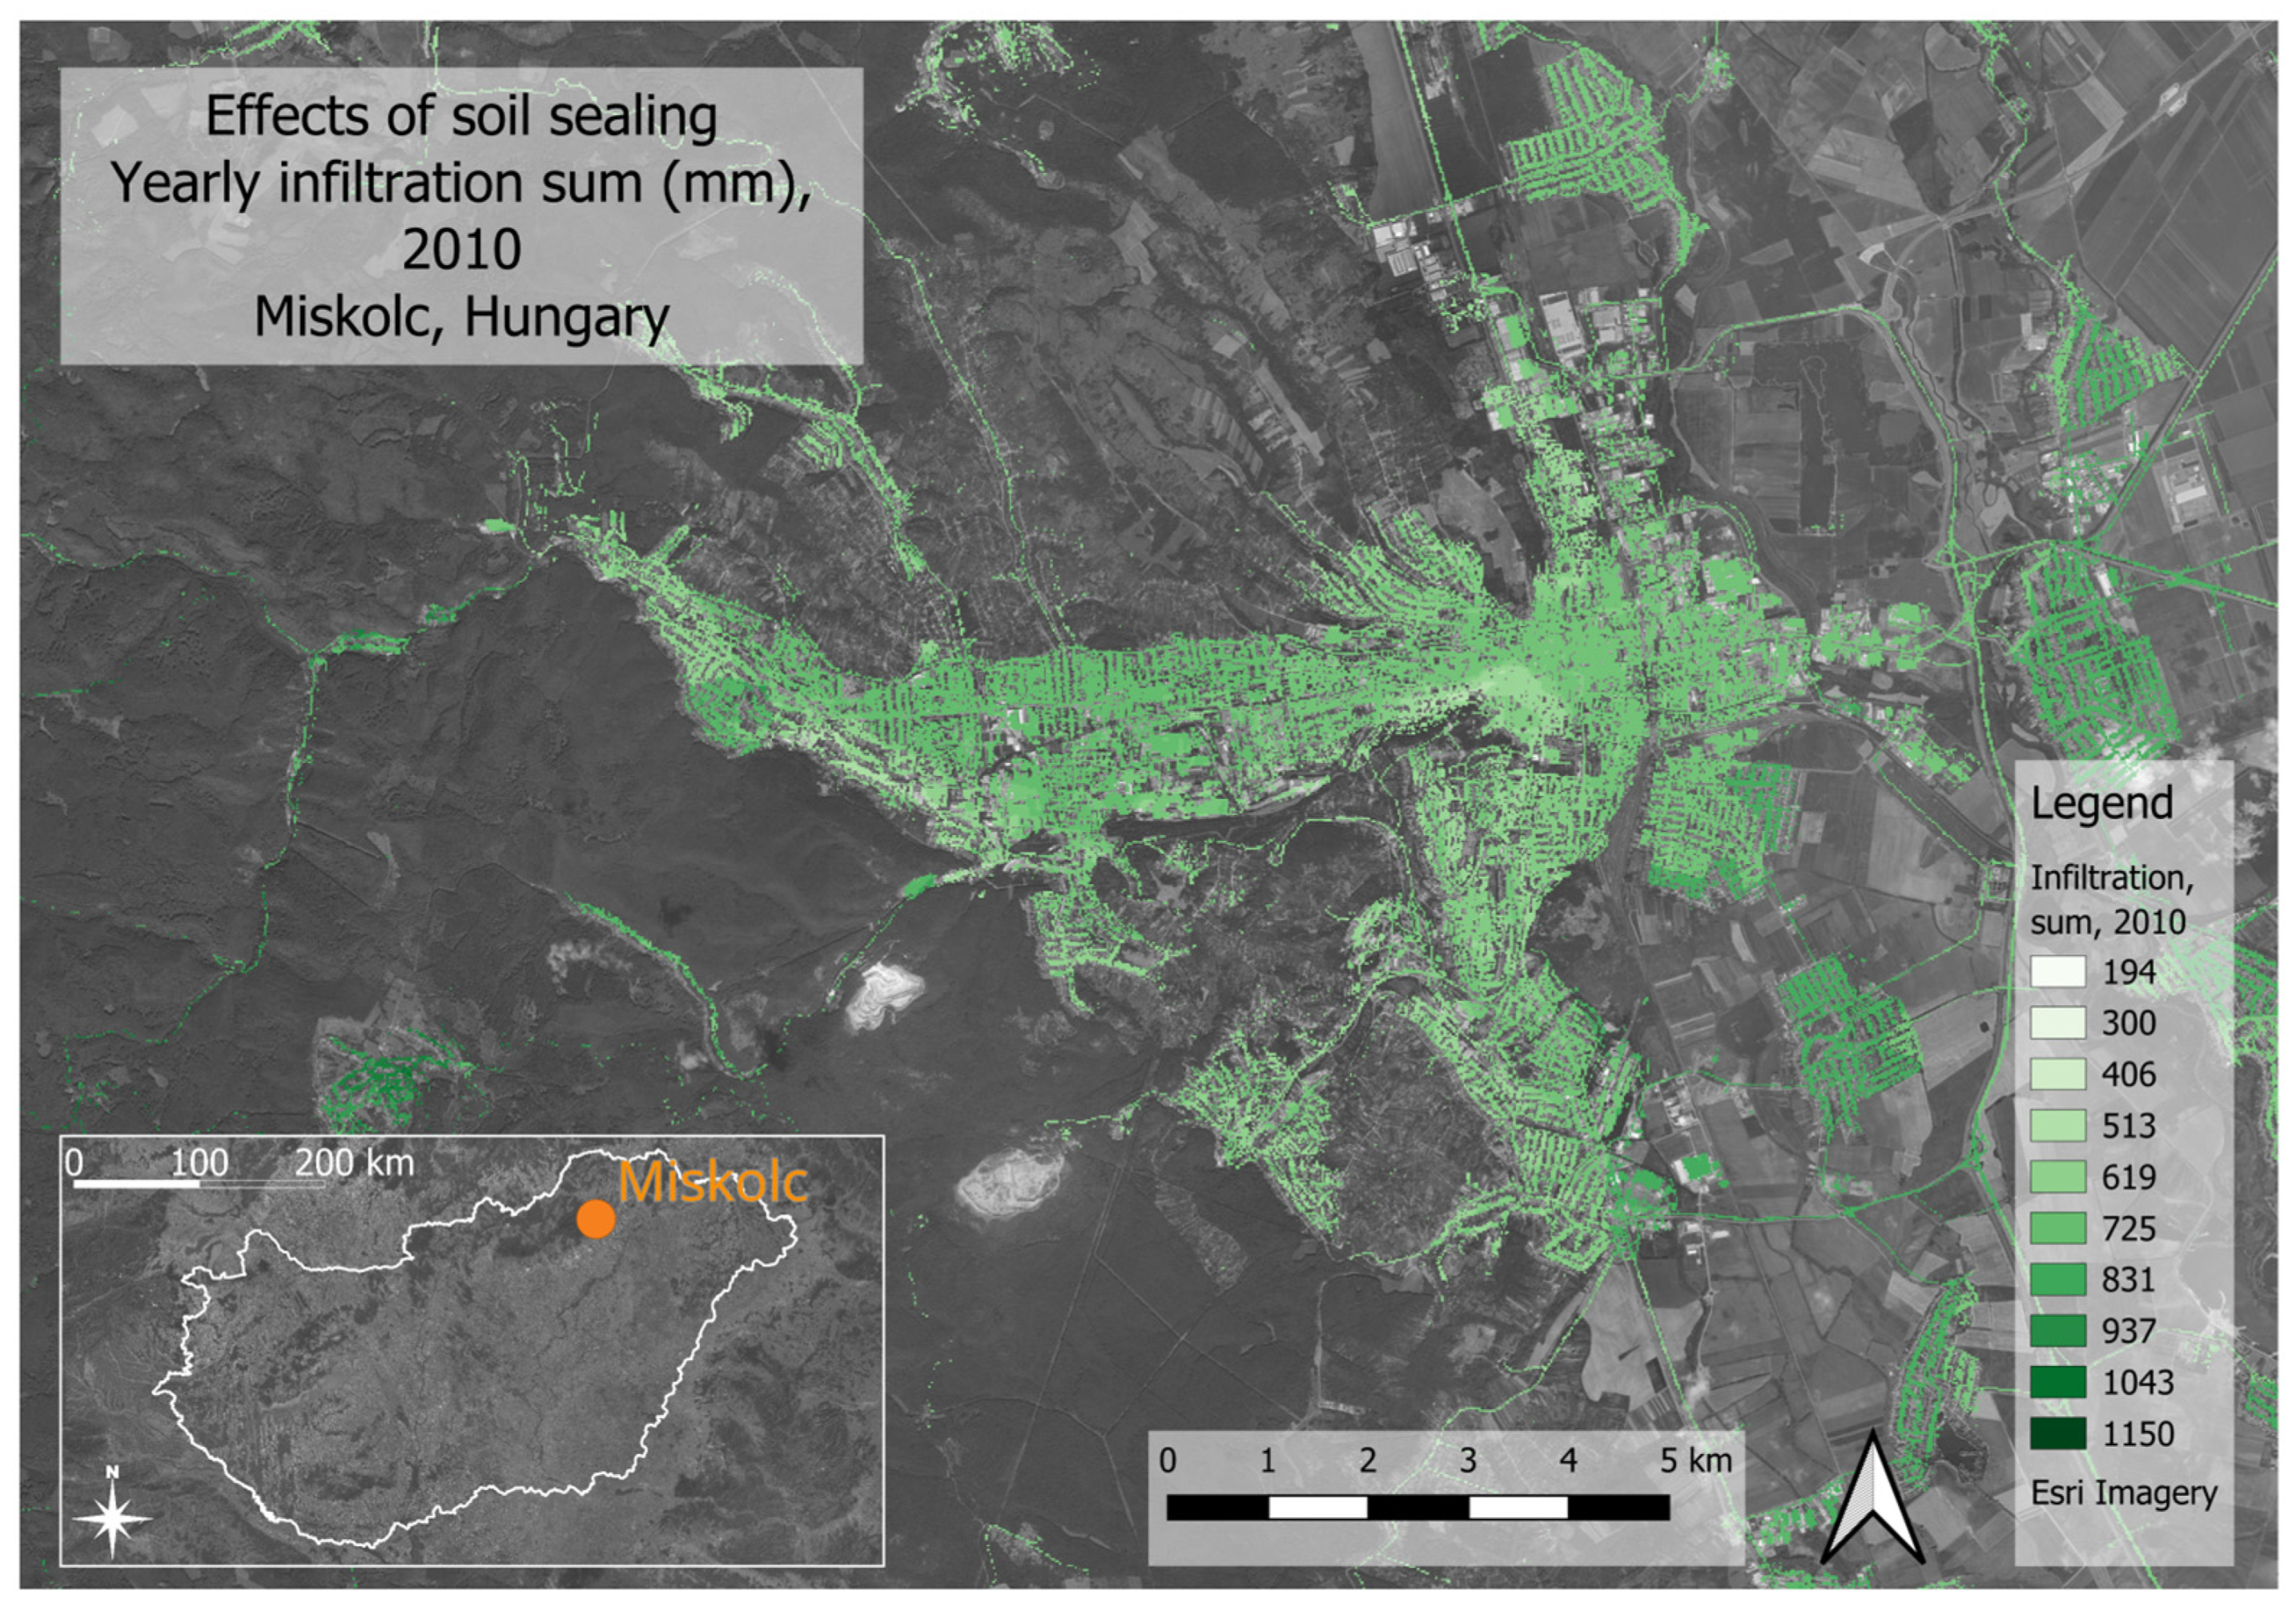
One of the key target capabilities of our methodology is presented in Figure 6, where an example is presented for the spatially explicit nature of our approach, for the region of the city of Miskolc in Hungary. Additional maps displaying other output variables are presented in the Supporting Materials (Figures S3–S9).

3.2. Global Statistics

As part of our methodology, our workflow has allowed us to calculate annual global statistics for the total sealed area of Hungary. Here we present some of these summary statistics for the extreme wet year of 2010 and the extreme dry year of 2022 (Table 3). These results clearly display that our model was able to capture the differences between these years and also present the total volume of selected fluxes.
In order to evaluate how long-term changes in climate would have affected these urban areas, we have performed the Mann–Kendall test on selected output parameters (Table 4), and the results indicate that there is only a significant increasing trend present in the number of Drought days.
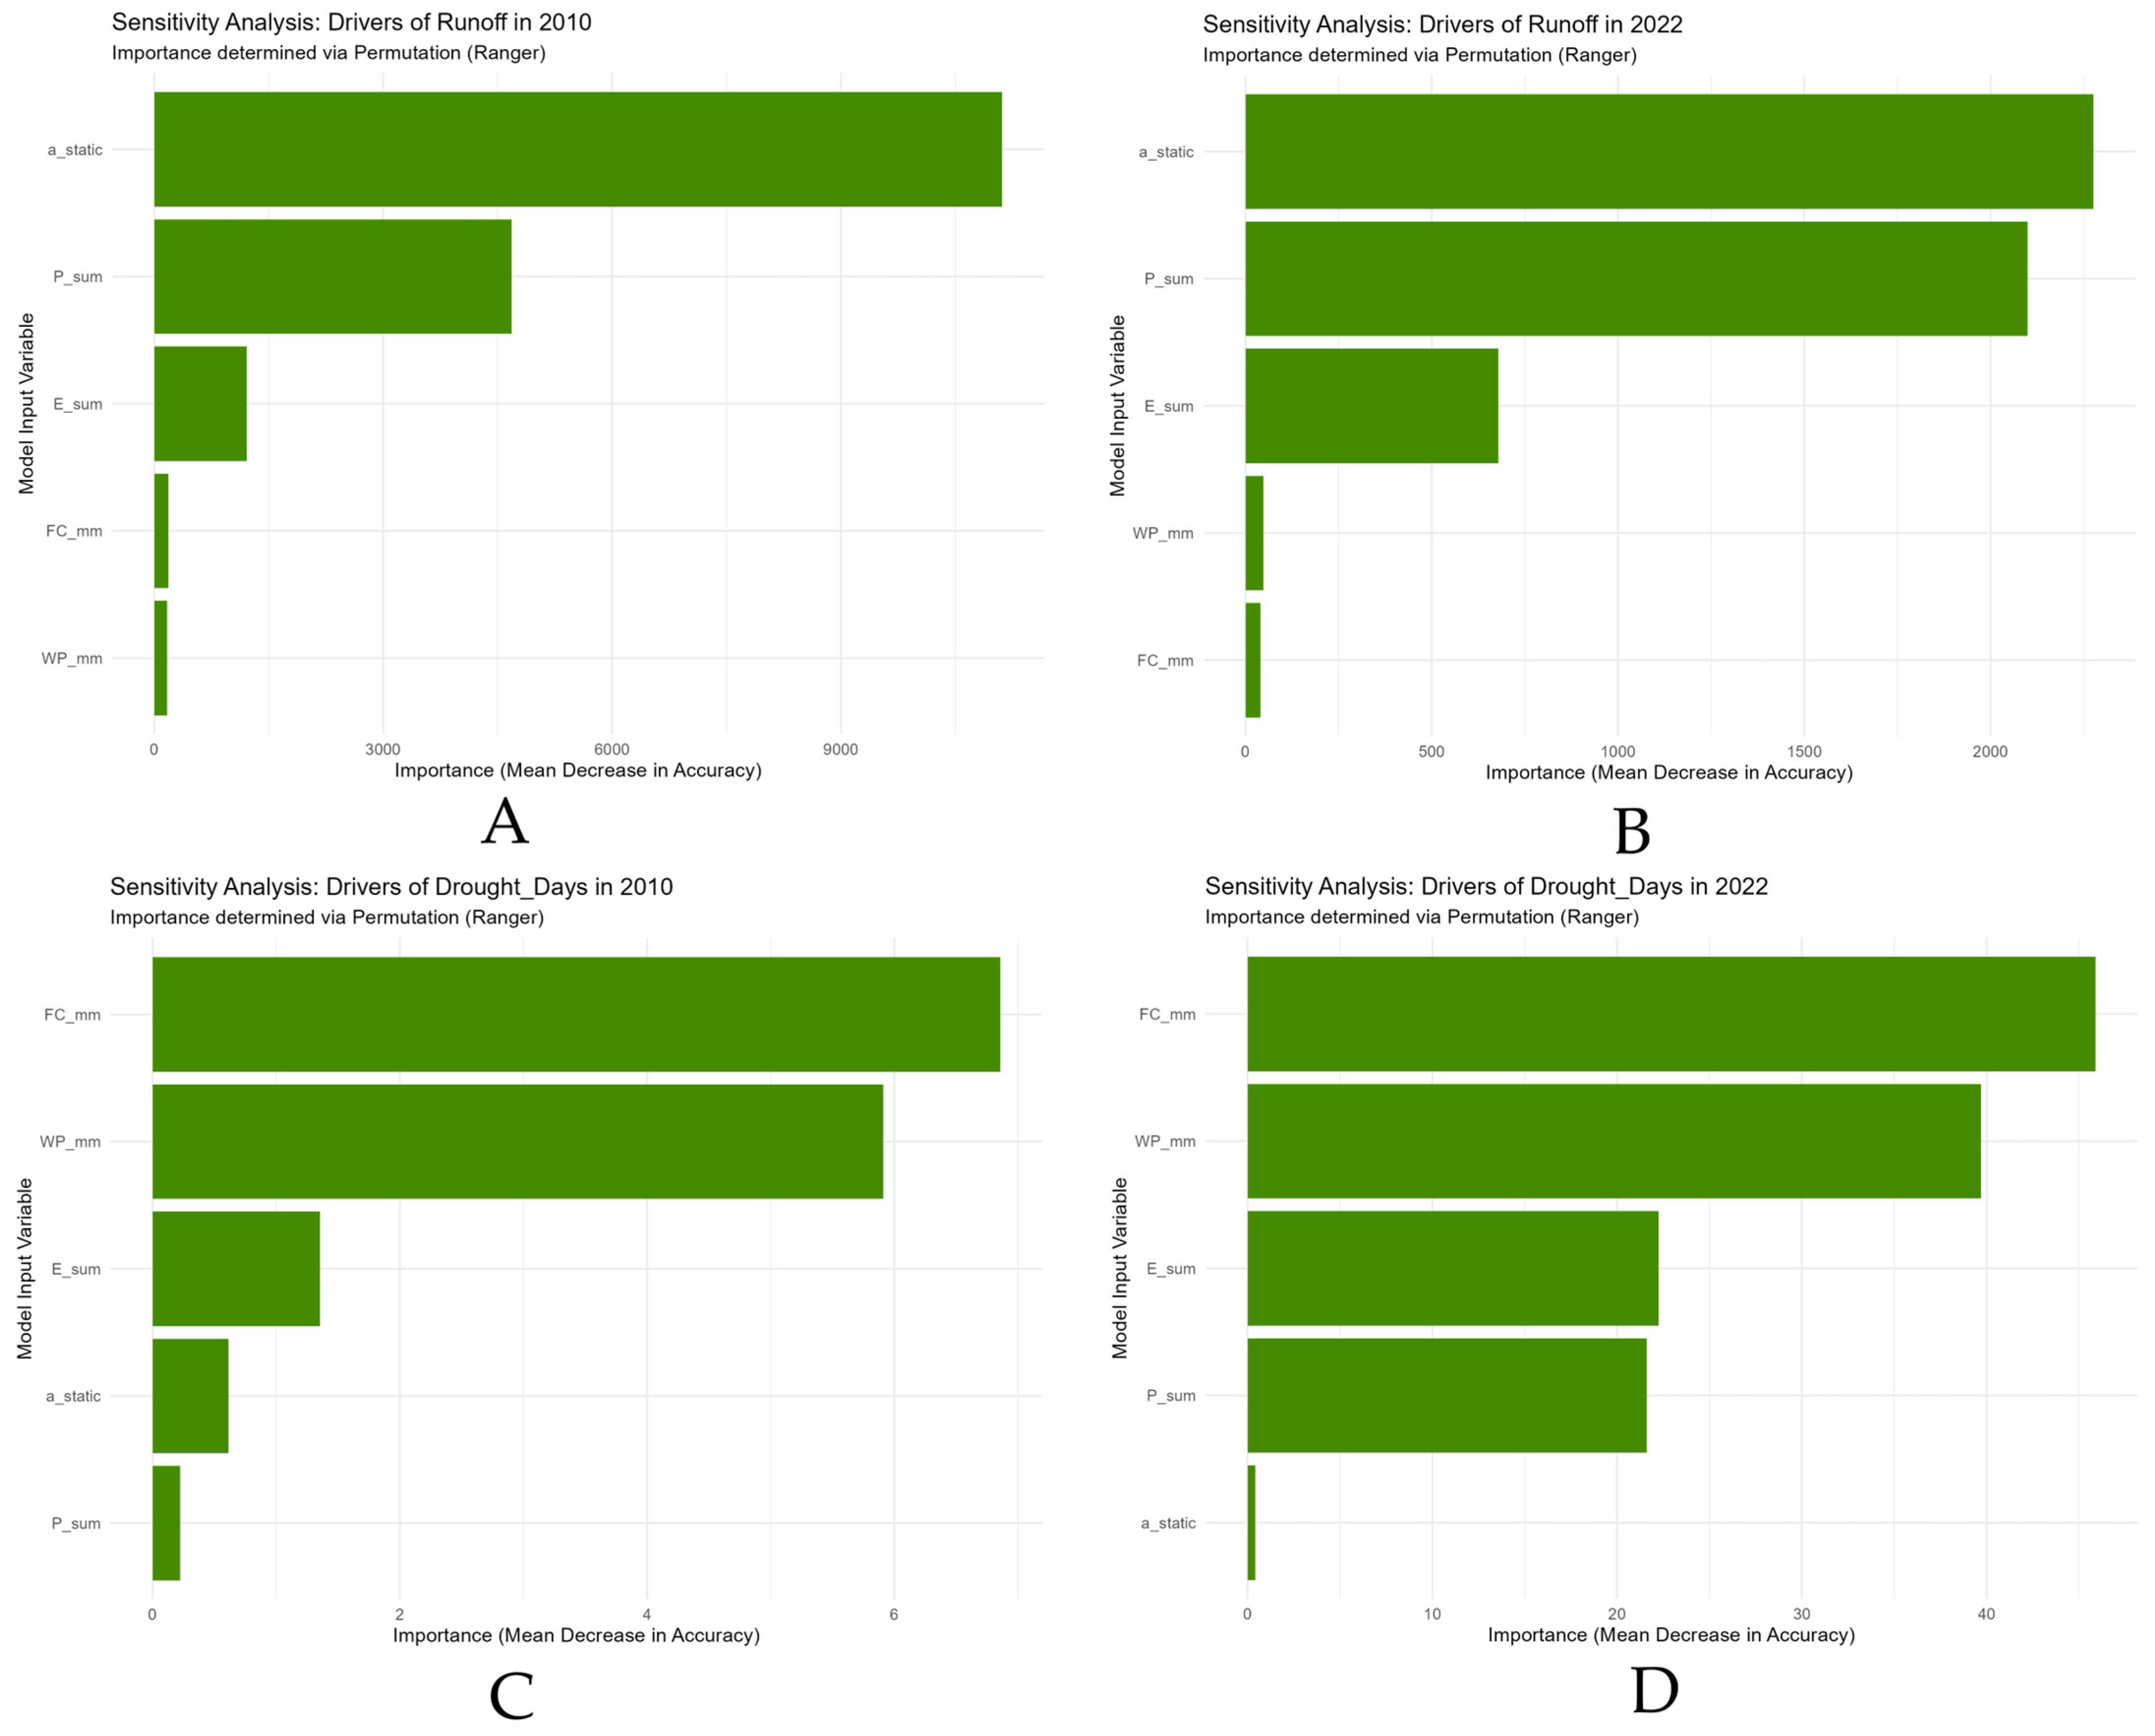
Results of the sensitivity analysis for the years 2010 and 2022 (carried out via Random Forest Regression) are displayed in Figure 7. Results indicate that the potential Runoff of the soils (Figure 7A,B) was primarily influenced by the applied runoff coefficient, followed by the meteorological data, independent of the year. However, when considering the number of “drought days” (days when SWC has reached the wilting point), the soil parameters (FC and WP) have gained increased weight (Figure 7C,D).
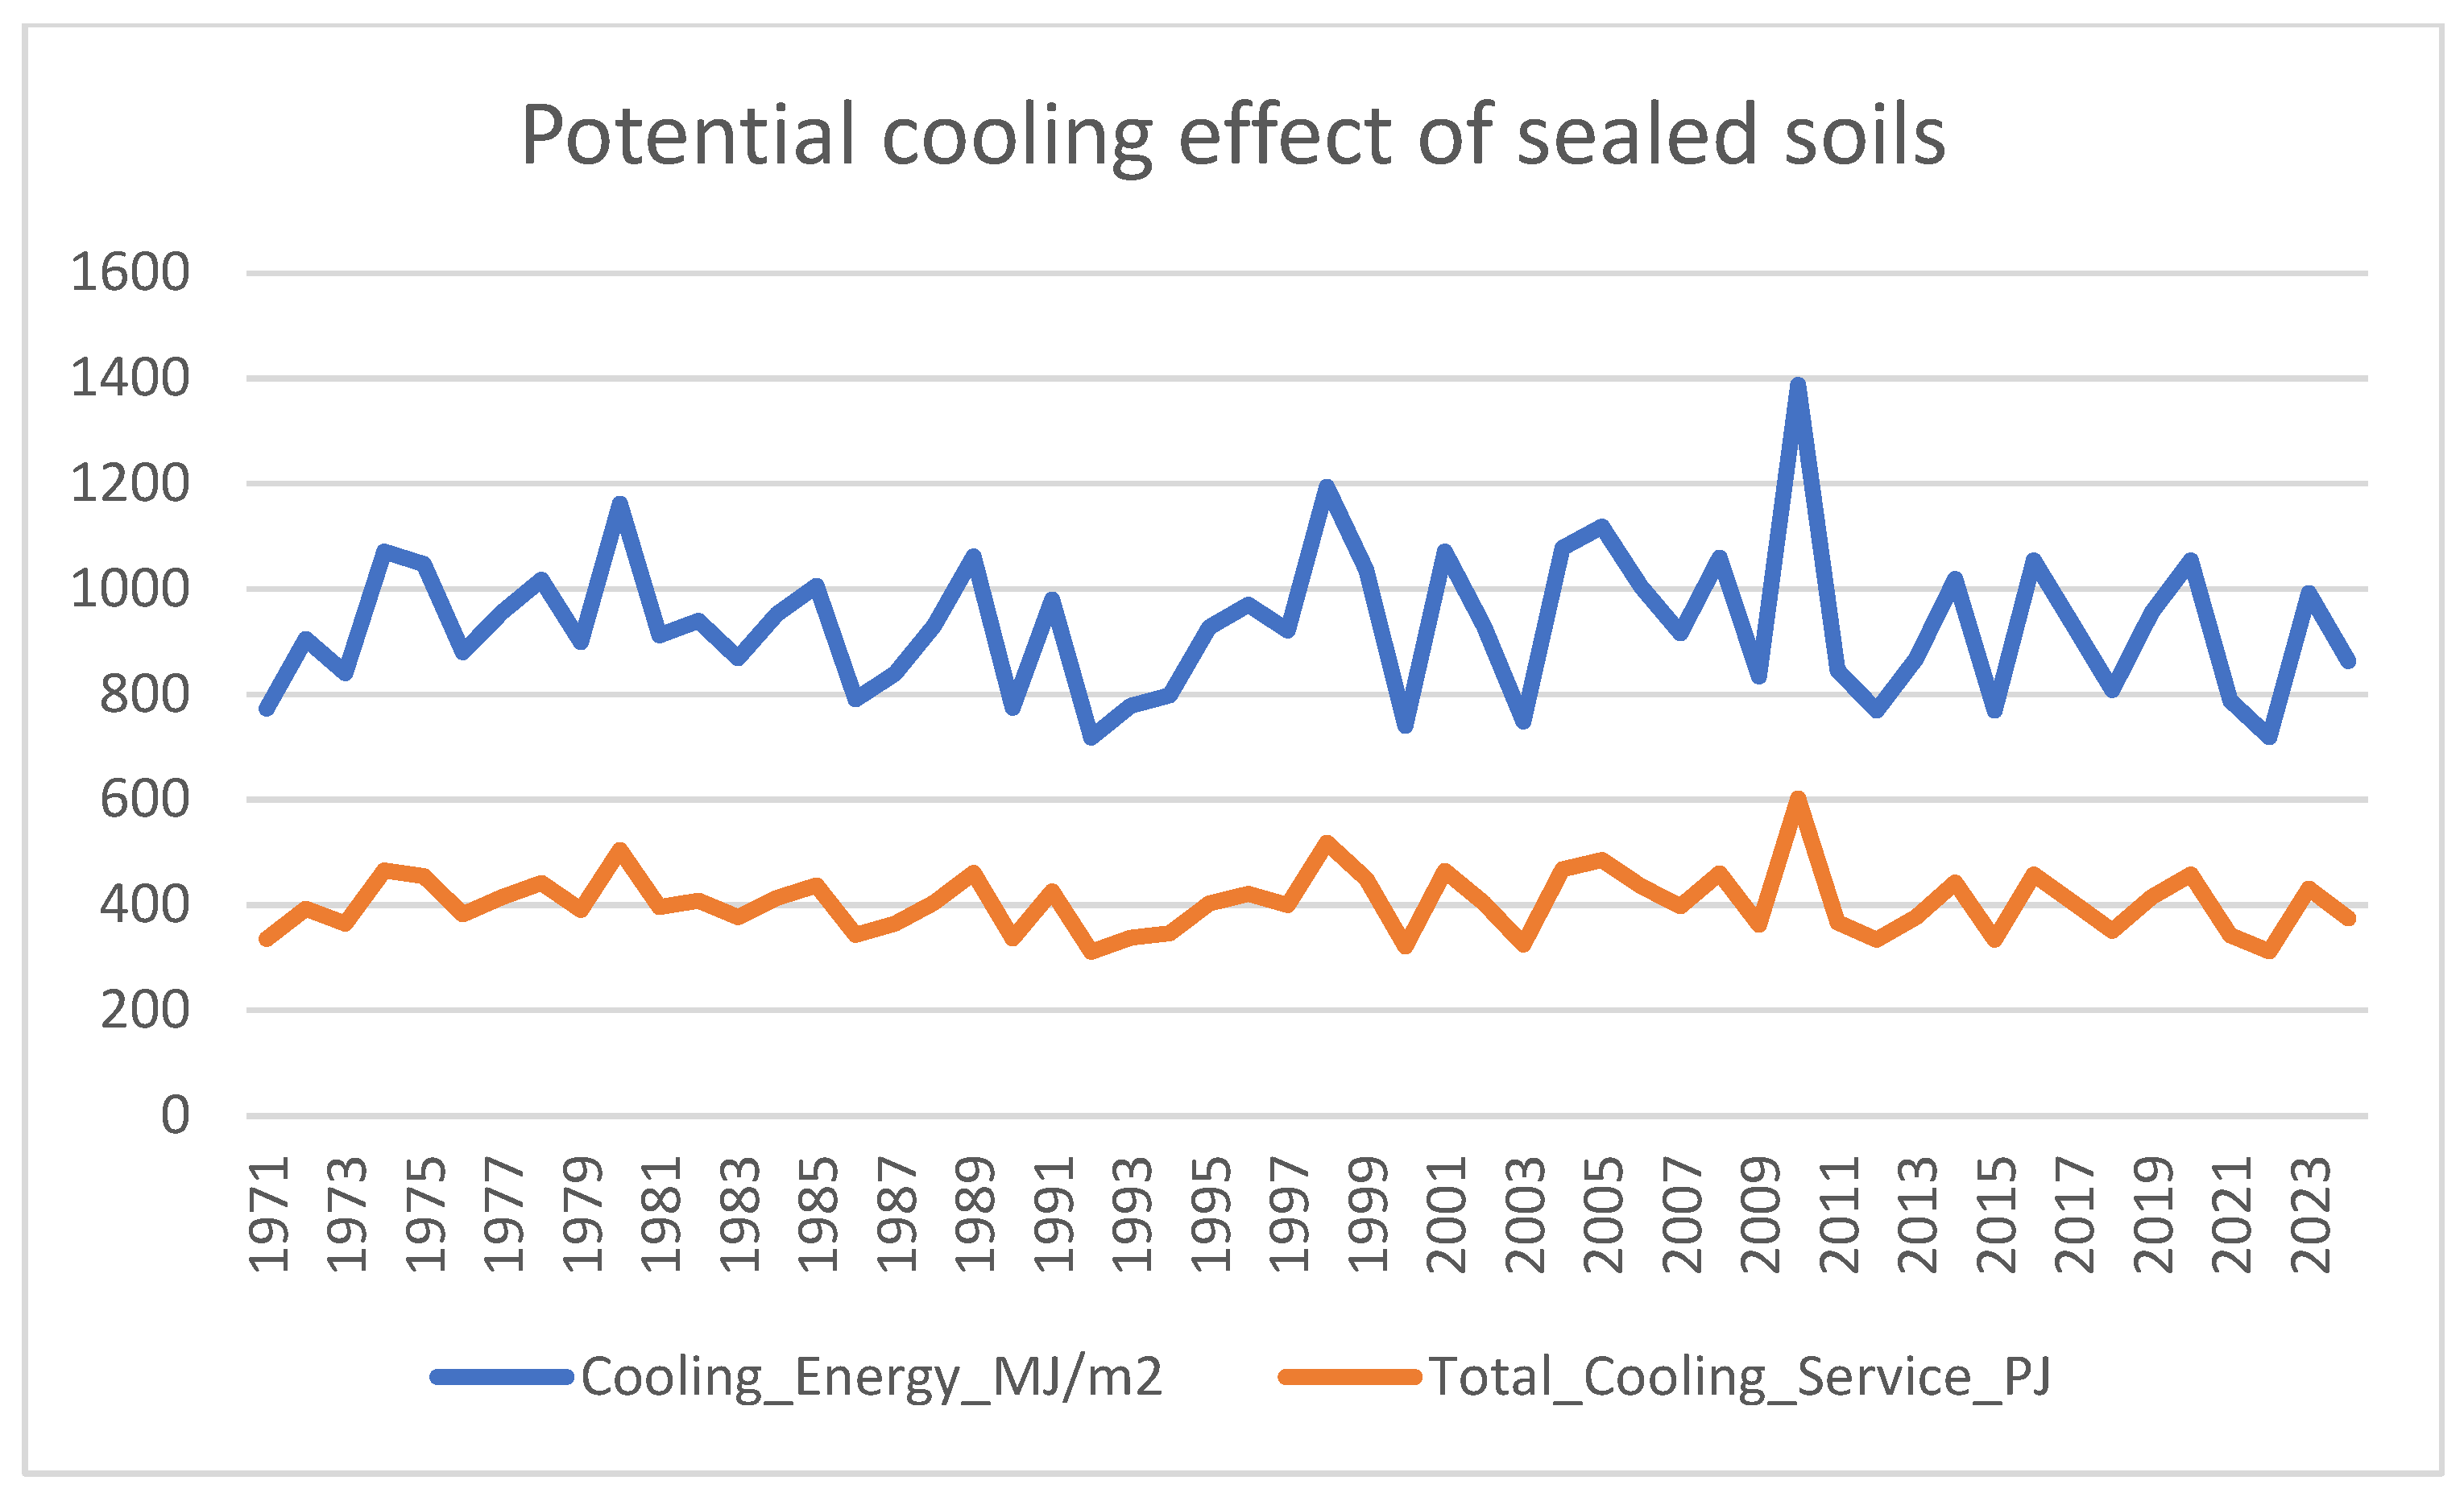
Figure 8 presents the energy potentially used to evaporate the water from these sealed soils, as well as the potential cooling effect at the national level. We can observe that the annual total cooling service would be (on average) around 400 PJ per year. Dividing this value by the 2760 km2 area of the estimated total area of sealed surfaces in Hungary, we can estimate an average of 0.145 PJ/km2 (or GJ/m2), which would equal 145 MJ/m2 cooling effect per year on a national average.

4. Discussion

The results presented indicate that the spatial and temporal aspects considered by our study indeed can be addressed by the applied methodology and demonstrate the potential for regional analysis. The time series of estimated soil water dynamics indicates that the model is robust and can perform at the national scale.
Based on the evaluation of model performance after the validation with point-based ground data, it is clear that the model does not capture the precise local dynamics of point-based locations. However, the application of local precipitation data has shown that while still far from perfectly capturing the daily dynamics, the model performed reasonably well (positive NSE and PBIAS values) for most stations at capturing annual mean values. This indicates that a significant part of the error in mode performance is associated with scale mismatch between the input data and the validation data, implying that at the level of application (national and regional level), the model is likely reasonably reliable at determining annual fluxes.
Our results show that even after the removal of impervious surfaces, runoff would still remain a significant factor. This underlines the importance of blue-green infrastructure and nature-based solutions in Hungarian urban environments. However, it is also clear that overall a larger proportion of the total annual rainfall could be utilized in these areas, highlighting the importance of soils as water reservoirs [12].
Based on our results, we can estimate that the soil surfaces we have already lost to urbanization would potentially allow between 0.14 and 0.29 km3 of water to infiltrate into the soil. This would equal about 7% of the estimated annual water withdrawal in Hungary [69]. The on-site evaporation from these surfaces would produce about 400 PJ of total cooling service. The resulting estimates of average cooling effect (145 MJ/m2), while not spatially explicit values, would still provide a useful baseline value for national estimates and further highlight the significance of soils in the mediation of the urban heat island effect.
The availability and quality of input data, as well as the relative simplicity of the applied methodology, carry obvious limitations of this study. Due to differences in spatial resolution of the utilized datasets, while the modeling itself was carried out in a spatially explicit way, the effects of spatial mismatch can clearly manifest when evaluating the output at a scale not supported by the input data. However, our validation results indicate that with the use of appropriately scaled input data, the model’s performance has improved significantly, indicating that the methods applied are physically sound and the quality of input data likely plays a critical role. Therefore, results from the present study should not be evaluated at the field level. Rather, they should be primarily utilized at the national and regional level, with possible indicative summary statistics applied at the level of larger municipalities.
The applied daily water balance calculation does not properly account for extreme precipitation events and their effects, as well as any sub-daily meteorological events or processes. The calculated runoff, therefore, is not an indicator of actual runoff potential and should not be utilized in order to calculate urban runoff, as it does not consider channel routing and drainage networks. The study aimed at utilizing openly accessible datasets, and therefore, the available soil information was not the best available. More detailed soil hydrological data could be obtained for Hungary from recently published alternative data sources [70].
Our results underline the potential effects of green surfaces in reducing the Urban Heat Island effect. While the current study only considered a grassed reference surface, increasing the proportion of tree canopy might carry additional benefits [71].
Sensitivity analysis of the results has revealed that the model was most sensitive to the runoff coefficient when determining runoff and deep percolation, while the importance of soil parameters has become higher when determining the number of drought days. The weight of climatic variables remained in both cases in the middle range. This demonstrates that the model sufficiently approximates the physical processes occurring in the soil.
Our findings provide a spatially explicit foundation for the regional demonstration of how reducing urban cover (through un-sealing the soil and/or the introduction of nature-based solutions), even just by introducing grass surfaces, can significantly regulate land surface temperature [72].

5. Conclusions

We have developed and applied a soil hydrological modeling framework for sealed urban surfaces in Hungary, estimating their underutilized potential for water retention. Model validation has indicated that while the model results were not comparable with local station-based monitoring data, they performed well at the scale appropriate for the input data. This emphasizes that while the estimates in the current study are reasonably well-founded at the country or regional level, field-based utilization of the results should be avoided, and should be based on other, locally based data and appropriately calibrated and validated model results.
Sensitivity analysis has revealed that the infiltration/runoff coefficient acted as a key variable in determining hydrological fluxes. However, the effect of droughts was more influenced by the soil parameters, underlining the importance of the soil as a natural water reservoir.
The primary aim of our study was to develop and apply a methodology to assess the “lost” potential of sealed urban surfaces in Hungary. Naturally, such undertakings can face significant limitations and challenges. In lieu of an extensive urban climate monitoring network, assumptions limiting model performance had to be made. The basic underlying assumption, that the current urban fabric would be completely removed, is obviously not a realistic one. However, our results might enable professionals of urban studies (such as spatial planners, urban designers, and landscape architects) to improve their planning process.
The presented results—while based on spatially explicit modeling—are generally founded on conservative calculations and likely carry a number of potential errors originating from the modeling framework and the utilized input data. Specific soil conditions and temporal variation in meteorological conditions are likely to result in differing results, and therefore, local data should be utilized when estimating the effects of specific projects, including nature-based solutions and blue-green infrastructure in urban areas. The soil moisture dynamics and the UHI effect both include inherently more complex processes, and these results should not be simply “downscaled” to address specific local issues.
Future work should focus on the application of more detailed and reliable data sources, particularly in the case of the soil data, where a recently developed national dataset would likely improve model accuracy [70].

Supplementary Materials

The following supporting information can be downloaded at: https://www.mdpi.com/article/10.3390/urbansci10070373/s1, Table S1: Detailed validation output for the comparison of solely grid-based model results with results utilizing point-based precipitation data at 15 monitoring stations across Hungary; Figure S1: Paired comparison of R2 for 15 hydrological validation stations;; Figure S2: Paired comparison of PBIAS for 15 hydrological validation stations; Figure S3: Drainage potential of sealed surfaces in the region of Miskolc, Hungary, for the year 2010; Figure S4: Drainage potential of sealed surfaces in the region of Miskolc, Hungary, for the year 2022; Figure S5: Evapotranspiration potential of sealed surfaces in the region of Miskolc, Hungary. for the year 2010; Figure S6: Evapotranspiration potential of sealed surfaces in the region of Miskolc, Hungary. for the year 2022; Figure S7: Infiltration potential of sealed surfaces in the region of Miskolc, Hungary, for the year 2022; Figure S8: Runoff potential of sealed surfaces in the region of Miskolc, Hungary, for the year 2010; Figure S9: Runoff potential of sealed surfaces in the region of Miskolc, Hungary, for the year 2022.

Author Contributions

Conceptualization, E.M., C.B. and I.W.; methodology, I.W. and T.R.; software, I.W.; validation, I.W. and L.B.; formal analysis, T.R. and L.B.; investigation, I.W. and G.H.; resources, G.H. and I.W.; data curation, I.W. and T.R.; writing—original draft preparation, I.W. and G.H.; writing—review and editing, M.A. and G.H.; visualization, I.W. and M.A.; supervision, E.M. and C.B.; project administration, C.B.; funding acquisition, C.B. All authors have read and agreed to the published version of the manuscript.

Funding

The research presented in the article was carried out within the framework of the Széchenyi Plan Plus program, with support from the RRF 2.3.1-21-2022-00008 project.

Institutional Review Board Statement

Not applicable.

Informed Consent Statement

Not applicable.

Data Availability Statement

While the study is primarily based on publicly available data sources (which are referenced in the text, the datasets presented (and R scripts used) in this article are not readily available because of ongoing additional analysis and studies. Requests to access the datasets should be directed to István Waltner at waltner.istvan@uni-mate.hu.

Acknowledgments

The database/analysis has been created using the Ecosystem Map of Hungary (project KEHOP-430-VEKOP-15-2016-00001, Ministry of Agriculture, 2019).

Conflicts of Interest

The authors declare no conflicts of interest. The funders had no role in the design of the study; in the collection, analyses, or interpretation of data; in the writing of the manuscript; or in the decision to publish the results.

Abbreviations

The following abbreviations are used in this manuscript:
Acellthe total area of a single grid cell
AWAvailable water
CStotalTotal Cooling Service
DDeep percolation/groundwater recharge
DEMDigital Elevation Model
ET0—(mm)reference evapotranspiration
ETactActual evapotranspiration
FCField Capacity
IInfiltration
Llatent heat of vaporization
NSENash-Sutcliffe efficiency
ODWSMSOperational Drought and Water Scarcity Management System
OVFGeneral Directorate of Water Management of Hungary
PPrecipitation
PBIASpercent bias
RRunoff
SEDSpecific Cooling Energy Density
SWCSoil Water Content
UHIUrban Heat Island
V/V%volumetric water content
WPWilting Point
α1slope component
α2soil component
α3plant/crop cover component
αdyndynamic runoff coefficient
αstaticstatic runoff coefficient
Ksstress coefficient
Ēsumweighted mean of annual evapotranspiration

References

  1. Howard, L. The Climate of London: Deduced from Meteorological Observations Made in the Metropolis and at Various Places Around It; Cambridge University Press: Cambridge, UK, 1833. [Google Scholar]
  2. Silvina Fenoglio, M.; Rosa Rossetti, M.; Videla, M. Negative Effects of Urbanization on Terrestrial Arthropod Communities: A Meta-Analysis. Glob. Ecol. Biogeogr. 2020, 29, 1412–1429. [Google Scholar] [CrossRef]
  3. Macha, F.J.; Kalogerakis, G.; Quevedo, A.C.; Liao, W.; Hamilton, B.M.; Robinson, S.A.; Tufenkji, N. Urban Runoff Toxicity to Aquatic Species: Physiological and Biomarker Responses with Toxicant Characterization. Environ. Sci. Technol. 2026, 60, 2832–2849. [Google Scholar] [CrossRef] [PubMed]
  4. Qian, Y.; Chakraborty, T.C.; Li, J.; Li, D.; He, C.; Sarangi, C.; Chen, F.; Yang, X.; Leung, L.R. Urbanization Impact on Regional Climate and Extreme Weather: Current Understanding, Uncertainties, and Future Research Directions. Adv. Atmos. Sci. 2022, 39, 819–860. [Google Scholar] [CrossRef] [PubMed]
  5. Bounoua, L.; Boukachaba, N.; Serbin, S.P.; Thome, K.J.; Ed-Dahmany, N.; Lachkham, M.A. Beyond the Urban Heat Island: A Global Metric for Urban-Driven Climate Warming. Urban Sci. 2026, 10, 6. [Google Scholar] [CrossRef]
  6. Bashar, T.; Uddin, M.Z. Effects of Land Use Change on Surface Runoff and Infiltration: The Case of Dhaka City. Urban Sci. 2025, 9, 497. [Google Scholar] [CrossRef]
  7. Kabisch, N.; Pueffel, C.; Masztalerz, O.; Hemmerling, J.; Kraemer, R. Physiological and Psychological Effects of Visits to Different Urban Green and Street Environments in Older People: A Field Experiment in a Dense Inner-City Area. Landsc. Urban Plan. 2021, 207, 103998. [Google Scholar] [CrossRef]
  8. Farkas, J.Z.; Hoyk, E.; de Morais, M.B.; Csomos, G. A Systematic Review of Urban Green Space Research over the Last 30 Years: A Bibliometric Analysis. Heliyon 2023, 9, e13406. [Google Scholar] [CrossRef] [PubMed]
  9. Semeraro, T.; Scarano, A.; Pandey, R. Ecosystem Services Analysis and Design through Nature-Based Solutions in Urban Planning at a Neighbourhood Scale. Urban Sci. 2022, 6, 23. [Google Scholar] [CrossRef]
  10. Zhang, L.; Wang, S.; Zhai, W.; He, Z.; Shi, W.; Li, Y.; Zhao, C. How Does Blue-Green Infrastructure Affect the Urban Thermal Environment across Various Functional Zones? Urban For. Urban Green. 2025, 105, 128698. [Google Scholar] [CrossRef]
  11. Liu, Y.; Chen, H.; Wu, J.; Wang, Y.; Ni, Z.; Chen, S. Impact of Urban Spatial Dynamics and Blue-Green Infrastructure on Urban Heat Islands: A Case Study of Guangzhou Using Local Climate Zones and Predictive Modeling. Sustain. Cities Soc. 2024, 115, 105819. [Google Scholar] [CrossRef]
  12. Várallyay, G. Soils, as the Most Important Natural Resources in Hungary (Potentialities and Constraints)—A Review. Agrokem 2015, 64, 321–338. [Google Scholar] [CrossRef]
  13. Báder, L.; Ungvári, G. A városi hőszigethatás mérséklése a párolgás növelésével. Tájökológiai Lapok 2022, 20, 5–22. [Google Scholar] [CrossRef]
  14. Abidli, M.; Halupka, G.; Waltner, I. Assessment of Soil Microclimate in an Urban Park of Budapest, Hungary. Időjárás 2024, 128, 327–344. [Google Scholar] [CrossRef]
  15. Novák, T.J.; Horváth, A.; Csákiné Michéli, E.; Fuchs, M. Antropogén Tényezők, Folyamatok És Bélyegek Megjelenése És Rendszerezése a Talajok Osztályozásában. Agrokem 2025, 74, 160–187. [Google Scholar] [CrossRef]
  16. Szolnoki, Z.; Farsang, A.; Puskás, I. Cumulative Impacts of Human Activities on Urban Garden Soils: Origin and Accumulation of Metals. Environ. Pollut. 2013, 177, 106–115. [Google Scholar] [CrossRef] [PubMed]
  17. Tóth, G.; Ivits, E.; Prokop, G.; Gregor, M.; Fons-Esteve, J.; Milego Agràs, R.; Mancosu, E. Impact of Soil Sealing on Soil Carbon Sequestration, Water Storage Potentials and Biomass Productivity in Functional Urban Areas of the European Union and the United Kingdom. Land 2022, 11, 840. [Google Scholar] [CrossRef]
  18. Gelybó, G.; Tóth, E.; Farkas, C.; Horel, Á.; Kása, I.; Bakacsi, Z. Potential Impacts of Climate Change on Soil Properties. Agrokémia És Talajt. 2018, 67, 121–141. [Google Scholar] [CrossRef]
  19. Jakab, G.; Németh, T.; Csepinszky, B.; Madarász, B.; Szalai, Z.; Kertész, Á. The influence of short term soil sealing and crusting on hydrology and erosion at Balaton Uplands, Hungary. Carpathian J. Earth Environ. Sci. 2013, 8, 147–155. [Google Scholar]
  20. Blanka-Végi, V.; Tobak, Z.; Sipos, G.; Barta, K.; Szabó, B.; van Leeuwen, B. Estimation of the Spatiotemporal Variability of Surface Soil Moisture Using Machine Learning Methods Integrating Satellite and Ground-Based Soil Moisture and Environmental Data. Water Resour. Manag. 2025, 39, 2317–2334. [Google Scholar] [CrossRef]
  21. Barros, V.D.D.; Waltner, I.; Minoarimanana, R.A.; Halupka, G.; Sándor, R.; Kaldybayeva, D.; Gelybó, G. SpatialAquaCrop, an R Package for Raster-Based Implementation of the AquaCrop Model. Plants 2022, 11, 2907. [Google Scholar] [CrossRef] [PubMed]
  22. Horel, Á.; Cseresnyés, I.; Zagyva, I.; Zsigmond, T. Soil Moisture Content and Plant Health Monitoring under Different Inter-Row Cropping Vineyard. Plant Soil 2025, 515, 701–716. [Google Scholar] [CrossRef]
  23. Ladányi, Z.; Barta, K.; Blanka, V.; Pálffy, B. Assessing Available Water Content of Sandy Soils to Support Drought Monitoring and Agricultural Water Management. Water Resour. Manag. 2021, 35, 869–880. [Google Scholar] [CrossRef]
  24. Iváncsics, V.; Kovács, K.F. A városi növekedés területhasználati és morfológiai aspektusai 12 hazai város példáján. Tájökológiai Lapok 2024, 22, 36–54. [Google Scholar] [CrossRef]
  25. Balázs, D.; Fazekas, I.; Mester, T. Assessment of Long-Term Land Cover Changes and Urban Expansion in Cities of the Hungarian Great Plain Using CORINE Data and Historical Maps. Land 2025, 14, 1153. [Google Scholar] [CrossRef]
  26. Allaga-Zsebeházi, G. Future Temperature and Urban Heat Island Changes in Budapest: A Comparative Study Based on the HMS-ALADIN and SURFEX Models. Időjárás 2021, 125, 675–692. [Google Scholar] [CrossRef]
  27. Ozturk, S.; Yilmaz, K.; Dincer, A.E.; Kalpakci, V. Effect of Urbanization on Surface Runoff and Performance of Green Roofs and Permeable Pavement for Mitigating Urban Floods. Nat. Hazards 2024, 120, 12375–12399. [Google Scholar] [CrossRef]
  28. Chahar, B.R.; Graillot, D.; Gaur, S. Storm-Water Management through Infiltration Trenches. J. Irrig. Drain. Eng. 2012, 138, 274–281. [Google Scholar] [CrossRef]
  29. Huang, H.; Tian, Y.; Wei, M.; Jia, X.; Wang, P.; Ackerman, A.C.; Chatterjee, S.G.; Liu, Y.; Tian, G. A Theoretical Nonlinear Regression Model of Rainfall Surface Flow Accumulation and Basin Features in Park-Scale Urban Green Spaces Based on LiDAR Data. Water 2023, 15, 2442. [Google Scholar] [CrossRef]
  30. Costa, S.; Peters, R.; Martins, R.; Postmes, L.; Keizer, J.J.; Roebeling, P. Effectiveness of Nature-Based Solutions on Pluvial Flood Hazard Mitigation: The Case Study of the City of Eindhoven (The Netherlands). Resources 2021, 10, 24. [Google Scholar] [CrossRef]
  31. Schroeder, D.W.; Tsegaye, S.; Singleton, T.L.; Albrecht, K.K. GIS- and ICPR-Based Approach to Sustainable Urban Drainage Practices: Case Study of a Development Site in Florida. Water 2022, 14, 1557. [Google Scholar] [CrossRef]
  32. Zhou, Q.; Leng, G.; Su, J.; Ren, Y. Comparison of Urbanization and Climate Change Impacts on Urban Flood Volumes: Importance of Urban Planning and Drainage Adaptation. Sci. Total Environ. 2019, 658, 24–33. [Google Scholar] [CrossRef] [PubMed]
  33. Wang, Y.; Liu, X.; Xiao, Z.; Wang, Y.; Ma, Y.; Huang, J.; An, Y.; Li, B. Evolution Mechanism of the Flash Flood-Debris Flow Disaster Chain Triggered by High-Elevation Shallow Landslides: A Case Study of the Huangya Gully Event in Yuzhong, China, on August 7, 2025. Landslides 2026, 23, 1981–1997. [Google Scholar] [CrossRef]
  34. Feng, B.; Zhang, Y.; Bourke, R. Urbanization Impacts on Flood Risks Based on Urban Growth Data and Coupled Flood Models. Nat. Hazards 2021, 106, 613–627. [Google Scholar] [CrossRef]
  35. Poozan, A.; Fletcher, T.D.; Arora, M.; Western, A.W.; Burns, M.J. The Influence of Spatial Arrangement and Site Conditions on the Fate of Infiltrated Stormwater. J. Hydrol. 2024, 630, 130738. [Google Scholar] [CrossRef]
  36. Logsdon, S.D.; Sauer, P. Improved or Unimproved Urban Areas Effect on Soil and Water Quality. Water 2017, 9, 247. [Google Scholar] [CrossRef]
  37. Rosmadi, H.S.B.; Ahmed, M.F.; Mokhtar, M.B.; Halder, B.; Scholz, M. Nature-Based Solutions (NbS) for Flood Management in Malaysia. Water 2024, 16, 3606. [Google Scholar] [CrossRef]
  38. Chaves, M.T.R.; Farias, T.R.L.; Eloi, W.M. Comparative Analysis of Bioretention Design Strategies for Urban Runoff Infiltration: A Critical Overview. Ecol. Eng. 2024, 207, 107352. [Google Scholar] [CrossRef]
  39. Zhang, J.; Peralta, R.C. Estimating Infiltration Increase and Runoff Reduction Due to Green Infrastructure. J. Water Clim. Chang. 2019, 10, 237–242. [Google Scholar] [CrossRef]
  40. Xu, Z.; Xiong, L.; Li, H.; Xu, J.; Cai, X.; Chen, K.; Wu, J. Runoff Simulation of Two Typical Urban Green Land Types with the Stormwater Management Model (SWMM): Sensitivity Analysis and Calibration of Runoff Parameters. Environ. Monit. Assess. 2019, 191, 343. [Google Scholar] [CrossRef] [PubMed]
  41. Ugolini, F.; Baronti, S.; Lanini, G.M.; Maienza, A.; Ungaro, F.; Calzolari, C. Assessing the Influence of Topsoil and Technosol Characteristics on Plant Growth for the Green Regeneration of Urban Built Sites. J. Environ. Manag. 2020, 273, 111168. [Google Scholar] [CrossRef] [PubMed]
  42. Fini, A.; Frangi, P.; Mori, J.; Donzelli, D.; Ferrini, F. Nature Based Solutions to Mitigate Soil Sealing in Urban Areas: Results from a 4-Year Study Comparing Permeable, Porous, and Impermeable Pavements. Environ. Res. 2017, 156, 443–454. [Google Scholar] [CrossRef] [PubMed]
  43. Piotrowska-Dlugosz, A.; Charzynski, P. The Impact of the Soil Sealing Degree on Microbial Biomass, Enzymatic Activity, and Physicochemical Properties in the Ekranic Technosols of Torun (Poland). J. Soils Sediments 2015, 15, 47–59. [Google Scholar] [CrossRef]
  44. Jeong, A. Sediment Accumulation Expectations for Growing Desert Cities: A Realistic Desired Outcome to Be Used in Constructing Appropriately Sized Sediment Storage of Flood Control Structures. Environ. Res. Lett. 2019, 14, 125005. [Google Scholar] [CrossRef]
  45. Salvati, L. The Spatial Pattern of Soil Sealing along the Urban-Rural Gradient in a Mediterranean Region. J. Environ. Plan. Manag. 2014, 57, 848–861. [Google Scholar] [CrossRef]
  46. Rodriguez-Rojas, M.; Grindlay Moreno, A.L. A Discussion on the Application of Terminology for Urban Soil Sealing Mitigation Practices. Int. J. Environ. Res. Public Health 2022, 19, 8713. [Google Scholar] [CrossRef] [PubMed]
  47. Xiao, R.; Jiang, D.; Christakos, G.; Fei, X.; Wu, J. Soil Landscape Pattern Changes in Response to Rural Anthropogenic Activity across Tiaoxi Watershed, China. PLoS ONE 2016, 11, e0166224. [Google Scholar] [CrossRef] [PubMed]
  48. Dutta, J.; Choudhury, R.; Nath, B. Quantification of Urban Groundwater Recharge: A Case Study of Rapidly Urbanizing Guwahati City, India. Urban Sci. 2024, 8, 187. [Google Scholar] [CrossRef]
  49. Mustafa, A.; Szydłowski, M.; Qarani Aziz, S. Optimizing Impervious Surface Distribution and Rainwater Harvesting for Urban Flood Resilience in Semi-Arid Regions. Urban Sci. 2025, 9, 523. [Google Scholar] [CrossRef]
  50. Kang, Z.; Liu, H.; Lu, Y.; Yang, X.; Zhou, X.; An, J.; Yan, D.; Jin, X.; Shi, X. A Novel Approach to Examining the Optimal Use of the Cooling Effect of Water Bodies in Urban Planning. Build. Environ. 2023, 243, 110673. [Google Scholar] [CrossRef]
  51. Bibri, S.E. Eco-Districts and Data-Driven Smart Eco-Cities: Emerging Approaches to Strategic Planning by Design and Spatial Scaling and Evaluation by Technology. Land Use Policy 2022, 113, 105830. [Google Scholar] [CrossRef]
  52. Kocsis, K.; Keresztesi, Z.; Nemerkényi, Z.; Gercsák, G.; Kovács, Z.; Kincses, Á.; Tóth, G.; Horváth, G.; Ádám, S.; Agárdi, N.; et al. National Atlas of Hungary; Hungarian Academy of Sciences: Budapest, Hungary, 2018. [Google Scholar]
  53. Lakatos, M.; Izsák, B.; Szentes, O.; Hoffmann, L.; Kircsi, A.; Bihari, Z. Return Values of 60-Minute Extreme Rainfall for Hungary. Időjárás 2020, 124, 143–156. [Google Scholar] [CrossRef]
  54. Tóth, B.; Weynants, M.; Pásztor, L.; Hengl, T. 3D Soil Hydraulic Database of Europe at 250 m Resolution. Hydrol. Process. 2017, 31, 2662–2666. [Google Scholar] [CrossRef]
  55. Agrárminisztérium. Agrárminisztérium Development of an Ecosystem Basemap and Data Model: Ecosystem Basemap of Hungary, Documentation. (In Hungarian: Ökoszisztéma Alaptérkép És Adatmodell Kialakítása: Magyarország Ökoszisztéma Alaptérképe, Dokumentáció); Agrárminisztérium: Budapest, Hungary, 2019. [CrossRef]
  56. European Space Agency. Airbus Copernicus DEM; European Space Agency: Paris, France, 2022. [Google Scholar]
  57. Hungarian Meteorological Service (HungaroMET) Meteorological Database. Available online: https://odp.met.hu/ (accessed on 30 December 2025).
  58. Fiala, K.; Harsányi, E.; Gaál, M.; Tarjáni, G. Operatív aszály- és vízhiánykezelő monitoring rendszer [Operational drought and water scarcity monitoring system]. Hidrológiai Közlöny [J. Hung. Hydrol. Soc.] 2018, 98, 14–24. [Google Scholar]
  59. Raes, D.; Steduto, P.; Hsiao, T.C.; Fereres, E. Chapter 3 Calculation Procedures. In AquaCrop Version 7.1 Reference Manual; Food and Agriculture Organization of the United Nations: Rome, Italy, 2023. [Google Scholar]
  60. Kenessey, B. Runoff Coefficients and Retentions. A Hydrological Study. (In Hungarian: Lefolyási Tényezők És Retenciók. Hidrológiai Tanulmány). Vízügyi Közlemények 1930, 1, 55–76. [Google Scholar]
  61. Guizani, D.; Buday-Bódi, E.; Tamás, J.; Nagy, A. Land Cover Modelling with Sentinel 2 in Water Balance Calculations of Urban Sites. JCEGI 2023, 11, 70–83. [Google Scholar] [CrossRef]
  62. Hargreaves, G.H.; Samani, Z.A. Samani Reference Crop Evapotranspiration from Temperature. Appl. Eng. Agric. 1985, 1, 96–99. [Google Scholar] [CrossRef]
  63. Olaya, V. Chapter 6 Basic Land-Surface Parameters. In Developments in Soil Science; Elsevier: Amsterdam, The Netherlands, 2009; Volume 33, pp. 141–169. ISBN 978-0-12-374345-9. [Google Scholar]
  64. Conrad, O.; Bechtel, B.; Bock, M.; Dietrich, H.; Fischer, E.; Gerlitz, L.; Wehberg, J.; Wichmann, V.; Böhner, J. System for Automated Geoscientific Analyses (SAGA) v. 2.1.4. Geosci. Model Dev. 2015, 8, 1991–2007. [Google Scholar] [CrossRef]
  65. HUN-REN Institute for Soil Sciences. AGROTOPO: Spatial Soil Information System at a Scale of 1:100,000 [Data Set]. Institute for Soil Sciences, Centre for Agricultural Research. Available online: https://maps.rissac.hu:3344/webappbuilder/apps/2/ (accessed on 4 June 2026).
  66. Datt, P. Latent Heat of Vaporization/Condensation. In Encyclopedia of Snow, Ice and Glaciers; Springer: Dordrecht, The Netherlands, 2011; p. 703. ISBN 978-90-481-2642-2. [Google Scholar]
  67. QGIS Development Team. QGIS Geographic Information System (Version 3.40.15) [Computer Software]. QGIS Association. Available online: https://www.qgis.org (accessed on 4 June 2026).
  68. R Core Team. R: A Language and Environment for Statistical Computing; R Core Team: Vienna, Austria, 2021. [Google Scholar]
  69. Somlyódy, L. Quo Vadis Hazai Vízgazdálkodás? Stratégiai Összegzés. In Magyarország Vízgazdálkodása: Helyzetkép és Stratégiai Feladatok; Magyar Tudományos Akadémia (MTA): Budapest, Hungary, 2011; pp. 9–84. ISBN 978-963-508-608-5. [Google Scholar]
  70. Szabó, B.; Kolcsár, R.A.; Mészáros, J.; Laborczi, A.; Takács, K.; Szatmári, G.; Makó, A.; Rajkai, K.; Benyhe, B.; Barta, K.; et al. National Soil Hydrologic Groups Map for Environmental Applications Using Data-Driven and Expert-Based Methods. Sci. Data 2025, 12, 1590. [Google Scholar] [CrossRef] [PubMed]
  71. Ibebuchi, C.C.; Nyamekye, C. Urban Heat and Cooling Demand: Tree Canopy Targets for Equitable Energy Planning in Baltimore. Urban Sci. 2026, 10, 61. [Google Scholar] [CrossRef]
  72. Wang, Z.; Zhou, R.; Yu, Y. The Impact of Urban Morphology on Land Surface Temperature under Seasonal and Diurnal Variations: Marginal and Interaction Effects. Build. Environ. 2025, 272, 112673. [Google Scholar] [CrossRef]
Figure 1. Urban cover in Hungary derived from the National Ecosystem Map of Hungary—“The database/analysis was prepared using the Ecosystem Base Map, Ministry of Agriculture, 2019 (KEHOP-4.3.0-VEKOP-15-2016-00001)” [55].
Urbansci 10 00373 g001
Figure 2. Paired comparison of Nash-Sutcliffe Efficiency (NSE) for 15 hydrological validation stations.
Urbansci 10 00373 g002
Figure 3. Wilcoxon signed rank exact test for NSE.
Urbansci 10 00373 g003
Figure 4. Wilcoxon signed rank exact test for PBIAS.
Urbansci 10 00373 g004
Figure 5. Time series of the calculated annual runoff coefficient from 1971 to 2024.
Urbansci 10 00373 g005
Figure 6. Infiltration potential of sealed surfaces in the region of Miskolc, Hungary, for the year 2010.
Urbansci 10 00373 g006
Figure 7. Results of the sensitivity analysis based on Random Forest Regression ((A) Runoff, 2010; (B) Runoff, 2022; (C) No. of Drought days, 2010; (D) No. of Drought days, 2022).
Urbansci 10 00373 g007
Figure 8. Time series of the potential cooling effect of the sealed soils.
Urbansci 10 00373 g008
Table 1. Component values for runoff calculation used for Equation (2) after Kenessey [60]. The utilized values are displayed with bold letters.
Component (Unit)Parameter Valueα Value (Utilized)
α1—slope (%)>35% 0.22–0.30 (0.26)
11–35%0.12–0.20 (0.16)
3.5–11%0.06–0.10 (0.08)
<3.5%0.01–0.05 (0.03)
α2—soil (categorical)very low hydraulic conductivity0.22–0.30 (0.26)
low hydraulic conductivity0.10–0.20 (0.21)
moderate hydraulic conductivity0.06–0.10 (0.08)
high hydraulic conductivity0.03–0.05 (0.04)
α3—plant/crop cover (categorical)bare rock0.22–0.30
grass/meadow0.17–0.25 (0.17) *
cultivated soil and/or forest0.07–0.15
closed forest, loose alluvium, gravel, sandy soil0.03–0.05
* Only grass cover was assumed.
Table 2. Class conversion between soil hydrological categories.
AGROTOPO [65]Kenessey [60]
1. Very high infiltration rate and hydraulic conductivity, low water retention4. high hydraulic conductivity
2. High infiltration rate and hydraulic conductivity, moderate water retention4. high hydraulic conductivity
3. Good infiltration and conductivity, good water retention3. moderate hydraulic conductivity
4. Moderate infiltration and conductivity, high water retention2. low hydraulic conductivity
5. Moderate infiltration, poor conductivity, high water retention2. low hydraulic conductivity
6. Low infiltration, very low conductivity, strong water retention 1. very low hydraulic conductivity
7. Very low infiltration, extremely low conductivity, strong water retention1. very low hydraulic conductivity
8. Good infiltration and conductivity, very high water retention3. moderate hydraulic conductivity
9. Shallow soils with extreme water dynamics1. very low hydraulic conductivity
Category numbers are based on their IDs in respective sources [60,65].
Table 3. Summary statistics of total annual water dynamics for the years 2010 and 2022.
Year20102022
Precipitation mean (mm)959.8448.4
Runoff mean (mm)292.8123.2
Infiltration mean (mm)666.9325.3
Evapotranspiration mean (mm)566.5293.5
Deep percolation mean (mm)93.731.5
Annual runoff coefficient0.3060.277
Percolation Ratio mean0.0970.068
Cooling_Energy_MJ/m21387.8719.0
Total_Cooling_Service_PJ602.7312.2
Precipitation sum (km3)0.4170.195
Runoff sum (km3)0.1270.053
Infiltration sum (km3)0.2900.141
Evapotranspiration sum (km3)0.2460.127
Deep percolation sum (km3)0.0410.014
Table 4. Summary table of the Mann–Kendall test for the period of 1971–2024.
VariableTaup_ValueSens_SlopeSignificance
Precipitation mean0.5820.5610.463Non-Significant
Runoff mean0.7760.4380.206Non-Significant
Infiltration mean0.4920.6220.255Non-Significant
Evapotranspiration mean−0.2830.777−0.142Non-Significant
Recharge mean1.3430.1790.259Non-Significant
Runoff Coeff. mean1.1190.2630.000Non-Significant
Drought Days mean2.0440.0410.000Significant
Disclaimer/Publisher’s Note: The statements, opinions and data contained in all publications are solely those of the individual author(s) and contributor(s) and not of MDPI and/or the editor(s). MDPI and/or the editor(s) disclaim responsibility for any injury to people or property resulting from any ideas, methods, instructions or products referred to in the content.