Systematic Review

A Comprehensive Systematic Review of Contemporary Geospatial Approaches to Flood Hazard and Risk Assessment


1
Environmental Dynamics Program, University of Arkansas, Fayetteville, AR 72701, USA
2
Arkansas Center for Space & Planetary Sciences, University of Arkansas, Fayetteville, AR 72701, USA
*
Author to whom correspondence should be addressed.
Urban Sci. 2026, 10(5), 271; https://doi.org/10.3390/urbansci10050271
Submission received: 26 March 2026 / Revised: 29 April 2026 / Accepted: 5 May 2026 / Published: 13 May 2026
(This article belongs to the Section Urban Environment and Sustainability)

Abstract

Due to climate change and its increased variability, as well as the extreme weather events, flooding is becoming a major natural threat causing profound economic, social, and ecological impact. This paper systematically reviews 89 peer-reviewed articles published between 2010 and 2024 on flood risk assessment approaches, including geospatial techniques and methods for flooding, using the PRISMA framework and the ScienceDirect and Web of Science databases. GIS and remote sensing are the most popular tools for flood hazard mapping, and hydrodynamic models such as HEC-RAS and MIKE FLOOD dominate flood simulation. Machine learning algorithms, multi-criteria decision analysis (MCDA), and climate scenario analysis have also emerged as increasingly prominent methodological contributions to flood risk frameworks. This review makes a novel contribution by providing the first systematic synthesis of geospatial flood risk assessment methods, explicitly quantifying both the urban–rural research imbalance and the degree of hazard, vulnerability, and exposure integration across the literature. Specifically, only 13 (2.7%) of all eligible articles addressed rural flooding, despite the profound socioeconomic impacts that disproportionately affect these communities, and only 16% of included studies integrated any combination of hazard, vulnerability, and exposure components within current assessment approaches. This review highlights the importance of interdisciplinary collaboration and sensitivity to rural contexts in cultivating resilience and fostering equitable flood risk management.

1. Introduction

Floods are among the most devastating water-related natural hazards, occurring when water inundates land that is normally dry due to a variety of hydrological, meteorological, and anthropogenic drivers. Understanding the distinction between flood hazard, the physical probability and intensity of a flood event, flood vulnerability, the susceptibility of communities and infrastructure to flood damage, flood exposure, the presence of people, assets, and systems within flood-prone areas, and flood resilience, the capacity of a system to absorb, recover from, and adapt to flood impacts, is fundamental to developing effective forecasting, prevention, and adaptation strategies.
Floods can be characterized into multiple types, such as riverine, flash, and urban floods, each with distinct causes and impact [1]. Hundecha et al. [2] categorized floods according to meteorological drivers, catchment state or hydrograph shape. These categories include three groups of rainfall driven floods and two groups of snowmelt-induced floods. Floods can also be categorized based on their primary causes, including natural drivers such as rainfall patterns, snowmelts and storm precipitation [3]; anthropogenic factors such as urbanization, land use changes [4] and agricultural practices [5]; and climate change, which is increasingly recognized as a key driver of more severe and frequent flood events worldwide [6,7].
The consequences of flooding are well documented globally. In Asia, recurrent floods across India, China, and Southeast Asia have caused widespread loss of life and billions in economic damages, exposing critical limitations in early warning systems and spatial risk mapping [8,9,10]. In Europe and North America, major flood events have similarly revealed persistent gaps in floodplain delineation, vulnerability assessment, and the integration of socioeconomic data into risk frameworks [11,12,13]. Crucially, these events share a common challenge: existing assessment approaches have struggled to fully capture the spatial complexity of flood risk, partly due to limited data availability, inadequate integration of socioeconomic factors, and the underutilization of geospatial tools, particularly in rural and data-scarce environments.
Recent advancements in geospatial techniques have significantly enhanced flood monitoring, hazard assessment and vulnerability analysis. These techniques integrated geospatial data and analytical models to identify flood-prone areas, assessing risk levels and developing mitigation strategies [14,15,16].
Techniques for flood evaluation have advanced greatly with remote sensing (RS) and geographic information systems (GIS) becoming tools because they can collect and interpret extensive spatial data instantly [17,18,19]. These techniques facilitate flood mapping, hazard zone identification, and damage assessment by integrating diverse data such as rainfall, elevation, and population density [20,21]. Similarly, hydrological, and hydraulic models, like HEC-RAS and HEC-HMS, are essential for simulating flood dynamics, particularly in river basins, providing critical insights for floodplain management and ecological assessments [22,23].
Progress in machine learning (ML) and artificial intelligence (AI) is revolutionizing flood risk evaluations by allowing real-time forecasts and continuous learning from updated information [24,25]. These approaches excel in flood forecasting, vulnerability mapping, and damage estimation, supporting data-driven decision-making [26]. Criteria decision analysis (MCDA) methods have improved flood assessments by combining various elements like socioeconomic and environmental metrics to accurately identify and prioritize areas most at risk [27,28]. While these methods have demonstrated significant utility, challenges remain in addressing data limitations, model uncertainties, and integrating socio-environmental factors.
The policy imperative for more comprehensive flood risk assessment is firmly established by the Sendai Framework for Disaster Risk Reduction (2015–2030), which explicitly calls for multi-dimensional risk assessments that integrate hazard, exposure, and vulnerability analyses [29]. The Framework’s emphasis on reducing underlying risk factors and strengthening resilience across all community types, urban and rural alike, directly motivates the need for systematic evaluation of how well current geospatial methodologies meet these objectives. This study is positioned as a direct response to that call, examining whether existing flood risk assessment approaches adequately operationalize the Sendai Framework’s integrated risk perspective.
While several reviews have examined flood risk assessment methodologies, none has systematically focused on the landscape of geospatial methods as a distinct analytical category, nor explicitly compared the urban–rural divide in research coverage. Existing reviews tend to either address broad disaster risk management or focus narrowly on specific tools such as hydrodynamic modeling, leaving a gap in understanding how the full spectrum of geospatial approaches, from RS and GIS to ML and MCDA, are being applied, and where critical blind spots remain. This review addresses that gap directly.
This study aims to review these advancements, their applications, and the remaining gaps, aiding in the creation of thorough flood risk evaluation frameworks. It integrates ideas and methods of flood hazard analysis into a whole and offers a summary of recent studies concerning flood hazard assessment, exposure, vulnerability, and risk assessment. It investigates the time and location emphasis of research and analyzes the ways flood risk is understood. It also aims to analyze the evolution of flood risk by examining the main outcomes of flood risk analysis, the methodologies employed, and the key factors influencing flood risk over time. This review seeks to enhance understanding of current flood risk assessment approaches and to identify future directions for research and policy development in comprehensive flood management.

2. Methodology

A detailed and structured approach was applied to identify, select, and analyze the literature related to flood hazard, vulnerability and risk assessments. The review followed PRISMA (Preferred Reporting Items for Systematic Reviews and Meta-Analyses) guidelines to ensure transparent, reproducible, and comprehensive reporting, thereby enabling a systematic capture of methodological patterns and key advancements in flood assessment, with a strong emphasis on spatial technologies and contemporary analytical frameworks.

2.1. Search Strategy

The literature search was conducted across two major databases as shown in Table 1: Web of Science and ScienceDirect. These sources were selected due to their rigorous academic indexing, multidisciplinary scope, and access to high-quality peer-reviewed content [30,31,32]. All searches were restricted to peer-reviewed journal articles published in English or French between 2010 and 2024. This period was specifically selected to reflect advancements in flood assessment techniques, including the advent of machine learning methods for flood prediction and vulnerability analysis, as well as the introduction of high-resolution satellite imagery such as Sentinel-1 and Landsat-8 [25,26] and the adoption of open-access geospatial platforms [20]. The Sendai Framework (2015) further reinforced the relevance of this period by promoting multi-dimensional disaster risk assessments integrating hazard, vulnerability, and exposure [29].
This search yielded to a total of 4919 records. Additional exclusion terms, covering unrelated hazard domains such as earthquakes, landslides, glaciers, drought, erosion, and cyclones, were applied during the screening phase rather than at the search stage to preserve the breadth of initial retrieval while maintaining thematic relevance.

2.2. Screening Criteria and Exclusion Justification

The screening process adhered to a rigorous framework to minimize selection bias, maintain the standards and meet our research objectives. The following exclusion criteria were made deliberately: gray literature, including reports, theses, and institutional documents, was excluded due to variability in methodological rigor and the challenges it poses to reproducibility and quality assessment. Studies published in languages other than English or French were excluded, as these represent the only languages in which the authors have sufficient proficiency to ensure accurate interpretation of technical methodological content.
Studies were shortlisted when their title and abstract included one or more relevant keywords such as “Flood Hazard,” “Exposure,” “Vulnerability,” “Flood Risk,” “Susceptibility,” “Flood Mapping,” “Spatial Techniques,” “Geospatial Methods,” “GIS,” “Remote Sensing,” “MCDA,” “Modeling,” and “ML.” This ensured thematic alignment with this study’s objectives and guaranteed methodological rigor. Articles were then subjected to manual and automated screening to eliminate duplicates and records falling outside the defined scope, with further exclusions based on the relevance to flood hazard and risk assessment and the integration of geospatial and remote sensing techniques.
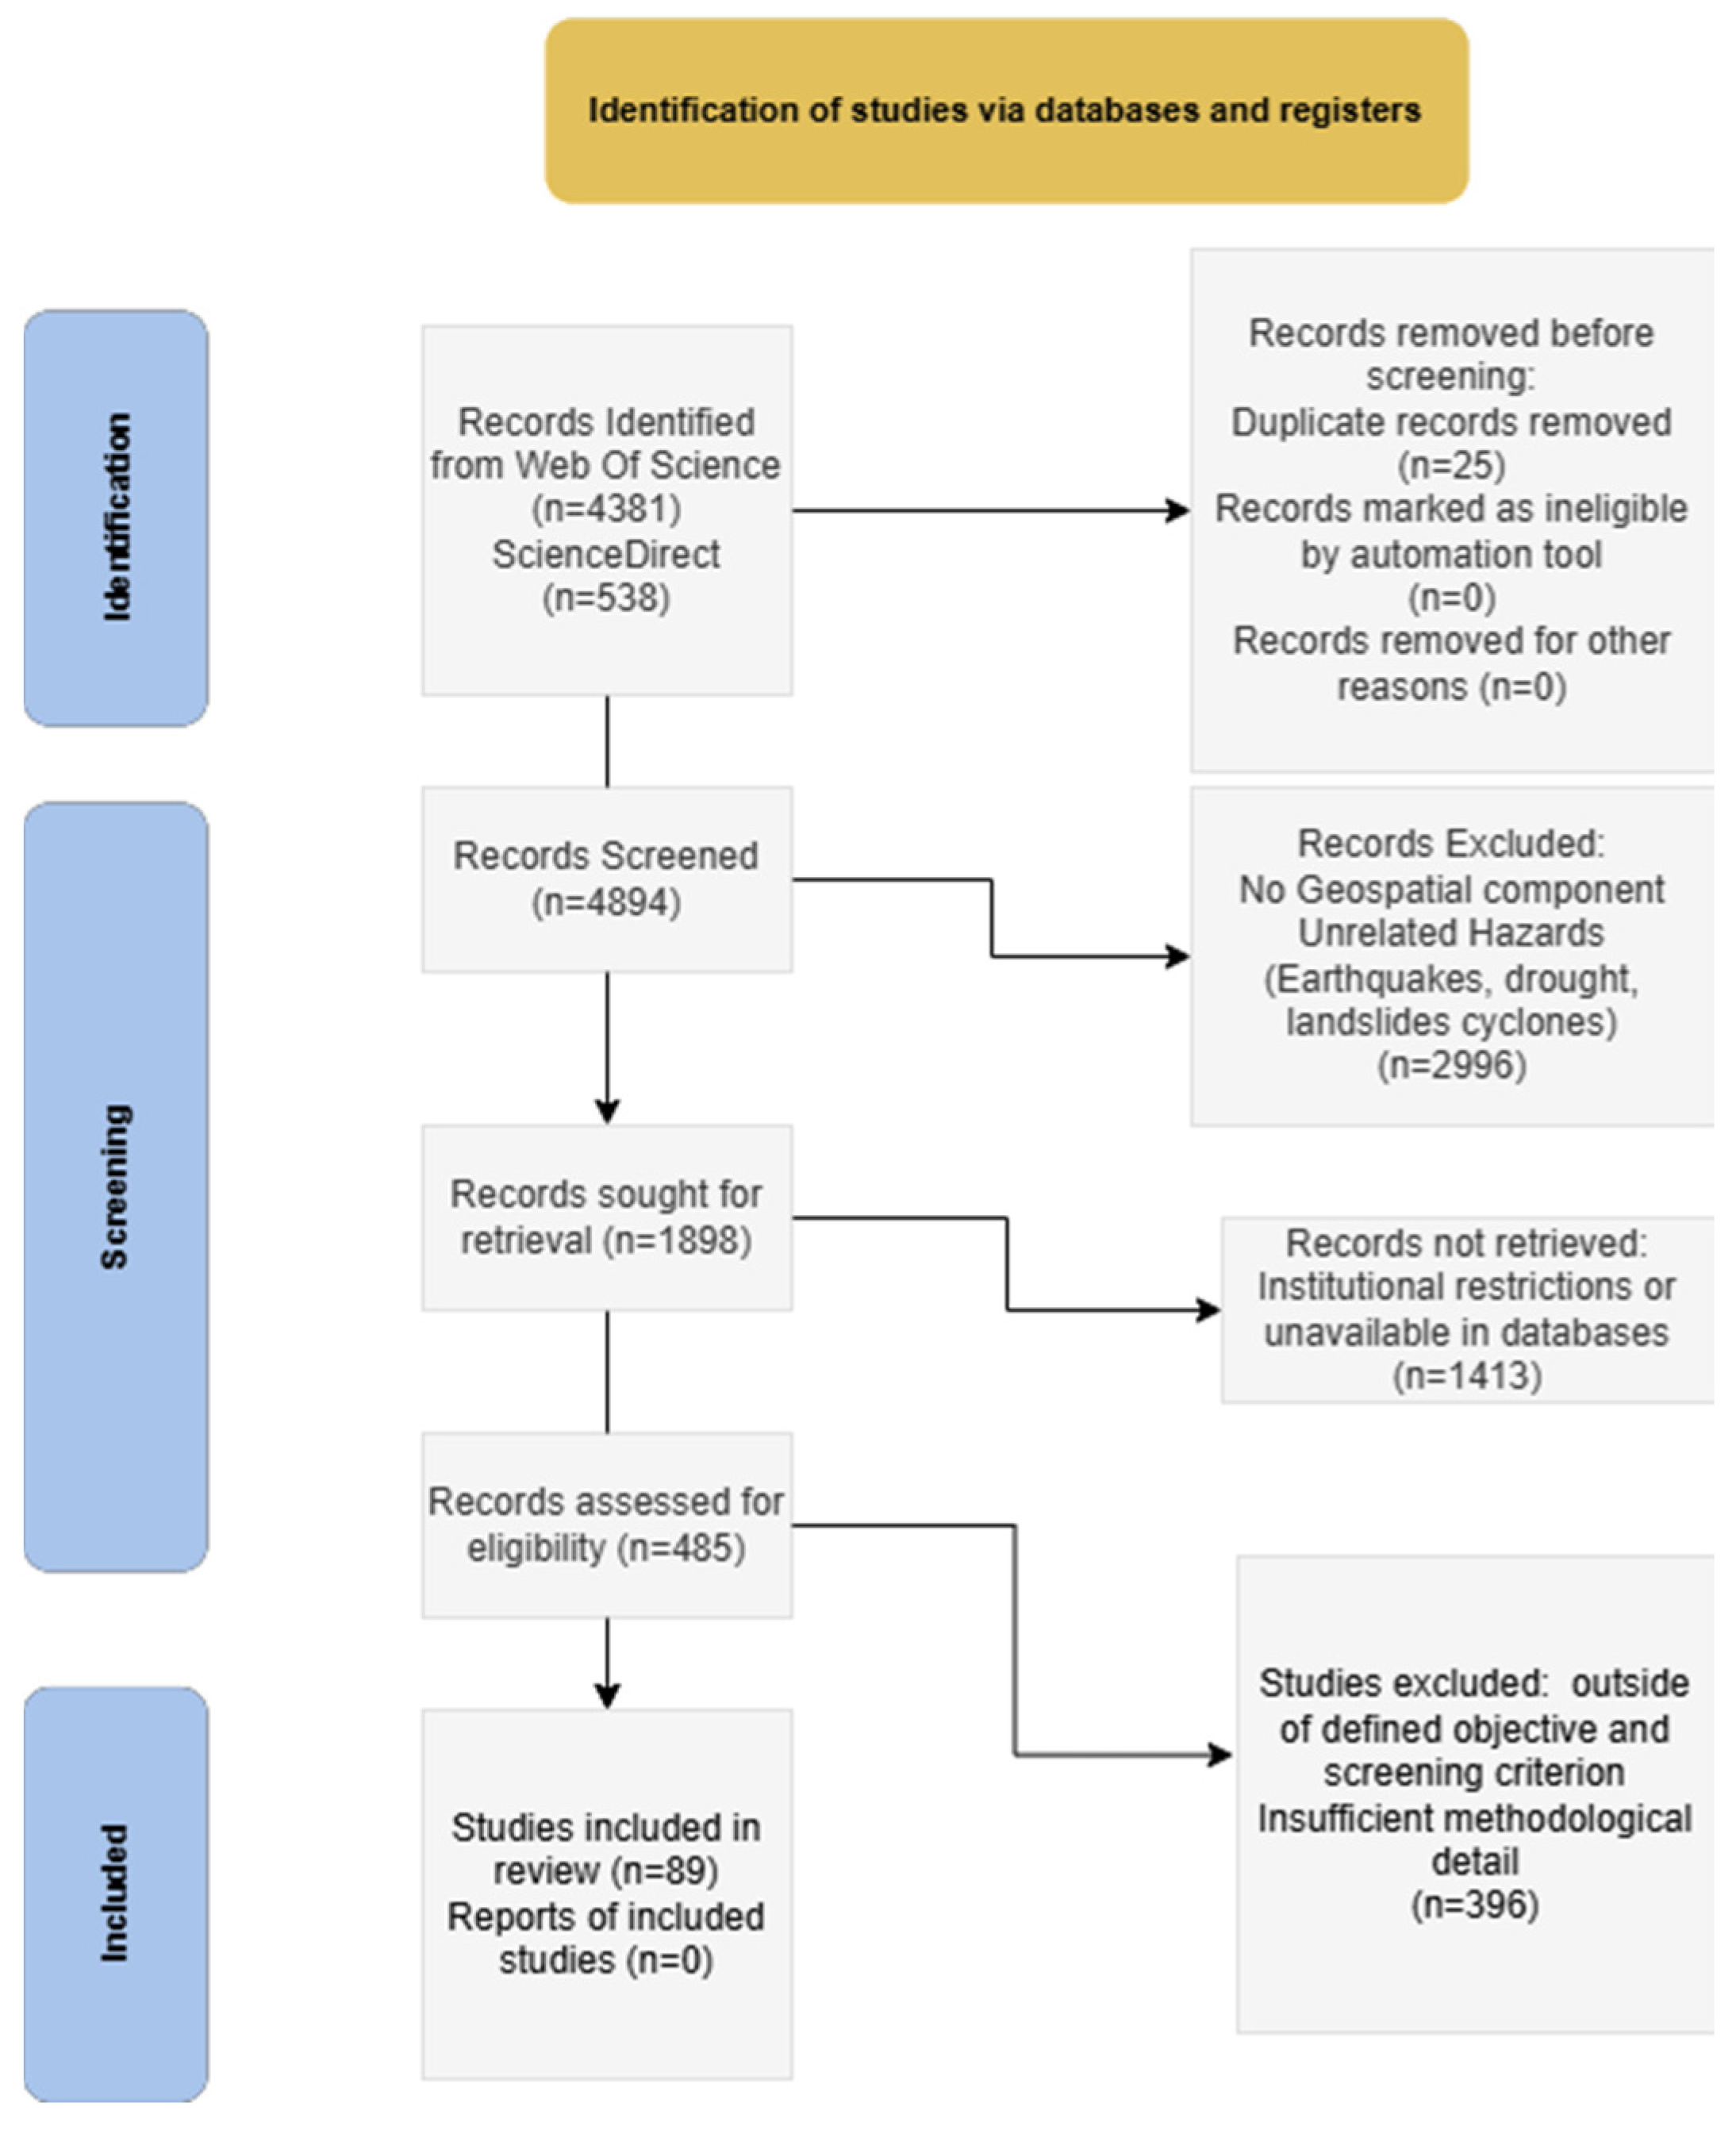
As illustrated in the PRISMA flow diagram (Figure 1), a total of 4919 records were initially identified from Web of Science (n = 4381) and ScienceDirect (n = 538). After removing 25 duplicates, 4894 records were screened based on title and abstract, of which 2996 were excluded as irrelevant. Of the 1898 records sought for retrieval, 1413 could not be accessed due to institutional restrictions or database unavailability, leaving 485 records assessed for full-text eligibility. Following full-text review, 396 studies were excluded for not employing geospatial methods, focusing on flood management rather than assessment or falling outside the defined objectives. A total of 89 articles were thus selected for the final synthesis.

2.3. Research Landsapce for Eligible Literature

To characterize the broader research landscape identified through the search process, the following figures present the distribution of the 485 articles assessed for eligibility by publication year, geographic location, research field, and flood type. This contextual overview situates the final 89 included studies within the wider body of flood risk literature and highlights overarching trends in the field prior to methodological synthesis.
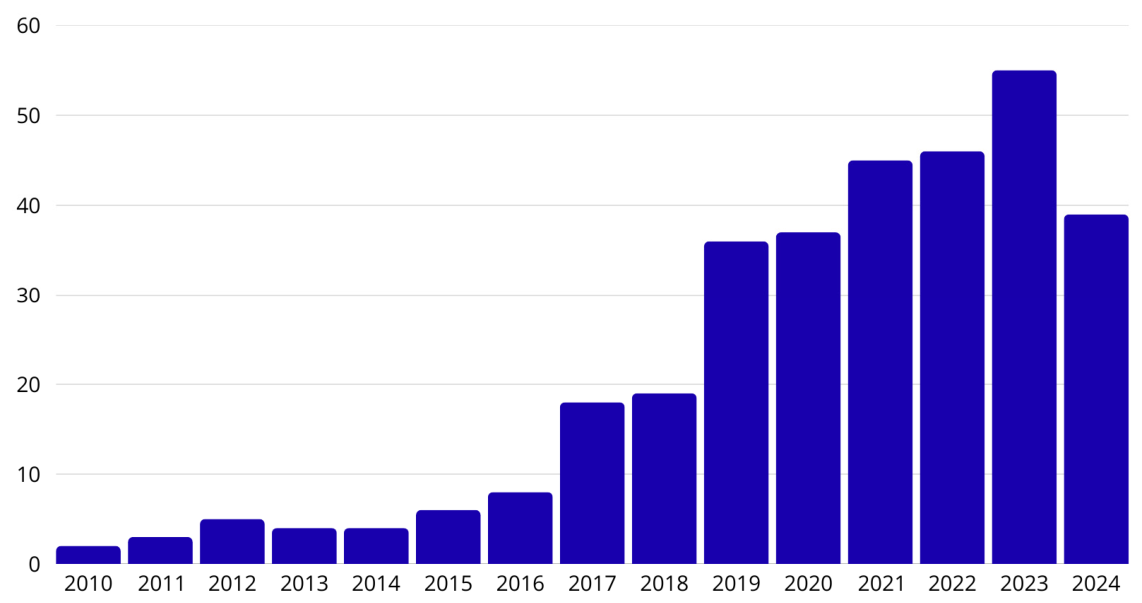
As shown in Figure 2, the chronological spread of flood hazard, exposure, vulnerability, and risk evaluation studies shows a continuous growth in research efforts from 2010 to 2024. Particularly, a sharp upturn is seen starting in 2016, reaching a peak of 55 publications in 2023, highlighting an increased academic focus and acknowledgment of the significance of flood risk research in tackling the escalating issues brought by climate change and swift urban growth. This upward trend over the last decade highlights the accelerating evolution of methodologies and the emergent need to address the impacts of increasingly frequent and severe flood events.
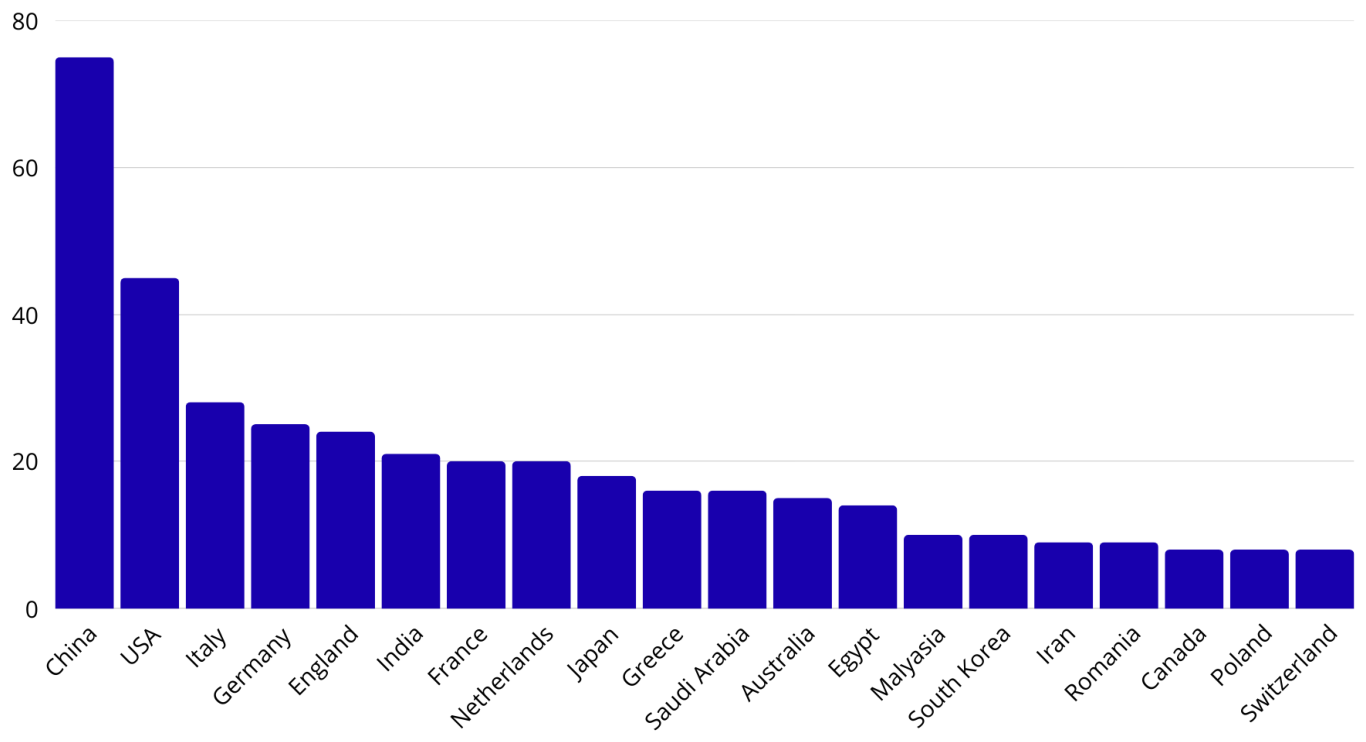
Figure 3 displays the distribution of research publications centered on flood hazard and flood risk evaluation worldwide. The findings show a cluster of studies coming from China and the United States, with more than 70 and about 45 papers, respectively, highlighting these countries’ strong involvement in flood-related research and risk control. Additionally, nations like Italy, Germany, and England each provide input with roughly 25 publications each, demonstrating their important contributions to the development of flood assessment methodologies. Additional notable contributions are evident from India, France, and the Netherlands, each registering between 15 and 20 studies, further demonstrating an active global dialogue on flood vulnerability and preparedness.
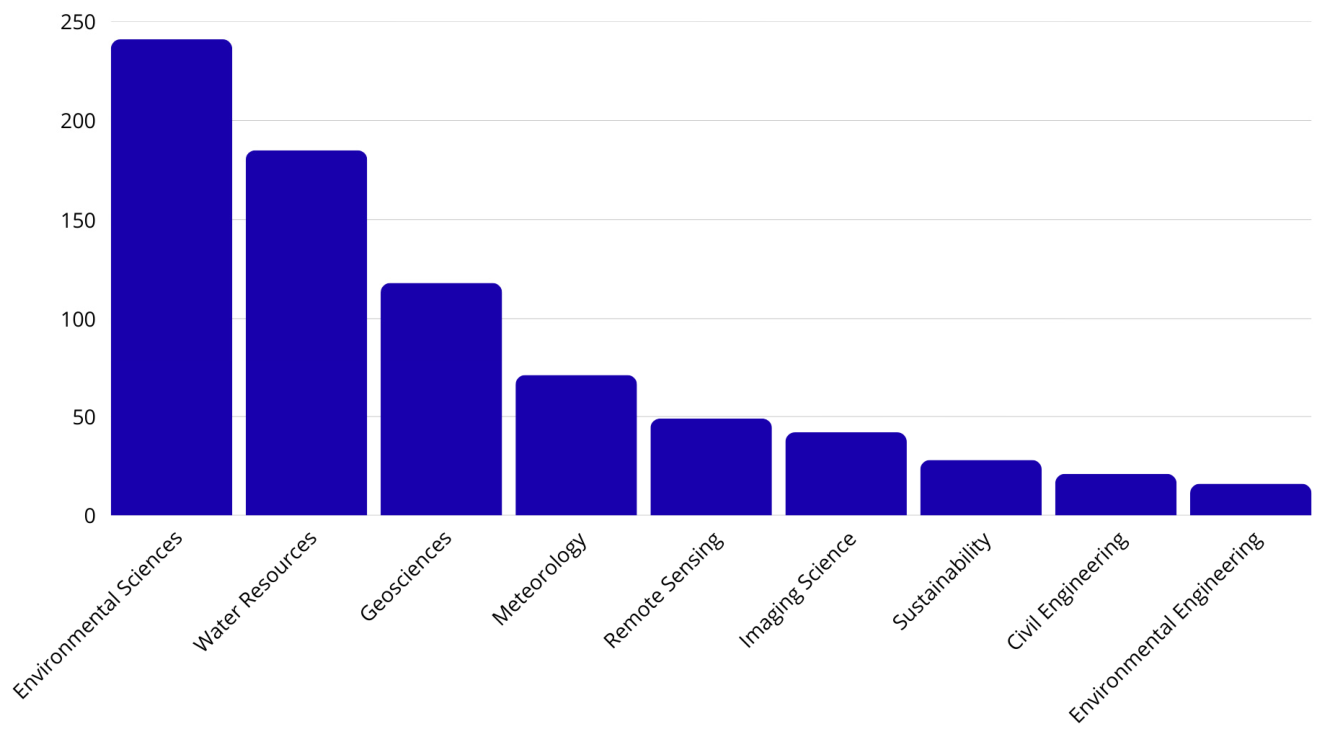
Figure 4 displays the breakdown of publications concerning flood hazard and vulnerability analyses, showing a notable focus on specific research areas. Environmental Sciences and Water Resources together represent more than 200 publications each, highlighting the key influence of ecological and hydrological viewpoints in directing modern flood studies. A significant share of research also originates from Geosciences Multidisciplinary, reflecting involvement from disciplines and their expertise in understanding flood processes and related hazards. The cross-disciplinary nature of flood risk evaluation is underscored by the input from areas like Meteorology and Remote Sensing which collectively enhance the analytical resources and offer essential context regarding the complex causes and effects of flood occurrences. Additional involvement from areas like Imaging Science, Green Sustainable Science, and Civil Engineering further supports the integration of technological innovation and engineering approaches into flood risk management, promoting adaptive solutions and resilience planning.
Although various research domains are actively involved in flood hazard and vulnerability assessments, a noticeable unevenness in representation persists, echoing the previously observed geographic and thematic gaps. The prevailing emphasis on water and geoscience fields highlights their fundamental importance in flood research, while the comparatively lower representation of civil engineering and related disciplines reflects the fact that structural flood management approaches, including dikes, dams, and diversion systems, are already well established in practice. The subsequent development of green infrastructure and nature-based solutions has further demonstrated the recognized limitations of purely structural approaches. Greater integration of civil engineering expertise with emerging geospatial and data-driven methods therefore represents an opportunity to enhance the robustness, applicability, and real-world transferability of flood risk models.
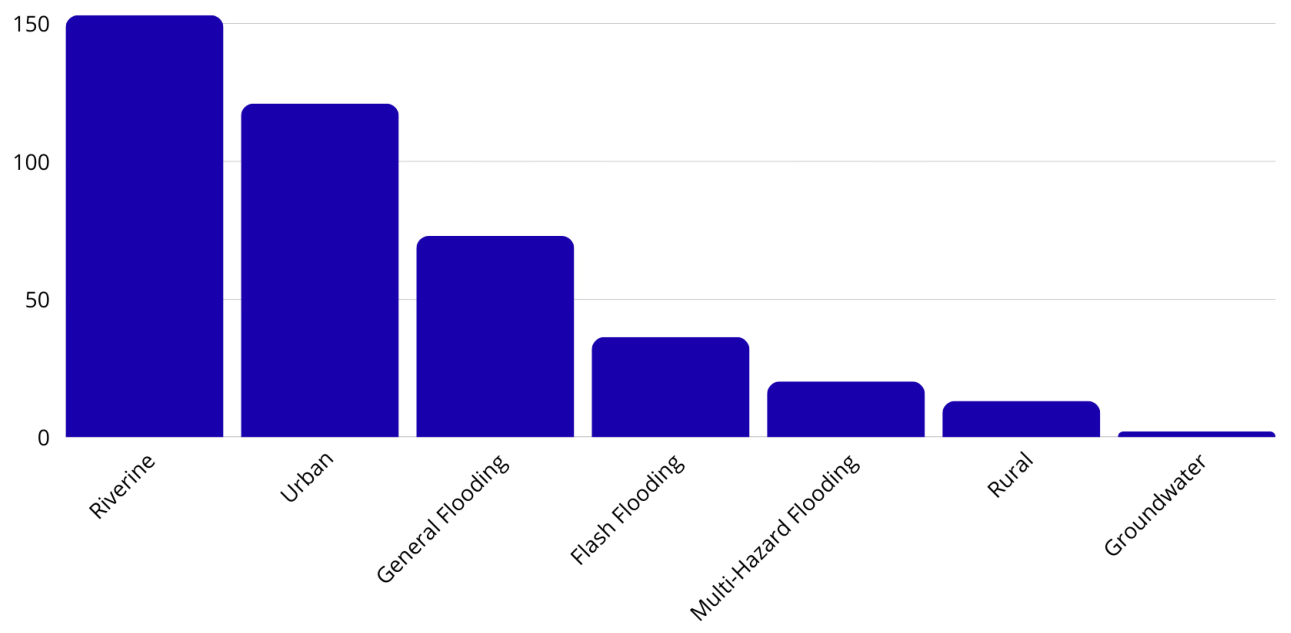
Figure 5 illustrates the distribution of flood types across the eligibility pool, showing a clear dominance of riverine/pluvial floods (n = 153) and urban floods (n = 121). Rural floods remain notably underrepresented (n = 13), alongside groundwater floods (n = 2) and multi-hazard floods (n = 20), reinforcing the thematic gaps that motivate this review.
Together, Figure 2, Figure 3, Figure 4 and Figure 5 characterize the broader research landscape of flood risk assessment literature, revealing persistent geographic and thematic concentrations that contextualize the methodological synthesis presented in the following sections.

2.4. Data Extraction

A structured data extraction framework was applied consistently across all 89 included studies. Bibliographic information, including author(s), publication year, and geographic location, was recorded to map temporal trends and regional concentrations in flood research. Each study was classified by flood type (riverine, urban, rural, flash, pluvial, groundwater, or multi-hazard) and assessment category (hazard, vulnerability, exposure, risk, or integrated), enabling systematic comparison across the literature.
Methodological dimensions were captured in detail, including the geospatial tools and analytical methods employed (GIS, remote sensing, machine learning, MCDA, and hydrodynamic modeling), the specific software and models used (such as HEC-RAS, MIKE FLOOD, ArcGIS Pro 3.4, QGIS, and Google Earth Engine), and the key hazard and vulnerability indices applied (including FHI, SoVI, FVI, and LVI). Data sources and inputs, such as digital elevation models, satellite imagery, rainfall records, and socioeconomic datasets, were also documented to assess data availability and transferability across geographic contexts. Finally, each study was evaluated for the degree to which it integrated hazard, vulnerability, and exposure components into a unified risk framework alongside its main findings and acknowledged limitations.
The extracted data was categorized thematically to highlight understudied methodological areas, document current research trends, and identify directions for future development. Geographic patterns within the selected studies were also examined, revealing areas of concentrated research activity and regions where flood risk assessment remains underexplored, offering important insight into the generalizability of existing methodologies and persistent geographic gaps in research coverage.
Following the full screening and eligibility assessment process described above, 89 peer-reviewed articles met all inclusion criteria and were selected for final synthesis. These studies form the analytical foundation of the results presented in the following section, which examine flood assessment types, spatial techniques, methodological trends, and the degree of hazard, vulnerability, and exposure integration across the included literature.

2.5. Quality Assessment

A custom five-criterion quality checklist was developed and applied consistently across all 89 included studies, tailored to the specific demands of geospatial flood risk research. Each study was assessed on the following criteria: clarity of research objectives (C1); appropriateness of the geospatial method to the stated aim (C2); transparency of data sources and inputs (C3); validation of results through quantitative metrics or field verification (C4); and explicit acknowledgment of limitations (C5). Each criterion was scored 0 or 1, yielding a maximum possible score of 5. Studies scoring 5 were classified as high quality, scores of 3–4 as moderate, and scores below 3 as low.
Of the 89 included studies, 40 (44.9%) were rated high quality and 49 (55.1%) moderate quality, with no studies rated low quality, yielding an average quality score of 4.2 out of 5. The most common gap identified was result validation (C4), where studies described methodological frameworks without reporting explicit accuracy metrics such as ROC curves, AUC values, or field-based verification—a recognized challenge in geospatial systematic reviews. Critically, findings from high-quality studies were consistent with the overall synthesis, supporting the robustness of the conclusions drawn in this review regarding geospatial method distribution, the urban–rural research imbalance, and the limited integration of hazard, vulnerability, and exposure components. Full quality scores for all 89 included studies are provided in the Supplementary Materials.
Following the screening, eligibility assessment, and quality appraisal described above, 89 peer-reviewed articles met all inclusion criteria and were selected for final synthesis. These studies form the analytical foundation of the results presented in the following section, which examine flood assessment types, spatial techniques, methodological trends, and the degree of hazard, vulnerability, and exposure integration across the included literature.

3. Results

3.1. Statistical Analysis

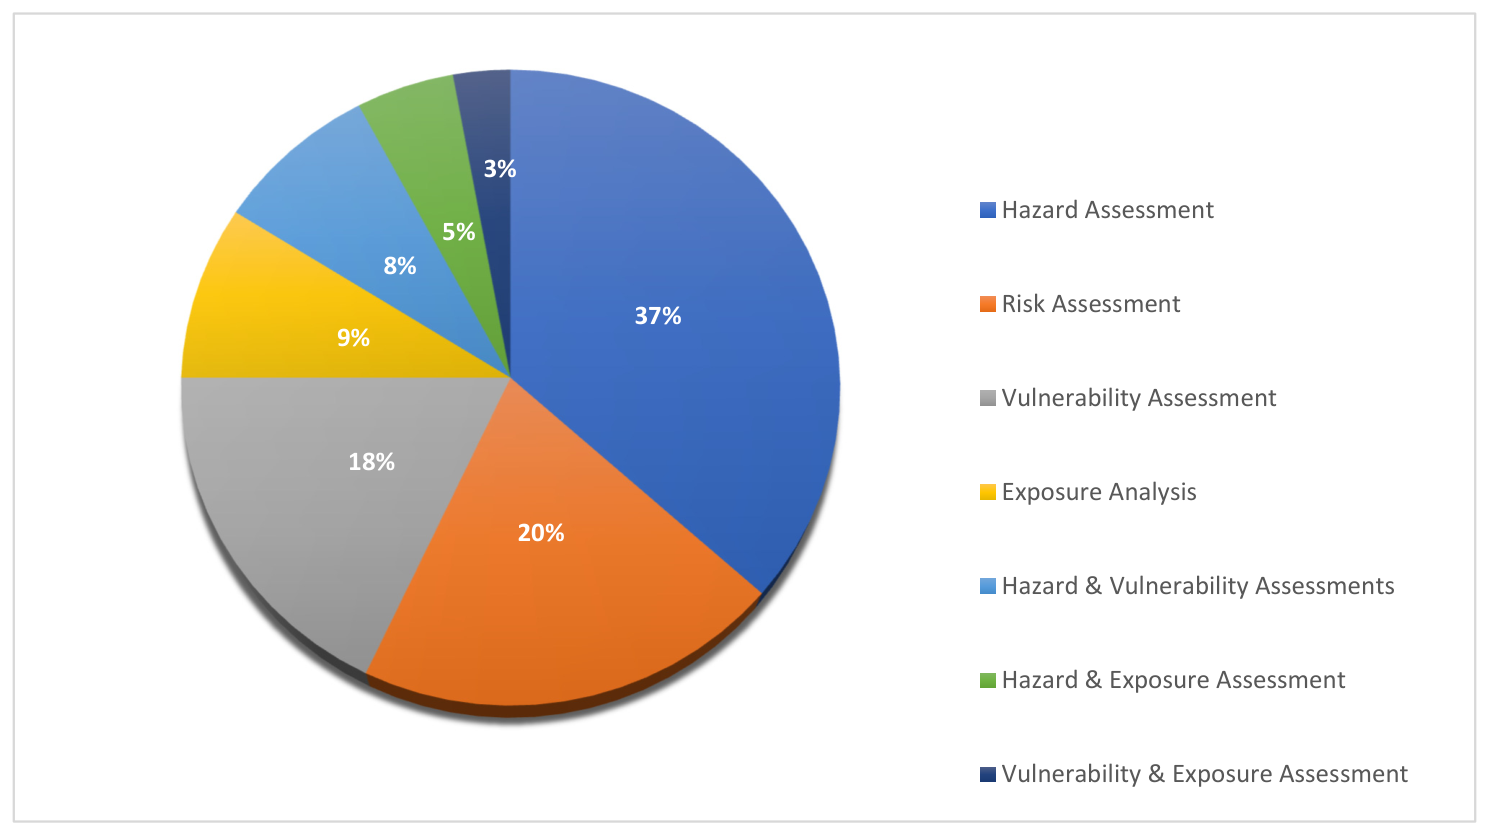
Hazard assessment dominates flood assessment research, as shown in Figure 6, making up 37% of studies, followed by risk assessment at 20%. Vulnerability assessment accounts for 18%, while exposure analysis is less common at 9%, indicating a gap in understanding the spatial distribution of assets at risk. Integrated assessments, such as hazard and vulnerability (8%), hazard and exposure (5%), and vulnerability and exposure (3%), are less frequently covered; therefore, this distribution suggests a need for more holistic approaches that integrate hazard, vulnerability, and exposure to provide a comprehensive flood risk perspective.
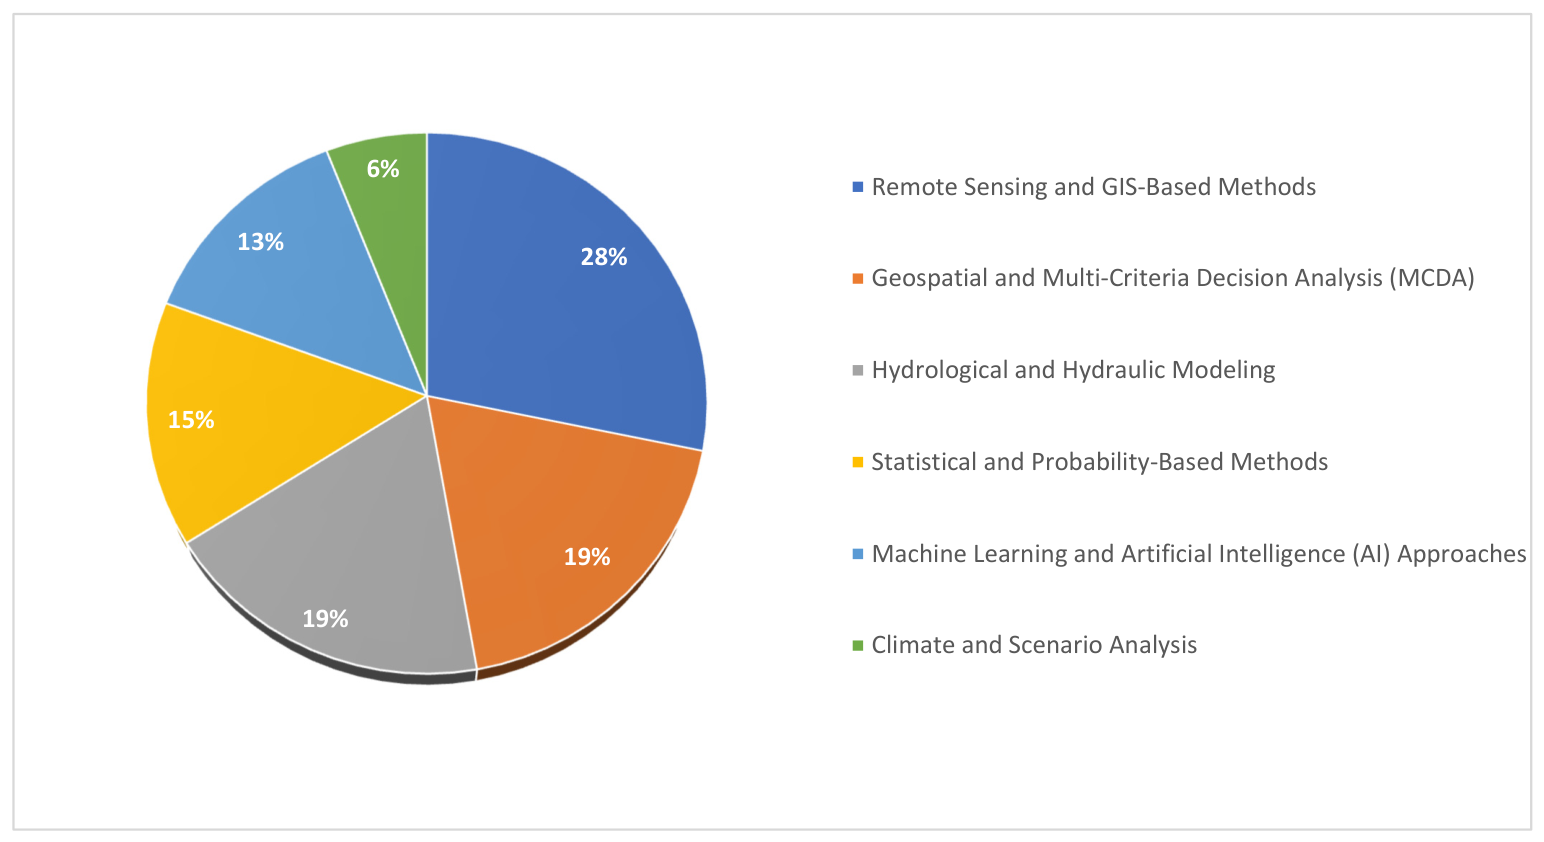
Remote sensing and GIS-based methods are the most frequently used, accounting for 28% of the studies, as shown in Figure 7, underscoring their importance in spatial data acquisition and flood mapping. Both geospatial and multi-criteria decision analysis (MCDA) and hydrological and hydraulic modeling each account for 19%, indicating a balanced reliance on decision-support frameworks and water-flow simulations for assessing flood risk. A total of 15% of the methods are statistical and probability-based, indicating their role in probabilistic assessments. Although they are being used more frequently, machine learning techniques (13%) still make up a smaller portion. When considered collectively, this distribution shows a growing support for data-driven techniques like machine learning and a strong emphasis on hydrological and spatial approaches.
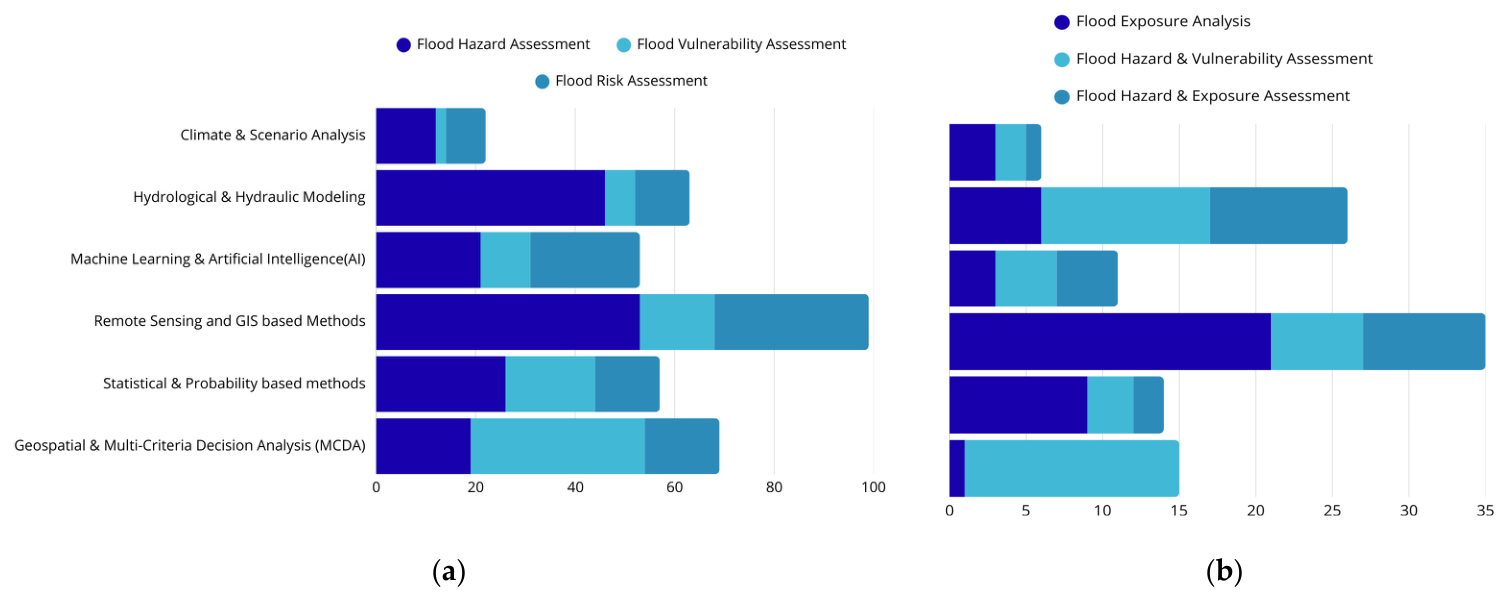
Figure 8 displays the distribution of spatial techniques used across various flood assessment types, including flood hazard assessment, exposure, vulnerability and risk assessment, flood hazard and vulnerability, and flood hazard and exposure. Each chart illustrates the frequency of specific methods such as geospatial and MCDA techniques, hydrological and hydraulic modeling, remote sensing and GIS-based methods, statistical and probability-based methods, and machine learning approaches within each assessment category, showing which techniques are most applied in different types of flood studies.
Flood hazard assessment depends significantly on GIS and remote sensing (RS) methods to identify flood-prone regions by examining spatial and environmental elements, like elevation, slope, and precipitation trends. Moreover, it typically uses modeling to replicate flood behavior and water movement. Flood risk assessment merges GIS and RS techniques to conduct analysis and mapping of flood risk by merging hazard and vulnerability information. This process often incorporates machine learning techniques, such as Random Forest and Support Vector Machine, to classify, predict, and rank areas at risk [33,34].
In the flood vulnerability assessment graph, multi-criteria decision analysis (MCDA) techniques play a primary role by prioritizing and combining various vulnerability factors, including social, economic, and environmental data, while statistical and probability-based methods quantify and assess the likelihood of these factors contributing to flood impacts. For the flood exposure analysis graph, we can say that this analysis primarily uses statistical and probability-based methods to evaluate the likelihood and extent of exposure for populations, infrastructure, and assets, with GIS and RS techniques also being essential for mapping the spatial patterns of exposed areas.

Three-Dimensional Cross-Comparison

Table 2 presents a three-dimensional cross-comparison of flood type, assessment type, and spatial technique across the 89 included studies, revealing distinct methodological patterns for each flood context. Riverine and pluvial floods dominate the literature (n = 29, 32.6%), with hazard assessment as the primary focus (n = 15), relying heavily on hydrological and hydraulic modeling and RS and GIS approaches. Urban flooding (n = 24, 27.0%) shows a contrasting pattern, where vulnerability assessment predominates (n = 12), largely addressed through geospatial and MCDA and statistical methods, reflecting the socioeconomic complexity of urban flood risk. Coastal flooding (n = 15, 16.9%) is almost exclusively addressed through RS and GIS techniques (n = 11), with vulnerability and exposure analyses prioritized over hazard modeling, consistent with the spatial nature of sea-level rise and storm surge assessments. Flash floods (n = 6, 6.7%) are addressed exclusively through hazard assessment, drawing equally on hydrological modeling, MCDA, and RS and GIS, reflecting their rapid-onset nature. Integrated assessments combining two or more components appear most frequently in urban flood studies (n = 4), suggesting that urban contexts are more likely to adopt holistic risk frameworks. Most strikingly, rural flooding is represented by only a single study (n = 1, 1.1%), which focused on vulnerability using hydrological modeling, underscoring a profound and persistent gap in the literature with direct implications for equitable flood risk management.

3.2. Descriptive Analysis

3.2.1. Common Contemporary Spatial Methods for Flood Hazard Assessment and Their Applications

Table 3 presents modern spatial techniques employed for flood hazard evaluation along with their uses. These approaches, such as sensing, GIS, hydrological simulation, and multi-criteria decision analysis (MCDA), are essential for converting hazard and vulnerability metrics into practical evaluations. Every method targets components of flood hazard analysis ranging from identifying flood-susceptible zones to assessing exposure and risk, offering researchers and decision-makers a range of tools to tackle different flood conditions and issues. Descriptive analysis plays a crucial role in systematic reviews by providing a comprehensive understanding of the data and context to interpret the application of the findings. It also helps summarize the characteristics of the data to set the stage for building meaningful conclusions [35]. This analysis is essential for demonstrating how contemporary spatial methods provide the foundational tools needed to translate complex hazard and vulnerability data into practical strategies for mitigating flood risks and addressing diverse challenges effectively. Additional details about these methods are provided in the Supplementary Materials.
Among the spatial techniques identified across the 89 included studies, machine learning and climate scenario analysis represent the most rapidly evolving methodological contributions, though their application remains comparatively limited. Machine learning approaches (n = 10, 11.2%) are most frequently applied in hazard and risk assessments for riverine and urban flooding, where algorithms such as Random Forest, XGBoost, Support Vector Machines, and deep learning models, including Convolutional Neural Networks (CNNs) and Long Short-Term Memory (LSTM) networks, demonstrate superior predictive accuracy compared to traditional statistical methods, particularly in non-linear and data-rich environments. Unlike conventional hydrological and hydraulic models, which rely on physically based equations and are computationally intensive, ML models derive patterns directly from observational data, producing faster predictions with comparable or higher accuracy, particularly in ungauged or data-sparse basins where calibrated physical models struggle. Their primary advantage lies in their ability to process large volumes of heterogeneous spatial and temporal data simultaneously, enabling real-time flood forecasting and continuous model improvement as new data becomes available. However, their application is largely concentrated in data-rich urban and riverine contexts, with virtually no presence in rural, coastal, or multi-hazard flood assessments, reflecting the data availability constraints that limit their transferability to underrepresented regions. Furthermore, ML models are often criticized for their limited interpretability, which can hinder their adoption in policy and emergency planning contexts where transparent decision-making is essential.
Climate and scenario analysis methods (n = 8, 9.0%) draw on global and regional climate models, including CMIP6, RCP pathways, and GCMs, to project future flood risks under different emissions scenarios. Their effect differs fundamentally from both ML and traditional GIS-based approaches: while ML optimizes predictions based on historical patterns and GIS methods map current spatial conditions, climate scenario analysis explicitly projects forward in time, quantifying how flood frequency, intensity, and spatial extent may shift under future climate trajectories. This forward-looking dimension makes it uniquely valuable for long-term infrastructure planning and climate adaptation policy, particularly in riverine and multi-hazard contexts where planning horizons extend decades ahead. However, climate scenario analysis introduces greater uncertainty than present-focused approaches, as projections are sensitive to emission pathway assumptions and model resolution, limitations that become especially pronounced at local scales where flood risk decisions are ultimately made. It also remains underutilized in vulnerability and exposure assessments, where its integration could substantially strengthen the long-term resilience planning dimension of flood risk frameworks. While both methods show clear methodological promise, their combined representation of only 20% of included studies suggests that the field has not yet fully transitioned toward data-driven and climate-informed approaches. The choice between them is fundamentally context-dependent: ML is best suited for near-term operational forecasting in data-rich environments, while climate scenario analysis is indispensable for strategic long-term planning under uncertainty, and their integration represents a promising but largely unexplored frontier in comprehensive flood risk assessment.

3.2.2. Key Hazard and Vulnerability Indices for Flood Assessments

Table 4 displays hazard and vulnerability metrics frequently utilized in flood risk evaluation. This table includes indicators designed to evaluate flood hazards and examine vulnerability components offering metrics that support an evaluation of flood risk. These indicators generally combine environmental and socioeconomic aspects, enabling researchers and policymakers to pinpoint high-risk zones and distribute resources effectively for flood mitigation. Indices such as the Flood Vulnerability Index (FVI), which integrates environmental and physical risk factors unique to flood-prone areas, and the Social Vulnerability Index (SoVI), which concentrates on sociodemographic factors, are examples in the table. Strong frameworks for assessing flood risk and creating flexible, evidence-based strategies are made possible by the integration of various data sources through the collection of flood assessment indices from reviewed papers.
While the indices presented in Table 4 share the overarching goal of quantifying flood risk components, they differ substantially in their conceptual focus, data requirements, and contextual applicability, and their selection should be guided by the specific assessment objectives and available data. The Flood Hazard Index (FHI) is the most physically oriented of the indices, focusing exclusively on flood depth, duration, and frequency. Its primary advantage lies in its simplicity and direct linkage to observable flood parameters, making it particularly suitable for rapid hazard zoning in data-scarce environments. However, its narrow physical focus means it captures neither the social nor the economic dimensions of risk, limiting its utility as a standalone tool for comprehensive flood risk assessment.
The Social Vulnerability Index (SoVI) addresses this gap by incorporating sociodemographic factors such as age, income, disability, and housing quality, making it especially valuable for identifying at-risk populations in urban and peri-urban contexts. Its main limitation is its reliance on census-based data, which may be outdated, unavailable, or inconsistent in developing regions, constraining its transferability across geographic contexts. The Flood Vulnerability Index (FVI) offers a broader integrative framework by combining social, economic, environmental, and physical indicators, making it more adaptable to diverse local conditions than either the FHI or SoVI alone. However, its multi-dimensional nature introduces challenges in indicator weighting and data availability, particularly in rural and data-deficient settings where socioeconomic datasets are often incomplete.
The Livelihood Vulnerability Index (LVI) is specifically designed for rural and agrarian communities, capturing flood-sensitive economic dimensions such as employment diversity, food security, and access to credit—factors that are systematically overlooked by urban-focused indices. This makes the LVI uniquely valuable for addressing the rural flood research gap identified in this review, though its application remains rare, reflecting the broader underrepresentation of rural contexts in the literature. The Composite Vulnerability Index (CVI) and the Flood Risk Index (FRI) represent the most integrated approaches, combining multiple hazard, exposure, and vulnerability dimensions into a single composite score. Their key advantage is their capacity for cross-regional comparison and policy prioritization, but this comes at the cost of methodological complexity, subjectivity in indicator selection and weighting, and sensitivity to data quality. The Urban Flood Risk Index (UFRI) extends this framework specifically to urban environments, incorporating infrastructure-specific variables such as impervious surfaces, drainage systems, and building types, making it the most contextually tailored tool for urban flood risk management.
All together, these findings suggest that no single index is universally applicable—the selection of appropriate indices should be driven by the flood type, geographic context, available data, and the specific hazard, vulnerability, or exposure dimension being assessed. The limited application of integrated indices such as the FRI and UFRI across the 89 included studies further reinforces the finding that holistic multi-component risk assessment frameworks remain underutilized in current flood risk research.

3.3. Regional Technology Adaptability Analysis

Table 5 presents the distribution of spatial techniques across developed and developing regions among the 89 included studies, revealing notable differences in methodological preferences that reflect underlying disparities in data availability, computational infrastructure, and institutional capacity. Developing regions account for most included studies (n = 55, 61.8%), with China (n = 11) and India (n = 7) as the most prolific contributors, followed by Egypt, Iran, Romania, and Bangladesh.
RS and GIS methods dominate in both developed (n = 11, 41%) and developing (n = 21, 38%) regions, reflecting their widespread accessibility and applicability across diverse contexts. However, important differences emerge for other techniques. Geospatial and MCDA approaches are disproportionately concentrated in developing regions (n = 17, 31%) compared to developed regions (n = 6, 22%), suggesting that MCDA frameworks—which require less specialized infrastructure and can integrate readily available socioeconomic data—are particularly well suited to data-constrained environments. Machine learning methods, while still limited overall, are more prevalent in developing regions (n = 7, 13%) than developed (n = 2, 7%), driven largely by studies from China and India where large datasets and computational resources are increasingly available.
Conversely, hydrological and hydraulic modeling shows an equal distribution between developed and developing regions (n = 4 each), reflecting the universal importance of physically based models for flood simulation regardless of regional context. Climate and scenario analysis is similarly balanced (n = 3 each), though its overall low representation across both groups indicates that long-term climate-informed approaches remain underutilized globally. These findings suggest that while developing regions are actively adopting accessible geospatial tools, significant gaps remain in the application of computationally intensive approaches, a disparity that has direct implications for the equity and comprehensiveness of flood risk assessment worldwide.

4. Discussion

4.1. Reliability and Limitations of Geospatial and Hydrological Models in Flood Hazard Assessment

The review of flood hazard assessment shows a trend in integrating diverse spatial methodologies, including GIS, remote sensing, machine learning, and hydrodynamic modeling. As illustrated by [155], spatial dependency frameworks such as exceedance and copula-based methods enhance flood forecasting by incorporating the natural variability of flood events across different watersheds. This spatial awareness is essential for flood risk evaluation, especially in areas with diverse topography and hydrological characteristics. Likewise, GIS and remote sensing technologies have improved flood mapping through the integration of factors, like slope, drainage, and land use empirically confirmed by [45], whose GIS-RS-MCDA integration produced a high-accuracy flood susceptibility map in Ethiopia, and [156], whose AHP-GIS framework effectively identified high flood risk zones in the Zambezi region. This integration, illustrated by [157] in their study on the King Talal Dam region, employs the Analytic Hierarchy Process (AHP) to prioritize these factors, ensuring that geospatial data remains responsive to ongoing environmental changes and, thus, keeps assessments current.
The review further reveals progression from traditional hydrological methods to advanced geospatial and machine learning techniques, each tailored to specific assessment needs. GIS-based flood mapping remains foundational due to its accessible visualization and its effectiveness in regions with robust topographical data, though its accuracy is often limited by the resolution of Digital Elevation Models (DEMs), [158]; this limitation is documented across multiple studies, with [61,159,160] each reporting that low-resolution DEMs introduced significant errors in flood zone delineation and depth estimation. As noted in prior studies, GIS mapping alone may not be sufficient as a predictive tool, particularly in complex terrains where low-resolution DEMs introduce errors. Meanwhile, remote sensing, particularly Synthetic Aperture Radar (SAR), offers invaluable capabilities in continuous flood monitoring due to its ability to collect data regardless of weather conditions. SAR’s utility in real-time monitoring is underscored by its application in inaccessible regions demonstrated empirically by [161], whose RAPID SAR system achieved high-accuracy flood inundation mapping for emergency response, and [162], whose Hydro SAR Sentinel-1 monitoring provided year-round flood data in flood-prone agricultural areas. Yet, its limitation lies in its surface-level assessment, which lacks the hydrological depth provided by traditional models [163].
Hydrodynamic modeling tools such as HEC-RAS and MIKE FLOOD are highly effective for simulating flood behavior where ample data is available [151,164], making them well suited for accurate applications like regulatory floodplain delineation. Nonetheless, their dependence on datasets and historical records restricts their use in areas lacking data and under shifting climatic scenarios [165,166]. Conversely, machine learning (ML) approaches provide adaptability by detecting patterns in changing settings and frequently deliver superior results with less reliance on physical input data [167]. However, ML models encounter difficulties including data requirements for training and poor interpretability, hindering their adoption in policy environments [168], as illustrated by [90], who found that purely data-driven ML models risk losing physical process understanding, proposing a Physics-Informed Machine Learning hybrid to balance predictive power with hydrological interpretability. Combining these methods might improve flood risk management across contexts.
The selection of an appropriate flood assessment method is inherently context-dependent, varying based on data availability, geographic characteristics, and computational resources. While GIS and remote sensing are ideal for initial, large-scale monitoring, hydrodynamic models are superior for detailed local predictions with ample data. Machine learning models, particularly when combined with multi-sourced geospatial and socioeconomic data, offer high-resolution flood hazard mapping, effectively addressing gaps in conventional approaches [169]. However, to fully harness ML’s potential, limitations in interpretability must be addressed to foster broader regulatory acceptance. This evolving field underscores the importance of an integrative, interdisciplinary approach, where combining the strengths of each technique leads to more comprehensive and responsive flood management strategies.

4.2. Tools and Methods in Flood Hazard Assessment

Reviewing the tools applied in flood hazard evaluation reveals a distinct pattern showcasing the integration of hydrological, GIS, remote sensing, machine learning and stochastic methods. These instruments tackle aspects of flood risk, each offering advantages that align well with flood-vulnerable settings and data scenarios. Hydrological and hydraulic models are prominent as the foundation of flood forecasting, modeling water flow and runoff behaviors essential for infrastructure design in regions such as urban floodplains, and river valleys. Flood hazard evaluations achieve the accuracy required for planning decisions like enhancing levee and flood channel locations through models like HEC-RAS and MIKE FLOOD [164]. This is supported empirically across the reviewed literature, as ref. [69] demonstrated that a porosity-based flood inundation model achieved efficient large-scale flood simulations while preserving spatial detail and reducing computation time, and [170] confirmed that an integrated hydrological–hydraulic model enhanced flood prediction accuracy in complex lake-influenced floodplains. When analyzing instances in U.S. flood areas, these models have shown to be essential for replicating flood dynamics under scenarios, especially where heavy precipitation and swift runoff meet, in heavily inhabited regions [171]. Ref. [85] further demonstrated that hydrodynamic forecasts substantially improved flood mapping accuracy for hurricane-prone areas, confirming the value of physically based models in extreme event scenarios.
Conversely, when examining the changing patterns of land use and hydrological reactions resulting from growth, remote sensing and GIS prove to be essential. The extensive data provided by Sentinel-1 SAR and MODIS imagery enable real-time flood surveillance and hazard mapping, detecting changes that could impact flood dynamics over time. This is empirically confirmed by [172], whose ensemble classifier combining Sentinel-1 and Sentinel-2 imagery improved land use mapping in the Sahel, directly aiding flood risk mitigation, and by [173], whose spatiotemporal analysis of urban rainstorm waterlogging demonstrated how urbanization patterns can be tracked through spatial analysis to improve flood management in rapidly growing cities. This review clearly demonstrated that these technologies are crucial for developing areas such as the Yangtze River Basin, where swift urban development increases susceptibility to flash floods.
As [174] notes, “GIS-based assessments enable planners to dynamically account for evolving land-use patterns, providing the responsive mapping required in these rapidly changing environments.” By layering this data within GIS frameworks, flood hazard maps are updated to reflect new infrastructure, impervious surfaces, and changing natural features, making this approach indispensable for proactive flood risk. Statistical approaches such as Monte Carlo simulations tackle uncertainties in flood forecasting by generating scenarios facilitating extended risk management in areas lacking sufficient data. Ref. [130] demonstrated this in practice, showing that high-resolution downscaled climate models revealed critical flood peak increases in Vietnam’s Upper Thu Bon catchment, necessitating adaptive flood risk management, though the study also acknowledged limitations in model uncertainties and spatial resolutions that constrain local-scale applicability. Nevertheless, their accuracy relies on data and premises emphasizing the necessity for enhanced inputs and revised climate forecasts [175].
Ultimately, a compelling aspect of our findings was the value of combining machine learning models such as Random Forest (RF) with multi-sourced geospatial and socioeconomic data to create high-resolution, granular flood hazard maps. Ref. [176] illustrated this effectively, demonstrating that combining SWMM with Random Forest analysis optimized flood resilience planning for high-density urban zones, directly supporting policy decisions. Similarly, ref. [95] showed that integrating Random Forest with TOPSIS decision-making identified flood-prone zones with improved hazard prioritization, combining the predictive power of ML with the structured multi-criteria reasoning of MCDA. These advanced, data-integrative models allow for an unprecedented level of detail, identifying not only areas of physical vulnerability but also those where socioeconomic factors heighten risk. This layered approach captures the intricacies of flood hazards, providing a comprehensive understanding that guides more effective, localized flood management strategies. The diversity of tools underscores the evolution of flood hazard assessment, where integrative, high-resolution mapping has become essential to addressing the intersecting drivers of flood risk in today’s complex environmental landscape.

4.3. Indices-Based Approaches and the Effectiveness of MCDA in Flood Vulnerability Assessment

The evaluation of flood vulnerability assessment techniques underscores the significance of indicator-based methods employing vulnerability indices. As demonstrated in studies, indices such as the Social Vulnerability Index (SoVI) and the Flood Vulnerability Index (FVI) continue to play a key role in integrating various socioeconomic, environmental, and physical information to generate standardized measures that highlight essential elements of flood risk. This is confirmed empirically across the reviewed literature; ref. [177] demonstrated that SoVI-based analysis revealed income-based spatial injustices in flood vulnerability, directly supporting equitable flood risk reduction policy design at the municipal level, while [121] applied social vulnerability indices to highlight the financial needs of vulnerable Romanian communities, enabling targeted flood resource allocation. For example, as highlighted in the research of [167], SoVI is commonly utilized in flood risk analysis to measure elements like age, income and housing security that affect a community’s ability to withstand floods. The organized framework of this index helps emergency planners and decision-makers pinpoint populations by facilitating a more targeted distribution of resources to safeguard at-risk groups. In the same vein, FVI, as pointed out by [178], combines social, environmental and physical metrics designed specifically for flood-vulnerable regions, rendering it a flexible instrument suitable for different regional settings, with distinctive environmental or socioeconomic characteristics. Ref. [59] empirically validated both CVI and FVI for coastal flood vulnerability assessment, confirming their effectiveness in highlighting critical areas for targeted resilience planning in response to sea-level rise and storm surges, particularly in data-scarce regions.
A major benefit of these indices is their multi-faceted approach, allowing flood evaluations to extend past one-dimensional analysis and incorporate various social and physical vulnerabilities. Ref. [143] demonstrated this empirically, showing that integrating social indicators into flood damage models produced more comprehensive vulnerability mapping by merging socioeconomic and physical data—a finding that directly supports the argument for multi-dimensional index-based assessments over single-component approaches. Providing an encompassing perspective on elements leading to flood risk indices like SoVI and FVI supply decision-makers with valuable information to develop more precise context-aware flood management plans. The study by [179] demonstrates the application of these indices in facilitating flood resilience planning tailored to specific regions, guaranteeing that evaluations are both precise and pertinent to the distinct socioeconomic and environmental issues faced by various locations. Furthermore, ref. [140] confirmed the value of the Livelihood Vulnerability Index (LVI) for mapping flood-exposed communities in rural contexts, demonstrating its utility for food security and emergency planning in flood-prone areas—a finding particularly significant given the underrepresentation of rural flood research identified in this review.
Multi-criteria decision analysis (MCDA) methods hold a position in assessing flood vulnerability by offering a systematic approach to analyze and rank multiple flood risk factors [180]. Techniques such as the Analytic Hierarchy Process (AHP) Fuzzy AHP, the Weighted Sum Model (WSM) and TOPSIS (Technique for Order of Preference by Similarity to Ideal Solution) are frequently employed. These approaches enable decision-makers to allocate weights to socioeconomic and environmental criteria specific to various areas [181]. Ref. [111] empirically validated Fuzzy AHP for urban flood risk assessment in arid regions, confirming its effectiveness in supporting proactive planning in Qatar, while [182] demonstrated that a Hierarchical Fuzzy Inference System reduced decision-making bias in flood-prone urban areas, enhancing flood resilience planning. For instance, Fuzzy AHP introduces a level of adaptability by incorporating “fuzziness” in indicator weighting, addressing uncertainties from incomplete data or different expert opinions. This flexibility is essential in complex flood-prone environments where local knowledge enhances the reliability of vulnerability assessments.
Every MCDA approach offers advantages improving the flexibility of flood vulnerability evaluations across various geographical and socioeconomic settings. Ref. [183] demonstrated this adaptability, showing that a GIS-based multi-criteria framework generated a flexible flood susceptibility assessment applicable even in ungauged catchments, a critical advantage in data-deficient regions. For instance, WSM’s simple combination of indicators into one vulnerability value is helpful for producing clear and understandable outcomes, whereas TOPSIS orders locations according to their closeness to an “ideal” vulnerability model, making it especially effective, for pinpointing areas that match particular vulnerability traits [184]. Ref. [95] empirically illustrated this by combining Random Forest with TOPSIS to identify flood-prone zones in Jiroft, demonstrating that integrating ML’s predictive power with MCDA’s structured reasoning improved hazard prioritization beyond what either method could achieve alone. However, these methods also have limitations, particularly regarding subjectivity in weighing indicators, which can introduce biases and inconsistencies [167]. This limitation is consistently documented across the reviewed studies; [156] noted that AHP criteria selection remained dependent on subjective judgment, ref. [113] reported limited scope for dynamic flood data integration based on his study area in Greece, and [185] found that weight assumptions in MCDA affected hazard map precision in complex terrains. While Fuzzy AHP reduces some uncertainty by employing a spectrum of values and then fixed weights, it does not fully remove subjectivity. Furthermore, the premise in MCDA that each criterion independently affects vulnerability might neglect actual interactions between socioeconomic indicators and infrastructure elements [186]. Overcoming these constraints demands choice of indicators, accurate adjustment of weights, and incorporation of objective information to reduce bias and improve the trustworthiness of MCDA-based evaluations [184].
In sum, the findings suggest that while indicator-based and MCDA methods provide powerful tools for flood vulnerability assessment, effective implementation requires careful attention to context-specific indicators and the potential biases in weighting. By acknowledging and adjusting for these limitations, MCDA and index-based approaches can produce robust, actionable insights, supporting comprehensive flood management and resilience planning.

4.4. Integrating Hazard, Exposure, and Vulnerability for a Comprehensive Flood Risk Assessment Framework

After examining various methodologies in flood hazard and vulnerability assessments, the necessity of integrating hazard, exposure, and vulnerability into a unified flood risk framework has become apparent. This integration approach, as illustrated in recent studies, allows for a more comprehensive and actionable assessment of flood impacts than independent analyses of each component. While hazard analysis effectively determines flood probability and intensity, it lacks the socioeconomic and infrastructural context that defines its true impact on communities [187]. Similarly, while vulnerability assessments offer valuable insights into factors such as socioeconomic status and housing stability that may increase susceptibility to flood damage, their practical application in mitigation planning is limited if hazard probabilities are not considered [188]. By bringing these dimensions together, a unified framework captures not only where and when floods are likely to occur but also identifies the specific people, assets, and infrastructure at risk, thus offering a multi-dimensional view of flood impacts.
Geospatial and statistical tools are essential for operationalizing this unified approach. As demonstrated by [157], geographic information systems (GIS) and remote sensing provide spatial precision in mapping hazard zones, exposed assets, and vulnerable populations. Integrating these spatial data layers with statistical methods, such as Principal Component Analysis (PCA) or machine learning algorithms, allows for the efficient processing of large datasets to isolate the primary drivers of flood risk, unveiling patterns and relationships often concealed in standalone analyses. This synergy not only deepens the understanding of flood risks but also enhances predictive accuracy, surpassing the capacity of traditional single-component evaluations.
A particularly critical insight from the reviewed papers is the often-overlooked role of exposure in flood risk assessments. While hazard and vulnerability analyses reveal the likelihood of flood events and the factors that increase susceptibility, exposure determines the actual extent to which people, infrastructure, and assets are at risk [178]. Overlooking exposure in flood assessments can lead to incomplete and sometimes misleading conclusions. For example, a high-hazard area with low exposure due to minimal infrastructure or population may present less risk than a densely populated urban zone with moderate hazard levels. Exposure acts as a bridge between hazard and vulnerability, translating potential flood events into tangible risks by accounting for the physical presence and density of at-risk elements [186].
Incorporating exposure analysis enables a more practical understanding of risk by directly identifying specific people, infrastructure, and assets within flood-prone areas. While hazard assessments estimate the likelihood and intensity of flooding, they often fail to reveal who and what will be affected. Exposure analysis addresses this gap by detailing the population, critical infrastructure, and assets situated within hazard zones. This adaptability is critical, as exposure data can be continuously updated with new demographic or infrastructural information, ensuring that flood risk assessments remain relevant as conditions evolve. Thus, integrating exposure with hazard data can significantly transform theoretical flood risk models into actionable frameworks for disaster preparedness and response. Combining hazard, exposure, and vulnerability not only identifies where floods are likely to occur but also quantifies their potential impact on local communities and economies [179]. This integrated approach empowers decision-makers to implement proactive strategies that mitigate flood damage, safeguard lives, and minimize economic disruption. Drawing on the evidence from the reviewed literature, a practical and operable three-stage integration pathway can be proposed for flood risk assessment frameworks seeking to incorporate hazard, vulnerability, and exposure in a unified approach. In the first stage—hazard delineation—RS and GIS tools and hydrodynamic models such as HEC-RAS are used to map flood extent, depth, and frequency, establishing the physical baseline of risk. Ref. [45] demonstrated this effectively, combining GIS, remote sensing, and MCDA to produce a high-accuracy hazard susceptibility map in Ethiopia that directly fed into risk management planning. In the second stage—vulnerability and exposure layering—socioeconomic and demographic data are integrated with the hazard baseline using MCDA frameworks such as AHP or Fuzzy AHP, weighted against locally relevant indicators of social vulnerability, infrastructure exposure, and adaptive capacity. Ref. [132] illustrated this stage in the context of Ghana’s agricultural basin, linking climate-driven hazard projections with vulnerability and exposure data through an impact chain methodology to produce an integrated risk assessment. In the third stage—synthesis and decision support—the combined hazard–vulnerability–exposure layers are translated into actionable risk scores using composite indices such as the FRI or UFRI, enabling spatial prioritization for flood mitigation investment and policy targeting. Ref. [176] demonstrated this operationally, combining SWMM hydrological modeling with Random Forest and TOPSIS decision-making to match flood risk demand with resource supply in high-density urban zones. This three-stage pathway—delineate, layer, synthesize—is deliberately method-agnostic, allowing practitioners to select the most appropriate tools at each stage based on data availability and local context, making it applicable across both data-rich urban environments and data-scarce rural settings where current integrated frameworks remain absent. By moving from isolated assessments to a comprehensive framework, flood management becomes more precise, adaptive, and resilient, supporting sustainable, long-term flood resilience in vulnerable areas.

4.5. Rural Flooding Compared to Urban, Riverine, and Pluvial Floods

A review of contemporary flood risk research reveals a pronounced emphasis on riverine, pluvial, and urban flooding due to their immediate impact and growing frequency. Pluvial flooding, where intense rainfall exceeds the drainage capacity of both urban infrastructure and natural land surfaces, has garnered significant attention as climate change projections forecast more extreme rainfall events, particularly in densely populated areas. This urban-centric focus highlights the critical need for resilient urban planning and infrastructure capable of managing flood risks in densely populated areas. However, developing robust forecasting models remains challenging due to the complex processes involved in urban flooding, limited long-term observations, and data variability [167,179,189]. Innovative approaches integrating satellite imagery, gauged measurements, and citizen observations are advancing urban flood forecasting, using key inputs like digital elevation models and rainfall data to improve modeling accuracy. Ref. [173] empirically demonstrated this, showing that spatiotemporal analysis of urban rainstorm waterlogging effectively tracked urbanization impacts on flood dynamics, directly supporting sustainable urban flood management planning. Many countries are complementing these advancements with both structural and non-structural measures, including spatial planning and green infrastructure, which aim to curb the frequency and impact of urban floods.
Although progress has been made, flood risk in rural areas is still considerably understudied despite their special vulnerabilities and considerable effects. Recent research, including the work by [186], indicates that rural flood hazards account for 22% of predicted flood damages in Ethiopia, highlighting the substantial consequences these floods may cause. Flood response in rural regions encounters unique difficulties frequently worsened by scarce resources, inadequate infrastructure and limited emergency service availability. Moreover, uncalibrated flood models for rural areas tend to perform poorly, pointing to the need for improved calibration and validation methods tailored to rural hydrological dynamics [190]. This underrepresentation is not incidental but reflects three interrelated structural barriers. First, data scarcity remains the most fundamental constraint, as rural areas typically lack the dense networks of rain gauges, streamflow sensors, and high-resolution DEMs that urban flood modeling depends upon, as confirmed by [183], who noted that their GIS-MCDA framework was specifically designed to function in ungauged catchments precisely because standard data infrastructure is absent in rural contexts. Second, model inadaptation compounds this problem. The dominant tools identified in this review, including HEC-RAS, machine learning algorithms, and MCDA frameworks, were largely developed and calibrated for urban and riverine environments with structured infrastructure and well-defined drainage systems, making their direct application to dispersed rural settlements and agricultural landscapes unreliable without substantial recalibration. Third, rural flooding receives disproportionately low policy attention, as disaster risk reduction frameworks have historically prioritized urban centers due to their higher population density and economic concentration, leaving rural communities with fewer early warning systems, lower infrastructure investment, and limited representation in flood risk governance, as reflected in the finding that only 1 of the 89 included studies and even only 13 out of all eligible papers focused exclusively on rural flood contexts. As [178,186] suggest, frameworks incorporating rural flood risks alongside urban concerns are essential for capturing a complete picture of regional flood vulnerabilities.
The need to tackle flood risks in rural areas grows more apparent when reflecting on the extensive consequences of rural flooding. Floods often cause economic and farming damage in rural communities, jeopardizing food stability and unsettling local economies that depend on agriculture. Ref. [132] empirically confirmed this, demonstrating that flood risk in Ghana’s White Volta Basin—an agricultural region—is projected to increase by 19.3% by 2100 under climate change scenarios, with adaptive capacity severely constrained by socioeconomic vulnerabilities. Ref. [140] similarly showed that the Livelihood Vulnerability Index effectively mapped flood-exposed rural communities, highlighting the direct threat to food security and the urgent need for emergency planning tailored to agrarian contexts. Interruptions to transportation, supply networks and service accessibility due to flooding further trigger ripple effects for urban centers reliant on rural supplies. However, the practical management consequences of the urban–rural divide extend beyond resource disruption. The absence of rural-specific flood control decision-making frameworks means that rural communities are typically reactive rather than proactive in flood response—lacking the early warning infrastructure, spatial planning tools, and institutional capacity that urban centers increasingly benefit from. Furthermore, the failure of urban–rural coordination in flood management creates systemic vulnerabilities—when rural flooding disrupts agricultural supply chains, transportation corridors, and water systems, the cascading effects on urban food security and economic stability are rarely accounted for in urban flood risk frameworks, creating blind spots in regional resilience planning [168]. For example, disruptions in rural–urban linkages can interrupt the flow of essential goods and services, which are critical to the resilience and economic stability of nearby cities [178].
Incorporating flood risk into flood management is thus crucial for developing a thorough and fair approach to flood resilience. Effective flood evaluation and planning need to expand their focus to cover rural regions, guaranteeing that flood resilience efforts safeguard every community. Ref. [191] illustrated the scale of this need, finding that approximately 24,837 hectares of crop area and 95 villages fell within high flood risk zones in their study region, a finding that underscores the urgency of developing rural-specific risk assessment frameworks that go beyond the urban-dominated methodologies currently prevalent in the literature. Improved flood modeling designed for environment infrastructure improvements capable of enduring rural floods and flexible risk management techniques considering local requirements will be vital for reducing rural flood hazards. By developing resilience in both rural and urban areas, regions can strengthen their overall capacity to manage the increasing frequency of flood events, creating a more robust defense against future climate-driven flood challenges.

4.6. Climate Change Adaptability of Geospatial Methods

Climate change is fundamentally altering the frequency, intensity, and spatial distribution of flood events, presenting new and growing challenges to the geospatial methods reviewed in this study. While the tools identified across the 89 included studies have demonstrated considerable effectiveness under historical flood conditions, their adaptability to the emerging realities of climate-driven flooding warrants critical examination across three dimensions: extreme flood events, data timeliness, and model transferability under shifting climatic baselines.
The increasing frequency of extreme flood events poses perhaps the most immediate challenge to current geospatial methods. Static hazard mapping approaches—which represent the dominant paradigm across the reviewed literature—are calibrated against historical flood records and return period statistics that are rapidly becoming outdated under non-stationary climate conditions. Ref. [130] demonstrated this directly, showing that high-resolution downscaled CMIP5 climate models revealed critical flood peak increases in Vietnam’s Upper Thu Bon catchment that would not have been captured by historically calibrated models, while [131] confirmed that probabilistic flood risk assessments under RCP climate scenarios showed significant increases in flood hazard in South Korea—findings that underscore the inadequacy of static approaches in capturing future extremes. Furthermore, ref. [192] highlighted that multiscale flood risk assessments under climate change scenarios revealed future flood hazard trends in riverine urban centers that existing infrastructure was not designed to accommodate, pointing to a fundamental mismatch between current assessment frameworks and future flood realities.
Data timeliness represents a second critical challenge. Geospatial flood assessments depend heavily on input data, DEMs, land use maps, precipitation records, and socioeconomic datasets that are often static and periodically updated at best. As climate change accelerates land use transformation, sea-level rise, and hydrological regime shifts, the temporal gap between data collection and assessment application introduces growing uncertainty into flood risk outputs. Ref. [193] illustrated this limitation, noting that their GIS-based screening tool for climate change-related flood risks was constrained by the lack of historical flood data for validation, a challenge that will intensify as climate change drives flood events outside historical ranges. Ref. [118] similarly acknowledged that DEM resolution and sea-level rise scenario variability limited the reliability of coastal vulnerability assessments, reflecting the broader challenge of keeping geospatial inputs current in rapidly changing coastal environments.
The transferability of models calibrated under historical conditions to future climate scenarios constitutes a third challenge, one that is particularly acute for hydrodynamic and machine learning models. Ref. [84] demonstrated that fast flood simulation tools using steady-state models, while effective for early warning under known conditions, were limited by simplified dynamics that may affect precision in complex extreme scenarios—precisely the scenarios that climate change is making more frequent. Machine learning models face a related challenge: trained on historical flood data, they may underperform when flood patterns shift beyond the range of their training datasets, as confirmed by the Physics-Informed Machine Learning approach proposed by [90], which explicitly addressed the risk of purely data-driven models losing physical process understanding under novel climate conditions.
Collectively, these findings suggest that the geospatial flood assessment field must urgently transition from historically calibrated static frameworks toward dynamic, climate-adaptive approaches that explicitly incorporate future scenario projections, near-real-time data updating, and uncertainty quantification. The integration of climate scenario analysis tools, currently represented by only 6% (n = 5) of the 89 included studies, with established GIS, remote sensing, and machine learning methods represents the most promising pathway toward climate-resilient flood risk assessment frameworks capable of meeting the challenges of an increasingly flood-prone world.

5. Conclusions

This systematic review addressed four objectives: mapping the geospatial flood risk assessment methodological landscape (2010–2024); examining its evolution; quantifying the urban–rural research imbalance; and assessing the degree of hazard, vulnerability, and exposure integration across the literature. The analysis of 89 peer-reviewed studies yields four core findings that together reveal both the progress and the persistent blind spots of the field.
First, the methodological landscape remains anchored in established spatial tools—RS and GIS and hydrological modeling collectively account for nearly half of all technique applications—while machine learning and climate scenario analysis, despite their growing promise, remain underutilized at the margins of current practice. This distribution reflects not just methodological preference but structural constraints of data availability, computational capacity, and institutional familiarity that will need to be actively addressed to enable methodological transition.
Second, the urban–rural imbalance in flood research is stark and quantifiable—with rural flooding representing only a single included study—which fundamentally limits the field’s capacity to inform equitable flood risk management across all community types. This gap is driven by interrelated structural barriers: data scarcity, models ill-suited to rural contexts, and the historically low policy priority of rural flood governance.
Third, the fragmentation of hazard, vulnerability, and exposure assessments, with only 16% of studies combining any two components, represents a critical methodological shortcoming with direct policy consequences. Fragmented assessments systematically underestimate flood impacts and limit the actionability of risk frameworks. To address this, this review proposes a three-stage integration pathway—delineate, layer, synthesize—as a practical and method-agnostic approach applicable across diverse data environments.
Future research should prioritize three specific and actionable directions: the development of lightweight, low-data geospatial models specifically calibrated for rural hydrological conditions—moving beyond urban-optimized tools toward approaches that function effectively with sparse sensor networks and limited ground-truth data; the establishment of quantitative exposure assessment systems that dynamically track population distribution, critical infrastructure, and asset concentration within flood-prone areas, enabling exposure to be treated as a living dataset rather than a static input; and the systematic integration of climate scenario analysis into standard flood risk workflows—shifting the field from historically calibrated static assessments toward dynamic, forward-looking frameworks capable of capturing flood events beyond historical ranges under accelerating climate change.
This review acknowledges some key limitations. The search was restricted to Web of Science and ScienceDirect, which may not capture the full breadth of relevant literature. The language restriction to English and French excludes contributions from non-English-speaking research communities in flood-prone regions of Asia, Latin America, and Africa. The geographic distribution of included studies is skewed toward China and the United States, potentially limiting the generalizability of findings to other regional contexts.
By quantifying the methodological landscape, diagnosing the structural causes of persistent research gaps, and proposing a concrete integration pathway, this review offers both a rigorous assessment of the current state of geospatial flood risk science and a directional roadmap toward a more equitable, integrated, and climate-adaptive future for the field. For policymakers, the findings underscore the urgent need to expand flood risk governance frameworks beyond urban centers, invest in rural data infrastructure, and mandate integrated hazard, vulnerability, and exposure assessments as a standard requirement for national flood risk planning.

Supplementary Materials

The following supporting information can be downloaded at: https://www.mdpi.com/article/10.3390/urbansci10050271/s1, PRISMA 2020 for Abstracts Checklist; PRISMA 2020 Checklist [194]; Table of the 89 studies included.

Author Contributions

Both authors contributed to the design of the methodology and writing of the paper. F.G. conducted the systematic review, collected the data, and performed the analysis. M.H.A. provided supervision, resources, and contributed to the review, editing, and guidance throughout the research process. Both authors participated in the preparation of the manuscript and approved the final version for publication. All authors have read and agreed to the published version of the manuscript.

Funding

This research received no external funding.

Institutional Review Board Statement

Not applicable.

Informed Consent Statement

Not applicable.

Data Availability Statement

This study is a systematic review of published literature. No new data was created or analyzed, and all sources are publicly available as cited in the references.

Acknowledgments

We would like to thank the editor and the anonymous reviewers for the exceptionally thoughtful comments that greatly improved the paper.

Conflicts of Interest

The authors declare no conflicts of interest.

References

  1. Swart, R.J.; Fons, J.; Geertsema, W.; Hove, L.; Jacobs, C.M.J. Urban Vulnerability Indicators. A Joint Report of ETC-CCA and ETC-SIA. 2012. Available online: https://api.semanticscholar.org/CorpusID:132765007 (accessed on 8 November 2024).
  2. Fischer, S.; Schumann, A.H. Temporal Changes in the Frequency of Flood Types and Their Impact on Flood Statistics. J. Hydrol. X 2024, 22, 100171. [Google Scholar] [CrossRef]
  3. Meresa, H.; Griffin, A.; Kay, A. Understanding and Disentangling of Flood Generation Mechanisms [Internet]. 2024. Available online: https://meetingorganizer.copernicus.org/EGU24/EGU24-2832.html (accessed on 9 November 2024).
  4. Nguyen, H.D.; Nguyen, Q.-H.; Dang, D.K.; Van, C.P.; Truong, Q.H.; Pham, S.D.; Bui, Q.-T.; Petrisor, A.-I. A Novel Flood Risk Management Approach Based on Future Climate and Land Use Change Scenarios. Sci. Total Environ. 2024, 921, 171204. [Google Scholar] [CrossRef]
  5. Rupngam, T.; Messiga, A.J. Unraveling the Interactions between Flooding Dynamics and Agricultural Productivity in a Changing Climate. Sustainability 2024, 16, 6141. [Google Scholar] [CrossRef]
  6. Gül, B.; Kayaalp, N. Investigation of the Flood Event under Global Climate Change with Different Analysis Methods for Both Historical and Future Periods. J. Water Clim. Change 2024, 15, 3939–3965. [Google Scholar] [CrossRef]
  7. Hirabayashi, Y.; Mahendran, R.; Koirala, S.; Konoshima, L.; Yamazaki, D.; Watanabe, S.; Kim, H.; Kanae, S. Global Flood Risk under Climate Change. Nat. Clim. Change 2013, 3, 816–821. [Google Scholar] [CrossRef]
  8. Islam, R.; Kamaruddin, R.; Ahmad, S.A.; Jan, S.; Anuar, A.R. A Review on Mechanism of Flood Disaster Management in Asia. Int. Rev. Manag. Mark. 2016, 6, 29–52. [Google Scholar]
  9. Ranjan, R. Flood Disaster Management. In River System Analysis and Management; Sharma, N., Ed.; Springer: Singapore, 2017; pp. 371–417. ISBN 978-981-10-1471-0. [Google Scholar]
  10. Keenan-Jones, D.C.; Serra-Llobet, A.; He, H.; Kondolf, G.M. Urban Development and Long-Term Flood Risk and Resilience: Experiences over Time and across Cultures. Cases from Asia, North America, Europe and Australia. Urban Stud. 2023, 62, 469–486. [Google Scholar] [CrossRef]
  11. Tichavský, R.; Fabiánová, A.; Tolasz, R. Intra-Annual Dendrogeomorphic Dating and Climate Linkages of Flood Events in Headwaters of Central Europe. Sci. Total Environ. 2021, 763, 142953. [Google Scholar] [CrossRef]
  12. Mallakpour, I.; Villarini, G. Investigating the Relationship between the Frequency of Flooding over the Central United States and Large-Scale Climate. Adv. Water Resour. 2016, 92, 159–171. [Google Scholar] [CrossRef]
  13. Velásquez, N.; Quintero, F.; Koya, S.R.; Roy, T.; Mantilla, R. Snow-Detonated Floods: Assessment of the U.S. Midwest March 2019 Event. J. Hydrol. Reg. Stud. 2023, 47, 101387. [Google Scholar] [CrossRef]
  14. Armenakis, C.; Du, E.; Natesan, S.; Persad, R.; Zhang, Y. Flood Risk Assessment in Urban Areas Based on Spatial Analytics and Social Factors. Geosciences 2017, 7, 123. [Google Scholar] [CrossRef]
  15. Shankar, B.; Ghosh, S.; Mishra, V.N.; Kumari, M.; Singh, U. Flood Detection and Flood Mapping Using Multi-Temporal Synthetic Aperture Radar and Optical Data. In Advances in Water Resource Planning and Sustainability; Rai, P.K., Ed.; Advances in Geographical and Environmental Sciences; Springer Nature: Singapore, 2023; pp. 135–152. ISBN 978-981-99-3659-5. [Google Scholar]
  16. Tomar, P.; Singh, S.K.; Kanga, S.; Pattanaik, A.; Meraj, G. Use of Geospatial Technique in Urban Flood Hazard Management. In Disaster Management and Environmental Sustainability; Kumar, S., Singh, S.K., Kanga, S., Meraj, G., Farooq, M., Nathawat, M.S., Eds.; Wiley: New York, NY, USA, 2024; pp. 155–167. Available online: https://onlinelibrary.wiley.com/doi/10.1002/9781394167463.ch13 (accessed on 9 November 2024).
  17. Essa, N.D.; Aamir, M.; Mahmood, S.A.; Riaz, F.; Farooq, N.; Rasheed, R.; Fatima, S.Q.; Batool, S.; Mehmood, S.A.; Kaukab, I.S. Analysis of Flood Damage Assessment through WorldView-2, Quick Bird and Multispectral Satellite Imagery in Southern Punjab, Pakistan. Int. J. Innov. Sci. Technol. 2019, 1, 120–139. [Google Scholar] [CrossRef]
  18. Opolot, E. Application of Remote Sensing and Geographical Information Systems in Flood Management: A Review. Res. J. Appl. Sci. Eng. Technol. 2013, 6, 1884. [Google Scholar] [CrossRef]
  19. Sajjad, A.; Lu, J.; Chen, X.; Chisenga, C.; Saleem, N.; Hassan, H. Operational Monitoring and Damage Assessment of Riverine Flood-2014 in the Lower Chenab Plain, Punjab, Pakistan, Using Remote Sensing and GIS Techniques. Remote Sens. 2020, 12, 714. [Google Scholar] [CrossRef]
  20. Ajin, R.S.; Krishnamurthy, R.R.; Jayaprakash, M.; Vinod, P.G. Flood Hazard Assessment of Vamanapuram River Basin, Kerala, India: An Approach Using Remote Sensing & GIS Techniques. Adv. Appl. Sci. Res. 2013, 4, 263–274. [Google Scholar]
  21. Uddin, K.; Gurung, D.R.; Giriraj, A.; Shrestha, B. Application of Remote Sensing and GIS for Flood Hazard Management: A Case Study from Sindh Province, Pakistan. Am. J. Geogr. Inf. Syst. 2013, 2, 1–5. [Google Scholar] [CrossRef]
  22. Cabral, S.L.; Campos, J.N.B.; da Silva Silveira, C.; de Assis Teixeira, F.A. Hydrologic and Hydraulic Modelling Integrated with GIS: A Study of the Acaraú River Basin–CE. J. Urban Environ. Eng. 2014, 8, 168–174. [Google Scholar]
  23. Monte, B.E.O.; Costa, D.D.; Chaves, M.B.; Magalhães, L.d.O.; Uvo, C.B. Hydrological and Hydraulic Modelling Applied to the Mapping of Flood-Prone Areas. Rev. Bras. Recur. Hidr. 2016, 21, 152–167. [Google Scholar] [CrossRef]
  24. Al-Rawas, G.; Nikoo, M.R.; Al-Wardy, M.; Etri, T. A Critical Review of Emerging Technologies for Flash Flood Prediction: Examining Artificial Intelligence, Machine Learning, Internet of Things, Cloud Computing, and Robotics Techniques. Water 2024, 16, 2069. [Google Scholar] [CrossRef]
  25. Saravi, S.; Kalawsky, R.; Joannou, D.; Casado, M.; Fu, G.; Meng, F. Use of Artificial Intelligence to Improve Resilience and Preparedness Against Adverse Flood Events. Water 2019, 11, 973. [Google Scholar] [CrossRef]
  26. Waqas, M.; Bonnet, S.; Wannasing, U.H.; Hlaing, P.T.; Lin, H.A.; Hashim, S. Assessment of Advanced Artificial Intelligence Techniques for Flood Forecasting. In Proceedings of the 2023 International Multi-Disciplinary Conference in Emerging Research Trends (IMCERT), Karachi, Pakistan, 4–5 January 2023; IEEE: New York, NY, USA, 2023; pp. 1–6. [Google Scholar]
  27. Angelis, A.; Kanavos, P. Value-Based Assessment of New Medical Technologies: Towards a Robust Methodological Framework for the Application of Multiple Criteria Decision Analysis in the Context of Health Technology Assessment. Pharmacoeconomics 2016, 34, 435–446. [Google Scholar] [CrossRef] [PubMed]
  28. Chisholm, O.; Sharry, P.; Phillips, L. Multi-Criteria Decision Analysis for Benefit-Risk Analysis by National Regulatory Authorities. Front. Med. 2022, 8, 820335. [Google Scholar] [CrossRef]
  29. Aitsi-Selmi, A.; Egawa, S.; Sasaki, H.; Wannous, C.; Murray, V. The Sendai Framework for Disaster Risk Reduction: Renewing the Global Commitment to People’s Resilience, Health, and Well-Being. Int. J. Disaster Risk Sci. 2015, 6, 164–176. [Google Scholar] [CrossRef]
  30. Harnegie, M.P. SciVerse Science Direct. J. Med. Libr. Assoc. 2013, 101, 165. [Google Scholar] [CrossRef]
  31. Price, M.; Snyder, G. Research Publications in Web of Science Shift from Bitcoin to Blockchain, with Focus on Computer Science, Engineering, Telecommunications, and Business Economics. Sch. Inf. Stud. Res. J. 2020, 10, 11. [Google Scholar] [CrossRef]
  32. McCafferty, P.; Mercado Garcia, E. Systematic Bibliographic Database Searching for an Overview of Reviews: A Practical Guide Using Children’s Participation as a Case Study. Br. J. Soc. Work. 2024, 54, 1033–1052. [Google Scholar] [CrossRef]
  33. Ganjirad, M.; Delavar, M. Flood Risk Mapping Using Random Forest and Support Vector Machine. ISPRS Ann. Photogramm. Remote Sens. Spat. Inf. Sci. 2023, 10, 201–208. [Google Scholar] [CrossRef]
  34. Zhang, W.; Hu, B.; Liu, Y.; Zhang, X.; Li, Z. Urban Flood Risk Assessment through the Integration of Natural and Human Resilience Based on Machine Learning Models. Remote Sens. 2023, 15, 3678. [Google Scholar] [CrossRef]
  35. Contreras, B.P.; Tate, S.A.; Morris, S.L.; Kahng, S. A Systematic Review of the Correspondence between Descriptive Assessment and Functional Analysis. J. Appl. Behav. Anal. 2023, 56, 146–165. [Google Scholar] [CrossRef]
  36. Agakpe, M.D.; Nyatuame, M.; Ampiaw, F. Development of Intensity–Duration–Frequency (IDF) Curves Using Combined Rain Gauge (RG) and Remote Sense (TRMM) Datasets for Weta Traditional Area in Ghana. HydroResearch 2024, 7, 109–121. [Google Scholar] [CrossRef]
  37. Alarifi, S.S.; Abdelkareem, M.; Abdalla, F.; Alotaibi, M. Flash Flood Hazard Mapping Using Remote Sensing and GIS Techniques in Southwestern Saudi Arabia. Sustainability 2022, 14, 14145. [Google Scholar] [CrossRef]
  38. Alharbi, T. A Weighted Overlay Analysis for Assessing Urban Flood Risks in Arid Lands: A Case Study of Riyadh, Saudi Arabia. Water 2024, 16, 397. [Google Scholar] [CrossRef]
  39. Araujo, P.V.N.; Amaro, V.E.; Silva, R.M.; Lopes, A.B. Delimitation of Flood Areas Based on a Calibrated a DEM and Geoprocessing: Case Study on the Uruguay River, Itaqui, Southern Brazil. Nat. Hazards Earth Syst. Sci. 2019, 19, 237–250. [Google Scholar] [CrossRef]
  40. Ayenew, W.A.; Kebede, H.A. GIS and Remote Sensing Based Flood Risk Assessment and Mapping: The Case of Dikala Watershed in Kobo Woreda Amhara Region, Ethiopia. Environ. Sustain. Indic. 2023, 18, 100243. [Google Scholar] [CrossRef]
  41. Bashir, B.; Alsalman, A. Flooding Hazard Vulnerability Assessment Using Remote Sensing Data and Geospatial Techniques: A Case Study from Mekkah Province, Saudi Arabia. Water 2024, 16, 2714. [Google Scholar] [CrossRef]
  42. Borges, D.E.; Ramage, S.; Green, D.; Justice, C.; Nakalembe, C.; Whitcraft, A.; Barker, B.; Becker-Reshef, I.; Balagizi, C.; Salvi, S.; et al. Earth Observations into Action: The Systemic Integration of Earth Observation Applications into National Risk Reduction Decision Structures. Disaster Prev. Manag. 2023, 32, 163–185. [Google Scholar] [CrossRef]
  43. Cohen, S.; Brakenridge, G.R.; Kettner, A.; Bates, B.; Nelson, J.; McDonald, R.; Huang, Y.-F.; Munasinghe, D.; Zhang, J. Estimating Floodwater Depths from Flood Inundation Maps and Topography. J. Am. Water Resour. Assoc. 2018, 54, 847–858. [Google Scholar] [CrossRef]
  44. Dashtian, H.; Young, M.H.; Young, B.E.; McKinney, T.; Rateb, A.M.; Niyogi, D.; Kumar, S.V. A Framework to Nowcast Soil Moisture with NASA SMAP Level 4 Data Using In-Situ Measurements and Deep Learning. J. Hydrol. Reg. Stud. 2024, 56, 102020. [Google Scholar] [CrossRef]
  45. Diriba, D.; Karuppannan, S. An Integrated Approach to Identify Flood Hazard and Risk Areas in Melka Soda District, Southern Ethiopia. Quat. Sci. Adv. 2024, 15, 100211. [Google Scholar] [CrossRef]
  46. Elstohy, R.; Ali, E.M. A Flash Flood Detected Area Using Classification-Based Image Processing for Sentinel-2 Satellites Data: A Case Study of Zafaraana Road at Red Sea. Egypt. J. Remote Sens. Space Sci. 2023, 26, 807–814. [Google Scholar] [CrossRef]
  47. Fan, Y.; Yu, S.; Wang, J.; Li, P.; Chen, S.; Ji, H.; Li, P.; Dou, S. Changes of Inundation Frequency in the Yellow River Delta and Its Response to Wetland Vegetation. Land 2022, 11, 1647. [Google Scholar] [CrossRef]
  48. Gevaert, C.M.; Buunk, T.; van den Homberg, M.J.C. Auditing Geospatial Datasets for Biases: Using Global Building Datasets for Disaster Risk Management. IEEE J. Sel. Top. Appl. Earth Obs. Remote Sens. 2024, 17, 12579–12590. [Google Scholar] [CrossRef]
  49. Guardiola-Albert, C.; Rivero-Honegger, C.; Monjo, R.; Diez-Herrero, A.; Yague, C.; Bodoque, J.M.; Tapiador, F.J. Automated Convective and Stratiform Precipitation Estimation in a Small Mountainous Catchment Using X-Band Radar Data in Central Spain. J. Hydroinform. 2017, 19, 315–330. [Google Scholar] [CrossRef]
  50. Guillaume Courty, L.; Cesar Soriano-Monzalvo, J.; Pedrozo-Acuna, A. Evaluation of Open-Access Global Digital Elevation Models (AW3D30, SRTM, and ASTER) for Flood Modelling Purposes. J. Flood Risk Manag. 2019, 12, e12550. [Google Scholar] [CrossRef]
  51. Guo, H.; Cai, Y.; Yang, Z.; Zhu, Z.; Ouyang, Y. Dynamic Simulation of Coastal Wetlands for Guangdong-Hong Kong-Macao Greater Bay Area Based on Multi-Temporal Landsat Images and FLUS Model. Ecol. Indic. 2021, 125, 107559. [Google Scholar] [CrossRef]
  52. Ibrahim, Y.A.; Salim, E. Building Resiliency in Floodplain Management: Land Use in Hydrology Treated as a Moving Target. Curr. Res. Environ. Sustain. 2023, 6, 100234. [Google Scholar] [CrossRef]
  53. Jamali, B.; Lowe, R.; Bach, P.M.; Urich, C.; Arnbjerg-Nielsen, K.; Deletic, A. A Rapid Urban Flood Inundation and Damage Assessment Model. J. Hydrol. 2018, 564, 1085–1098. [Google Scholar] [CrossRef]
  54. Kim, S.; Kim, Y.; Ghorbani, M.A.; Kim, D. Analysis on the Temporal Scaling Behavior of Extreme Rainfall in Korean Peninsula Based on High-Resolution Radar-Based Precipitation Data. J. Hydrol. Reg. Stud. 2024, 55, 101915. [Google Scholar] [CrossRef]
  55. Lei, T.; Wang, J.; Li, X.; Wang, W.; Shao, C.; Liu, B. Flood Disaster Monitoring and Emergency Assessment Based on Multi-Source Remote Sensing Observations. Water 2022, 14, 2207. [Google Scholar] [CrossRef]
  56. Lu, Y.; Zhai, G.; Zhou, S. An Integrated Bayesian Networks and Geographic Information System (BNs-GIS) Approach for Flood Disaster Risk Assessment: A Case Study of Yinchuan, China. Ecol. Indic. 2024, 166, 112322. [Google Scholar] [CrossRef]
  57. Magliulo, P.; Valente, A. GIS-Based Geomorphological Map of the Calore River Floodplain Near Benevento (Southern Italy) Overflooded by the 15th October 2015 Event. Water 2020, 12, 148. [Google Scholar] [CrossRef]
  58. Manfreda, S.; Samela, C. A Digital Elevation Model Based Method for a Rapid Estimation of Flood Inundation Depth. J. Flood Risk Manag. 2019, 12, 12541. [Google Scholar] [CrossRef]
  59. Mendoza, E.T.; Salameh, E.; Sakho, I.; Turki, I.; Almar, R.; Ojeda, E.; Deloffre, J.; Frappart, F.; Laignel, B. Coastal Flood Vulnerability Assessment, a Satellite Remote Sensing and Modeling Approach. Remote Sens. Appl.-Soc. Environ. 2023, 29, 100923. [Google Scholar] [CrossRef]
  60. Meng, X.; Zhang, M.; Wen, J.; Du, S.; Xu, H.; Wang, L.; Yang, Y. A Simple GIS-Based Model for Urban Rainstorm Inundation Simulation. Sustainability 2019, 11, 2830. [Google Scholar] [CrossRef]
  61. Parida, B.R.; Tripathi, G.; Pandey, A.C.; Kumar, A. Estimating Floodwater Depth Using SAR-Derived Flood Inundation Maps and Geomorphic Model in Kosi River Basin (India). Geocarto Int. 2022, 37, 4336–4360. [Google Scholar] [CrossRef]
  62. Schmidt, S.; Nuesser, M.; Baghel, R.; Dame, J. Cryosphere Hazards in Ladakh: The 2014 Gya Glacial Lake Outburst Flood and Its Implications for Risk Assessment. Nat. Hazards 2020, 104, 2071–2095. [Google Scholar] [CrossRef]
  63. Shuang, Z.; Qiu, C.; Cun-Rui, H.; Zhe, W. Establishment and Validation of Health Vulnerability and Adaptation Indices under Extreme Weather Events on the Basis of the 2016 Flood in Anhui Province, China. Adv. Clim. Change Res. 2021, 12, 649–659. [Google Scholar]
  64. Surwase, T.; Manjusree, P.; Prakash, S.; Kuntla, S. Development of Algorithms for Evaluating Performance of Flood Simulation Models with Satellite-Derived Flood. H2open J. 2020, 3, 222–235. [Google Scholar] [CrossRef]
  65. Syakira, N.; Tan, M.L.; Zulkafli, Z.; Zhang, F.; Tangang, F.; Chang, C.K.; Ibrahim, W.M.M.W.; Ramli, M.H.P. Assessment of Three GPM IMERG Products for GIS-Based Tropical Flood Hazard Mapping Using Analytical Hierarchy Process. Water 2023, 15, 2195. [Google Scholar] [CrossRef]
  66. Thirumurugan, P.; Krishnaveni, M. Flood Hazard Mapping Using Geospatial Techniques and Satellite Imagesa Case Study of Coastal District of Tamil Nadu. Environ. Monit. Assess. 2019, 191, 193. [Google Scholar] [CrossRef] [PubMed]
  67. Wang, G.; Li, P.; Li, Z.; Ding, D.; Qiao, L.; Xu, J.; Li, G.; Wang, H. Coastal Dam Inundation Assessment for the Yellow River Delta: Measurements, Analysis and Scenario. Remote Sens. 2020, 12, 3658. [Google Scholar] [CrossRef]
  68. Zingaro, M.; Hostache, R.; Chini, M.; Capolongo, D.; Matgen, P. A Localized Particle Filtering Approach to Advance Flood Frequency Estimation at Large Scale Using Satellite Synthetic Aperture Radar Image Collection and Hydrodynamic Modelling. Remote Sens. 2024, 16, 2179. [Google Scholar] [CrossRef]
  69. Ayoub, V.; Delenne, C.; Chini, M.; Finaud-Guyot, P.; Mason, D.; Matgen, P.; Maria-Pelich, R.; Hostache, R. A Porosity-Based Flood Inundation Modelling Approach for Enabling Faster Large Scale Simulations. Adv. Water Resour. 2022, 162, 104141. [Google Scholar] [CrossRef]
  70. Dewals, B.; Kitsikoudis, V.; Mejía-Morales, M.A.; Archambeau, P.; Mignot, E.; Proust, S.; Erpicum, S.; Pirotton, M.; Paquier, A. Can the 2D Shallow Water Equations Model Flow Intrusion into Buildings during Urban Floods? J. Hydrol. 2023, 619, 129231. [Google Scholar] [CrossRef]
  71. Dhote, P.R.; Joshi, Y.; Rajib, A.; Thakur, P.K.; Nikam, B.R.; Aggarwal, S.P. Evaluating Topography-Based Approaches for Fast Floodplain Mapping in Data-Scarce Complex-Terrain Regions: Findings from a Himalayan Basin. J. Hydrol. 2023, 620, 129309. [Google Scholar] [CrossRef]
  72. Dong, L.; Dong, X.; Ma, Y.; Wei, C.; Yu, D.; Bo, H.; Guo, J. An Integrated Time-Varying Moment (ITVM) Model for Flood Frequency Re-Analysis under Future Climate Change Conditions. Flood Risk Manag. 2024, 17, 13012. [Google Scholar] [CrossRef]
  73. Ferrari, A. A Parallel Porosity Model for Large-Scale Modelling of River Floods in Urban Areas. J. Hydrol. 2024, 635, 131232. [Google Scholar] [CrossRef]
  74. Goumas, C.; Trichakis, I.; Vozinaki, A.-I.; Karatzas, G.P. Flood Risk Assessment and Flow Modeling of the Stalos Stream Area. J. Hydroinform. 2022, 24, 677–696. [Google Scholar] [CrossRef]
  75. Kastridis, A.; Stathis, D. Evaluation of Hydrological and Hydraulic Models Applied in Typical Mediterranean Ungauged Watersheds Using Post-Flash-Flood Measurements. Hydrology 2020, 7, 12. [Google Scholar] [CrossRef]
  76. Kim, J.; Amodeo, M.; Kearns, E.J. Atlas of Probabilistic Extreme Precipitation Based on the Early 21st Century Records in the United States. J. Hydrol. Reg. Stud. 2023, 48, 101480. [Google Scholar] [CrossRef]
  77. Malgwi, M.B.; Ramirez, J.A.; Zischg, A.; Zimmermann, M.; Schuermann, S.; Keiler, M. A Method to Reconstruct Flood Scenarios Using Field Interviews and Hydrodynamic Modelling: Application to the 2017 Suleja and Tafa, Nigeria Flood. Nat. Hazards 2021, 108, 1781–1805. [Google Scholar] [CrossRef]
  78. Pena, F.; Nardi, F.; Melesse, A.; Obeysekera, J.; Castelli, F.; Price, R.M.; Crowl, T.; Gonzalez-Ramirez, N. Compound Flood Modeling Framework for Surface-Subsurface Water Interactions. Nat. Hazards Earth Syst. Sci. 2022, 22, 775–793. [Google Scholar] [CrossRef]
  79. Pons, F.; Alquier, M.; Paya, E.; Moulin, C.; Panier, N.; Chollet, A.-E. First tests of Cartino2D method on Toulon French metropolis. LHB-Hydrosci. J. 2021, 107, 1912968. [Google Scholar]
  80. Romali, N.S.; Yusop, Z. Flood Damage and Risk Assessment for Urban Area in Malaysia. Hydrol. Res. 2021, 52, 142–159. [Google Scholar] [CrossRef]
  81. Seleem, O.; Heistermann, M.; Bronstert, A. Efficient Hazard Assessment for Pluvial Floods in Urban Environments: A Benchmarking Case Study for the City of Berlin, Germany. Water 2021, 13, 2476. [Google Scholar] [CrossRef]
  82. Tian, F.; Ma, B.; Yuan, X.; Wang, X.; Yue, Z. Hazard Assessments of Riverbank Flooding and Backward Flows in Dike-Through Drainage Ditches during Moderate Frequent Flooding Events in the Ningxia Reach of the Upper Yellow River (NRYR). Water 2019, 11, 1477. [Google Scholar] [CrossRef]
  83. Trinh, M.X.; Molkenthin, F. Flood Hazard Mapping for Data-Scarce and Ungauged Coastal River Basins Using Advanced Hydrodynamic Models, High Temporal-Spatial Resolution Remote Sensing Precipitation Data, and Satellite Imageries. Nat. Hazards 2021, 109, 441–469. [Google Scholar] [CrossRef]
  84. van den Bout, B.; Jetten, V.G.; van Westen, C.J.; Lombardo, L. A Breakthrough in Fast Flood Simulation. Environ. Model. Softw. 2023, 168, 105787. [Google Scholar] [CrossRef]
  85. Wing, O.E.J.; Sampson, C.C.; Bates, P.D.; Quinn, N.; Smith, A.M.; Neal, J.C. A Flood Inundation Forecast of Hurricane Harvey Using a Continental-Scale 2D Hydrodynamic Model. J. Hydrol. X 2019, 4, 100039. [Google Scholar] [CrossRef]
  86. Yang, J.; Wang, J.; Hu, Y.; Li, B.; Zhao, J.; Liang, Z. Flood Risk Mapping for the Area with Mixed Floods and Human Impact: A Case Study of Yarkant River Basin in Xinjiang, China. Environ. Res. Commun. 2023, 5, 095005. [Google Scholar] [CrossRef]
  87. Albertini, C.; Gioia, A.; Iacobellis, V.; Petropoulos, G.P.; Manfreda, S. Assessing Multi-Source Random Forest Classification and Robustness of Predictor Variables in Flooded Areas Mapping. Remote Sens. Appl. Soc. Environ. 2024, 35, 101239. [Google Scholar] [CrossRef]
  88. Alvarez-Estrella, J.; Munoz, P.; Bendix, J.; Contreras, P.; Celleri, R. Enhancing Peak Runoff Forecasting through Feature Engineering Applied to X-Band Radar Data. Water 2024, 16, 968. [Google Scholar] [CrossRef]
  89. Argyroudis, S.A.; Mitoulis, S.A.; Chatzi, E.; Baker, J.W.; Brilakis, I.; Gkoumas, K.; Vousdoukas, M.; Hynes, W.; Carluccio, S.; Keou, O.; et al. Digital Technologies Can Enhance Climate Resilience of Critical Infrastructure. Clim. Risk Manag. 2022, 35, 100387. [Google Scholar] [CrossRef]
  90. Bhasme, P.; Vagadiya, J.; Bhatia, U. Enhancing Predictive Skills in Physically-Consistent Way: Physics Informed Machine Learning for Hydrological Processes. J. Hydrol. 2022, 615, 128618. [Google Scholar] [CrossRef]
  91. Ghaffarian, S.; Taghikhah, F.R.; Maier, H.R. Explainable Artificial Intelligence in Disaster Risk Management: Achievements and Prospective Futures. Int. J. Disaster Risk Reduct. 2023, 98, 104123. [Google Scholar] [CrossRef]
  92. Ghosh, S.; Saha, S.; Bera, B. Flood Susceptibility Zonation Using Advanced Ensemble Machine Learning Models within Himalayan Foreland Basin. Nat. Hazards Res. 2022, 2, 363–374. [Google Scholar] [CrossRef]
  93. Hashemi-Beni, L.; Puthenparampil, M.; Jamali, A. A Low-Cost IoT-Based Deep Learning Method of Water Gauge Measurement for Flood Monitoring. Nat. Hazards Risk 2024, 15, 2364777. [Google Scholar] [CrossRef]
  94. Meadows, M.; Wilson, M. A Comparison of Machine Learning Approaches to Improve Free Topography Data for Flood Modelling. Remote Sens. 2021, 13, 275. [Google Scholar] [CrossRef]
  95. Rafiei-Sardooi, E.; Azareh, A.; Choubin, B.; Mosavi, A.H.; Clague, J.J. Evaluating Urban Flood Risk Using Hybrid Method of TOPSIS and Machine Learning. Int. J. Disaster Risk Reduct. 2021, 66, 102614. [Google Scholar] [CrossRef]
  96. Ren, H.; Pang, B.; Bai, P.; Zhao, G.; Liu, S.; Liu, Y.; Li, M. Flood Susceptibility Assessment with Random Sampling Strategy in Ensemble Learning (RF and XGBoost). Remote Sens. 2024, 16, 320. [Google Scholar] [CrossRef]
  97. Saikh, N.I.; Mondal, P. GIS-Based Machine Learning Algorithm for Flood Susceptibility Analysis in the Pagla River Basin, Eastern India. Nat. Hazards Res. 2023, 3, 420–436. [Google Scholar] [CrossRef]
  98. Shreevastav, B.B.; Tiwari, K.R.; Mandal, R.A.; Singh, B. “Flood Risk Modeling in Southern Bagmati Corridor, Nepal” (a Study from Sarlahi and Rautahat, Nepal). Prog. Disaster Sci. 2022, 16, 100260. [Google Scholar] [CrossRef]
  99. Yang, J.; Ahn, D.; Bahk, J.; Park, S.; Rizqihandari, N.; Cha, M. Assessing Climate Risks from Satellite Imagery with Machine Learning: A Case Study of Flood Risks in Jakarta. Clim. Risk Manag. 2024, 46, 100651. [Google Scholar] [CrossRef]
  100. Ettinger, S.; Mounaud, L.; Magill, C.; Yao-Lafourcade, A.-F.; Thouret, J.-C.; Manville, V.; Negulescu, C.; Zuccaro, G.; De Gregorio, D.; Nardone, S.; et al. Building Vulnerability to Hydro-Geomorphic Hazards: Estimating Damage Probability from Qualitative Vulnerability Assessment Using Logistic Regression. J. Hydrol. 2016, 541, 563–581. [Google Scholar] [CrossRef]
  101. Hidayah, E.; Indarto; Lee, W.-K.; Halik, G.; Pradhan, B. Assessing Coastal Flood Susceptibility in East Java, Indonesia: Comparison of Statistical Bivariate and Machine Learning Techniques. Water 2022, 14, 3869. [Google Scholar] [CrossRef]
  102. Houessou-Dossou, E.A.Y.; Mwangi Gathenya, J.; Njuguna, M.; Abiero Gariy, Z. Flood Frequency Analysis Using Participatory GIS and Rainfall Data for Two Stations in Narok Town, Kenya. Hydrology 2019, 6, 90. [Google Scholar] [CrossRef]
  103. Liu, X.; Hu, H.; Hu, P. Accuracy Assessment of LiDAR-Derived Digital Elevation Models Based on Approximation Theory. Remote Sens. 2015, 7, 7062–7079. [Google Scholar] [CrossRef]
  104. Longenecker, H.E.; Graeden, E.; Kluskiewicz, D.; Zuzak, C.; Rozelle, J.; Aziz, A.L. A Rapid Flood Risk Assessment Method for Response Operations and Nonsubject-Matter-Expert Community Planning. J. Flood Risk Manag. 2020, 13, 12579. [Google Scholar] [CrossRef]
  105. Nguyen-Huy, T.; Kath, J.; Nagler, T.; Khaung, Y.; Aung, T.S.S.; Mushtaq, S.; Marcussen, T.; Stone, R. A Satellite-Based Standardized Antecedent Precipitation Index (SAPI) for Mapping Extreme Rainfall Risk in Myanmar. Remote Sens. Appl. Soc. Environ. 2022, 26, 100733. [Google Scholar] [CrossRef]
  106. Osman, S.A.; Das, J. A Robust Ensemble of Hybrid and Bivariate Statistical Models for Flood Prediction Mapping in Lower Damodar River Basin of India. Geosystems Geoenviron. 2024, 3, 100312. [Google Scholar] [CrossRef]
  107. Peña, F.; Obeysekera, J.; Jane, R.; Nardi, F.; Maran, C.; Cadogan, A.; de Groen, F.; Melesse, A. Investigating Compound Flooding in a Low Elevation Coastal Karst Environment Using Multivariate Statistical and 2D Hydrodynamic Modeling. Weather. Clim. Extrem. 2023, 39, 100534. [Google Scholar] [CrossRef]
  108. Rasool, S.; Rana, I.A.; Waseem, H.B. Assessing Multidimensional Vulnerability of Rural Areas to Flooding: An Index-Based Approach. Int. J. Disaster Risk Sci. 2024, 15, 88–106. [Google Scholar] [CrossRef]
  109. Zhang, X.; Kang, A.; Song, Q.; Guo, Y.; Liu, Y.; Lei, X.; Wang, H. Characteristics and Risk Management of Urban Surface Flooding in Guangzhou, China: Insights from 2022 Ground Monitoring. J. Hydrol. Reg. Stud. 2024, 53, 101831. [Google Scholar] [CrossRef]
  110. Al-Taani, A.; Al-husban, Y.; Ayan, A. Assessment of Potential Flash Flood Hazards. Concerning Land Use/Land Cover in Aqaba Governorate, Jordan, Using a Multi-Criteria Technique. Egypt. J. Remote Sens. Space Sci. 2023, 26, 17–24. [Google Scholar] [CrossRef]
  111. Baalousha, H.M.; Younes, A.; Yassin, M.A.; Fahs, M. Comparison of the Fuzzy Analytic Hierarchy Process (F-AHP) and Fuzzy Logic for Flood Exposure Risk Assessment in Arid Regions. Hydrology 2023, 10, 136. [Google Scholar] [CrossRef]
  112. Hawchar, L.; Naughton, O.; Nolan, P.; Stewart, M.G.; Ryan, P.C. A GIS-Based Framework for High-Level Climate Change Risk Assessment of Critical Infrastructure. Clim. Risk Manag. 2020, 29, 100235. [Google Scholar] [CrossRef]
  113. Kazakis, N.; Kougias, I.; Patsialis, T. Assessment of Flood Hazard Areas at a Regional Scale Using an Index-Based Approach and Analytical Hierarchy Process: Application in Rhodope-Evros Region, Greece. Sci. Total Environ. 2015, 538, 555–563. [Google Scholar] [CrossRef] [PubMed]
  114. Liu, J.; Zhang, C. Identification of Risks and Estimation of Flood Storage in Ponds. Math. Probl. Eng. 2017, 2017, 7348384. [Google Scholar] [CrossRef]
  115. Marzo, E.; Busini, V.; Rota, R. Definition of a Shortcut Methodology for Assessing Flood-Related Na-Tech Risk. Nat. Hazards Earth Syst. Sci. 2012, 12, 3241–3253. [Google Scholar] [CrossRef]
  116. Moghadas, M.; Asadzadeh, A.; Vafeidis, A.; Fekete, A.; Koetter, T. A Multi-Criteria Approach for Assessing Urban Flood Resilience in Tehran, Iran. Int. J. Disaster Risk Reduct. 2019, 35, 101069. [Google Scholar] [CrossRef]
  117. Ozegin, K.O.; Ilugbo, S.O. Evaluation of Potentially Susceptible Flooding Areas Leveraging Geospatial Technology with Multicriteria Decision Analysis in Edo State, Nigeria. Nat. Hazards Res. 2025, 5, 109–133. [Google Scholar] [CrossRef]
  118. Rocha, C.; Antunes, C.; Catita, C. Coastal Vulnerability Assessment Due to Sea Level Rise: The Case Study of the Atlantic Coast of Mainland Portugal. Water 2020, 12, 360. [Google Scholar] [CrossRef]
  119. Selvam, R.A.; Jebamalai, A.R.A. Application of the Analytical Hierarchy Process (AHP) for Flood Susceptibility Mapping Using GIS Techniques in Thamirabarani River Basin, Srivaikundam Region, Southern India. Nat. Hazards 2023, 118, 1065–1083. [Google Scholar] [CrossRef]
  120. Solanki, Y.P.; Kumar, V.; Sharma, K.V.; Deshmukh, A.; Tiwari, D.K. Flood Hazard Analysis in Mumbai Using Geospatial and Multi-Criteria Decision-Making Techniques. J. Water Clim. Change 2024, 15, 2484–2500. [Google Scholar] [CrossRef]
  121. Torok, I. Qualitative Assessment of Social Vulnerability to Flood Hazards in Romania. Sustainability 2018, 10, 3780. [Google Scholar] [CrossRef]
  122. Usman Kaoje, I.; Abdul Rahman, M.Z.; Idris, N.H.; Razak, K.A.; Wan Mohd Rani, W.N.M.; Tam, T.H.; Mohd Salleh, M.R. Physical Flood Vulnerability Assessment Using Geospatial Indicator-Based Approach and Participatory Analytical Hierarchy Process: A Case Study in Kota Bharu, Malaysia. Water 2021, 13, 1786. [Google Scholar] [CrossRef]
  123. Wu, J.; Jiang, X. Flood Disaster Risk Assessment in Wuhan City Based on GIS Analysis and Indicator Ranking Using Random Forest. Buildings 2024, 14, 1370. [Google Scholar] [CrossRef]
  124. Xu, Y.; Guo, H.; Liu, J.; Sun, R.; Li, X. Wildfire Risks under a Changing Climate: Synthesized Assessments of Wildfire Risks over Southwestern China. Front. Environ. Sci. 2023, 11, 1137372. [Google Scholar] [CrossRef]
  125. Zhang, Z.; Zhang, J.; Zhang, Y.; Chen, Y.; Yan, J. Urban Flood Resilience Evaluation Based on GIS and Multi-Source Data: A Case Study of Changchun City. Remote Sens. 2023, 15, 1872. [Google Scholar] [CrossRef]
  126. Zhu, F.; Zhong, P.-A.; Sun, Y.; Yeh, W.W.-G. Real-Time Optimal Flood Control Decision Making and Risk Propagation Under Multiple Uncertainties. Water Resour. Res. 2017, 53, 10635–10654. [Google Scholar] [CrossRef]
  127. Hieronymus, M.; Kalen, O. Should Swedish Sea Level Planners Worry More about Mean Sea Level Rise or Sea Level Extremes? Ambio 2022, 51, 2325–2332. [Google Scholar] [CrossRef]
  128. Li, B.; Tan, L.; Zhang, X.; Qi, J.; Marek, G.W.; Li, Y.; Dong, X.; Zhao, W.; Chen, T.; Feng, P.; et al. Modeling Streamflow Response under Changing Environment Using a Modified SWAT Model with Enhanced Representation of CO2 Effects. J. Hydrol. Reg. Stud. 2023, 50, 101547. [Google Scholar] [CrossRef]
  129. Liu, K.; Kinouchi, T.; Tan, R.; Heng, S.; Chhuon, K.; Zhao, W. Unraveling Urban Hydro-Environmental Response to Climate Change and MCDA-Based Area Prioritization in a Data-Scarce Developing City. Sci. Total Environ. 2024, 948, 174389. [Google Scholar] [CrossRef]
  130. Nam, D.H.; Hoa, T.D.; Duong, P.C.; Thuan, D.H.; Mai, D.T. Assessment of Flood Extremes Using Downscaled CMIP5 High-Resolution Ensemble Projections of Near-Term Climate for the Upper Thu Bon Catchment in Vietnam. Water 2019, 11, 634. [Google Scholar] [CrossRef]
  131. Park, J.; Kang, M.S.; Song, I.; Song, J.-H.; Jun, S.M. Probabilistic Risk Assessment of Flood Disaster in South Korea Under The Impact Of Climate Change. Irrig. Drain. 2016, 65, 16–25. [Google Scholar] [CrossRef]
  132. Smits, W.K.; Attoh, E.M.N.A.N.; Ludwig, F. Flood Risk Assessment and Adaptation under Changing Climate for the Agricultural System in the Ghanaian White Volta Basin. Clim. Change 2024, 177, 39. [Google Scholar] [CrossRef]
  133. Wang, H.; Yuan, W.; Ma, Y.; Bai, X.; Huang, L.; Cheng, S.; Yang, H.; Guo, W. Spatiotemporal Dislocation of Ecosystem Supply and Demand Services from Habitat Quality under Different Development Scenarios. Ecol. Indic. 2023, 157, 111230. [Google Scholar] [CrossRef]
  134. Yunus, A.P.; Avtar, R.; Kraines, S.; Yamamuro, M.; Lindberg, F.; Grimmond, C.S.B. Uncertainties in Tidally Adjusted Estimates of Sea Level Rise Flooding (Bathtub Model) for the Greater London. Remote Sens. 2016, 8, 366. [Google Scholar] [CrossRef]
  135. Zhuang, Q.; Liu, S.; Zhou, Z. Spatial Heterogeneity Analysis of Short-Duration Extreme Rainfall Events in Megacities in China. Water 2020, 12, 3364. [Google Scholar] [CrossRef]
  136. Kelly, M.; Kuleshov, Y. Flood Hazard Assessment and Mapping: A Case Study from Australia’s Hawkesbury-Nepean Catchment. Sensors 2022, 22, 6251. [Google Scholar] [CrossRef]
  137. Loli, M.; Kefalas, G.; Dafis, S.; Mitoulis, S.A.; Schmidt, F. Bridge-Specific Flood Risk Assessment of Transport Networks Using GIS and Remotely Sensed Data. Sci. Total. Environ. 2022, 850, 157976. [Google Scholar] [CrossRef]
  138. Liu, Z.; Yang, Z.; Chen, M.; Xu, H.; Yang, Y.; Zhang, J.; Wu, Q.; Wang, M.; Song, Z.; Ding, F. Research Hotspots and Frontiers of Mountain Flood Disaster: Bibliometric and Visual Analysis. Water 2023, 15, 673. [Google Scholar] [CrossRef]
  139. Meijer, L.G.; Reimann, L.; Aerts, J.C.J.H. Comparing Spatially Explicit Approaches to Assess Social Vulnerability Dynamics to Flooding. Int. J. Disaster Risk Reduct. 2023, 96, 103883. [Google Scholar] [CrossRef]
  140. Abd Majid, N.; Nazi, N.M.; Idris, N.D.M.; Taha, M.R. GIS-Based Livelihood Vulnerability Index Mapping of the Socioeconomy of the Pekan Community. Sustainability 2019, 11, 6935. [Google Scholar] [CrossRef]
  141. Aziz, F.; Wang, X.; Mahmood, M.Q.; Awais, M.; Trenouth, B. Coastal Urban Flood Risk Management: Challenges and Opportunities–A Systematic Review. J. Hydrol. 2024, 645, 132271. [Google Scholar] [CrossRef]
  142. Blair, G.S.; Beven, K.; Lamb, R.; Bassett, R.; Cauwenberghs, K.; Hankin, B.; Dean, G.; Hunter, N.; Edwards, L.; Nundloll, V.; et al. Models of Everywhere Revisited: A Technological Perspective. Environ. Model. Softw. 2019, 122, 104521. [Google Scholar] [CrossRef]
  143. Carlier, B.; Puissant, A.; Dujarric, C.; Arnaud-Fassetta, G. Upgrading of an Index-Oriented Methodology for Consequence Analysis of Natural Hazards: Application to the Upper Guil Catchment (Southern French Alps). Nat. Hazards Earth Syst. Sci. 2018, 18, 2221–2239. [Google Scholar] [CrossRef]
  144. Hu, R.; Fang, F.; Salinas, P.; Pain, C.C.; Domingo, N.S.; Mark, O. Numerical Simulation of Floods from Multiple Sources Using an Adaptive Anisotropic Unstructured Mesh Method. Adv. Water Resour. 2019, 123, 173–188. [Google Scholar] [CrossRef]
  145. Wang, Q.; Gao, Y.; Gong, T.; Liu, T.; Sui, Z.; Fan, J.; Wang, Z. Dam Surface Deformation Monitoring and Analysis Based on PS-InSAR Technology: A Case Study of Xiaolangdi Reservoir Dam in China. Water 2023, 15, 3298. [Google Scholar] [CrossRef]
  146. An, T.T.; Izuru, S.; Narumasa, T.; Raghavan, V.; Hanh, L.N.; An, N.V.; Long, N.V.; Thuy, N.T.; Minh, T.P. Flood Vulnerability Assessment at the Local Scale Using Remote Sensing and GIS Techniques: A Case Study in Da Nang City, Vietnam. J. Water Clim. Change 2022, 13, 3217–3238. [Google Scholar]
  147. Jacinto, R.; Sebastiao, F.; Reis, E.; Ferrao, J. SoResilere-A Social Resilience Index Applied to Portuguese Flood Disaster-Affected Municipalities. Sustainability 2023, 15, 3309. [Google Scholar] [CrossRef]
  148. Lu, H.; Zheng, J.; Ou, H.; Liu, Y.; Li, X. Vulnerability Assessment and Spatio-Temporal Difference Analysis of Inland Fisheries Flood Disaster in China. Front. Ecol. Evol. 2022, 10, 899786. [Google Scholar] [CrossRef]
  149. Tang, J.; Li, Y.; Cui, S.; Xu, L.; Hu, Y.; Ding, S.; Nitivattananon, V. Analyzing the Spatiotemporal Dynamics of Flood Risk and Its Driving Factors in a Coastal Watershed of Southeastern China. Ecol. Indic. 2021, 121, 107134. [Google Scholar] [CrossRef]
  150. Asare-Kyei, D.; Forkuor, G.; Venus, V. Modeling Flood Hazard Zones at the Sub-District Level with the Rational Model Integrated with GIS and Remote Sensing Approaches. Water 2015, 7, 3531–3564. [Google Scholar] [CrossRef]
  151. Iroume, J.Y.-A.; Onguene, R.; Koffi, F.D.; Colmet-Daage, A.; Stieglitz, T.; Sone, W.E.; Bogning, S.; Olinga, J.M.O.; Ntchantcho, R.; Ntonga, J.-C.; et al. The 21st August 2020 Flood in Douala (Cameroon): A Major Urban Flood Investigated with 2D HEC-RAS Modeling. Water 2022, 14, 1768. [Google Scholar] [CrossRef]
  152. Maphugwi, M.; Blamey, R.C.; Reason, C.J.C. Rainfall Characteristics over the Congo Air Boundary Region in Southern Africa: A Comparison of Station and Gridded Rainfall Products. Atmos. Res. 2024, 311, 107718. [Google Scholar] [CrossRef]
  153. Wang, M.; Fu, X.; Zhang, D.; Chen, F.; Su, J.; Zhou, S.; Li, J.; Zhong, Y.; Tan, S.K. Urban Flooding Risk Assessment in the Rural-Urban Fringe Based on a Bayesian Classifier. Sustainability 2023, 15, 5740. [Google Scholar] [CrossRef]
  154. Zhang, J.; Xu, W.; Xu, B.; Zhao, J.; Liang, C.; Zhang, W.; Deng, J. Application of GIS Spatial Analysis for the Assessment of Storm Surge Inundation Risks in the Guangdong-Macao-Hong Kong Great Bay Area. Water 2024, 16, 2554. [Google Scholar] [CrossRef]
  155. Alexandre, D.A.; Chaudhuri, C.; Gill-Fortin, J. Novel Extensions to the Fisher Copula to Model Flood Spatial Dependence over North America. Hydrol. Earth Syst. Sci. 2024, 28, 5069–5085. [Google Scholar] [CrossRef]
  156. Mshelia, Z.H.; Nyam, Y.S.; Moisès, D.J.; Belle, J.A. Geospatial Analysis of Flood Risk Hazard in Zambezi Region, Namibia. Environ. Chall. 2024, 15, 100915. [Google Scholar] [CrossRef]
  157. Al-Omari, A.A.; Shatnawi, N.N.; Shbeeb, N.I.; Istrati, D.; Lagaros, N.D.; Abdalla, K.M. Utilizing Remote Sensing and GIS Techniques for Flood Hazard Mapping and Risk Assessment. Civ. Eng. J. 2024, 10, 1423–1436. [Google Scholar] [CrossRef]
  158. Xing, Y.; Chen, H.; Liang, Q.; Ma, X. Improving the Performance of City-Scale Hydrodynamic Flood Modelling through a GIS-Based DEM Correction Method. Nat. Hazards 2022, 112, 2313–2335. [Google Scholar] [CrossRef]
  159. Fereshtehpour, M.; Karamouz, M. DEM Resolution Effects on Coastal Flood Vulnerability Assessment: Deterministic and Probabilistic Approach. Water Resour. Res. 2018, 54, 4965–4982. [Google Scholar] [CrossRef]
  160. Arash, A.M.; Yasi, M. The Assessment for Selection and Correction of RS-Based DEMs and 1D and 2D HEC-RAS Models for Flood Mapping in Different River Types. J. Flood Risk Manag. 2023, 16, e12871. [Google Scholar] [CrossRef]
  161. Shen, X.; Anagnostou, E.N.; Allen, G.H.; Brakenridge, G.R.; Kettner, A.J. Near-Real-Time Non-Obstructed Flood Inundation Mapping Using Synthetic Aperture Radar. Remote Sens. Environ. 2019, 221, 302–315. [Google Scholar] [CrossRef]
  162. Meyer, F.J.; Schultz, L.A.; Osmanoglu, B.; Kennedy, J.H.; Jo, M.; Thapa, R.B.; Bell, J.R.; Pradhan, S.; Shrestha, M.; Smale, J.; et al. HydroSAR: A Cloud-Based Service for the Monitoring of Inundation Events in the Hindu Kush Himalaya. Remote Sens. 2024, 16, 3244. [Google Scholar] [CrossRef]
  163. Dasgupta, A.; Hostache, R.; Ramsankaran, R.; Schumann, G.; Grimaldi, S.; Pauwels, V.; Walker, J. Optimizing SAR-Based Flood Extent Assimilation for Improved Flood Inundation Forecasts. In Proceedings of the EGU General Assembly 2020, Online, 4–8 May 2020; p. 4342. [Google Scholar]
  164. Hutanu, E.; Mihu-Pintilie, A.; Urzica, A.; Paveluc, L.E.; Stoleriu, C.C.; Grozavu, A. Using 1D HEC-RAS Modeling and LiDAR Data to Improve Flood Hazard Maps Accuracy: A Case Study from Jijia Floodplain (NE Romania). Water 2020, 12, 1624. [Google Scholar] [CrossRef]
  165. Aryal, A.; Acharya, A.; Kalra, A. Assessing the Implication of Climate Change to Forecast Future Flood Using CMIP6 Climate Projections and HEC-RAS Modeling. Forecasting 2022, 4, 582–603. [Google Scholar] [CrossRef]
  166. Immaddudin Wira Rohmat, F.; Stamataki, I.; Sa’adi, Z.; Fitriani, D. Flood Analysis Using HEC-RAS: The Case Study of Majalaya, Indonesia under the CMIP6 Projection. In Proceedings of the EGU General Assembly 2022, Vienna, Austria, 23–27 May 2022; p. EGU22-3090. [Google Scholar]
  167. Prokic, M.; Savic, S.; Pavic, D. Pluvial Flooding in Urban Areas Across the European Continent. Geogr. Pannonica 2019, 23, 216–232. [Google Scholar] [CrossRef]
  168. Hosseiny, H.; Nazari, F.; Smith, V.; Nataraj, C. A Framework for Modeling Flood Depth Using a Hybrid of Hydraulics and Machine Learning. Sci. Rep. 2020, 10, 8222. [Google Scholar] [CrossRef]
  169. Singha, C.; Rana, V.K.; Pham, Q.B.; Nguyen, D.C.; Łupikasza, E. Integrating Machine Learning and Geospatial Data Analysis for Comprehensive Flood Hazard Assessment. Environ. Sci. Pollut. Res. 2024, 31, 48497–48522. [Google Scholar] [CrossRef] [PubMed]
  170. Tanaka, T.; Yoshioka, H.; Siev, S.; Fujii, H.; Fujihara, Y.; Hoshikawa, K.; Ly, S.; Yoshimura, C. An Integrated Hydrological-Hydraulic Model for Simulating Surface Water Flows of a Shallow Lake Surrounded by Large Floodplains. Water 2018, 10, 1213. [Google Scholar] [CrossRef]
  171. Akkimi, A.; Dutta, S. Suitable Dem Assessment Study for Data Scarce Cities towards Urban Extreme and Nuisance Flood Mapping. ISPRS Ann. Photogramm. Remote Sens. Spat. Inf. Sci. 2021, 4, 161–168. [Google Scholar] [CrossRef]
  172. Schulz, D.; Yin, H.; Tischbein, B.; Verleysdonk, S.; Adamou, R.; Kumar, N. Land Use Mapping Using Sentinel-1 and Sentinel-2 Time Series in a Heterogeneous Landscape in Niger, Sahel. ISPRS J. Photogramm. Remote Sens. 2021, 178, 97–111. [Google Scholar] [CrossRef]
  173. Yu, H.; Zhao, Y.; Fu, Y.; Li, L. Spatiotemporal Variance Assessment of Urban Rainstorm Waterlogging Affected by Impervious Surface Expansion: A Case Study of Guangzhou, China. Sustainability 2018, 10, 3761. [Google Scholar] [CrossRef]
  174. Song, M.; Zhang, J.; Bian, G.; Wang, J.; Wang, G. Quantifying Effects of Urban Land-Use Patterns on Flood Regimes for a Typical Urbanized Basin in Eastern China. Hydrol. Res. 2020, 51, 1521–1536. [Google Scholar] [CrossRef]
  175. Heffernan, J.M.; Wahl, L.M. Monte Carlo Estimates of Natural Variation in HIV Infection. J. Theor. Biol. 2005, 236, 137–153. [Google Scholar] [CrossRef]
  176. Tian, J.; Yan, Y.; Zeng, S. Intelligent Identification and Management of Flood Risk Areas in High-Density Blocks from the Perspective of Flood Regulation Supply and Demand Matching. Ecol. Indic. 2024, 160, 111799. [Google Scholar] [CrossRef]
  177. Englund, M.; Passos, M.V.; Andre, K.; Swartling, A.G.; Segnestam, L.; Barquet, K. Constructing a Social Vulnerability Index for Flooding: Insights from a Municipality in Sweden. Front. Clim. 2023, 5, 1038883. [Google Scholar] [CrossRef]
  178. Jamshed, A.; Birkmann, J.; Feldmeyer, D.; Rana, I.A. A Conceptual Framework to Understand the Dynamics of Rural–Urban Linkages for Rural Flood Vulnerability. Sustainability 2020, 12, 2894. [Google Scholar] [CrossRef]
  179. Schanze, J. Pluvial Flood Risk Management: An Evolving and Specific Field. J. Flood Risk Manag. 2018, 11, 227–229. [Google Scholar] [CrossRef]
  180. Mitra, R.; Das, J. A Comparative Assessment of Flood Susceptibility Modelling of GIS-Based TOPSIS, VIKOR, and EDAS Techniques in the Sub-Himalayan Foothills Region of Eastern India. Environ. Sci. Pollut. Res. 2023, 30, 16036–16067. [Google Scholar] [CrossRef]
  181. Campello, B.S.C.; Duarte, L.T.; Romano, J.M.T. Multicriteria Decision Support Employing Adaptive Prediction in a Tensor-Based Feature Representation. Pattern Recognit. Lett. 2023, 174, 52–56. [Google Scholar] [CrossRef]
  182. Zhang, J.; Fu, D.; Wang, Y.; Singh, R.P. Detailed Sponge City Planning Based on Hierarchical Fuzzy Decision-Making: A Case Study on Yangchen Lake. Water 2017, 9, 903. [Google Scholar] [CrossRef]
  183. Feloni, E.; Mousadis, I.; Baltas, E. Flood Vulnerability Assessment Using a GIS-Based Multi-Criteria Approach-The Case of Attica Region. J. Flood Risk Manag. 2020, 13, e12563. [Google Scholar] [CrossRef]
  184. Pistrika, A.; Tsakiris, G. Flood Risk Assessment: A Methodological Framework. In Proceedings of the EWRA Symposium “Water Resources Management: New Approaches and Technologies”; European Water Resources Association (EWRA): Chania Crete, Greece, 2007. [Google Scholar]
  185. Abdelkarim, A.; Al-Alola, S.S.; Alogayell, H.M.; Mohamed, S.A.; Alkadi, I.I.; Ismail, I.Y. Integration of GIS-Based Multicriteria Decision Analysis and Analytic Hierarchy Process to Assess Flood Hazard on the Al-Shamal Train Pathway in Al-Qurayyat Region, Kingdom of Saudi Arabia. Water 2020, 12, 1702. [Google Scholar] [CrossRef]
  186. Tiepolo, M.; Belcore, E.; Braccio, S.; Issa, S.; Massazza, G.; Rosso, M.; Tarchiani, V. Method for Fluvial and Pluvial Flood Risk Assessment in Rural Settlements. MethodsX 2021, 8, 101463. [Google Scholar] [CrossRef]
  187. Nofal, O.; Rosenheim, N.; Patil, J.; Zhou, X.; Kameshwar, S.; van de Lindt, J.W.; Duenas-Osorio, L. Community-Level Approach for a Socio-Physical Flood Post-Hazard Functionality Assessment. In ASCE Inspire 2023; ASCE: San Francisco, CA, USA, 2023; pp. 339–348. [Google Scholar]
  188. Shupe-Diggs, C.; Diko, S.K.; Santo, C.A. An Integrated Social Vulnerability Assessment of Riverine Flood Hazards in Shelby County, Tennessee. Int. J. Disaster Resil. Built Environ. 2021, 12, 308–321. [Google Scholar] [CrossRef]
  189. Ghalandari, S. A Compilation of Benchmark Pluvial Flood Datasets. Eur. J. Dev. Stud. 2023, 3, 68–78. [Google Scholar] [CrossRef]
  190. Bernet, D.B.; Zischg, A.P.; Prasuhn, V.; Weingartner, R. Modeling the Extent of Surface Water Floods in Rural Areas: Lessons Learned from the Application of Various Uncalibrated Models. Environ. Model. Softw. 2018, 109, 134–151. [Google Scholar] [CrossRef]
  191. Sharma, S.S.V.; Roy, P.S.; Chakravarthi, V.; Rao, S. Flood Risk Assessment Using Multi-Criteria Analysis: A Case Study from Kopili River Basin, Assam, India. Geomat. Nat. Hazards Risk 2018, 9, 79–93. [Google Scholar] [CrossRef]
  192. Fernandez-Novoa, D.; Garcia-Feal, O.; Gonzalez-Cao, J.; DeCastro, M.; Gomez-Gesteira, M. Multiscale Flood Risk Assessment under Climate Change: The Case of theMino River in the City of Ourense, Spain. Nat. Hazards Earth Syst. Sci. 2022, 22, 3957–3972. [Google Scholar] [CrossRef]
  193. Johnsson, I.; Balstrom, T. A GIS-Based Screening Method to Identify Climate Change-Related Threats on Road Networks: A Case Study from Sweden. Clim. Risk Manag. 2021, 33, 100344. [Google Scholar] [CrossRef]
  194. Page, M.J.; McKenzie, J.E.; Bossuyt, P.M.; Boutron, I.; Hoffmann, T.C.; Mulrow, C.D.; Shamseer, L.; Tetzlaff, J.M.; Akl, E.A.; Brennan, S.E.; et al. The PRISMA 2020 statement: An updated guideline for reporting systematic reviews. BMJ 2021, 372, n71. [Google Scholar] [CrossRef] [PubMed]
Figure 1. PRISMA 2020 flow diagram for systematic review. Records identified from Web of Science and ScienceDirect.
Urbansci 10 00271 g001
Figure 2. Annual distribution of flood risk assessment publications (2010–2024). Based on 485 articles assessed for eligibility. Source: Web of Science and ScienceDirect databases.
Urbansci 10 00271 g002
Figure 3. Geographic distribution of flood hazard and risk assessment publications by country. Based on 485 articles assessed for eligibility. Source: Web of Science and ScienceDirect databases.
Urbansci 10 00271 g003
Figure 4. Distribution of articles on flood hazard and vulnerability assessments by research field. Source: Web of Science and ScienceDirect databases.
Urbansci 10 00271 g004
Figure 5. Distribution of flood types across articles assessed for eligibility. Source: Authors’ classification based on title and abstract screening.
Urbansci 10 00271 g005
Figure 6. Distribution of flood assessment types among the 89 included studies. Hazard assessment dominates at 37% (n = 33), followed by risk assessment at 20% (n = 18), vulnerability assessment at 18% (n = 16), and exposure analysis at 9% (n = 8). Integrated approaches including hazard & vulnerability (8%, n = 7), hazard & exposure (5%, n = 4), and vulnerability & exposure (3%, n = 3) represent a minority of studies, highlighting the limited adoption of holistic multi-component frameworks. Source: Authors’ synthesis.
Urbansci 10 00271 g006
Figure 7. Distribution of spatial techniques across the 89 included studies. Remote sensing and GIS-based methods are the most frequently employed (28%, n = 25), followed by geospatial and MCDA approaches (19%, n = 17) and hydrological and hydraulic modeling (19%, n = 17). Statistical and probability-based methods account for 15% (n = 13), while machine learning and AI techniques represent 13% (n = 12), reflecting their growing but still emerging role in flood risk research. Climate and scenario analysis methods account for the remaining 6% (n = 5). Source: Authors’ synthesis.
Urbansci 10 00271 g007
Figure 8. Distribution of spatial techniques applied across individual and merged flood assessment categories among the 89 included studies. (a) shows technique distribution for individual assessment types—hazard, vulnerability, exposure, and risk. (b) shows distributions for merged assessment types combining two or more components. Remote sensing and GIS-based methods dominate hazard and risk assessments, while MCDA techniques are most prevalent in vulnerability assessments. Statistical and probability-based methods are most prominent in exposure analysis. Machine learning approaches appear across all categories but remain more prominent in hazard and risk assessments. Source: Authors’ synthesis.
Urbansci 10 00271 g008
Table 1. Search criteria used to find relevant articles from the selected databases.
Search CriteriaDatabaseNumber
(ALL = (“Flood risk assessment” OR “Flood hazard assessment” OR “flood vulnerability assessment”)) AND ALL = (“Geospatial methods” OR “spatial methods” OR “Spatial techniques” OR “GIS” OR “Remote sensing” OR “Machine learning” OR “ML” OR “Multi-criteria” OR “Multicriteria” OR “MCDA” OR “Hydrolog” OR “Hydraulics”) AND PY = (2010–2024), filtered by language: English or French, document type: Article Web Of
Science
4381
ALL(“Flood risk assessment” OR “Flood hazard assessment” OR “Flood vulnerability assessment”) AND ALL(“Geospatial methods” OR “GIS” OR “Remote sensing”) AND NOT ALL(“hurricane” OR “prediction”), filtered by language: English or FrenchScience
Direct
538
Table 2. Three-dimensional cross-comparison: Flood type × assessment type × spatial technique (n = 89).
Flood TypeAssessmentRS & GISHydrological & Hydraulic ModelingGeospatial & MCDAML & AIStatistical MethodsClimate & Scenario AnalysisTotal
Riverine/Pluvial
(n = 29)
Hazard55211115
Risk113319
Vulnerability314
Exposure11
Urban
(n = 24)
Hazard2114
Risk123
Vulnerability3512112
Exposure11
Integrated1214
Coastal
(n = 15)
Hazard3115
Vulnerability4116
Exposure33
Integrated11
Flashflood
(n = 6)
Hazard21216
Multi Haz
(n = 3)
Hazard11
Risk112
Rural
(n = 1)
Vulnerability11
General/Other
(n = 11)
Hazard.1113
Risk33
Vulnerability213
Integrated112
Total331224104689
The following section provides a descriptive analysis of the spatial methods and assessment indices identified across the 89 included studies, elaborating on their technical characteristics, applications, and comparative strengths.
Table 3. Common contemporary spatial methods for flood hazard assessment and their applications.
Method
Category
DescriptionKey Techniques and ToolsApplicationsReferences
Remote Sensing and GIS-BasedIntegrate satellite imagery and geospatial data (e.g., elevation, vegetation, drainage) to assess and map environmental and anthropogenic processes like flood risk. Remote sensing captures surface characteristics, while GIS analyzes data for decision-making, enabling detailed flood maps, land-use planning, and resource management.ArcGIS, QGIS, ERDAS IMAGINE, ENVI 5, Google Earth Engine, Sentinel-1 SAR, Landsat, MODISUseful in emergency response planning, identifying exposure and vulnerable zones. Assessing the impacts of land-use changes on flood risk.[36,37,38,39,40,41,42,43,44,45,46,47,48,49,50,51,52,53,54,55,56,57,58,59,60,61,62,63,64,65,66,67,68]
Hydrological and Hydraulic ModelingSimulates water flow within watersheds and flood propagation over land and water bodies. Hydrological models focus on rainfall-runoff and watershed processes, while hydraulic models simulate the movement of water in rivers and floodplains using flow equations.HEC-HMS, SWAT, WEAP (Water Evaluation and Planning), LISFLOOD, HYDRUS, MODFLOW, HEC-RAS, MIKE FLOOD, TUFLOW, Delft3D, FLO-2D, RiverFlow2D, Arc SWATUsed for planning flood mitigation structures (e.g., dams, levees) and assessing impacts on urban areas.[69,70,71,72,73,74,75,76,77,78,79,80,81,82,83,84,85,86]
Machine Learning and Artificial Intelligence (AI)Employs algorithms for high-accuracy flood predictions based on spatial and environmental data, identifying critical factors contributing to flood risk through feature selection techniques.Random Forest, XGBoost, SVM, Deep Learning (CNN, LSTM), TensorFlow, Scikit-LearnEnhances predictive capabilities in flood-prone areas, supporting proactive measures in urban planning and infrastructure protection.[87,88,89,90,91,92,93,94,95,96,97,98,99]
Statistical and Probability-Based MethodsApplies statistical distributions and probabilistic models to estimate flood probabilities and simulate possible flood scenarios, useful for long-term risk assessments.Gumbel, Log-Pearson, Copula models, Monte Carlo simulations, R Python 4.5Supports flood insurance calculations, long-term floodplain management, and climate adaptation planning by deriving exceedance probabilities for registered flood characteristics such as peak discharge, volume, duration, and hydrograph shape.[100,101,102,103,104,105,106,107,108,109]
Geospatial and Multi-Criteria Decision Analysis (MCDA)Integrates geospatial data with decision-making frameworks to prioritize flood-prone areas by weighing multiple criteria (e.g., rainfall, land use, elevation, population density) for systematic flood risk assessment.Analytic Hierarchy Process (AHP), Fuzzy AHP, Weighted Sum Model (WSM), TOPSIS, GIS platforms (ArcGIS, QGIS), Python/R, Google Earth EngineApplied in hazard zoning, exposure, and vulnerability mapping. Resource allocation to high-risk areas for flood preparedness and mitigation.[110,111,112,113,114,115,116,117,118,119,120,121,122,123,124,125,126]
Climate and Scenario AnalysisEvaluates future flood risks based on climate change projections, incorporating global and regional climate models to assess impacts of changing precipitation patterns, sea-level rise, and extreme weather events on flood risks.CMIP6 climate models, PRECIS (Providing Regional Climates for Impacts Studies), GCMs (Global Climate Models), RCP (Representative Concentration Pathways), GIS, Python (climate libraries)Supports long-term planning for climate-resilient infrastructure, adaptation strategies, and scenario-based flood risk assessments in dynamic environments.[127,128,129,130,131,132,133,134,135]
Table 4. Key hazard and vulnerability indices for flood assessment.
IndexPurposeIndicatorsApplicationsReferences
Flood Hazard Index (FHI)To measure the potential hazard level in flood-prone areasFlood depth, duration, frequencyUsed to identify high-risk flood zones and prioritize hazard mitigation strategies[113,136,137]
Social Vulnerability Index
(SoVI)
Measures social vulnerability to environmental hazards, including floods, by combining socioeconomic factorsAge, income level, disability, race/ethnicity, education, housing qualityIdentifies at-risk populations within flood-prone areas; applied in urban and rural contexts for flood resilience planning and resource allocation[121,138,139]
Flood Vulnerability Index
(FVI)
Designed for flood events; assesses vulnerability by combining social, economic, environmental, and physical indicatorsPopulation density, economic dependency on agriculture, proximity to water bodies, infrastructure resilienceAdaptable to local conditions for diverse environments; used in planning and prioritizing areas for flood mitigation and disaster response[59]
Livelihood Vulnerability Index (LVI)Evaluates flood vulnerability by assessing livelihood factors, focusing on flood-sensitive economic sectorsEmployment diversity, access to credit, social support networks, food and water security, housing durabilityParticularly useful in rural or agrarian communities; helps prioritize interventions where livelihoods are closely tied to flood-sensitive resources[70,72,73,126,140,141,142,143,144,145]
Composite Vulnerability Index (CVI)Combines various indicators based on regional needs, offering a holistic view of vulnerabilityHousing quality, public health infrastructure, road density, literacy rate, poverty levelAdaptable for diverse flood-prone areas; allows cross-regional comparison and local customization in vulnerability assessment[59]
Resilience and Adaptive Capacity IndicesAssesses community resilience and adaptive capacity to flooding, considering recovery and adaptation potentialAccess to emergency funds, insurance coverage, education, healthcare services, social cohesion, self-organizationUseful for assessing long-term community resilience to recurrent flooding; guides investments in adaptive strategies and support systems[116,132,146,147,148,149]
Flood Risk Index (FRI)
&
Urban Flood Risk Index (UFRI)
To provide a composite score combining hazard, exposure, and vulnerability for comprehensive risk.
To evaluate flood risk in urban areas with unique infrastructure and population densities.
Hazard, exposure, and vulnerability indices.
Impervious surfaces, drainage systems, urban density, building types.
Broad application in flood risk assessments for policymaking and risk management.
Used by urban planners for flood mitigation in cities with high population density and infrastructure.
[117,150,151,152,153,154]
Table 5. Regional distribution of spatial techniques: Developed vs. developing regions (n = 89 included studies).
Spatial TechniqueDeveloped
Regions
(n = 27)
Developing
Regions
(n = 55)
Global/Multi-
Country
(n = 7)
Total
(n)
% of Total
RS & GIS11 (41%)21 (38%)1 (14%)3337.1%
Hydrological & Hydraulic4 (15%)4 (7%)4 (57%)1213.5%
Geospatial & MCDA6 (22%)17 (31%)2 (29%)2528.1%
ML & AI2 (7%)7 (13%)910.1%
Statistical1 (4%)3 (5%)44.5%
Climate & Scenario3 (11%)3 (5%)66.7%
Column Total27 557 89100%
Disclaimer/Publisher’s Note: The statements, opinions and data contained in all publications are solely those of the individual author(s) and contributor(s) and not of MDPI and/or the editor(s). MDPI and/or the editor(s) disclaim responsibility for any injury to people or property resulting from any ideas, methods, instructions or products referred to in the content.