1. Introduction
Rapid urbanization in Saudi Arabia places increasing pressure on energy, water, mobility, and waste-management systems, making measurable sustainability outcomes central to the Vision 2030 agenda [
1,
2,
3]. In the broader literature, smart-city strategies based on ICT/IoT, secure connectivity, shared data platforms, and analytics/AI are widely presented as enablers of more adaptive, efficient, and sustainable urban operations [
4,
5,
6,
7,
8]. However, in the Saudi context, public reporting remains uneven. Long-term goals are often discussed alongside the achieved results; indicators are sometimes mixed across spatial levels (national versus city) and analytical domains (for example, renewable electricity generation versus renewable energy in final energy use); and source quality varies substantially between cases [
9]. These inconsistencies complicate cross-case comparison, weaken policy learning, and make it more difficult to prioritize investments aligned with national sustainability objectives.
Against this background, this study develops a verification-oriented assessment framework to examine the contribution of smart-city initiatives to sustainable urban development in Saudi Arabia. In this paper, smart cities are treated as integrated socio-technical systems that combine instrumented assets, communication infrastructure, interoperable data platforms, and analytics/AI to improve service performance, environmental efficiency, and quality of life [
4,
5]. The contribution of the paper is primarily methodological. Rather than claiming a fully measured benchmarking of all Saudi cases, the study proposes a structured approach to assess what can currently be verified, what remains only partially documented, and where evidence gaps persist.
More specifically, the paper advances the literature in four ways. First, it harmonizes indicators to reduce cross-level and cross-domain conflation. Second, it explicitly separates the stated targets from the observed outcomes. Third, it applies an evidence rating rubric that assigns greater weight to publicly verifiable datasets, official indicators, and peer-reviewed analyses than to promotional or anecdotal claims. Fourth, it introduces a Saudi-calibrated readiness–impact matrix that reflects local climatic, infrastructural, and institutional conditions [
9,
10,
11].
To structure the assessment, the paper combines two complementary reference lenses. The first is a governance- and service-oriented perspective derived from multidimensional smart-city frameworks in the literature [
10,
11,
12]. The second is the ITU smart sustainable cities KPI perspective, which provides a sector- and indicator-oriented basis to link interventions to measurable urban outcomes [
13]. These lenses are not interchangeable. Instead, they are used jointly to support a mechanism-first evaluation of how smart-city interventions may translate into observable service, sustainability, and governance effects. The paper also recognizes the growing role of machine learning in operationalizing mechanism-level controls, such as adaptive signal timing, predictive maintenance, and building energy optimization, and therefore incorporates AI-enabled pathways into evidence synthesis [
14].
1.1. Contributions
This paper makes the following contributions:
Verification-oriented assessment workflow. This study develops a reproducible workflow that harmonizes indicators, separates targets from achieved results, and grades evidence according to public verifiability.
Harmonization of indicators and boundary discipline. This study distinguishes renewable energy generation from renewable energy use in final energy use and separates national contextual indicators from city-level evidence to avoid cross-level inference.
Evidence-grading rubric. This study introduces a transparent ranking scheme that privileges verifiable sources, documents data provenance where possible, and reports uncertainty or missing evidence instead of imputing effects where measurement remains incomplete [
10,
11].
This study provides a Saudi-calibrated readiness–impact matrix that links deployment readiness, including governance, data quality, infrastructure, and financing conditions, to plausible sectoral KPI impacts under Saudi climatic and institutional constraints [
1].
KPI-mapped case synthesis. This study applies the framework to flagship initiatives and major metropolitan areas, mapping concrete smart-city mechanisms to sector-relevant KPIs at asset, program, and city levels, while clearly distinguishing verified evidence from partial or still-emerging evidence.
The policy playbook proposes actionable guidance on KPI transparency, interoperable data governance, cybersecurity safeguards, and procurement/PPP design to support more measurable, comparable, and scalable smart-city outcomes in the Kingdom [
13].
Table 1 positions the present study relative to the recent Arab-world and Saudi smart-city literature.
1.2. Paper Organization
The remainder of this paper is organized as follows.
Section 2 formalizes the core concepts, reference frameworks, and technological pillars through a mechanism-first lens.
Section 3 presents the Saudi urbanization and sustainability context that conditions the design and interpretation of KPIs.
Section 4 synthesizes the principal Saudi smart-city case studies and their documented mechanisms.
Section 5 develops and applies the readiness–impact matrix and the comparative benchmarking logic.
Section 6 discusses governance, risks, and policy pathways for measurable scaling.
Section 7 outlines the main challenges and future research directions. Finally,
Section 8 concludes the paper.
2. Smart Cities: Concepts, Frameworks, and Technologies
In this paper, smart cities are treated as integrated socio-technical systems in which sensing, secure communications, governed data platforms, and analytics are coordinated to monitor, predict, and improve urban services under explicit measurement and governance rules [
4,
6,
10]. Consistent with the verification-oriented perspective adopted in this study, the analysis follows a mechanism-first logic: it emphasizes concrete operational levers, such as adaptive signal control, demand response, leakage analytics, and occupancy-informed building control, rather than generic technology labels alone. This framing supports more precise KPI selection, reduces cross-level ambiguity, and enables more defensible comparison across Saudi municipalities [
7,
11].
2.1. Definitions and Scope
A smart-city is defined here as an urban system that senses through networked devices and supervisory systems, communicates through secure and governed data pathways, integrates multi-source data on interoperable platforms, and acts through analytics-enabled control of services across transport, energy, water, waste, and public administration [
4,
6,
10]. In this study, a smart-city claim is considered analytically meaningful only when it can be linked to a specific mechanism, a clearly defined boundary, an identifiable baseline, and at least one measurable KPI.
To preserve analytical clarity, three levels of assessment are distinguished: (i) the asset/subsystem level, such as a building energy-management system, a district-metered area (DMA), or a signalized corridor; (ii) the program level, such as demand response, pressure management, or adaptive signal control; and (iii) the city level, where aggregates are compiled from program records and official statistics [
7,
11]. This layered structure is essential because the later sections evaluate evidence across different spatial and operational scales without conflating subsystem performance with citywide outcomes.
The KPI set is expressed through explicit units and normalization rules, including kWh saved, peak reduction (kW/MW), building energy intensity (kWh m
−2), non-revenue water (NRW, %), approach delay (s/vehicle), travel time index, and collection fuel intensity (L/km). Reported effects are interpreted relative to clearly stated baselines, such as fixed-time traffic plans, pre-deployment building schedules, or historical non-intervention periods. The paper does not assume that all cases provide citywide causal evaluation; rather, evidence is graded according to what the underlying source makes publicly verifiable. When published evaluations include comparison groups or quasi-experimental designs, these are treated as stronger evidence than simple descriptive before/after reporting. KPI interpretation is also tied to consistent temporal windows and stable spatial boundaries, which is especially important in the Saudi context because of strong climatic seasonality and mass-event dynamics associated with Hajj and Umrah [
9].
Representative mechanisms examined later in the paper include adaptive signal control, leakage analytics and pressure management, HVAC optimization, and demand response or peak shaving. Each mechanism is linked to sector-specific KPIs and to defensible operational data sources such as ATMS, DMA, EMS, and AMI streams [
8,
14].
2.2. Core Characteristics of Smart Cities
Smart cities are characterized not simply by digitization, but by the operational integration of sensing, data exchange, analysis, and responsive control. IoT and supervisory systems generate real-time observations on traffic, service conditions, energy loads, and environmental variables; governed platforms support secure data exchange; and analytics translate these streams into decisions that can improve service efficiency, reliability, and sustainability [
4,
8]. Open-data and transparency practices can further strengthen accountability, collaboration, and policy learning when data are released in privacy-preserving and decision-relevant forms [
7,
16].
Beyond technical performance, a smart-city approach must also address inclusion, accessibility, and governance capacity so that digital deployment does not reinforce existing inequalities [
16,
17]. For this reason, smart-city maturity is treated here not only as a function of technological deployment, but also as a function of institutional readiness, data quality, interoperability, and the measurability of outcomes.
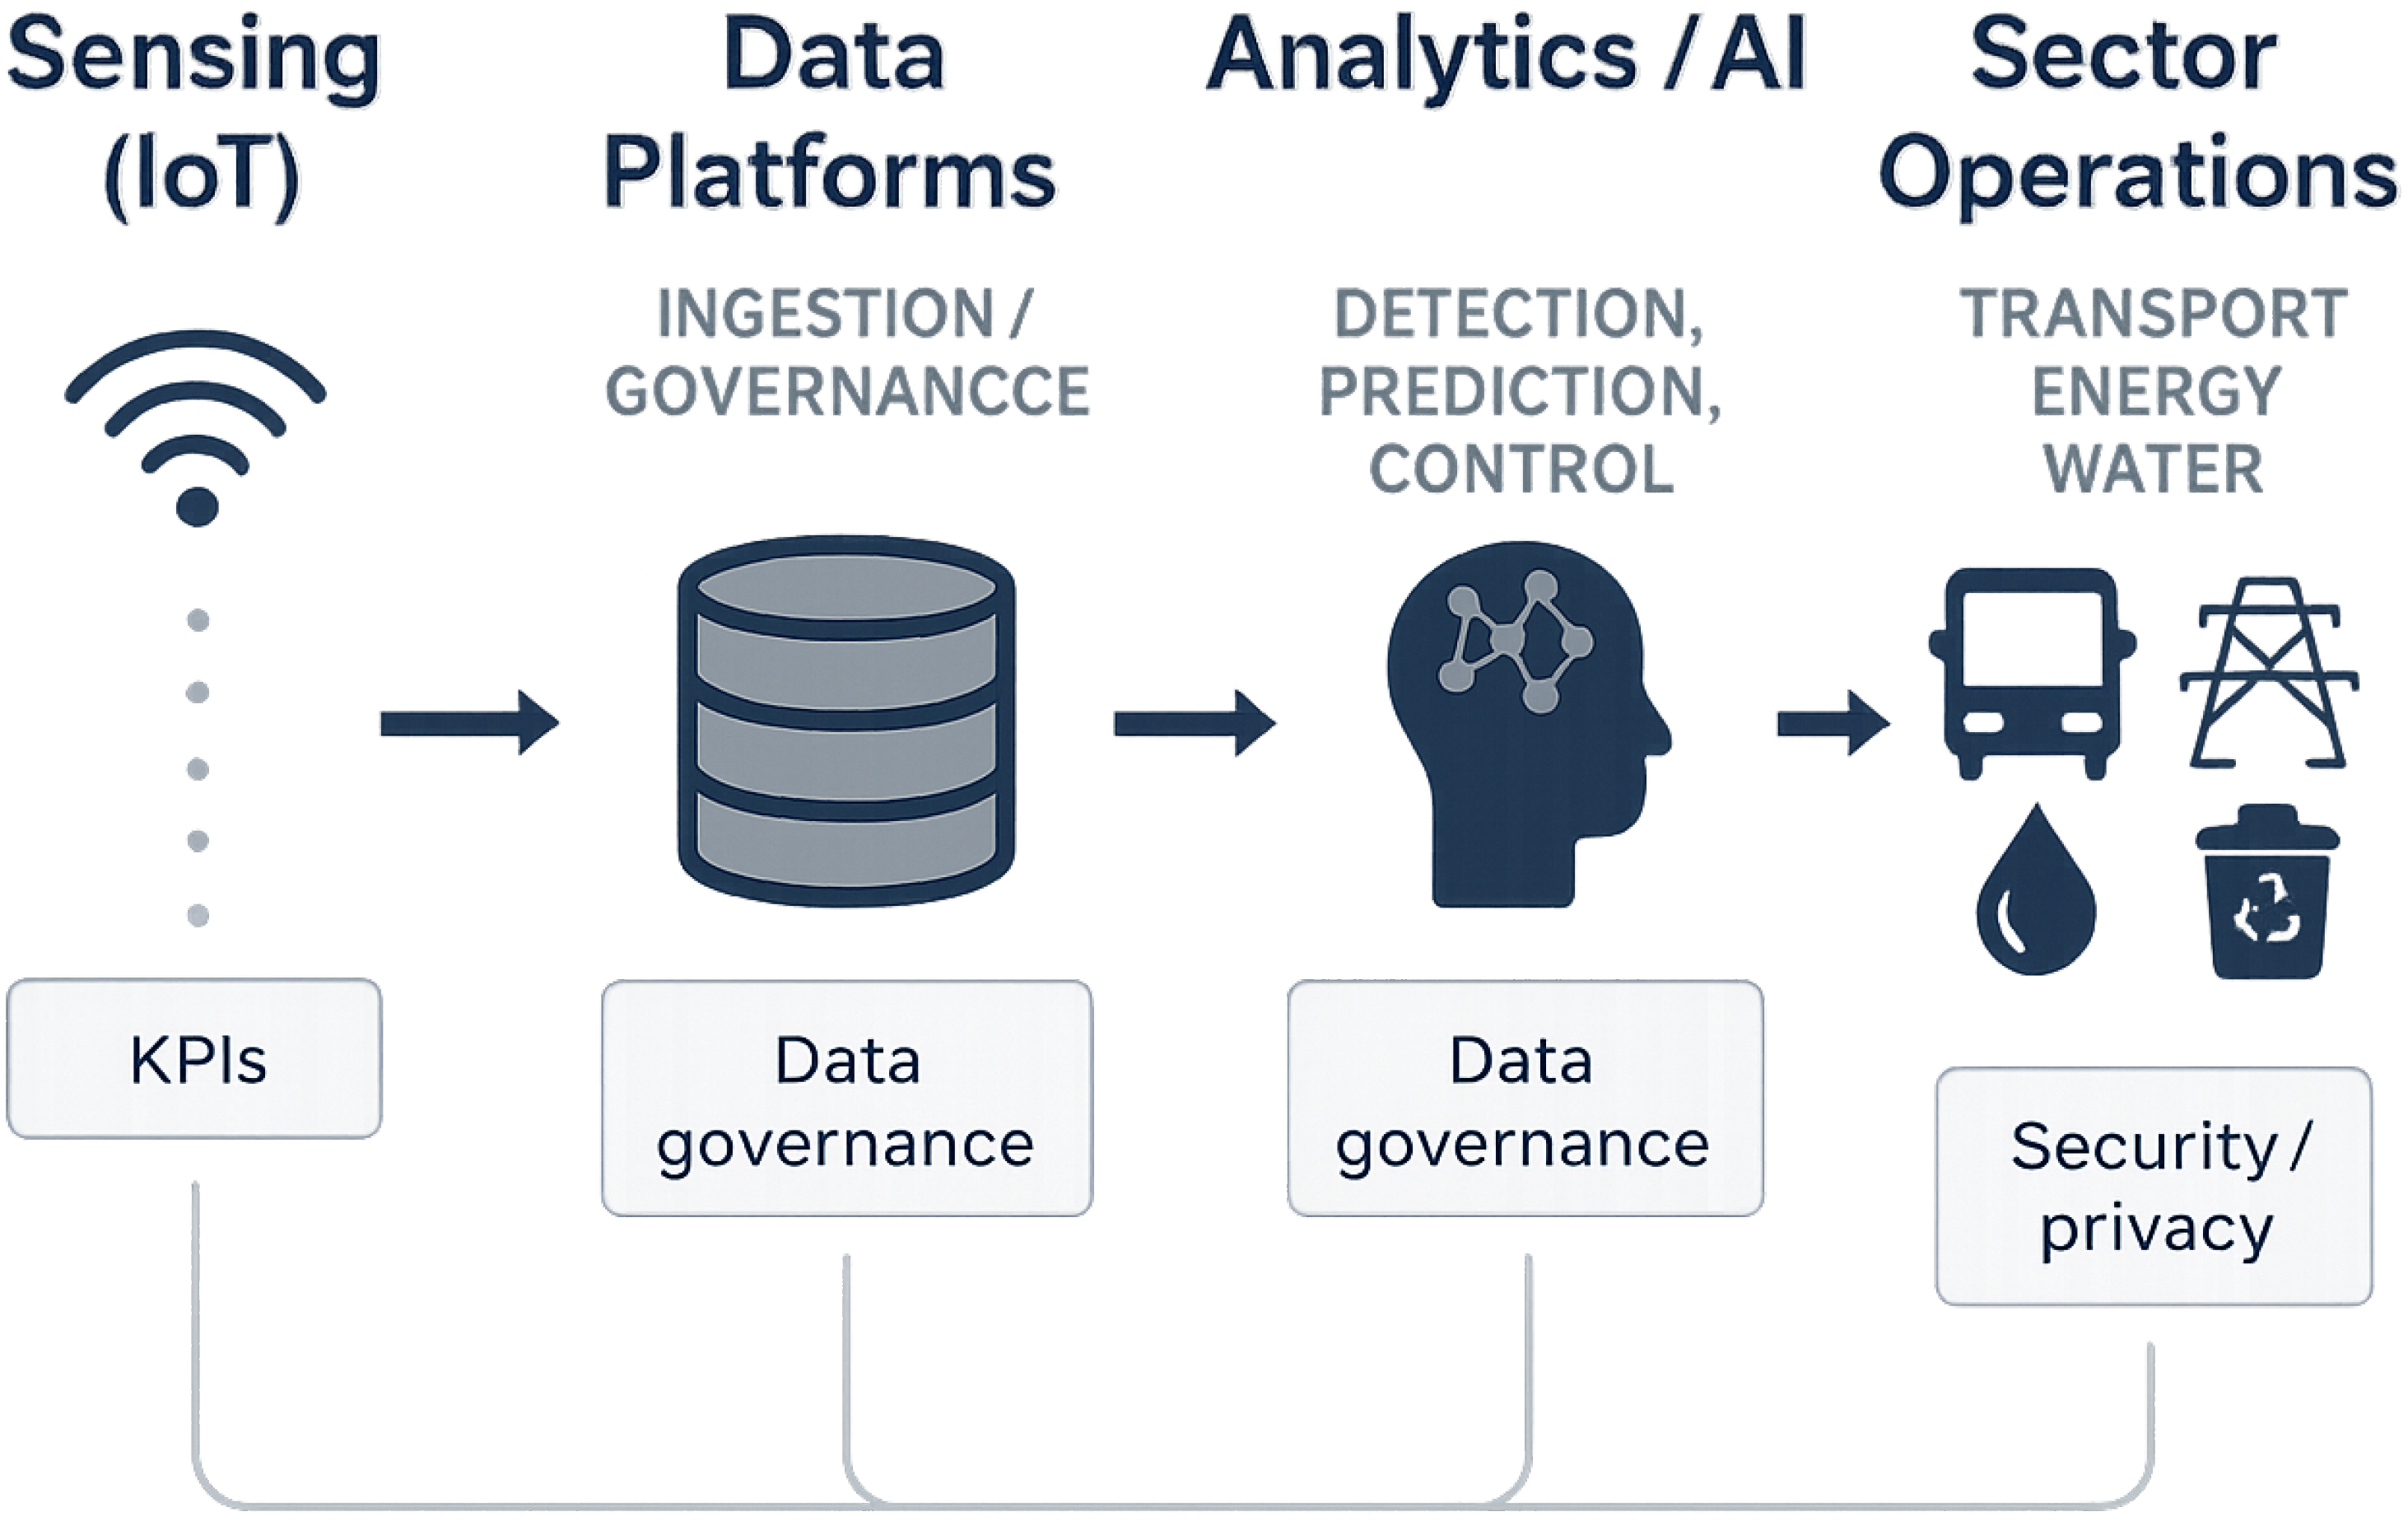
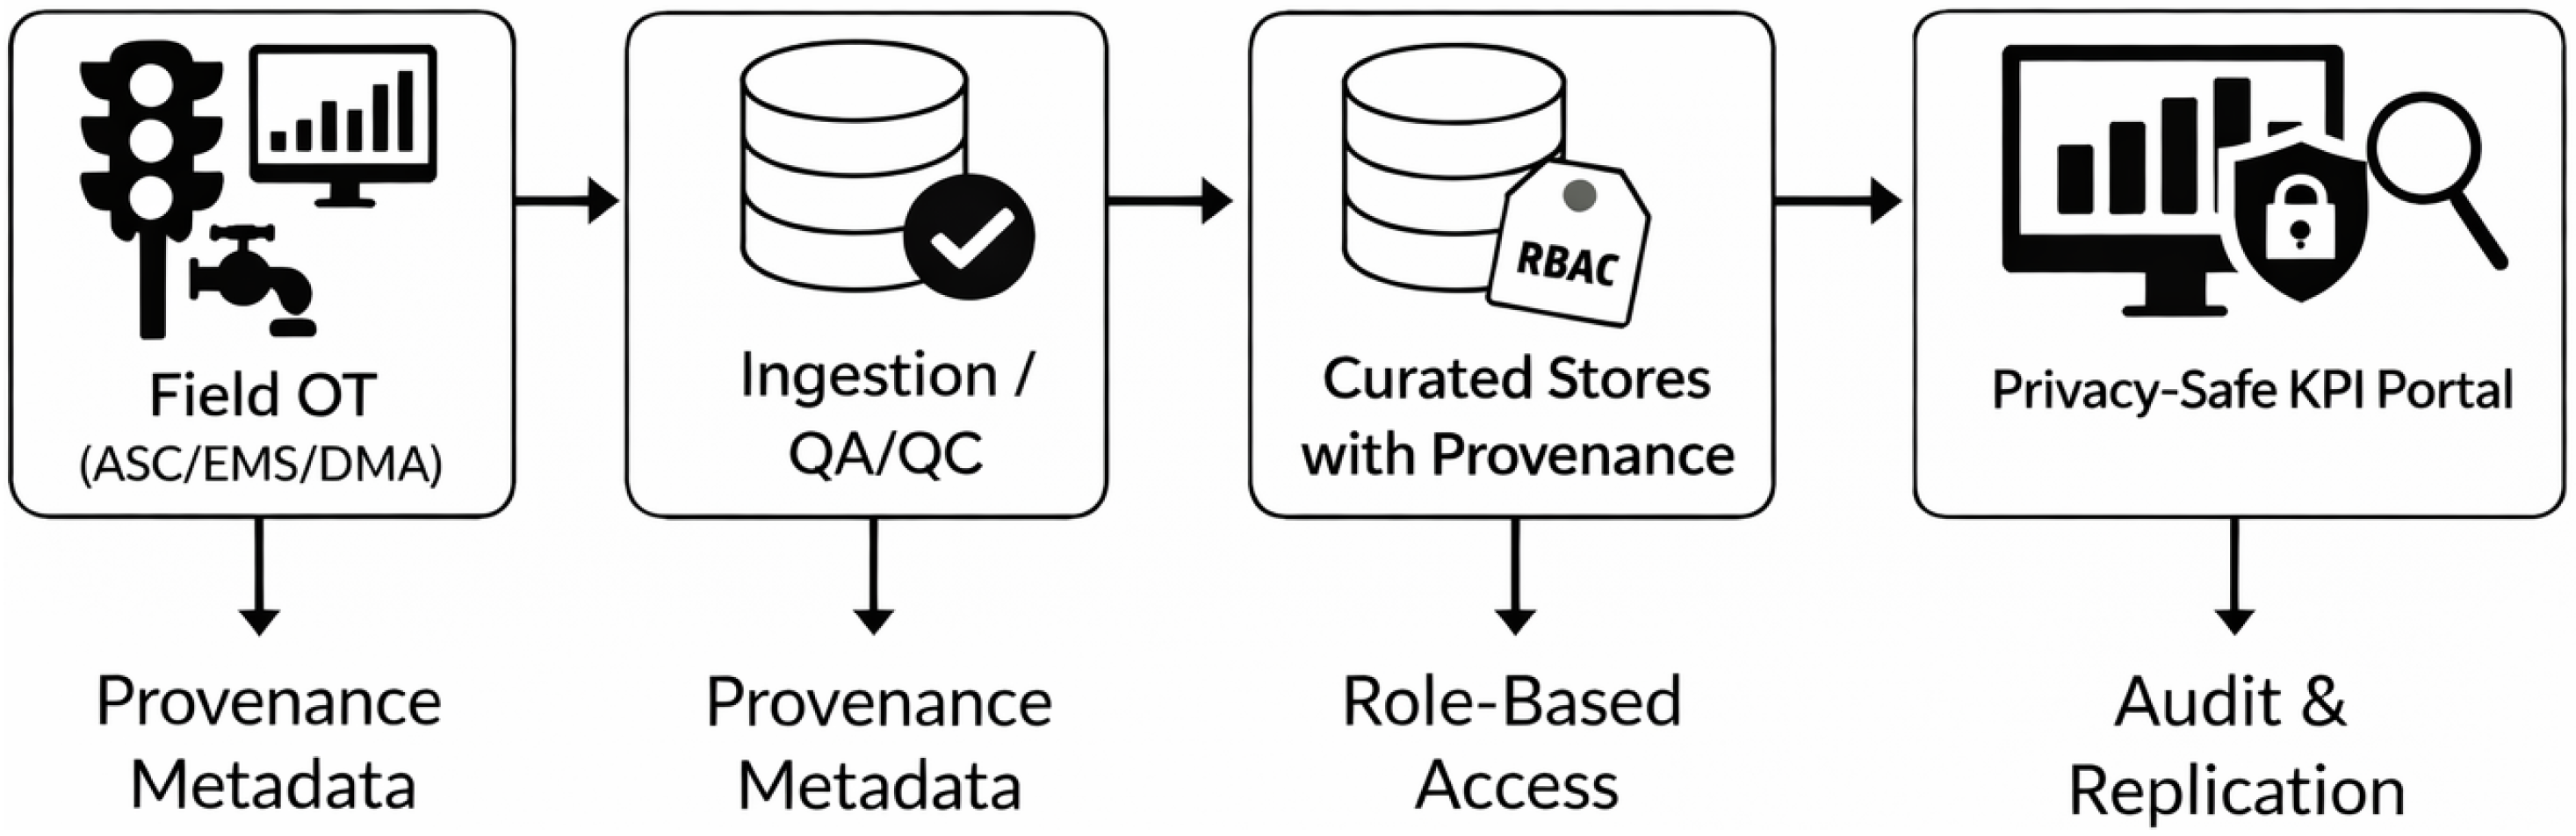
Figure 1 summarizes the mechanism-first logic adopted in this study. Rather than representing a purely technical architecture, the figure depicts the operational component of a broader causal assessment pathway in which smart-city interventions generate outcomes only when sensing, governed data platforms, analytics, and sectoral operations modify real service decisions and produce measurable KPI changes. The lower part of the framework therefore emphasizes the evaluative requirements that make causal interpretation credible: data governance, security and privacy safeguards, explicit KPIs, stable boundaries, and verifiable evidence. This distinction is important because the presence of a technological layer alone does not demonstrate sustainable urban impact; impact is credited only when a mechanism can be linked to an observed outcome under a defensible baseline and evidence standard.
2.3. Reference Frameworks
Two complementary reference lenses structure the analysis. First, multidimensional smart-city frameworks in the literature provide a governance and services-oriented perspective for organizing urban domains, institutional readiness, and stakeholder roles [
10,
12,
17]. Second, the ITU Smart Sustainable Cities framework provides KPI-oriented guidance for sectoral assessment in areas such as energy, buildings, water, and transport [
13]. These lenses are not treated as interchangeable. Rather, the first is used to frame governance, service integration, and institutional readiness, whereas the ITU framework is used to anchor KPI selection, reporting discipline, and cross-sector comparability.
This distinction supports the readiness–impact matrix developed later in the paper. In that matrix, readiness reflects governance, infrastructure, data quality, interoperability, and implementation capacity, while impact is interpreted through sector-relevant KPIs under Saudi climatic, infrastructural, and institutional conditions [
9,
13].
Table 2 summarizes the reference frameworks and their analytical roles in this study.
2.4. Evaluation-Theory Basis of the Verification-Oriented Framework
The mechanism-first logic adopted in this study is not intended to describe only a technical architecture. Rather, it is used as an evaluation logic that links smart-city interventions to observable sustainability outcomes through explicit causal pathways. In this sense, sensing infrastructure, governed data platforms, analytics, and sectoral operations are treated as operational mechanisms that can influence urban performance only when they are embedded in appropriate institutional arrangements, implementation capacities, and measurement systems.
This framing draws on theory-based evaluation, which emphasizes that credible assessment requires an explicit program theory connecting interventions, implementation conditions, mechanisms, outputs, and outcomes [
18,
19,
23]. Applied to smart cities, the intervention is not simply the deployment of IoT devices, digital platforms, or AI models. The relevant causal question is whether these deployments change operational decisions, service delivery, resource consumption, reliability, or user experience in ways that can be measured against a defensible baseline. For example, adaptive signal control can contribute to sustainable mobility only if sensor data are translated into timing changes that reduce approach delay or travel time variability within a clearly defined corridor and time window. Similarly, building energy analytics can support sustainability only if they generate verifiable reductions in energy intensity or peak demand after normalization for weather, occupancy, and operational schedules.
The assessment principles used in this paper are therefore derived from evaluation-theory requirements rather than from a simple checklist. First, verifiability is required because public-sector performance claims must be supported by traceable evidence, identifiable data provenance, and reproducible indicators. Without verifiable evidence, smart-city claims remain promotional or aspirational rather than evaluative. Second, boundary discipline is necessary because smart-city interventions usually operate at specific asset, corridor, district, or program levels, whereas sustainability outcomes are often reported at city or national scales. Explicit spatial, temporal, and institutional boundaries reduce ecological fallacies and prevent subsystem results from being interpreted as citywide impacts. Third, baseline specification is required because improvement can only be interpreted relative to a credible counterfactual, such as a fixed-time traffic plan, a pre-deployment building schedule, or a historical non-intervention period. Fourth, evidence grading is necessary because public documentation varies substantially across Saudi cases, ranging from plans and targets to operator records, official statistics, and peer-reviewed evaluations.
This logic is also consistent with realist evaluation and contribution analysis [
20,
21]. Realist evaluation asks what works, for whom, under which conditions, and through which mechanisms; this is particularly relevant for Saudi smart-city initiatives because climate stress, mass-gathering dynamics, infrastructure maturity, and governance capacity affect whether the same technological mechanism produces comparable outcomes across cities. Contribution analysis is also relevant because most smart-city outcomes cannot be attributed to a single intervention through experimental control alone. Instead, the assessment must build a credible contribution story by connecting mechanisms, implementation evidence, baselines, and observed KPI movement while acknowledging alternative explanations and remaining uncertainty.
The framework also incorporates insights from institutional theory, innovation diffusion, and public value management [
22,
24,
25]. Institutional theory highlights that smart-city mechanisms depend on mandates, roles, regulatory arrangements, procurement rules, and organizational legitimacy. Innovation diffusion theory explains why technically similar solutions may spread unevenly across municipalities depending on relative advantage, observability, compatibility, trialability, and implementation complexity. Public value management further clarifies that smart-city assessment should not be limited to technical efficiency, but should examine whether digital interventions create publicly valuable outcomes, such as improved service reliability, reduced resource waste, greater transparency, and more accountable urban governance.
Accordingly, the verification-oriented framework developed in this paper treats smart-city assessment as a causal and institutional evaluation problem. The technical layers shown in
Figure 1 represent enabling mechanisms, but the credibility of any claimed sustainability effect depends on whether these mechanisms can be connected to explicit KPIs, stable boundaries, defensible baselines, and evidence of sufficient quality. This theoretical grounding justifies the readiness–impact matrix used later in the paper: readiness captures institutional and operational conditions for implementation, while impact captures only those KPI effects that are supported by sufficiently verifiable evidence.
2.5. Operational and Technological Pillars
IoT and governed data platforms. The instrumentation layer includes building sensors, DMA pressure and flow meters, feeder and substation telemetry, and ATMS detectors. These data streams are ingested on operational timescales, quality-checked for missingness and outliers, and stored under governance rules that define access, retention, and privacy protection [
8,
11]. In this study, such platforms matter because they make it possible to compute mechanism-specific KPIs over consistent temporal windows and stable spatial boundaries.
Analytics and AI for control. Analytics support three broad functions: detection, prediction, and control. Representative examples include leak and anomaly detection, short-term forecasting of traffic and load, adaptive traffic-signal timing, occupancy-informed HVAC control, and condition-based maintenance. The paper therefore treats AI not as an end in itself, but as an operational means whose value must be demonstrated through explicit baselines and service-level KPIs rather than through model-fit metrics alone [
8,
14].
Smart grids and distributed energy resources. In the energy domain, relevant mechanisms include demand response, peak shaving, storage coordination, and distributed energy resource integration. For these mechanisms, the analysis emphasizes verifiable indicators such as peak reduction, load factor, and curtailment, and it explicitly distinguishes renewable electricity output from renewables in final energy use to avoid cross-domain conflation [
10,
11].
Security, privacy, and resilience. Security and resilience are treated as enabling conditions for credible smart-city operation. Network segmentation, role-based access control, privacy-preserving aggregation, and continuity measures such as backup power and communication support are especially important in the Saudi context, where extreme heat and high-demand event periods can stress urban systems [
9,
16].
Table 3 lists the main operational and technological pillars considered in the analysis.
2.6. Implications for the Saudi Case Analysis
In Saudi Arabia, the relevance of these frameworks and pillars is shaped by climatic stress, water scarcity, rapid metropolitan growth, legacy-infrastructure integration, and large event-driven population surges. These conditions make mechanism-level verification particularly important because claimed smart-city benefits may vary substantially across sectors, municipalities, and operating periods [
9]. Consequently, the subsequent sections focus not on generic smart-city branding, but on whether concrete mechanisms can be linked to measurable effects through defensible baselines, explicit boundaries, and transparent evidence quality.
To operationalize this perspective, the next sections introduce the Saudi initiatives and city-level programs considered in the empirical synthesis and evaluate them using the verification protocol developed in this study.
3. Saudi Urbanization and Sustainability Context
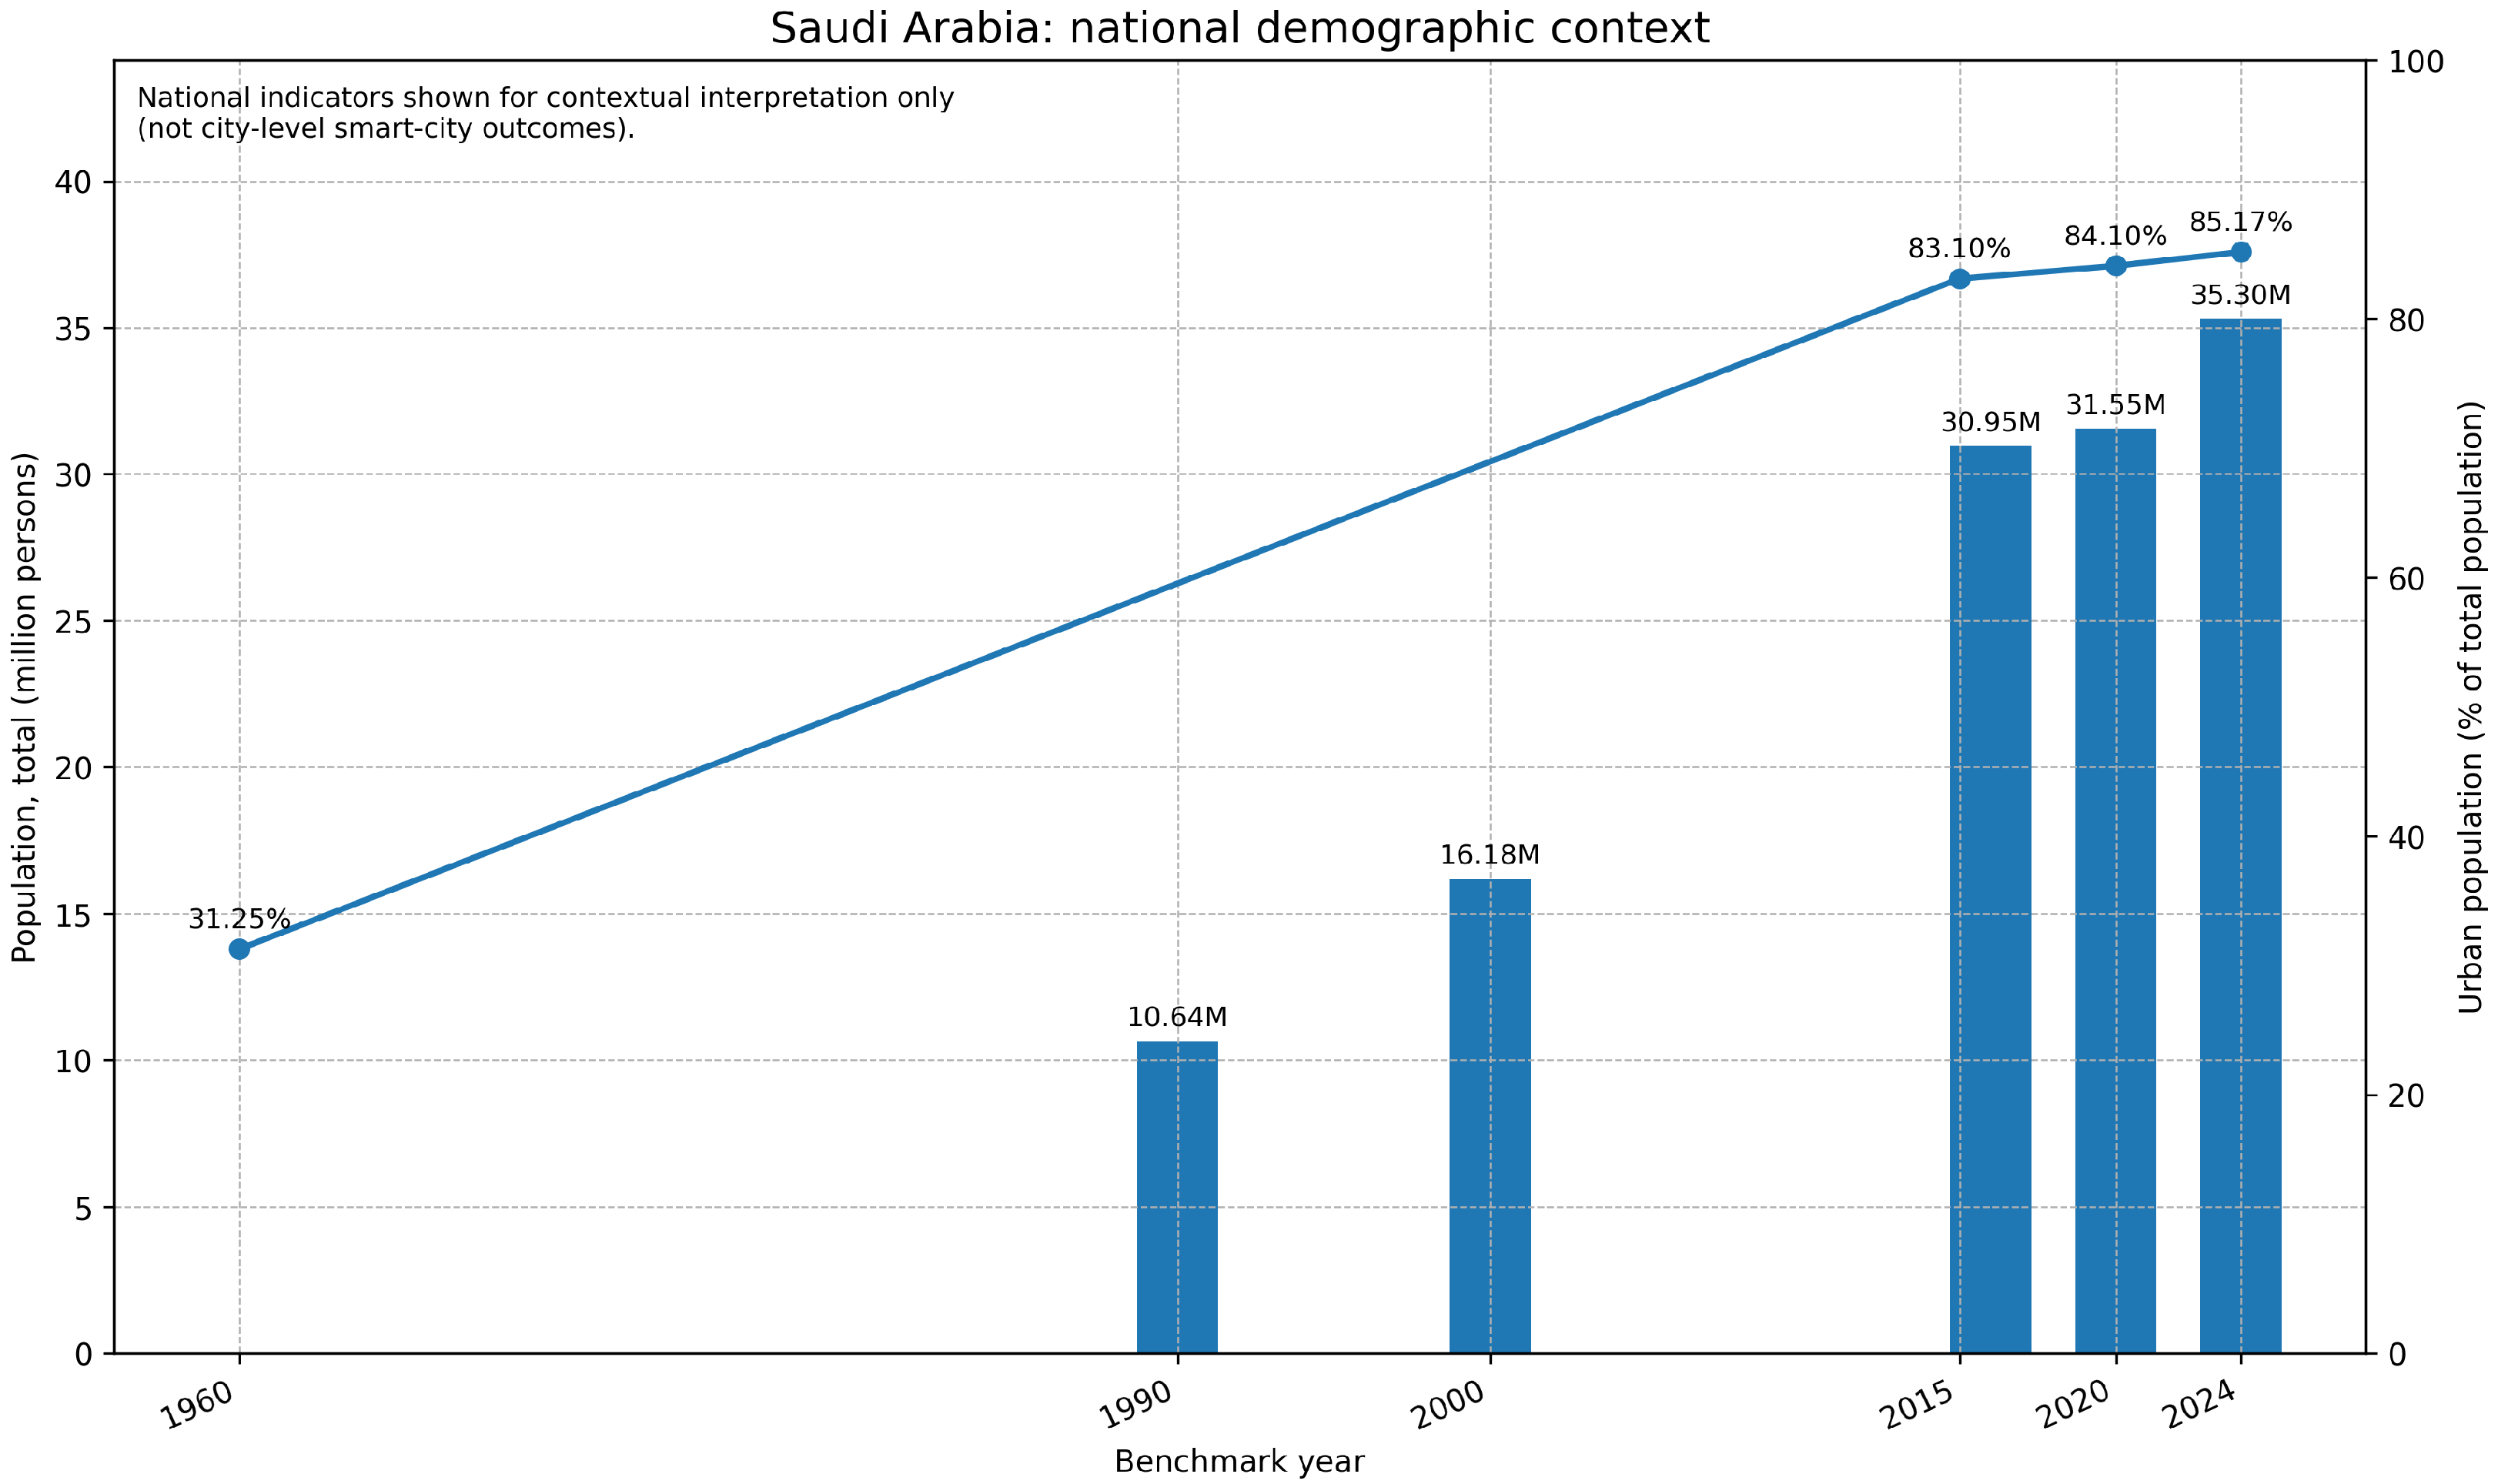
Saudi Arabia’s rapid urbanization, cooling-dominated climate, and recurring mass-gathering dynamics jointly define the operating conditions under which urban services function and smart-city mechanisms must be evaluated. This section synthesizes national indicators strictly as contextual evidence, not as city-level outcomes, and identifies the scope conditions that later inform baselines, counterfactuals, evidence classification, and readiness–impact assessment [
1,
2,
3,
9,
26,
27,
28,
29]. As illustrated in
Figure 2, benchmark-year national demographic indicators help explain demand concentration, service stress, and the measurement conditions that shape the design and interpretation of KPIs in the Saudi context. However, in this study, such national series are used only to define the operating context, plausibility limits, and reporting discipline; they are not interpreted as direct evidence of municipal smart-city impacts.
3.1. Urbanization Trajectories (National)
National demographic series indicate sustained population growth and a high and increasing share of urban residents, consistent with long-term structural changes in employment, land use, infrastructure demand, and pressure on public services [
2,
30]. The concentration of population in major metropolitan areas implies: (i) pronounced temporal peaking of daily demand driven by commuting and weekend cycles; (ii) strong seasonal peaks associated with cooling demand; and (iii) greater system-level sensitivity to operational interventions such as adaptive traffic control and demand response. From a measurement perspective, these dynamics require: (a) KPI windows that capture rush-hour and seasonal variability; (b) explicit spatial boundaries for corridors, feeders, districts, and district-metered areas (DMAs); and (c) strict separation between program-level and city-level aggregates to avoid ecological fallacies, consistent with standardized city indicator practice [
28]. Consequently, national urbanization indicators are treated here as contextual constraints on urban-service demand, rather than as evidence of local smart-city effectiveness.
Importantly, national urbanization is not spatially uniform. Urban demand is concentrated in a limited number of major metropolitan centers, especially Riyadh, Jeddah, Makkah, and Madinah, whereas other initiatives, such as NEOM and KAEC, represent greenfield or master-planned development trajectories with different demographic maturity, infrastructure sequencing, and evidence availability. This distinction is important for the case selection in this study. Riyadh and Jeddah represent mature metropolitan systems undergoing retrofit-oriented digital transformation; Makkah and Madinah represent existing cities whose service systems are additionally shaped by pilgrimage-related demand; and NEOM and KAEC represent planned or semi-planned development models where governance design and infrastructure ambition are more visible than audited city-scale outcomes. The six cases therefore capture key variants of Saudi urbanization rather than a homogeneous national urban condition.
3.2. Climate, Seasonality, and Environmental Stressors
Saudi cities operate in an arid, heat-stressed environment characterized by high cooling demand and recurrent dust events. These conditions shape electricity load profiles, water-network behavior, transport performance, and the reliability of field instrumentation [
9,
29]. In this study, they are treated as measurement conditions rather than as outcome variables. Their role is therefore to define normalization rules, control logic, and robustness requirements, not to imply causal smart-city gains at the municipal scale.
The principal implications for measurement are as follows:
Energy. KPI estimation should incorporate degree-day normalization and peak-season stratification. The effects of demand response and peak behavior should be reported by season and hour of the day to avoid overstating off-peak gains [
26,
28].
Water. NRW and burst metrics are influenced by seasonal pressure profiles and thermal stress on assets. For pressure-management programs, pressure-band compliance (PBC) should be reported along with NRW [
9,
29].
Mobility. Heat and dust can affect incident rates, travel demand, and network capacity. Approach delay and travel time index (TTI) models should therefore include weather and incident covariates and exclude extraordinary events from baseline windows where necessary.
Sensing and QA/QC. Dust ingress and soiling can degrade sensors, cameras, meters, and communications. Data completeness, outlier handling, and missingness controls should therefore be explicitly reported for ATMS, AMI, and DMA data streams [
10,
11,
31].
3.3. Mass-Gathering Dynamics: Hajj and Umrah
Pilgrimage seasons are not treated in this paper as a generic national variable. Rather, they are interpreted as location-specific contextual conditions that are especially relevant to Makkah and Madinah, and more broadly to service systems in the Western Region during Hajj and Umrah periods. These seasons generate predictable but extreme surges in mobility, accommodation, water demand, energy use, and waste collection, especially in Makkah and the Western Region. These surges create: (i) stronger resilience requirements, including redundancy in power and communication systems; (ii) atypical routing and staging conditions for transport and service operations; and (iii) the need to estimate KPIs separately under surge and non-surge regimes [
9,
29,
32]. Accordingly, mechanism effects such as adaptive signal control or dynamic waste routing should be estimated and reported separately for Hajj/Umrah periods, with clearly defined event calendars and spatial boundaries, so that crowd-management performance is not conflated with ordinary urban operations. This distinction is particularly important because the results observed under pilgrimage conditions may reflect short-horizon operational resilience rather than normal day-to-day urban efficiency.
3.4. National Energy Indicators
National energy balances provide an important context for sectoral transitions under Vision 2030, but are not used in this study as proxies for city-level performance. Two distinctions are maintained throughout: (i) national versus city-level aggregation, and (ii) renewable electricity output versus renewables in final energy use, which differ in both the denominator and the sectoral scope [
26,
30]. In parallel with the demographic context summarized in
Figure 2, national energy indicators are used only to frame long-term transition conditions and to assess whether program-level claims remain broadly plausible relative to national trajectories [
1,
26]. They therefore serve as contextual references for horizon-setting and plausibility checks; they are not interpreted as evidence of city-level smart-city performance, nor are they used to infer causal effects for municipal interventions.
3.5. Energy–Water–Mobility Interdependencies
Urban performance in Saudi Arabia is shaped by strong interdependencies across sectors. Cooling-driven electricity peaks can coincide with high potable-water demand in residential, commercial, and hospitality settings, thus increasing the marginal value of demand response, storage, and coordinated system management. Similarly, traffic disruption, dust events, and mass-gathering conditions can affect water and waste logistics, compromising routing efficiency and service reliability. For this reason, KPIs are interpreted in a cross-sector framework: energy (kWh, peak kW, load factor), water (NRW, burst rates, pressure compliance), mobility (delay, TTI), and waste (fuel intensity, overflow rates) are co-reported when mechanisms plausibly interact [
5,
6,
10,
31]. This conservative approach reduces over-attribution, makes conditioning factors explicit, and helps distinguish direct mechanism effects from broader system-wide covariations.
3.6. Measurement Implications and Scope Conditions
Table 4 summarizes the main contextual factors and their implications for KPI design and interpretation in Saudi urban deployments. Beyond the descriptive context, these scope conditions define how baselines, comparison windows, and control logic should be specified in a later case assessment.
3.7. Indicator Design for Saudi Applications
Given these scope conditions, indicator design follows three principles: (i) normalization, (ii) stratification, and (iii) co-reporting. First, normalization converts raw measurements into comparable indicators, such as kWh m
−2 for buildings, L/km for waste fleets, and s/vehicle for corridor approaches, allowing for comparisons across assets and time [
10,
13,
28,
31]. Second, stratification ensures that estimates are reported by season, time of day, and, where relevant, surge versus non-surge operating regimes, particularly for Western Region programs [
29,
32]. Third, co-reporting of cross-sector KPIs, such as energy peaks with water pressure compliance or traffic delay with incident and weather flags, reduces misattribution and captures operational trade-offs more realistically [
5,
6,
31].
Data Provenance and Uncertainty Handling
To preserve verification quality, KPI estimates are interpreted according to a source hierarchy that prioritizes operator or utility records, official statistics, and peer-reviewed evaluations over vendor brochures, promotional summaries, or non-reproducible claims. For each indicator reported, the spatial boundary, the temporal window, the baseline definition, the level of aggregation (asset, program, or city), and the principal QA/QC rules should be explicitly stated. Where data completeness, baseline comparability, or boundary stability are insufficient, the corresponding result is treated as partial or directional evidence rather than as a fully verified city-level result.
3.8. Readiness–Impact Interpretation
The national context defines important boundary conditions for Saudi urban programs, but does not determine their outcomes. In the readiness–impact matrix developed later in the paper, readiness is evaluated at the city or program level through governance, data, infrastructure, and financing conditions, whereas impact is derived from verified mechanism–KPI effects. National indicators are used only for two limited purposes: (i) horizon-setting, for example, in relation to Vision 2030 energy transition goals, and (ii) plausibility checks, such as reconciling claimed renewable shares with national trajectories. They are never used as substitutes for evidence at the city or program level [
1,
26,
28,
30,
31].
These scope conditions are carried directly into the later assessment framework, where cases are judged not only by claimed smart-city functionality but also by the verifiability, boundary clarity, and contextual robustness of their reported KPI effects.
In synthesis, the contextual factors discussed in this section define the interpretation rules used in the readiness–impact assessment. Population concentration explains why mature metropolitan cases such as Riyadh and Jeddah require program- and corridor-level evaluation rather than broad citywide attribution. The distinction between mature existing cities and greenfield or master-planned projects explains why NEOM and KAEC are assessed primarily through planning readiness, governance design, sequencing logic, and evidence availability, rather than through fully verified sustainability outcomes. Climate stress, aridity, and energy–water–mobility interdependencies define the normalization requirements for energy, water, transport, and municipal service KPIs. Finally, Hajj and Umrah dynamics are treated as city-specific surge conditions that are particularly relevant to Makkah and Madinah, requiring event-window baselines and surge/non-surge stratification. These contextual factors therefore inform both axes of the assessment: readiness is interpreted through governance, infrastructure, data, and financing conditions, while impact is credited only when mechanism-specific KPI evidence is boundary-explicit, baseline-defined, and contextually robust.
The case study section therefore uses these contextual distinctions to compare six Saudi smart-city trajectories: greenfield or master-planned development, mature metropolitan retrofit, and pilgrimage-sensitive urban operations.
4. Case Studies of Smart Cities in Saudi Arabia
Saudi Arabia’s Vision 2030 has catalyzed a diverse portfolio of smart-city initiatives that span both greenfield developments and the digital transformation of existing metropolitan systems. Across these settings, cyber–physical infrastructure, including IoT sensing, automated control, data platforms, and digitally coordinated service delivery, is increasingly coupled with new institutional arrangements such as program-delivery vehicles, public–private contracting, and performance-based service models. In line with the verification-oriented perspective adopted in this paper, this section does not treat all cases as analytically equivalent. Instead, it compares six prominent cases, namely NEOM, King Abdullah Economic City (KAEC), Riyadh, Jeddah, Madinah, and Makkah, through a common lens centered on: (i) verified scope and deployment maturity, (ii) documented smart-city mechanisms, (iii) the current status of publicly traceable outcome evidence, and (iv) the implications of these differences for the later readiness–impact assessment.
The six cases were selected purposively rather than statistically. The objective was not to construct a representative sample of all Saudi municipalities, but to capture the main smart-city trajectories currently visible in the Kingdom under Vision 2030. Four selection criteria were used. First, the case had to have national or strategic relevance, either as a flagship initiative, a major metropolitan system, a pilgrimage-sensitive urban center, or a logistics-linked development. Second, the case had to represent a distinct urbanization or implementation trajectory, including greenfield planning, master-planned precinct development, existing city retrofit, metropolitan digital-service modernization, or event-sensitive smart operations. Third, the case had to be sufficiently documented in publicly traceable sources to allow at least a qualitative assessment of deployment scope, mechanisms, and evidence limitations. Fourth, the selected set had to provide functional diversity across transport, municipal services, platforms, energy, logistics, lighting, and surge-period service coordination.
The resulting typology is therefore analytical rather than purely descriptive. Each case was classified using four criteria: (i) development trajectory, (ii) implementation stage, (iii) dominant functional role, and (iv) prevailing evidence type. This classification procedure helps avoid treating highly different cases as directly equivalent. It also supports the later readiness–impact assessment by clarifying whether a case contributes mainly evidence of planning ambition, deployment readiness, mechanism visibility, or partially documented operational performance.
Table 5 summarizes the resulting case-selection and classification logic used for the Saudi smart-city assessment.
The cases are not assumed to be comparable as projects located at the same chronological stage. NEOM and KAEC are assessed mainly as planning-led or staged development trajectories, whereas Riyadh, Jeddah, Makkah, and Madinah are assessed as existing urban systems with different degrees of deployment maturity and evidence availability. The comparison is therefore cross-sectional and evidence-based rather than time-synchronized. It compares what is publicly verifiable at the time of assessment, not the total success of each initiative over an identical implementation period. For this reason, the later scoring procedure separates deployment readiness from verified KPI impact and avoids converting planning ambition, infrastructure delivery, or mechanism visibility into citywide sustainability outcomes unless baseline-defined and boundary-explicit evidence is available.
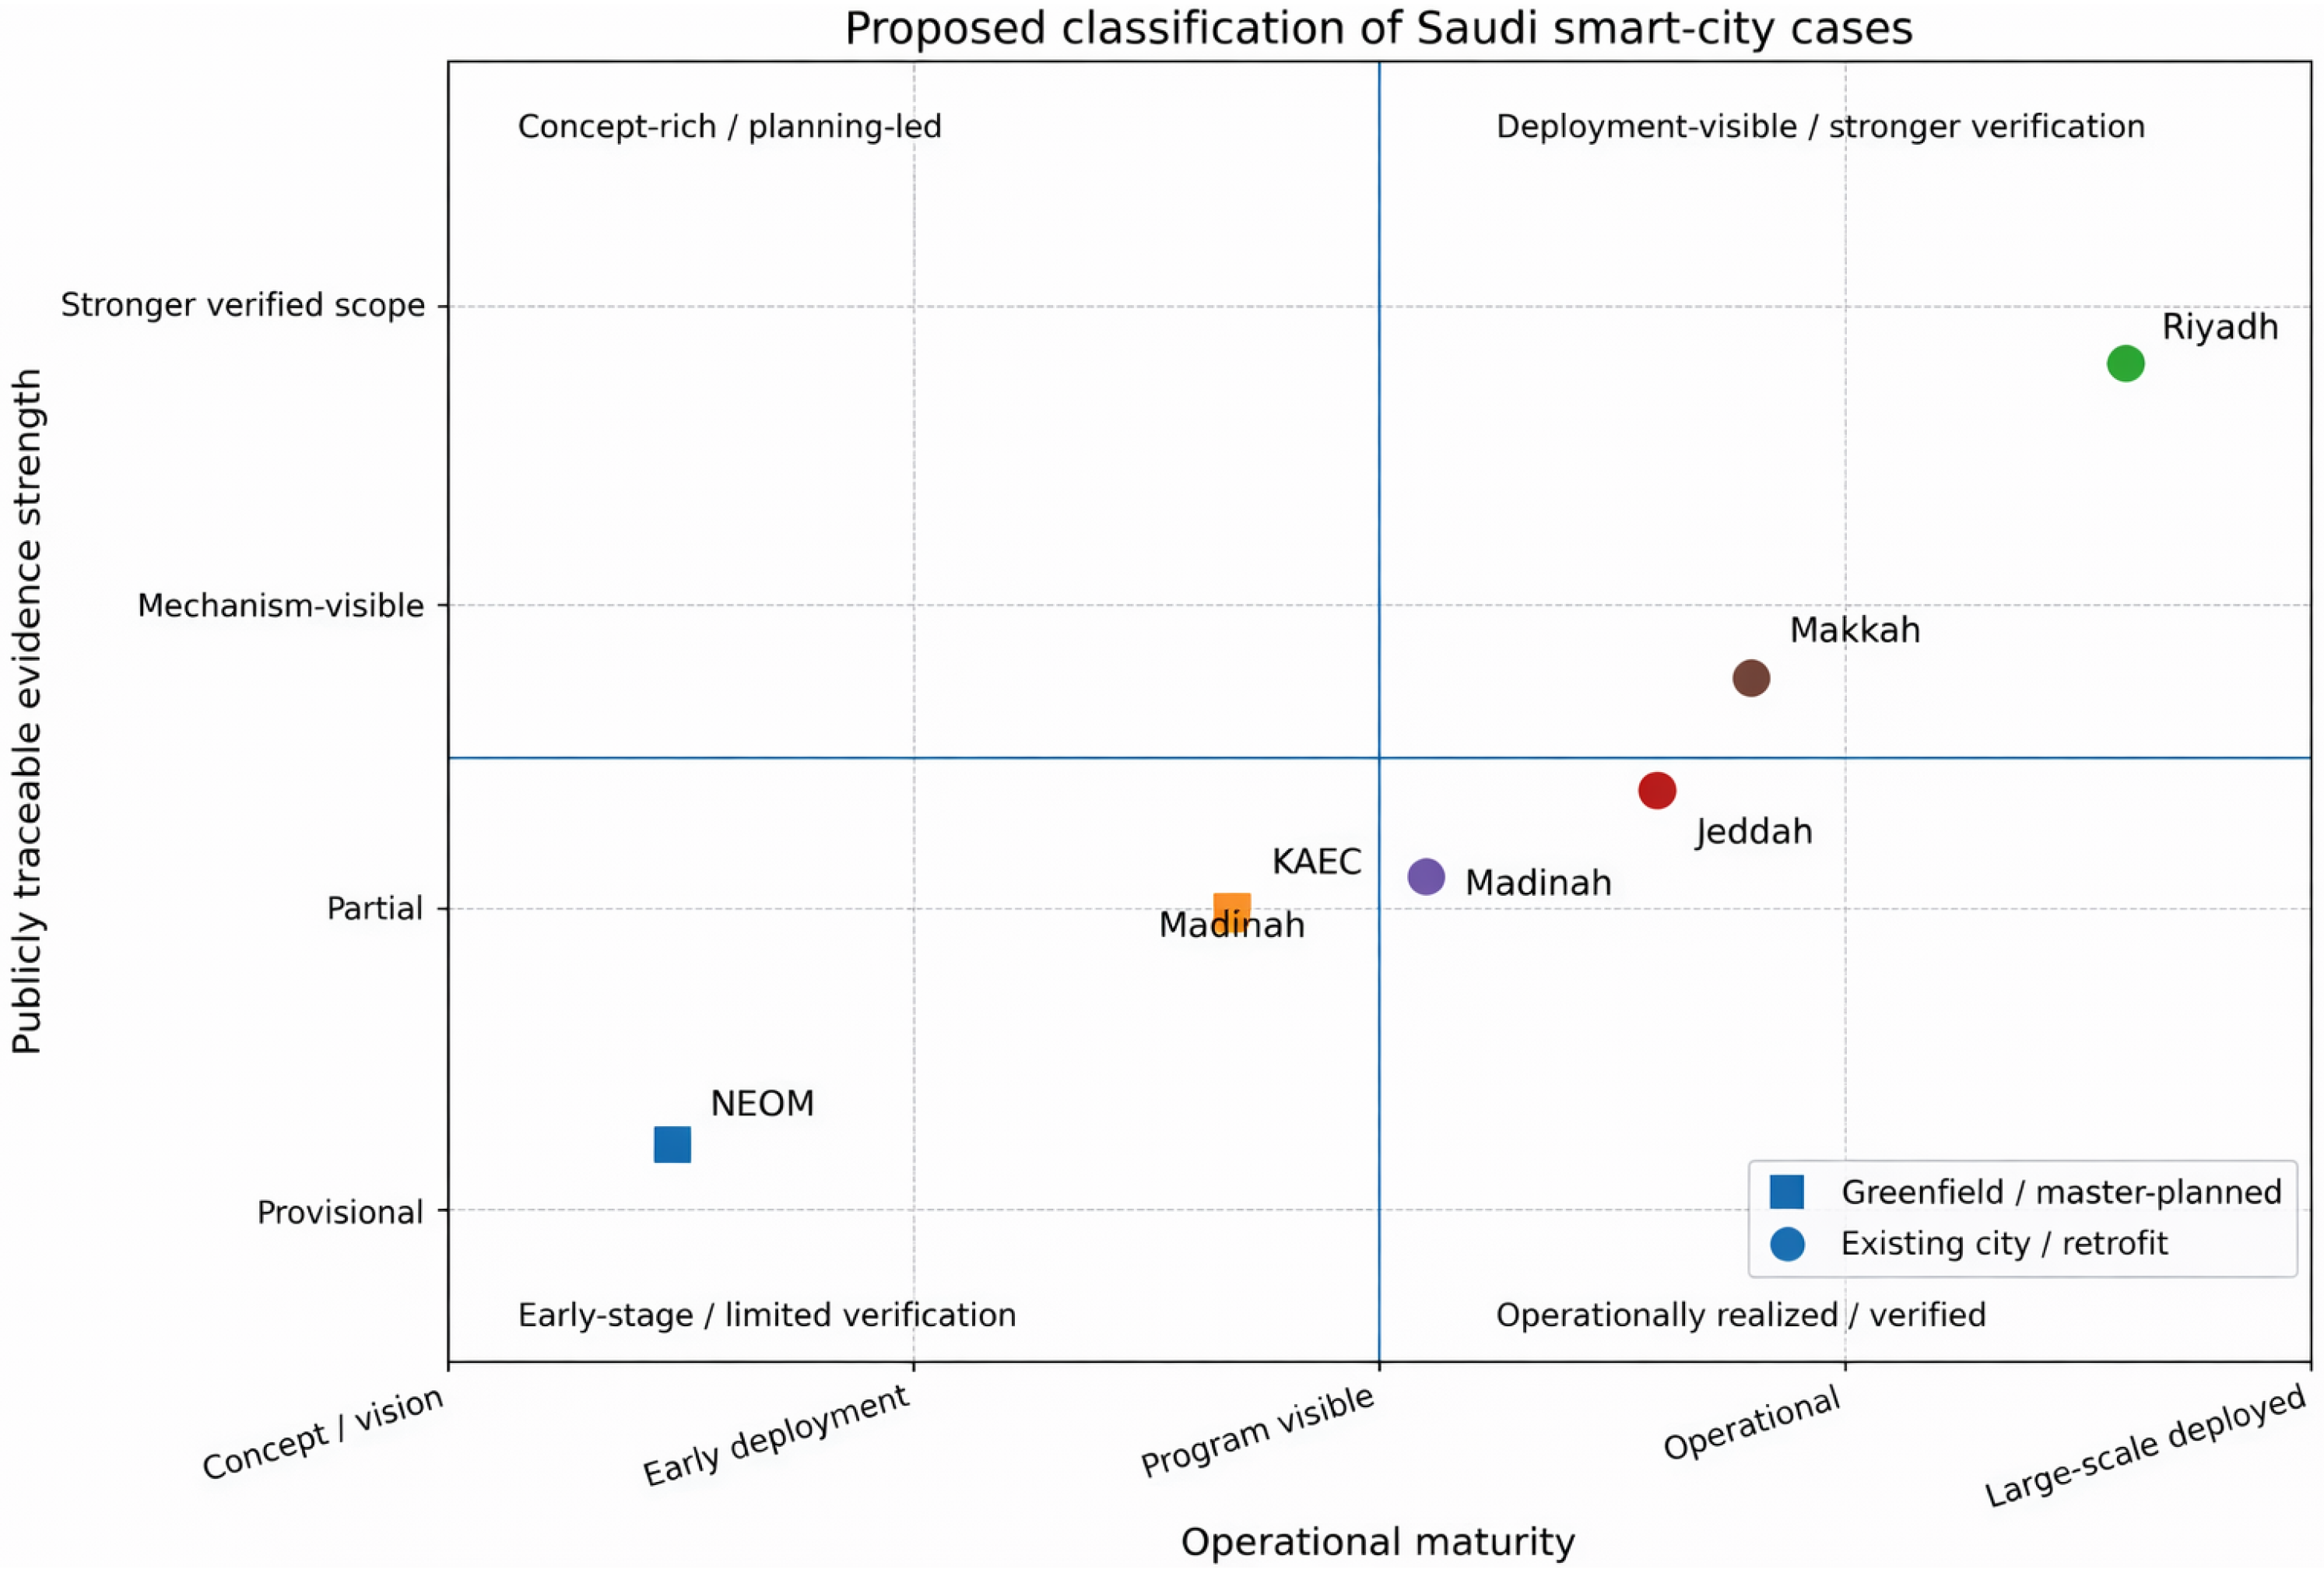
Based on this classification procedure, the selected cases illustrate two broad trajectories of smart-city development in Saudi Arabia. The first consists of greenfield or master-planned developments, such as NEOM and KAEC, where planning ambition, integrated urban design, and governance experimentation are more visible than audited city-scale outcomes. The second includes existing metropolitan systems, such as Riyadh, Jeddah, Madinah, and Makkah, where narrower but more operationally concrete mechanisms can already be identified in transport, lighting, municipal services, and surge-period coordination. This distinction is central to the verification logic of the paper because the visibility, readiness, and measurability of deployment do not evolve at the same pace between these two groups.
Figure 3 provides a compact analytical overview of the six cases. It highlights that high planning ambition does not necessarily coincide with strong public outcome verification, and that existing city programs may exhibit stronger mechanism visibility even when aggregate urban impacts remain only partially demonstrated. This distinction helps clarify why the subsequent assessment gives different analytical weight to deployment maturity, evidence strength, and the scale at which impacts can currently be interpreted.
4.1. NEOM: Planning-Rich, Outcome-Immature Smart Urbanism
NEOM is a planned region in northwest Saudi Arabia with multiple subprojects, most notably THE LINE, Oxagon, and Trojena. Its publicly documented scope is substantial in spatial and institutional terms, but its operational maturity remains staged and uneven across components. For the purposes of this paper, the analytically important distinction is between verified planning and program scope and verified urban performance. Official materials document long-term ambitions in compact transit-oriented urban form, clean-energy supply, digital services, and integrated resource management. These features make NEOM highly relevant as a reference case for master-planned smart urbanism and integrated infrastructure design.
However, independently auditable city-scale performance series remain limited while implementation is still ongoing. As a result, NEOM is not treated here as a mature case with demonstrated citywide sustainability outcomes. Instead, it is interpreted as a planning-rich but outcome-immature case whose strongest present value lies in governance design, system integration ambition, and the articulation of future smart-service architecture. Quantified claims concerning realized energy, mobility, water, or livability benefits should therefore remain provisional until boundary-explicit operational datasets and reproducible evaluation methods are made public [
35].
For the later readiness–impact assessment, NEOM is, therefore, informative primarily on deployment ambition and planning readiness, whereas its verified impact evidence remains limited at the present stage.
4.2. KAEC: Port-Centric Urban Development and Precinct-Scale Services
KAEC is a master-planned development on the Red Sea coast anchored by King Abdullah Port and an industrial and logistics base linked to rail connectivity and special economic-zone instruments. Compared to NEOM, KAEC provides a more mature view of urban delivery on a district-scale and logistics-linked service organization, but its citywide sustainability evidence is still incomplete. Its documented relevance for smart cities lies mainly in logistics digitization, district utilities, precinct-scale service coordination, and the governance sequencing of large planned developments.
Early vision materials projected ambitious residential and economic trajectories, whereas later program and corporate reporting suggest a more gradual residential uptake alongside continued logistics activity and infrastructure development. This makes KAEC analytically valuable as a case of managed urban build-out in which operational systems may advance faster than citywide demographic maturity. Yet peer-reviewed and publicly auditable evidence on aggregate city-level outcomes remain sparse. Accordingly, KAEC contributes more strongly to the paper’s discussion of governance, sequencing, and precinct operations than to any robust quantification of citywide sustainability gains [
36].
For the later readiness–impact assessment, KAEC is therefore treated as a case with visible deployment logic and governance relevance, but only partial publicly verified outcome evidence.
4.3. Riyadh: Verified Large-Scale Transport Deployment with Partial Urban Impact Evidence
Riyadh is the strongest case in this set in terms of clearly documented large-scale infrastructure deployment. Under the Royal Commission for Riyadh City, the capital has implemented one of the world’s largest single-phase automated metro programs, consisting of multiple lines, a long route, and a large station network. The delivered system includes communications-based train control (CBTC), while the project documentation also reports supporting features such as regenerative braking energy recovery and solar integration on-site at selected depots and park-and-ride facilities. These elements provide solid evidence of the major transport-system modernization and establish credible mechanism-level pathways toward modal shift, congestion relief, and improved energy efficiency in transport [
37,
38].
At the same time, the distinction between verified deployment and verified citywide impact remains important. Although reductions in congestion, emissions, or road-transport energy use are plausible, rigorous attribution of such aggregate urban effects requires open longitudinal operating data, transparent baselines, and evaluation methods capable of separating metro effects from concurrent changes in network, land use, and travel demand. Therefore, the present analysis strongly credits Riyadh for verified system deployment and mechanism visibility, while treating broader citywide effects as prospective or only partially evidenced in the open literature [
37,
38,
39].
For the later readiness–impact assessment, Riyadh is thus classified as a case of high verified deployment readiness and partial but credible outcome evidence, especially in transport modernization.
4.4. Jeddah: Visible Digital-Service Modernization with Attribution Constraints
Jeddah illustrates a different smart-city trajectory, centered less on a single flagship megaproject and more on incremental digital modernization in mobility, safety, and municipal services. Publicly traceable developments include camera-based traffic management and automated enforcement within the Saher ecosystem, together with broader municipal modernization efforts related to lighting, metering, and selected IoT-enabled service pilots. These developments indicate substantial progress in digital traffic monitoring, enforcement, and service coordination, and provide credible evidence of a growing operational smart-city layer within the metropolitan system [
40].
The main analytical limitation in Jeddah is not the absence of digitalization, but the limited availability of Jeddah-specific evaluations that isolate the effects of adaptive control at the corridor level, AI-assisted coordination, or integrated municipal analytics. Much of the stronger published evidence is national or cross-city in scope, which makes local attribution difficult. Likewise, citywide performance series suitable for rigorous before–after or counterfactual analysis are not consistently available in the public domain. Jeddah is therefore best understood as a case of visible digital-service modernization with incomplete public outcome attribution rather than as a city with fully demonstrated smart-city impacts [
40].
For the later readiness–impact assessment, Jeddah is treated as mechanism-visible and operationally relevant, but with limited city-specific impact verification in open sources.
4.5. Madinah: Platform-Centric Services and Mechanism-Visible Retrofit
Madinah illustrates a platform-centric smart-city pathway that combines municipal digital services, visitor-oriented applications, and targeted infrastructure retrofits. The available documentation indicates the deployment of integrated service platforms along with an initial phase of street-light modernization. From a mechanism perspective, this combination is credible: digital platforms can improve municipal coordination and user-facing access, while LED and intelligent-control retrofits are internationally associated with substantial reductions in lighting-related electricity demand when appropriately measured.
However, from a verification perspective, the distinction between projected savings and realized city-level outcomes is essential. In the absence of interval metering, matched seasonal baselines, and publicly accessible operating series, expected electricity savings from lighting upgrades should not be treated as demonstrated aggregate impacts. Madinah therefore represents a case in which the mechanisms are visible and technically plausible, but the magnitude of verified city-level benefit remains insufficiently documented. Its value in this study lies mainly in showing how platform-based municipal digitization and targeted retrofit measures may coexist within a pilgrimage-oriented urban context.
For the later readiness–impact assessment, Madinah is accordingly treated as mechanism-visible, but with light public evidence on aggregate outcome magnitude.
4.6. Makkah: Surge Condition Smart Urban Operations
Makkah presents the most distinctive operational context among the six cases because smart-city systems must function under extreme seasonal and event-driven demand associated with Hajj and Umrah. In this setting, the most relevant smart-city contribution is not simply routine efficiency but the ability to sustain continuity, safety, and service coordination under surge conditions. Documented modernization priorities include scalable traffic management, public-realm lighting upgrades, and digitally coordinated service platforms capable of supporting large transient populations. National ESCO documentation also reports major LED street-lighting retrofits with indicative fixture-level savings consistent with comparable retrofit programs elsewhere in the Kingdom [
41].
Analytically, Makkah should therefore not be assessed in the same way as a conventional metropolitan case. Annualized or aggregate citywide indicators may understate the operational value of smart systems that are most important during high-intensity pilgrimage periods. For this reason, evaluation in Makkah should explicitly distinguish surge and non-surge operating windows and should give weight to resilience, continuity, and crowd-management performance rather than focusing only on annual average savings. Makkah is thus best characterized as a surge operations case in which the relevance of smart-city mechanisms is high, but the appropriate evidence design must be event-sensitive and boundary-explicit [
41].
For the later readiness–impact assessment, Makkah is treated as a case of high strategic relevance under surge conditions, but with impact verification that depends strongly on event-specific measurement design.
Table 6 provides a comparative analytical summary of selected Saudi smart-city cases.
Table 6 is intended as a qualitative orientation table. To avoid relying only on impressionistic case descriptions,
Table 7 translates the same cases into a standardized evidence format aligned with the scoring logic developed in
Section 5.1. The table reports the representative mechanism, assessment boundary, KPI and unit, baseline condition, observed or post-intervention value where publicly available, source type, Evidence Score (
), and admissible Impact Score (
). Where baseline or post-intervention KPI values are not publicly reported in the reviewed open sources, this is stated explicitly as NR. Such cases are treated as planning-relevant, mechanism-visible, partial, or directional evidence only, rather than as verified KPI impacts.
Across the six cases, the strongest publicly traceable evidence concerns deployment scope and mechanism visibility rather than harmonized city-level outcome series. The standardized evidence matrix confirms that Riyadh provides the clearest example of large-scale verified transport modernization, but also shows that public baseline and post-intervention KPI series are still insufficient for fully credited citywide impact. Jeddah, Madinah, and Makkah illustrate mechanism-visible interventions whose broader impacts are plausible but depend on stronger boundary-explicit and season-sensitive evidence. By contrast, NEOM and KAEC currently contribute more to understanding governance design, sequencing logic, and development readiness than to measuring the sustainability outcomes realized. This cross-case asymmetry directly motivates the evidence-grading and readiness–impact analysis developed in the following section.
5. Readiness–Impact Matrix and Comparative Benchmarking
This section translates the case evidence synthesized in
Section 4 into a two-axis diagnostic composed of a readiness axis and an impact axis. The matrix is designed as a verification-oriented decision-support tool rather than as a promotional ranking of cities. Its purpose is to identify where Saudi smart-city programs are operationally ready for measurable deployment, where impact evidence is already boundary-explicit and methodologically defensible, and where governance, data, baseline, or reporting limitations still constrain credible assessment.
In keeping with the verification logic adopted in this paper, matrix positions are assigned primarily at the program or mechanism scales rather than at the city scale, unless public evidence provides explicit denominators, aggregation rules, and stable spatial and temporal boundaries for broader interpretation [
10,
11,
13,
26,
28,
42,
43]. The standardized evidence matrix introduced in
Table 7 is therefore used as the bridge between the qualitative case descriptions and the scoring logic developed below. Where baseline values, post-intervention values, or reproducible KPI series are not publicly reported, the corresponding entry is not treated as verified impact, even if deployment scope or mechanism visibility is strong.
5.1. Dimensions, Scoring Logic, and Admissibility Rules
The scoring logic operationalizes the evaluation-theory principles introduced in
Section 2.4, particularly verifiability, boundary discipline, baseline specification, and evidence grading. To reduce subjective interpretation, all ordinal scores were assigned using a predefined coding protocol. The protocol specifies the minimum documentation required for each score, the acceptable types of baselines, the treatment of missing or incomplete data, and downgrade rules when public evidence is insufficient. The scoring unit is the program or mechanism, not the city as a whole, unless the source provides explicit aggregation rules, denominators, and stable spatial and temporal boundaries.
5.1.1. Readiness Score
Readiness reflects the extent to which a program possesses the enabling conditions required for reliable implementation, monitoring, and operational continuity. It is evaluated through four equally weighted dimensions:
- 1.
Governance and mandate clarity: Authorization, role definition, operating responsibility, and O&M continuity.
- 2.
Data quality and access: Telemetry continuity, metadata completeness, latency, archival practice, and documentation.
- 3.
Infrastructure state and operability: Controllability of assets, commissioning status, maintenance practice, and functional redundancy.
- 4.
Financing and contracting: Budget continuity, PPP design, performance clauses, and data-verification requirements.
Each dimension is scored on a scale from 0 to 3, and the overall Readiness Score is defined as
where
G,
D,
I, and
F denote the governance, data, infrastructure, and financing scores, respectively. Higher
values indicate stronger institutional and operational conditions for evidence-ready deployment. The calibration in
Table 8 defines how the 0–3 scale is interpreted for each readiness component.
To make the readiness assessment reproducible, each readiness component was scored using the calibration rules reported in
Table 8. In general, a score of 0 indicates the absence of the enabling condition, 1 indicates partial or pilot-level availability, 2 indicates operational but incompletely documented readiness, and 3 indicates mature, documented, and institutionally embedded readiness. The overall
therefore summarizes the degree to which governance, data, infrastructure, and financing conditions jointly support evidence-ready smart-city deployment.
5.1.2. Evidence Score
Because the paper distinguishes documented mechanisms from verified outcomes, movement on the impact axis is conditioned by an explicit Evidence Score, denoted as . The score evaluates the verifiability of the supporting record, not the magnitude of the reported effect. In other words, measures whether the evidence is sufficiently documented to support assessment, whereas the Impact Score measures the observed strength and robustness of KPI movement.
An acceptable baseline must satisfy four conditions. First, it must be temporally defined, for example, as a pre-deployment period, a matched historical window, a fixed-time control condition, or an event-calendar period. Second, it must be spatially matched to the intervention boundary, such as the same corridor, building, district-metered area, feeder, route, or program boundary. Third, it must use comparable denominators, such as s/vehicle, kWh m−2, MW, NRW percentage, vehicle-km, lane-hours, or service connections. Fourth, it must be reasonably comparable in operating conditions, or explicitly adjusted for major confounders such as seasonality, cooling degree-days, pilgrimage surges, incident periods, occupancy variation, or network reconfiguration.
Missing or incomplete data were handled conservatively. If the source did not report the temporal window, spatial boundary, units, or baseline definition, the evidence was not scored above . If operational logs were available but contained undocumented gaps, unstable boundaries, unclear provenance, or insufficient QA/QC information, the score was downgraded by one level. If the source reported only planned targets, design claims, architectural concepts, or promotional statements without measured outcomes, the score was assigned , regardless of the scale or ambition of the initiative.
The Evidence Score is therefore defined as follows:
: Targets, plans, architectural concepts, or promotional claims only, with no measured KPI outcome and no defensible baseline.
: Qualitative reporting, partial logs, or descriptive evidence with unclear units, incomplete baseline information, unstable boundaries, or undocumented missing-data treatment.
: Operator, utility, or agency records with explicit units, a documented baseline, stable spatial and temporal boundaries, and sufficient data completeness to support program-scale interpretation.
: Audited, official, peer-reviewed, or reproducible indicator series with documented provenance, clear QA/QC procedures, stable denominators, and transparent methods that allow for independent verification or replication.
This classification ensures that stated ambitions remain recorded as ambitions and are not counted as achieved outcomes.
5.1.3. Impact Score
Impact is evaluated through sector-specific KPI movement under explicitly stated baselines and boundaries. To avoid conflating mechanism visibility with demonstrated outcome strength, the Impact Score, denoted as , is calibrated separately from . reflects the magnitude, consistency, and robustness of observed KPI movement, whereas reflects the credibility and reproducibility of the supporting evidence.
The Impact Score is assigned only after verifying that the KPI is mechanism-relevant and measured using a suitable denominator. For example, adaptive signal control is assessed through corridor-level delay, travel time index, throughput, or travel time reliability; building energy management is assessed through kWh m−2, peak kW, or load factor indicators; and pressure management is assessed through NRW, pressure-band compliance, burst frequency, or leak index indicators. KPI changes are interpreted only within the boundary for which the evidence is available.
The Impact Score is defined as follows:
: No observed KPI movement, no measurable outcome, or evidence limited to planned targets.
: Directional or localized KPI movement, but with limited temporal support, partial robustness, incomplete normalization, or narrow operational scope.
: Consistent KPI improvement under a boundary-explicit and method-matched comparison, with appropriate normalization for seasonality, operating conditions, demand variation, or asset scale.
: Replicated, multi-period, or independently verified KPI improvement with stable denominators, transparent methods, and robustness checks across relevant operating conditions.
When data completeness, baseline comparability, denominator consistency, or boundary stability is insufficient, the Impact Score is downgraded or the result is treated as directional evidence only. This conservative rule prevents local or incomplete evidence from being overgeneralized into citywide sustainability claims.
5.1.4. Admissible Impact and Evidence-Gating Rule
The main specification credits movement on the impact axis only when . This threshold is not intended to imply that evidence is fully causal or externally audited. Rather, it represents the minimum documentation level at which the source simultaneously reports a measured KPI, explicit units, a defined baseline, and stable spatial and temporal boundaries. Evidence below this level may still be useful for describing planning ambition or mechanism visibility, but it is not sufficiently documented to support credited KPI impact.
The admissible Impact Score,
, is therefore defined as
Programs with may still appear in the matrix as hollow or non-credited markers to indicate planning relevance or mechanism visibility, but they are not credited with verified KPI impact. This rule reduces the risk that aspirational, partial, or weakly documented evidence is interpreted as demonstrated sustainability performance.
5.1.5. Scoring Reproducibility and Conservative Coding
To improve reproducibility, all program entries were coded using the predefined readiness, evidence, and impact scoring rubrics reported in
Table 8,
Table 9 and
Table 10. The scoring relied only on publicly traceable evidence and followed conservative downgrade rules when source provenance, baseline definition, spatial boundaries, temporal windows, denominator consistency, or missing-data treatment were insufficiently documented. Accordingly, ambiguous cases were not interpreted optimistically; they were either downgraded or reported as partial, directional, or threshold-sensitive evidence.
This procedure does not eliminate all judgment from the assessment, because the available public documentation differs substantially across Saudi smart-city cases. However, it reduces subjectivity by making the scoring criteria explicit, separating readiness conditions from evidence quality and impact magnitude, and linking each score to defined governance, data, infrastructure, financing, baseline, boundary, and data-completeness requirements. Formal inter-rater reliability assessment using weighted Cohen’s kappa remains a useful extension for future applications of the framework when complete independent score sheets are available.
5.2. Program Scorecard and Source Discipline
Table 11 consolidates the representative program entries using the same evidence logic introduced in
Section 4. The table deliberately distinguishes deployment visibility from verified KPI impact. A program may therefore receive a relatively high readiness score because its institutional mandate, infrastructure deployment, or implementation pathway is visible, while still receiving no credited impact if baseline and post-intervention KPI values are not publicly available.
The
and
values reported in
Table 11 are assigned according to the detailed scoring rubric in
Table 9 and
Table 10. Qualitative deployment visibility alone is not sufficient to receive credited impact. Conversely, a localized program can receive a credited program-scale impact only when the supporting evidence satisfies the minimum documentation conditions for
.
The conservative treatment in
Table 11 is intentional. It prevents verified deployment scope, such as the existence of a metro system, digital platform, or retrofit program, from being converted automatically into verified sustainability impact. This distinction is central to the paper’s contribution: it identifies where evidence is already sufficient for program-scale interpretation and where stronger public reporting is needed before citywide claims can be made.
5.3. Matrix Positions and Interpretive Logic
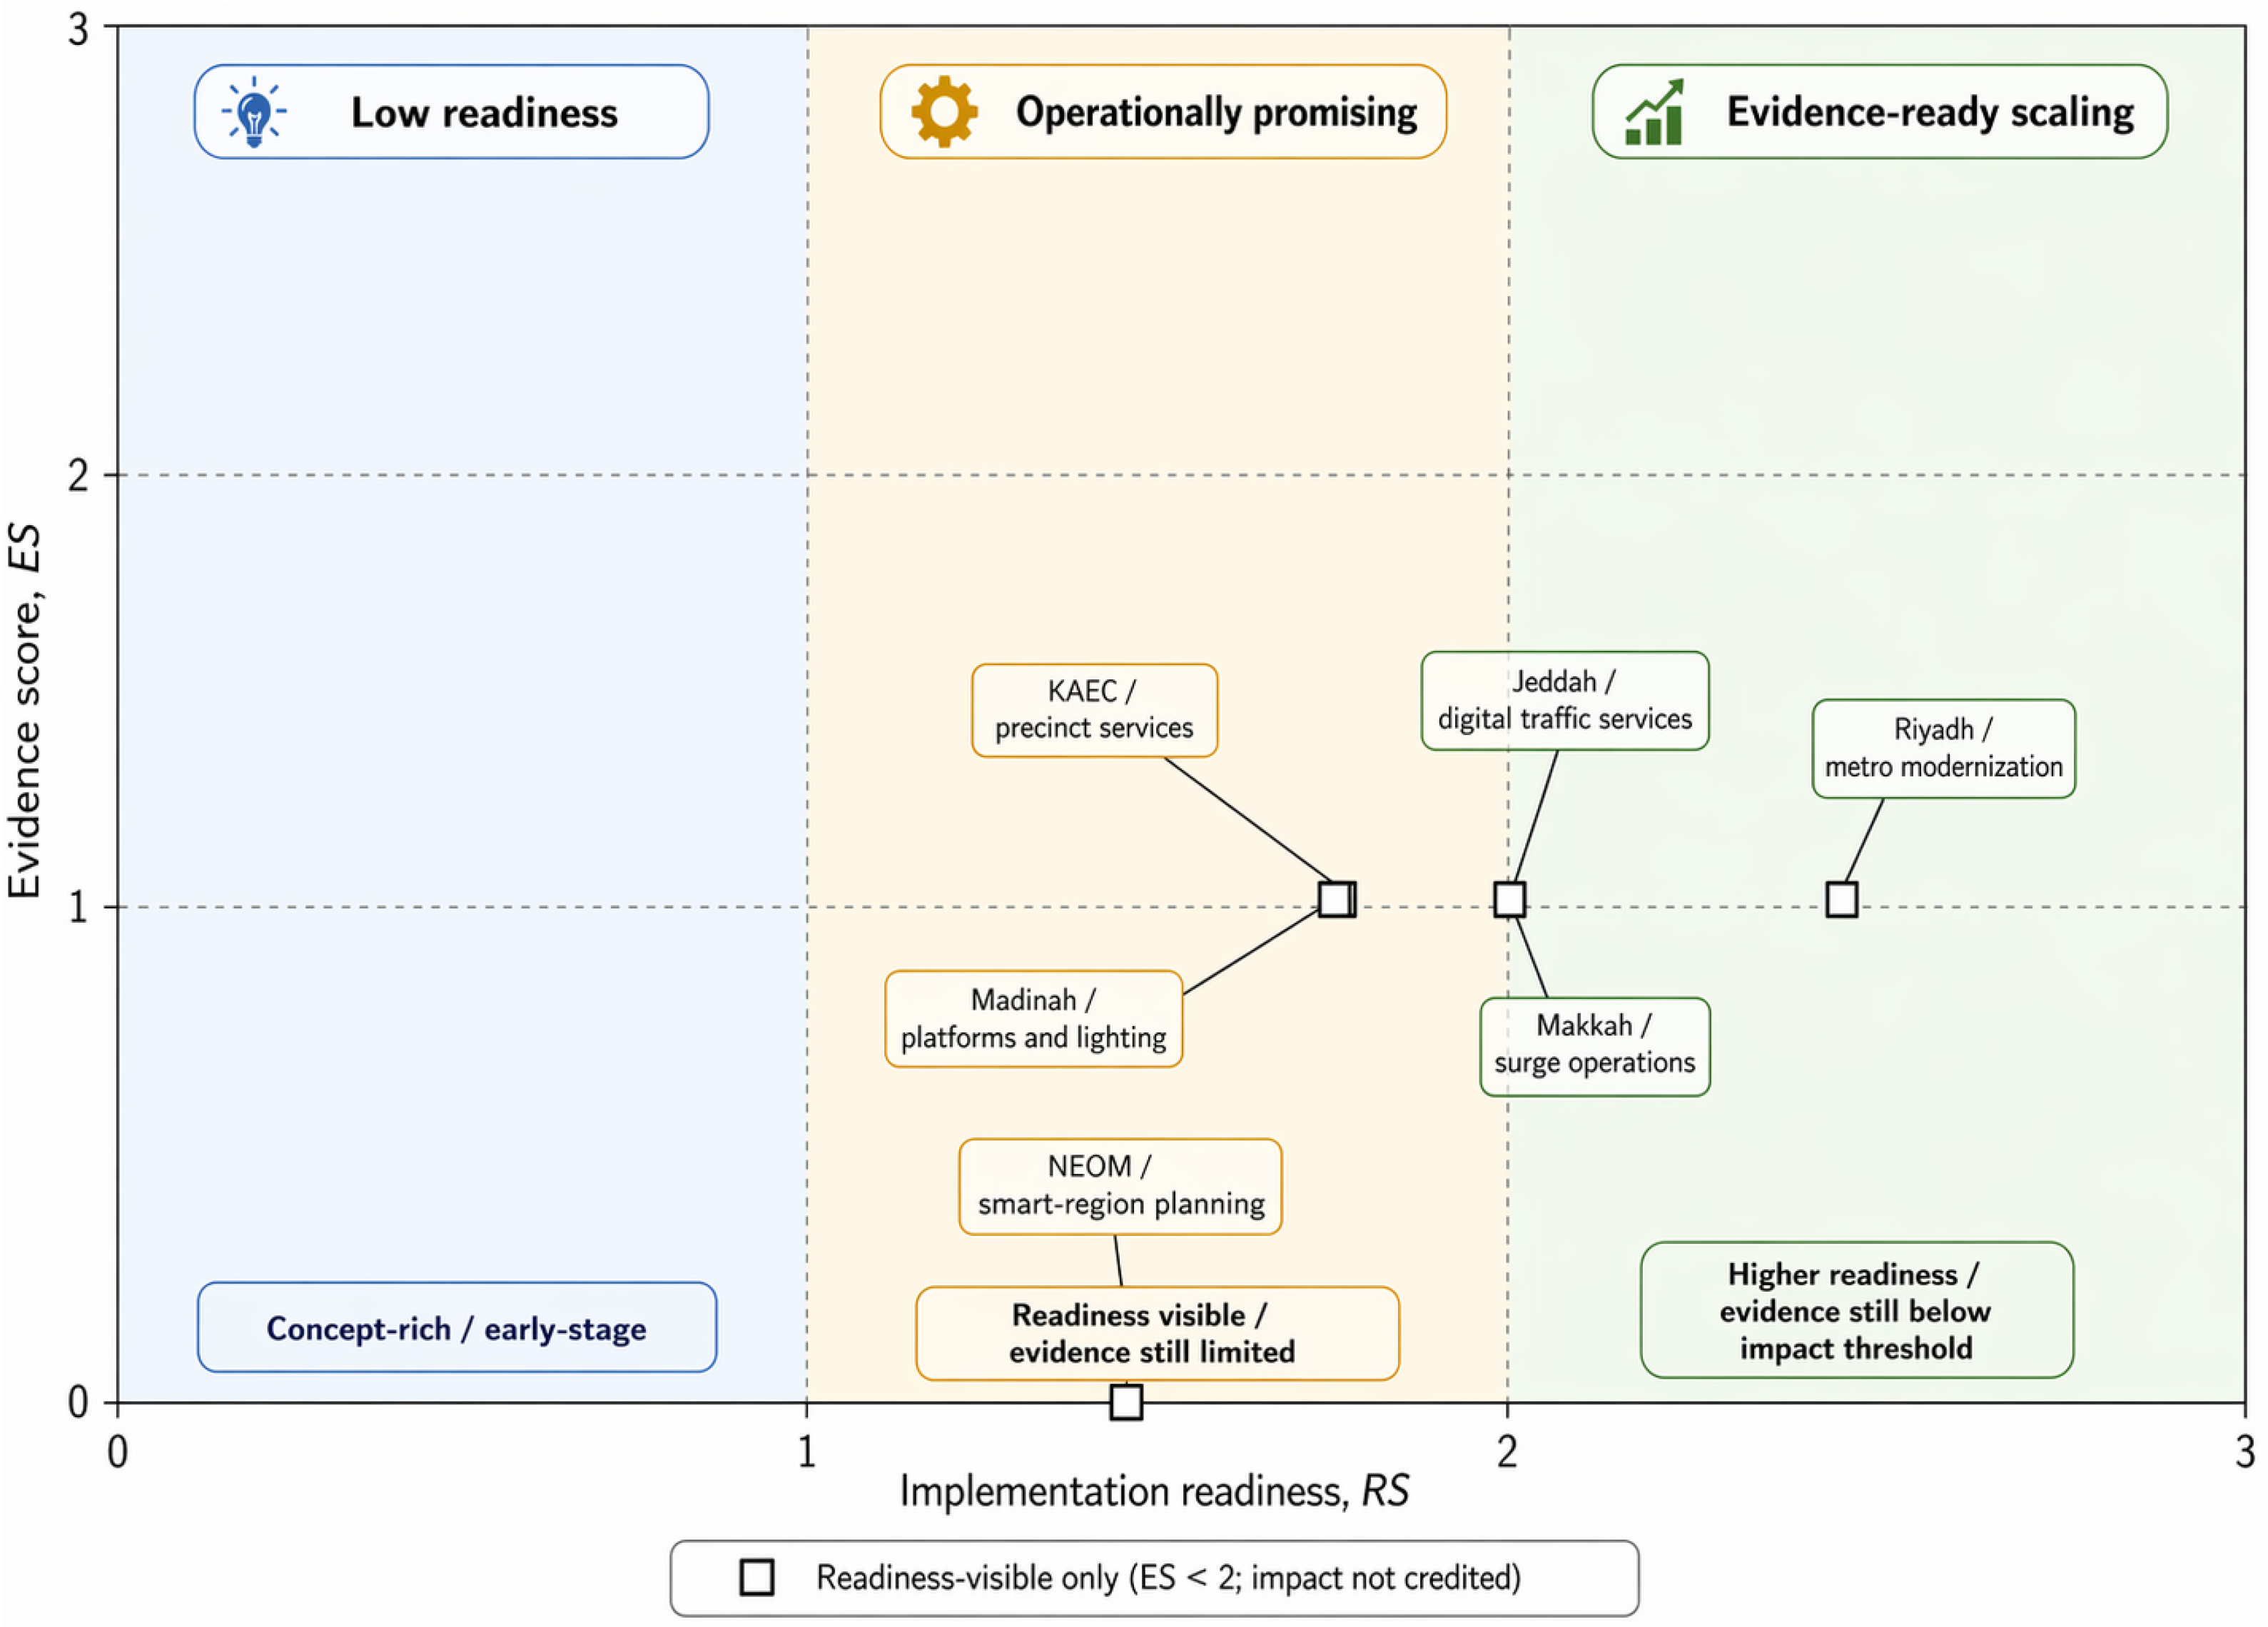
Figure 4 positions the representative cases and programs in the readiness–evidence plane using the
,
, and
values reported in
Table 11. The horizontal axis represents implementation readiness,
, while the vertical axis represents the Evidence Score,
, that is, the degree to which the reviewed public sources provide verifiable, boundary-explicit, and baseline-defined support for interpretation. Each marker is directly labeled with the corresponding case or program name to make the diagnostic mapping explicit.
This visualization shows variation in evidence maturity even when admissible impact remains uncredited under the main evidence-gating rule. In the present public source synthesis, no plotted case satisfies the conditions required for credited impact under the threshold. Accordingly, the figure should be interpreted as a readiness–evidence diagnostic within the broader readiness–impact framework, rather than as a direct display of admissible impact.
To further clarify the figure,
Table 12 provides the explicit marker-to-case mapping used in the readiness–evidence matrix. This table links each plotted point to its corresponding case or program, marker type, Readiness Score, Evidence Score, and interpretation.
The matrix should therefore be read as a diagnostic of evidence readiness, not as a claim that all listed cities have demonstrated comparable sustainability impacts. For the public source synthesis conducted in this paper, several cases exhibit visible readiness or mechanism maturity, but remain impact-uncredited because baseline and post-intervention KPI values are not publicly available. This result is analytically meaningful: it shows where smart-city programs are becoming operationally visible, while also identifying the specific evidence gaps that prevent stronger claims about sustainability outcomes.
5.4. Within-Kingdom Comparison Under Method-Matched Conditions
Cross-case comparison is performed only under method-matched conditions. Transport programs are compared only when the same type of mechanism and boundary can be identified, such as a corridor-level adaptive signal system benchmarked against a fixed-time or legacy timing plan. Building energy programs are compared only when metered boundaries, weather normalization, and occupancy or schedule adjustments are available. Water-network programs are compared only within stable district-metered areas or equivalent hydraulic boundaries, and only when NRW, pressure-band compliance, or burst-related indicators are reported using comparable denominators.
These method-matching requirements also serve as baseline acceptability criteria for the scoring protocol. If a case provides deployment evidence but does not report a comparable baseline, denominator, or temporal window, it can support readiness or mechanism visibility but not credited KPI impact. This is particularly important in the Saudi context because climatic seasonality, cooling peaks, dust events, and Hajj/Umrah surges can substantially affect transport, energy, water, and municipal service indicators. A KPI value observed under one operating regime should not be generalized to another unless the boundary and temporal window are explicitly defined.
Accordingly, the analysis avoids direct ranking of cities. Instead, it identifies mechanism-specific evidence gaps. Riyadh, for example, provides strong deployment evidence for transport modernization, but citywide congestion, emissions, or travel time benefits require open longitudinal data and transparent baseline definitions before they can be treated as verified impacts. Similarly, Makkah requires surge-sensitive baselines and event-window indicators before pilgrimage-period smart operations can be compared with ordinary metropolitan service improvements.
5.5. Policy Learning Interpretation
The readiness–impact matrix supports three policy learning functions. First, it distinguishes deployment readiness from outcome verification. This prevents technologically advanced or high-profile projects from being credited with sustainability impacts that are not yet publicly documented. Second, it identifies the evidence conditions required for stronger claims, such as published baseline periods, post-intervention KPI values, spatial boundaries, denominators, and QA/QC procedures. Third, it highlights where Saudi smart-city programs can improve comparability by adopting common reporting templates.
For public agencies and program operators, the practical implication is that smart-city reporting should move beyond project descriptions and announceable deployment milestones. Each mechanism should be accompanied by a minimum evidence package: the intervention boundary, the baseline condition, the post-intervention measurement window, the KPI unit, the denominator, the adjustment method for confounders, and the data provenance. Such reporting would allow for program-level achievements to be distinguished from citywide effects and would improve the comparability of Saudi smart-city initiatives across sectors and municipalities.
5.6. Sensitivity, Robustness, and Uncertainty Handling
Sensitivity analysis was conducted to examine whether the interpretation of program positions in the readiness–impact matrix remains stable under alternative baseline, denominator, temporal window, and evidence-gating assumptions. This step is important because the available public evidence is heterogeneous across Saudi cases and because small changes in baseline definition or boundary specification can affect the interpretation of reported KPI movement.
First, robustness was assessed under alternative baseline definitions. These included fixed-time versus historically optimized traffic-signal plans, pre/post windows with and without incident filtering, matched-season versus unadjusted comparisons, and surge versus non-surge event windows in pilgrimage-affected cities. For energy-related programs, baseline sensitivity considered weather-adjusted versus non-adjusted comparisons and, where relevant, peak-season versus annualized estimates. For water-network programs, robustness was assessed by considering stable-DMA comparisons, exclusion of reconfiguration periods, and pressure-band compliance alongside NRW indicators.
Second, sensitivity was examined with respect to alternative denominators and aggregation rules. These included per lane-hour or per vehicle for corridor-level transport indicators, per m2 of cooled area for building energy indicators, per service connection or per DMA for water-network indicators, and event-window versus annualized denominators for surge-sensitive operations. Programs whose interpretation remains stable under these alternative denominators are treated as more robust for policy learning, whereas programs whose interpretation changes substantially are reported as denominator-sensitive.
Third, uncertainty was handled through conservative downgrade rules. Where spatial boundaries are unstable, temporal windows are unclear, baseline comparability is weak, data completeness is insufficient, or missing-data treatment is undocumented, the corresponding evidence is downgraded or reported as partial or directional rather than as a fully verified KPI effect. This rule prevents local, incomplete, or poorly documented evidence from being overgeneralized into citywide sustainability claims.
Sensitivity was also assessed with respect to the evidence-gating threshold. Three specifications were considered: a permissive rule, ; the main rule, ; and a strict rule, . Under the permissive rule, programs supported by qualitative reporting or partial logs can receive provisional impact credit, but the risk of over-attribution increases. Under the strict rule, only audited, official, peer-reviewed, or reproducible indicator series are credited, which reduces attribution risk but may understate emerging program-scale evidence in contexts where public reporting is still developing. The threshold is therefore retained as the main specification because it represents the minimum documentation level at which a source simultaneously reports a measured KPI, explicit units, a defined baseline, and stable spatial and temporal boundaries.
The qualitative interpretation of the matrix was checked under these alternative thresholds. Programs whose classification changes under
or
are treated as threshold-sensitive rather than robustly positioned. This reinforces the diagnostic purpose of the readiness–impact matrix and avoids presenting it as a fixed ranking of cities. The procedure also preserves consistency with the admissible impact rule in Equation (
2) and maintains the separation between national contextual series and city- or program-scale operational outcomes.
6. Governance, Risks, and Policy Pathways
This section translates the verification-oriented assessment developed in the previous sections into governance, risk management, and policy implications for Saudi smart-city programs. Its purpose is not to restate generic smart-city aspirations, but to specify the institutional, data, security, and procurement conditions under which smart-city mechanisms can be measured credibly, compared consistently, and scaled responsibly. The analysis therefore remains boundary-explicit and KPI-led, linking sectoral interventions to public-verifiability requirements, SDG-relevant outcomes, and operational risk controls.
6.1. SDG Alignment Through Verification-Oriented KPIs
The relationship between smart-city interventions and the United Nations Sustainable Development Goals (SDGs) is formalized here through a program-scale KPI mapping grounded in the ITU–T Smart Sustainable Cities KPI family (Y.4901/Y.4902/Y.4903), together with ISO 37122 on smart-city indicators and ISO 37123 on resilient-city indicators [
13,
29,
31,
44,
45]. The mapping is defined at explicit operational boundaries, such as corridors, district-metered areas (DMAs), buildings, and service zones, and is interpreted under the same methodological rules used throughout the article: harmonized baselines, seasonal or event-sensitive stratification, and provenance-attested datasets. In line with the verification posture of this study, SDG credit is assigned only where the underlying KPI evidence is sufficiently explicit to support public verification.
Energy- and climate-related interventions, including building energy management, demand response, peak shaving, and distributed energy resources, are evaluated through building energy intensity (kWh m−2), peak-demand reduction (kW/MW or %), and load factor. These indicators support SDG 7, especially Targets 7.2 and 7.3, by improving energy efficiency and facilitating renewable integration, while also contributing to SDG 13 when transparent emissions-conversion factors are applied. Water-efficiency and service-reliability measures, including DMA metering, pressure management, and leak analytics, are captured through non-revenue water (NRW, %), pressure-band compliance, and burst/leak response metrics, thereby addressing SDG 6, especially Target 6.4, and contributing to SDG 11 through more reliable urban-service provision.
In mobility, adaptive signal control and surge operation measures are evaluated through approach delay (s/vehicle), travel time index (TTI), and headway variability, directly supporting SDG 11, especially Target 11.2, on safe, affordable, accessible, and sustainable transport, while also strengthening SDG 9 through data-driven infrastructure management. The performance of urban-services and materials-management is summarized through the overflow rate, missed-collection rate, and fuel intensity of collection (L km
−1) on the route and counterfactuals of the day, aligned with SDG 12, especially Target 12.5, and with SDG 11 on livability. Governance and data-related KPIs, including open-data uptime, time-to-publish, metadata completeness, and documented security posture, advance SDGs 16, especially Target 16.6, and act as cross-functional enablers for measurable progress across SDGs 6, 7, 9, 11, 12, and 13.
Table 13 maps the program-scale KPIs to the relevant Sustainable Development Goals.
6.2. KPI Definitions: Scope, Rationale, and Measurement Posture
Quantifying smart-city performance requires a compact set of operational indicators that are actionable for managers, reproducible for auditors, and comparable across programs. Accordingly, this study adopts boundary-explicit KPIs that link each claim to a clearly defined spatial unit, such as a building, DMA, or traffic corridor, and to a synchronized temporal window, such as 5–15 min measurements and monthly or seasonal reporting cadence. The selected indicators emphasize direct operational levers in energy, water, mobility, and service logistics, together with governance metrics that support transparency and continuity of measurement. To ensure interpretability and cross-study synthesis, the set of KPI follows operational forms widely used in practice and is aligned with the ITU–T Smart Sustainable Cities KPI family, as well as ISO 37122, thus supporting explicit linkage to SDGs 6, 7, 9, 11, 12, 13, and 16 through transparent denominators, baselines, and evidence classification [
13,
31,
44,
45].
For each KPI, estimates should be computed against a documented counterfactual, such as matched non-event days, modeled baselines, or phased rollouts, and should be stratified for weather and seasonality where relevant. Units are standardized, symbols are defined locally, and any data conditioning, including degree-day adjustment, incident filtering, or sensor smoothing, should be disclosed to enable like-for-like replication and defensible attribution.
Building Energy Intensity (BEI).
where
E is the metered site electricity consumption (or total final energy, where available) over the reporting window, and
A is the gross floor area actually served by HVAC and lighting systems. The same occupancy schedule and space inventory should be used across pre/post periods, and reporting should state whether plug loads are included.
Degree-day normalization.
This expression adjusts energy use for weather variability. Here,
and
are the cooling and heating degree days calculated for the evaluation period using stated base temperatures, while the subscript “ref” denotes a common climatic reference period. The base temperature, weather station, and aggregation method should always be reported.
Load factor.
where
is the average demand and
is the maximum coincident demand over the same metering interval. A higher load factor indicates smoother loading and more efficient system utilization. Forced outages should be excluded from the baseline unless resilience effects are being evaluated explicitly.
Peak reduction (demand response/peak shaving).
where
denotes the counterfactual peak in the absence of the program, and
is the peak observed during the intervention window. Results should be reported in both absolute terms (kW/MW) and relative terms (%), together with the baseline construction rule and associated uncertainty.
Non-Revenue Water (NRW).
The system input volume is the metered flow entering the DMA, while billed authorized consumption corresponds to revenue water delivered to customers. NRW should be computed at the DMA level using matched-season comparisons, and any configuration changes, such as valving updates or meter replacements, should be documented because they affect the mass balance.
Pressure-band compliance.
where
is the measured pressure at time
t,
denotes the service band, and
T is the total number of sampling intervals. Reporting should specify sensor locations, sampling intervals, and any smoothing or validation rules. This KPI should be interpreted jointly with NRW to avoid crediting apparent gains that are due only to pressure suppression.
Travel Time Index (TTI).
where
is the travel time observed during the designated peak period and
is the free-flow travel time measured on the same corridor and in the same direction. Corridor geometry, time windows, and incident/weather filters should be stated explicitly. When evaluating adaptive signal control, TTI should be reported together with approach delay (s/veh), using matched seasons and lane-hour denominators where applicable.
6.3. Verification-Ready Data Governance, Cybersecurity, and Fairness
Scaling smart-city programs from pilots to operational systems requires a data regime that is privacy-preserving, verifiable, interoperable, and portable across vendors and contract cycles [
46,
47]. In the approach adopted here, aggregated and boundary-explicit KPIs, such as corridor-level approach delay or DMA-level non-revenue water, constitute the default unit of public reporting, while record-level data remain subject to role-based access control, purpose limitation, and retention policies. Each published indicator should be accompanied by provenance metadata, including source system, timestamps, spatial boundary, and QA/QC status, together with a concise methodological note that enables independent replication [
10,
13,
28,
31,
43,
48,
49]. To reduce vendor lock-in and preserve longitudinal comparability, interfaces should remain vendor-neutral and schema-documented, with machine-readable data dictionaries and versioned change logs for any configuration or algorithmic changes that may affect KPI computation [
6,
46,
47].
Figure 5 summarizes these requirements as a verification pipeline extending from field operational technology (adaptive signal control, building EMS/DR, and water DMA/SCADA), through data ingestion and QA, to curated stores with lineage, and finally to a privacy-safe KPI portal that supports audit and replication. Treating operational systems as measurement infrastructure, through stable asset identifiers, synchronized clocks, and control-state traces, makes baseline matching, counterfactual construction, and uncertainty reporting reproducible, consistent with KPI-oriented guidance from ITU–SSC and with scholarly calls for methodological transparency rather than promotional reporting [
9,
10,
11,
13]. Because ASC, SCADA, AMI, and DMA platforms act simultaneously as operational and measurement infrastructure, their protection should follow OT-aware cybersecurity principles rather than generic IT controls alone [
50]. The same pipeline can support machine learning-based detection, prediction, and control, provided that the models are tied to auditable inputs, documented preprocessing steps, model cards, and drift-monitoring procedures [
14,
47,
51,
52,
53].
Cybersecurity is a first-order determinant of readiness because any loss of integrity or availability directly undermines KPI credibility. Core controls include up-to-date OT/IT asset inventories, network segmentation between field OT and enterprise IT, patch and firmware management policies, credential hygiene, least-privilege access, and incident-response playbooks exercised at the same cadence as operational drills [
8,
11,
50]. Fairness controls are equally important. Signal timing and transit headways should be reviewed for district-level accessibility, demand response and tariff pilots should report eligibility and uptake geography, and AI-enabled services should disclose model documentation together with parity and error-checking procedures [
5,
14,
52,
53]. Across domains, transparent data lineage and reproducible methods remain prerequisites for external verification and cross-city comparability [
13,
31].
6.4. Climate Stress, Water Scarcity, and Seasonal Surges as Governance Risks
Saudi operating conditions shape both readiness and plausible impact ranges. Cooling-dominated demand, extreme heat, airborne dust, and mass-event surges associated with Hajj and Umrah all influence how urban systems perform and how smart-city interventions should be evaluated [
9,
29]. These conditions increase the value of robust building control, grid flexibility, resilient field instrumentation, and dual-mode operating policies that explicitly distinguish surge from non-surge conditions in transport, water, and energy systems. Accordingly, programs should parameterize control targets by season and event-calendar, document matched-season baselines, and harden outdoor electronics through environmental enclosures, filtration, derating, and preventive maintenance tailored to local stressors.
Because water scarcity is structural, leak detection, pressure management, and district metering deserve particular emphasis where telemetry quality permits. Their results should be reported through standardized and auditable indicators, notably NRW, leak index, and pressure-band compliance, to support longitudinal verification and cross-city comparison [
13,
26,
29].
Figure 6 complements the governance architecture by summarizing coverage across eight risk families that condition readiness and attainable impact in the Saudi context: data governance, cybersecurity, algorithmic fairness, climate/heat/dust resilience, water scarcity, surge operations, O&M capacity, and procurement/PPP design. The matrix is intended as a program-management tool rather than an empirical performance scorecard. Filled cells denote the dominant current status assigned to each risk family, distinguishing areas in which controls are largely established from those where mitigation remains partial or where material gaps persist. Consistent with regional reviews, transparency and systematic fairness evaluation often lag behind technical hardening and security controls, suggesting that governance reforms should advance in parallel with infrastructure deployment [
9,
10,
29].
6.5. Financing, Procurement, and Performance Contracts
Financing and procurement determine not only the feasibility of implementation, but also data access, measurability, and long-term comparability. Performance-based contracts can align incentives by tying milestone payments to verified KPI improvements supported by agreed baselines, uncertainty bands, and counterfactual rules [
10,
11]. In PPP-type arrangements, contract schedules should specify KPI ownership, access rights, boundary-specific metering requirements, third-party audit rights, anonymized public KPI portals, and vendor-neutral APIs to preserve continuity across procurement cycles [
13,
31]. For OT-dependent systems, procurement should also preserve configuration histories, controller logs, and asset inventories needed for later verification and cybersecurity assurance [
50].
To remain in line with the verification logic of this paper, procurement documents should clearly distinguish between target KPIs, commissioning KPIs, and operational KPIs credited. This prevents projected benefits, such as expected energy savings or anticipated congestion relief, from being reported as achieved outcomes before evidence thresholds are met. It also ensures that KPI continuity survives vendor changes, software upgrades, and contracting cycles.
Table 14 summarizes the main risk domains and their corresponding mitigation measures in the Saudi context.
6.6. Policy Playbook for Measurable Scaling
A national policy playbook for measurable scaling should standardize four enabling pillars: transparency, procurement, capacity, and sequenced scaling. Transparency requires indicator catalogs aligned with international guidance, privacy-safe public KPI portals, reproducible methods, and version control. Procurement should enforce data portability, verification clauses, audit rights, and open interfaces. Capacity-building should include city data offices, utility–city coordination cells, and operator training for ASC, EMS, and DMA systems. Sequenced scaling should prioritize mechanisms that already have defensible baselines and feasible telemetry. In AI-enabled services, this scaling logic should also include formal model governance, trustworthiness evaluation, and structured documentation such as model cards [
52,
53].
Near-term actions include adaptive signal control on priority corridors, DMA pressure management supported by continuous telemetry, and targeted demand response in large metered buildings. Medium-term actions include retro-commissioning and continuous commissioning in public facilities, together with telematics-guided waste logistics. Longer-term orchestration includes DER and storage aggregation supported by standardized performance telemetry and participation in flexibility services under transparent market rules [
5,
13,
14,
31].
Table 15 links these actions to accountable entities, measurable KPIs, and indicative timelines.
Overall, the policy pathway proposed here is intentionally conservative: it prioritizes mechanisms that already possess measurable baselines, feasible telemetry, and clear governance ownership before scaling toward more complex multi-sector orchestration. This sequencing is consistent with the broader argument of the paper that credible smart-city progress in Saudi Arabia depends not only on ambitious digital deployment, but on auditable evidence, durable governance, and boundary-explicit measurement.
7. Challenges and Future Directions
Despite visible progress in deploying mechanism-oriented smart-city programs in Saudi Arabia, most notably adaptive signal control, building Energy Management Systems (EMSs)/Strategic Energy Management (SEM), and district-metered area (DMA)-based pressure management, several structural barriers still limit the transition from promising architectures to verifiable, comparable, and scalable impacts. These barriers do not invalidate the progress observed in the examined cases; instead, they explain why documented deployment maturity often advances faster than publicly auditable outcome evidence. In keeping with the verification-oriented perspective adopted throughout this paper, the main challenge is therefore not only to expand smart-city deployment, but also to strengthen the measurement conditions under which claimed benefits can be attributed, reproduced, and compared.
7.1. Persistent Challenges
7.1.1. Fragmented Reporting and Weak Comparability
Public reporting remains uneven across cities, sectors, and program boundaries. In many cases, targets are still presented alongside realized outcomes, while indicators are reported at incompatible levels of aggregation, such as national versus city scales or renewable electricity output versus renewables in final energy use. This heterogeneity complicates inference, weakens cross-city comparison, and may bias apparent impact magnitudes when denominators, baselines, or reporting windows are not harmonized [
10,
11,
26]. A related issue is that privacy-safe KPI portals with provenance metadata, versioned methods, and vendor-neutral interfaces are still not standard practice. Without portable schemas, explicit indicator definitions, and maintained change logs, longitudinal comparability becomes fragile and external replication remains difficult [
6,
13].
7.1.2. Operational Technology as Measurement Infrastructure
A second challenge concerns the increasing measurement role of operational technology (OT) systems. Adaptive signal control (ASC) controllers, Advanced Metering Infrastructure (AMI), Supervisory Control and Data Acquisition (SCADA) systems, and DMA telemetry no longer serve only operational functions; they also constitute the measurement backbone of smart-city evaluation. As a result, cyber-integrity, system availability, timestamp consistency, and configuration traceability become scientific preconditions for credible KPI estimation rather than routine IT concerns. Configuration drift, clock skew, patch delays, or undocumented firmware changes can directly undermine KPI credibility and compromise reproducibility [
8,
11,
50]. In a verification-oriented framework, the reliability of the measurement substrate is therefore inseparable from the reliability of the outcome claim itself.
7.1.3. Saudi Climatic, Infrastructural, and Surge-Related Constraints
Saudi operating conditions introduce further complexity. Cooling-dominated electricity demand, structural water scarcity, extreme heat, dust exposure, and seasonal or pilgrimage-related surges place additional stress on sensors, communications, and control logic, while also requiring season-aware and surge-aware parameterization of evaluation procedures, especially in Makkah and Madinah during Hajj and Umrah periods [
9,
13,
29]. These conditions make context-sensitive baselines indispensable for robust inference. In practice, this means that evaluations should distinguish ordinary from surge operations, apply matched-season comparisons, and document environmental filtering rules explicitly. Without such controls, apparent gains may reflect transient operating conditions rather than genuine mechanism-level improvements.
7.1.4. Equity, Fairness, and the Risk of Uneven Benefit Distribution
Another challenge is to ensure that smart-city systems do not reinforce existing spatial or social inequalities. Algorithmic services should therefore be governed by district-level accessibility audits, transparent reporting of eligibility and acceptance in demand response or tariff programs, and public model documentation that includes parity and error checks [
10,
14,
52,
53]. Although the international literature increasingly presents AI as an enabler of efficient and low-carbon urban development, planning claims should not be confused with demonstrated program-scale effects. In the present framework, AI-based designs and forecasts remain useful for hypothesis generation and operational planning, but impact credit is assigned only when auditable changes are observed in boundary-explicit indicators, such as delay, kWh m
−2, or NRW %, under matched counterfactuals [
14,
54]. This distinction is essential if efficiency gains are to be evaluated without obscuring questions of access, fairness, and differential service quality across districts or user groups.
7.1.5. Uneven Evidence Quality and Source Discipline
Finally, the quality of supporting evidence remains uneven across domains and sources. To support cumulative learning, outcome claims should rely primarily on peer-reviewed studies, audited reports, or official indicator series, while press releases, promotional documents, and encyclopedic pages should be labeled explicitly as context only. All entries should include DOIs or stable URLs together with access dates, and dataset references should specify the exact indicator code and series title, for example, WDI SP.URB.TOTL.IN.ZS or EG.ELC.RNEW.ZS, to avoid cross-domain or cross-level conflation [
13,
26,
30,
55]. This source discipline is especially important in a comparative review because weak or inconsistently documented evidence can create false equivalence across cases and inflate the apparent robustness of the overall synthesis.
7.2. Limitations of the Present Synthesis
This synthesis is verification-anchored, but it remains constrained by three main limitations. First, audited and program-scale KPI time series are still scarce, particularly outside mobility and selected utility applications. Second, baseline construction, spatial boundaries, and denominator choices remain heterogeneous across cities and sectors, which weakens direct comparability even when the same general mechanism is present. Third, several giga-projects and master-planned developments remain at an early implementation stage, meaning that design documentation and stated ambitions still dominate the public record. In accordance with the protocol proposed in this paper, only verified effects with are credited, while target-only statements are treated as non-outcome evidence.
A second limitation concerns causal identification. Several findings rely on matched pre/post comparisons and engineering counterfactuals; where exogenous shocks or concurrent policy changes occur, such as tariff reforms, unusual weather, construction works, or special events, residual confounding may persist. Measurement error can also propagate from OT systems when clocks are unsynchronized, sensors drift, or firmware is updated without corresponding documentation in change logs. Such issues widen uncertainty bounds and may overstate or understate readiness–impact movement even when the qualitative direction of effect remains plausible.
A third limitation lies in uneven evidence availability across domains. Mobility programs more often expose dashboards and operational traces, whereas water and building datasets are frequently siloed by contractual, institutional, or privacy constraints. This asymmetry may create survivorship bias, because programs with stronger telemetry are more likely to appear in the evidence base, and publication bias, because positive cases are often more visible than null or mixed results. Governance indicators, such as open-data uptime, time-to-publish, and metadata completeness, are also still emerging, which complicates longitudinal assessment of institutional maturity.
7.3. Future Directions for Verification-Ready Smart-City Evaluation
To address these limitations, several future directions are recommended.
- (1)
Verification-ready data governance.
Data governance should be strengthened through privacy-safe KPI portals that publish provenance metadata, versioned methods, and reproducible extracts at explicit program boundaries such as corridors, DMAs, and buildings. These portals should prioritize aggregated, verification-ready indicators over raw sensitive records, while still preserving sufficient methodological detail for independent replication.
- (2)
Procurement and PPP reform for evidence continuity.
Procurement and PPP templates should standardize vendor-neutral schemas, independent audit rights, and retention of controller logs, meter records, and configuration snapshots so that results remain verifiable over time. Contracts should also distinguish clearly between target KPIs, commissioning KPIs, and credited operational KPIs, thereby preventing projected benefits from being reported as achieved outcomes before evidence thresholds are met.
- (3)
Pre-registered evaluation designs and replication packages.
Major deployments should adopt pre-registered evaluation designs and publish replication packages, including code, parameter files, methods notes, and anonymized aggregates, to enable third-party reproduction and stress testing. Even where full open-data release is not feasible, structured replication metadata would substantially improve credibility and cumulative learning.
- (4)
Systematic uncertainty reporting.
Uncertainty should be reported through common protocols, including bootstrap or block-bootstrap confidence intervals for time series ratios, sensitivity tests for baseline windows, and leave-one-segment-out or leave-one-building-out diagnostics where relevant. This is particularly important in settings where denominator choices or environmental covariates can materially affect apparent impact magnitudes.
- (5)
Method-matched external benchmarking.
Method-matched international benchmarking should be expanded carefully by comparing each mechanism against cities with similar KPI definitions, baselines, and operating constraints. Such benchmarking should be used only to bound plausible performance ranges, not to substitute for Saudi evidence. Gulf peers are especially relevant for climate and water-stress comparability, whereas benchmark cities such as Singapore or Barcelona may be useful only where measurement rules and intervention logic are sufficiently aligned.
- (6)
Equity, resilience, and AI governance as core evaluation dimensions.
Future work should integrate equity and resilience more explicitly in smart-city evaluation. District-level accessibility audits, parity and error checks for algorithmic services, and surge/non-surge parameterization for Makkah and Madinah would help ensure that efficiency gains do not come at the cost of spatial or social disparities. Likewise, cybersecurity baselines and AI model governance tools, including model cards, drift monitoring, and attribution testing, should be treated as scientific preconditions for reliable measurement rather than as post hoc assurances.
7.4. From Plan-Level Ambition to Verifiable Urban Impact
In general, the main future challenge for Saudi smart-city development is not the absence of ambition, but the need to convert digitally enabled programs into auditable and transferable evidence of urban benefit. This requires stronger data governance, better procurement discipline, more explicit uncertainty reporting, and a broader evaluation culture that treats comparability, fairness, and resilience as integral components of smart-city maturity. If implemented, these steps would narrow uncertainty intervals, improve comparability across cities and programs, and accelerate the transition from plan-level ambition to verifiable and scalable impacts aligned with the SDGs.
8. Conclusions
This paper examined Saudi Arabia’s smart-city trajectory through a verification-oriented lens that shifts attention from technological ambition alone to boundary-explicit, reproducible, and policy-relevant outcomes. Rather than treating smart cities as a collection of digital projects or aspirational narratives, the study framed them as integrated socio-technical systems whose performance must be assessed through explicit mechanisms, defensible baselines, and publicly interpretable indicators. Based on this perspective, the paper developed a methodology that harmonizes indicators across administrative levels and sectors, separates targets from achieved results, and grades evidence according to public verifiability.
Applied to the Saudi cases examined in this study, namely Riyadh, Jeddah, Makkah, Madinah, KAEC, and NEOM, this approach shows that the strongest current evidence does not lie in broad citywide claims, but in more clearly bounded program-scale mechanisms. The most credible evidence emerges where governance mandates are clear, telemetry is reliable, and KPI pipelines are supported by explicit methods and transparent data provenance. In this respect, corridor-level adaptive signal control, degree-day-normalized building EMS/SEM, and district-metered water-management programs illustrate the types of interventions most suited to verification-ready scaling. By contrast, cases dominated by strategic plans, design narratives, or projected benefits remain important for understanding ambition and institutional direction, but they cannot yet be interpreted as equivalent to demonstrated urban outcomes.
A central contribution of the paper is therefore the readiness–impact assessment framework, which provides a structured way to distinguish deployment maturity from verified performance. The framework is not intended as a ranking device, but as a decision-support approach for identifying where Saudi smart-city programs are already evidence-ready, where they remain readiness-rich but impact-light, and what institutional or data conditions must be strengthened before stronger claims can be made. In parallel, the policy playbook translates this framework into operational priorities, including privacy-safe KPI observatories, vendor-neutral interfaces, data-portability requirements, verification clauses in procurement, and capacity building for operators and city data offices.
The Saudi case also helps qualify the broader critique that smart cities are often overly techno-centric. The evidence reviewed in this paper partly confirms this concern, since several initiatives are still documented mainly through planning ambition, digital architecture, and deployment narratives rather than through publicly auditable sustainability outcomes. At the same time, the Saudi experience suggests a distinctive pathway in which digital planning can contribute meaningfully to sustainability when it is coupled with governance capacity, sector-specific mechanisms, transparent KPIs, and baseline-defined evidence. The key issue is therefore not the presence of smart-city technologies alone, but whether these technologies produce verifiable improvements in energy use, mobility, water management, resilience, and service quality. From this perspective, the Saudi smart-city agenda can be interpreted as a transition from techno-centric ambition toward evidence-based urban sustainability.
The analysis also shows that Saudi-specific operating conditions must be treated as integral to smart-city evaluation rather than as background context alone. Cooling-dominated electricity demand, structural water scarcity, extreme heat and dust, and recurring Hajj/Umrah surges directly affect both the plausibility of impacts and the design of credible evaluation protocols. As a result, season-matched baselines, surge/non-surge operating modes, hardened field instrumentation, and fairness-sensitive service review are not optional refinements, but preconditions for valid inference and equitable smart-city governance.
Looking forward, three priorities emerge for verification-aligned scaling. First, publicly funded smart-city programs should adopt privacy-safe, provenance-rich KPI reporting as standard practice. Second, method-matched evaluation designs, such as corridor-, building-, or DMA-level counterfactual comparisons, should become the default basis for impact claims. Third, AI-enabled operations should be governed through explicit documentation, model monitoring, and attribution safeguards so that predictive capability is not confused with verified service improvement. If these disciplines are institutionalized alongside continued investment in digital infrastructure and human capacity, Saudi cities will be better positioned to convert smart-city ambition into verifiable, comparable, and scalable sustainability outcomes aligned with Vision 2030. More broadly, the framework proposed in this paper offers a transferable template for jurisdictions seeking to move from smart-city rhetoric toward measurable improvements in service quality, resilience, and environmental performance.