A Co-Created Framework to Define Digital Twinning Use Cases for Urban Transport Decarbonisation
 , , , ,
  and
and
Abstract
1. Introduction
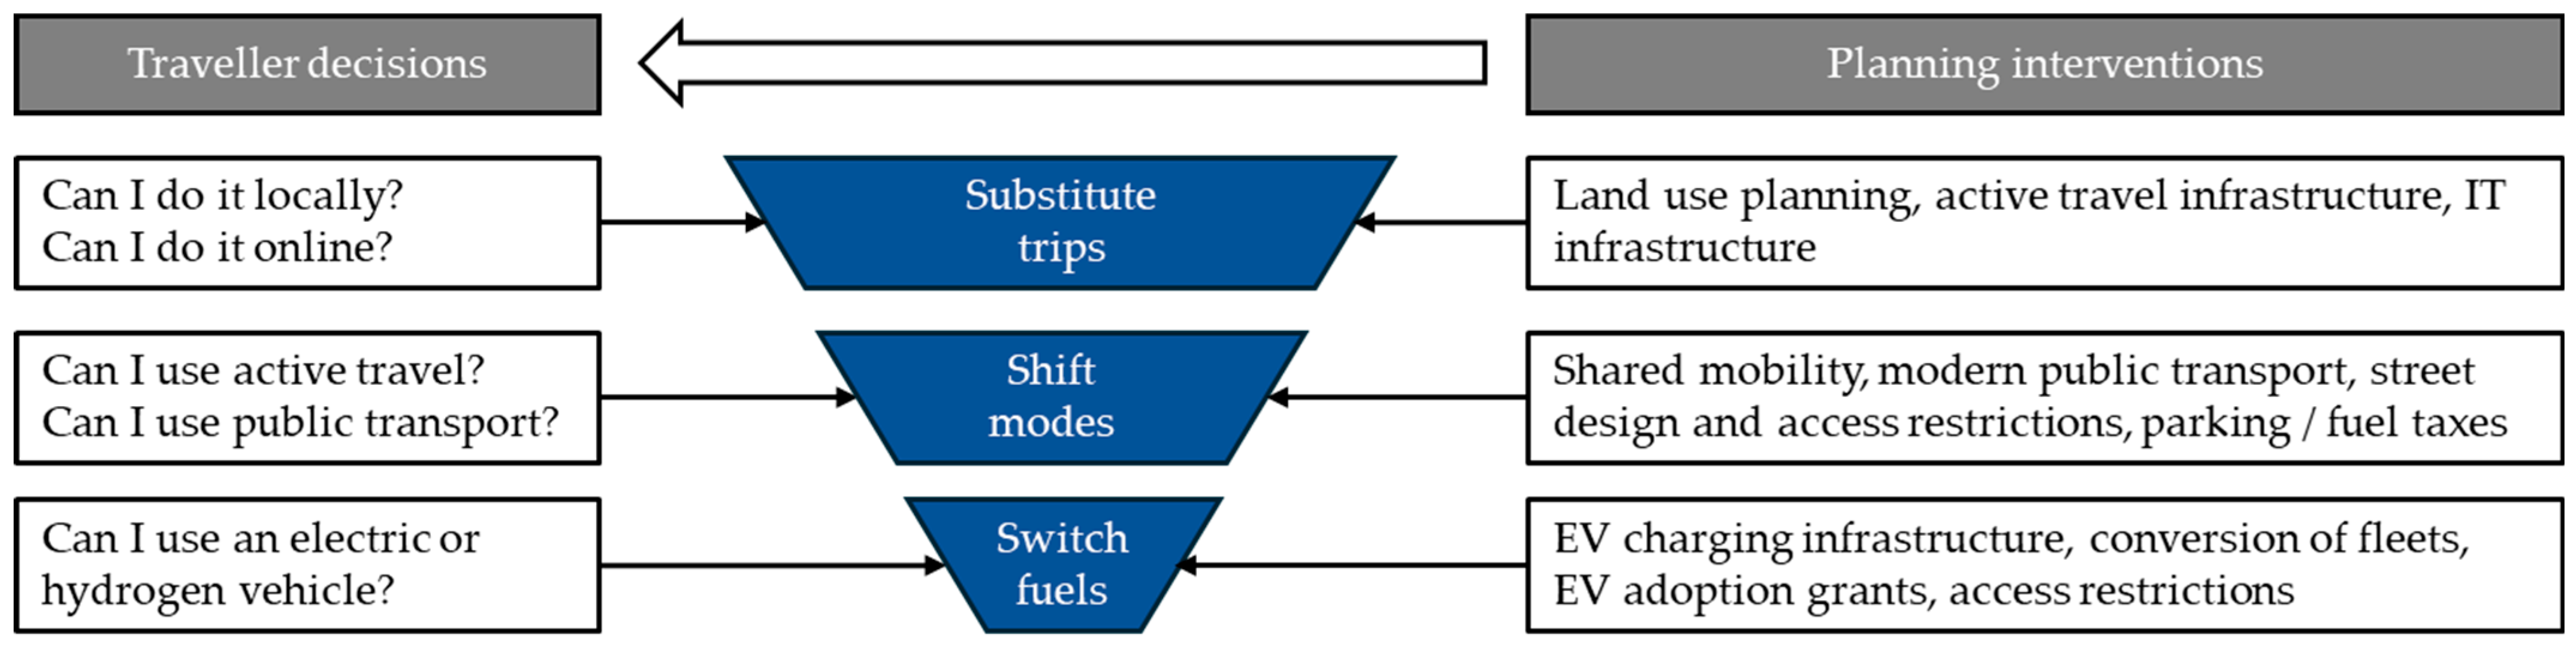
1.1. Urban Transport Decarbonisation
1.2. Smart Cities
1.3. Urban Digital Twinning
1.4. Context of This Research
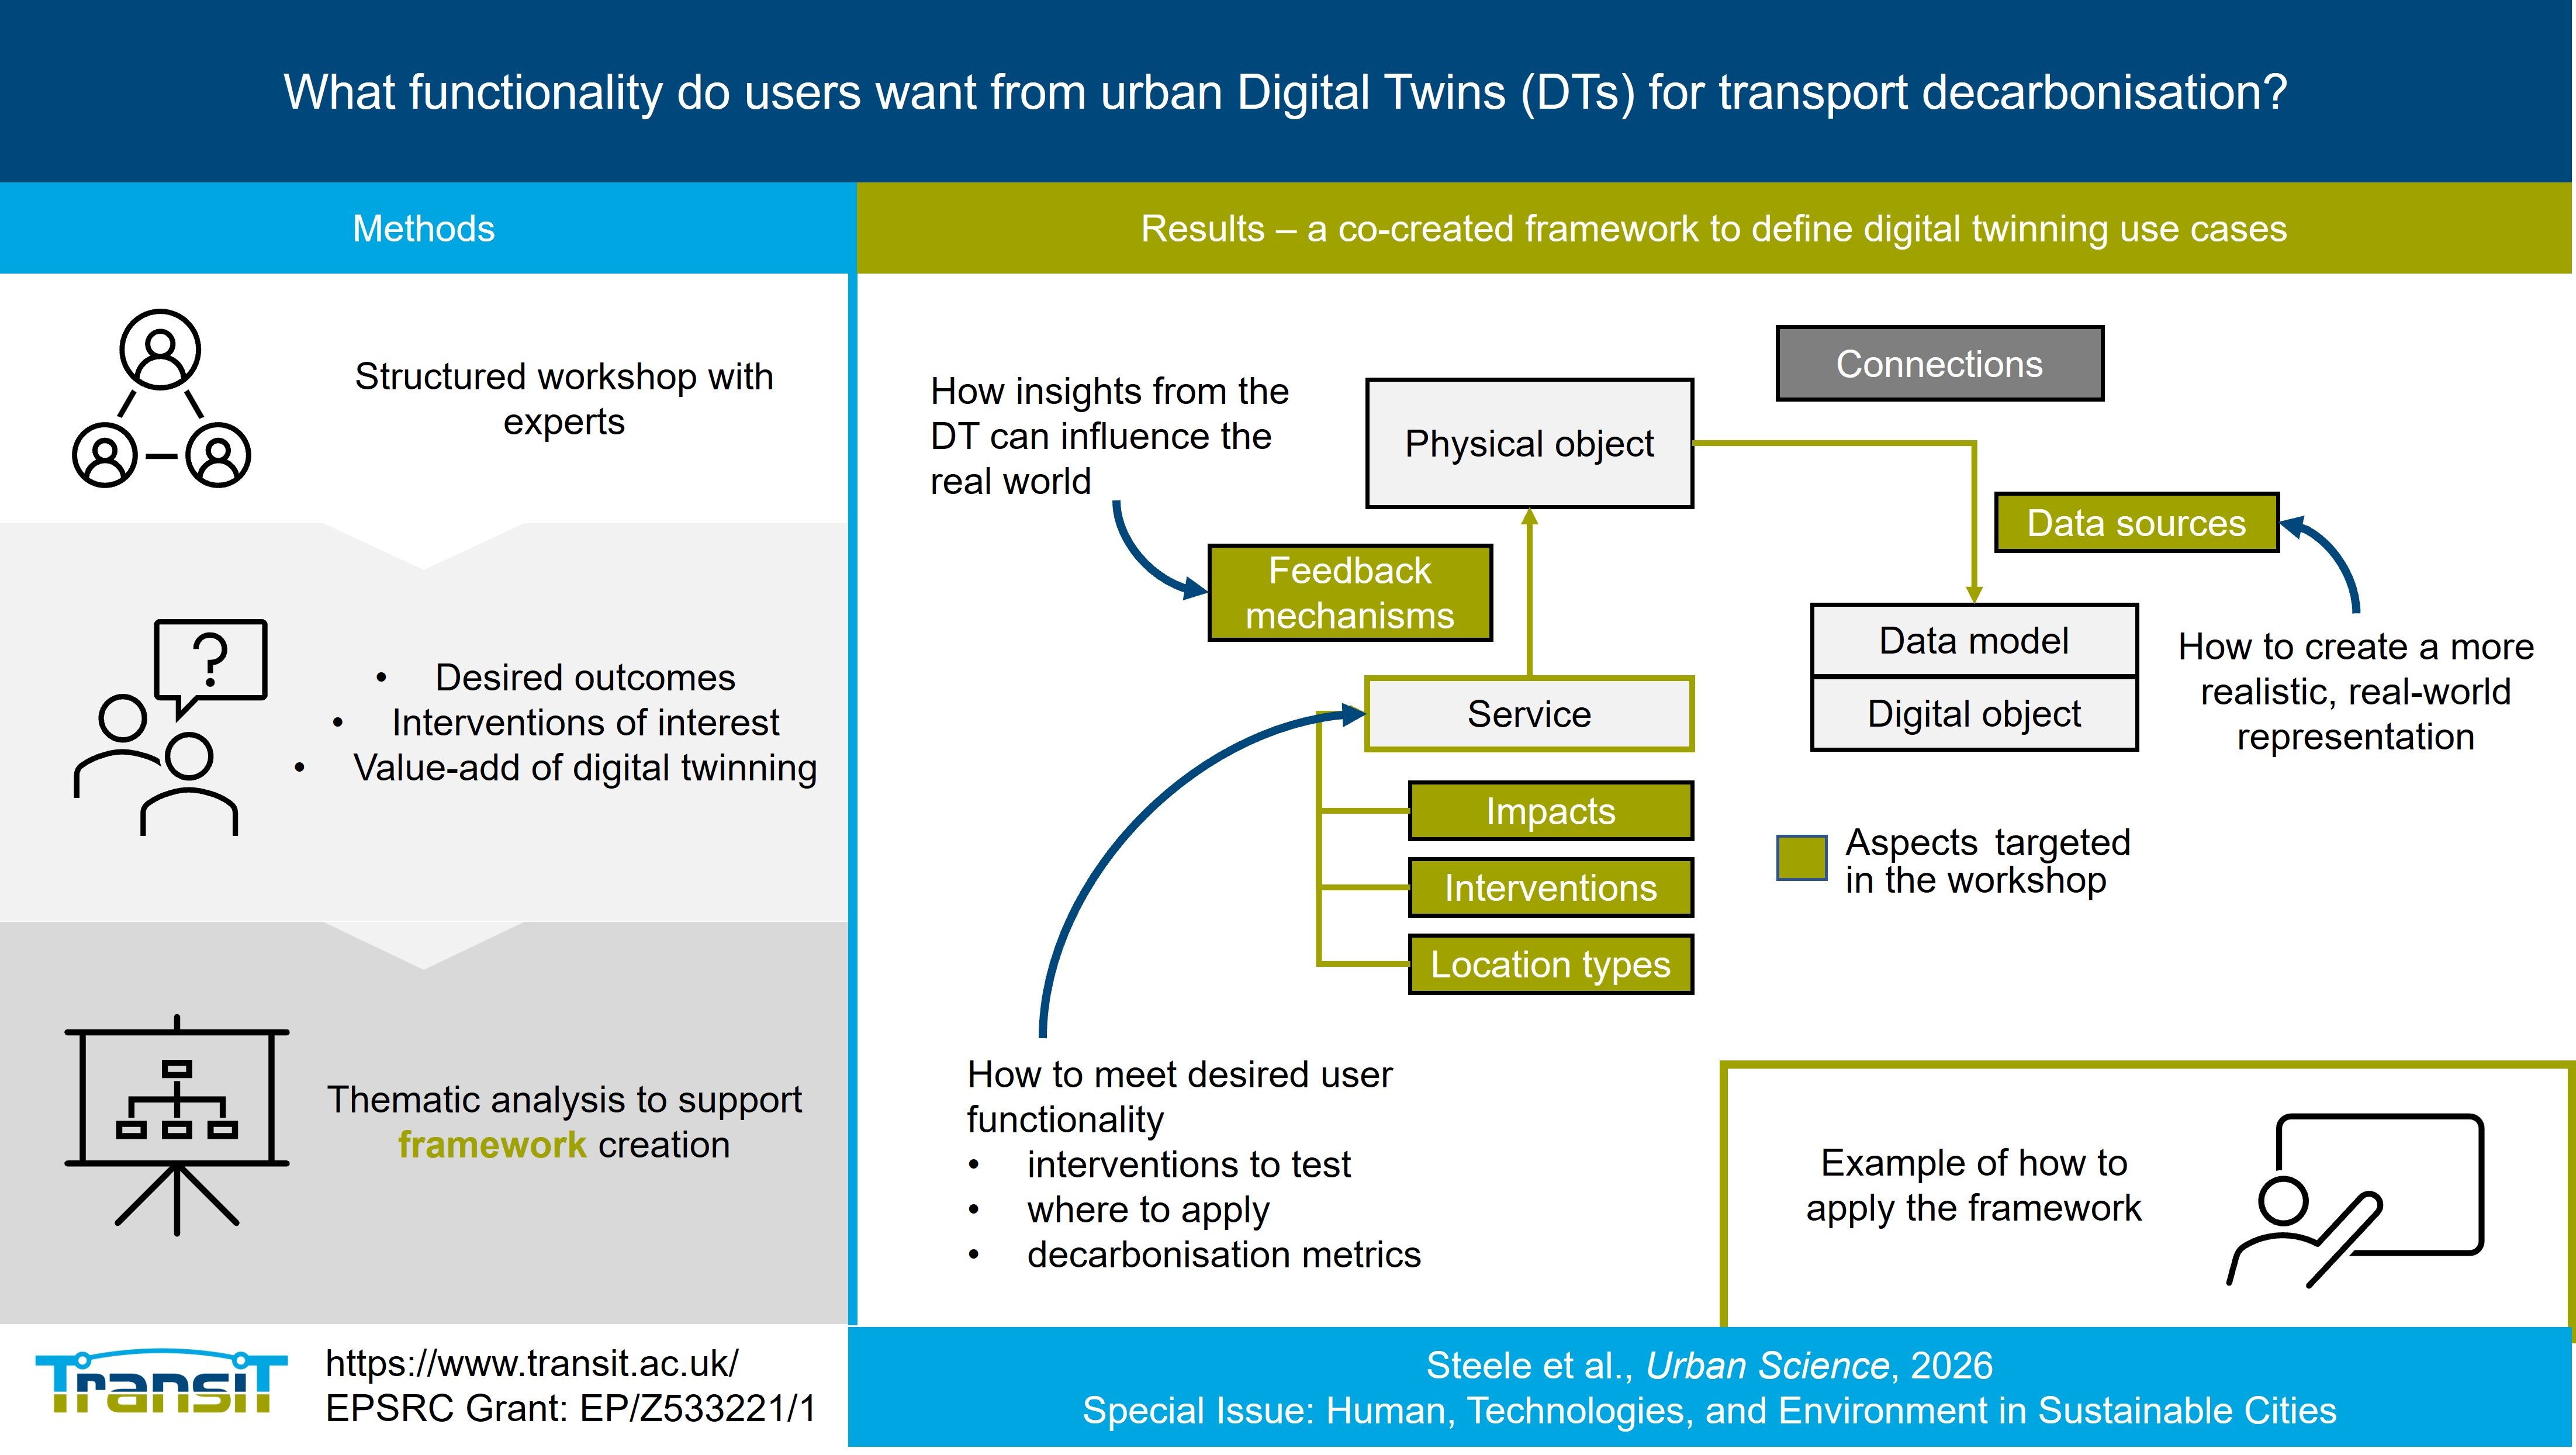
- From the perspective of practitioners, which impacts, interventions and location types are of priority concern for transport decarbonisation?
- Which data sources and feedback mechanisms do practitioners see as the “value-adding” contributions of digital twins?
- How can these aspects be combined into a framework for defining digital twinning use cases?
1.5. Overview of Paper Structure and Contributions
- Summarises from a practitioner perspective the impacts, interventions and location types of priority concern for transport decarbonisation
- Provides context regarding the limitations of existing transport models that digital twinning should aim to overcome.
- Captures the data sources and feedback mechanisms that practitioners see as the value-adding contributions of digital twins.
- Brings together the five aspects (highlighted in bold above) as a framework to support the definition of digital twinning use cases for urban transport decarbonisation.
- Illustrates application of the framework through an example related to urban transport decarbonisation in the West Midlands, UK.
2. Methodology
2.1. Framework Development
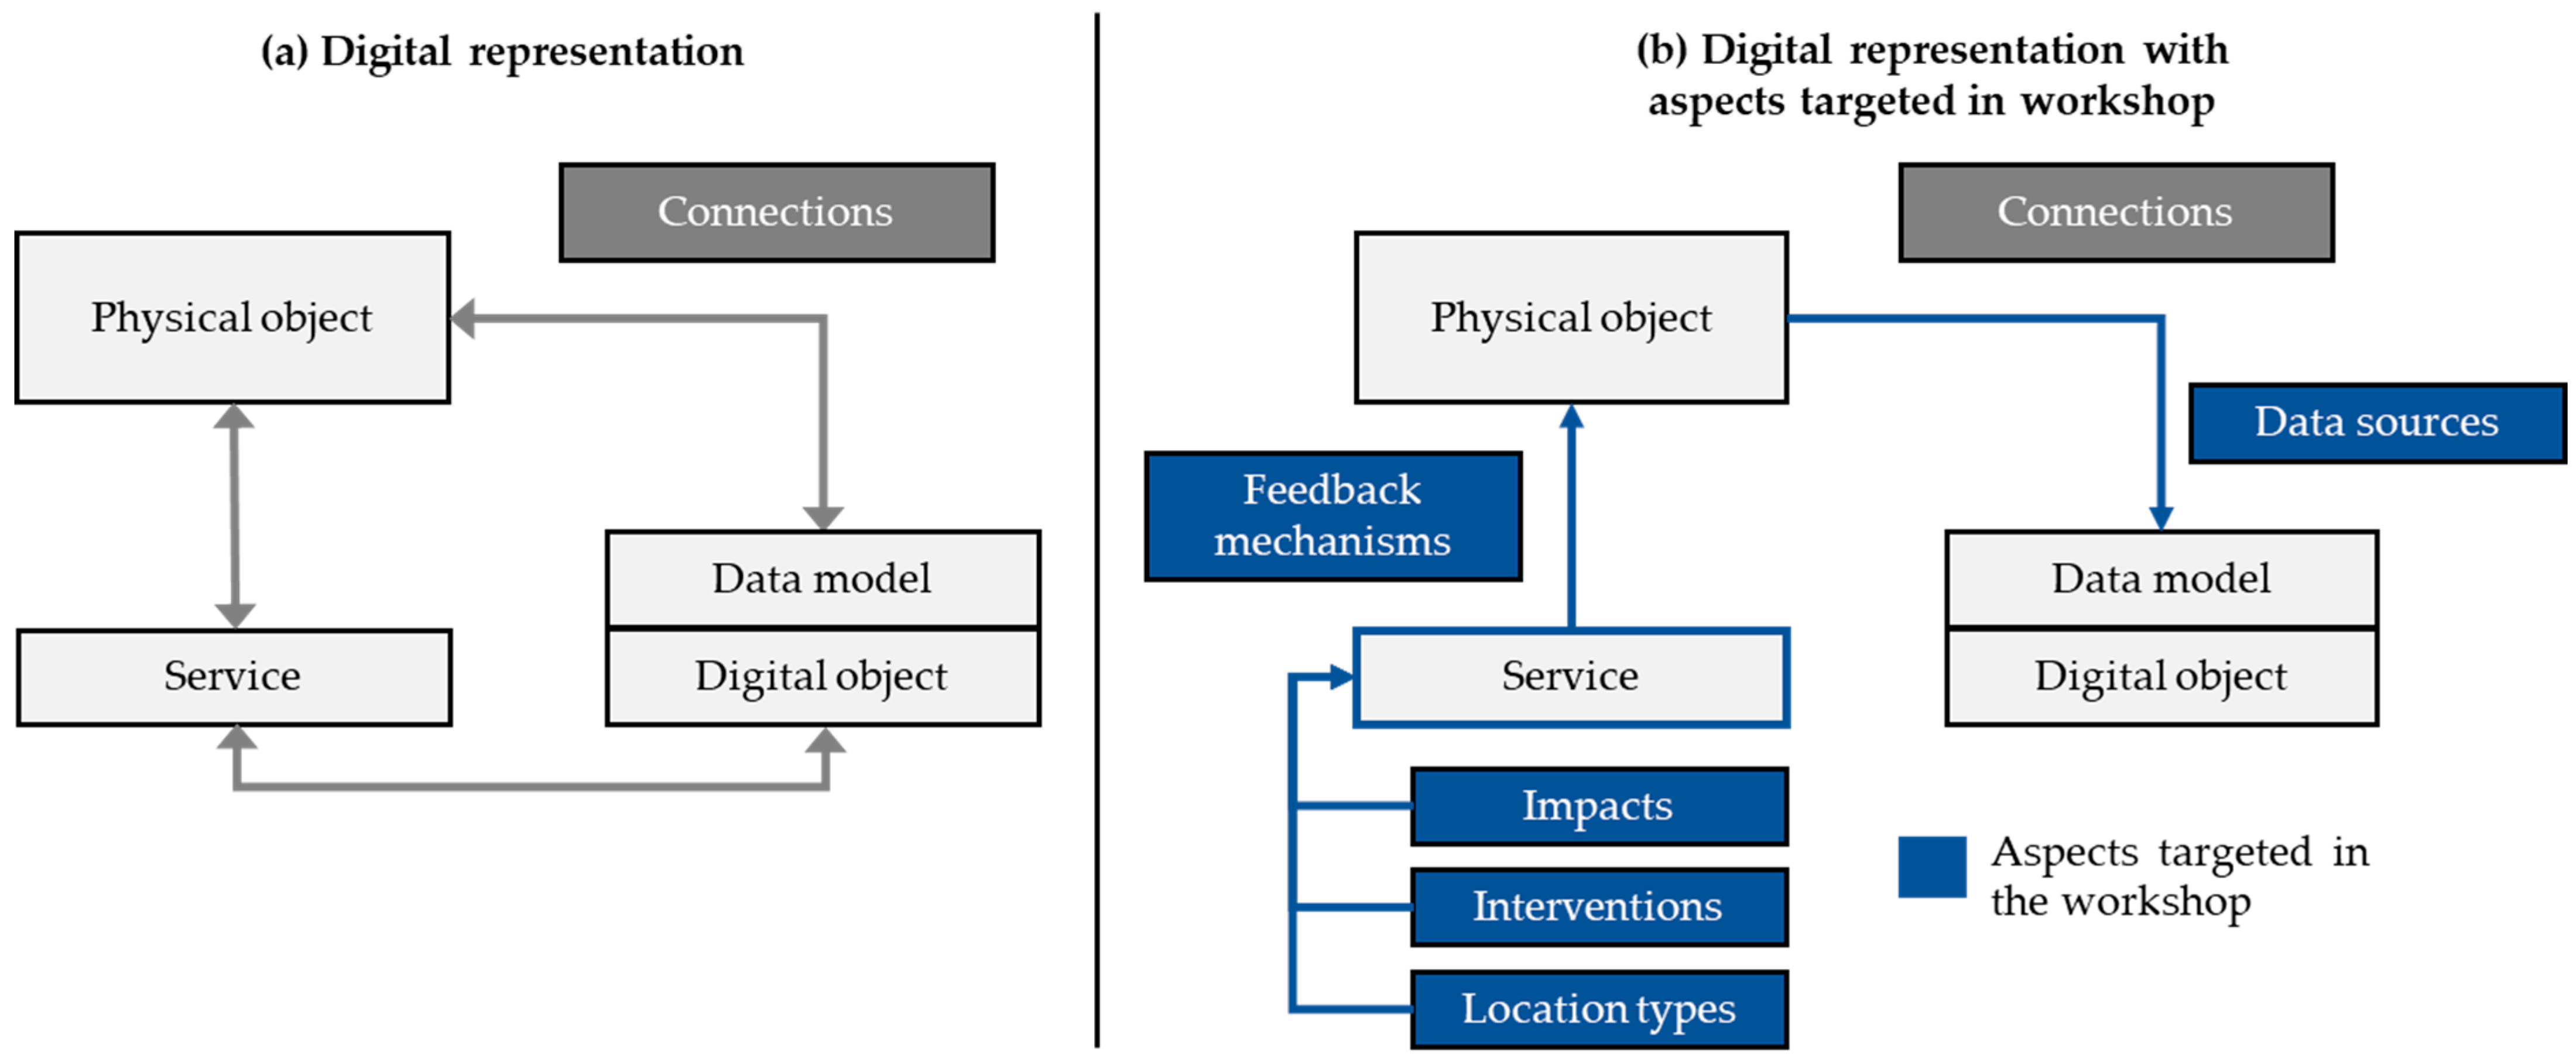
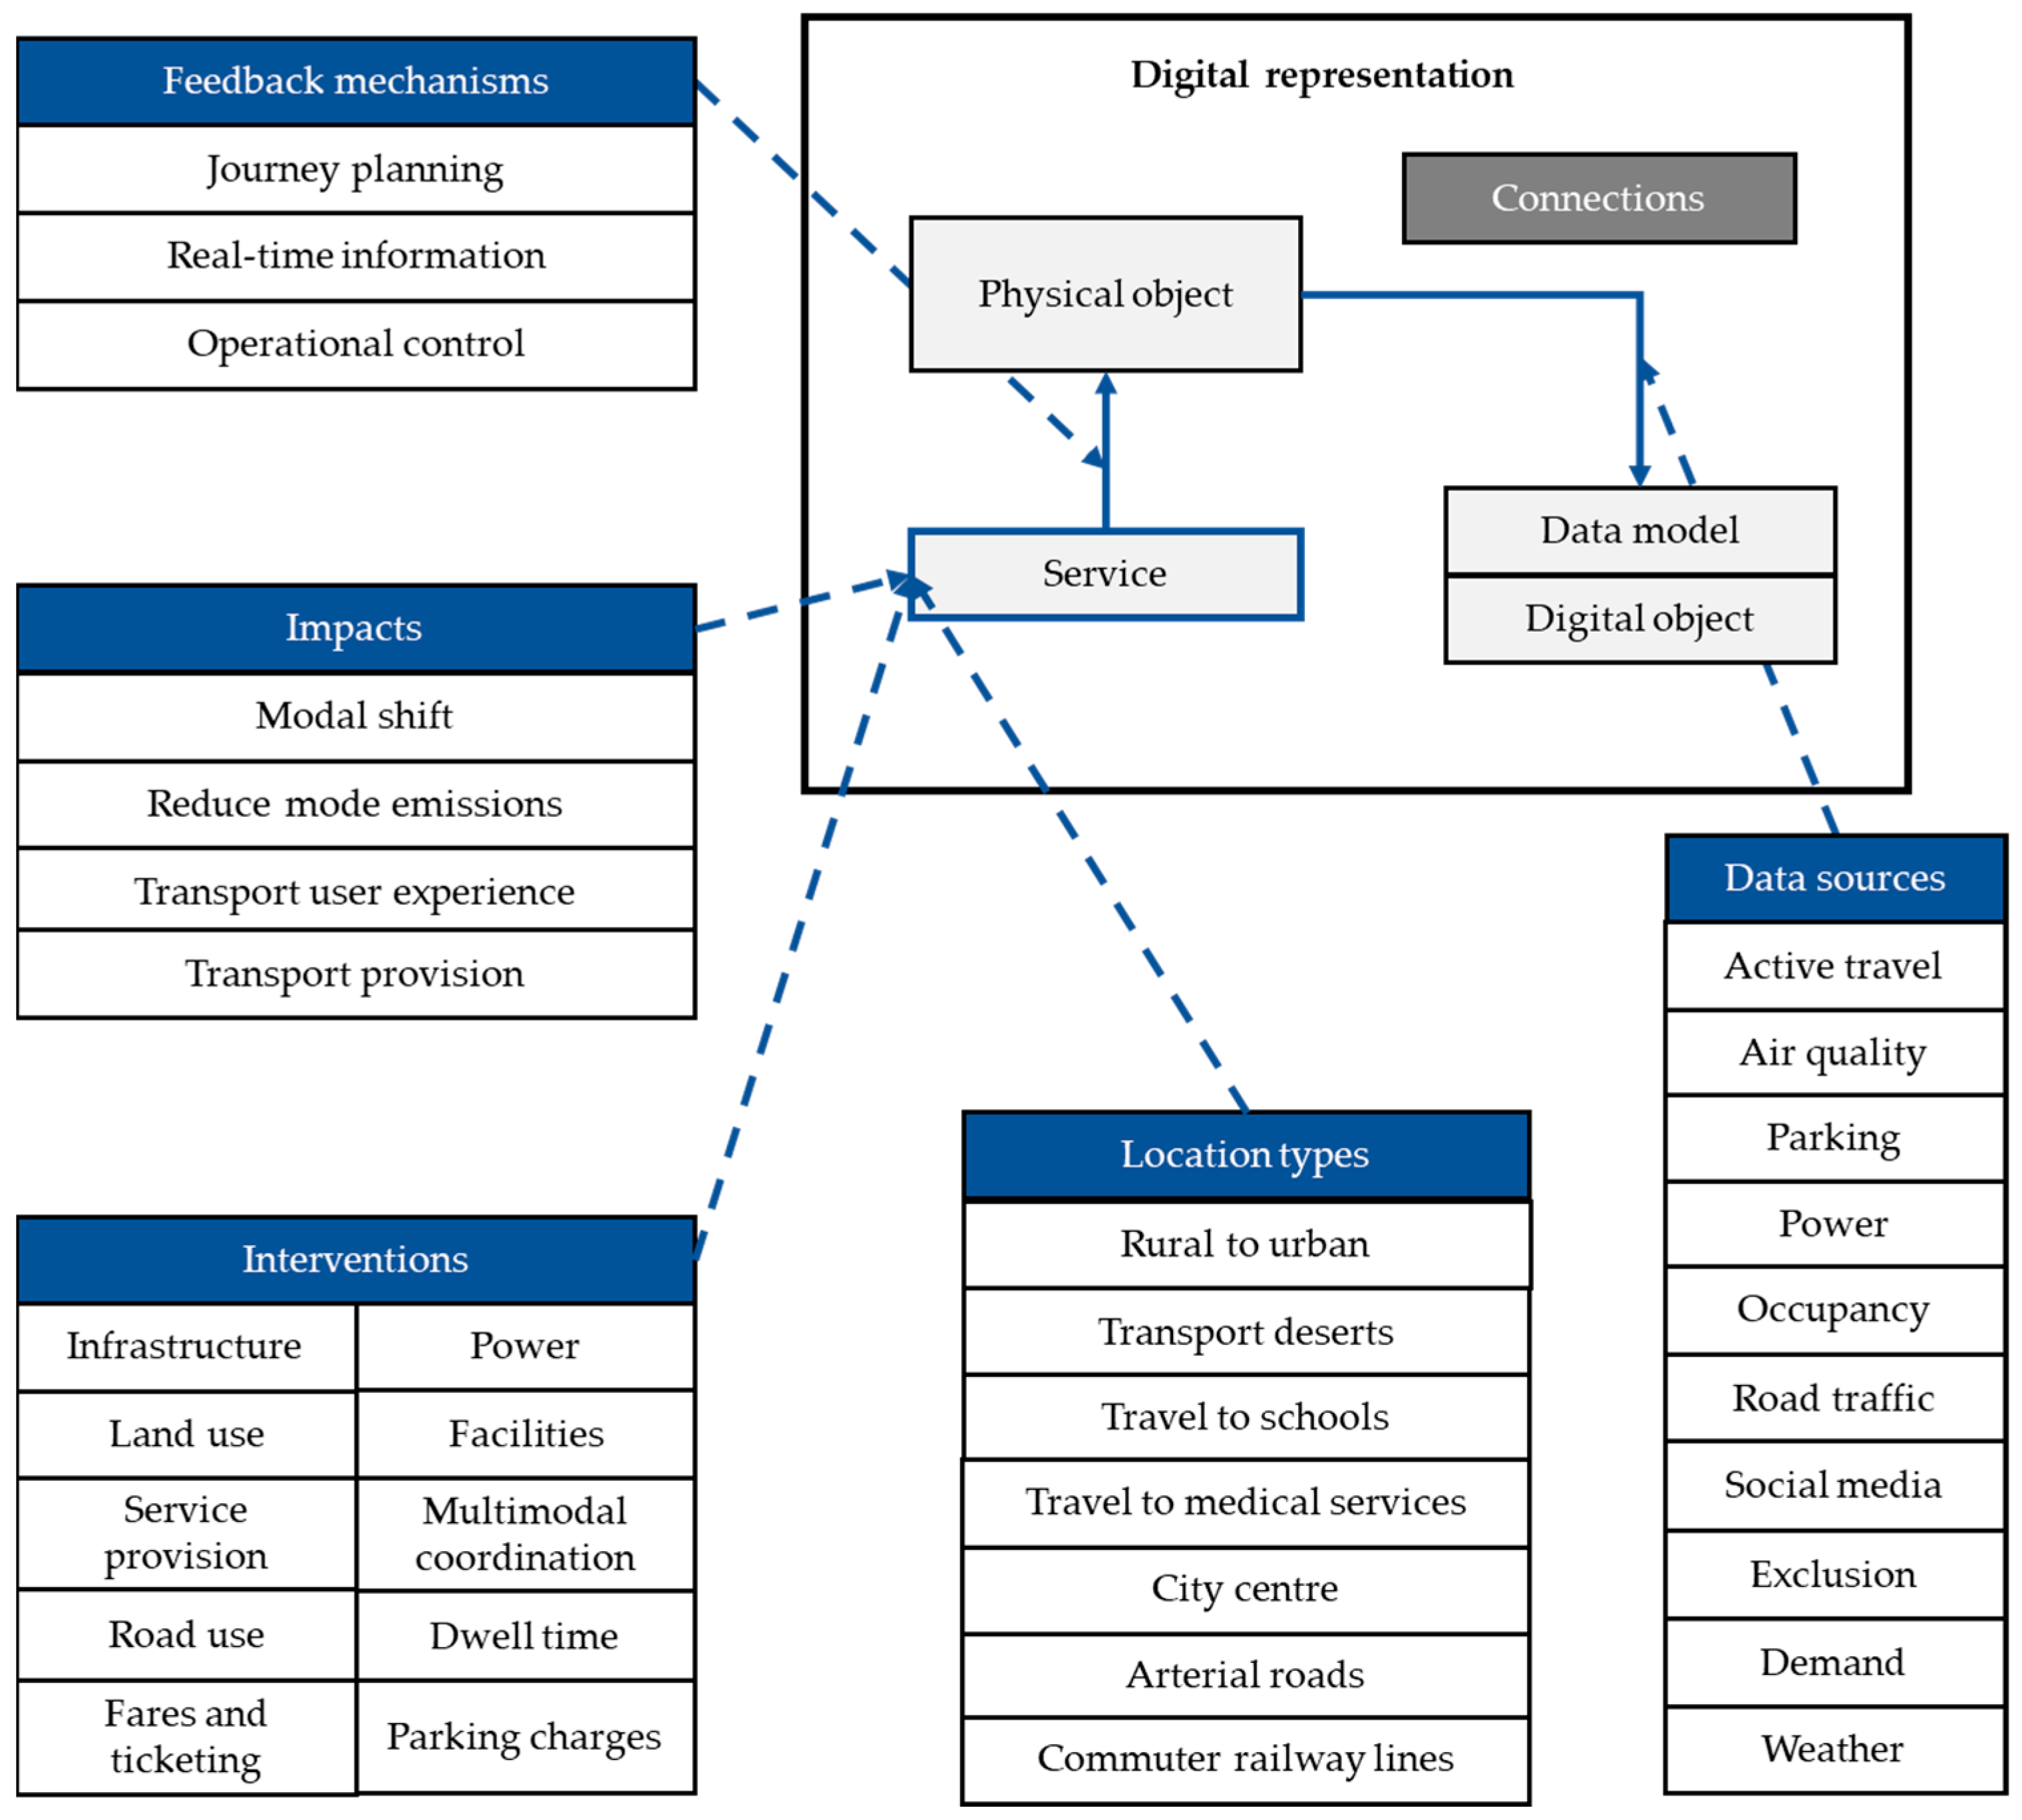
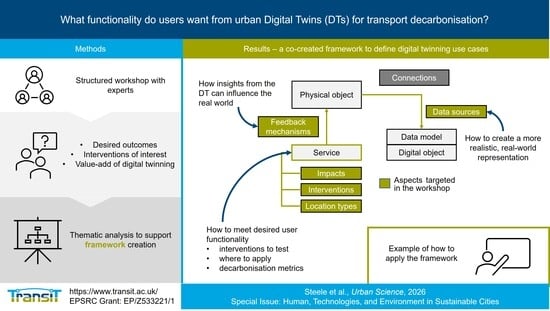
- Impacts, interventions and location types correspond to the service component, which provides a means for user interaction. In scenario modelling, users specify the interventions and locations to be modelled and assess the impacts with respect to a range of metrics.
- Data sources correspond to the link from the physical object to the data model and digital representation. As per the NDTP, real-time inputs help accurately represent the environment.
- Feedback mechanisms correspond to the link between the service component and physical object, indicating how the insights derived from the digital representation can impact the real-world state of the transport system, which in turn will update the digital representation. As per the NDTP, this creates the ability to output to infrastructure in that environment.
2.2. Workshop Purpose
2.3. Workshop Procedure and Data Collection
- How do you identify the problems to address today?
- What added value do you want to see over existing methods?
- What interventions are you most interested in?
- What dynamic/time-dependent data can we add to our models?
- Where could we add closed feedback between the physical and digital assets?
- Are there any interventions for which we could compare traditional and digital twinning (TransiT) methods?
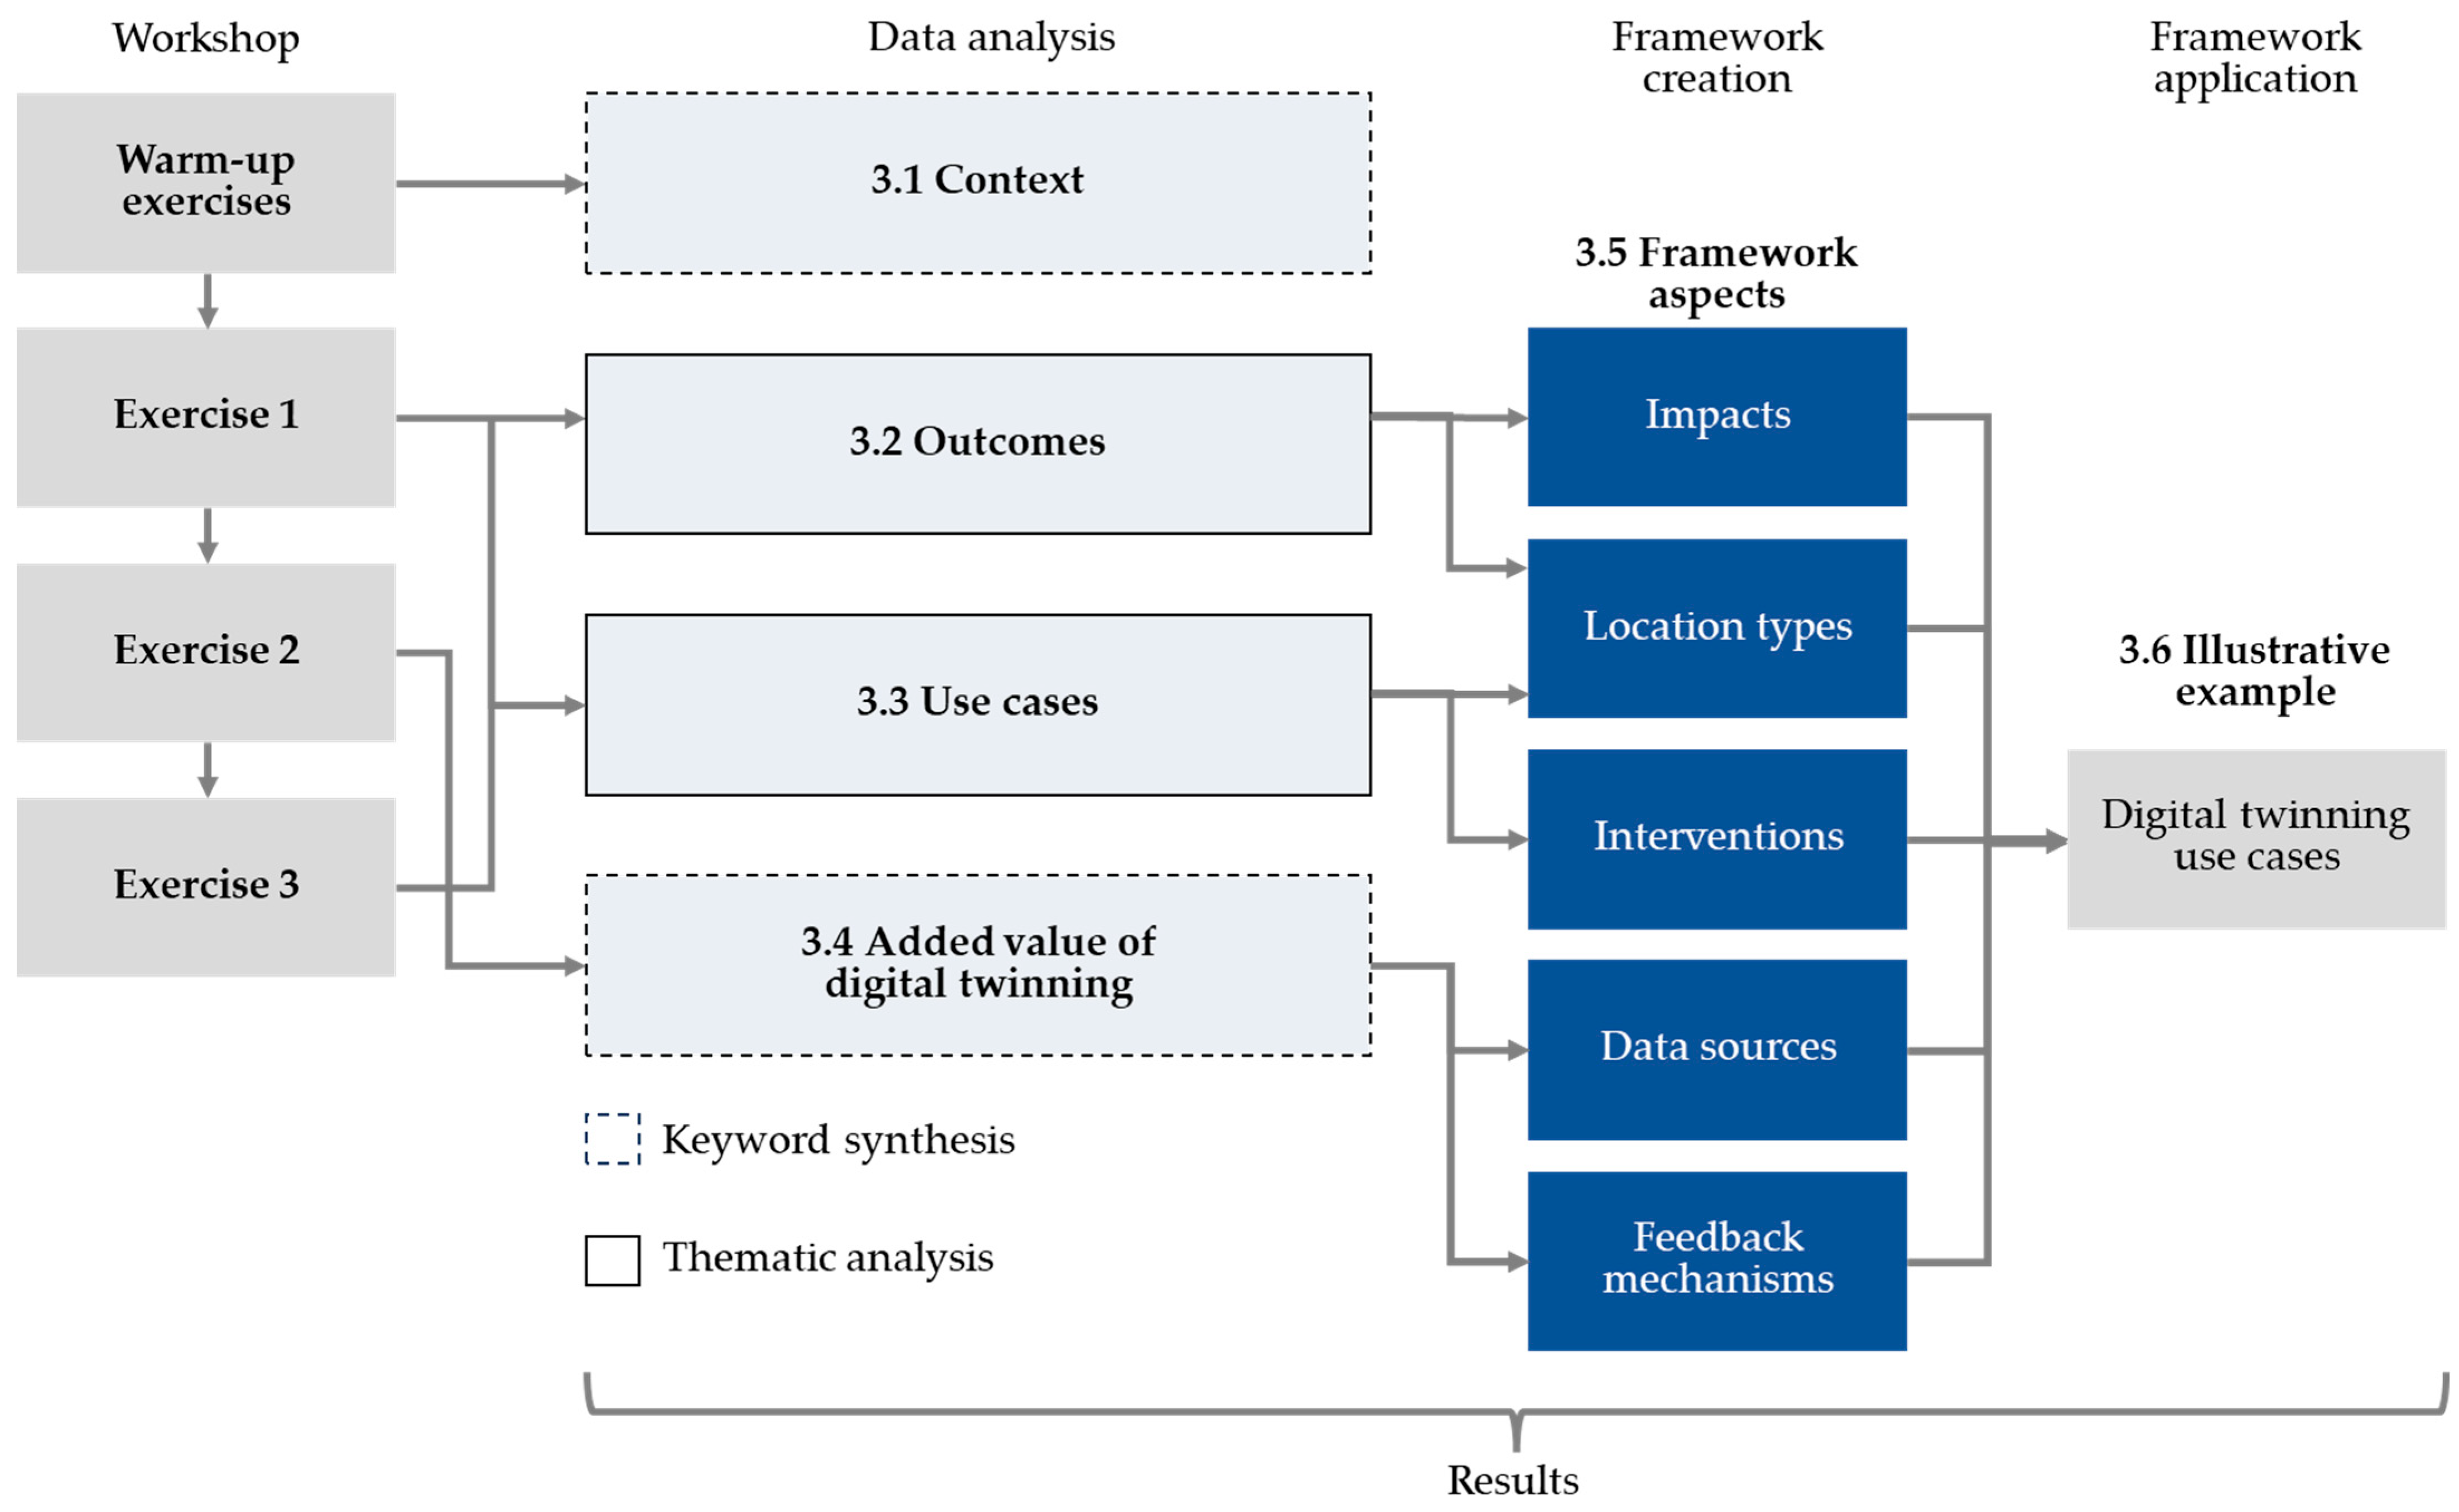
2.4. Data Analysis
3. Results
3.1. Context
3.1.1. How Transport Issues Are Currently Identified
- Passenger feedback: Qualitative and quantitative feedback from transport user groups is important to understand the services users want and likely behavioural change. This can be captured through focus groups, surveys, and real-time walk-throughs of a journey.
- Stakeholder feedback: Other transport stakeholders can help elucidate problems, including infrastructure providers, operators, drivers, and maintainers. Stakeholders, including politicians, can provide input on the feasibility of proposed solutions, including but not limited to operational, financial and political feasibility.
- Literature and project review: Published research from academia and industry can provide insight into problems. This includes parallel projects in other sectors, e.g., freight and model or tool development internally and externally.
- Analysis of real-world data: Quantitative insights can be driven by real-world data on the current and historic state of transport, such as journey times, delays, reliability, incidents and failures, passenger numbers, mode split, car usage, emissions, safety, etc. Understanding where emissions originate in terms of trip distance, purpose and mode is important to identify areas with the greatest potential to shift or reduce car use. Demographic and economic data can also be used to infer changes in travel demand and behaviours. Data may be taken from open feeds or from an organisation’s or stakeholder’s own records or sensors. Data from trials, e.g., of pricing changes, is useful for determining the effect of interventions and whether this matches models.
3.1.2. Added Value Desired over Existing Methods
- Ability to conduct multimodal what-if analysis: Attendees want to be able to optioneer and test an intervention or multiple interventions, before real-world application, and be able to gauge the wider impacts across transport modes. This includes interactions between passenger and freight transportation, for example, recognising that the pseudo-randomness of freight demand is difficult to represent in conventional models. Analysis of spatial and place-based differences, e.g., urban vs. rural, is essential.
- Ability to generate real-time insights: Attendees want to be able to draw insights from near real-time data (e.g., delays, reliability, capacity, occupancy) to predict demand forecasts and inform operational and contingency planning. However, due to the complexities of incorporating real-time data, careful consideration should be given to understanding where it can truly add value.
- Inclusion of realistic passenger behaviour: Attendees want the interventions tested to have real-world applicability by considering passengers’ needs and behaviours, e.g., trip chaining within and between modes, perceived barriers to using PT and active travel. It is important to validate whether perspectives match reality and the potential impact this has on solution acceptance.
- Improved tool quality and robust data: Attendees want a tool that is user-friendly with easy-to-understand reports, and for intervention scenarios to be quick to produce and run. Reporting of potential impacts should reflect real-world key performance indicators. Any tools should make existing data, including historical data, easier to understand and use, e.g., provide higher resolution and demonstrate robustness in data about mobility and emissions. Data that is not currently being considered, such as asset information and supply side issues (e.g., for the railway—unavailability of rolling stock, staff, spare parts for maintenance), could be incorporated.
3.1.3. Transport Decarbonisation Interventions of Interest
- Pricing: To both incentivise PT use and penalise car use: free or low-cost PT, integrated ticketing or ticket pricing reform, congestion charges, parking and pricing controls, and the introduction of individual carbon credits.
- Road space reallocation: To make space for active travel routes or create low-traffic neighbourhoods. For the latter, understanding disruption to traffic and whether this increases the overall car kilometres travelled.
- Meeting demand with public transport: Reopening local rail stations or opening new lines, running new routes, improving connectivity between PT modes, increasing service frequencies, offering services that reflect how people travel, e.g., trip chaining, meeting “accessibility desires”, e.g., no more than 10 minutes’ walk away from a PT stop or station.
- Public transport user experience: Improving PT reliability and information provision to customers, considering realistic operational simulation and what happens under disruption, e.g., short-term roadworks, rail closures, and meeting accessibility needs (step-free access, space for wheelchairs, pushchairs, and luggage). Considering not just passengers but also other people in the transport system, such as drivers and operators.
- Electrification: Electrification of public and private vehicles and the impact of electric vehicle-charging requirements on the grid in areas with high transport use.
3.2. Outcomes
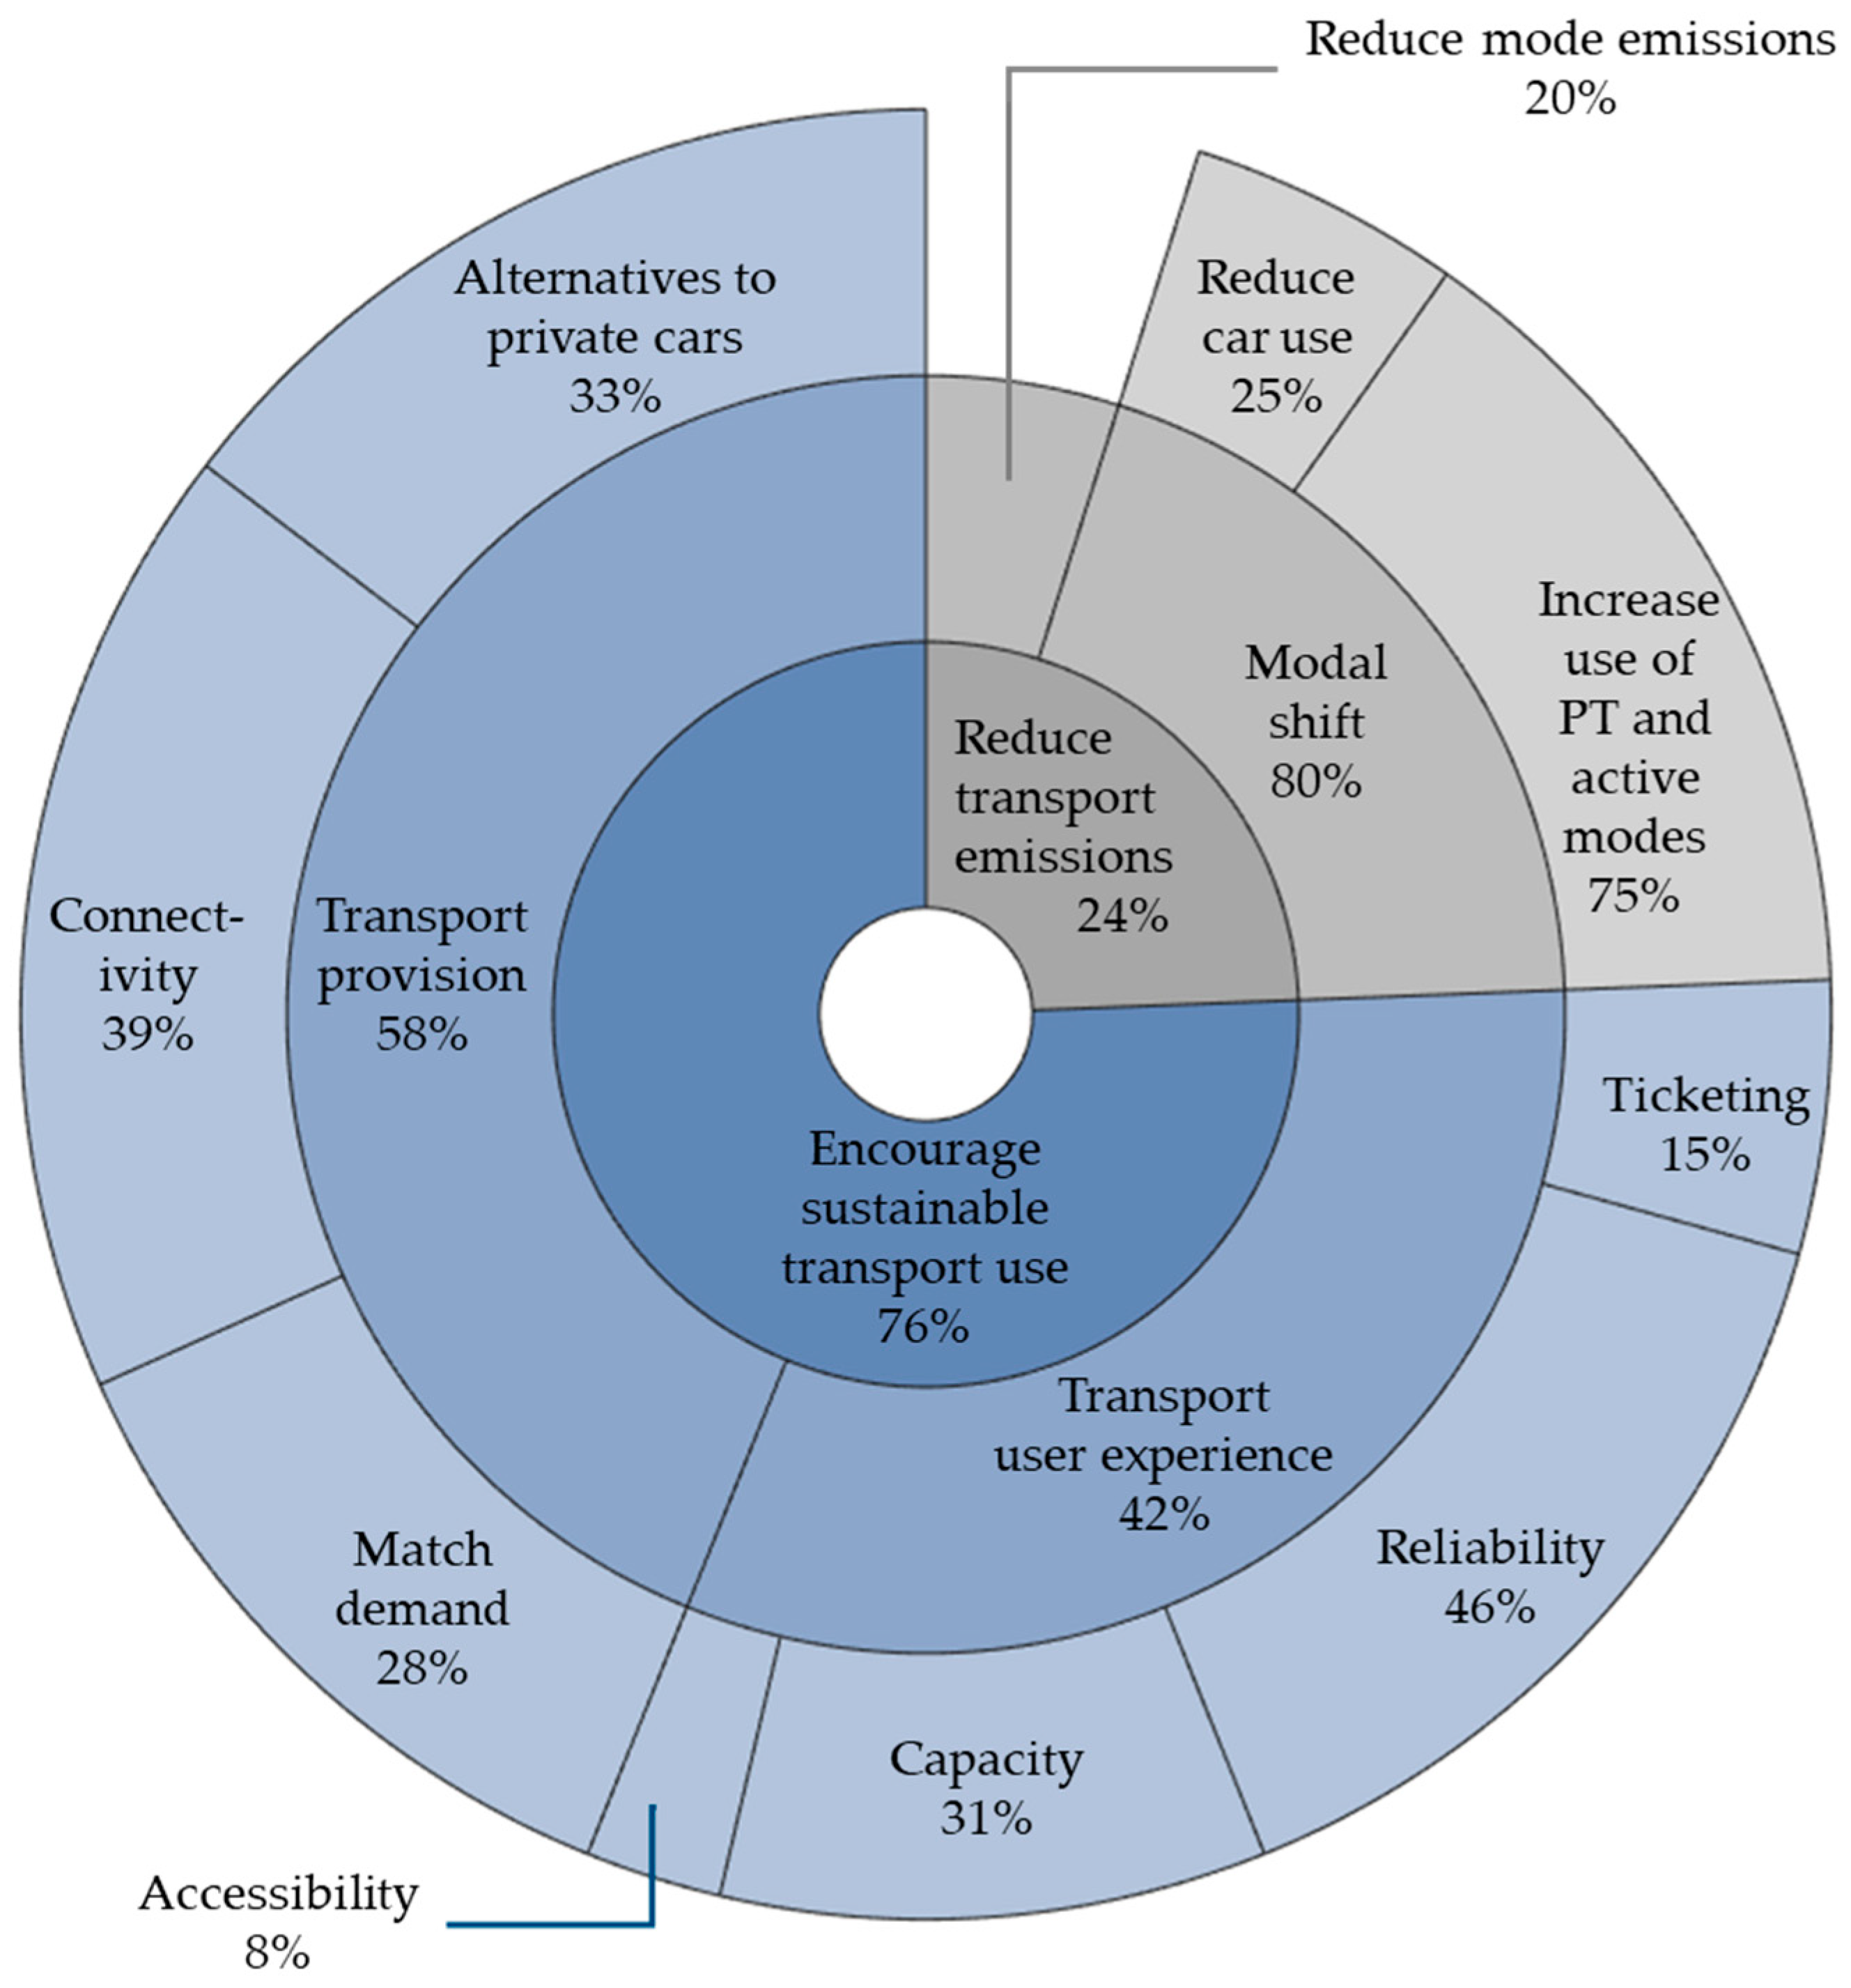
- The reduction in regional transport carbon emissions from a system perspective, primarily through modal shift but also through the reduction in emissions from individual modes.
- Increased sustainable transport use through better transport provision and improved transport user experience.

| Themes | Codes | Keywords | Example Quotations |
|---|---|---|---|
| 1. Reduce transport emissions (10) | Modal shift (8) | Reduce car use (2) | “No cars in low emission zone” |
| Increase use of Public Transport (PT) and active modes (6) | “Use public transport to travel to medical appointments”, “Make public transport more attractive to shift car journeys” | ||
| Reduce mode emissions (2) | Reduce mode emissions (2) | “Reduce emissions of buses”, “Electrification of rail” | |
| 2. Encourage sustainable transport use (31) | Transport user experience (13) | Accessibility (1) | “Make public transport more accessible for wheelchair users, disabled, vulnerable groups” |
| Capacity (4) | “Reduce occupancy of buses during peak times”, “Reduce station congestion from school drop off” | ||
| Reliability (6) | “Improve customer confidence in public transport” | ||
| Ticketing (2) | “Improve ticketing payment system”, “Reduce fare” | ||
| Transport provision (18) | Match demand (5) | “Understand the ability of the system to absorb more users (long term and event based)”, “Understand demand movements” | |
| Alternatives to private cars (6) | “Increase public transport provision from rural areas”, “Reduce transport deserts” | ||
| Connectivity (7) | “Improve transport connectivity”, “Social hubs interconnectivity improvements” |

3.3. Use Cases
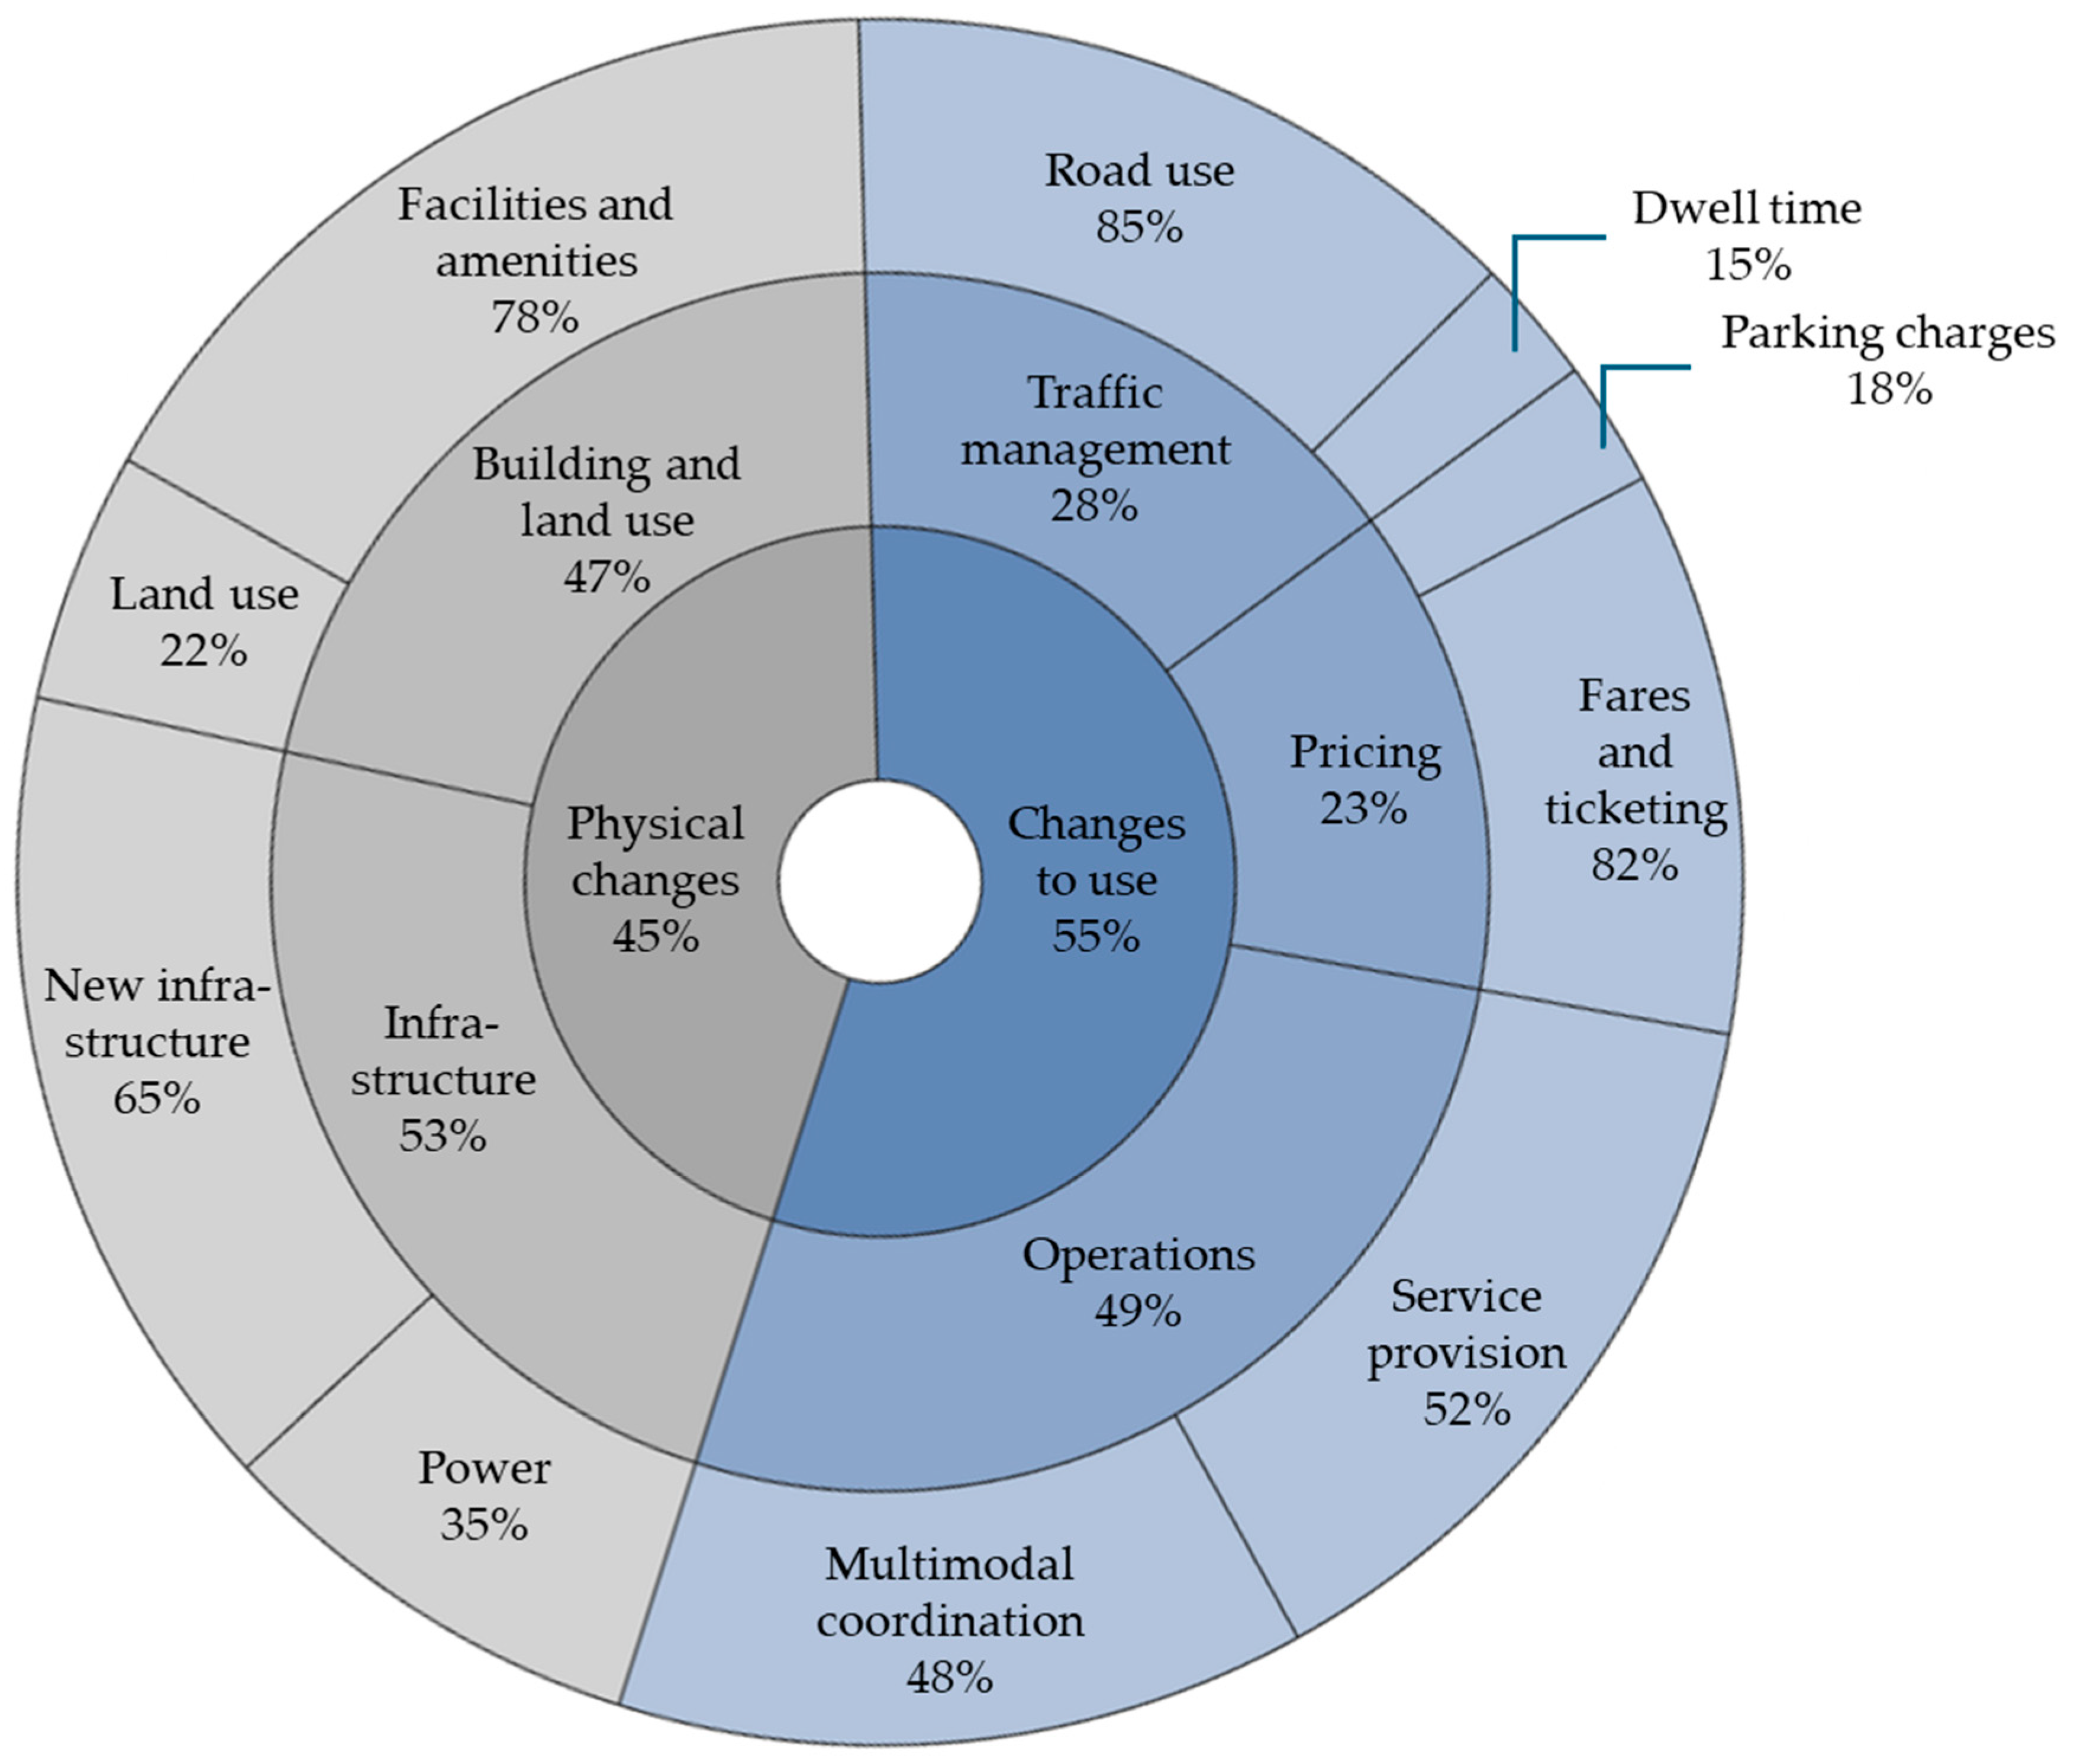
- Infrastructure changes predominantly relate to new transport infrastructure, with responses indicating high interest in rail (62%), tram extensions (23%) and cycling (15%). This supports the outcome of transport provision. Transport power requirements are of almost equal interest for rail electrification and load balancing, and the charging of electric vehicle bus fleets, which aligns with the reduction in mode emissions.
- Building and land use includes changing land use to provide services more locally, e.g., 15 min neighbourhoods (to thereby reduce car-km) and improving transport facilities and amenities, which aligns with the outcome of improving transport user experience. Most interventions in this category (78%) relate to the latter. Around two-thirds of the responses aim to facilitate intermodal changes, predominantly between active travel and bus or rail, through the provision of cycle parking, storage, showers, etc. The remainder relate to providing better information to passengers, particularly in real time, so they have confidence to use public transport.
- Operations directly relate to transport provision and user experience. Half the responses focus on service provision, with high interest in modelling additional PT services (predominantly buses) and dynamic operations, where PT responds to changes in passenger demand and planned or unplanned disruption on the network. The other half centre multimodal coordination, predominantly by aligning schedules between trains and buses, with some mention of developing mobility (bus) hubs. There is significant weighting towards buses as an intervention, which may be due to their relative flexibility and short implementation time.
- Traffic management largely concerns road use, with 85% of responses looking to restrict vehicle access (both private cars and freight) or prioritise pedestrians and active travel specifically within the city centre. These interventions force mode shifts but also improve the safety and experience of active travel. School travel is also targeted through either school bus priority or “school streets”. Passenger flow on and off buses is also considered to improve passenger experience. A few responses highlighted the importance of motivating users to opt for active travel, e.g., by promoting health benefits, reduced cost, etc., and managing the cultural disconnect between car drivers and active travellers.
- Pricing is largely focussed on fares and ticketing (82%), with further responses related to parking charges. Free or reduced fares are of interest, specifically for young people and in low-emission zones. Integrated ticketing across modes is another intervention of interest that could improve public transport user experience to drive mode shifts. Parking charges relate to park and ride locations and large employers with private parking facilities.
3.4. Added Value of Digital Twinning
3.4.1. Dynamic or Time-Dependent Data Sources That Could Be Added to Models
3.4.2. Feedback Mechanisms Between the Real World and DR
- Journey planning
- Assumed to be through online planners or mobile apps;
- Providing information to passengers on alternatives to car travel, including pricing;
- Sharing the availability of parking spaces, e.g., disabled spaces, electric vehicle charging spaces, parent and child spaces; status of electric vehicle chargers.
- Real-time updates
- Customer information systems in railway stations, on trains and via apps, providing useful data to travellers such as the location of the quiet carriage, empty luggage racks, seat availability, for their journey;
- Customer information systems at bus stops, on buses and via apps, providing updates on service occupancy, location, expected arrival, etc.;
- Update to traffic conditions via routing apps.
- Operational control
- Smart motorway gantry control;
- Sensor-based traffic light control;
- Information provided to traffic controllers, road and rail (e.g., signallers, platform dispatchers) and transport operators.
3.4.3. Validating the Added Value of Digital Twinning Methods
- Identifying the system effects of changes, rather than just primary relationships;
- Using data feeds to give more specific (temporal) parameter values, rather than averages;
- Incorporating variance and elasticities, including human variance;
- Validating interventions found using human factors techniques within the models;
- Evidencing the correctness of models against the real world;
- Allowing users to visualise the impact of changes;
- Enhancing usability to encourage the use of models and provide greater access.
3.5. Framework of Five Critical Aspects to Inform Digital Twinning Use Cases
- Services: the outputs captured in the workshop support the specification of the transport interventions to test, the types of locations to which they should be applied, and relevant decarbonisation metrics to support local transport planning and project evaluation.
- Data sources: by incorporating the data sources captured during the workshop, modellers can add value, creating a more realistic representation of the real-world transport system (including travellers) and the wider system within which it sits. Baseline data is also required to be able to provide the service functionality desired by users. As previously stated, this is true for models, shadows and twins.
- Feedback mechanisms: the mechanisms captured relate to more automated day-to-day operational control and information provision to drive behavioural change. For longer-term scenario modelling, the insights require human interpretation and will inform decision making.
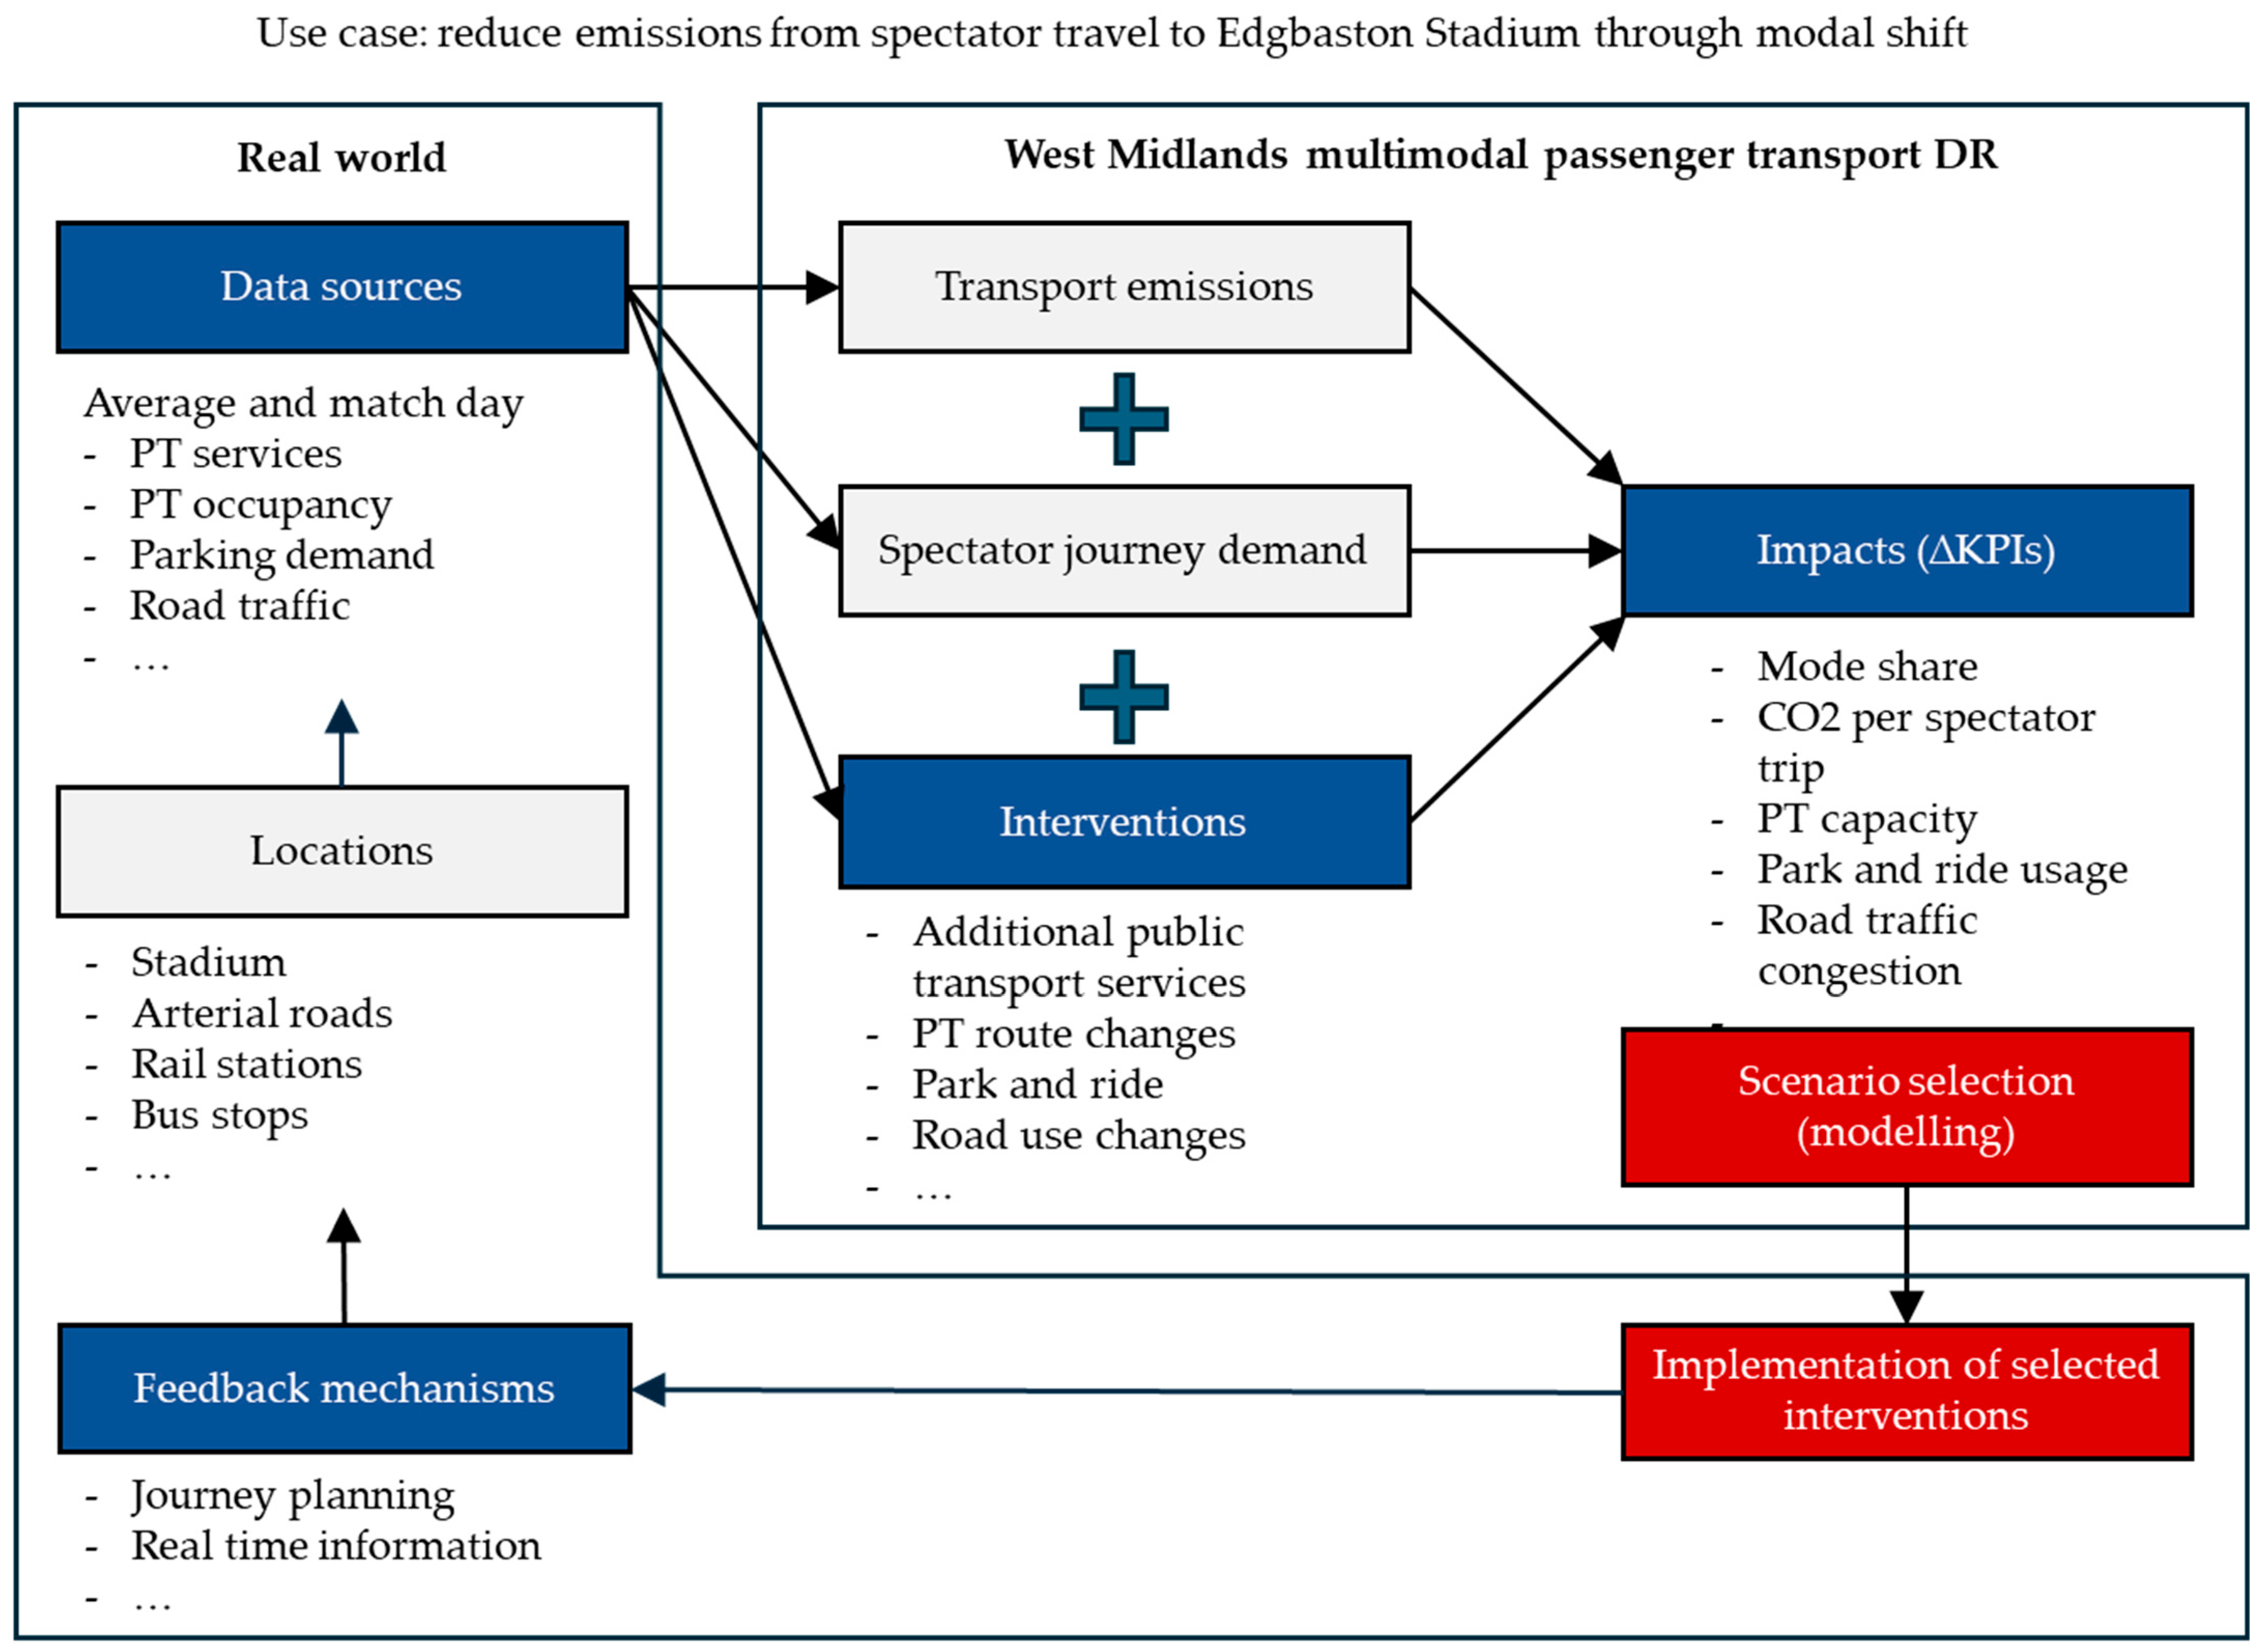
3.6. Illustrative Example of Framework Application
4. Discussion
4.1. Critical Evaluation of Contributions
4.2. Critical Evaluation of Approach
4.3. Digital Twins vs. Digital Twinning
5. Conclusions
Supplementary Materials
Author Contributions
Funding
Institutional Review Board Statement
Informed Consent Statement
Data Availability Statement
Acknowledgments
Conflicts of Interest
Appendix A
| Category (Number of Attendees) | Organisation |
|---|---|
| Academia (8) | University of Leeds, Durham University, University of Birmingham, Heriot-Watt University |
| Industry (10) | WSP, Transport for West Midlands, Midlands Connect |
References
- IPCC. Summary for Policymakers. In Climate Change 2023: Synthesis Report; Core Writing Team, Lee, H., Romero, J., Eds.; Contribution of Working Groups I, II and III to the Sixth Assessment Report of the Intergovernmental Panel on Climate Change; IPCC: Geneva, Switzerland, 2023; pp. 1–34. [Google Scholar] [CrossRef]
- IEA. Transport. Available online: https://www.iea.org/energy-system/transport (accessed on 6 August 2025).
- United Nations, Department of Economic and Social Affairs, Population Division. World Urbanization Prospects: The 2018 Revision; (ST/ESA/SER.A/420); United Nations: New York, NY, USA, 2019; Available online: https://population.un.org/wup/assets/WUP2018-Report.pdf (accessed on 21 November 2025).
- Monteiro, J.; Sousa, N.; Coutinho-Rodrigues, J.; Natividade-Jesus, E. Challenges Ahead for Sustainable Cities: An Urban Form and Transport System Review. Energies 2024, 17, 409. [Google Scholar] [CrossRef]
- Budnitz, H.; Jaskólski, M.; Knapskog, M.; Lis-Plesińska, A.; Schmidt, F.; Szymanowski, R.; van der Craats, J.; Schwanen, T. Multi-level governance and modal thinking: Tensions in electric mobility transitions in European cities. Transp. Policy 2025, 160, 63–72. [Google Scholar] [CrossRef]
- Miner, P.; Smith, B.M.; Jani, A.; McNeill, G.; Gathorne-Hardy, A. Car harm: A global review of automobility’s harm to people and the environment. J. Transp. Geogr. 2024, 115, 103817. [Google Scholar] [CrossRef]
- Cleland, C.L.; Jones, S.; Moeinaddini, M.; Weir, H.; Kee, F.; Barry, J.; Longo, A.; McKeown, G.; Garcia, L.; Hunter, R.F. Complex interventions to reduce car use and change travel behaviour: An umbrella review. J. Transp. Health 2023, 31, 101652. [Google Scholar] [CrossRef]
- Royal Town Planning Institute (RTPI). Net Zero Transport: The Role of Spatial Planning and Place-Based Solutions. RTPI. 2021. Available online: https://www.rtpi.org.uk/new-from-the-rtpi/net-zero-transport-the-role-of-spatial-planning-and-place-based-solutions/ (accessed on 7 November 2025).
- Matyas, M.; Knoll-Pollard, J.; Jenkins, B.; Moore, A.; McVeigh, D. Understanding the Requirements and Barriers for Modal Shift; WSP: London, UK, 2023; Available online: https://www.theccc.org.uk/publication/understanding-the-requirements-and-barriers-for-modal-shift-wsp/ (accessed on 11 August 2025).
- Faliagka, E.; Christopoulou, E.; Ringas, D.; Politi, T.; Kostis, N.; Leonardos, D.; Tranoris, C.; Antonopoulos, C.P.; Denazis, S.; Voros, N. Trends in Digital Twin Framework Architectures for Smart Cities: A Case Study in Smart Mobility. Sensors 2024, 24, 1665. [Google Scholar] [CrossRef] [PubMed]
- ISO/IEC 5087; Information Technology—City Data Model. International Organization for Standardization: Geneva, Switzerland, 2024.
- Lin, Z.; Lan, J.; Nguyen, A.T.; Flynn, D. Contingency-Aware Spatiotemporal Optimization for Safe Autonomous Vehicle Trajectory Planning. IEEE Trans. Intell. Transp. Syst. 2025, 26, 18487–18499. [Google Scholar] [CrossRef]
- Lin, Z.; Lan, J.; Anagnostopoulos, C.; Tian, Z.; Flynn, D. Safety-crtitical multi-agent MCTS for mixed traffic coordination at unsignalized intersections. IEEE Trans. Intell. Transp. Syst. 2025, 26, 18992–19006. [Google Scholar] [CrossRef]
- Nag, D.; Brandel-Tanis, F.; Pramestri, Z.A.; Pitera, K.; Frøyen, Y.K. Exploring digital twins for transport planning: A review. Eur. Transp. Res. Rev. 2025, 17, 15. [Google Scholar] [CrossRef]
- Tao, F.; Liu, W.; Zhang, M.; Hu, T.; Qi, Q.; Zhang, H.; Sui, F.; Wang, T.; Xu, H.; Huang, Z.; et al. Five-dimension digital twin model and its ten applications. Jisuanji Jicheng Zhizao Xitong/Comput. Integr. Manuf. Syst. CIMS 2019, 25, 1–18. (In Chinese) [Google Scholar] [CrossRef]
- Charitonidou, M. Urban scale digital twins in data-driven society: Challenging digital universalism in urban planning decision-making. Int. J. Archit. Comput. 2022, 20, 238–253. [Google Scholar] [CrossRef]
- Aghaabbasi, M.; Sabri, S. Potentials of digital twin system for analyzing travel behavior decisions. Travel Behav. Soc. 2025, 38, 100902. [Google Scholar] [CrossRef]
- Newrzella, S.R.; Franklin, D.W.; Haider, S. 5-Dimension Cross-Industry Digital Twin Applications Model and Analysis of Digital Twin Classification Terms and Models. IEEE Access 2021, 9, 131306–131321. [Google Scholar] [CrossRef]
- Callcut, M.; Cerceau Agliozzo, J.-P.; Varga, L.; McMillan, L. Digital Twins in Civil Infrastructure Systems. Sustainability 2021, 13, 11549. [Google Scholar] [CrossRef]
- Belfadel, A.; Hörl, S.; Tapia, R.J.; Politaki, D.; Kureshi, I.; Tavasszy, L.; Puchinger, J. A conceptual digital twin framework for city logistics. Comput. Environ. Urban Syst. 2023, 103, 101989. [Google Scholar] [CrossRef]
- DUET. D2.2 Scenario Specifications of the DUET Solution. DUET. 2020. Available online: https://www.digitalurbantwins.com/_files/ugd/68109f_c0be167a31d54825a3f458323d773790.pdf (accessed on 11 August 2025).
- Vom Brocke, J.; Hevner, A.; Maedche, A. Introduction to Design Science Research. In Design Science Research. Cases; Vom Brocke, J., Hevner, A., Maedche, A., Eds.; Progress in IS; Springer: Cham, Switzerland, 2020. [Google Scholar] [CrossRef]
- Peffers, K.; Tuunanen, T.; Rothenberger, M.A.; Chatterjee, S. A Design Science Research Methodology for Information Systems Research. J. Manag. Inf. Syst. 2007, 24, 45–77. [Google Scholar] [CrossRef]
- Braun, V.; Clarke, V. Using thematic analysis in psychology. Qual. Res. Psychol. 2006, 3, 77–101. [Google Scholar] [CrossRef]
- Baxter, K.; Courage, C.; Caine, K. Chapter 12—Focus Groups. In Understanding Your Users, 2nd ed.; Baxter, K., Courage, C., Caine, K., Eds.; Morgan Kaufmann: Waltham, MA, USA, 2015; pp. 338–376. [Google Scholar] [CrossRef]
- Naeem, M.; Ozuem, W.; Howell, K.; Ranfagni, S. A Step-by-Step Process of Thematic Analysis to Develop a Conceptual Model in Qualitative Research. Int. J. Qual. Methods 2023, 22, 16094069231205789. [Google Scholar] [CrossRef]
- Department for Transport. Decarbonising Transport: A Better, Greener Britain; Department for Transport: London, UK, 2021. Available online: https://www.gov.uk/government/publications/transport-decarbonisation-plan (accessed on 12 August 2025).
- WMCA. £2.4bn Transport Fund Will Improve Journeys for Everyone Across West Midlands; West Midlands Combined Authority: Birmingham, UK, 2025. Available online: https://www.wmca.org.uk/news/2-4bn-transport-fund-will-improve-journeys-for-everyone-across-west-midlands/ (accessed on 12 August 2025).
- Jiao, J.; Dillivan, M. Transit Deserts: The Gap between Demand and Supply. J. Public Transp. 2013, 16, 23–39. [Google Scholar] [CrossRef]
- Net Zero Now. Go Green Game, Executive Summary, How Edgbaston Reduced Emissions from the England New Zealand IT20 by >25%; Net Zero Now: London, UK, 2023; Available online: https://assets.edgbaston.com/wp-content/uploads/2024/01/Edgbaston-Go-Green-Game-Exec-Summary.pdf?_gl=1*f5992l*_up*MQ..*_ga*MTYwODkzNzcxMi4xNzU5MjMzMDY2*_ga_ZHXWMN2QK2*czE3NTkyMzMwNjYkbzEkZzAkdDE3NTkyMzMwNjYkajYwJGwwJGgw (accessed on 30 September 2025).
- Nili, A.; Tate, M.; Barros, A.; Johnstone, D. An approach for selecting and using a method of inter-coder reliability in information management research. Int. J. Inf. Manag. 2020, 54, 102154. [Google Scholar] [CrossRef]
- Sonta-Draczkowska, E.; Cichosz, M.; Klimas, P.; Pilewicz, T. Co-creating innovations with users: A systematic literature review and future research agenda for project management. Eur. Manag. J. 2025, 43, 321–339. [Google Scholar] [CrossRef]


| Data Flow | Model | Shadow | Twin |
|---|---|---|---|
| General description | No automatic data flow between physical and digital | Automatic data flow from physical to digital only | Automatic, bidirectional data flow between physical and digital |
| Physical object to digital object | Manual | Automatic | Automatic |
| Digital object to service component | Manual | Manual/Automatic | Automatic |
| Service component to physical object | Manual | Manual | Automatic |
| Themes | Codes | Keywords | Example Quotations |
|---|---|---|---|
| 1. Infrastructure (20) | New transport infrastructure (13) | Cycle infrastructure (2) | “Segregated infrastructure, e.g., cycle lane” |
| Rail infrastructure (8) | “Local stations reopened”, “Metro across the city” | ||
| Tram infrastructure (3) | “Tram extension to coach station”, “Tram extensions down main roads” | ||
| Power (7) | Energy management (2) | “Energy recovery to increase efficiency of rail network”, “Load balancing” | |
| Electric vehicle charging (3) | “Charging of electric buses at depots/along a route” | ||
| Rail electrification (2) | “Electrify rail lines” | ||
| 2. Building and land use (18) | Land use (4) | Local services (4) | “15-min neighbourhood around work location”, “Services available more locally” |
| Facilities and amenities (14) | Intermodal interfaces (6) | “Cycle parking at larger bus stops”, “Optimal location of park and ride”, “Pram, wheelchair, bike access [on trains]” | |
| Real-time information (3) | “[bus] stops display real-time information”, “Apps to show journey planning across modes” | ||
| Static signage (2) | “Wayfinding—pointing to active travel options”, “Changing bus lane signage to improve understanding of road users” | ||
| Station amenities (3) | “Stations with toilets, shops, cafes”, “Shower facilities/locker rooms available in stations”, “Family spaces” | ||
| 3. Operations (23) | Transport service provision (12) | Dynamic operations (5) | “Contingency plans for strategic locations based on resilience modelling”, “Demand responsive transport”, “Disruption management” |
| Route changes (2) | “Routing of buses to local centres”, “Routes—orbital routes are [too] slow” | ||
| Additional Public Transport (PT) services (5) | “Additional buses during peak times”, “24-h bus service” | ||
| Multimodal coordination (11) | Mobility hubs (2) | “Satellite bus centres”, “Bus hubs” | |
| Schedule coordination (9) | “Aligning buses and trains in rural areas”, “Optimisation of [public transport] connections”, “Integrated, multimodal public transport” | ||
| 4. Traffic management (13) | Road use (11) | Bus priority (3) | “School buses to run exclusively on specific corridors”, “Priority [for buses] to pull into traffic” |
| Active travel priority (3) | “Pedestrian right of way”, “School streets/walking buses”, “Pedestrian/cycle right of way in city centre” | ||
| Restrict vehicle access (5) | “Consolidation of freight at the edge of the city centre”, “Close roads”, “City centre restrictions on personal vehicles” | ||
| Dwell time (2) | Passenger flow (2) | “Ingress/egress on public transport”, “Buses—multiple exits” | |
| 5. Pricing (11) | Fares and ticketing (9) | Integrated ticketing (4) | “Increase smartcard area and modes”, “Integrated, multimodal ticketing” |
| Free or reduced fares (5) | “Cost-ticket prices [for public transport]”, “Free public transport in low emission zone”, “Free bus travel for young people” | ||
| Parking charges (2) | Change parking pricing (2) | “Different pricing methods for park and ride”, “Make parking more expensive for those with public transport alternatives” |
| Category | Rationale for Inclusion | Potential Sources |
|---|---|---|
| Active travel | To better understand walking and cycling demand, routes and experience | Smartphone/GPS, logging apps such as Strava, CCTV (e.g., at cycle parking facilities), rental bike usage data, vehicle sensing, traffic light—pedestrian interactions, accessibility data, e.g., step-free access assessment |
| Air quality | To understand where and when air quality is poor, and determine root causes, e.g., idling, congestion | Air quality sensors (e.g., nitrous oxides (NOx), particulate matter (PM), sulphur dioxide (SO2), carbon oxides (COx)) |
| Parking | To understand car park utilisation and how long people are using services | Car park ticket barrier data, car park occupancy sensors, car park ticketing, park and ride ticket data, CCTV |
| Power and energy | To understand power and energy demand from different substations at different times from public and private transport | Train traction charging, train metering data, electric bus charging demand from depots, electric vehicle charging data |
| Public transport occupancy | To understand differences in demand across routes and at different times (peak/off-peak, through the week, seasonal variation, for specific events). To improve the accuracy of metrics such as emissions per passenger | Smartphone/GPS, CCTV (e.g., station platforms, concourses, bus stops), occupancy data from operators, ticketing data |
| Road traffic | To understand the difference in demand across routes at different times | Smartphone/GPS, traffic sensors, road conditions data, low emission zone data including usage by compliant and non-compliant vehicles, car count data, traffic management protocols, routing protocols, e.g., from Google Maps, road traffic control centre data, CCTV, automatic number plate recognition |
| Social media | To understand real-time issues with services and passenger sentiments towards PT | Different social media platforms, e.g., X, Facebook, Instagram |
| Transport-related social exclusion | To identify people experiencing exclusion to ensure interventions alleviate their issues. Contributors to exclusion include poor provision of local transport, unsuitable conditions to facilitate travel, high level of car dependency. It is most likely to affect people with disabilities, health conditions, caring responsibilities. | Census data, demographic information, accessibility information, information on street conditions, local transport schedules, requests for passenger assistance |
| Journey demand | To understand demand and opportunities for modal shift, including for specific events | Smartphone/GPS, travel survey data from employers, boarding/ticketing data from operators, smartcard data, data from ticket barriers, ticket data for special events, e.g., concerts, sports matches |
| Weather and environment | To understand the impact of these conditions on transport, e.g., mode choice, potential disruption | Weather sensors, Met Office data, climatological data |
| Aspect | Description |
|---|---|
| Impacts | Captures the impacts desired from urban transport decarbonisation interventions. From this, appropriate KPIs can be defined to compare different interventions or sets of interventions. |
| Location type | Specifies the areas of interest to be modelled, helping to define the system boundary and scale of the DRs required. |
| Interventions | Sets out the transport decarbonisation interventions of interest. This helps to specify the level of detail required for the DRs and provides a starting point for baseline development. |
| Data sources | Prompts developers to consider additional dynamic data sources of value to be incorporated into the DRs to create a more realistic representation of the real world. |
| Feedback mechanisms | Prompts developers to consider how the impact evaluation and insights derived from the DRs can be fed back to influence the real-world state of the transport system. Direct control is achieved through a DT. |
| Aspect | Description for Edgbaston Stadium Use Case |
|---|---|
| Impacts | This use case considers how to manage travel to and from Edgbaston Stadium for cricket matches through improved transport provision and transport user experience and to understand the impact on local travel. The desired outcome is a modal shift from private cars to public and active transport modes to reduce carbon emissions from spectator travel. Example KPIs: mode share, CO2 per spectator-trip, PT capacity, PT occupancy, park and ride usage, road traffic congestion (e.g., average delay or travel time index). |
| Location type | Transport desert—although there are frequent bus services to and from the city centre to the stadium, the stadium is not well connected to locations within Edgbaston and other areas of Birmingham. Railway stations (on commuter lines) are at least a half-hour walk away. It is next to an arterial road, which may be affected by local road closures on match days. |
| Interventions | Interventions predominantly relate to transport service provision. As a special case of dynamic operations, contingency plans for match day travel could be developed. These may include additional PT services, route changes or park and ride from alternative stations to Birmingham New Street in the city centre. Given that road use changes (i.e., access restrictions) are already in place, revisions to these could be evaluated. |
| Data sources | Understanding journey demand is crucial, including the modes (e.g., active travel, PT) by which visitors travel to the stadium. To understand the impacts this has on congestion and residents, data is needed to compare average congestion vs. match day congestion with regard to parking, PT occupancy and road traffic. |
| Feedback mechanisms | Feedback is likely to concern journey planning or real-time information for match day visitors or residents affected by road closures and traffic. |
Disclaimer/Publisher’s Note: The statements, opinions and data contained in all publications are solely those of the individual author(s) and contributor(s) and not of MDPI and/or the editor(s). MDPI and/or the editor(s) disclaim responsibility for any injury to people or property resulting from any ideas, methods, instructions or products referred to in the content. |
© 2026 by the authors. Licensee MDPI, Basel, Switzerland. This article is an open access article distributed under the terms and conditions of the Creative Commons Attribution (CC BY) license.
Share and Cite
Steele, H.; Duvnjak, J.; Byron, P.; Matyas, M.; Easton, J.; Roberts, C.; Flynn, D.; Greening, P. A Co-Created Framework to Define Digital Twinning Use Cases for Urban Transport Decarbonisation. Urban Sci. 2026, 10, 140. https://doi.org/10.3390/urbansci10030140
Steele H, Duvnjak J, Byron P, Matyas M, Easton J, Roberts C, Flynn D, Greening P. A Co-Created Framework to Define Digital Twinning Use Cases for Urban Transport Decarbonisation. Urban Science. 2026; 10(3):140. https://doi.org/10.3390/urbansci10030140
Chicago/Turabian StyleSteele, Heather, Joshua Duvnjak, Paul Byron, Melinda Matyas, John Easton, Clive Roberts, David Flynn, and Philip Greening. 2026. "A Co-Created Framework to Define Digital Twinning Use Cases for Urban Transport Decarbonisation" Urban Science 10, no. 3: 140. https://doi.org/10.3390/urbansci10030140
APA StyleSteele, H., Duvnjak, J., Byron, P., Matyas, M., Easton, J., Roberts, C., Flynn, D., & Greening, P. (2026). A Co-Created Framework to Define Digital Twinning Use Cases for Urban Transport Decarbonisation. Urban Science, 10(3), 140. https://doi.org/10.3390/urbansci10030140