Article

Introducing the T-MCCR Index for Evaluating Urban Thermal Comfort and Morphological Performance

by
Hossein Abdeyazdan
* and
Daniele Santucci
Faculty of Architecture, RWTH Aachen University, 52062 Aachen, Germany
*
Author to whom correspondence should be addressed.
Urban Sci. 2026, 10(3), 123; https://doi.org/10.3390/urbansci10030123
Submission received: 21 December 2025 / Revised: 12 February 2026 / Accepted: 17 February 2026 / Published: 25 February 2026
(This article belongs to the Topic Advances in Urban Resilience for Sustainable Futures)

Abstract

Urban morphology plays a key role in shaping outdoor thermal comfort, especially as cities experience increasing heat stress under climate change. While the Universal Thermal Climate Index (UTCI) is widely applied in outdoor thermal comfort studies, existing approaches rarely provide a comprehensive framework for evaluating and comparing the thermal comfort performance of urban morphologies across different times of the day. This study addresses this gap by proposing a time-aggregated, morphology-sensitive framework for comparative assessment of outdoor thermal comfort. Morphological performance is defined as the measurable capacity of an urban form to provide and sustain thermally comfortable outdoor conditions over time, emerging from the combined effects of its spatial configuration and geometry. Hourly UTCI simulations were conducted for three urban morphologies in Aachen, Germany, under present climate conditions and a high-emission future scenario (RCP 8.5, 2050). The urban fabric was discretized into uniform spatial parcels, and the proportion of thermally comfortable areas was evaluated across the diurnal cycle using the Time-weighted Morphological Climate Comfort Ratio (T-MCCR). The results show clear differences in thermal comfort performance among morphologies. Compact urban form exhibits higher comfort persistence and greater resilience under future climate conditions, whereas detached morphologies show lower performance and more fragmented comfort patterns. The proposed framework provides a comparative, design-support tool for morphology-driven thermal comfort evaluation.

1. Introduction

The quality of outdoor environments significantly influences people’s health, well-being and activity levels; meanwhile, technological and societal advancements have increased the demand for better outdoor environments [1,2]. On the other hand, climate change and city growth have increased temperature peaks and frequencies, resulting in changes in local climates, and they can affect outdoor thermal comfort in many cities [3,4,5,6,7]. Extensive research on human thermal comfort has been carried out over time, employing diverse methodological approaches, including biometeorological, psychological, physiological, climatological, medical, and engineering disciplines, to investigate the complex interactions between climate and the human body [8]. Between all climate comfort indices, the UTCI provides a standardized and physiologically grounded assessment of outdoor thermal stress, with broad applicability across climatic regions and sectors such as meteorology, public health, and urban planning [9]. Although the underlying thermophysiological model can account for factors such as age, gender, or health status, these parameters are typically fixed to a reference profile in most applications, meaning that the UTCI is commonly used as a population-averaged indicator rather than an individualized one [10].
Owing to its foundation in contemporary human biometeorological science, the UTCI enables the harmonization of thermal comfort assessments, ensuring that research outcomes are both physiologically relevant and comparable across studies and regions, an advantage over many traditional indices [11]. For calculation of the UTCI, it should be mentioned that outdoor thermal comfort is strongly influenced by urban morphological parameters, including vegetation characteristics (e.g., tree traits, species selection, and plant arrangement), and built environment features such as street orientation, building arrangement, surface materials, SVF and aspect ratio [12,13]. These factors collectively affect microclimatic conditions by altering solar exposure, wind flow, shading, and radiative heat exchange [14]. Moreover, many studies have examined how climate change affects human health [15,16]. To project future climate impacts, researchers use scenario frameworks such as the SSPs and RCPs [17]. Among climate change scenarios, RCP8.5 represents a high-emission scenario with a radiative forcing of 8.5 W/m2; it is widely used in climate research to illustrate the potential consequences of inaction and to assess risks under extreme warming conditions [18]. Exploring outdoor thermal comfort under high-emission scenarios like RCP8.5 provides valuable insights for climate-adaptive urban planning. To this end, a study in Nicosia, Cyprus, found that by 2050, climate change could raise pedestrian-level air temperatures by 2.3 °C and increase the UTCI by up to 4.3 °C in the late afternoon [19]. Urban morphology and weather conditions interact in complex ways to affect outdoor thermal comfort. To better study these effects, researchers have developed classification systems that describe the physical structure and land use of urban areas [20], such as LCZ [21]. The LCZ framework has become one of the most widely used methods for analyzing outdoor thermal comfort in urban areas as it systematically links urban form and land cover with local climatic conditions [20]. However, it should be noted that the LCZ framework primarily functions as a generalized classification system of urban morphology and land cover rather than a fully morphology-based methodological framework explicitly designed to quantify outdoor thermal comfort. UTCI mapping is commonly used to evaluate the temporal performance of urban morphology by representing spatial distributions of distinct perceived thermal conditions, which allows for the identification of localized thermal hot and cold spots [22]. Using Grasshopper with Ladybug and Honeybee plugins, the researchers conducted parametric simulations to analyze how variations in neighborhood size (20 m, 40 m, and 60 m) influence UTCI values across the urban fabric. The UTCI was calculated using key environmental parameters sourced from a standard EPW file. This approach enabled spatial mapping of thermal comfort and allowed for the analysis of diurnal and seasonal thermal stress conditions [23]. However, UTCI-based mapping approaches effectively visualize spatial–thermal patterns but remain largely representational, limiting direct comparison between urban configurations. Among existing approaches, the STOCA (Spatiotemporal Outdoor Comfort Availability) metric proposed by Santucci [24] represents one of the most advanced methodologies for evaluating the performance of urban environments in providing outdoor thermal comfort by integrating UTCI-based comfort conditions across space and time [24]. However, STOCA is inherently dependent on predefined spatial resolutions, specific study extents, and context-dependent aggregation strategies. As a result, its scale-sensitive formulation limits direct and transferable comparison of thermal comfort performance across different urban morphologies or design alternatives [24]. This limitation constrains its applicability as a transferable, morphology-level performance metric.
This study addresses a critical gap in urban climate research: the absence of a unified, quantitative framework that evaluates urban morphological performance by considering both thermal conditions and their time-dependent relevance for outdoor user presence and activity. While outdoor thermal comfort has been extensively investigated, most existing methods rely on climatic parameters or subjective perception, offering limited capacity to systematically compare how different urban configurations provide outdoor thermal comfort across spatial and temporal scales. The aim of this study is to develop a metric-based framework that addresses the identified research gap by explicitly integrating time-aggregated (or time-weighted) outdoor thermal comfort into the evaluation of urban morphological performance. To this end, the present research introduces the T-MCCR, a quantitative, scalable, and design-oriented index that enables performance-based assessment of morphology-driven outdoor thermal comfort.

2. Materials and Methods

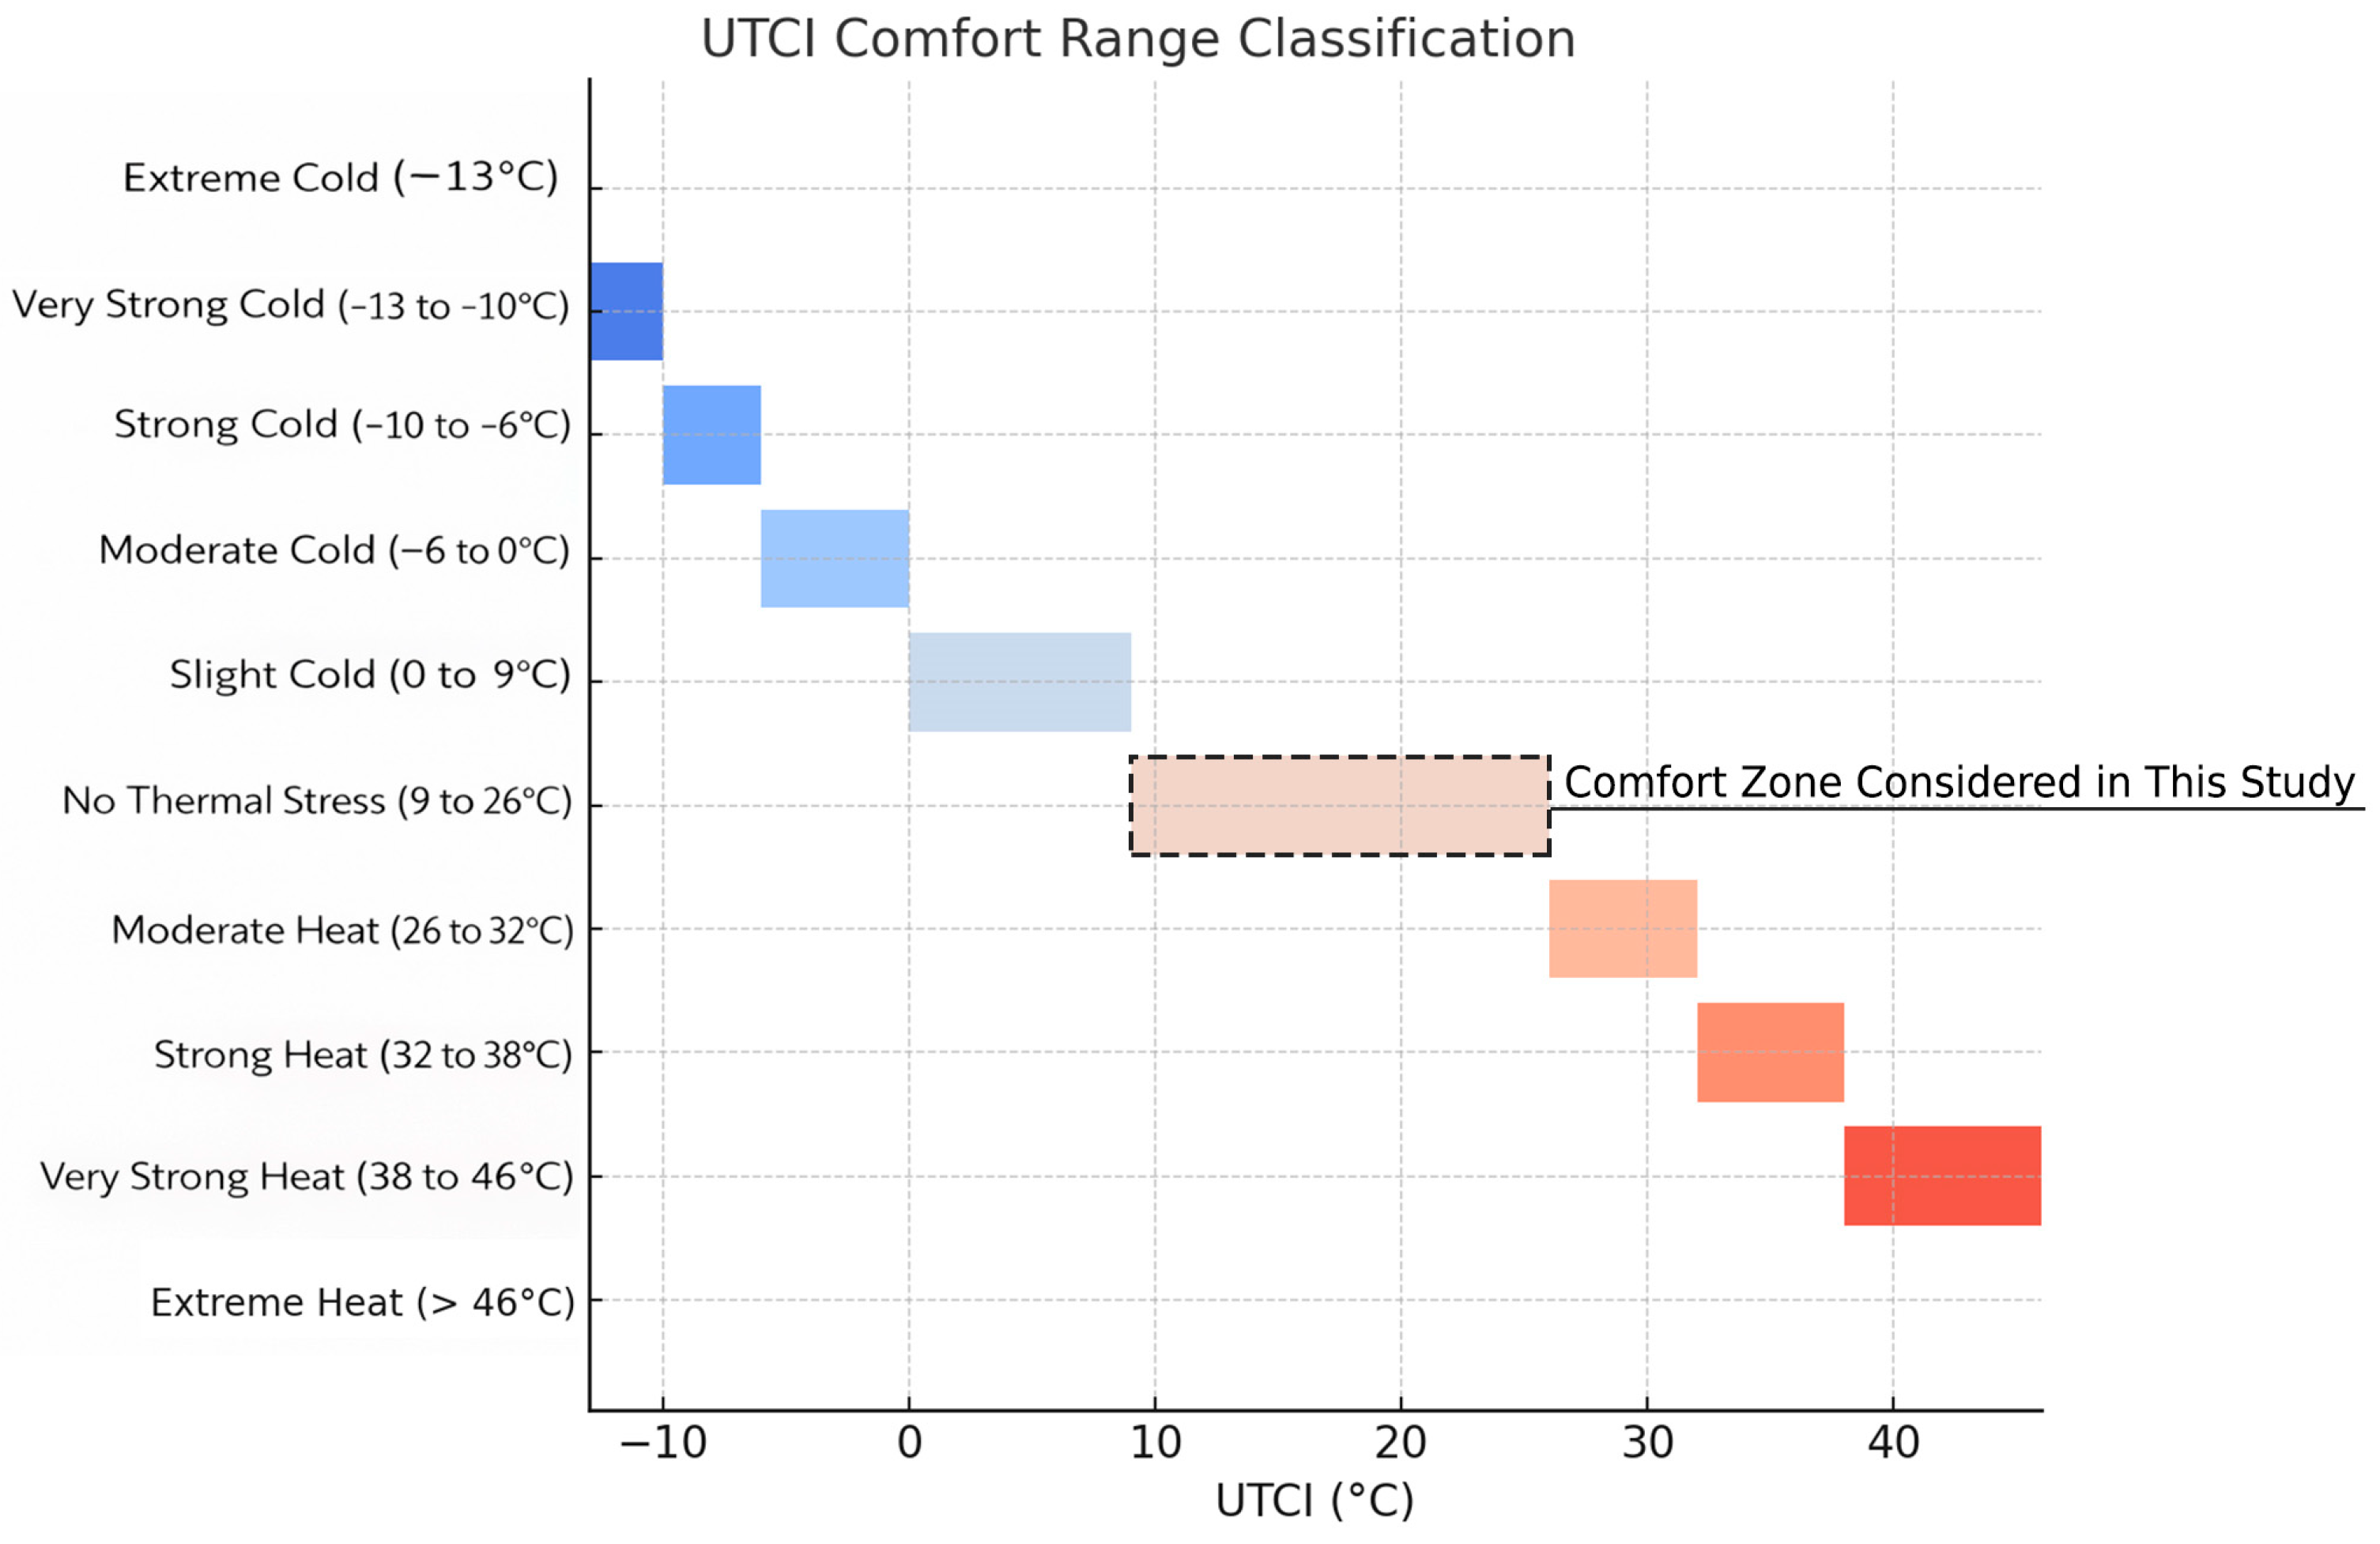
The proposed T-MCCR introduces a novel, data-driven framework for quantifying and comparing the capacity of urban morphologies to provide outdoor thermal comfort. Unlike conventional thermal indices, such as the UTCI or PET, that reflect morphological effects only indirectly through microclimatic variables (e.g., solar radiation, shading, wind flow, and surface temperature), the T-MCCR directly links key morphological characteristics (e.g., density, building height, and spatial configuration) to thermal comfort outcomes in a measurable manner. By calculating the proportion of spatial units that meet predefined comfort thresholds (Figure 1) over time, the T-MCCR captures the dynamic interaction between form and microclimate.
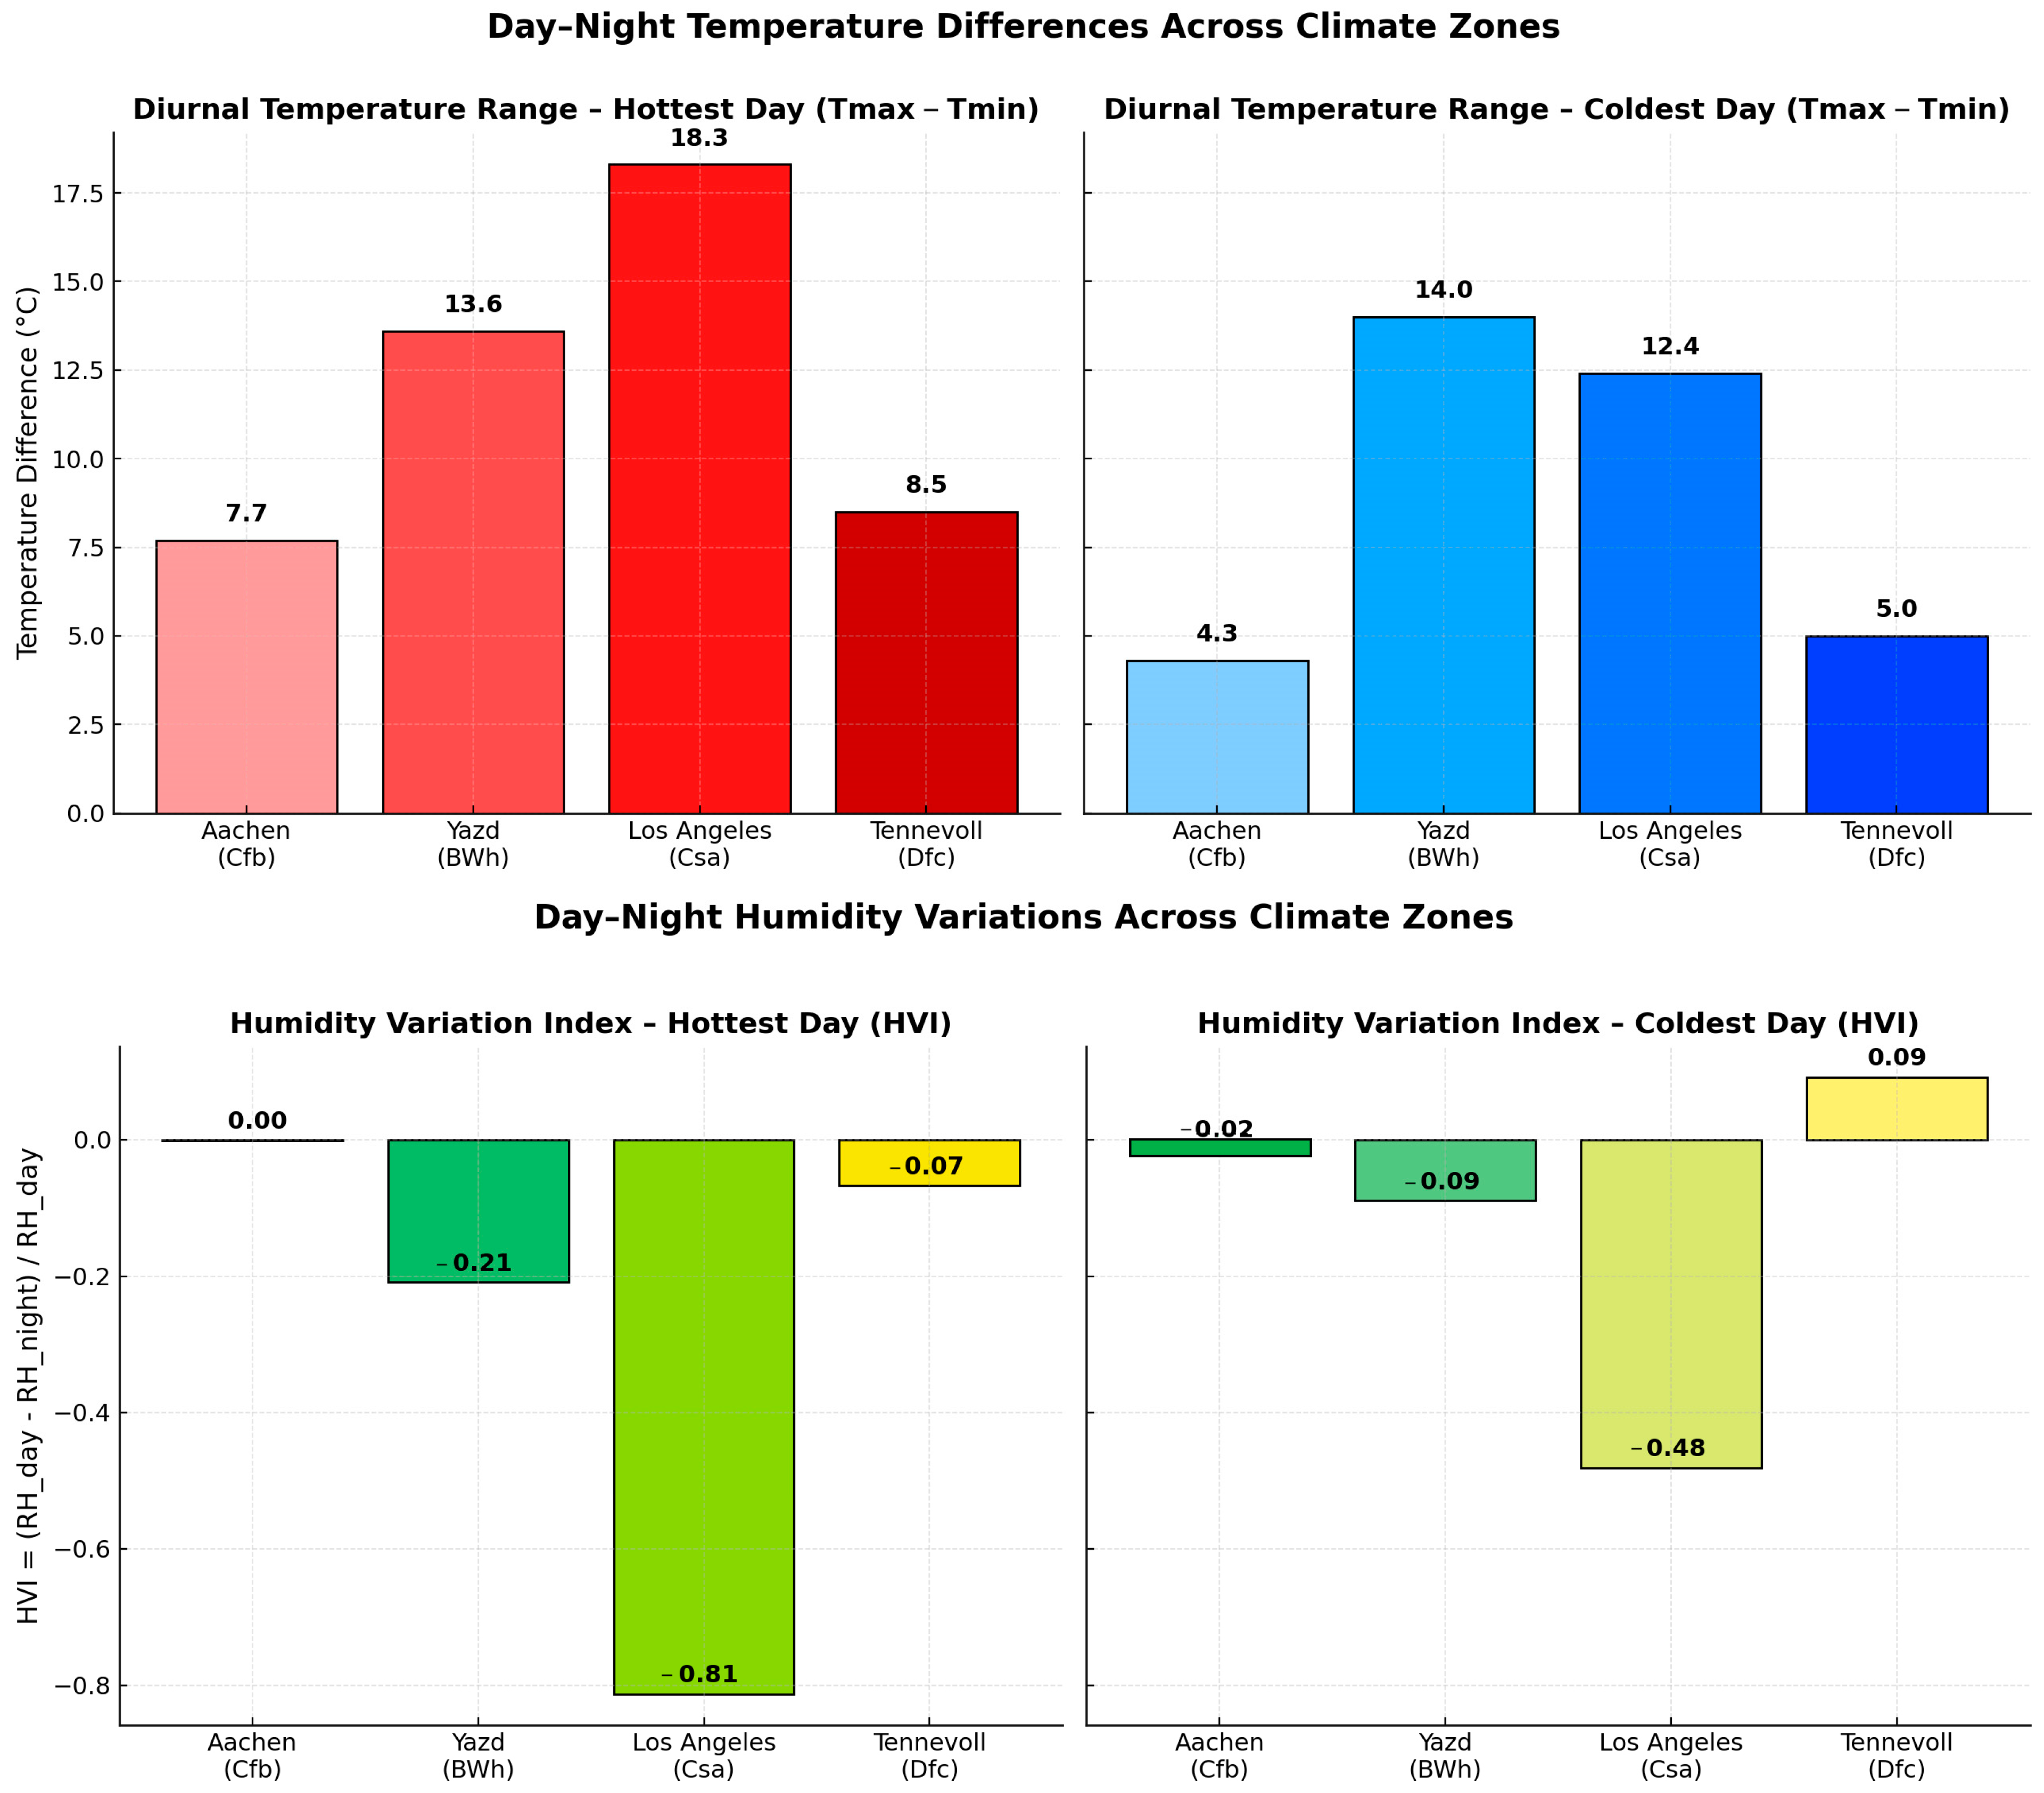
Moreover, in different climatic regions, the diurnal amplitude of meteorological parameters, particularly air temperature, relative humidity, wind speed, and solar radiation, varies significantly (Figure 2) and directly influences the patterns of outdoor thermal comfort throughout the 24 h cycle [25]. In temperate or coastal climates, the difference between daytime and nighttime air temperatures is generally small, resulting in relatively stable thermal comfort conditions [26]. In contrast, arid and desert climates experience strong diurnal fluctuations, with temperature differences often exceeding 15–20 °C, leading to extremely hot daytime conditions and noticeably cooler nights [27]. Meanwhile, in humid–warm climates, although diurnal temperature differences are smaller, high nighttime humidity limits radiative cooling, creating a persistent sense of heat stress and thermal fatigue. Such diurnal variations make it insufficient to assess outdoor thermal comfort solely through daily averages or limited hourly snapshots, as they fail to represent the real temporal dynamics experienced by urban dwellers [28,29]. Therefore, an index such as the Time-weighted Morphological Climate Comfort Ratio (T-MCCR), which measures the proportion of thermally comfortable parcels at each hour and aggregates these values across the 24 h cycle, provides a realistic and dynamic representation of how day–night climatic fluctuations affect overall urban thermal comfort performance.
Consequently, the T-MCCR index serves not only as a quantitative metric for evaluating outdoor thermal comfort across a 24 h cycle but also as a decision-support tool for time-sensitive urban planning. By analyzing the temporal distribution of hours in the comfortable range derived from the T-MCCR, policymakers and urban designers can develop morphology-specific strategies for managing the timing of urban activities, such as promoting nighttime urban life, scheduling outdoor events, or concentrating daytime functions within comfortable hours. Its numerical structure enables both spatial and temporal assessments, facilitating direct comparison across morphological alternatives. To operationalize the index, the study area is discretized into a uniform grid composed of equally sized parcels, each functioning as a receptor for thermal comfort evaluation. Following hourly UTCI simulations, the index is computed as the ratio of comfortable parcels (i.e., those within defined UTCI thresholds) to the total number of parcels at each time step. This comfort ratio is then tracked throughout the diurnal cycle or across multiple periods, revealing how different morphological configurations respond to environmental variability. Importantly, the comfort ratio is sensitive to morphological parameters such as sky view factor, block compactness, street orientation, and ground surface geometry, factors that govern the spatial distribution of heat, airflow, and solar radiation. To ensure the reliability of UTCI results across spatial resolutions, a GCI analysis was conducted. Simulations were performed at three resolutions (8 m, 4 m, and 2 m), and the results demonstrated that refinement beyond the 4 m grid yielded no significant changes in output. This confirmed that the 4 m resolution was both computationally efficient and numerically robust for evaluating thermal comfort in this context. However, relying solely on the temporal comfort ratio may obscure critical aspects of spatial and temporal heterogeneity in thermal conditions. To address this, the concept of entropy is integrated into the T-MCCR framework. Entropy quantifies the degree of variability, or disorder, in the spatial distribution of thermal comfort, revealing how consistently comfort is experienced across the urban surface. This integration enhances the interpretability of the T-MCCR by accounting not only for the extent of thermal comfort but also for its spatial quality.
Entropy is particularly informative when the comfort ratio lies between 0 and 1, when only a portion of parcels satisfy comfort thresholds. In such intermediate states, the comfort ratio alone cannot distinguish between morphologies with clustered versus scattered comfort zones. For instance, a comfort ratio of 0.6 could emerge from either a cohesive central cluster or a fragmented spatial pattern. In such cases, entropy functions as a second-order diagnostic parameter, capturing the degree of spatial coherence or dispersion in comfort distribution. Conversely, when the comfort ratio is 1 (all parcels are comfortable) or 0 (none are comfortable), entropy does not work. Thus, entropy provides a complementary spatial diagnostic that enhances the resolution of morphological performance assessment, particularly in cases where aggregate comfort values may mask significant spatial differences.

2.1. Conceptual Framework

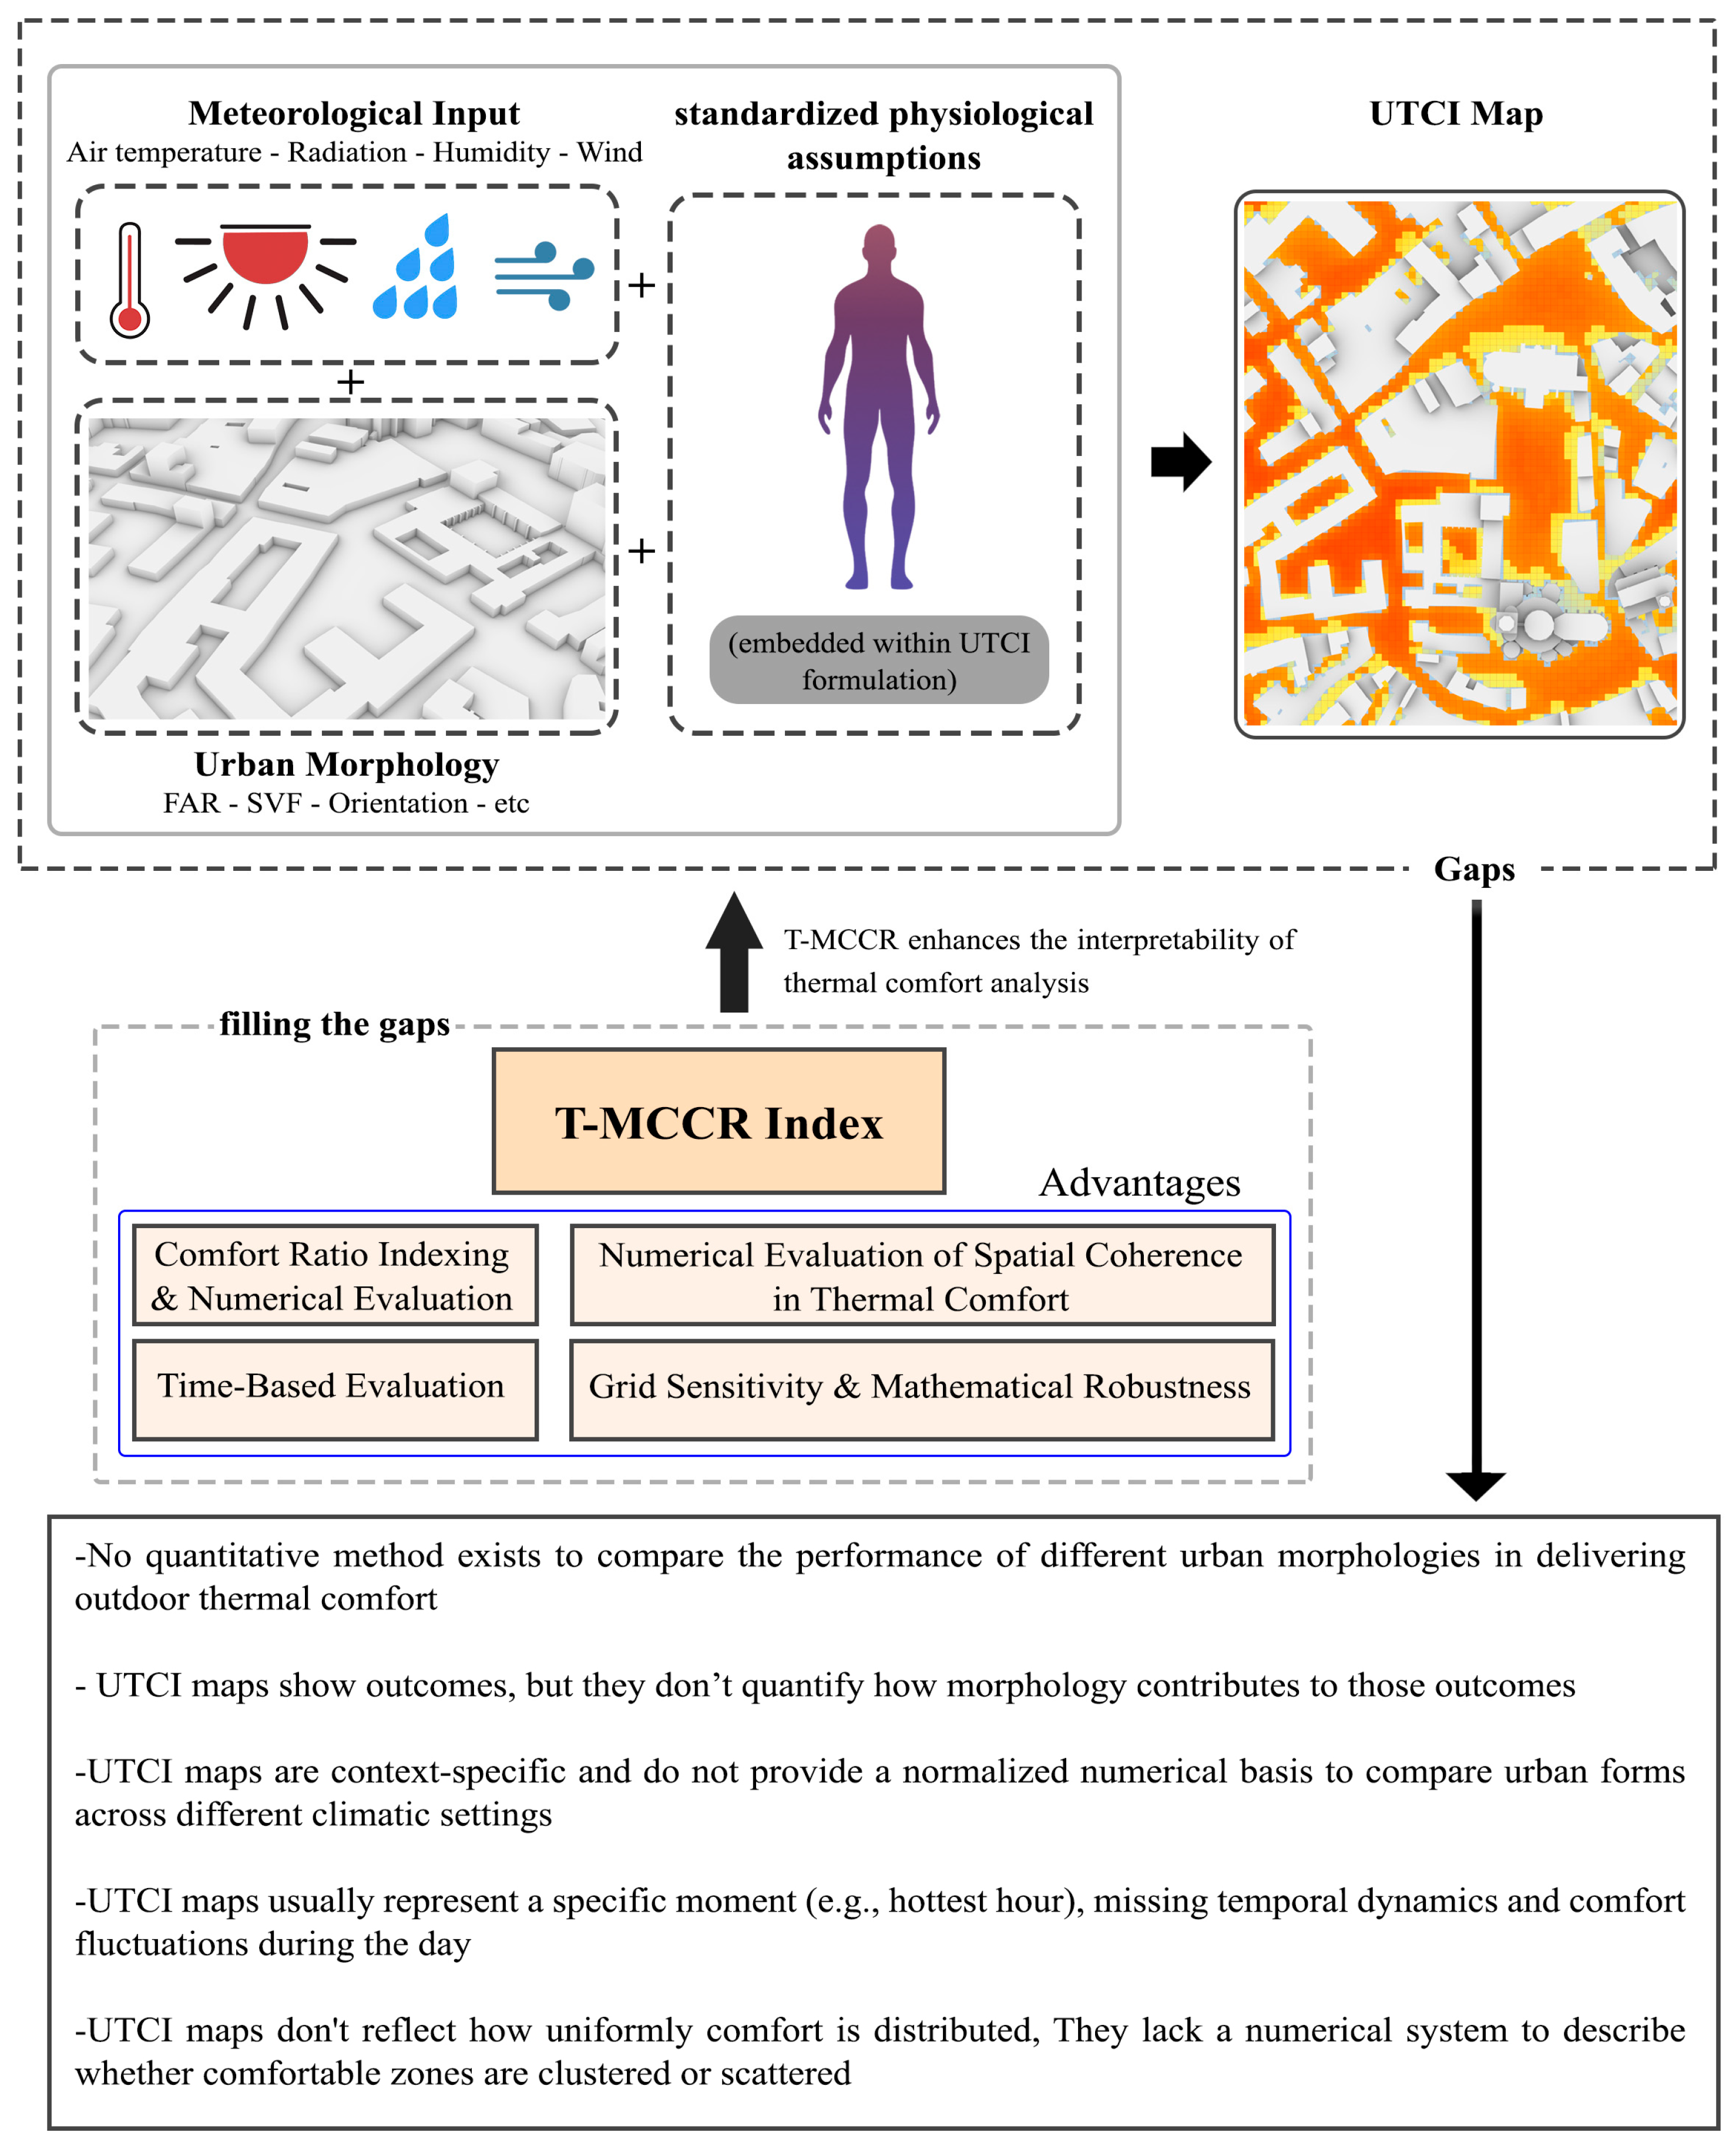
The proposed T-MCCR framework is designed to support a performance-oriented assessment of urban morphology in relation to outdoor thermal comfort. In this context, the following conceptual and methodological contributions are addressed (Figure 3):
  • Performance-oriented morphological assessment: The T-MCCR framework enables a performance-based evaluation of urban morphologies by comparing their ability to provide and maintain outdoor thermal comfort over time, moving beyond approaches that focus solely on climatic indicators.
  • Compatibility with design-oriented workflows: The scalar and numerical formulation of the index allows for its integration into design and analysis workflows, including performance-based evaluation, optimization processes, and scenario-driven urban planning.
  • Scalability across spatial and climatic contexts: Due to its relative formulation, the T-MCCR can be applied across different spatial scales, from individual urban parcels to district-level configurations, and under both current and future climate scenarios.
  • Linking computational analysis with urban design application: By providing an interpretable and transferable metric, the framework supports the translation of computational thermal comfort assessments into urban design and planning contexts.

2.2. Climate Scenarios

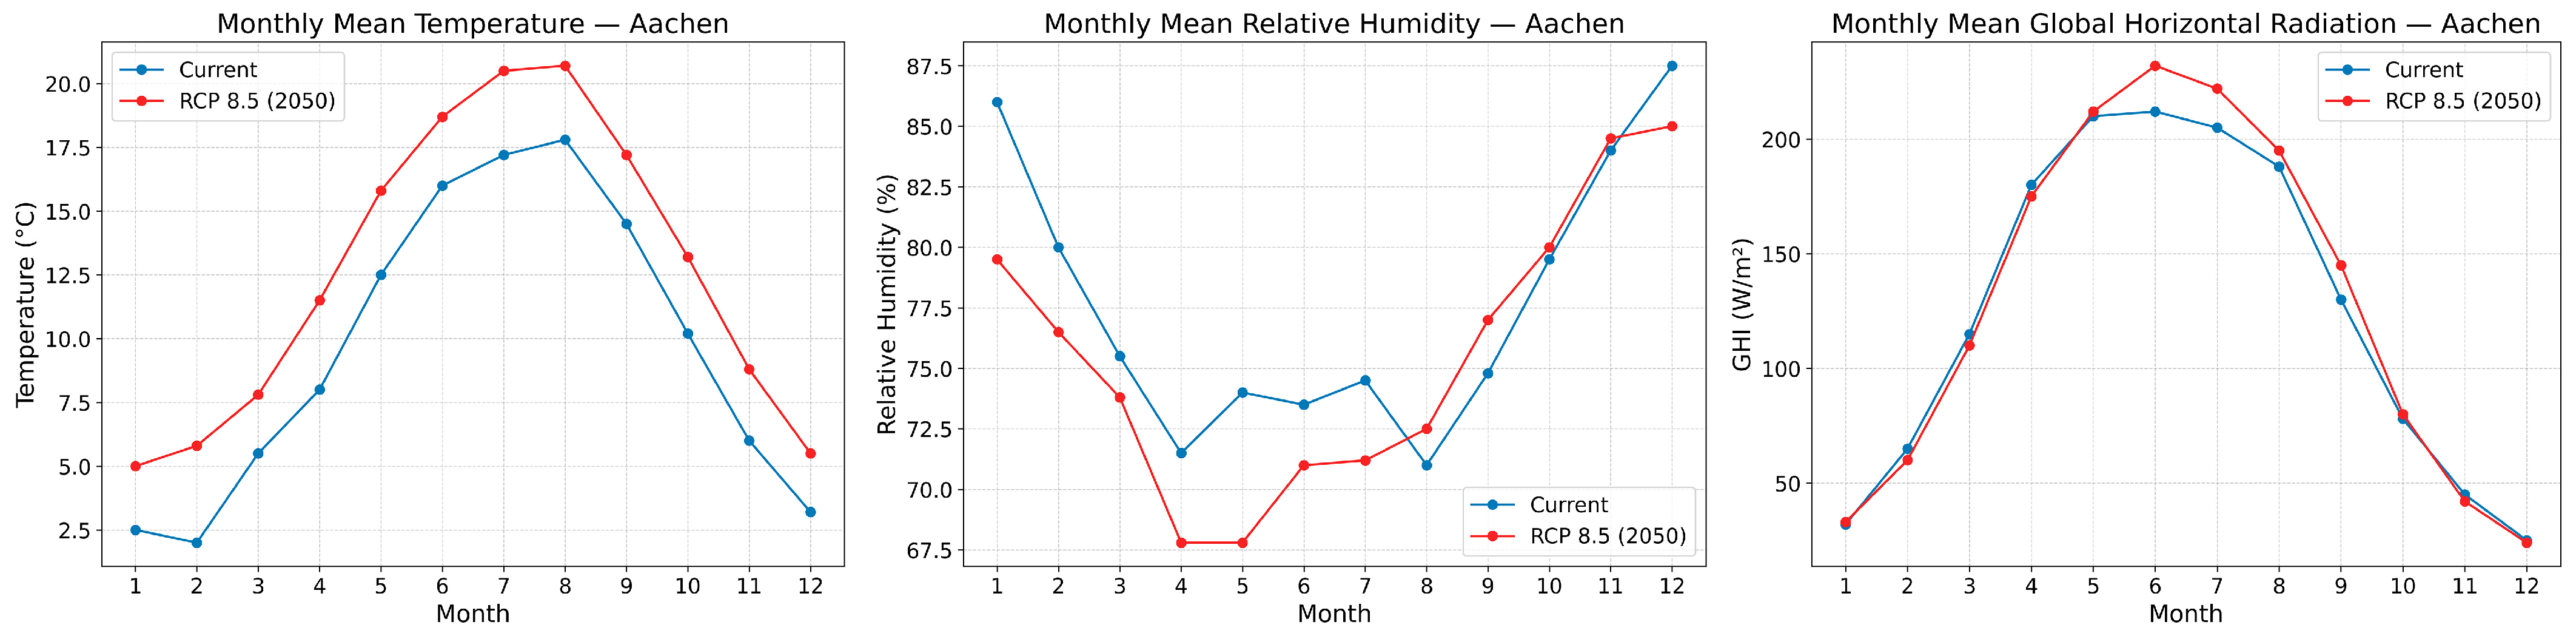
Accurate climatic data (Figure 4) is significant for assessing urban thermal comfort, especially when using dynamic indices like the T-MCCR, which depends on hourly UTCI values. Since the UTCI is highly sensitive to air temperature, humidity, wind speed, and solar radiation, even minor variations in these inputs can significantly affect the spatial and temporal distribution of comfortable zones. To explore the impact of climate change on the thermal performance of different urban morphologies, this study compares two standard EPW datasets: one representing current climate conditions and another reflecting the RCP 8.5 scenario projected for 2050. Daily patterns of key climatic variables on the hottest day of the year are analyzed across both scenarios, providing insights into seasonal shifts and their implications for urban thermal comfort.

2.3. Grid Sensitivity

The GCI is a standardized approach for quantifying numerical uncertainty related to mesh resolution in computational modeling. It enables researchers to systematically evaluate whether simulation outputs become stable and independent of grid size as the mesh is refined [30]. Recent studies in environmental modeling have applied the GCI to ensure the reliability and consistency of results across multiple spatial resolutions [31,32].
This approach is particularly relevant in grid-based simulations such as CFD and urban microclimate modeling, where spatial discretization directly affects output accuracy. When refining computational grids, it is essential to confirm that the solution achieves numerical convergence, meaning that further reductions in grid size do not significantly affect key output variables [30]. In this context, a mesh convergence study, often summarized through the GCI, provides a quantitative measure of discretization error and marks the point at which simulation results become grid-independent [33]. GCI analysis is recognized as a necessary validation step in such domains, since ignoring grid sensitivity can introduce subtle errors and weaken trust in the findings. By demonstrating that grid refinement beyond a certain threshold yields negligible changes in the results, researchers can establish model reliability while avoiding unnecessary computational expense [34,35].
In GCI analysis, the first step is to estimate the observed order of accuracy (p), which assesses whether simulation results become more stable as the computational grid is refined [31]. This step helps to determine if the numerical solution consistently improves as the mesh becomes finer, and whether further refinement still contributes meaningfully to result accuracy. In CFD and urban-scale modeling, accurate estimation of (p) is critical for quantifying convergence behavior and avoiding misleading interpretations of discretization error [32,36].
p = 2 f 3 f 1 f 2 f I n I n ( r )
where
  • 1f, 2f, and 3f are the simulation outputs for fine, medium, and coarse grids, respectively.
  • r is the uniform refinement ratio between grids, such as 2.
Once the observed order of accuracy (p) has been estimated, the next step in GCI analysis is to quantify the discretization error between two grid levels using the GCI [30,37,38].
This index expresses the relative difference between solutions on successive grids and reflects the level of uncertainty due to grid discretization [30].
G C I 12 = 1 r p 1   . f 2 f 1 f 1 . f s
  • GCI12 is the Grid Convergence Index between fine (grid 1) and medium (grid 2) grids.
  • f1 results from the finer grid.
  • f2 results from the medium grid.
  • r is the grid refinement ratio.
  • P is the observed order accuracy (from step 1).
  • fs is the safety factor (typically 1.25 for consistent meshes).
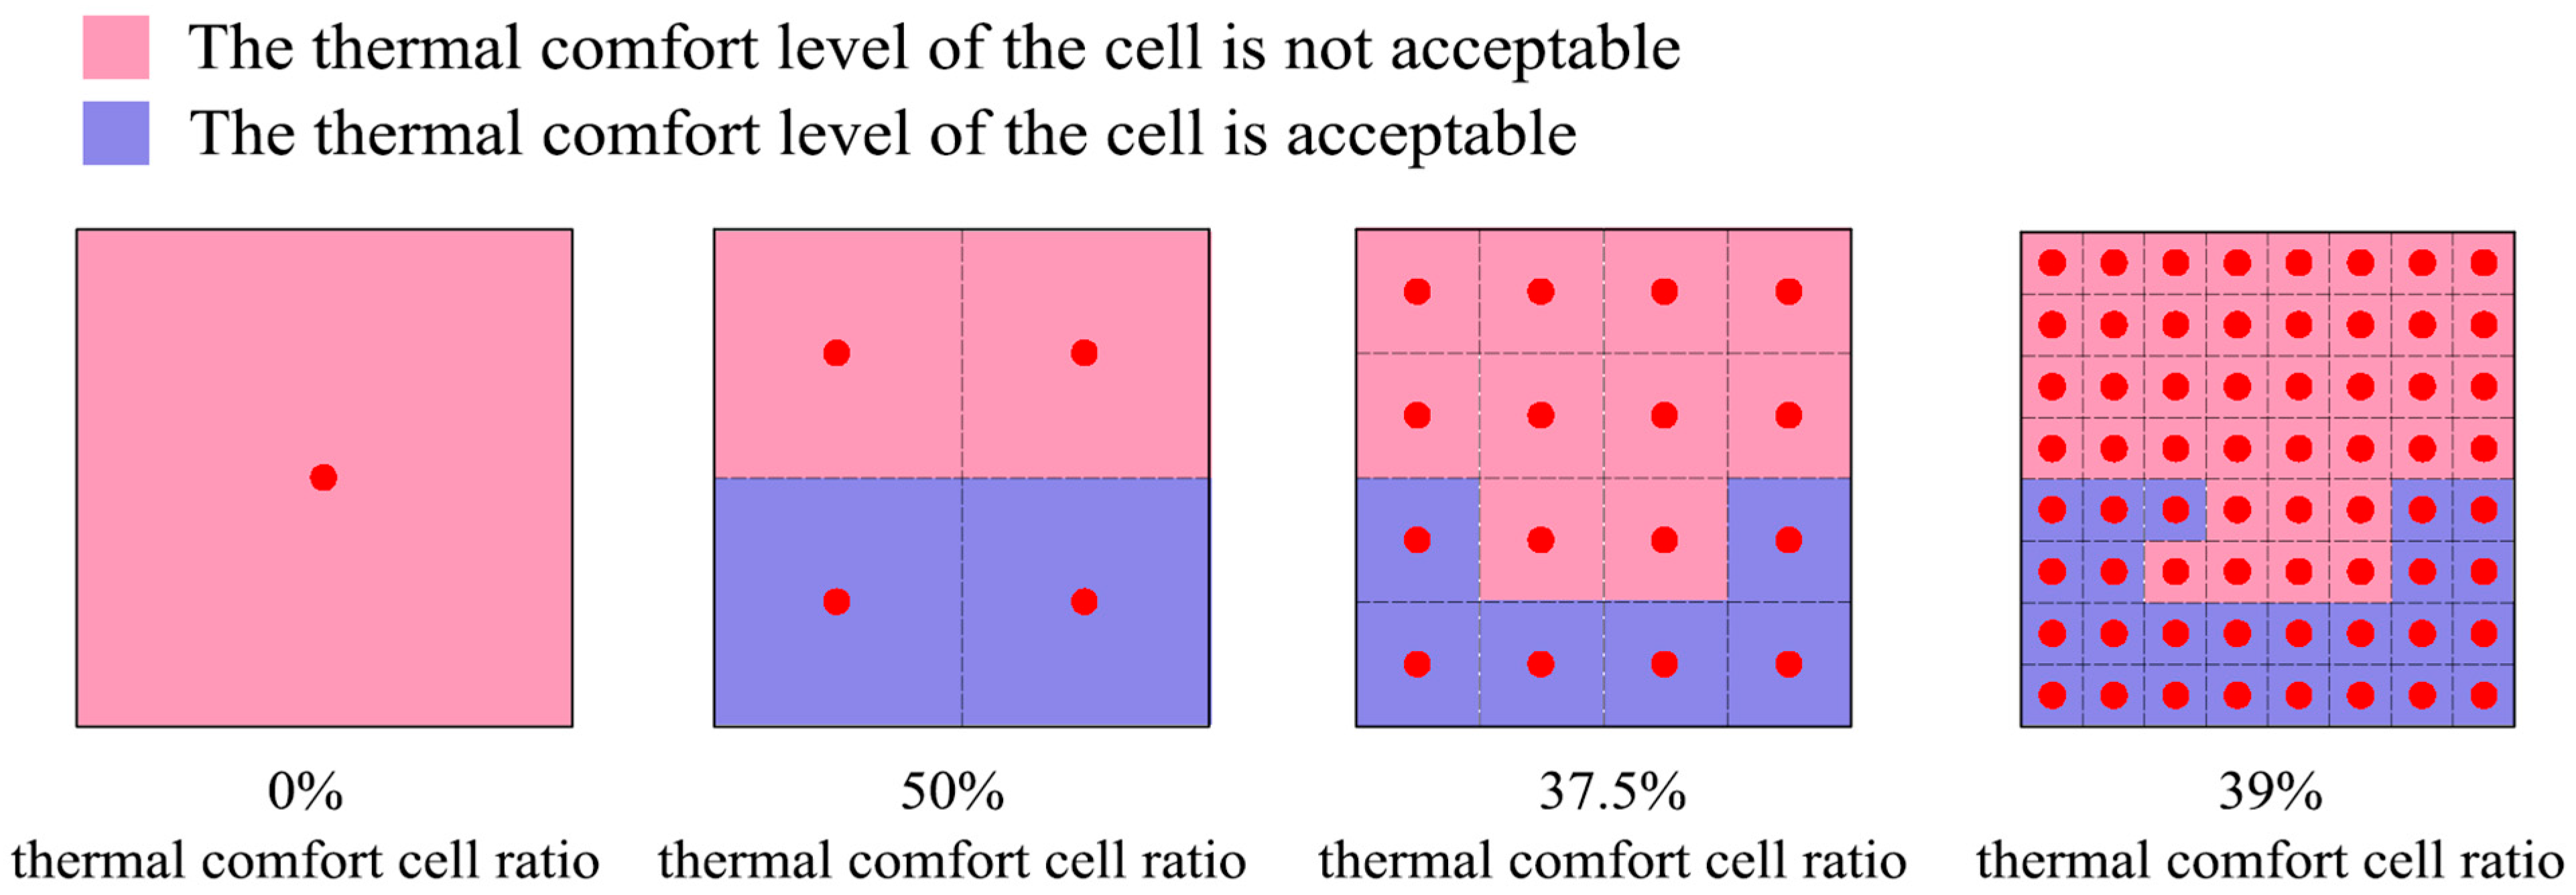
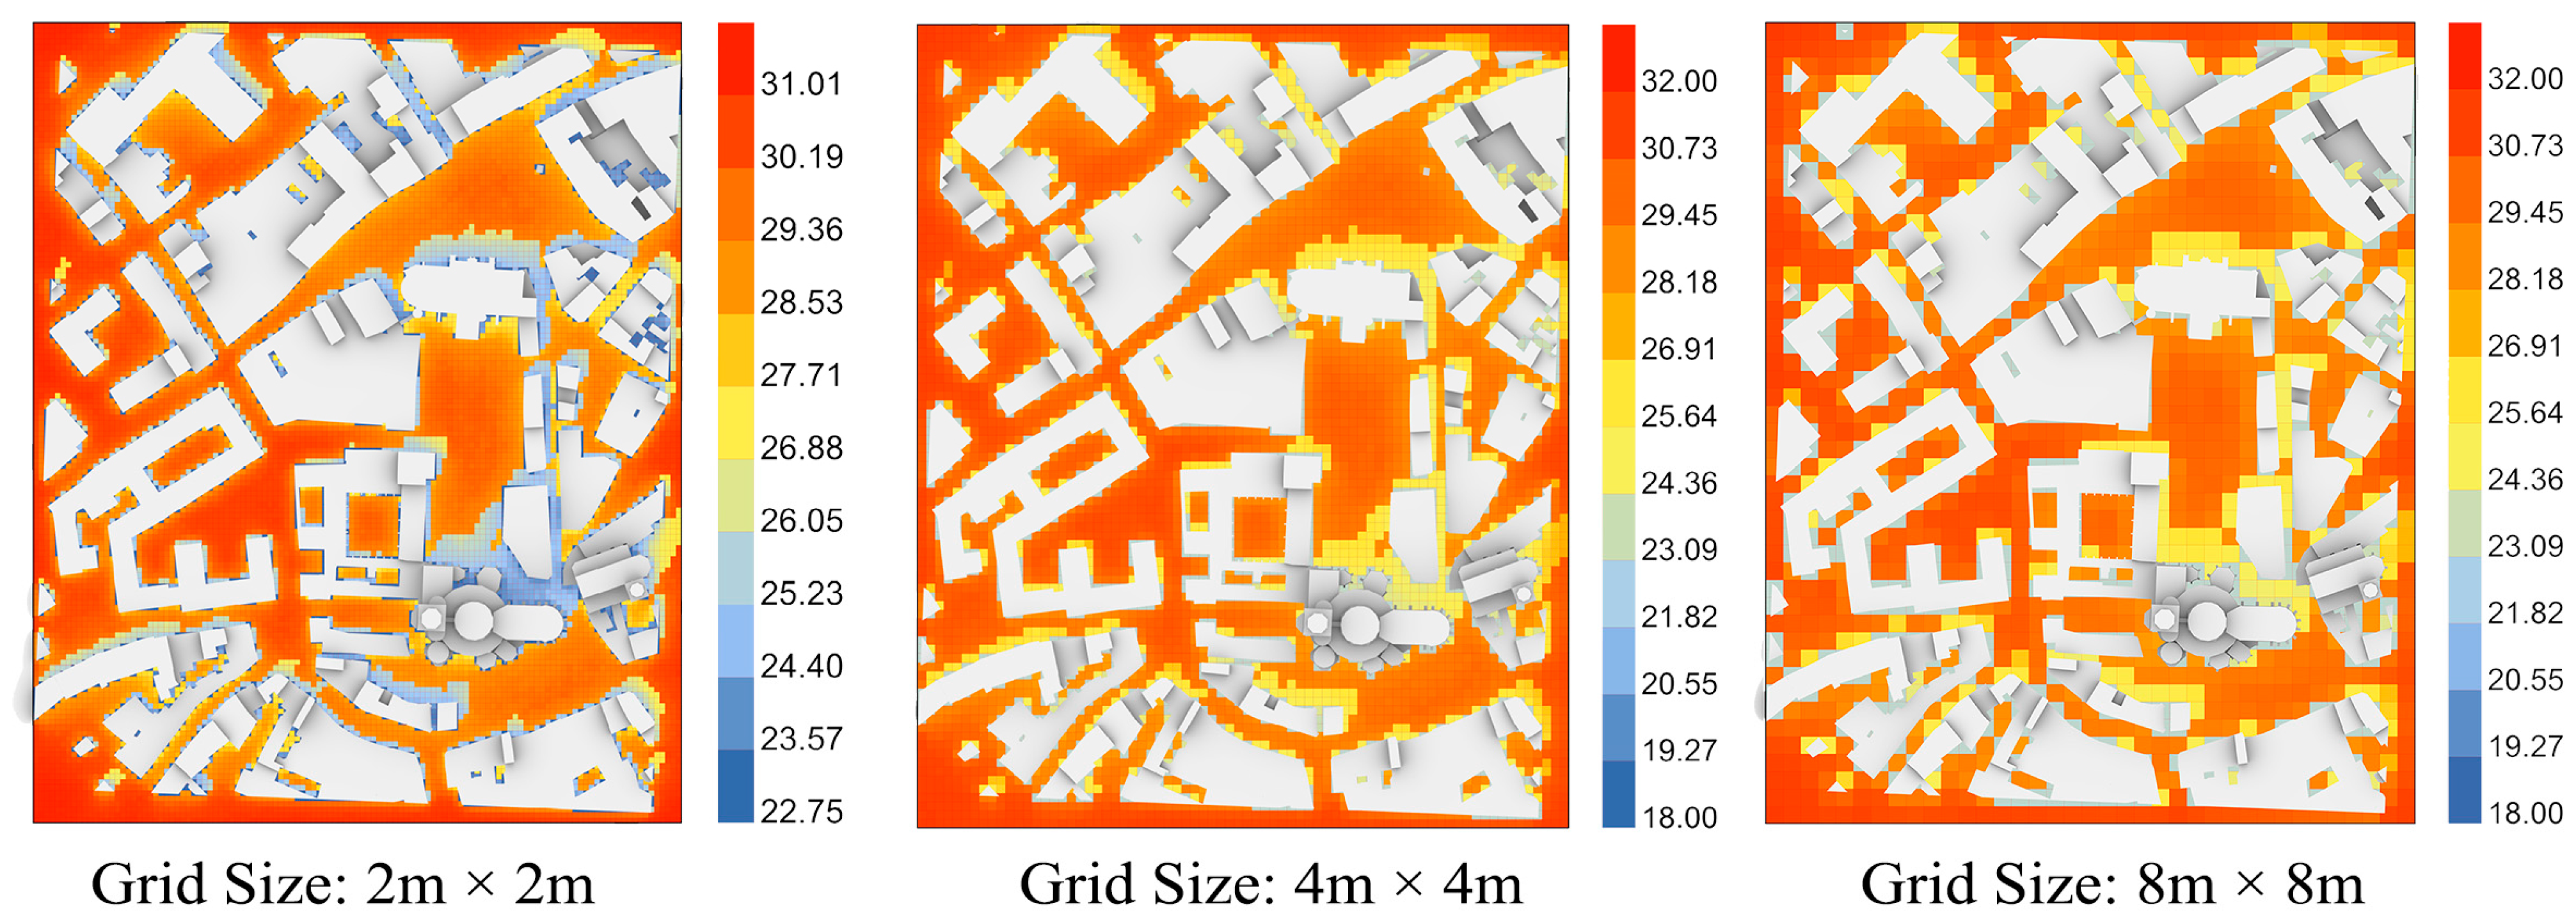
Once the GCI values between grid levels have been computed, the final step is to assess whether the simulation results have reached grid independence. Grid independence implies that further refinement of the mesh does not lead to meaningful changes in simulation outputs. This condition is essential for ensuring that the model results are not artifacts of spatial discretization. A GCI value below 1%, with a consistent observed order of accuracy (p), typically indicates numerical convergence [30]. In the present study (Figure 5, Figure 6 and Figure 7), thermal comfort conditions were evaluated using the UTCI across three mesh resolutions: 8 m, 4 m, and 2 m. The analysis revealed a substantial shift in the proportion of thermally comfortable parcels when refining the grid from 8m to 4m. However, further refinement from 4m to 2m resulted in no appreciable difference in the outcome, suggesting that grid convergence had been achieved at the 4 m resolution.
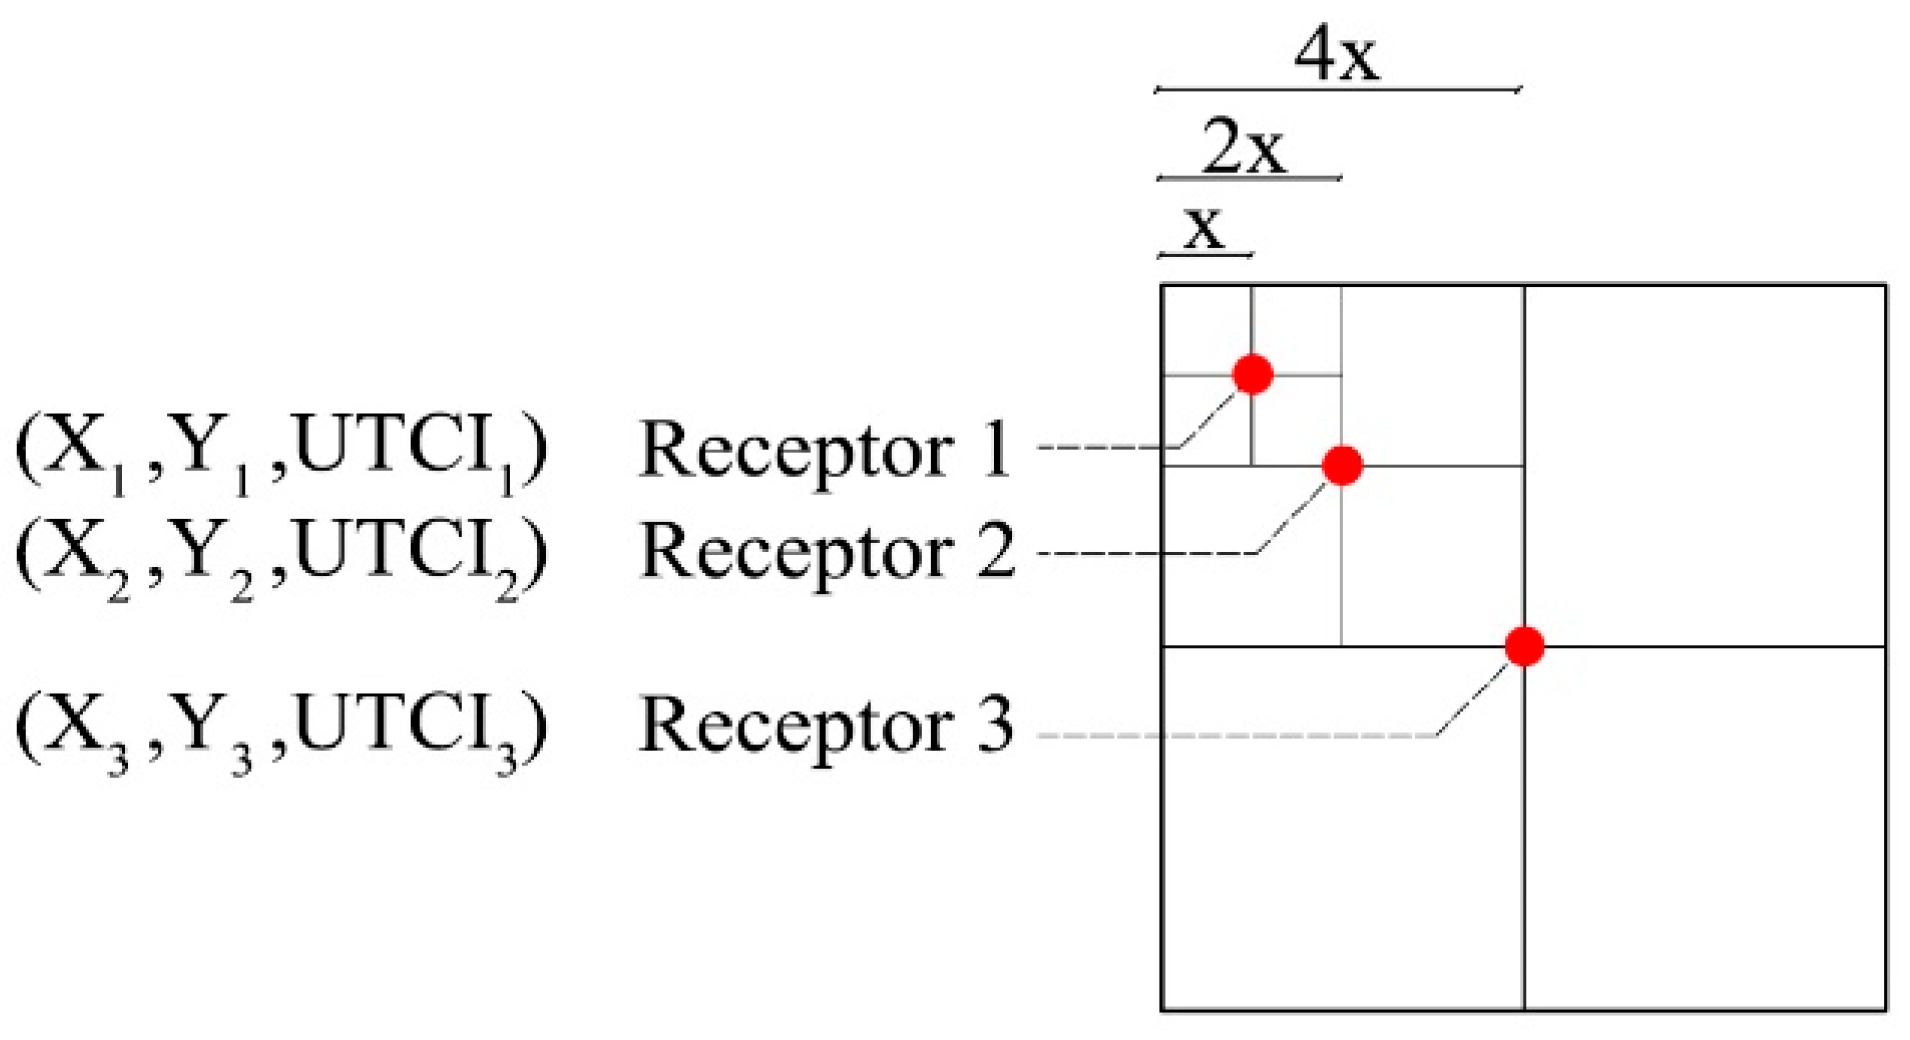
In this context, each parcel within the grid is treated as a spatial unit whose center acts as a receptor, reporting the UTCI value of that parcel. As the grid resolution becomes finer, the number of parcels, and thus receptors, increases, enhancing spatial precision. Yet, the key criterion in assessing numerical stability is not the absolute count of thermally comfortable parcels but the relative ratio of such parcels to the total number of parcels. When this ratio stabilizes across successive grid refinements, it reflects that further mesh refinement does not affect the overall assessment of thermal comfort. According to the Grid Convergence Index (GCI) framework, this behavior confirms grid independence, validating the selected grid size as both computationally efficient and numerically robust.
In this study, the cell centers of the computational grid are considered receptors (Figure 5) for extracting thermal information. Each receptor includes precise spatial coordinates (x and y), the value of the UTCI at that point, and the cell size as a measure of the spatial resolution of the mesh. As the grid refinement level changes, both the receptor location and cell size vary, resulting in differences in the reported UTCI values (Figure 6 and Figure 7). This highlights the importance of selecting an appropriate mesh size and numerical accuracy in thermal comfort analyses.
By implementing the Grid Convergence Index (GCI), the percentage change in the ratio of comfort grids to total grids between the 8 m × 8 m and 4 m× 4 m networks was found to be 3%.
A reliable grid size can be determined by evaluating the percentage change in the ratio of comfort grids to total grids; a change of less than 1% between the 4 m × 4 m and 2 m × 2 m networks indicates that the 4 m × 4 m grid provides sufficient spatial resolution.

2.4. T-MCCR

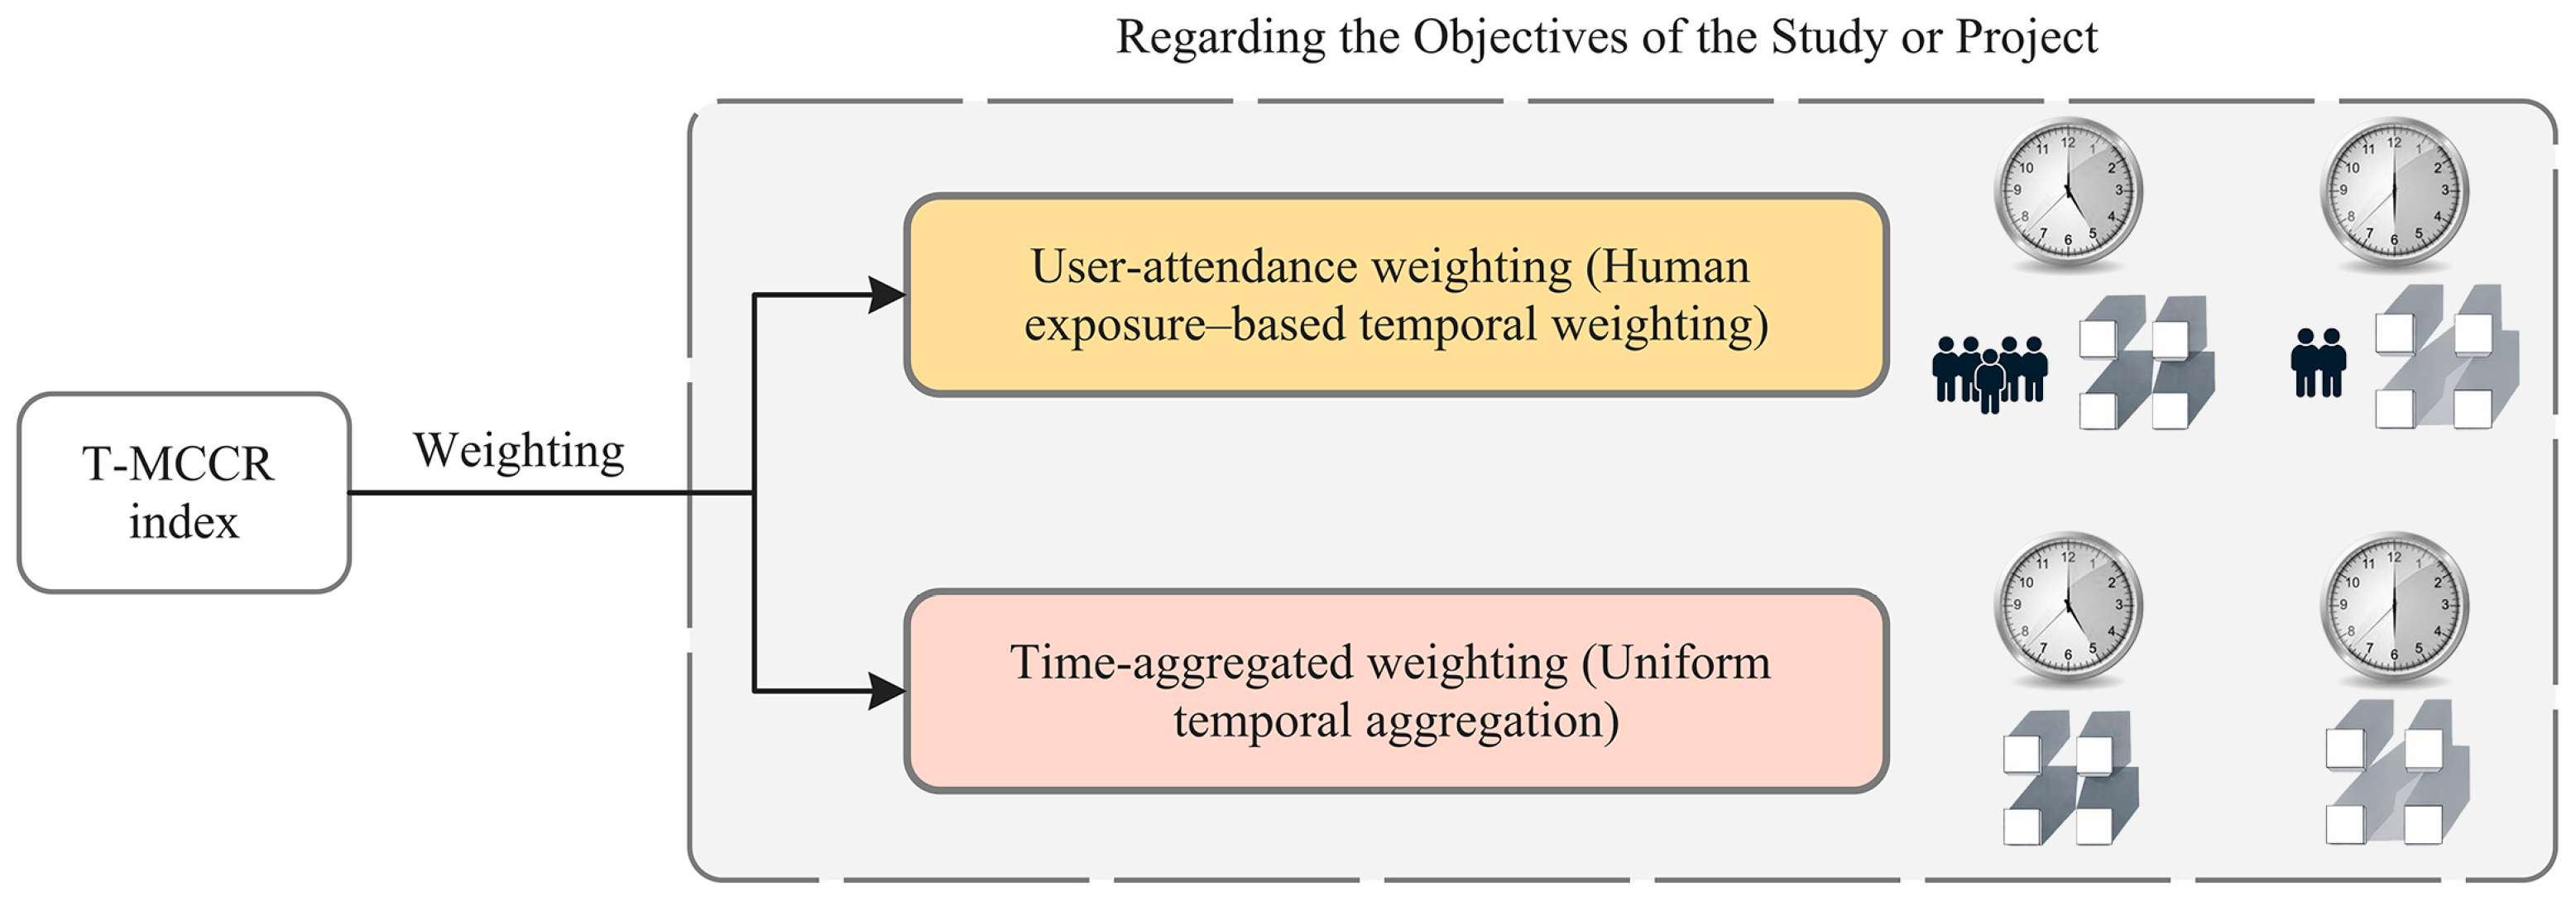
Based on the specific objectives and research scope, temporal weighting may be applied using one of the following approaches (Figure 8), or by combining and comparing them within a single analytical framework.
(1)
Time-aggregated weighting (uniform):
All time steps are assigned equal weight, and temporal differentiation arises implicitly from the hourly variation in thermal comfort conditions (UTCI) (Equation (3)). This approach preserves a morphology-driven evaluation while avoiding additional complexity related to user behavior or land-use patterns.
T M C C R = N C o m f o r t , t N t o t a l t = 1 T 1 T
where
  • Ncomfort,t = t number of parcels (or pixels) within the thermal comfort range at time.
  • Ntotal = Total number of valid parcels.
  • T = Total number of time steps (e.g., hours).
(2)
User-attendance weighting (exposure-based):
Temporal weights are assigned according to the intensity or probability of human presence, such that hours with higher occupancy contribute more strongly to the index. This interpretation incorporates land use, activity patterns, and accessibility alongside morphology, enabling a human-exposure-oriented assessment of thermal comfort.
In this case, we have:
T M C C R = t = 1 T W t   C t
where
  • Wt = P t 1 t P t and W t t = 1 t = 1 , 0 ≤ Wt ≤ 1
  • Ct represents the comfort ratio at time step t , as defined in Equation (3).

2.5. Applying Entropy as Guidance

If 0 < N C o m f o r t , t N t o t a l < 1, EWD can be calculated and used as a guideline for decision-making.
If N C o m f o r t , t N t o t a l = 0 or 1, EWD is 0.
  • Entropy Weighted by Distance (EWD)
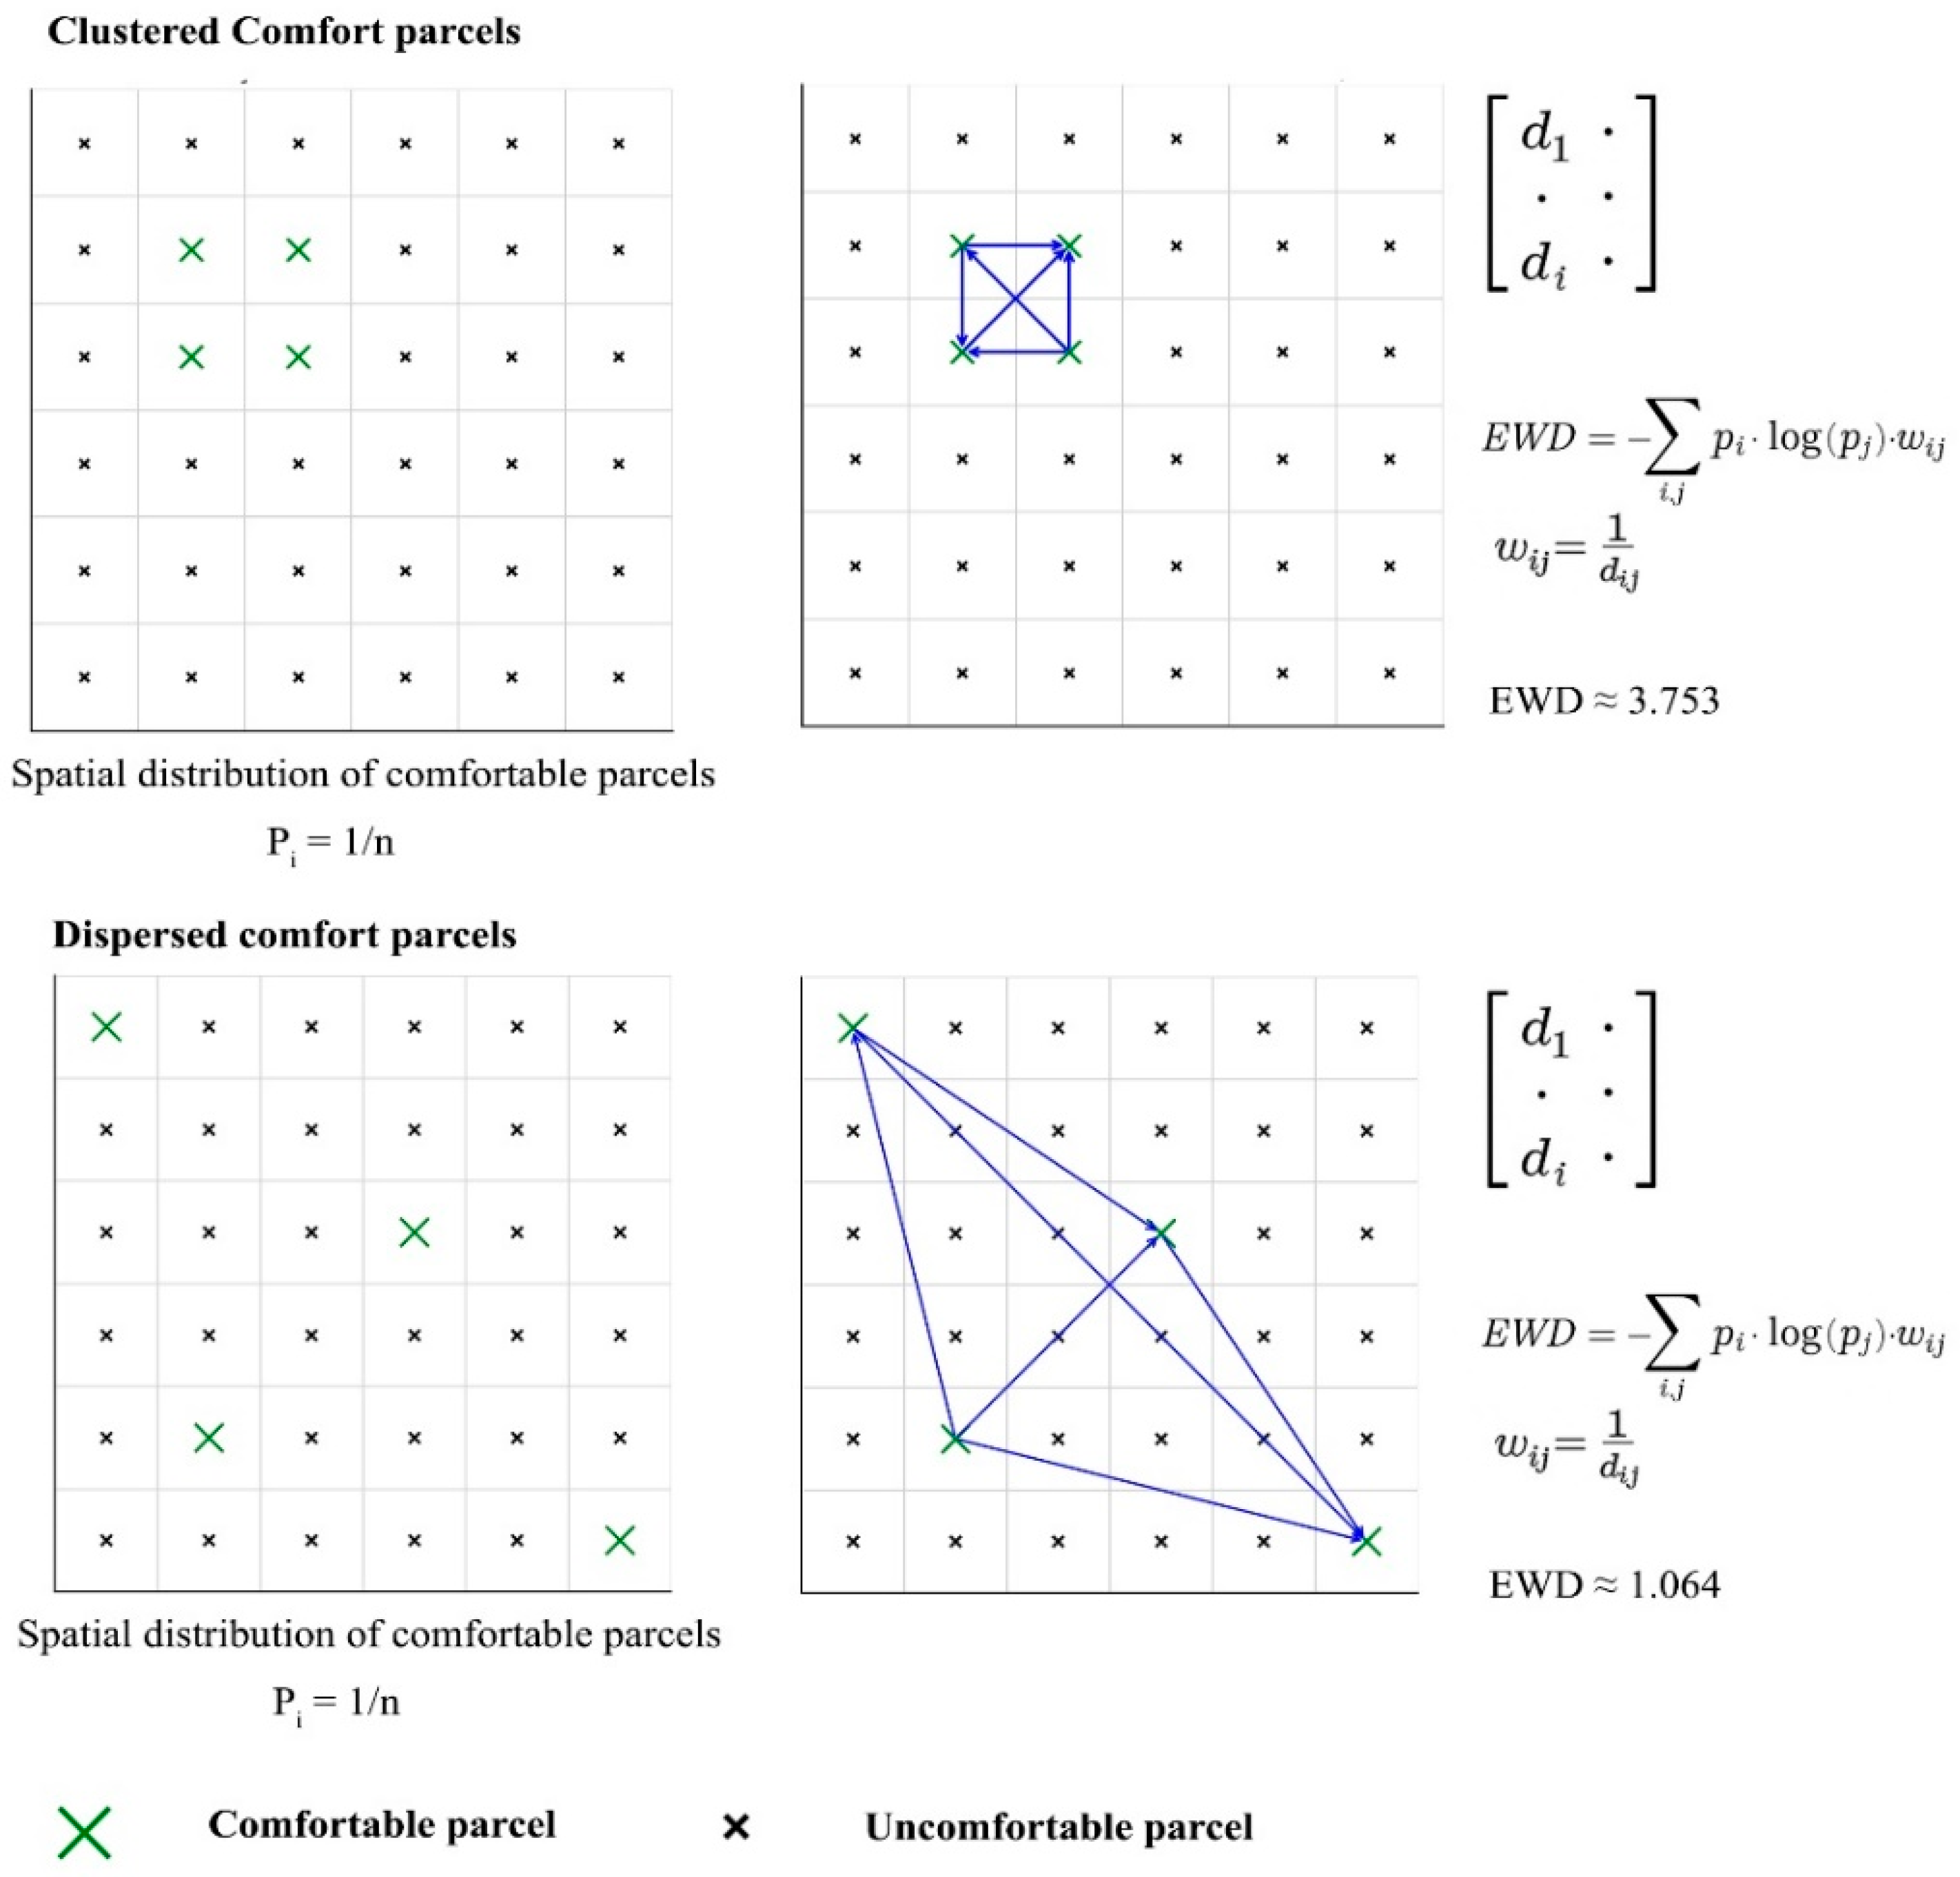
Understanding not just the quantity but the spatial distribution of climate comfort is critical for evaluating the performance of urban morphologies. In cases where different configurations produce the same overall ratio of comfortable parcels (Figure 6), such as a centralized courtyard versus dispersed detached buildings, the qualitative experience and spatial logic of comfort can differ dramatically. Traditional comfort indices fail to capture this spatial nuance. The EWD metric addresses this gap by integrating both the probabilistic distribution of comfort (entropy) and the spatial arrangement of comfort zones (distance). This makes it possible to distinguish between morphologies that may have identical comfort ratios but fundamentally different spatial patterns, allowing for more meaningful comparative evaluations and supporting urban design strategies that prioritize not just thermal performance but also its spatial coherence and accessibility.
Entropy is a well-established metric in spatial analysis for quantifying the degree of disorder, or dispersion in the spatial distribution of phenomena, originally rooted in information theory. It has been adapted to urban studies as a way to assess the complexity of and variability in built environments and land-use patterns [39,40]. In urban morphology, higher entropy values typically indicate more spatially dispersed or fragmented configurations, whereas lower values reflect clustering or regularity in spatial arrangements [39,41,42]. This approach has been applied in various fields such as thermal comfort mapping, land-use diversity analysis, and spatial equity assessments, offering a robust framework to interpret spatial patterns beyond mere counts or densities [43,44,45]. Additionally, research on urban heat storage cycles has shown that entropy measures can effectively characterize thermal behavior complexity, enhancing the understanding of urban microclimate dynamics [46].
While classical Shannon entropy quantifies the statistical uncertainty or heterogeneity of a spatial distribution, it does not account for the spatial relationships among the entities under study [47]. To address this, the EWD formulation introduces a spatial weighting factor based on pairwise distances between spatial units (in this case, thermally comfortable parcels) [48,49,50].
In this study, spatial entropy is employed as a complementary metric to the T-MCCR, enhancing the assessment of how thermally comfortable parcels are spatially arranged. While the T-MCCR captures the extent and persistence of comfort across morphologies, entropy highlights variations in spatial organization, distinguishing between clustered and dispersed comfort patterns. This is especially important when different urban forms show the same comfort ratios but differ in terms of their spatial distribution.
By accounting for the relative positions of comfort zones, EWD offers a spatially explicit measure that differentiates between statistically similar yet morphologically distinct configurations. This enables a more nuanced interpretation of spatial performance, especially in scenario-based comparisons where aggregate comfort levels alone may obscure meaningful structural differences.
  • Step 1—Spatial Probability Distribution
Assume that n thermally comfortable parcels (grid cells) are identified within the study area. Each parcel is assigned an equal probability
p i = 1 n
n = grid cells that are thermally comfortable.
  • Step 2—Pairwise Distance Matrix
For each pair of thermally comfortable parcels i and j, the Euclidean distance is calculated based on their spatial coordinates
d i j = ( y j y i ) 2 + ( x j x i ) 2
  • dij = the distance between parcel i and parcel j.
  • Xi, Yj = the Cartesian coordinates of parcel i.
  • Xj, Yj = the Cartesian coordinates of parcel j.
  • Step 3—Entropy Weighted by Distance (EWD)
The EWD is computed by integrating both the spatial probabilities and the pairwise distances into a single entropy-based expression
E W D = i = 1 n j = 1 j i n p i . log ( p j ) w i j ,     w i j = 1 d i j
  • Normalization Method (Min–Max Scaling)
To enable a meaningful comparison across morphological alternatives with different spatial extents or comfort grid counts, the raw EWD values can be normalized using a min–max scaling approach. This technique rescales the EWD values to a standardized range between 0 and 1 [51]:
E W D n o r m , i = ( m i n E W D i E W D ) / ( m a x E W D i E W D )
  • EWDi = i is the unnormalized for the scenario.
  • EWDmin and EWDmax = The maximum and minimum EWD values observed across all scenarios.
In cases where the ratio of climate-comfortable cells to total cells is similar across scenarios, the EWD can be employed to better interpret the spatial distribution of comfort zones. In Figure 9, the proportion of comfortable cells is equal in both diagrams; however, the EWD values differ significantly, reflecting the distinct spatial arrangements, clustered versus dispersed, of those comfort zones.

2.6. UTCI Simulation Method

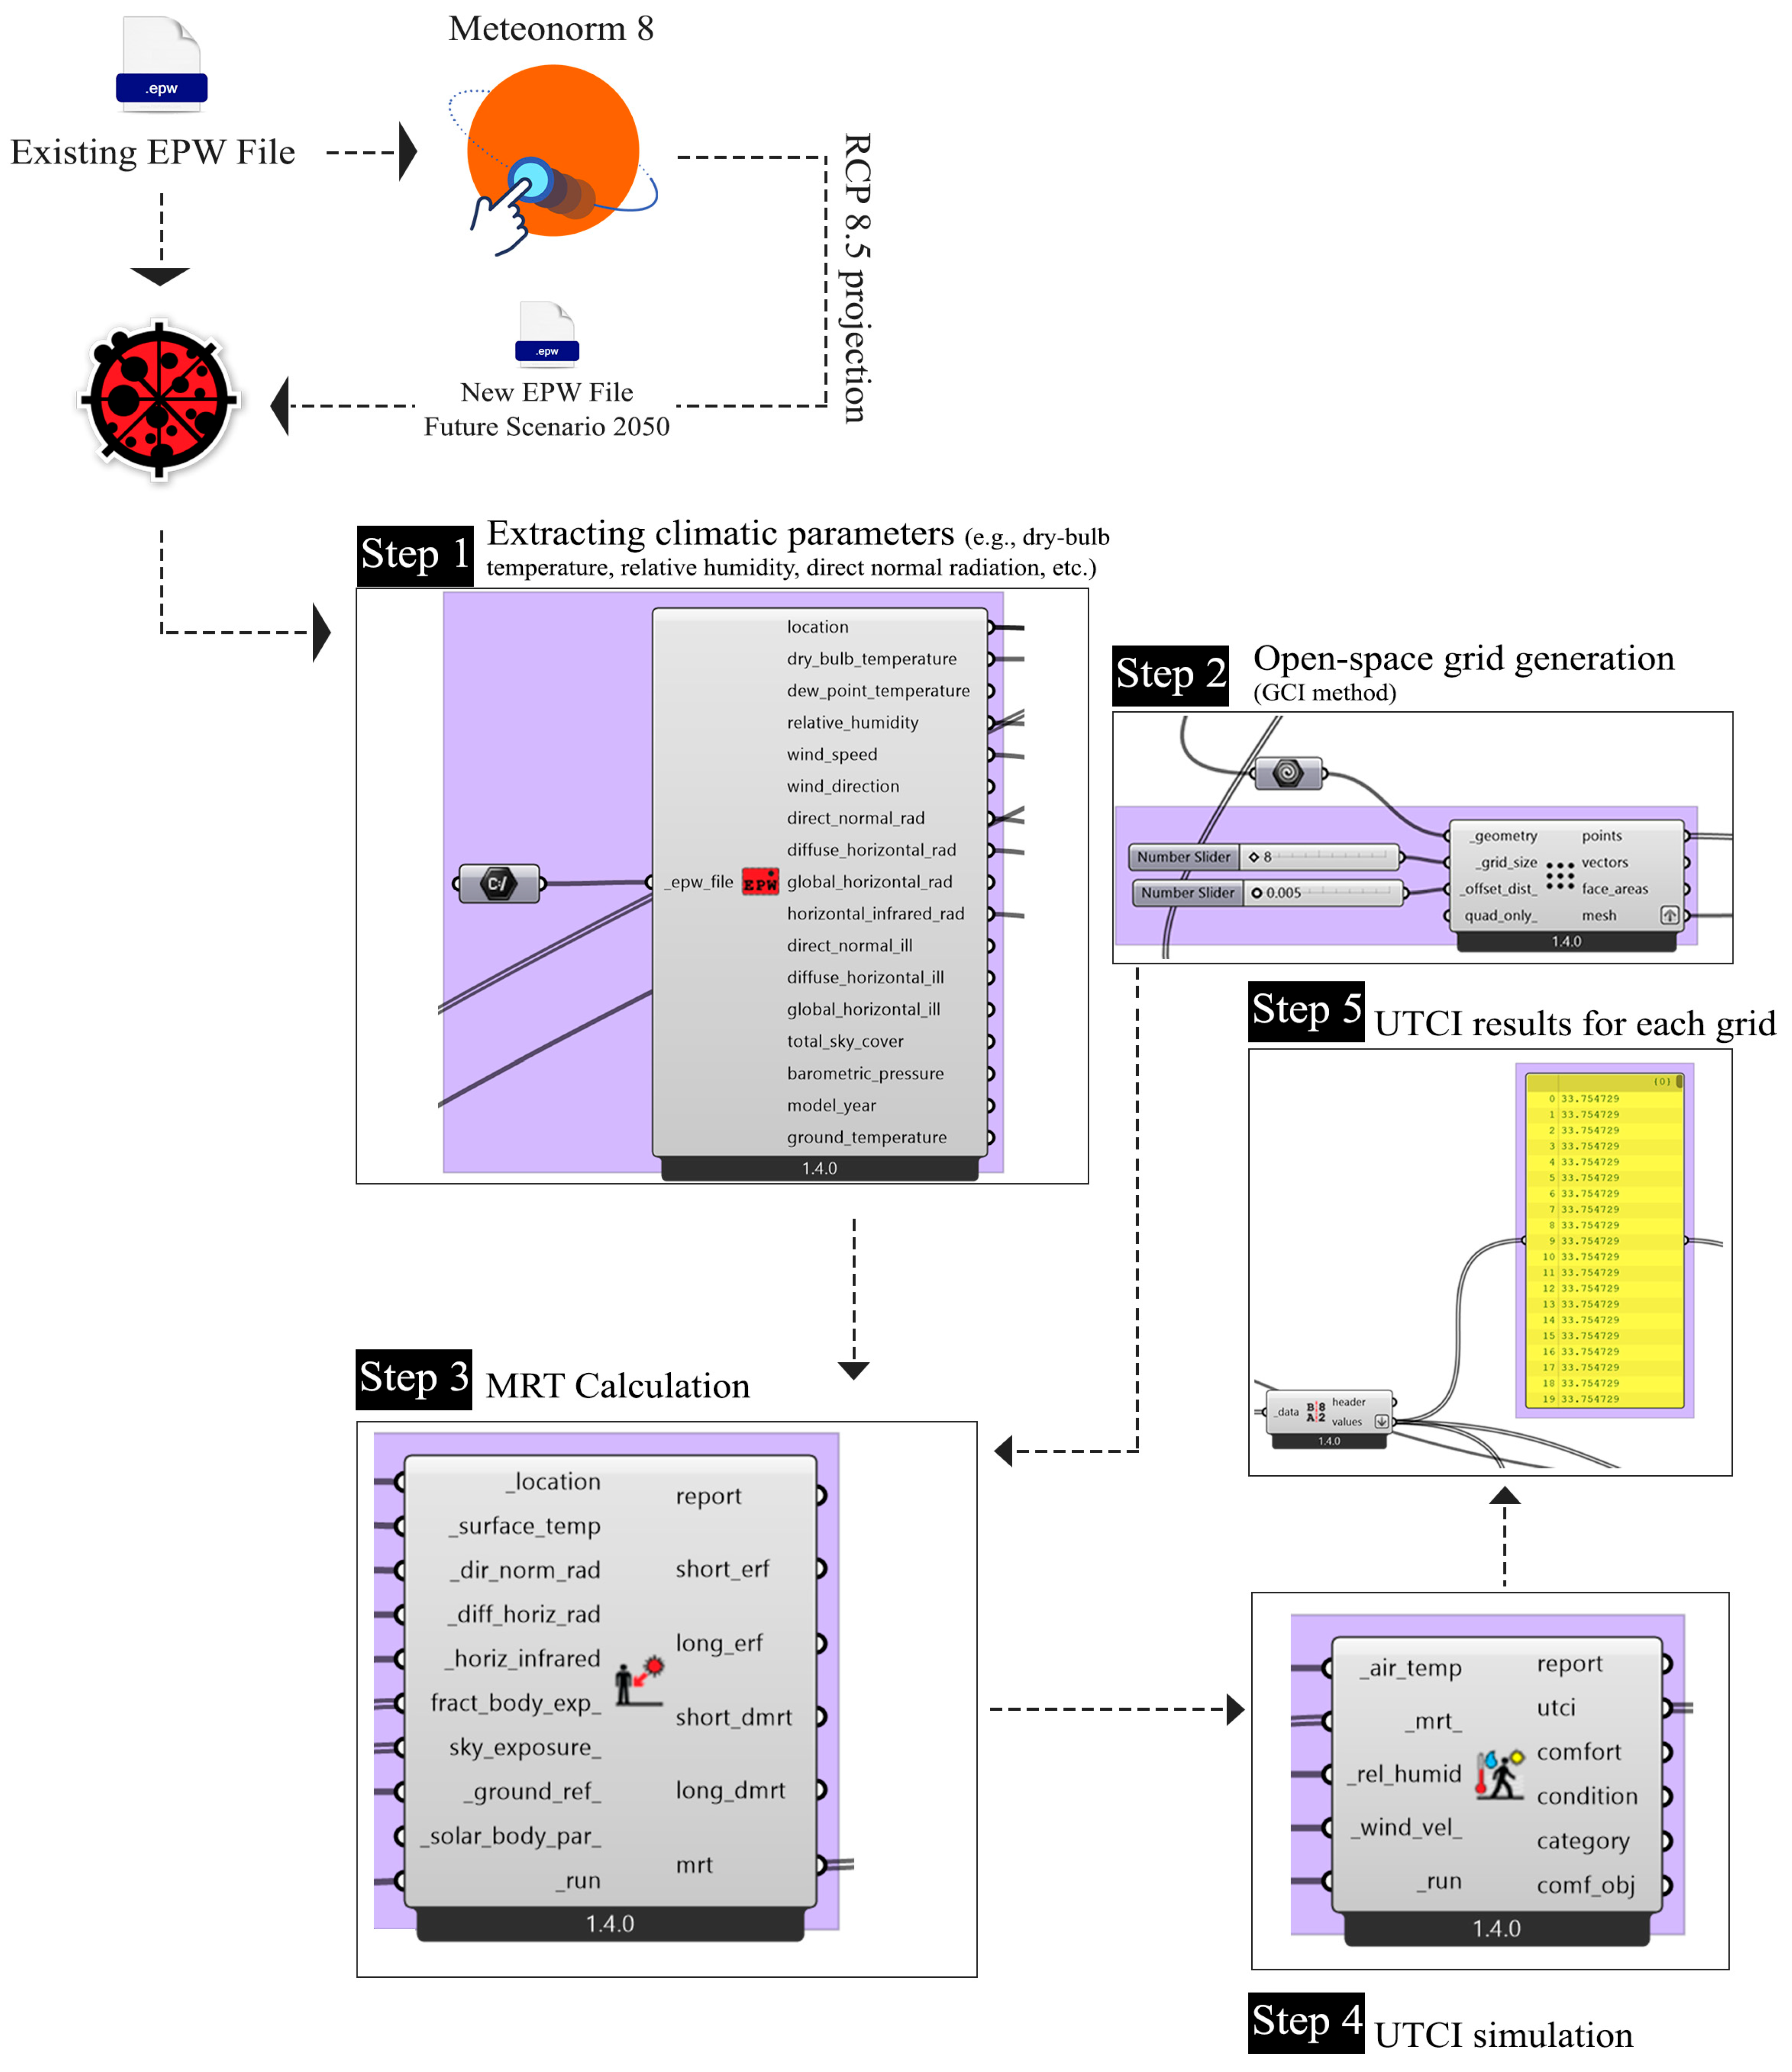
In this study, EPW weather files were used to represent both the baseline (current climate) and future climate change scenarios. While the existing EPW file was employed to characterize present-day conditions, future weather datasets were generated using Meteonorm 8 based on climate change projections under the RCP 8.5 scenario for the 2050 time horizon. Meteonorm applies a statistical weather morphing approach, in which long-term climate model projections are used to modify the baseline EPW file by adjusting temperature, humidity, wind, and solar radiation variables while preserving the original temporal structure of the weather data. The resulting future EPW files were then used to extract hourly climatic parameters required for microclimatic modeling. Subsequently, the open space was discretized into uniform grids with an optimal resolution determined using the Grid Convergence Index (GCI) method. For each grid cell, the Universal Thermal Climate Index (UTCI) was calculated (Figure 10) by integrating local microclimatic conditions, with particular emphasis on the Mean Radiant Temperature (MRT).
Mean Radiant Temperature (MRT) was calculated using the six-directional (six-flux) radiation model implemented in Ladybug Tools [52]. The computation follows ISO 7726 [53] and the German guideline VDI 3787 [54], where MRT is defined as the Stefan–Boltzmann equivalent temperature derived from the balance of shortwave and longwave radiation fluxes incident on the human body [55,56].
In this workflow, MRT accounts for shortwave radiation components, including direct normal solar radiation, diffuse horizontal sky radiation, and reflected shortwave radiation from surrounding ground and urban surfaces, as well as longwave radiation components, represented through horizontal infrared radiation and longwave emission from surrounding built surfaces [57].
Radiative exchanges are resolved within a six-directional framework (±X, ±Y, +Z, −Z), weighted by angular view factors consistent with ISO 7726. Three-dimensional urban geometry, sky exposure, ground reflectance, and shading conditions are therefore embedded in the MRT calculation, enabling spatial variability in radiant thermal conditions to be captured at the pedestrian level [56].
MRT values were obtained through simulation-based calculations at an hourly temporal resolution. Human exposure was represented by a reference point at pedestrian height (~1.5 m), adopting standard absorption and emissivity coefficients for the human body, as defined in ISO 7726 [53]. During nighttime hours, MRT is determined solely by longwave radiative exchanges [52].
The grid-based UTCI outputs provide a high-resolution spatial basis for the subsequent T-MCCR analysis.

3. Results

3.1. Pilot Case Study

Given that the T-MCCR index is theoretically weighted based on the degree of human presence and use of urban spaces, peak hours of urban activity can be expected to carry greater importance in the assessment of outdoor thermal comfort. However, in the present study, with the primary aim of introducing and validating the methodological framework and technical formulation of the index, the performance of the T-MCCR across all hours of the day and across different urban morphologies is assigned equal weight. It is acknowledged that, in real-world conditions, due to the continuous yet uneven pattern of urban space usage, particularly the dominance of daytime activities, nighttime hours generally exhibit lower practical relevance, even when they may offer more favorable thermal comfort conditions. As commonly adopted in the literature, the hottest days of the year are often analyzed as critical periods for better understanding urban thermal performance and for informing mitigation or resilience strategies. Accordingly, in this study, the T-MCCR index is evaluated on the hottest day of the year to demonstrate its ability to capture morphological differences in terms of outdoor thermal comfort provision.
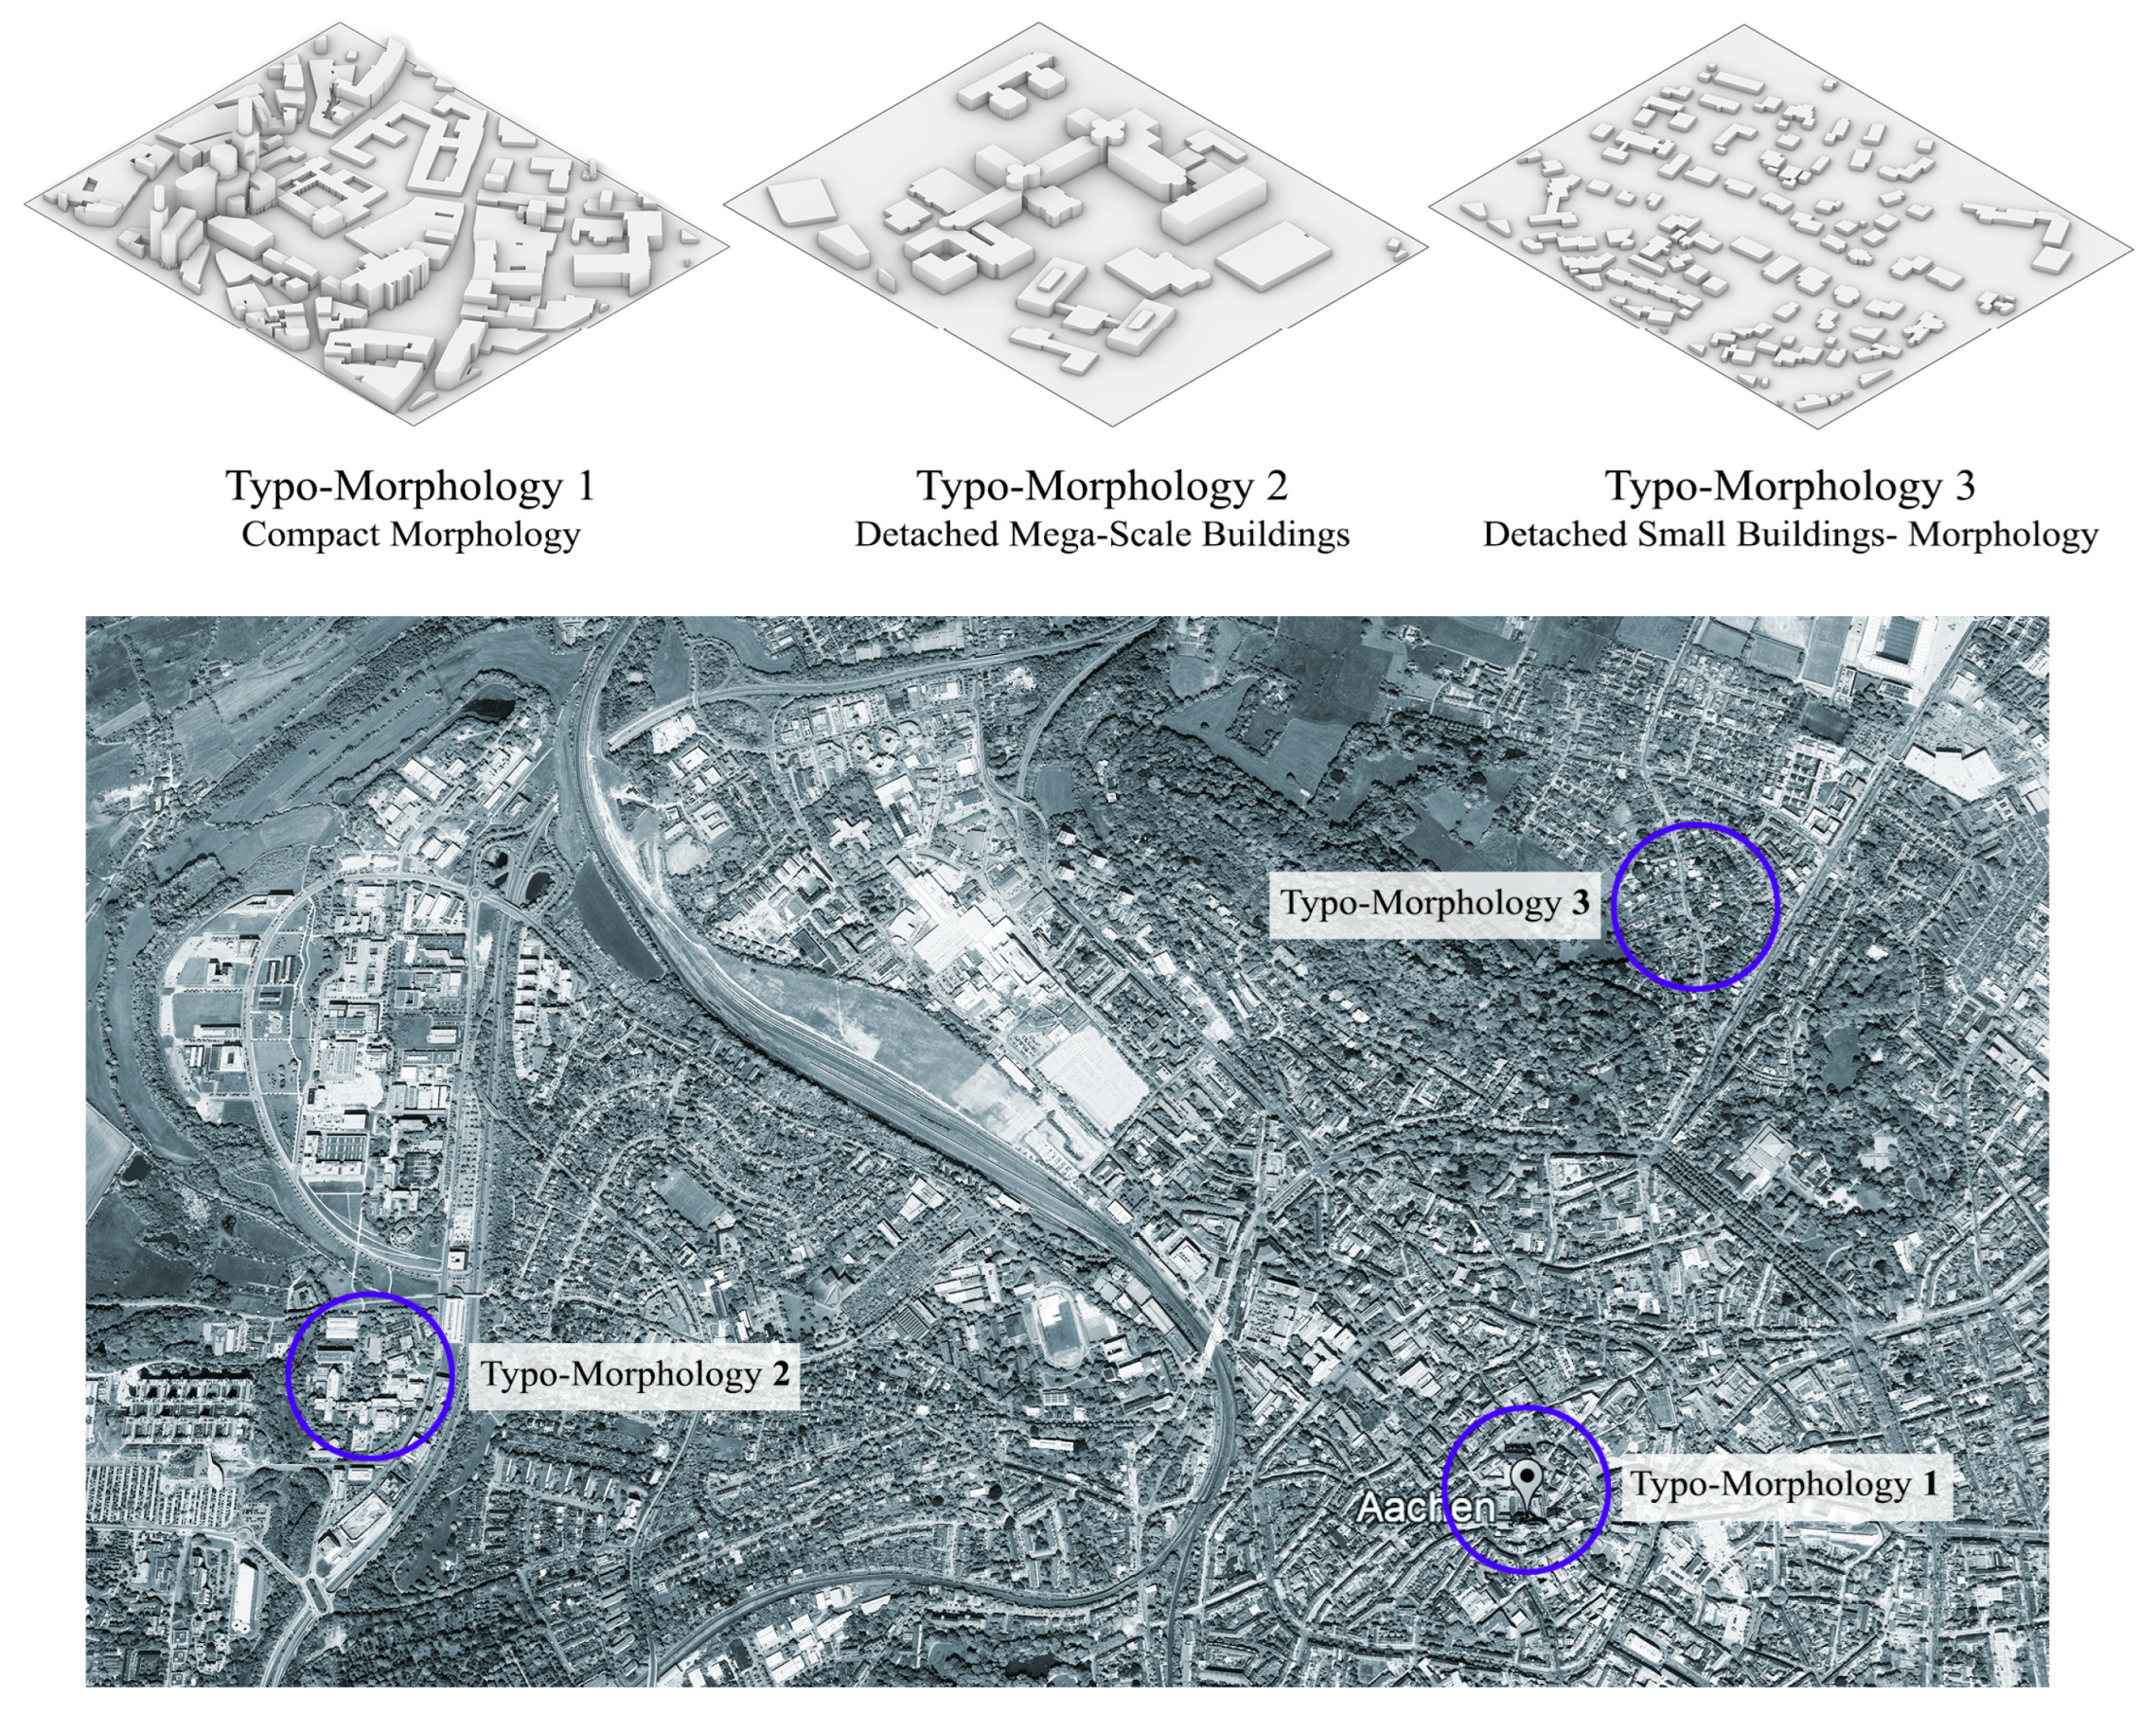
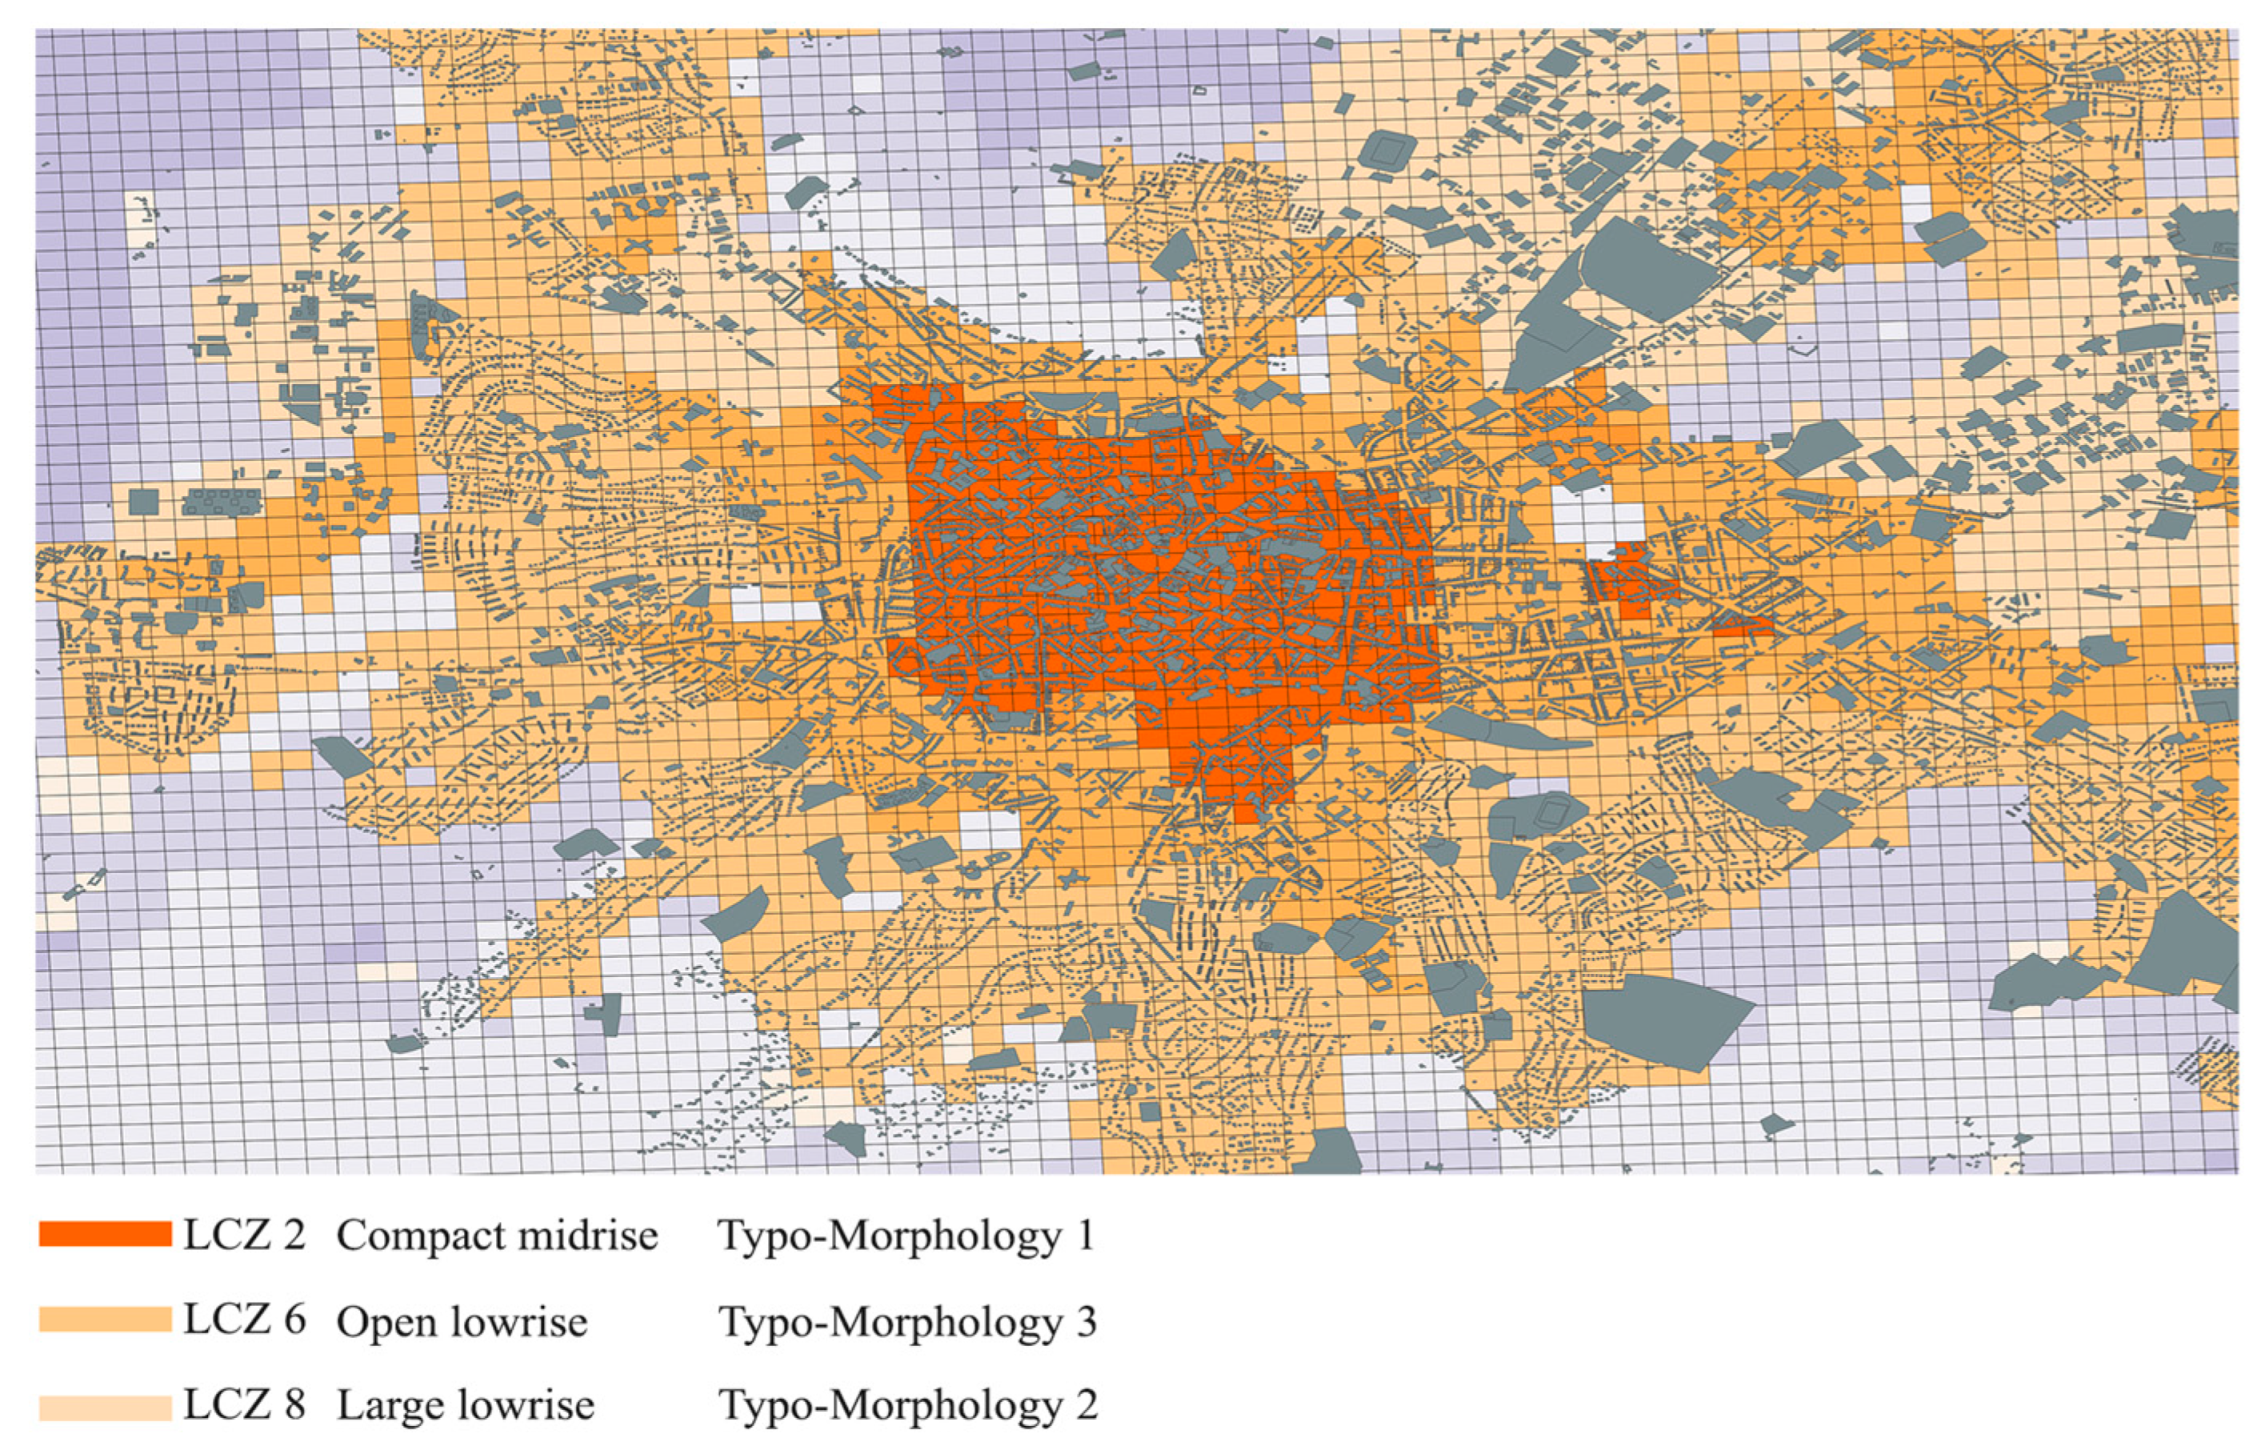
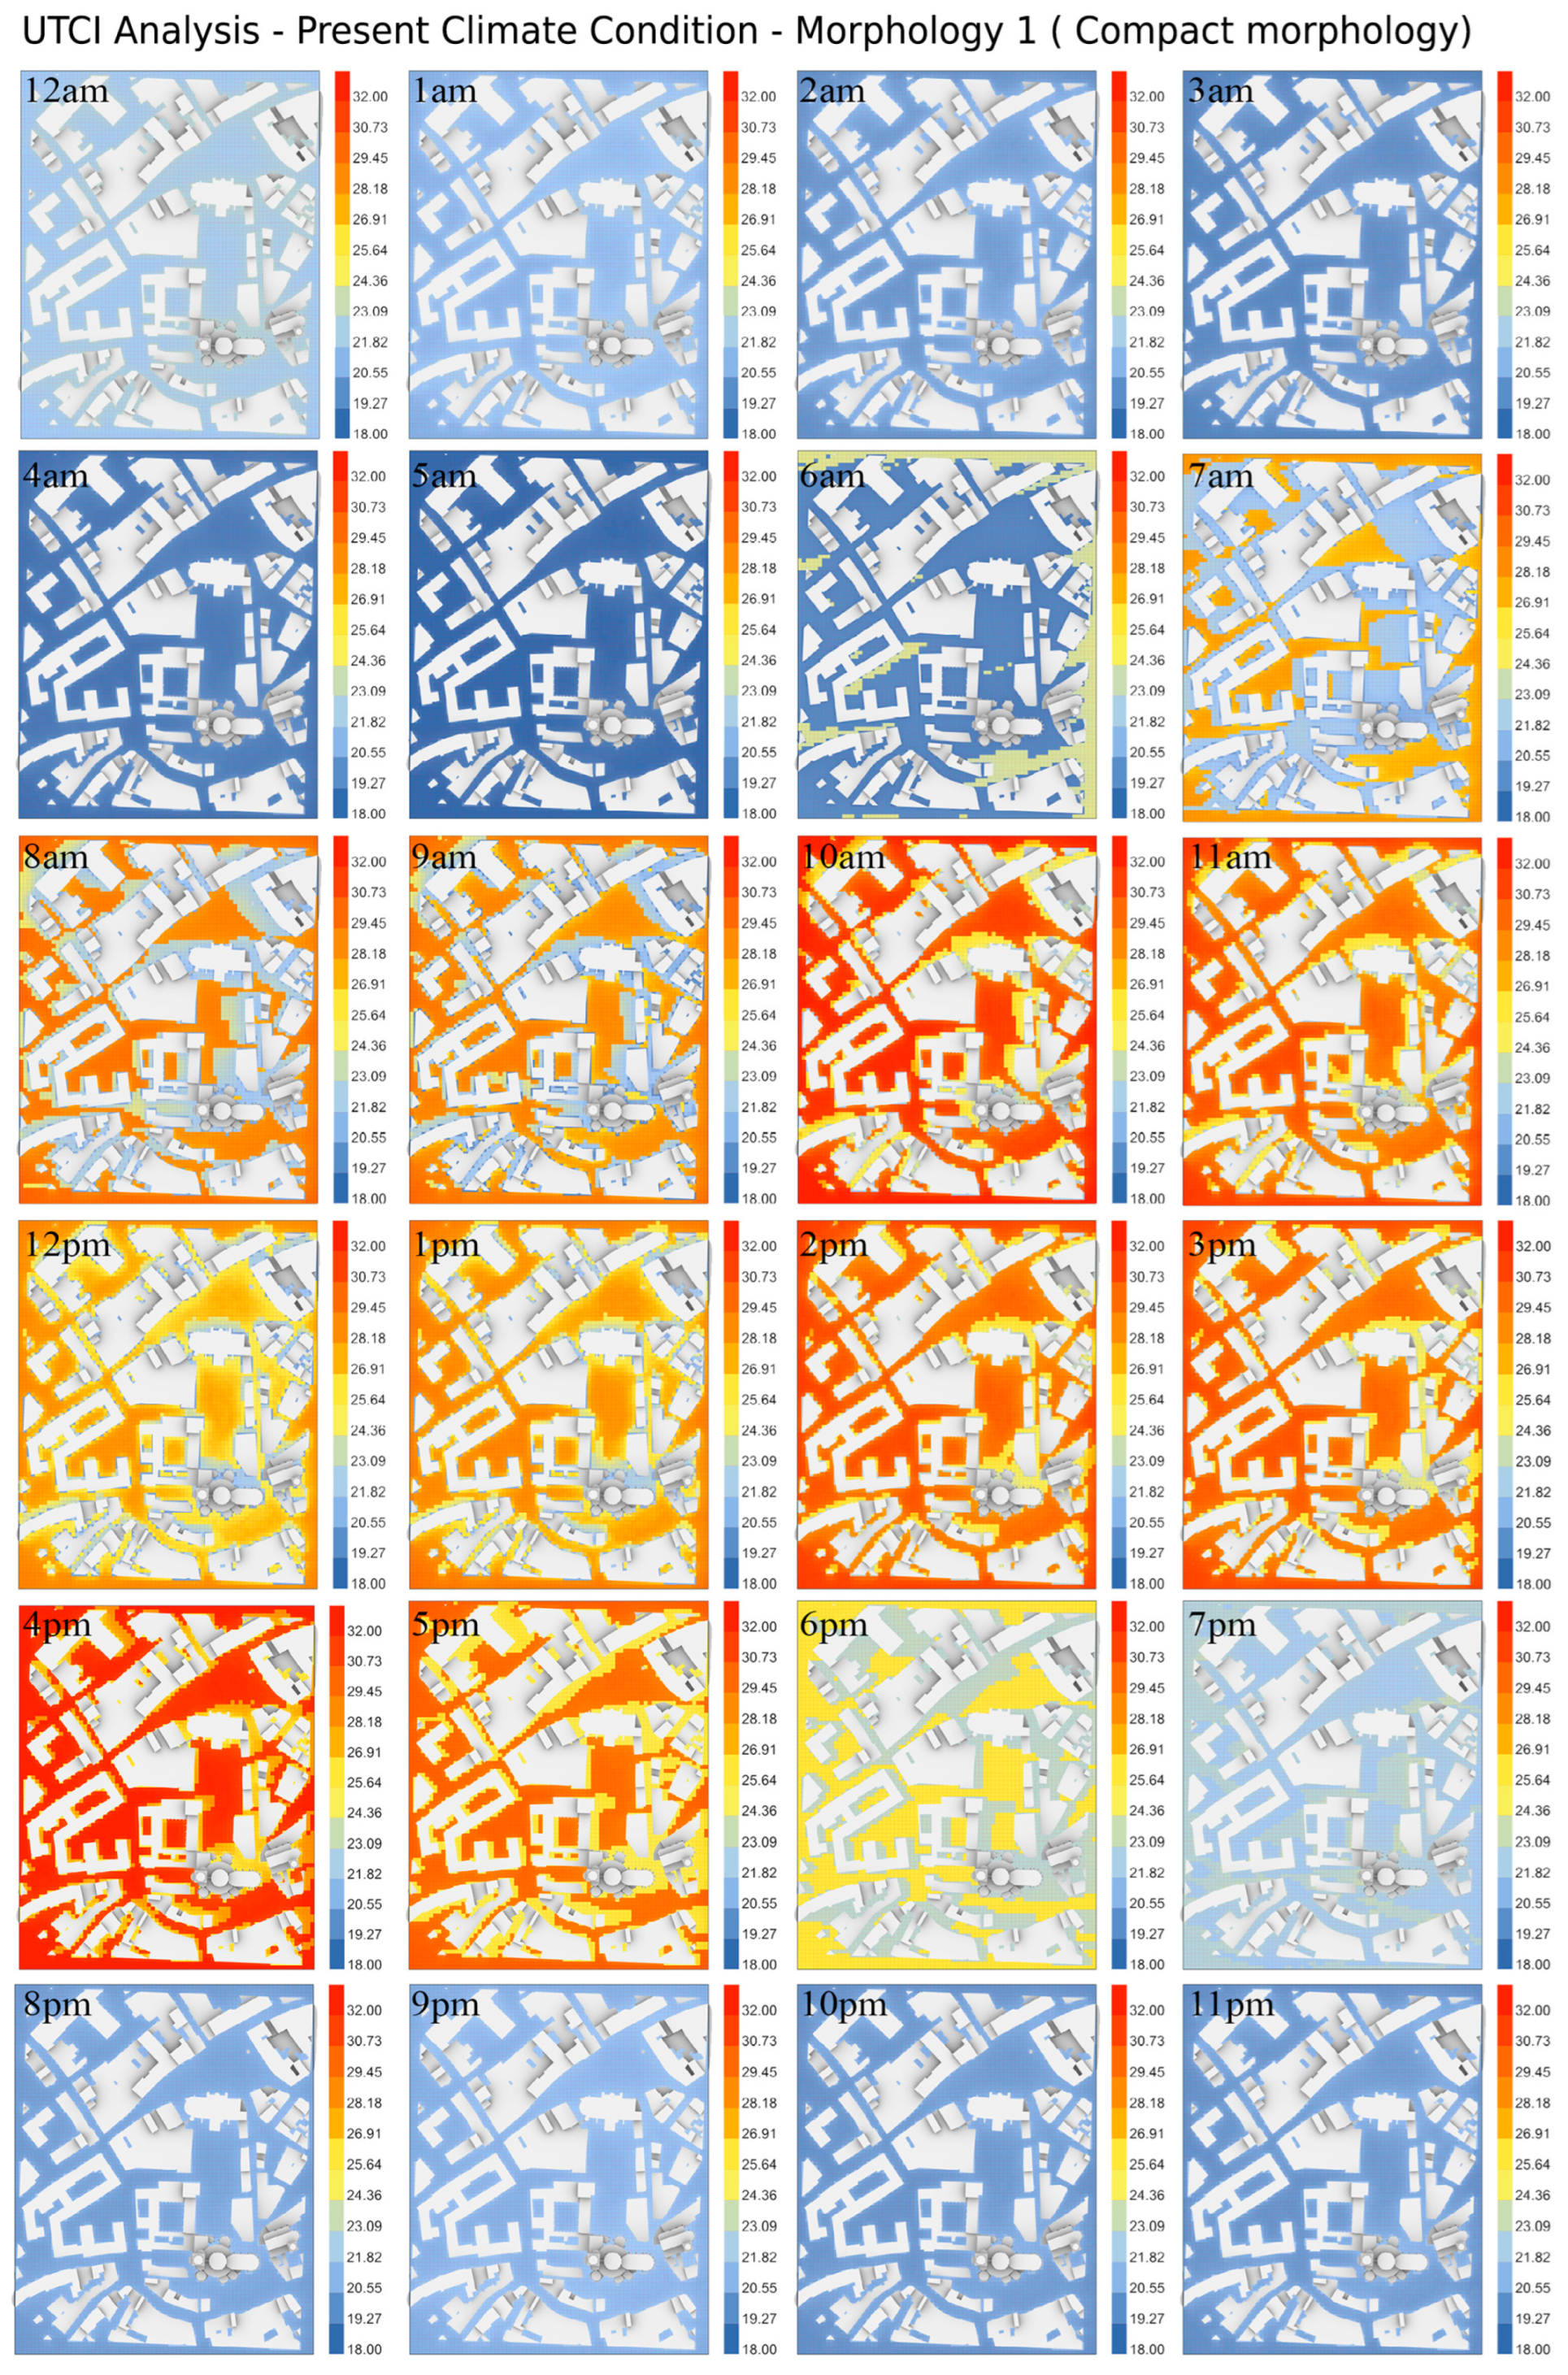
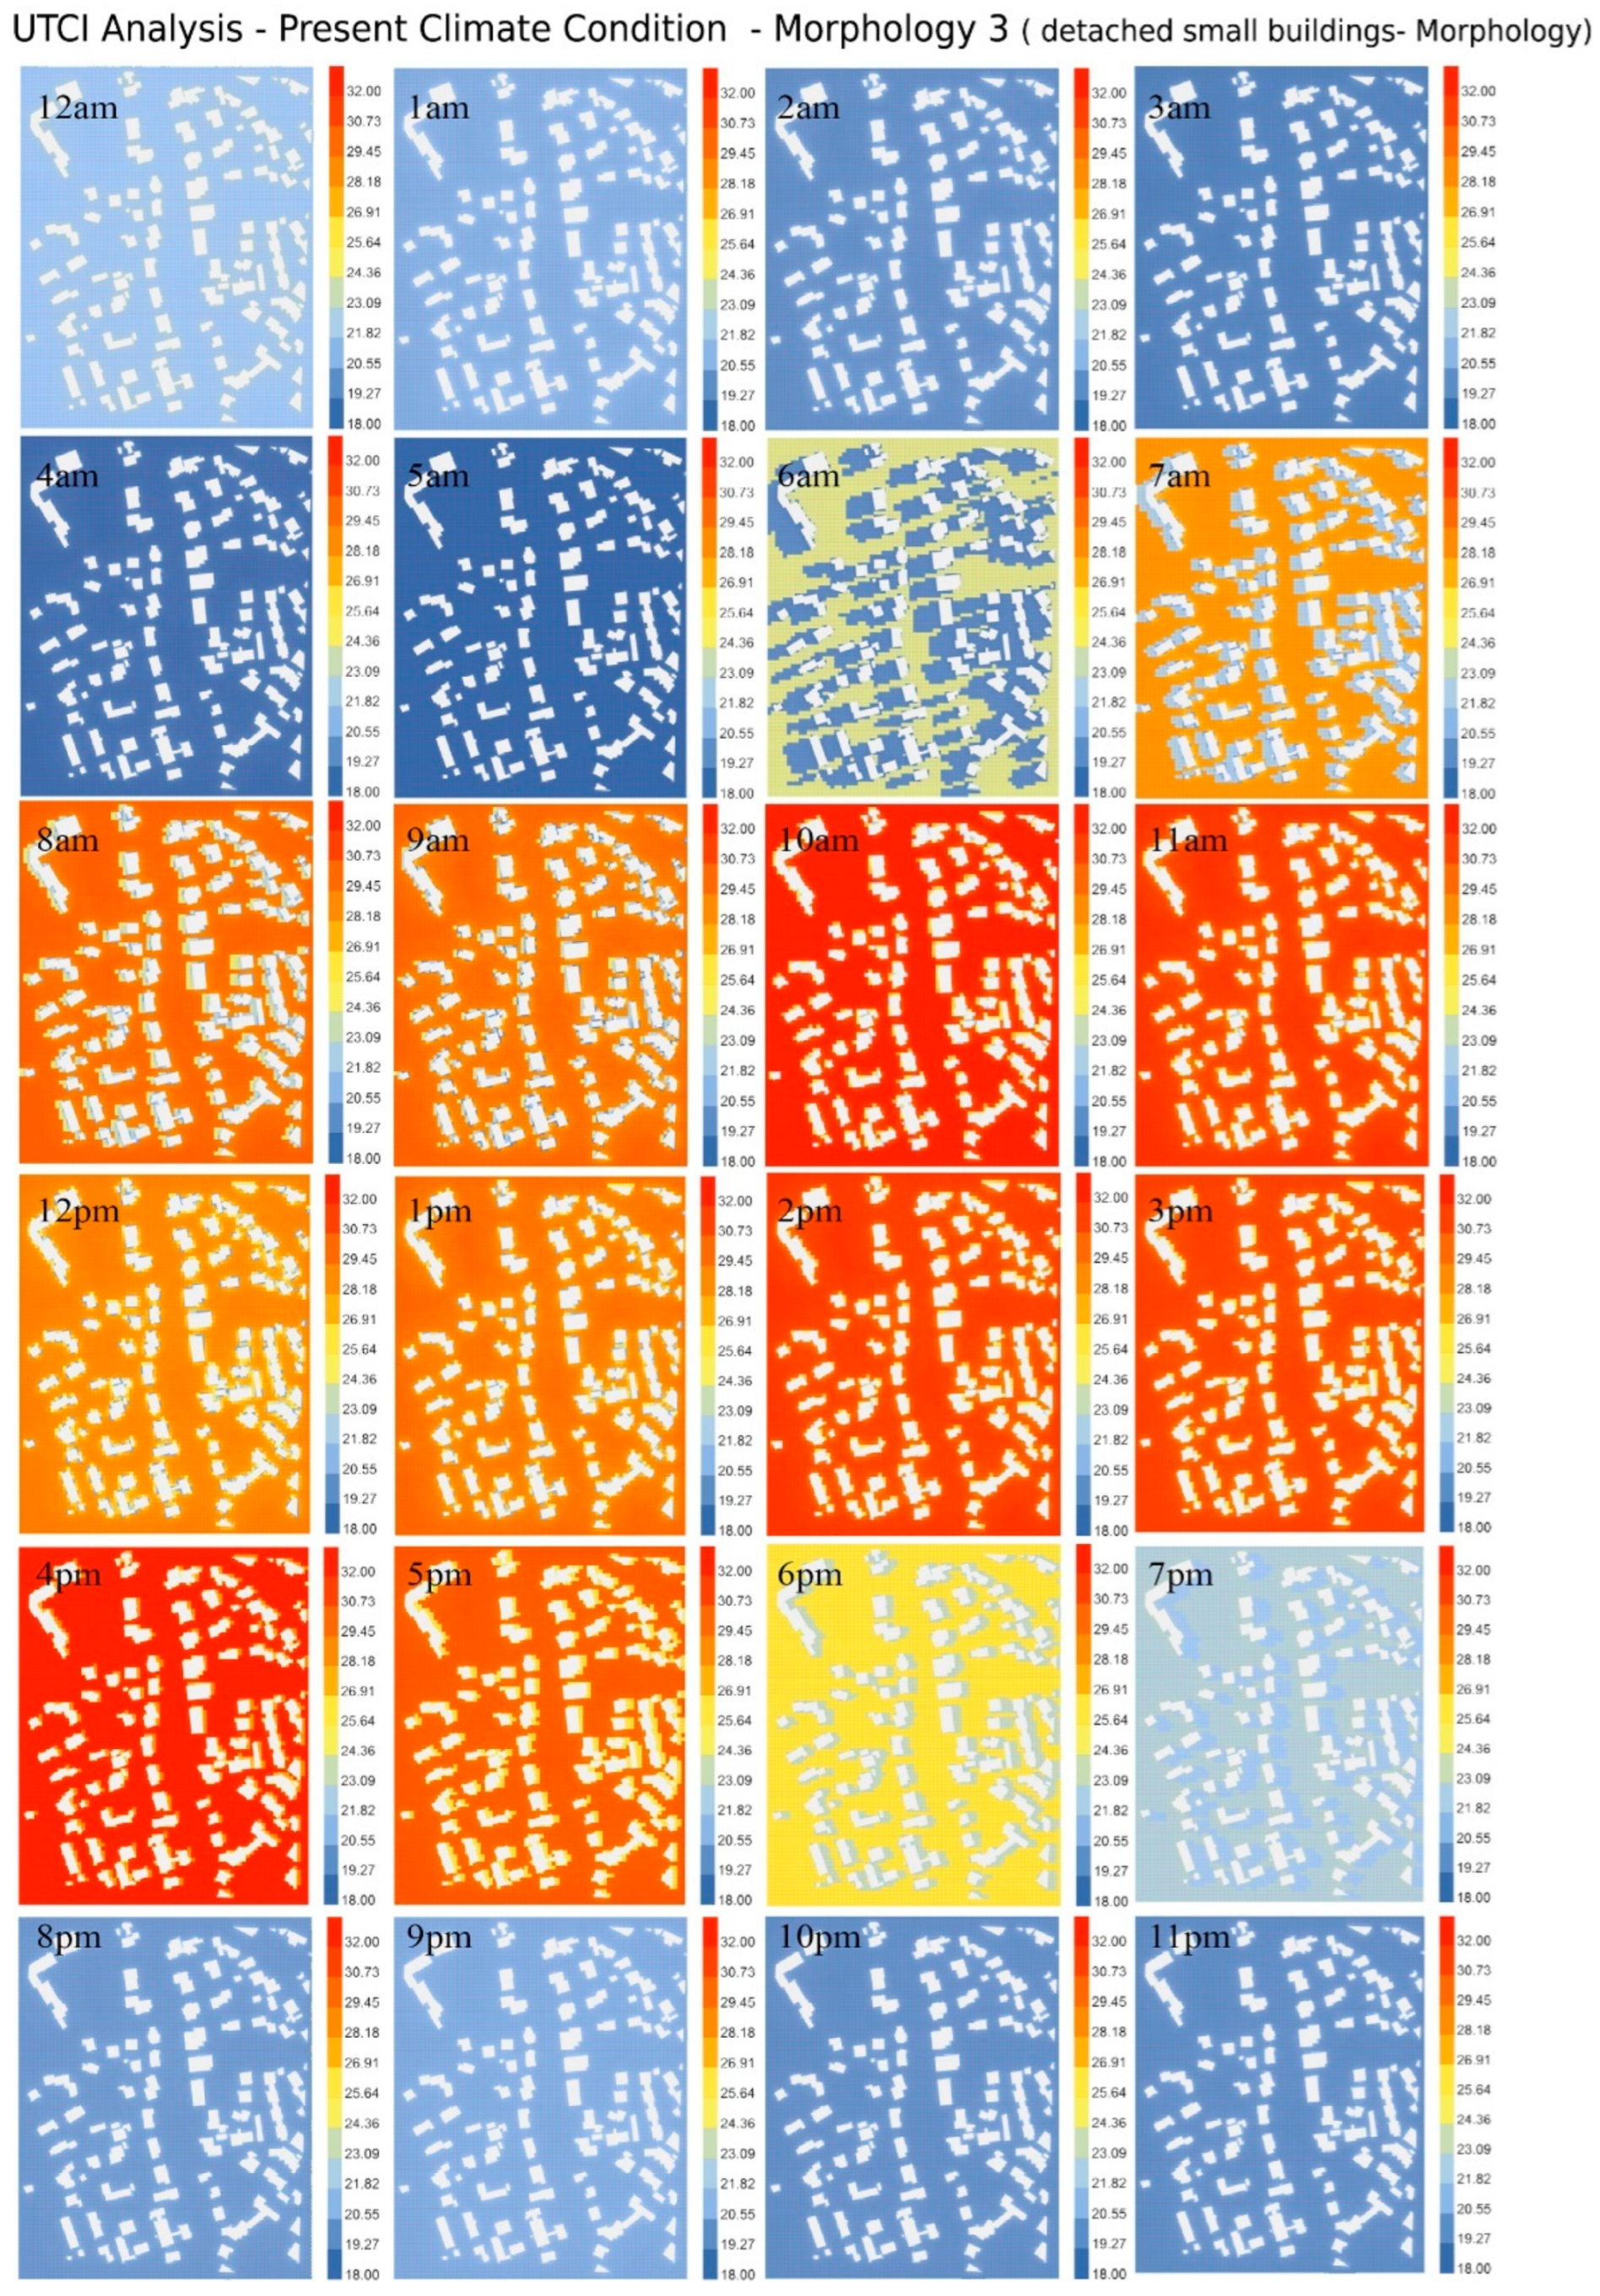
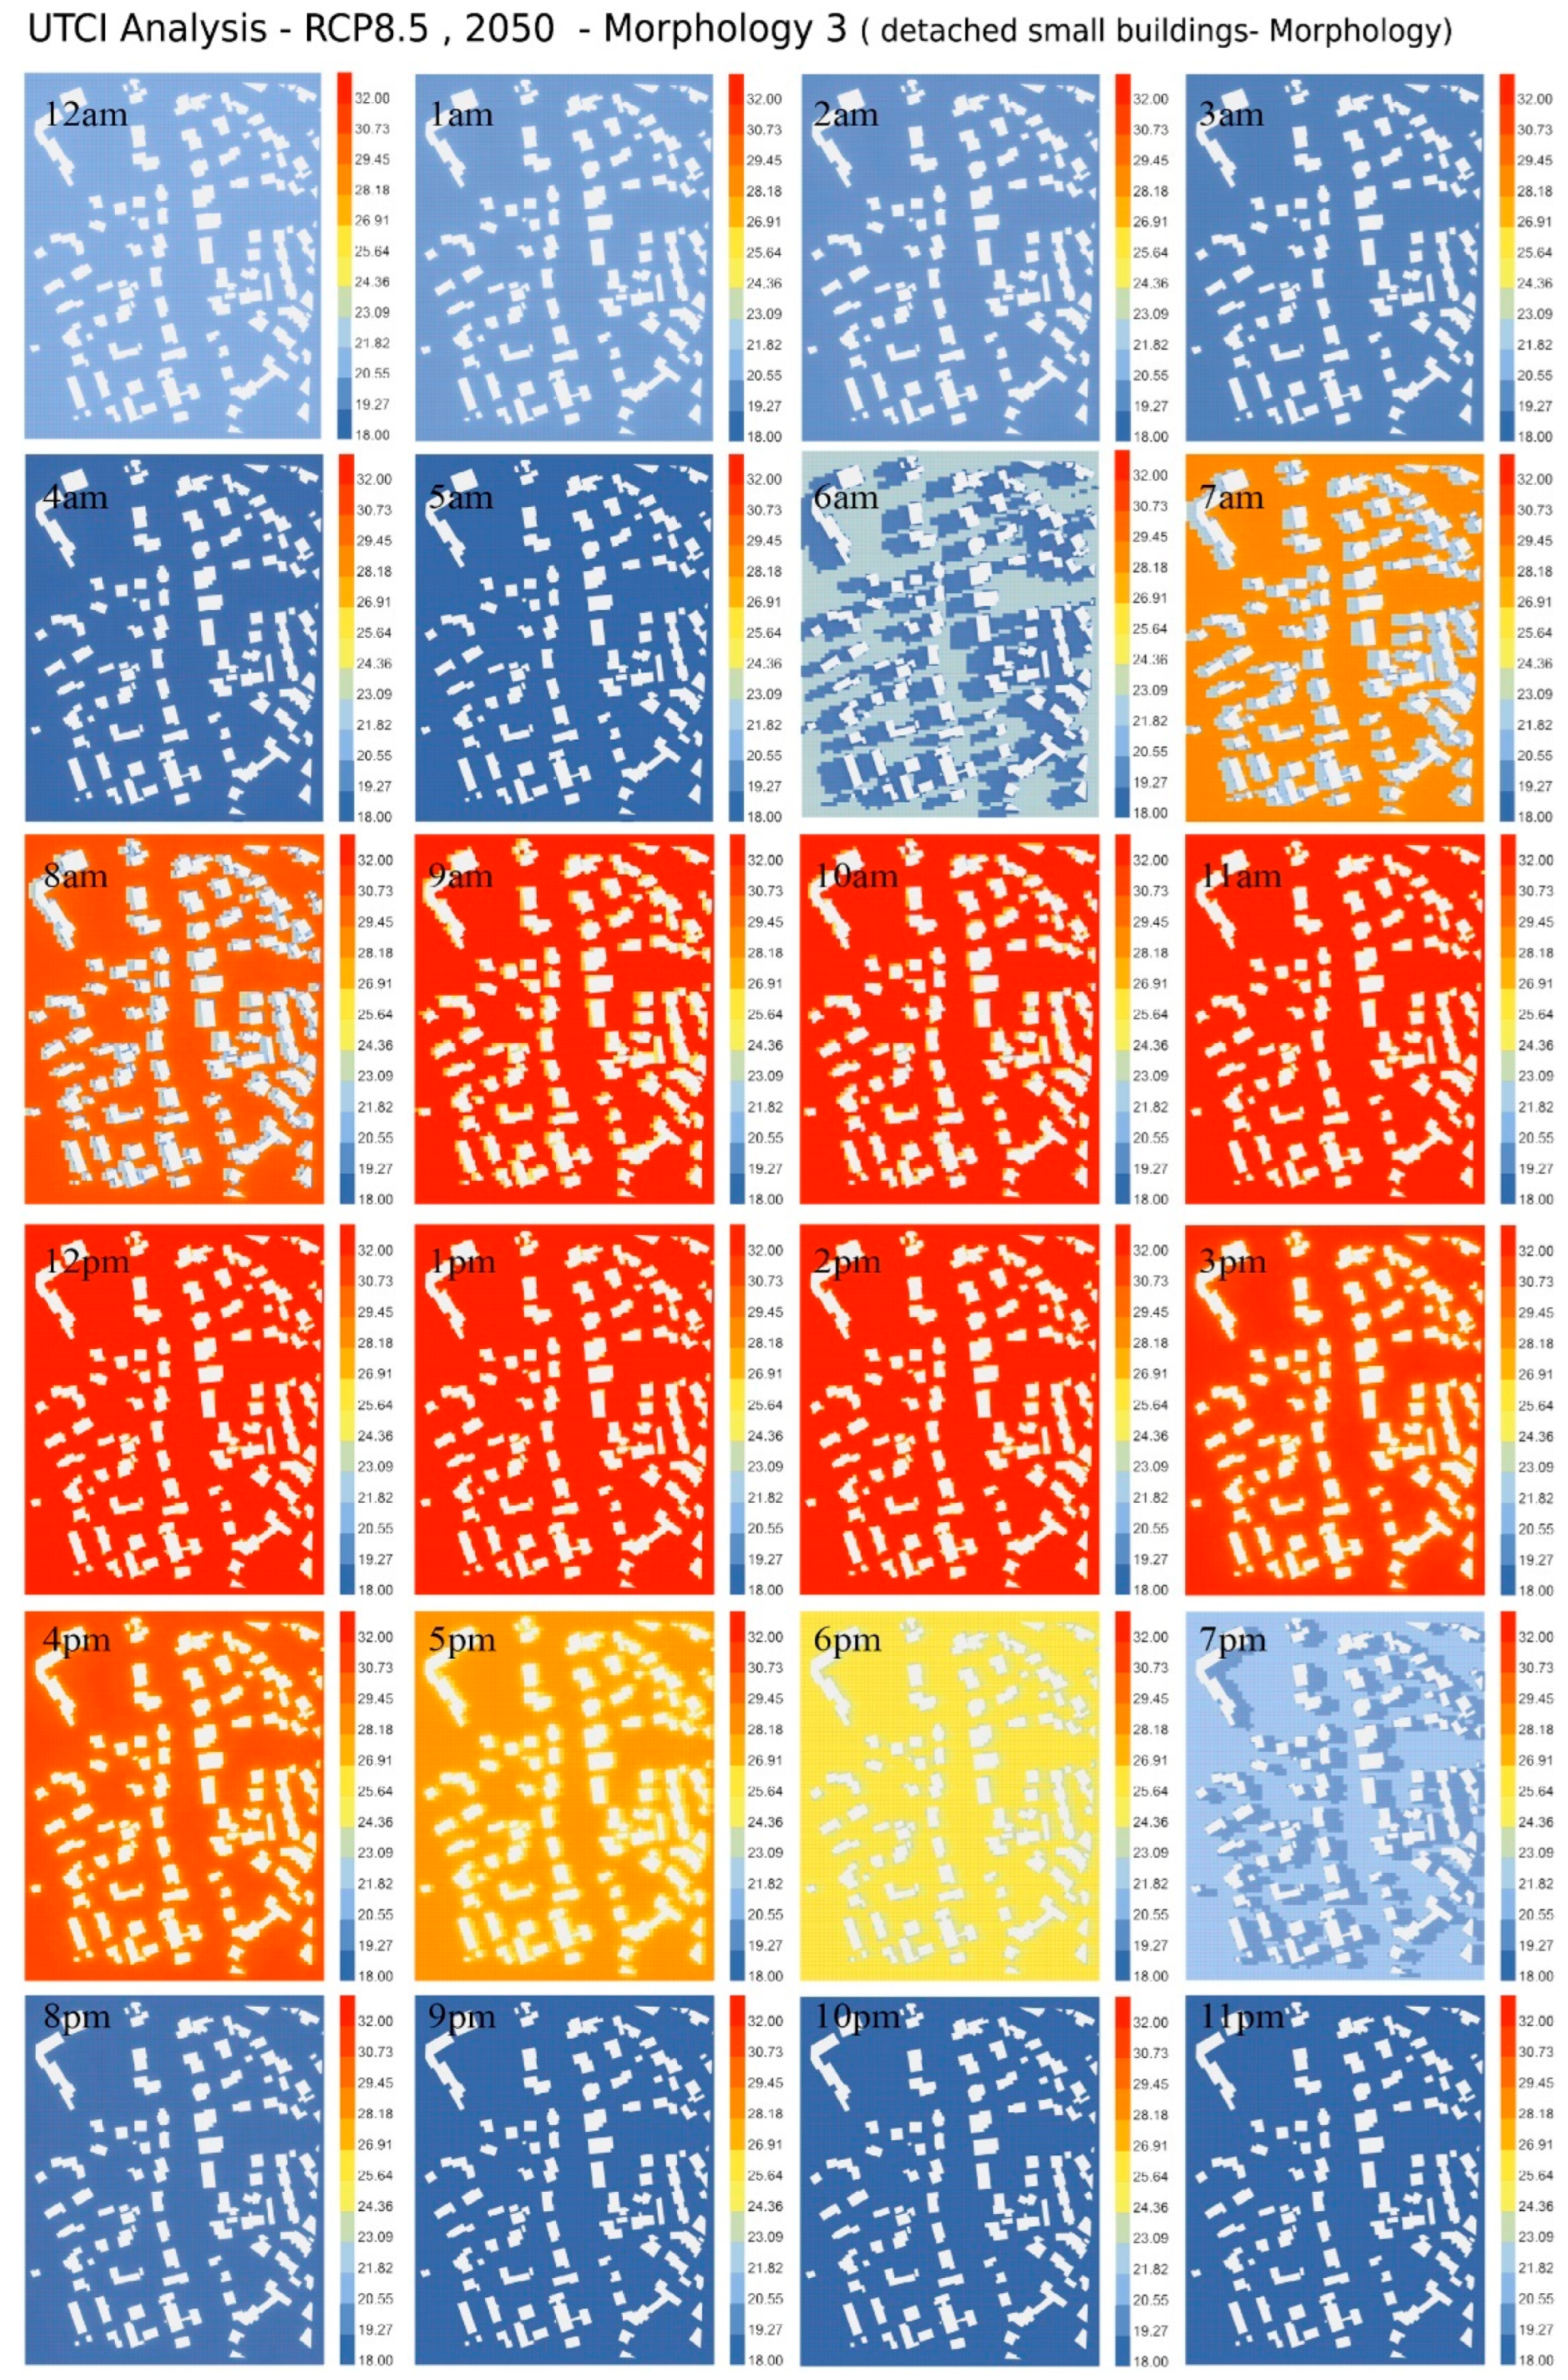
To evaluate the influence of urban form on outdoor thermal comfort, three distinct urban typo-morphologies (Figure 11 and Figure 12) were selected within the city of Aachen in Germany:
  • A compact urban morphology located in the historic city center (Morphology 1).
  • A morphology characterized by detached mega-scale buildings (Morphology 2).
  • A morphology composed of detached small-scale buildings (Morphology 3).
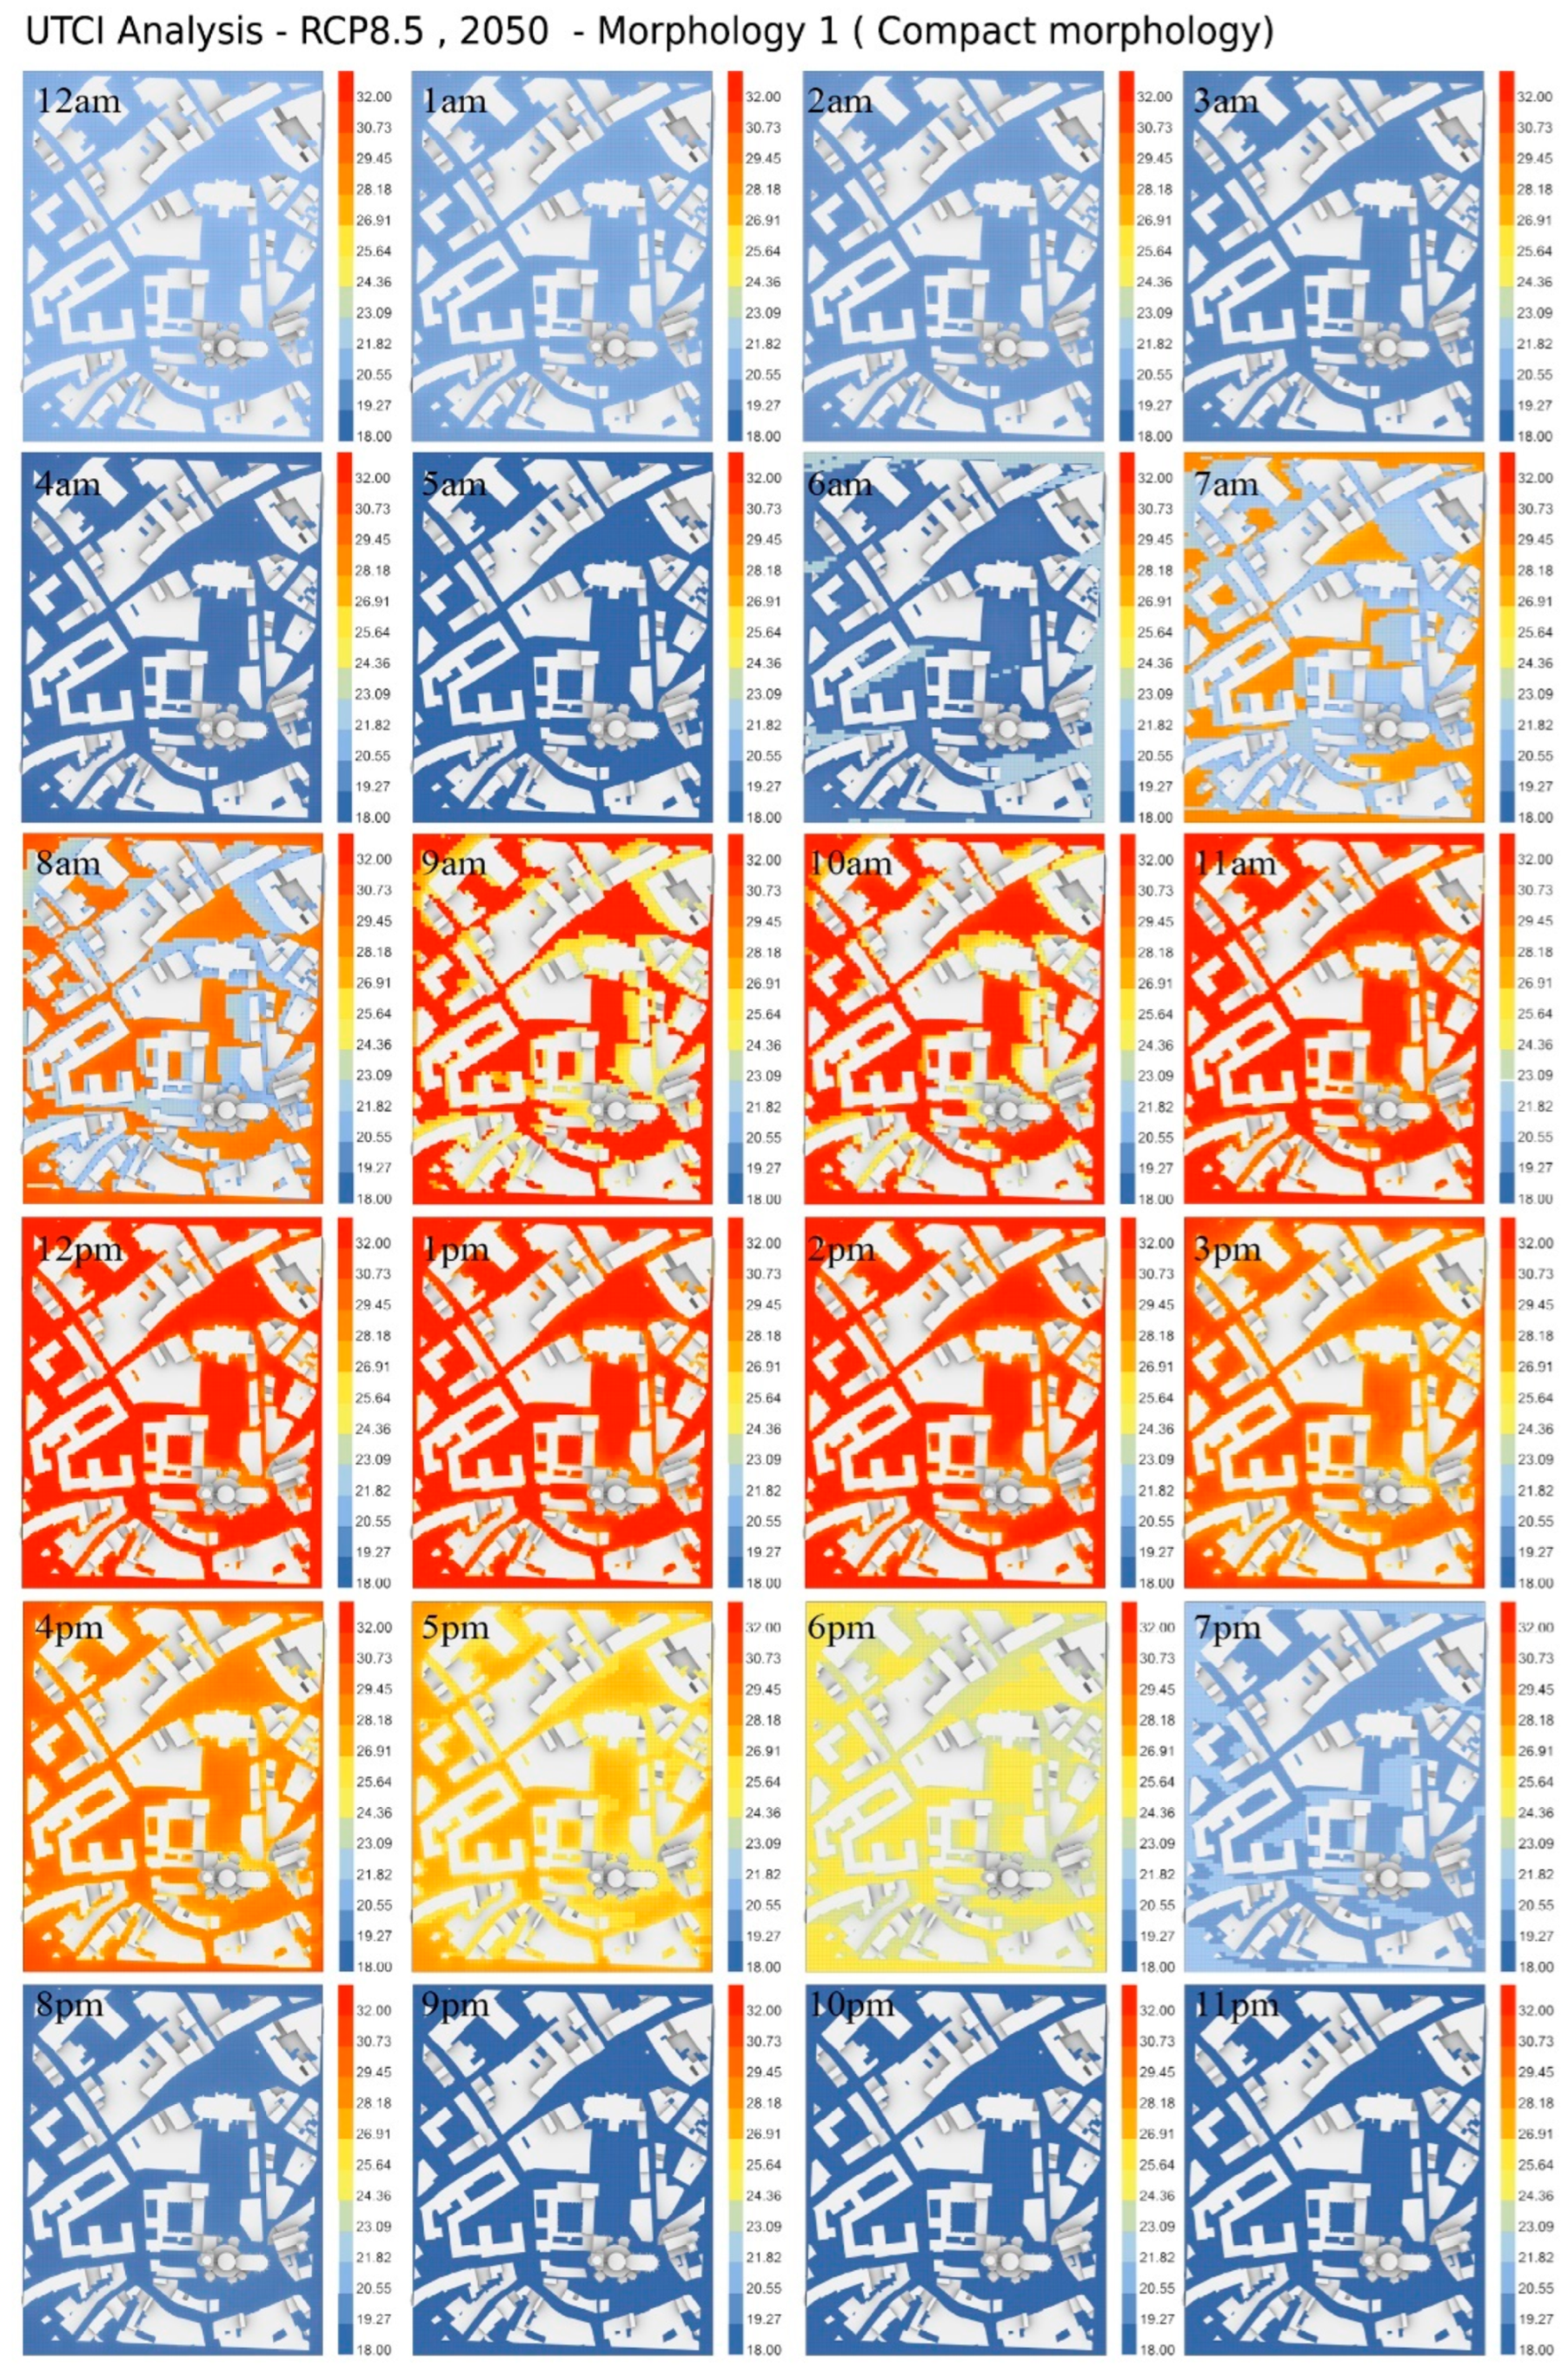
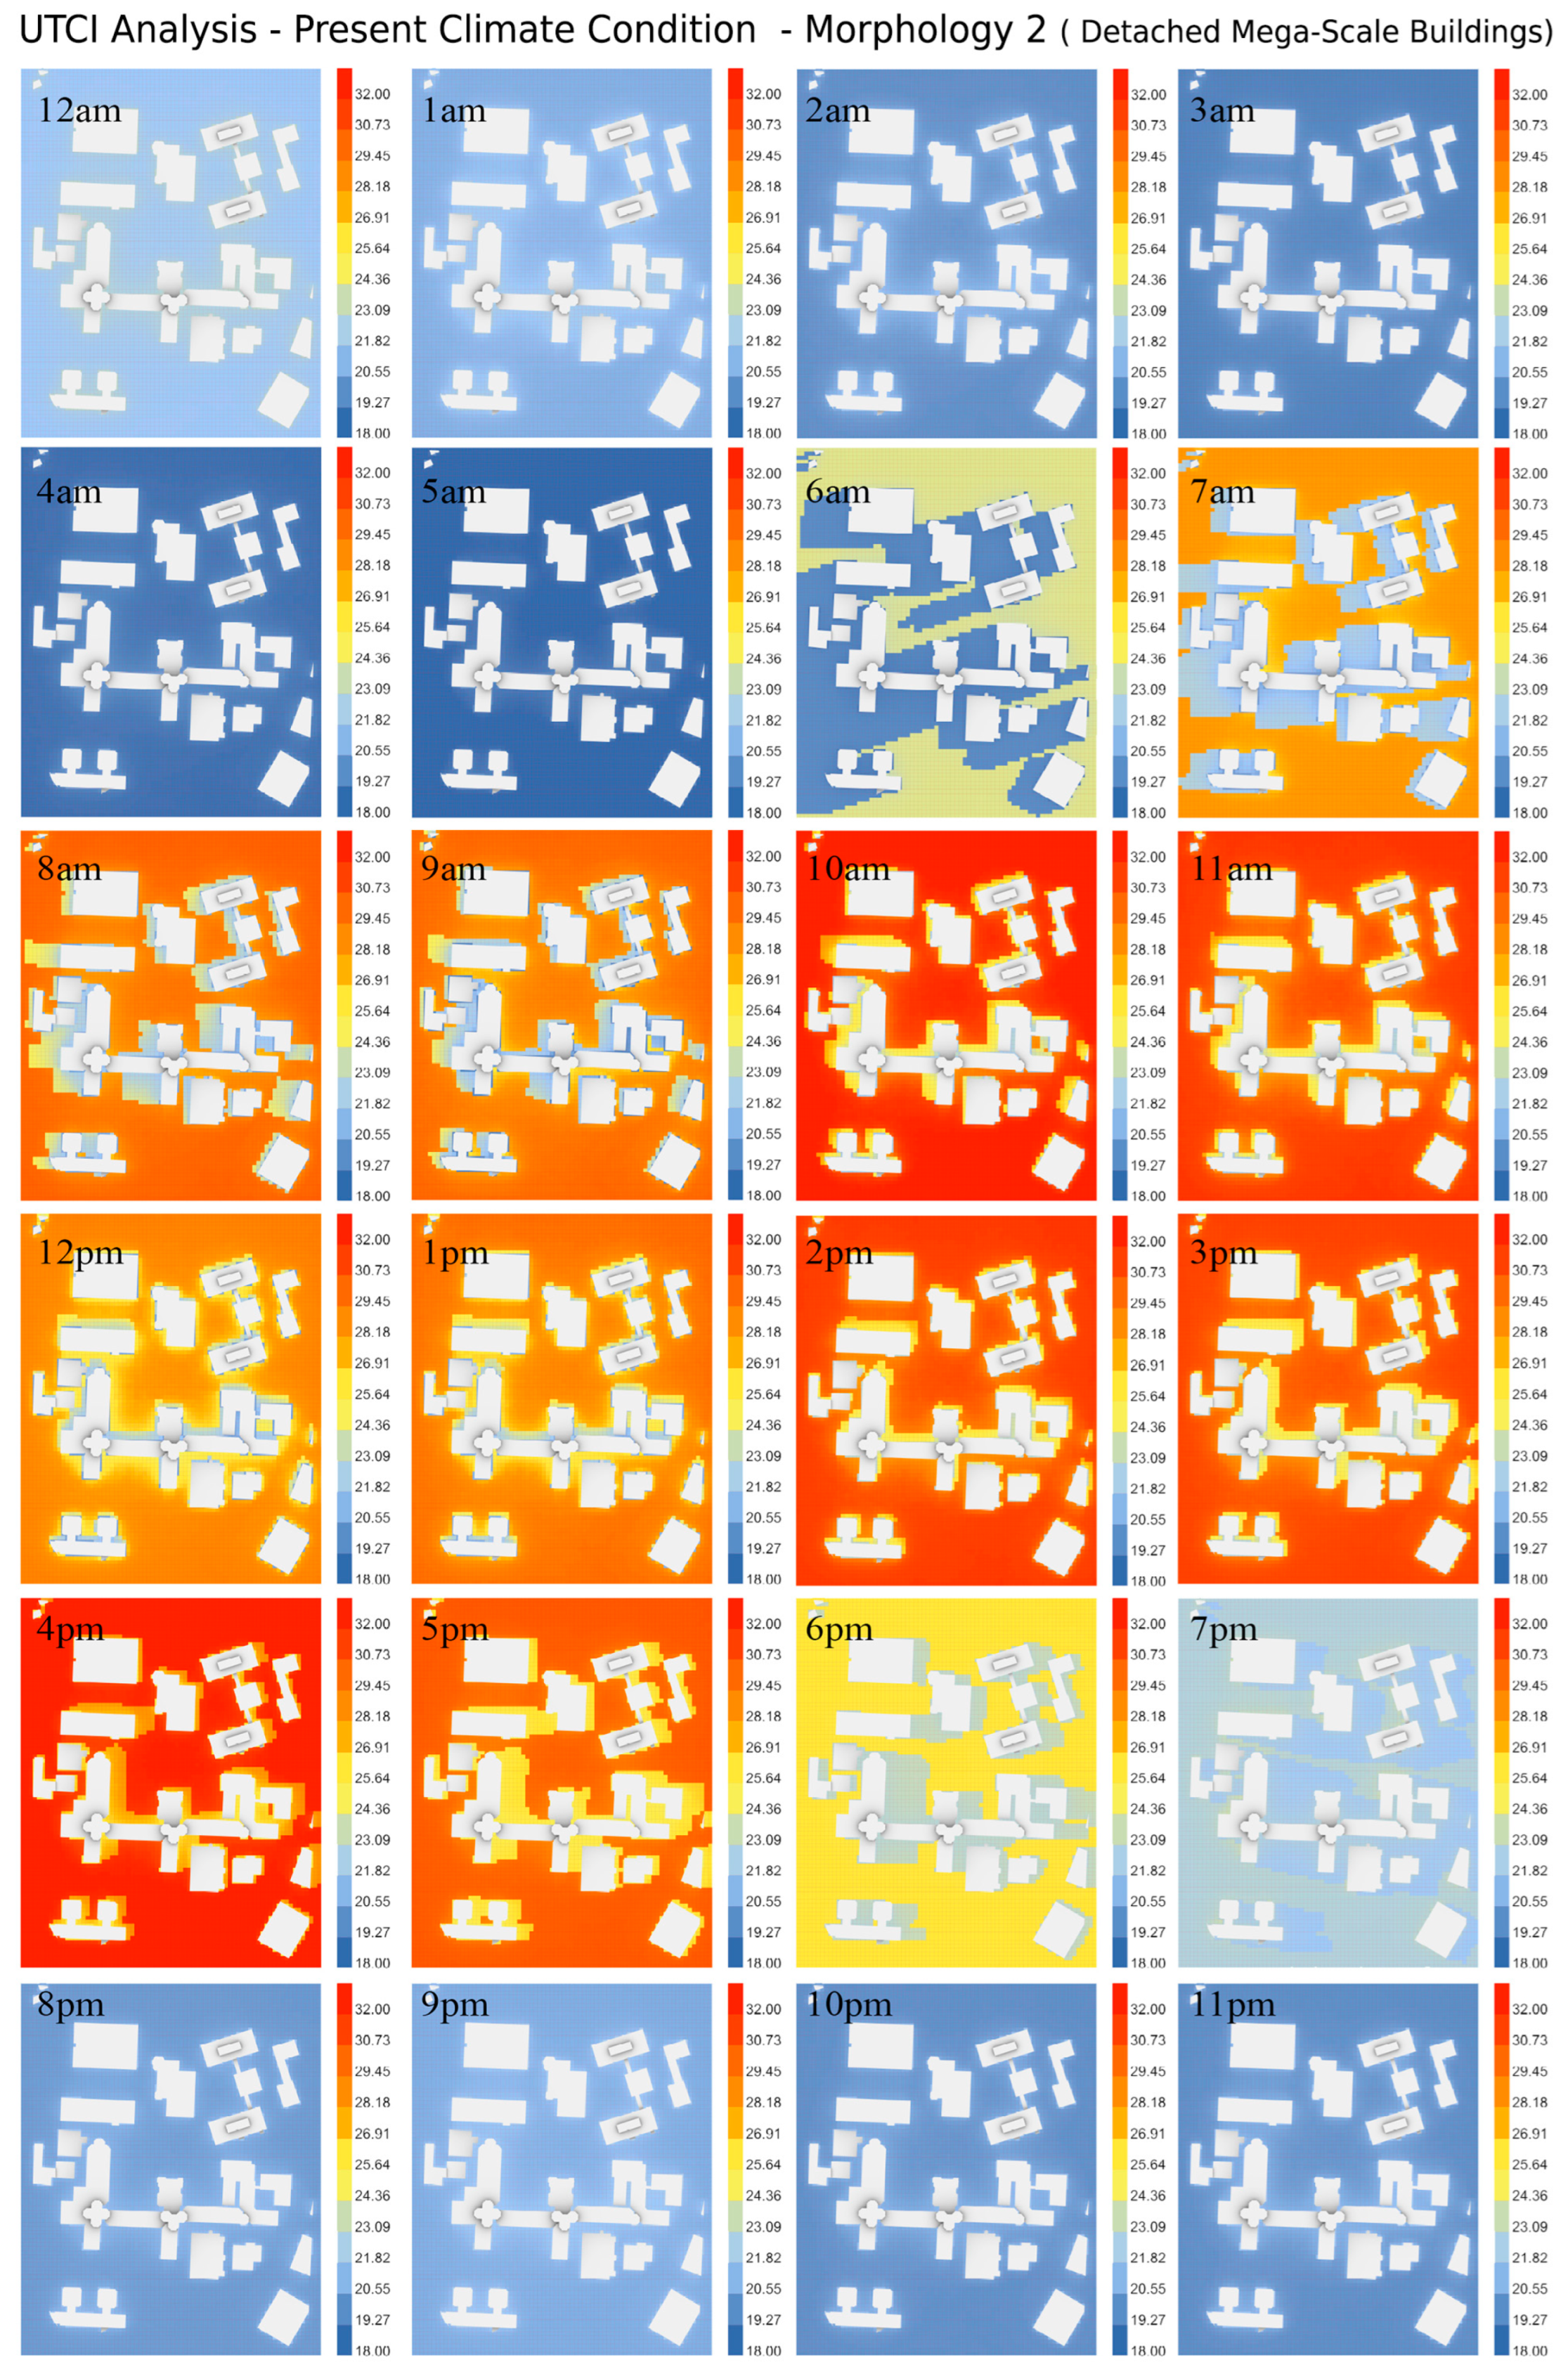
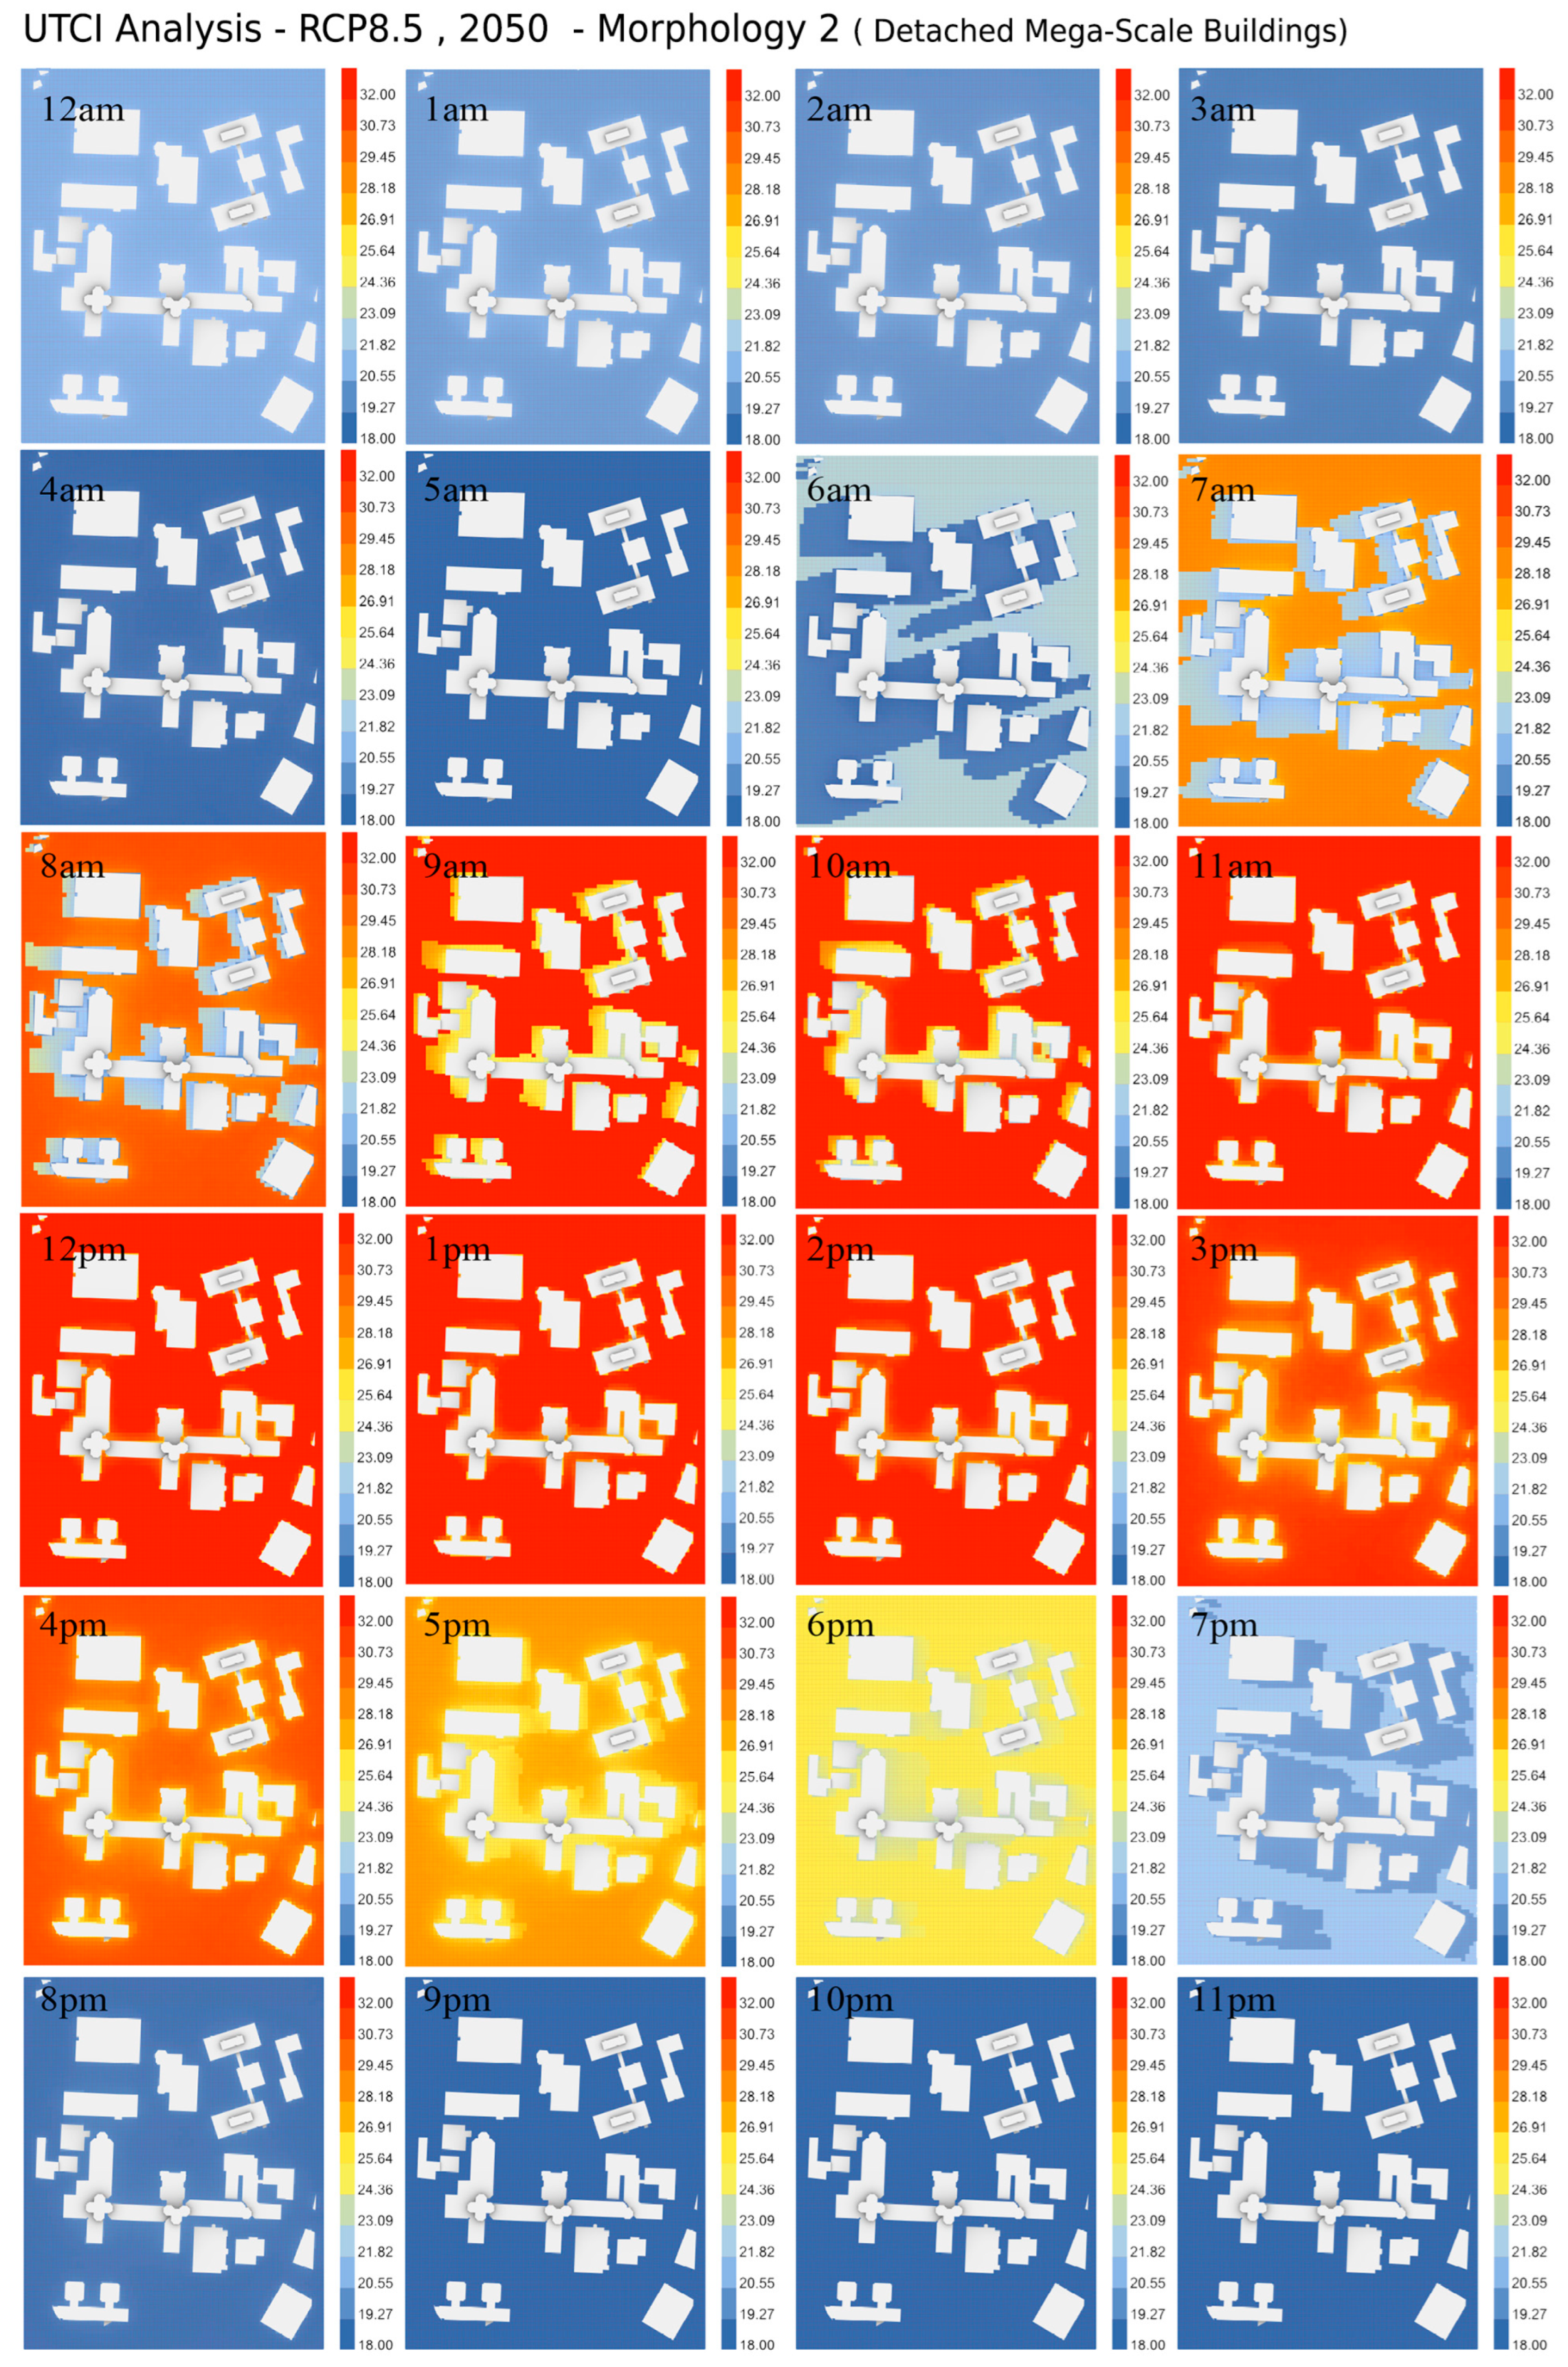
These diverse spatial configurations provide a comparative basis for applying the T-MCCR. UTCI simulations were conducted for the hottest day of the year, using EPW weather data representing both the current climate and the projected future scenario (RCP 8.5 (2050)). The UTCI results (Appendix AFigure A1, Figure A2, Figure A3, Figure A4, Figure A5 and Figure A6) under both scenarios served as the basis for calculating the T-MCCR index, across different urban forms. The selected typo-morphologies exhibit distinct urban density and built–unbuilt configurations, as summarized in Table 1. While all cases share an identical site area, substantial differences are observed in building footprint, unbuilt area, and gross floor area. Typo-Morphology 1 represents a compact urban form with the highest building coverage ratio (47.6%) and floor area ratio (FAR = 1.29), whereas Typo-Morphology 2 and Typo-Morphology 3 progressively reflect more open urban structures with lower building coverage ratios and FAR values. These morphological contrasts directly influence the radiative environment, sky view factor, and shading patterns, thereby playing a critical role in shaping the spatial variability in Mean Radiant Temperature (MRT) and, consequently, the UTCI across the study area.
Based on the proposed methodology, hourly UTCI maps were generated and presented sequentially for different climatic scenarios (Appendix A).

3.2. Implementation of the T-MCCR Framework Based on UTCI Analysis

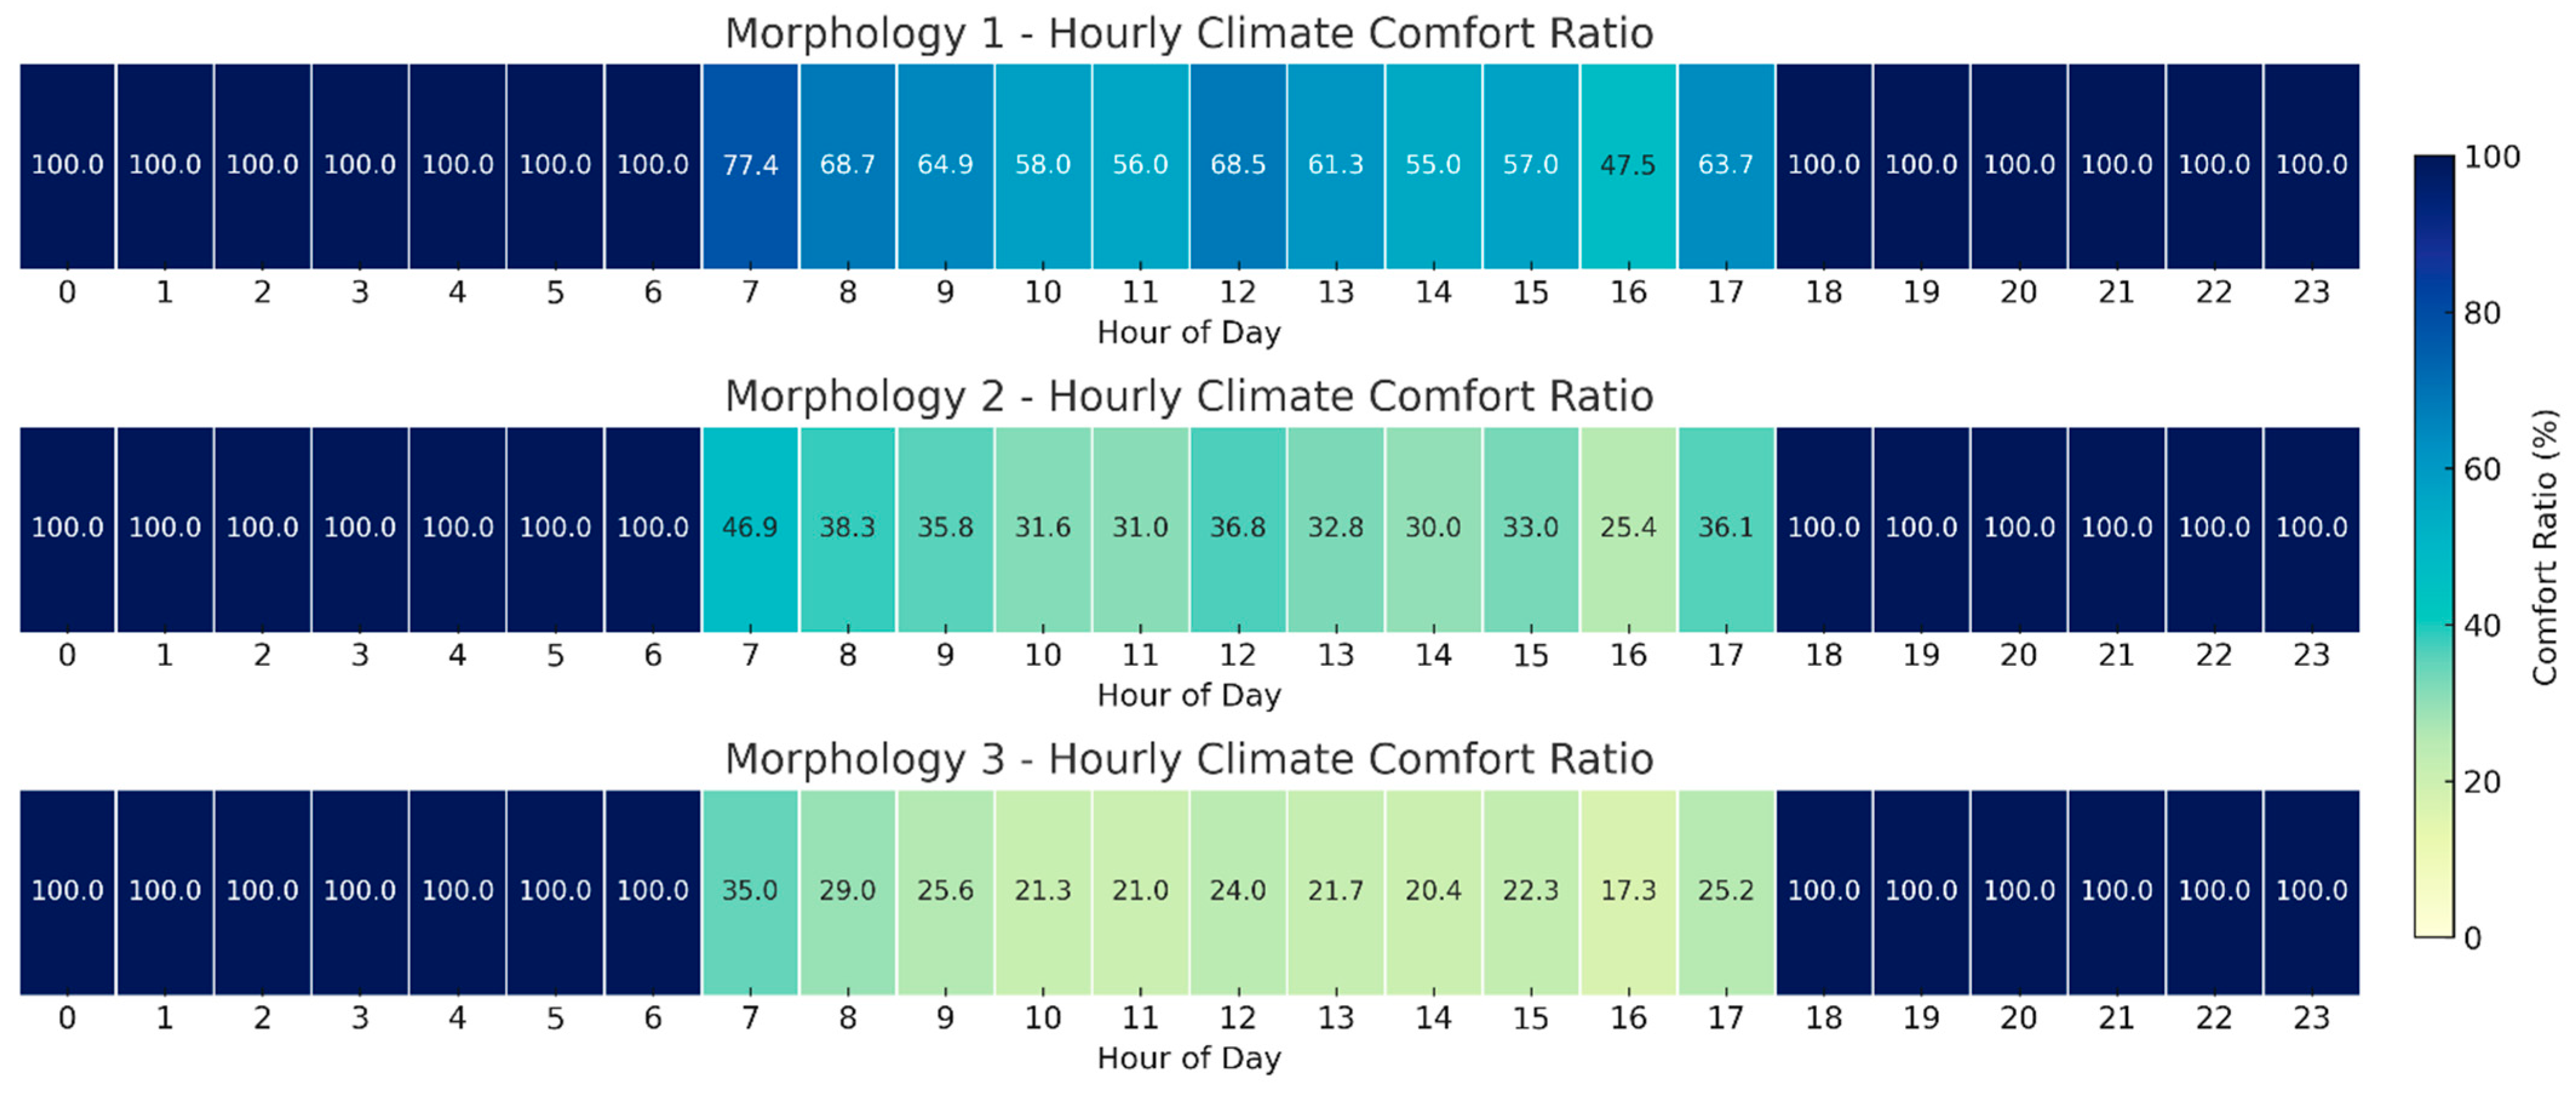
Under current climatic conditions, all three morphologies exhibit (Figure 13) a high hourly Climate Comfort Ratio during nighttime and early morning hours (00:00–06:00 and 18:00–23:00), maintaining values close to 100%. However, notable differences emerge during daytime hours (08:00–17:00). Morphology 1 (compact morphology) consistently outperforms the others, preserving comfort levels between 50% and 70%. In contrast, Morphologies 2 (detached mega-scale buildings) and 3 (detached small-scale buildings) experience a sharper decline, with the detached small-scall buildings morphology showing values below 30% for most daytime hours. These findings indicate that urban form and spatial configuration significantly influence the persistence of outdoor thermal comfort during peak heat periods.
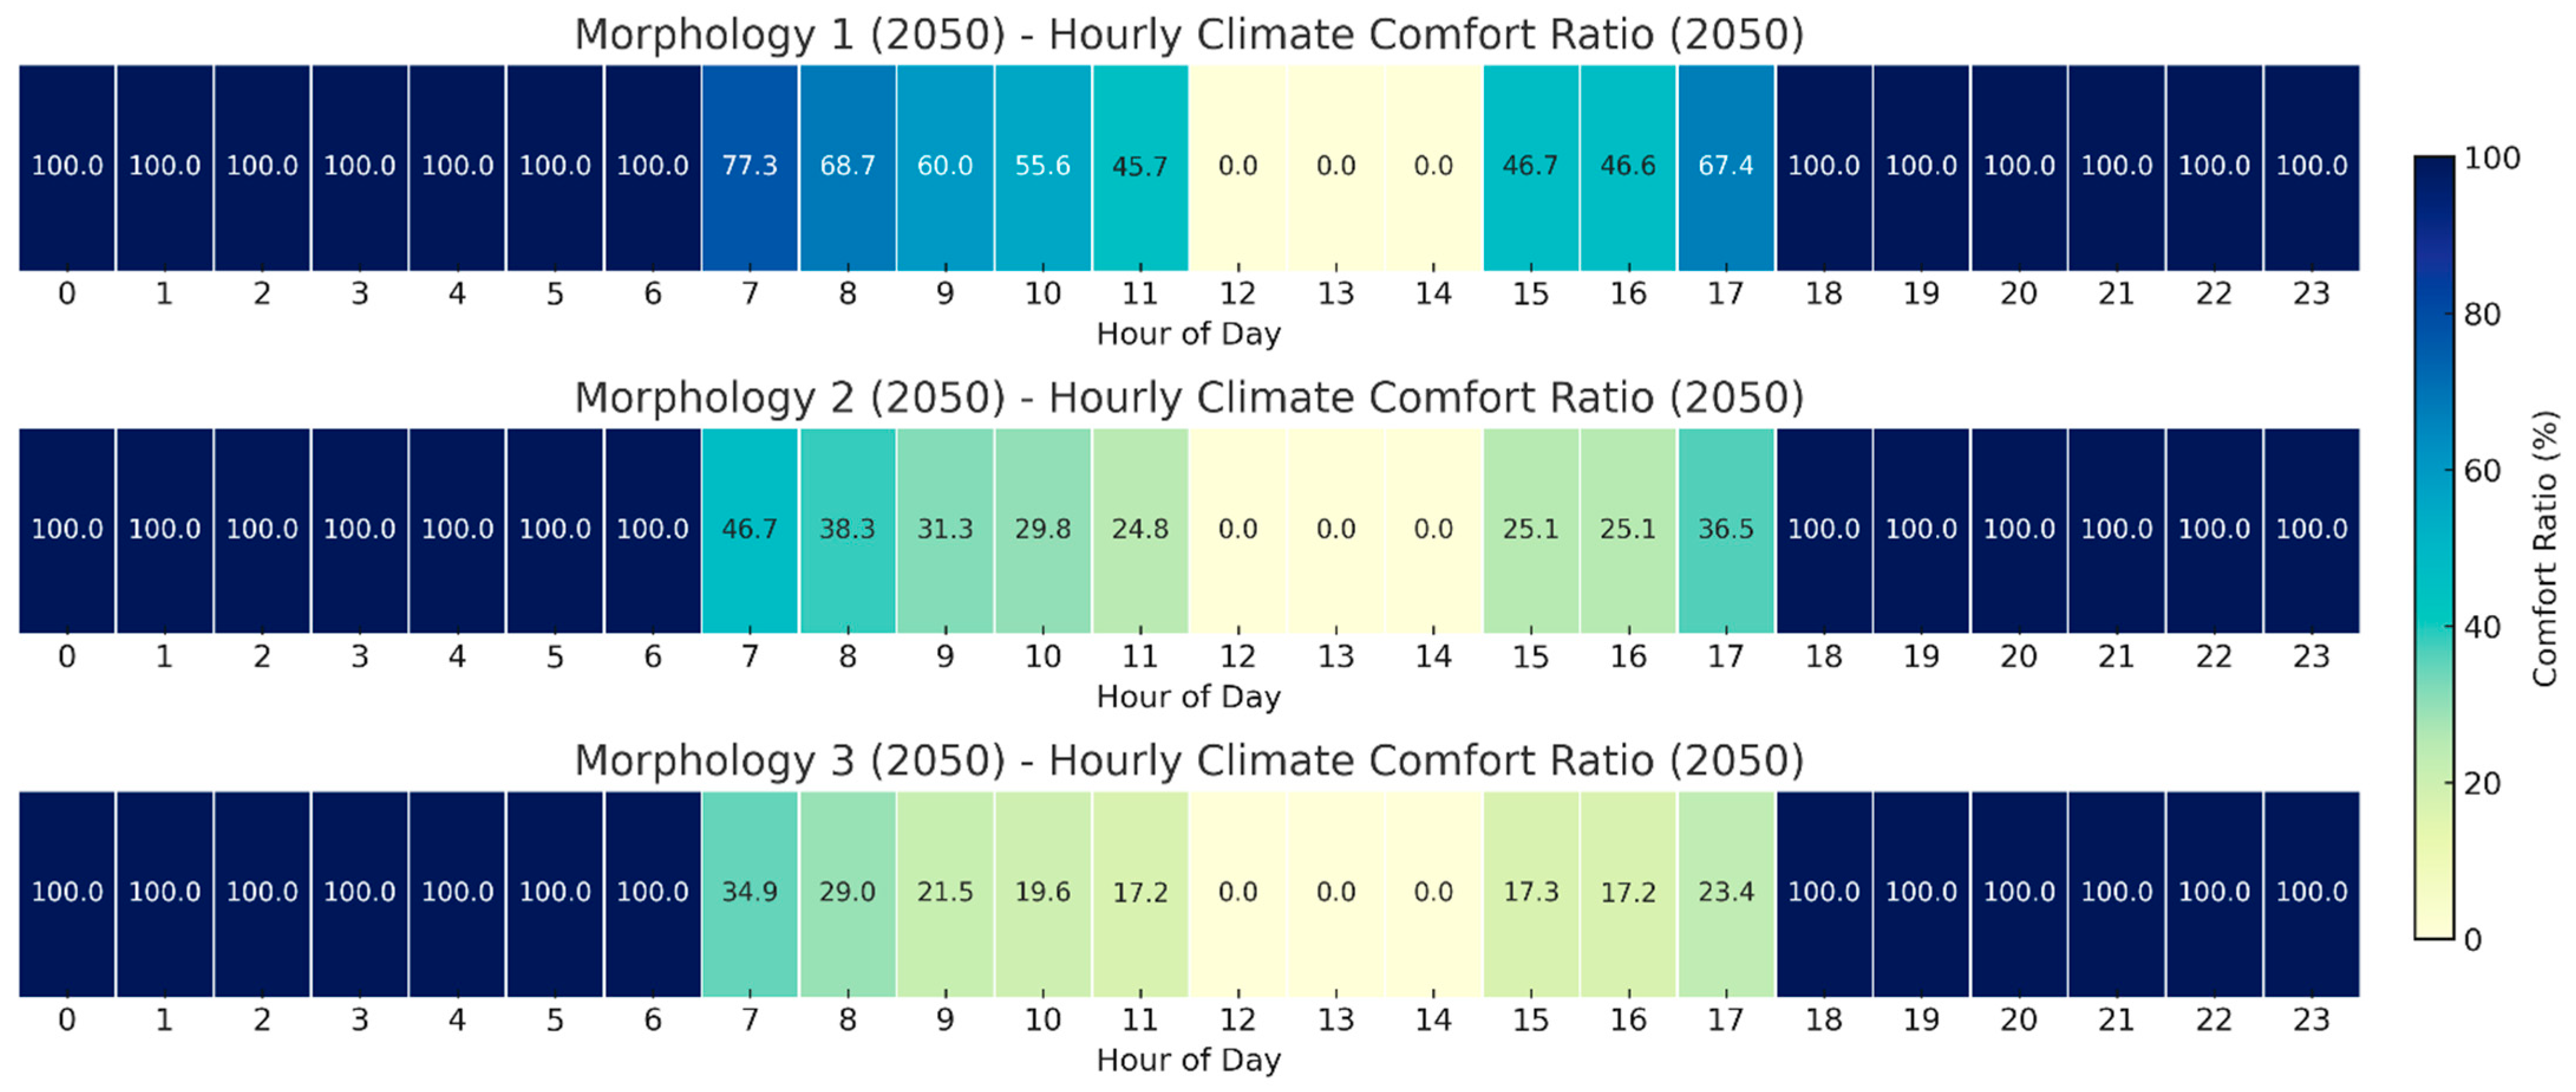
In the projected 2050 scenario (Figure 14) under climate change conditions, all morphologies demonstrate a substantial reduction in thermal comfort when it is midday. Even Morphology 1, which showed relatively resilient performance in the baseline, drops to 0% comfort ratio between 12:00 and 15:00. Morphologies 2 (detached mega-scale buildings) and 3 (detached small-scall buildings) follow similar patterns with limited comfort recovery in the early morning and late afternoon. This suggests that without adaptive urban design strategies, future urban environments may face extended periods of thermal discomfort. Therefore, morphological adaptations, such as enhanced shading, increased ventilation, and thermally responsive materials, will be crucial to mitigate climate-induced comfort loss in outdoor urban spaces.
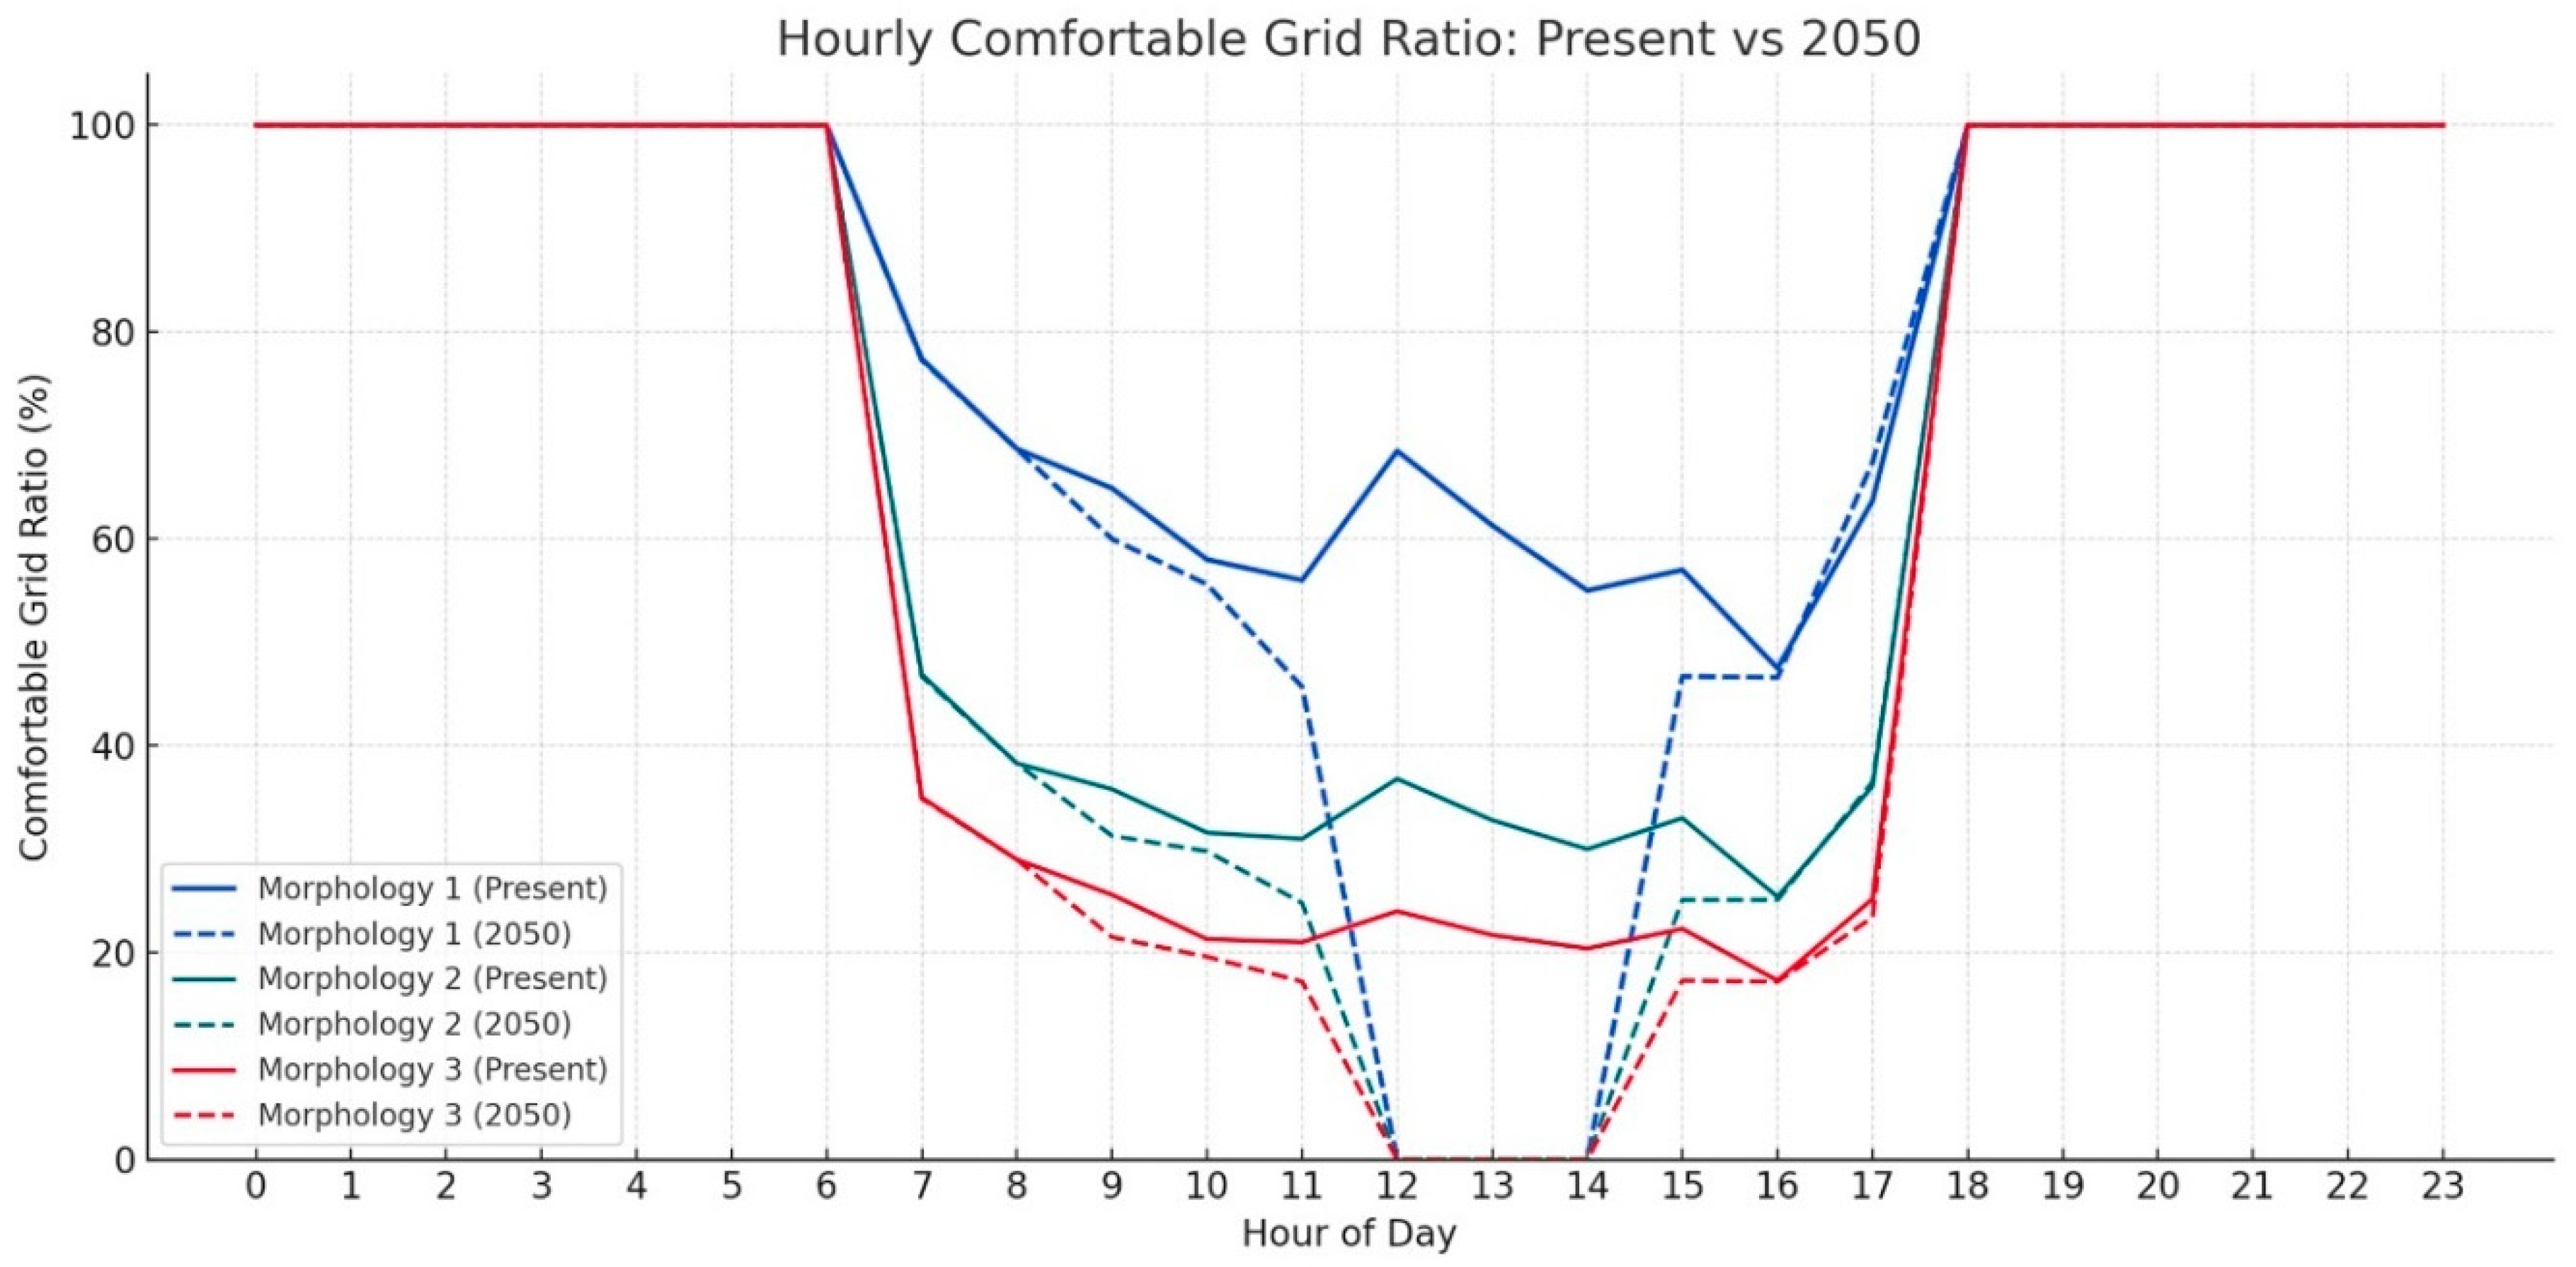
The hourly distribution of thermally comfortable grid cells across the three morphologies (Figure 15) reveals clear differences in their performance under present and future climate conditions. In the current climate scenario, Morphology 1 maintains a relatively high proportion of comfortable parcels throughout the daytime, with a minimum value of approximately 55% at peak heat hours (around 13:00–15:00). Morphologies 2 and 3, in contrast, display significantly lower comfort proportions, particularly between 10:00 and 17:00, where values drop below 35% and 25%, respectively. Under the 2050 RCP 8.5 scenario, all morphologies experience a sharp reduction in comfort when it is midday. Notably, Morphology 1 drops to a minimum of ~45%, while Morphologies 2 and 3 fall to levels below 25% and 20%, respectively, with some hours reaching near-zero comfort ratios. Despite the overall decline in thermal performance, Morphology 1 consistently outperforms the other configurations across all hours, suggesting greater resilience to climate-induced stress. Early morning and late evening hours (before 7:00 and after 18:00) remain thermally comfortable across all morphologies in both scenarios, indicating that the most critical differences occur during the central hours of the day when thermal stress peaks.
To enable a more interpretable comparison across morphologies, the hourly values of comfort ratios can be aggregated using the T-MCCR (Time-weighted Morphological Climate Comfort Ratio) metric. By summing the hourly comfort percentages and dividing by 24 (the total number of hours), a single numerical value is obtained for each morphology. This allows for a straightforward comparison of overall thermal comfort performance and resilience, especially under varying climate conditions. Such a quantitative index facilitates integration into optimization frameworks and spatial planning processes, where compact, comparable metrics are essential for decision-making.

4. Discussion

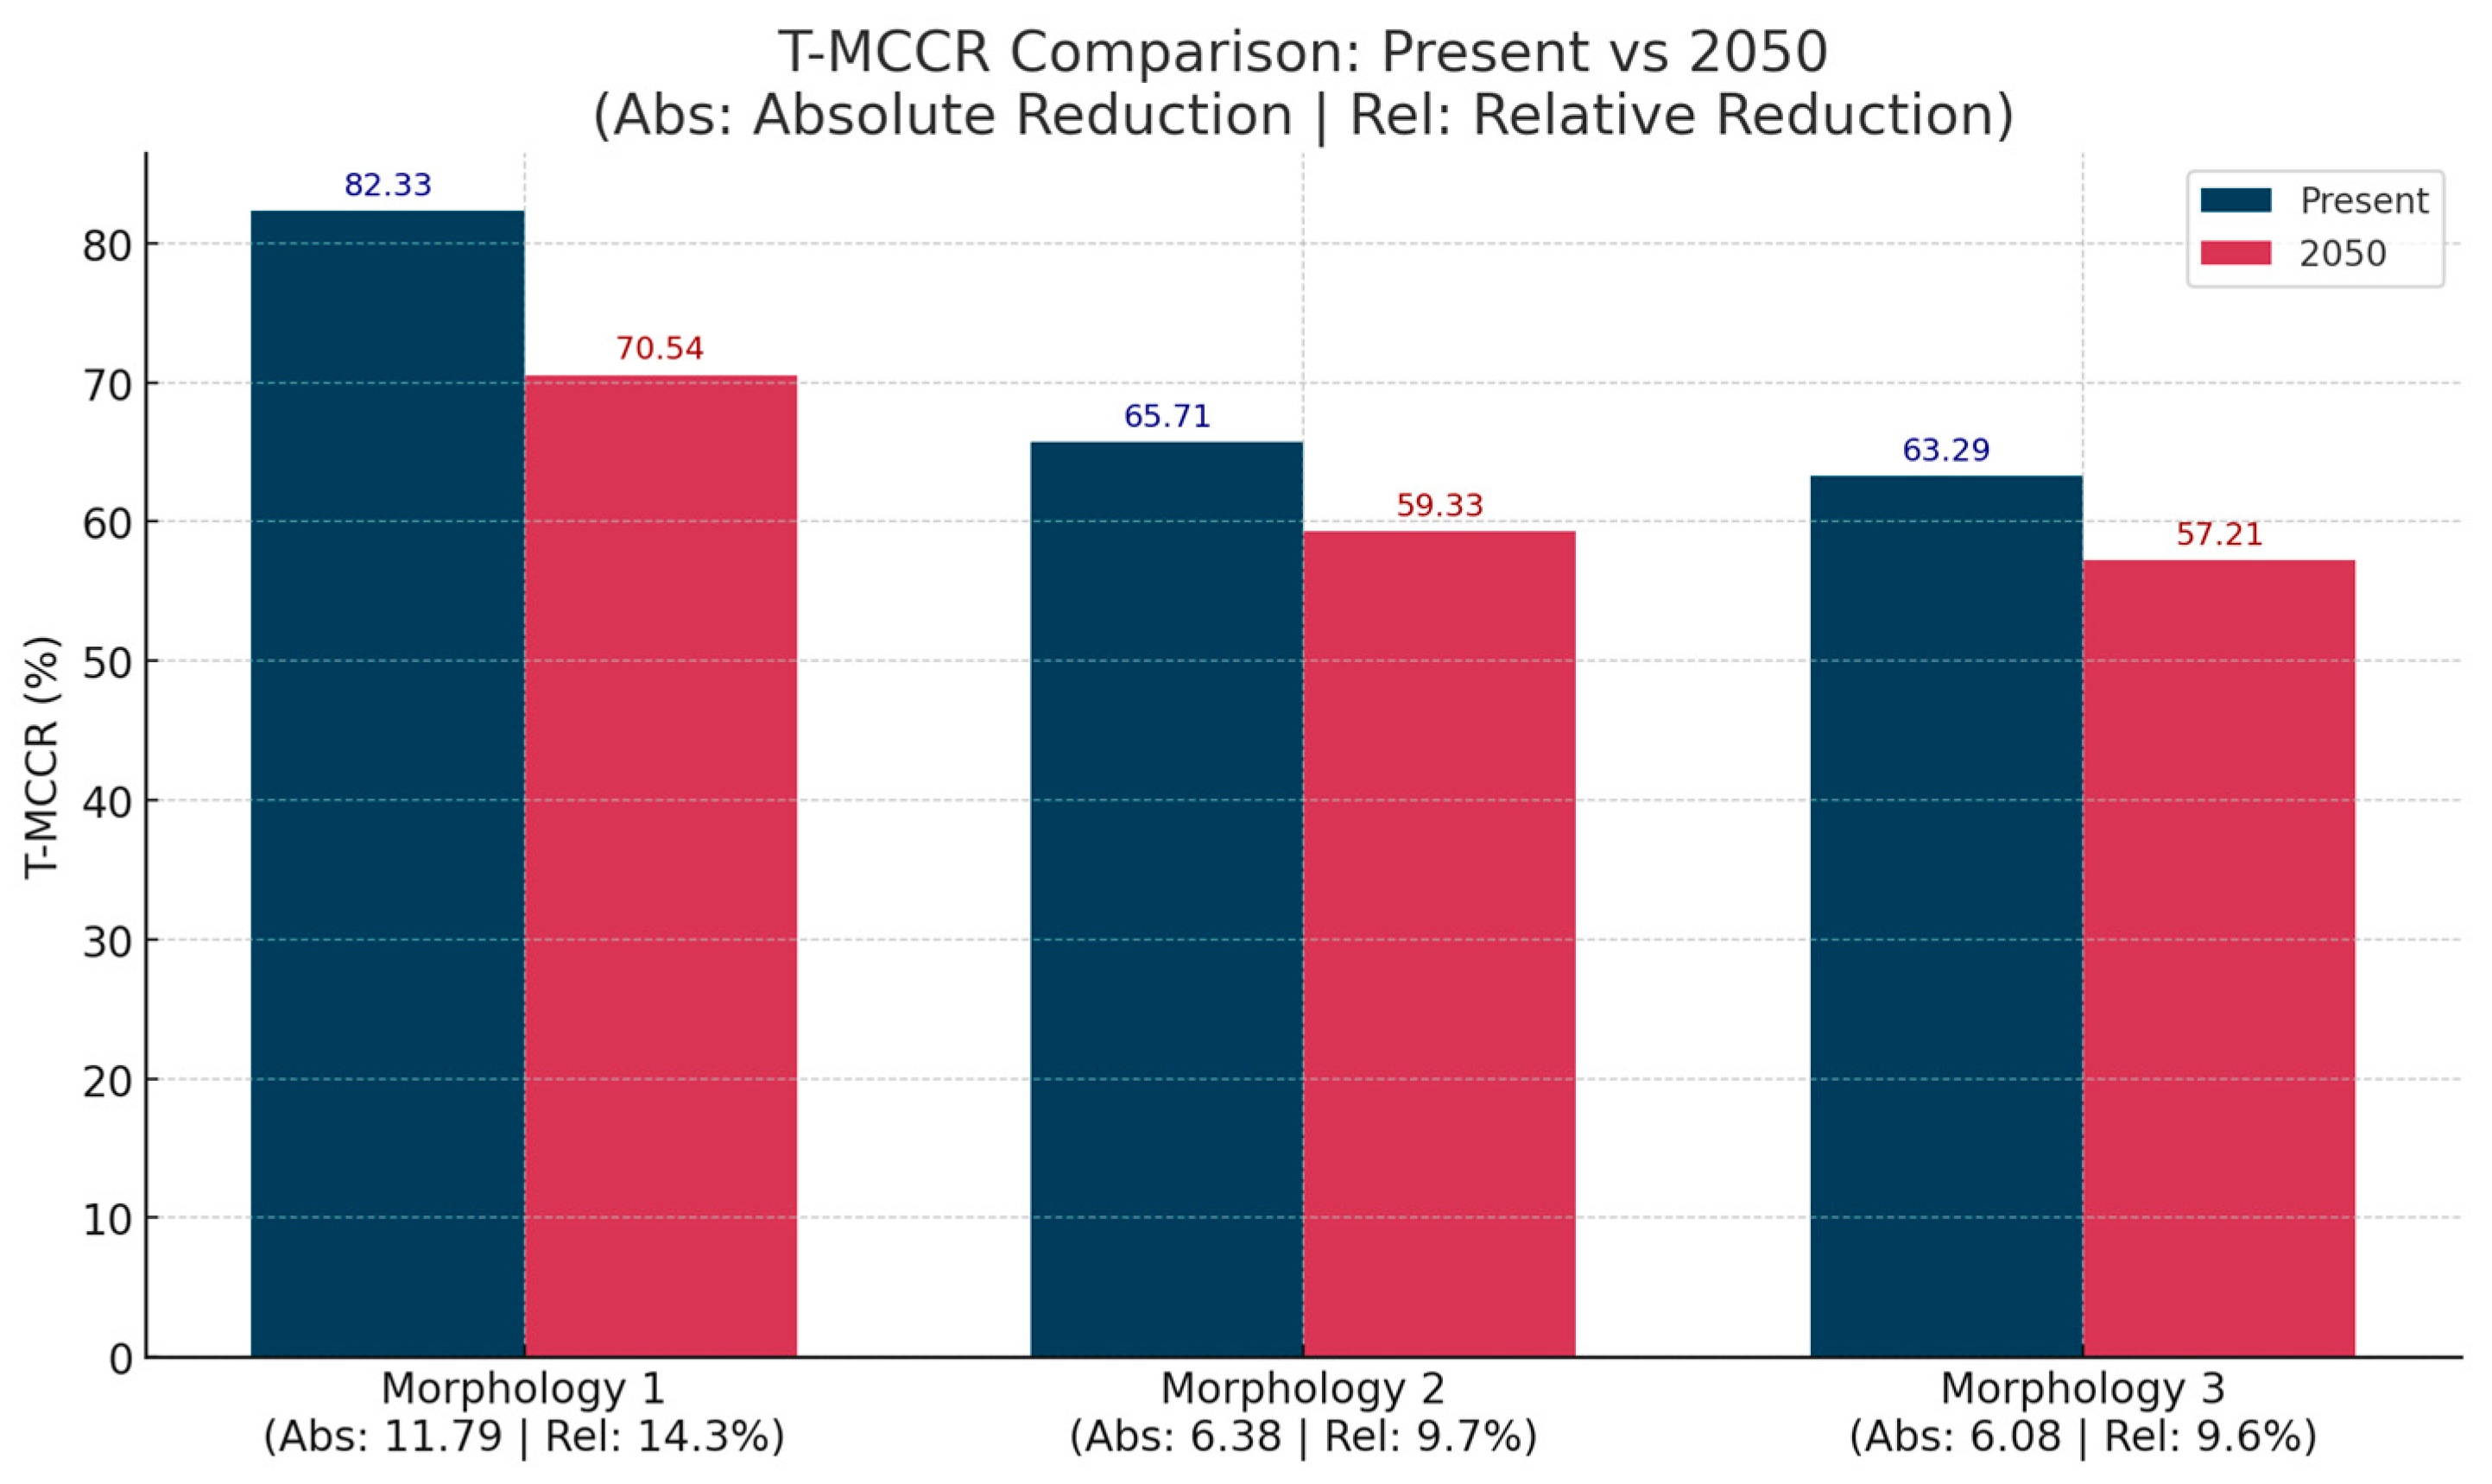
The analysis of the T-MCCR (Time-weighted Morphological Climate Comfort Ratio) (Figure 16) across the three urban morphologies under both current and projected 2050 climate conditions reveals a consistent performance hierarchy. Morphology 1 demonstrates the highest average thermal comfort across the day in both scenarios, with a T-MCCR of 0.82 at present, declining to 0.72 in 2050. Morphology 2 and Morphology 3 follow with lower comfort levels, exhibiting more pronounced reductions under future conditions. Despite the overall climate-induced decline in thermal comfort across all morphologies, Morphology 1 remains the most resilient configuration. These findings highlight the critical role of urban form in maintaining outdoor comfort in the face of climate change and suggest that Morphology 1 offers the best adaptive potential.
The findings of this study offer practical implications for urban designers, planners, and policymakers seeking to improve outdoor thermal comfort in response to climate change. The T-MCCR index, due to its numerical and time-weighted nature, allows for direct benchmarking of different urban morphologies based on their thermal performance. This makes it particularly valuable in early-stage urban design, scenario-based evaluation, and performance-driven planning. Notably, compact and dense morphologies, such as Morphology 1, demonstrated superior resilience even under projected 2050 climate conditions, highlighting the role of urban form in mediating thermal vulnerability. Key parameters such as building density, height-to-width ratios, sky view factor, compactness, vegetation presence, and the continuity of shaded surfaces play an essential role in shaping local microclimates. Higher enclosure and reduced sky exposure generally moderate solar gains and mitigate daytime heat stress, while open and highly fragmented configurations tend to increase radiative load, surface heating, and exposure to direct sunlight. The arrangement and spacing of buildings also influence wind flow patterns, affecting both convective cooling and heat retention. These intrinsic morphological attributes collectively determine how different urban forms respond to climatic drivers, which explains the variation in UTCI-based thermal comfort performance observed across typologies and scenarios. This numerical nature of the T-MCCR index makes it particularly suitable for integration into future optimization-based studies, enabling the systematic evaluation and generation of urban morphologies with enhanced thermal resilience under varying climate scenarios. Its simplicity and adaptability also support incorporation into generative design tools and policy frameworks focused on climate-sensitive and equitable urban transformation.

5. Conclusions

This study introduced the T-MCCR as a metric-based framework for evaluating the thermal comfort performance of urban spaces with different morphologies by explicitly accounting for temporal variation. By integrating spatial comfort ratios within a temporally structured formulation, the proposed index addresses key limitations of existing descriptive and map-based approaches and enables systematic, performance-oriented comparison of urban forms under both current and future climatic conditions.
The application of the T-MCCR to contrasting morphological configurations demonstrated that urban form plays a decisive role not only in the spatial extent but also in the temporal persistence of outdoor thermal comfort. The results further indicate that climate change scenarios amplify performance differences among morphologies, highlighting the importance of considering time-dependent comfort provision rather than relying solely on instantaneous thermal conditions.
While the T-MCCR framework can accommodate differentiated temporal weighting based on patterns of outdoor space use or user behavior, such approaches require high-resolution spatiotemporal occupancy data across different morphological configurations, which are often associated with greater uncertainty than the microclimatic simulation outputs employed in this study. To avoid introducing additional uncertainty, the present application adopts a uniform temporal weighting scheme, allowing for morphological performance to be evaluated primarily as a function of climatic forcing and geometric configuration.
Future research may extend the T-MCCR framework by incorporating user-weighted temporal schemes when reliable occupancy data are available, enabling activity-oriented or program-specific evaluations of outdoor thermal comfort. In parallel, further studies may examine the sensitivity of T-MCCR outcomes to alternative UTCI comfort threshold definitions, assessing the robustness of relative performance rankings across varying comfort ranges. Together, these directions would enhance the robustness, interpretability, and applicability of the T-MCCR framework across diverse climatic and planning contexts.

Author Contributions

Conceptualization, H.A. and D.S.; methodology, H.A.; software, H.A.; validation, D.S.; formal analysis, H.A.; investigation, D.S. and H.A.; data curation, D.S.; writing—original draft preparation, H.A.; writing—review and editing, D.S.; visualization, H.A.; supervision, D.S. All authors have read and agreed to the published version of the manuscript.

Funding

This research received no external funding.

Institutional Review Board Statement

Not applicable.

Informed Consent Statement

Not applicable.

Data Availability Statement

The original contributions presented in the study are included in the article; further inquiries can be directed to the corresponding author.

Conflicts of Interest

The authors declare no conflicts of interest.

Abbreviations

The following abbreviations are used in this manuscript:
T-MCCRTime-weighted Morphological Climate Comfort Ratio
UTCIUniversal Thermal Climate Index
GCIGrid Convergence Index
CFDComputational Fluid Dynamics
SVFSky View Factor
RCPsRepresentative Concentration Pathways
LCZLocal Climate Zones
STOCASpatiotemporal Outdoor Thermal Comfort Availability
EPWEnergyPlus Weather
EWDEntropy Weighted by Distance

Appendix A

Figure A1. Hourly UTCI maps for Typo-Morphology 1 (compact morphology) under present climate conditions.
Urbansci 10 00123 g0a1
Figure A2. Hourly UTCI maps for Typo-Morphology 1 (compact morphology) under the RCP 8.5 climate scenario in 2050.
Urbansci 10 00123 g0a2
Figure A3. Hourly UTCI maps for Typo-Morphology 2 (detached mega-scale buildings) under present climate conditions.
Urbansci 10 00123 g0a3
Figure A4. Hourly UTCI maps for Typo-Morphology 2 (detached mega-scale buildings) under under the RCP 8.5 climate scenario in 2050.
Urbansci 10 00123 g0a4
Figure A5. Hourly UTCI maps for Typo-Morphology 3 (detached small-scale buildings) under present climate conditions.
Urbansci 10 00123 g0a5
Figure A6. Hourly UTCI maps for Typo-Morphology 3 (detached small-scale buildings) under the RCP 8.5 climate scenario in 2050.
Urbansci 10 00123 g0a6

References

  1. Li, L.; Wang, Z.; Zhen, M.; Nan, K. Energy & Buildings Study on Outdoor Thermal Comfort of Older People in Age-Friendly Communities in Cold Regions. Energy Build. 2025, 329, 115265. [Google Scholar] [CrossRef]
  2. Zhao, H.; Ji, W.; Deng, S.; Wang, Z.; Liu, S. Energy & Buildings A Review of Dynamic Thermal Comfort Influenced by Environmental Parameters and Human Factors. Energy Build. 2024, 318, 114467. [Google Scholar] [CrossRef]
  3. Mahdavinejad, M.; Shaeri, J.; Nezami, A.; Goharian, A. Urban Climate Comparing Universal Thermal Climate Index (UTCI) with Selected Thermal Indices to Evaluate Outdoor Thermal Comfort in Traditional Courtyards with BWh Climate. Urban Clim. 2024, 54, 101839. [Google Scholar] [CrossRef]
  4. Li, Z.; Zhou, L.; Hong, X.; Qiu, S. Outdoor Thermal Comfort and Activities in Urban Parks: An Experiment Study in Humid Subtropical Climates. Build. Environ. 2024, 253, 111361. [Google Scholar] [CrossRef]
  5. IPCC. Climate Change 2022: Impacts, Adaptation, and Vulnerability. Contribution of Working Group II to the Sixth Assessment Report of the Intergovernmental Panel on Climate Change; Cambridge University Press: Cambridge, UK; New York, NY, USA, 2022. [Google Scholar]
  6. Karimi, M.; Abdeyazdan, H.; Esmailzadeh, A. Energy for Sustainable Development Optimizing Urban Solar Photovoltaic Potential: A Large Group Spatial Decision-Making Approach for Tehran. Energy Sustain. Dev. 2025, 85, 101689. [Google Scholar] [CrossRef]
  7. Shokri, M.; Mankaa, R.N.; Traverso, M. Geo-Environmental Analysis and Mechanical Properties of Geosynthetics in Railway Components Industry (Sub and Superstructures). J. Clean. Prod. 2025, 501, 145366. [Google Scholar] [CrossRef]
  8. Carlucci, S.; Pagliano, L. A Review of Indices for the Long-Term Evaluation of the General Thermal Comfort Conditions in Buildings. Energy Build. 2012, 53, 194–205. [Google Scholar] [CrossRef]
  9. Park, S.; Tuller, S.E.; Jo, M. Landscape and Urban Planning Application of Universal Thermal Climate Index (UTCI) for Microclimatic Analysis in Urban Thermal Environments. Landsc. Urban Plan. 2014, 125, 146–155. [Google Scholar] [CrossRef]
  10. Fiala, D.; Lomas, K.J.; Stohrer, M. Computer Prediction of Human Thermoregulatory and Temperature Responses to a Wide Range of Environmental Conditions. Int. J. Biometeorol. 2001, 45, 143–159. [Google Scholar] [CrossRef]
  11. Jendritzky, G.; de Dear, R.; Havenith, G. UTCI-Why Another Thermal Index? Int. J. Biometeorol. 2012, 56, 421–428. [Google Scholar] [CrossRef] [PubMed]
  12. Wang, C.; Ürge-vorsatz, D.; Carmeliet, J. Cooling Ef Fi Cacy of Trees across Cities Is Determined by Background Climate, Urban Morphology, and Tree Trait. Commun. Earth Environ. 2024, 5, 754. [Google Scholar] [CrossRef]
  13. Rahman, M.A.; Moser, A.; Rötzer, T.; Pauleit, S. Within Canopy Temperature Differences and Cooling Ability of Tilia Cordata Trees Grown in Urban Conditions. Build. Environ. 2017, 114, 118–128. [Google Scholar] [CrossRef]
  14. Zou, J.; Yu, Y.; Mortezazadeh, M.; Lu, H.; Gaur, A.; Wang, L. Evaluating Climate Change Impacts on Building Level Steady-State and Dynamic Outdoor Thermal Comfort. Build. Environ. 2025, 271, 112604. [Google Scholar] [CrossRef]
  15. Tong, S.; Ebi, K. Preventing and Mitigating Health Risks of Climate Change. Environ. Res. 2019, 174, 9–13. [Google Scholar] [CrossRef] [PubMed]
  16. Xu, Z.; Sheffield, P.E.; Hu, W.; Su, H.; Yu, W.; Qi, X. Climate Change and Children’s Health—A Call for Research on What Works to Protect Children. Int. J. Environ. Res. Public Health 2012, 9, 3298–3316. [Google Scholar] [CrossRef]
  17. Antoniou, N.; Montazeri, H.; Blocken, B.; Neophytou, M. On the Impact of Climate Change on Urban Microclimate, Thermal Comfort, and Human Health: Multiscale Numerical Simulations. Build. Environ. 2024, 260, 111690. [Google Scholar] [CrossRef]
  18. Riahi, K.; Rao, S.; Krey, V.; Cho, C.; Chirkov, V.; Fischer, G.; Kindermann, G.; Nakicenovic, N.; Rafaj, P. RCP 8.5-A Scenario of Comparatively High Greenhouse Gas Emissions. Clim. Change 2011, 109, 33–57. [Google Scholar] [CrossRef]
  19. Isinkaralar, O.; Isinkaralar, K.; Sevik, H.; Küçük, Ö. Thermal Comfort Modeling, Aspects of Land Use in Urban Planning and Spatial Exposition under Future Climate Parameters. Int. J. Environ. Sci. Technol. 2025, 22, 11977–11990. [Google Scholar] [CrossRef]
  20. Zhou, S.; Jia, W.; Diao, H.; Geng, X.; Wu, Y.; Wang, M.; Wang, Y.; Xu, H.; Lu, Y.; Wu, Z. A CycleGAN-Pix2pix Framework for Multi-Objective 3D Urban Morphology Optimization: Enhancing Thermal Performance in High-Density Areas. Sustain. Cities Soc. 2025, 126, 106400. [Google Scholar] [CrossRef]
  21. Qiu, L.; Ma, H.; Yuan, H.; Chen, H. Quantify the Shading Effects on Alleviating Human Thermal Stress across Different Local Climate Zones in the Yangtze River Delta. Build. Environ. 2025, 282, 113249. [Google Scholar] [CrossRef]
  22. Gallacher, C.; Boehnke, D. Pedestrian Thermal Comfort Mapping for Evidence—Based Urban Planning; An Interdisciplinary and User—Friendly Mobile Approach for the Case Study of Dresden, Germany. Int. J. Biometeorol. 2025, 69, 2895–2912. [Google Scholar] [CrossRef]
  23. Benbrahim, R.; Sriti, L.; Besbas, S.; Nocera, F. Assessing the Impact of Urban Area Size on Thermal Comfort in Compact Urban Fabrics Considering the Saharan City of Ghardaïa, Algeria. Sustainability 2025, 17, 2213. [Google Scholar] [CrossRef]
  24. Santucci, D. Impact of Microclimate on People Flows in Dense Urban Space. Ph.D. Thesis, Technische Universität München, Munich, Germany, 2021. [Google Scholar]
  25. Zhao, Y.; Norouzi, H.; Azarderakhsh, M.; AghaKouchak, A. Global Patterns of Hottest, Coldest, and Extreme Diurnal Variability on Earth. Bull. Am. Meteorol. Soc. 2021, 102, E1672–E1681. [Google Scholar] [CrossRef]
  26. Chepfer, H.; Brogniez, H.; Noel, V. Diurnal Variations of Cloud and Relative Humidity Profiles across the Tropics. Sci. Rep. 2019, 9, 16045. [Google Scholar] [CrossRef]
  27. Baruti, M.M.; Johansson, E.; Åstrand, J. Review of Studies on Outdoor Thermal Comfort in Warm Humid Climates: Challenges of Informal Urban Fabric. Int. J. Biometeorol. 2019, 63, 1449–1462. [Google Scholar] [CrossRef] [PubMed]
  28. Shi, Z.; Yang, J.; Wang, L.E.; Lv, F.; Wang, G.; Xiao, X.; Xia, J. Exploring Seasonal Diurnal Surface Temperature Variation in Cities Based on ECOSTRESS Data: A Local Climate Zone Perspective. Front. Public Health 2022, 10, 1001344. [Google Scholar] [CrossRef] [PubMed]
  29. Lauritsen, R.G.; Rogers, J.C. U.S. Diurnal Temperature Range Variability and Regional Causal Mechanisms, 1901–2002. J. Clim. 2012, 25, 7216–7231. [Google Scholar] [CrossRef]
  30. Ekaterinaris, J.A. High-Order Accurate, Low Numerical Diffusion Methods for Aerodynamics. Prog. Aerosp. Sci. 2005, 41, 192–300. [Google Scholar] [CrossRef]
  31. Tominaga, Y.; Wang, L.L.; Zhai, Z.J.; Stathopoulos, T. Accuracy of CFD Simulations in Urban Aerodynamics and Microclimate: Progress and Challenges. Build. Environ. 2023, 243, 110723. [Google Scholar] [CrossRef]
  32. Back, Y.; Kumar, P.; Bach, P.M.; Rauch, W.; Kleidorfer, M. Science of the Total Environment Integrating CFD-GIS Modelling to Re Fi Ne Urban Heat and Thermal Comfort Assessment. Sci. Total Environ. 2023, 858, 159729. [Google Scholar] [CrossRef] [PubMed]
  33. Hu, X.; Yang, X.; Ilhwan Park, G. On the Grid Convergence of Wall-Modeled Large-Eddy Simulation. J. Comput. Phys. 2024, 504, 112884. [Google Scholar] [CrossRef]
  34. Ghavidel, A.; Rashki, M.; Ghohani Arab, H.; Azhdary Moghaddam, M. Reliability Mesh Convergence Analysis by Introducing Expanded Control Variates. Front. Struct. Civ. Eng. 2020, 14, 1012–1023. [Google Scholar] [CrossRef]
  35. Caron, C.; Lauret, P.; Bastide, A. Machine Learning to Speed up Computational Fluid Dynamics Engineering Simulations for Built Environments: A Review. Build. Environ. 2025, 267, 112229. [Google Scholar] [CrossRef]
  36. Baker, N.; Kelly, G.; O’Sullivan, P.D. A Grid Convergence Index Study of Mesh Style Effect on the Accuracy of the Numerical Results for an Indoor Airflow Profile. Int. J. Vent. 2020, 19, 300–314. [Google Scholar] [CrossRef]
  37. Pađen, I.; Peters, R.; García-Sánchez, C.; Ledoux, H. Automatic High-Detailed Building Reconstruction Workflow for Urban Microscale Simulations. Build. Environ. 2024, 265, 111978. [Google Scholar] [CrossRef]
  38. Liu, Z.; Zhong, P.; Qiu, H.; Wang, M.; Tian, W.; Su, G. Verification and Validation plus Uncertainty Quantification of Heat Transfer Simulation for Liquid Metal in Wire-Wrapped Rod Assembly. Int. Commun. Heat Mass Transf. 2025, 165, 109114. [Google Scholar] [CrossRef]
  39. Nazarnia, N.; Harding, C.; Jaeger, J.A.G. How Suitable Is Entropy as a Measure of Urban Sprawl? Landsc. Urban Plan. 2019, 184, 32–43. [Google Scholar] [CrossRef]
  40. Rakhmatulloh, A.R.; Dewi, D.I.K.; Syahri, E.K. Spatial Entropy Model for the Impact Assessment of Built Environment on Urban Street Design. IOP Conf. Ser. Earth Environ. Sci. 2023, 1264, 012047. [Google Scholar] [CrossRef]
  41. Zhang, P.; Ghosh, D.; Park, S. Spatial Measures and Methods in Sustainable Urban Morphology: A Systematic Review. Landsc. Urban Plan. 2023, 237, 104776. [Google Scholar] [CrossRef]
  42. Dewa, D.D.; Buchori, I.; Sejati, A.W.; Liu, Y. Shannon Entropy-Based Urban Spatial Fragmentation to Ensure Sustainable Development of the Urban Coastal City: A Case Study of Semarang, Indonesia. Remote Sens. Appl. Soc. Environ. 2022, 28, 100839. [Google Scholar] [CrossRef]
  43. Fistola, R. Urban Entropy vs Sustainability: A New Town Planning Perspective. WIT Trans. Ecol. Environ. 2011, 155, 195–204. [Google Scholar] [CrossRef]
  44. Ping, D.; Li, C.; Yu, X.; Liu, Z.; Tu, R.; Zhou, Y. City-Scale Information Modelling for Urban Energy Resilience with Optimal Battery Energy Storages in Hong Kong. Appl. Energy 2025, 378, 124813. [Google Scholar] [CrossRef]
  45. Ji, Y.; Liu, Y.; Tang, H.; Li, Z.; Bai, Y.; Feng, T. Stratified Strategies for Enhancing Thermal Comfort through Multidimensional Compactness Optimization in Urban Built-up Areas during Heatwaves. Sustain. Cities Soc. 2025, 127, 106445. [Google Scholar] [CrossRef]
  46. Hertel, D.; Schlink, U. Entropy Frameworks for Urban Heat Storage Can Support Targeted Adaptation Strategies. Urban Clim. 2022, 42, 101129. [Google Scholar] [CrossRef]
  47. Altieri, L.; Cocchi, D.; Roli, G. A New Approach to Spatial Entropy Measures. Environ. Ecol. Stat. 2018, 25, 95–110. [Google Scholar] [CrossRef]
  48. Lovric, M. (Ed.) International Encyclopedia of Statistical Science; Springer: Berlin/Heidelberg, Germany, 2025; ISBN 978-3-662-69358-2. [Google Scholar]
  49. Naimi, B.; Hamm, N.A.S.; Groen, T.A.; Skidmore, A.K.; Toxopeus, A.G.; Alibakhshi, S. ELSA: Entropy-Based Local Indicator of Spatial Association. Spat. Stat. 2019, 29, 66–88. [Google Scholar] [CrossRef]
  50. Wang, R.; Liu, X.; Zhao, X.; Cheng, X.; Qiu, H. A Novel Entropy-Based Method for Quantifying Urban Energy Demand Aggregation: Implications for Urban Planning and Policy. Sustain. Cities Soc. 2024, 103, 105284. [Google Scholar] [CrossRef]
  51. Roszkowska, E.; Wachowicz, T. Impact of Normalization on Entropy-Based Weights in Hellwig’s Method: A Case Study on Evaluating Sustainable Development in the Education Area. Entropy 2024, 26, 365. [Google Scholar] [CrossRef]
  52. Scale, U.; Hub, U.; Coccolo, S.; Corre, O.L.; Naboni, E. ScienceDirect ScienceDirect ScienceDirect Distributed Systems and Mean Cooling Radiant of International Simulation Tools for the Temperature in Using an for Outdoor Space An Assessing Predicting the Mean Radiant Overview of Simulation the Feasibility Tools of the Heat Temperature in an Space Temperature Function for a Meloni District Heat Demand Forecast. Energy Procedia 2017, 122, 1111–1116. [Google Scholar] [CrossRef]
  53. ISO 7726; Ergonomics of the Thermal Environment—Instruments for Measuring Physical Quantities. International Organization for Standardization (ISO): Geneva, Switzerland, 1998.
  54. VDI 3787 Part 2; Environmental Meteorology—Methods for the Human Biometeorological Evaluation of Climate and Air Quality for Urban and Regional Planning. Verein Deutscher Ingenieure (VDI): Düsseldorf, Germany, 2008.
  55. d’Ambrosio Alfano, F.R.; Olesen, B.W.; Palella, B.I.; Pepe, D. Working with Different Building Energy Performance Tools: From Input Data to Energy and Indoor Temperature Predictions. Energies 2023, 16, 743. [Google Scholar] [CrossRef]
  56. Naboni, E.; Meloni, M.; Mackey, C.; Kaempf, J. The Simulation of Mean Radiant Temperature in Outdoor Conditions: A Review of Software Tools Capabilities. In Proceedings of the 16th IBPSA Conference, Rome, Italy, 2–4 September 2019; pp. 3234–3241. [Google Scholar] [CrossRef]
  57. Guo, H.; Aviv, D.; Loyola, M.; Teitelbaum, E.; Houchois, N.; Meggers, F. On the Understanding of the Mean Radiant Temperature within Both the Indoor and Outdoor Environment, a Critical Review. Renew. Sustain. Energy Rev. 2020, 117, 109207. [Google Scholar] [CrossRef]
Figure 1. Blue tones indicate cold stress categories, while orange and red tones represent heat stress categories. The highlighted dashed area marks the comfort zone considered in this study.
Urbansci 10 00123 g001
Figure 2. Temperature and relative humidity variation in hottest and coldest day in different climate zones.
Urbansci 10 00123 g002
Figure 3. Conceptual framework illustrating how the T-MCCR index addresses existing gaps in conventional UTCI-based thermal comfort assessment. Solid arrows indicate the analytical progression from meteorological and morphological inputs to UTCI mapping and gap identification. The dashed boundaries represent conceptual groupings, while the highlighted T-MCCR block illustrates the proposed solution and its advantages.
Urbansci 10 00123 g003
Figure 4. Monthly mean climatic variables derived from EPW files for Aachen, comparing present climate conditions with future projections under the RCP 8.5 scenario (2050).
Urbansci 10 00123 g004
Figure 5. Role of parcel center points in Grid Convergence Index (GCI) evaluation for UTCI and entropy-weighted distance (EWD) analyses.
Urbansci 10 00123 g005
Figure 6. Application of GCI in a UTCI-based thermal comfort analysis, Red dots represent parcel center points (receptors) used for UTCI evaluation regarding GCI analysis.
Urbansci 10 00123 g006
Figure 7. Spatial distribution of UTCI values across three grid resolutions: 2 m × 2 m, 4 m × 4 m, and 8 m × 8 m.
Urbansci 10 00123 g007
Figure 8. Weighting methods within the T-MCCR framework. The yellow box represents user-attendance weighting (human exposure–based temporal weighting), whereas the pink box denotes uniform time-aggregated weighting. Clock symbols indicate temporal variability, human icons represent user presence, and building icons illustrate the variation of thermal comfort levels across urban morphologies at different hours.
Urbansci 10 00123 g008
Figure 9. Comparison of clustered and dispersed spatial distributions of comfortable parcels using the Entropy Weighted by Distance (EWD) metric. Green markers represent comfortable parcels, while black crosses denote uncomfortable parcels. Blue lines illustrate the spatial distances between comfortable parcels used in the EWD calculation.
Urbansci 10 00123 g009
Figure 10. Overview of the methodological workflow for grid-based UTCI simulation.
Urbansci 10 00123 g010
Figure 11. Selected urban areas in Aachen categorized into three typo-morphologies used for T-MCCR analysis.
Urbansci 10 00123 g011
Figure 12. LCZ-based typo-morphological classification of the study area.
Urbansci 10 00123 g012
Figure 13. Hourly Climate Comfort Ratio (CCR) comparison across the three typo-morphologies under present climate conditions.
Urbansci 10 00123 g013
Figure 14. Hourly Climate Comfort Ratio (CCR) projections for 2050 under the RCP 8.5 scenario.
Urbansci 10 00123 g014
Figure 15. Comparison of hourly Comfortable Grid Ratio (CGR) between present and 2050 (RCP 8.5) climate scenarios across all three typo-morphologies.
Urbansci 10 00123 g015
Figure 16. T-MCCR values for the three typo-morphologies under present and 2050 (RCP 8.5) climate scenarios.
Urbansci 10 00123 g016
Table 1. Quantitative morphological indicators of the selected urban typo-morphologies.
TYPO-MORPHOLOGYSITE AREA (M2)BUILDING FOOTPRINT (M2)UNBUILT AREA (M2)GROSS FLOOR AREA (M2)BUILDING COVERAGE RATIO (%)FAR
TYPO-MORPHOLOGY 1109,85152,28157,570141,69447.61.29
TYPO-MORPHOLOGY 2109,85127,04782,804102,83624.60.94
TYPO-MORPHOLOGY 3109,85118,88290,96919,17017.20.17
Disclaimer/Publisher’s Note: The statements, opinions and data contained in all publications are solely those of the individual author(s) and contributor(s) and not of MDPI and/or the editor(s). MDPI and/or the editor(s) disclaim responsibility for any injury to people or property resulting from any ideas, methods, instructions or products referred to in the content.