Article

Proteomic Differences in the Hypothalamus May Influence Weight Gain in Rats Fed a Cafeteria Diet


by
Sergio Guzmán-Rodríguez
1,†,
Judith Nwaiwu
2,†,
Cristian D. Gutiérrez-Reyes
2,
Ricardo Romero-Guevara
1,
Jesús Chávez-Reyes
1,
Favour Chukwubueze
2,
Oluwatosin Daramola
2,
Tuli Bhattacharjee
2,
Yehia Mechref
2 and
Bruno Antonio Marichal-Cancino
1,*
1
Department of Physiology and Pharmacology, Center of Basic Sciences, Autonomous University of Aguascalientes, Aguascalientes 20100, Mexico
2
Department of Chemistry and Biochemistry, Texas Tech University, Lubbock, TX 79409, USA
*
Author to whom correspondence should be addressed.
These authors contributed equally to this work.
Submission received: 4 February 2026 / Revised: 30 March 2026 / Accepted: 2 April 2026 / Published: 14 April 2026
(This article belongs to the Special Issue One Health)

Abstract

Eating behavior requires a balance between metabolic and hedonic components. Anxiety and dietary type may influence the quantity, patterns, and other aspects of food intake. Modern diets, especially in Western societies, often contain high levels of calories from fat and simple sugars (e.g., cafeteria-style diets). This type of diet may promote overweight and/or obesity in some, although many consumers remain at a normal weight. The mechanisms underlying susceptibility or resistance to weight gain remain unclear. Here, Sprague-Dawley male rats were fed a cafeteria diet for 10 weeks and then classified into quartiles based on body mass. We evaluated locomotor activity and anxiety-like behaviors and analyzed hypothalamic proteomics in overweight (Q4) rats compared with underweight (Q1) rats. Our results showed that locomotor activity and anxiety-like behaviors did not differ across quartiles (p > 0.05). Nevertheless, the expression of several hypothalamic proteins differed between Q4 and Q1 rats. Functional enrichment analysis of these differentially expressed proteins (p ≤ 0.05) revealed changes in cytoskeleton dynamics, synaptic communication, energy production and utilization, biosynthesis of cellular components (including nucleotides and carbohydrates), and regulation of metabolism between Q1 and Q4 rats. Neuro-humoral hypothalamic output regulates metabolism and food intake. Therefore, these functional changes in the hypothalamus may be associated with rats’ susceptibility/resistance to weight gain.

1. Introduction

Obesity has increasingly become a significant public health concern. Obesity has a chronic and non-communicable nature characterized by abnormal or excessive fat accumulation that poses substantial health risks, including hyperlipidemia, hypertension, and type 2 diabetes [1]. Like other chronic diseases, obesity is multifactorial, heterogeneous in presentation, and often progressive [2,3]. However, the classification of obesity as a disease does not automatically translate into its consistent recognition and management as such by health care professionals [4]. The etiology of obesity is shaped by multiple interacting determinants, including caloric intake, metabolic efficiency, level of physical activity, coexisting endocrine disorders (e.g., Cushing’s syndrome), eating behaviors, dietary composition (e.g., cafeteria-type diets), genetic predisposition, and emerging omics-based factors (e.g., proteomics and metabolomics). Susceptibility to obesity cannot be adequately explained by a body mass index (BMI) > 30 alone; for instance, variations in the muscle-to-fat ratio are associated with differing disease risks [5]. Furthermore, indirect influences, such as psychological states and environmental conditions, may disrupt molecular pathways and further increase vulnerability to obesity. Consequently, approaches to assessing and managing obesity must extend beyond BMI to incorporate a more comprehensive framework that accounts for physical activity, body composition, dietary patterns, eating behavior, metabolic status, genetic background, and molecular signatures [6]. Such an integrative approach may facilitate the development of more precise and individualized interventions. Given the interplay of these factors, it is unsurprising that individuals with similar environmental exposures and dietary patterns may attain markedly different weight outcomes, ranging from underweight to obesity.
Food-eating behavior is regulated by the central nervous system (CNS), primarily in the hypothalamus [7,8,9]. The hypothalamus integrates afferent signals from the gut and brainstem while generating efferent signals that govern food intake. Several nuclei and neuronal circuits within the hypothalamus contribute to the regulation of feeding behavior [10]. Peptides and lipids from viscera such as the pancreas, the gut/intestine, and the perivisceral adipose tissue control the hypothalamic activity via the arcuate nucleus [11,12,13]. This peripheral/hypothalamic axis regulates satiety and feeding anxiety, which may impact food intake, especially when hypercaloric food is available [14]. In this sense, the high-calorie diet would compensate for the emotional discomfort (such as anxiety) produced by chronic stress by generating a hedonic response [15,16]. Thus, differences in hypothalamic function may explain why some individuals exposed to the same diet appear more susceptible (or resistant) to gaining weight. Previous studies by Levin and colleagues demonstrated that Sprague-Dawley rats exhibit heterogeneous susceptibility to diet-induced obesity when exposed to high-energy diets. Selective breeding experiments have shown that obesity-prone and obesity-resistant phenotypes can emerge within this strain, suggesting that intrinsic biological differences influence weight gain responses to obesogenic diets [17]. These findings support the notion that variability in metabolic and neurobiological mechanisms may underlie differential susceptibility to obesity.
Changes in hypothalamic protein expression patterns could explain alterations in feeding behaviors. The metaproteomic profile of a rat’s hypothalamus includes at least eighty-six proteins with metabolic functions correlated with obesity [18]. According to Wi et al. [19], the hypothalamic proteome plays a critical role in determining susceptibility to diet-induced overweight and obesity by controlling hypothalamic neuronal activity [19]. In addition, the hypothalamic–pituitary–adrenal (HPA) axis influences feeding behavior through hypothalamic circuits that regulate stress and appetite. Under cafeteria diets and chronic stress, this interaction promotes the intake of calorie-dense foods and exacerbates weight gain. Hence, our study analyzed anxiety-like behaviors and the hypothalamic proteome of rats fed a cafeteria diet for several weeks to identify potential signaling pathways and biological processes involved in susceptibility to or resistance to weight gain. Hypothalamic proteomics was studied using a sensitive analytical technique, liquid chromatography–tandem mass spectrometry (LC-MS/MS), which has been widely used for the analysis of biological samples [20,21,22].
Although cafeteria diet models have been widely used to induce obesity in rodents, less attention has been paid to the biological mechanisms underlying inter-individual variability in weight gain under identical dietary conditions. Identifying hypothalamic molecular signatures associated with susceptibility or resistance to diet-induced weight gain may provide insights into the neurobiological mechanisms contributing to obesity risk.

2. Materials and Methods

2.1. Animals

Thirty preadolescent male Sprague-Dawley rats with a weight of 60–100 g (at the beginning of the experiments) from the vivarium of the Autonomous University of Aguascalientes were housed in four home cages (7–8 each). They were in the research vivarium habitat for a week before any manipulation. All rats in this study were housed in a 12/12 h light/dark cycle (starting at 10:00 a.m.) at a constant temperature of 22 ± 1 °C and a humidity of 50%. In all the cages access was provided to standard food, a cafeteria diet, and water ad libitum. We recorded the rats’ body mass weekly. Halfway through the experiment, a rat developed otitis, so it was separated, treated, and excluded from the experiment.
The experimental protocol was carried out with the permission of the Institutional Ethics Committee (PIFF24-1 CEADIUAA—approved 28 June 2022) and in strict adherence to the national and international standards for the use of laboratory animals of the United States of America and the Animal Research: Reporting of In Vivo Experiments (ARRIVE) [23,24].

2.2. Access to Overfeeding and Quartile Classification

The animals had free access to an overfeeding protocol using the cafeteria diet, adapted from previous studies [25]. The diet contained 400 g of sausage, 200 g of Oreo biscuits, 200 g of Maria biscuits, 300 g of lard, 100 g of pancake flour, and 300 g of rodent standard pellet powder (Purina®, Rodent Laboratory Chow, Irapuato, Guanajuato, Mexico). Briefly, the ingredients were mixed entirely to form a croquette, then wrapped and refrigerated at −5 °C. The overfeeding period lasted 10 weeks.
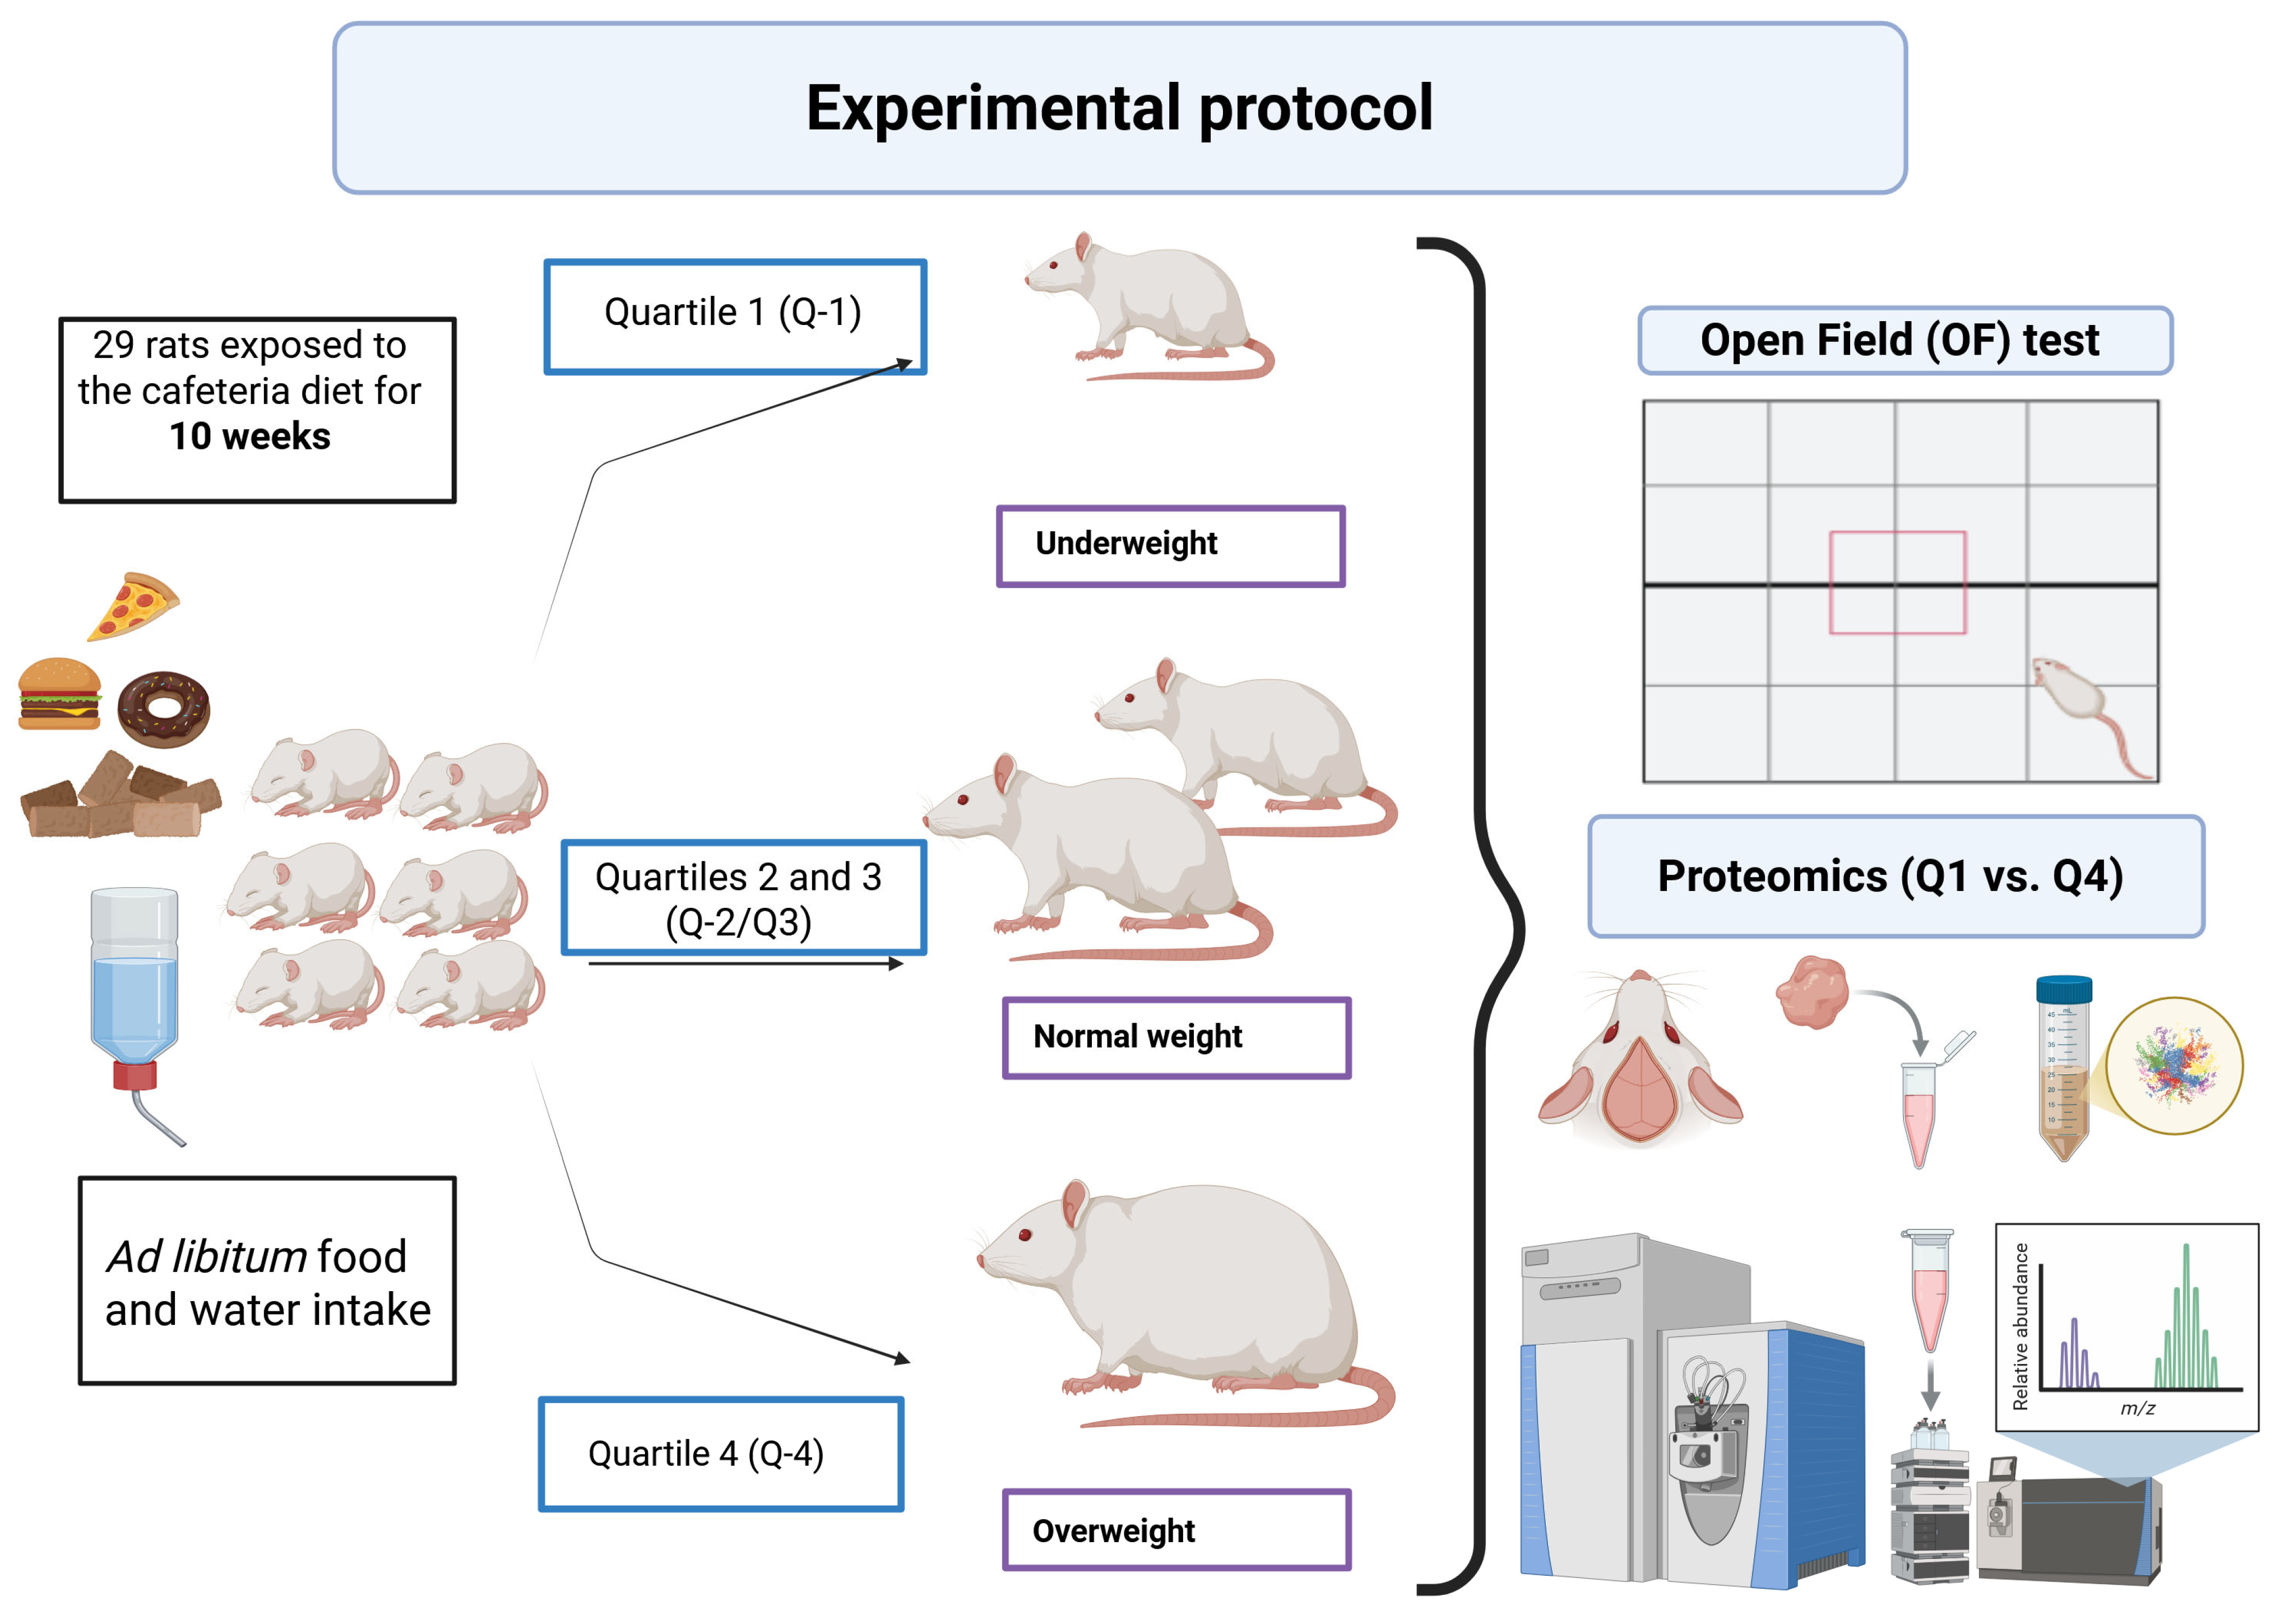
After the overfeeding period, animal databases were categorized based on their body weight into quartiles as resistant to obesity (Q1), normal weight (Q2–Q3), and susceptible to obesity (Q4) (Table 1).

2.3. Open-Field Test

The anxiety-like response was assessed using the open-field test. Our paradigm layout consisted of a square-shaped platform (60 cm per side). The apparatus had a black background, divided into two main regions: a central area (20 cm per side) and the periphery. Each rat was allowed to explore the apparatus freely for three minutes. The open-field test was conducted at the end of the 10-week cafeteria diet feeding period during the light phase of the cycle under controlled environmental conditions between 10 and 11 am. They were video-recorded, and the parameters of rearing (standing on their hind legs), grooming, and visits to central quadrants and periphery were determined visually from each video and the time spent per quadrant, distance traveled, and freezing behavior were analyzed digitally by using Fiji (Image J) software v. 1.54p [26] which was incorporated with the plug-in Animal Tracker API [27].

2.4. Hypothalamus Extraction

The hypothalamus was extracted after sacrifice at the end of the experiments. It was identified visually, as described previously [2,28] at stereotaxic coordinates AP: −3.36; ML: 2.0; and DV: 8.0, as indicated by Paxinos and Watson [29]. The extraction was done after a sagittal cut and segmentation of the thalamus between the optic chiasm and the cerebellum. The hypothalamus, a circular tissue mass of approximately 0.5 cm in length, was stored at −80 °C for cryopreservation.
The anesthetic used to slaughter the animals was isoflurane (Sofloran®, Laboratorios PiSA S.A. de C.V., Guadalajara, Jalisco, Mexico).

2.5. Tissue Lysis and Protein Extraction

The frozen hypothalamus tissues (stored at −80 °C) were obtained and thawed. To lyse the tissues, each sample was transferred into a 2 mL microcentrifuge tube containing ~100 mg of 400 µm zirconium beads. About 150 µL of 50 mM Ammonium bicarbonate (ABC) buffer and 150 µL of 5% sodium deoxycholate (SDC) were added to the tubes. The samples were homogenized using Beadbug microtube homogenizer (Benchmark Scientific, Edison, NJ, USA) at 4000 g for 30 s. This process was repeated three times with a 30 s interlude before sonicating on ice for 1 h. Subsequently, the samples were centrifuged at 14,800× g for 10 min, and the protein-containing supernatant was collected into a new tube. Protein concentrations were determined using a bicinchoninic acid (BCA) assay kit (Thermo Scientific, Pittsburgh, PA, USA).

2.6. Tryptic Digestion

A total of 50 µg of protein from each sample was obtained from the tissue stock and transferred to a new 1.5 mL Eppendorf tube. The proteins were denatured at 90 °C for 15 min, then reduced by adding 1.25 µL of 200 mM dithiothreitol (DTT) and incubated at 60 °C for 45 min. Reduction was followed by alkylation with 5 µL of iodoacetamide (IAA) and incubated at 37.5 °C for 45 min. To terminate the alkylation reaction, 1.25 µL of DTT was added, and the mixture was incubated at 37.5 °C for 30 min. Proteins were digested with trypsin enzyme at a 1:25 (enzyme-to-protein) mass ratio and incubated at 37.5 °C overnight (~18 h). Digestion was halted with 1 µL of formic acid, and the samples were dried using a SpeedVac concentrator. Peptides were subsequently purified using a top-tip C18 desalting protocol and then dried in a SpeedVac concentrator. Dried purified peptides were resuspended in 2% ACN, 98% HPLC-grade water, and 1% formic acid to a concentration of 1 µg/µL before LC–MS/MS analysis.

2.7. Proteomics LC-MS/MS Conditions

A total of 1 µg of each sample was injected into the nano UltiMate 3000 Nano UHPLC system (Thermo Sci., San Jose, CA, USA) coupled with an Orbitrap Fusion Lumos mass spectrometer (Thermo Sci., San Jose, CA, USA) operated in positive mode. Mobile phase A (MPA) consisted of 2% ACN in HPLC-grade water with 0.1% FA, while mobile phase B (MPB) was 100% ACN with 0.1% FA. Samples were loaded onto an Acclaim PepMap 100 C18 trapping column (75 μm × 2 cm, 3 μm particle size, 100 Å pore size; Thermo Scientific, Pittsburgh, PA, USA), followed by chromatographic separation on a reversed-phase C18 Acclaim PepMap column (15 cm × 75 μm; Thermo Scientific, Pittsburgh, PA, USA). The column temperature was maintained at 29.5 °C throughout the 120 min analysis. The applied multistep gradient started at 5% MPB for 10 min; 30% for 75 min; 50% for 13 min; and 90% for 2 min, and was kept at 90% for 4 min to wash the column. Finally, it was decreased to 5% MPB over 1 min and maintained for 4 min to equilibrate the column. The separated peptides were analyzed in the positive mode on the Orbitrap mass analyzer. The full MS spectra were acquired using the Orbitrap mass analyzer at a resolution of 120 K, with a mass-to-charge (m/z) range of 350–1800. The AGC target value was set to 1 × 10⁶, and the maximum injection time was set to auto; the RF lens was set at 30%. The dynamic exclusion parameters were as follows: repeat count 1, exclusion duration 60 s, and mass tolerance 10 ppm. The MS2 scan was generated in a data-dependent acquisition mode, with the top 20 most intense precursor ions selected for fragmentation using stepped higher-energy collision dissociation (HCD) at 15%, 25%, and 35%. The isolation mode was the quadrupole with an isolation window of 1.6 m/z. The AGC target value was set to 1 × 10⁶, and the maximum injection time was set to auto. Charge states 2–8 were included, and the normalized AGC target was 100%.

2.8. Proteomic Data Analyses

Proteome Discoverer 2.5 (version 2.50.400) was used to analyze raw proteomics data. The raw data were searched using Sequence against the Swiss-Prot rat fasta downloaded on 20 March 2025 from Uniprot. Carbamidomethylating of cysteine was set as a fixed modification, while oxidation of methionine and acetylation of the protein N-terminal were set as variable modifications. Only proteins with more than one peptide were considered for further analysis. Precursor mass tolerance was 10 ppm while fragment mass tolerance was 0.02 ppm. The false discovery rate (FDR) for proteins and peptides was 1% at the high-confidence level. Protein abundances were normalized relative to the total number of identified proteins in each sample. Normalized data were used for statistics. Groups were statistically compared to identify differences in protein expression.
We performed a functional enrichment analysis using the open software Cytoscape v. 3.10.3 and its built-in “Clue Go app” [12,13,14]. The objective was to identify the “terms” (biological process, molecular function, cellular compartment, pathways) enriched through association with the detected proteins. Only proteins that were differentially expressed between quartiles Q1 and Q4 (p ≤ 0.05) were used for the analysis (Figure 1).

Data and Statistics

Behavioral metrics were subjected to one-way analysis of variance (ANOVA), followed by Fisher’s least significant difference (LSD) post hoc test for multiple pairwise comparisons. The proteomic data quality was first corrected using Benjamini–Hochberg false discovery rate (FDR) procedure, obtaining an adjusted p-value ≤ 0.05 for identified peptides. The relative abundance of each peptide was used for Student’s t-test comparison between groups.

3. Results

3.1. Effects of the Cafeteria Diet on Body Mass

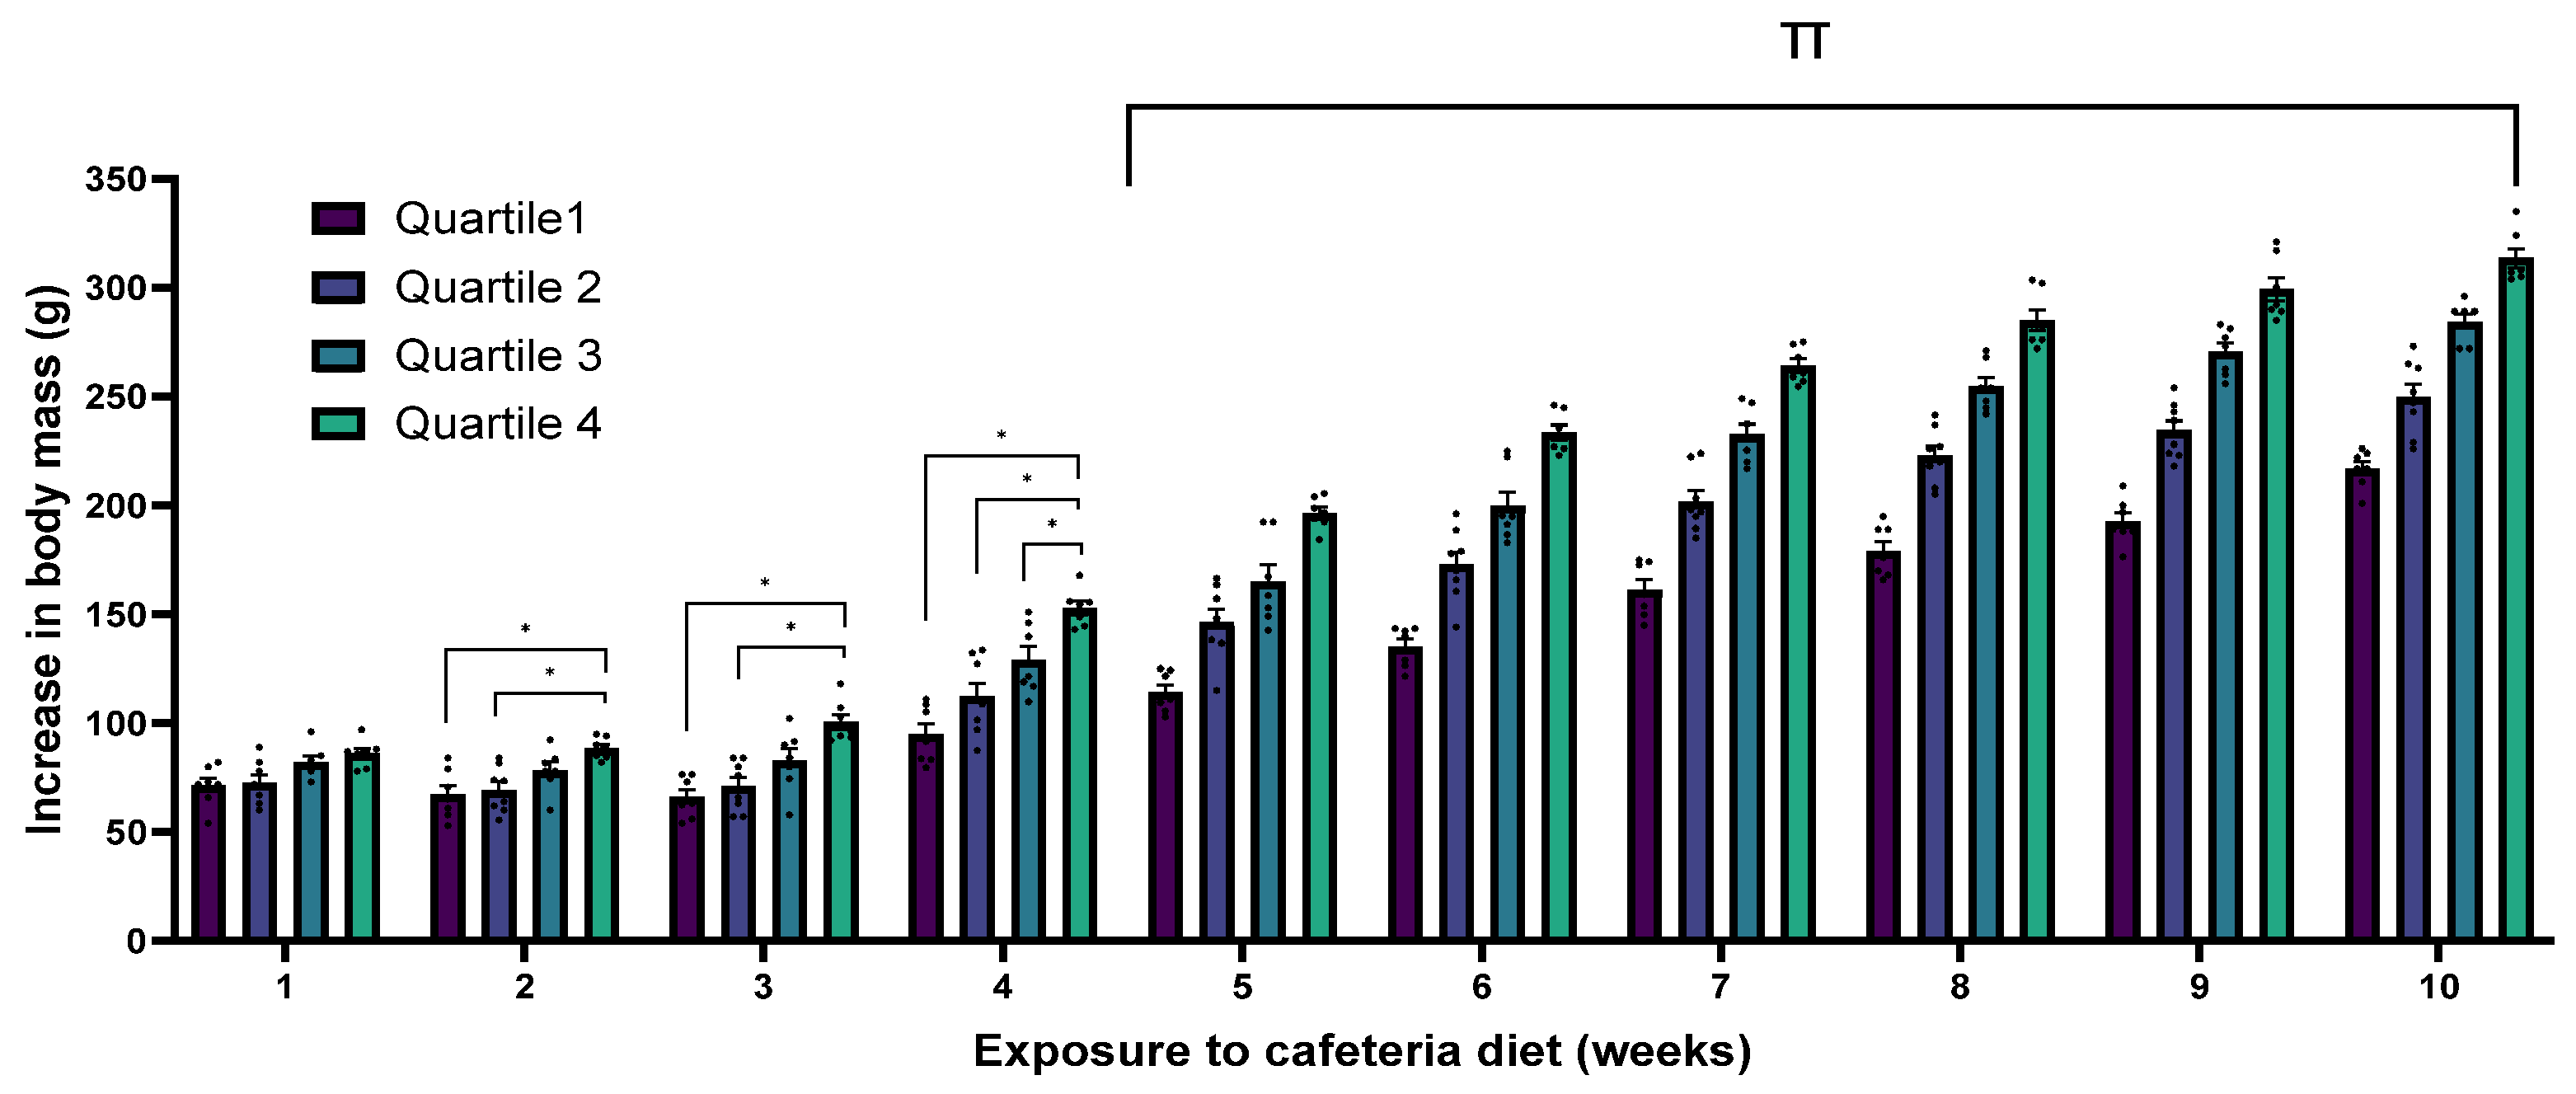
After 10 weeks of cafeteria diet feeding, rats showed marked differences in body weight (Figure 2 and Table 1). The 29 rats were ranked by weight and assigned to quartiles. Table 1 shows descriptive statistics for each quartile after the 10 weeks of cafeteria diet feeding. According to this classification, body mass increase was retrospectively evaluated. Figure 2 illustrates the increase in body mass resulting from the cafeteria diet. In the second and third weeks, animals from the fourth quartile (Q4) showed a higher body mass compared to those from the first (Q1) and second (Q2) quartiles (p < 0.05). During the fourth week, animals from Q4 were significantly heavier than those from the other quartiles (i.e., Q1, Q2, and Q3; p < 0.05). From the fifth week, all quartiles differed significantly from one another (p < 0.05).

3.2. Open-Field Paradigm

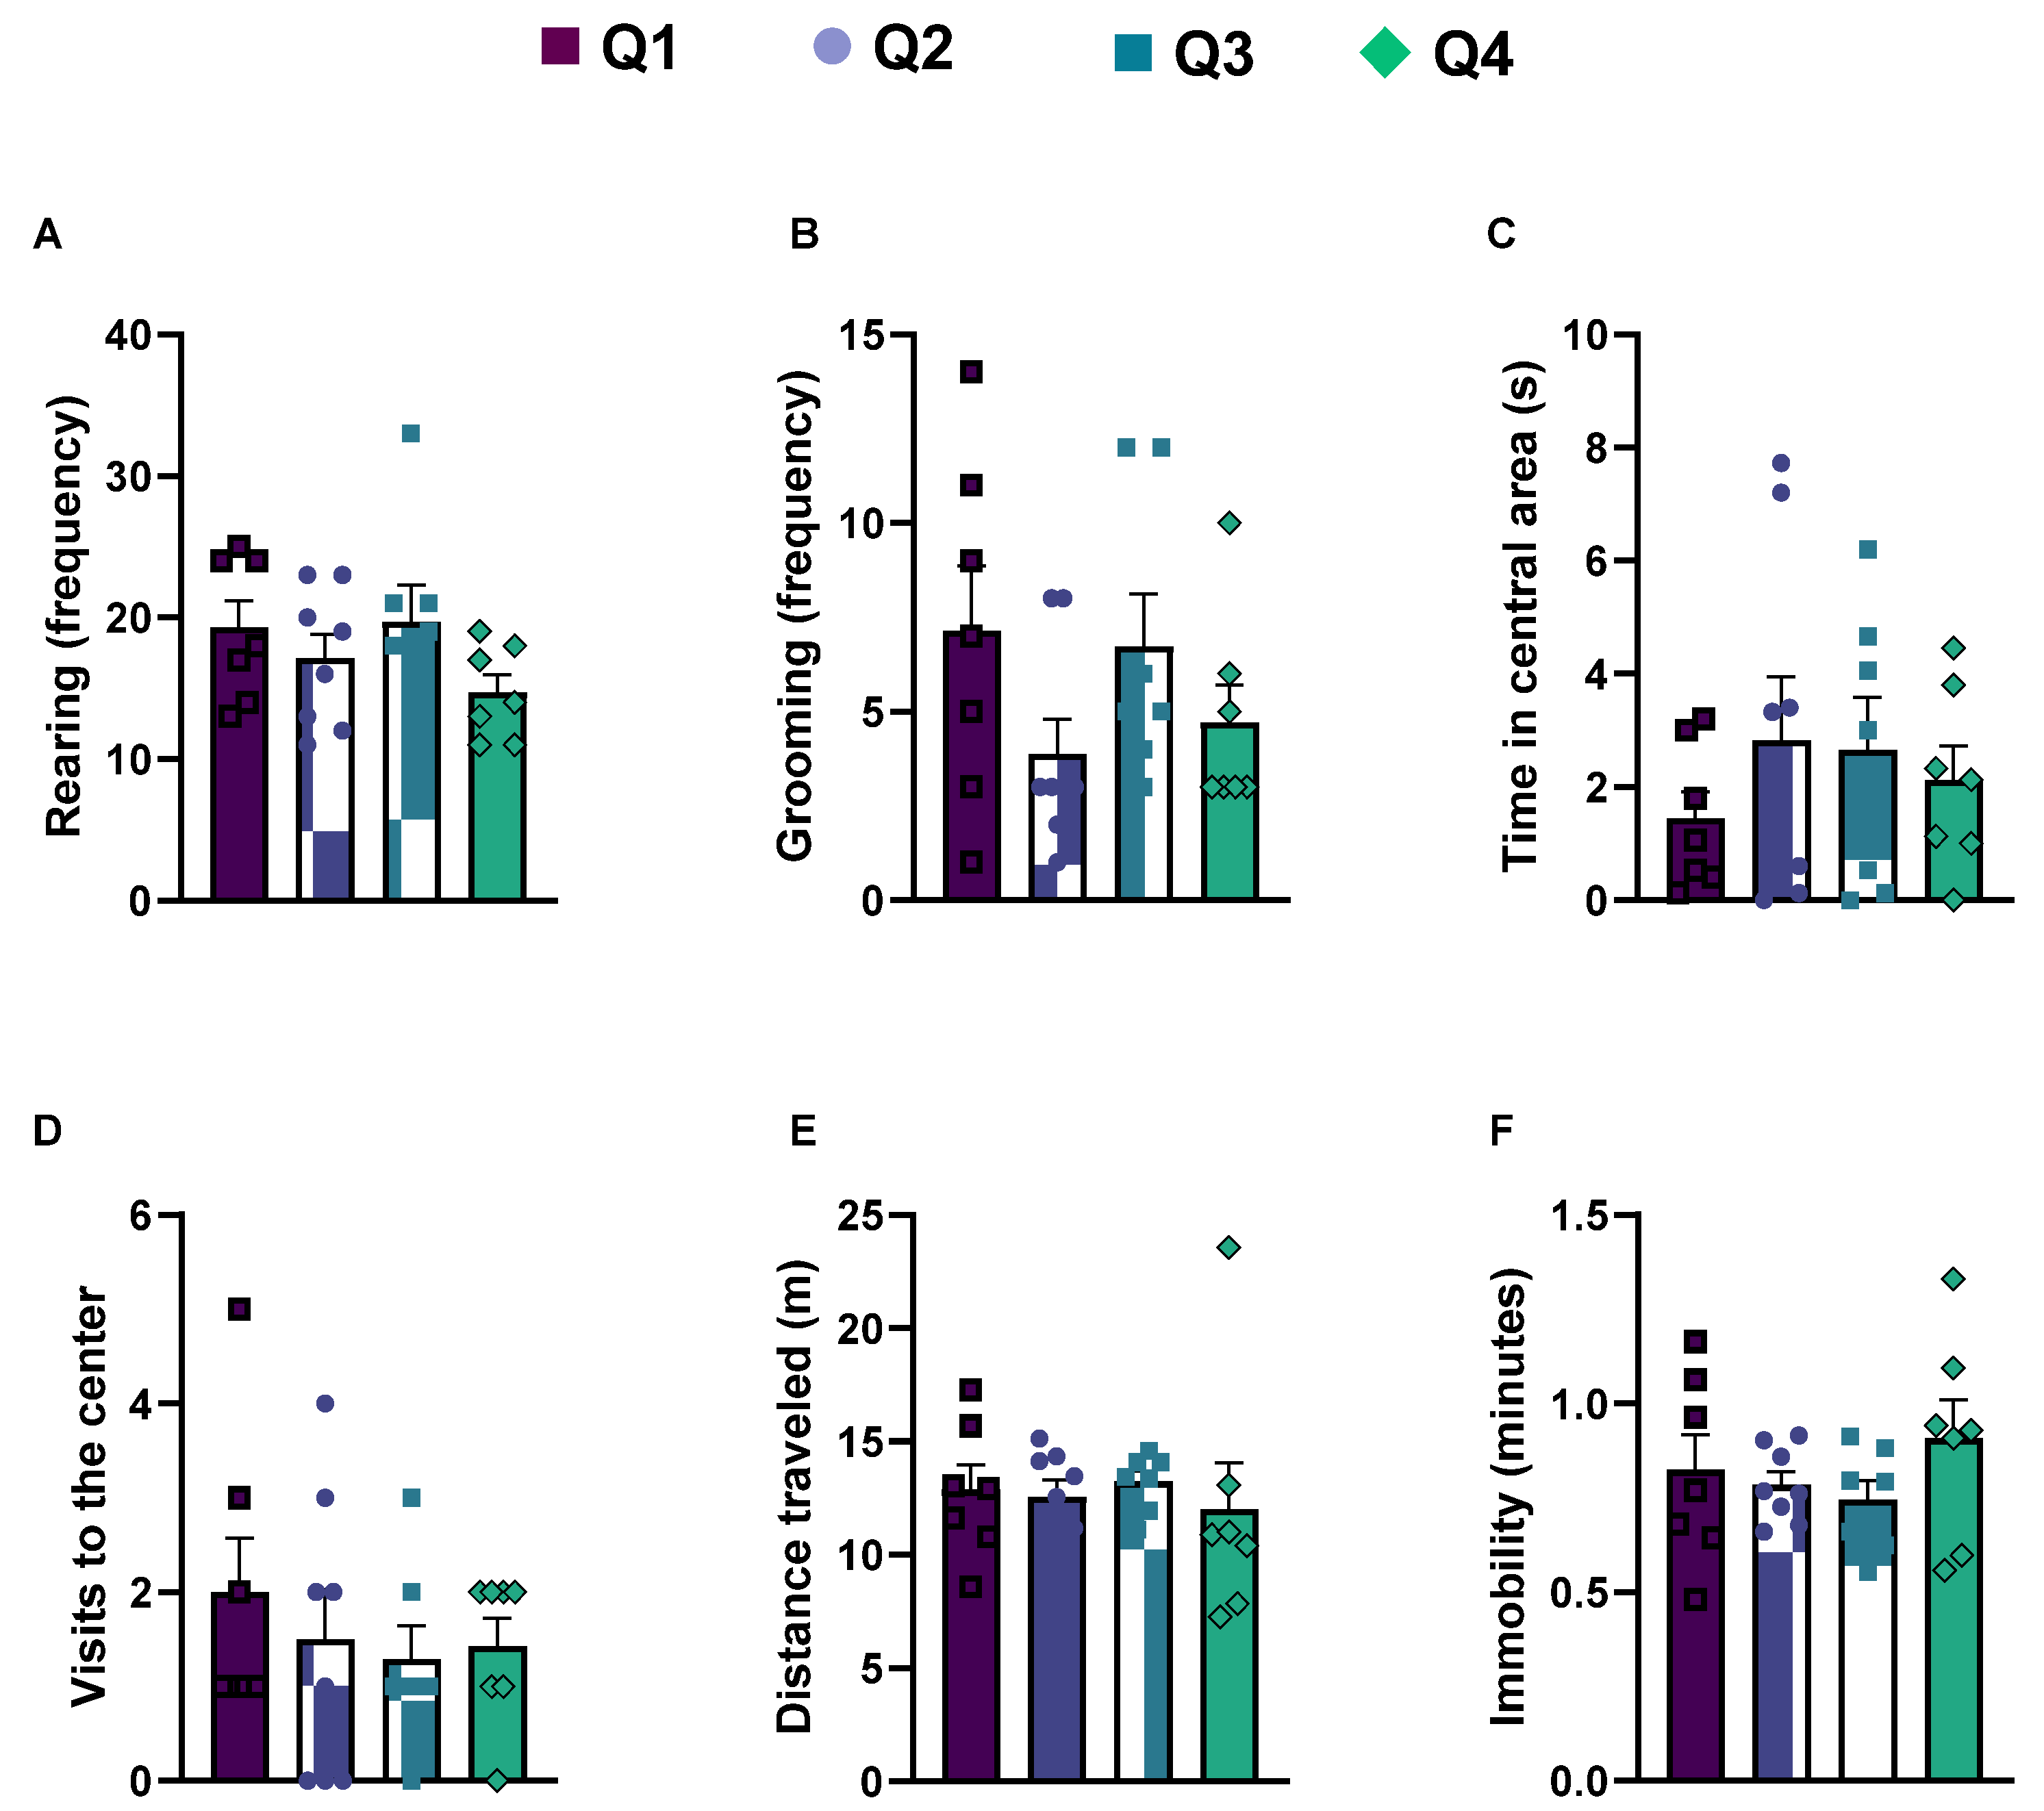
Figure 3 shows the effects of the cafeteria diet on anxiety-like responses among the quartiles in terms of rearing (Figure 3A), grooming (Figure 3B), time spent in the central area (Figure 3C), visits to the center (Figure 3D), distance traveled (Figure 3E), and immobility (Figure 3F) in the open-field paradigm. No significant differences were detected in all the parameters tested (p > 0.05 in all cases).

3.3. Hypothalamic Proteomics

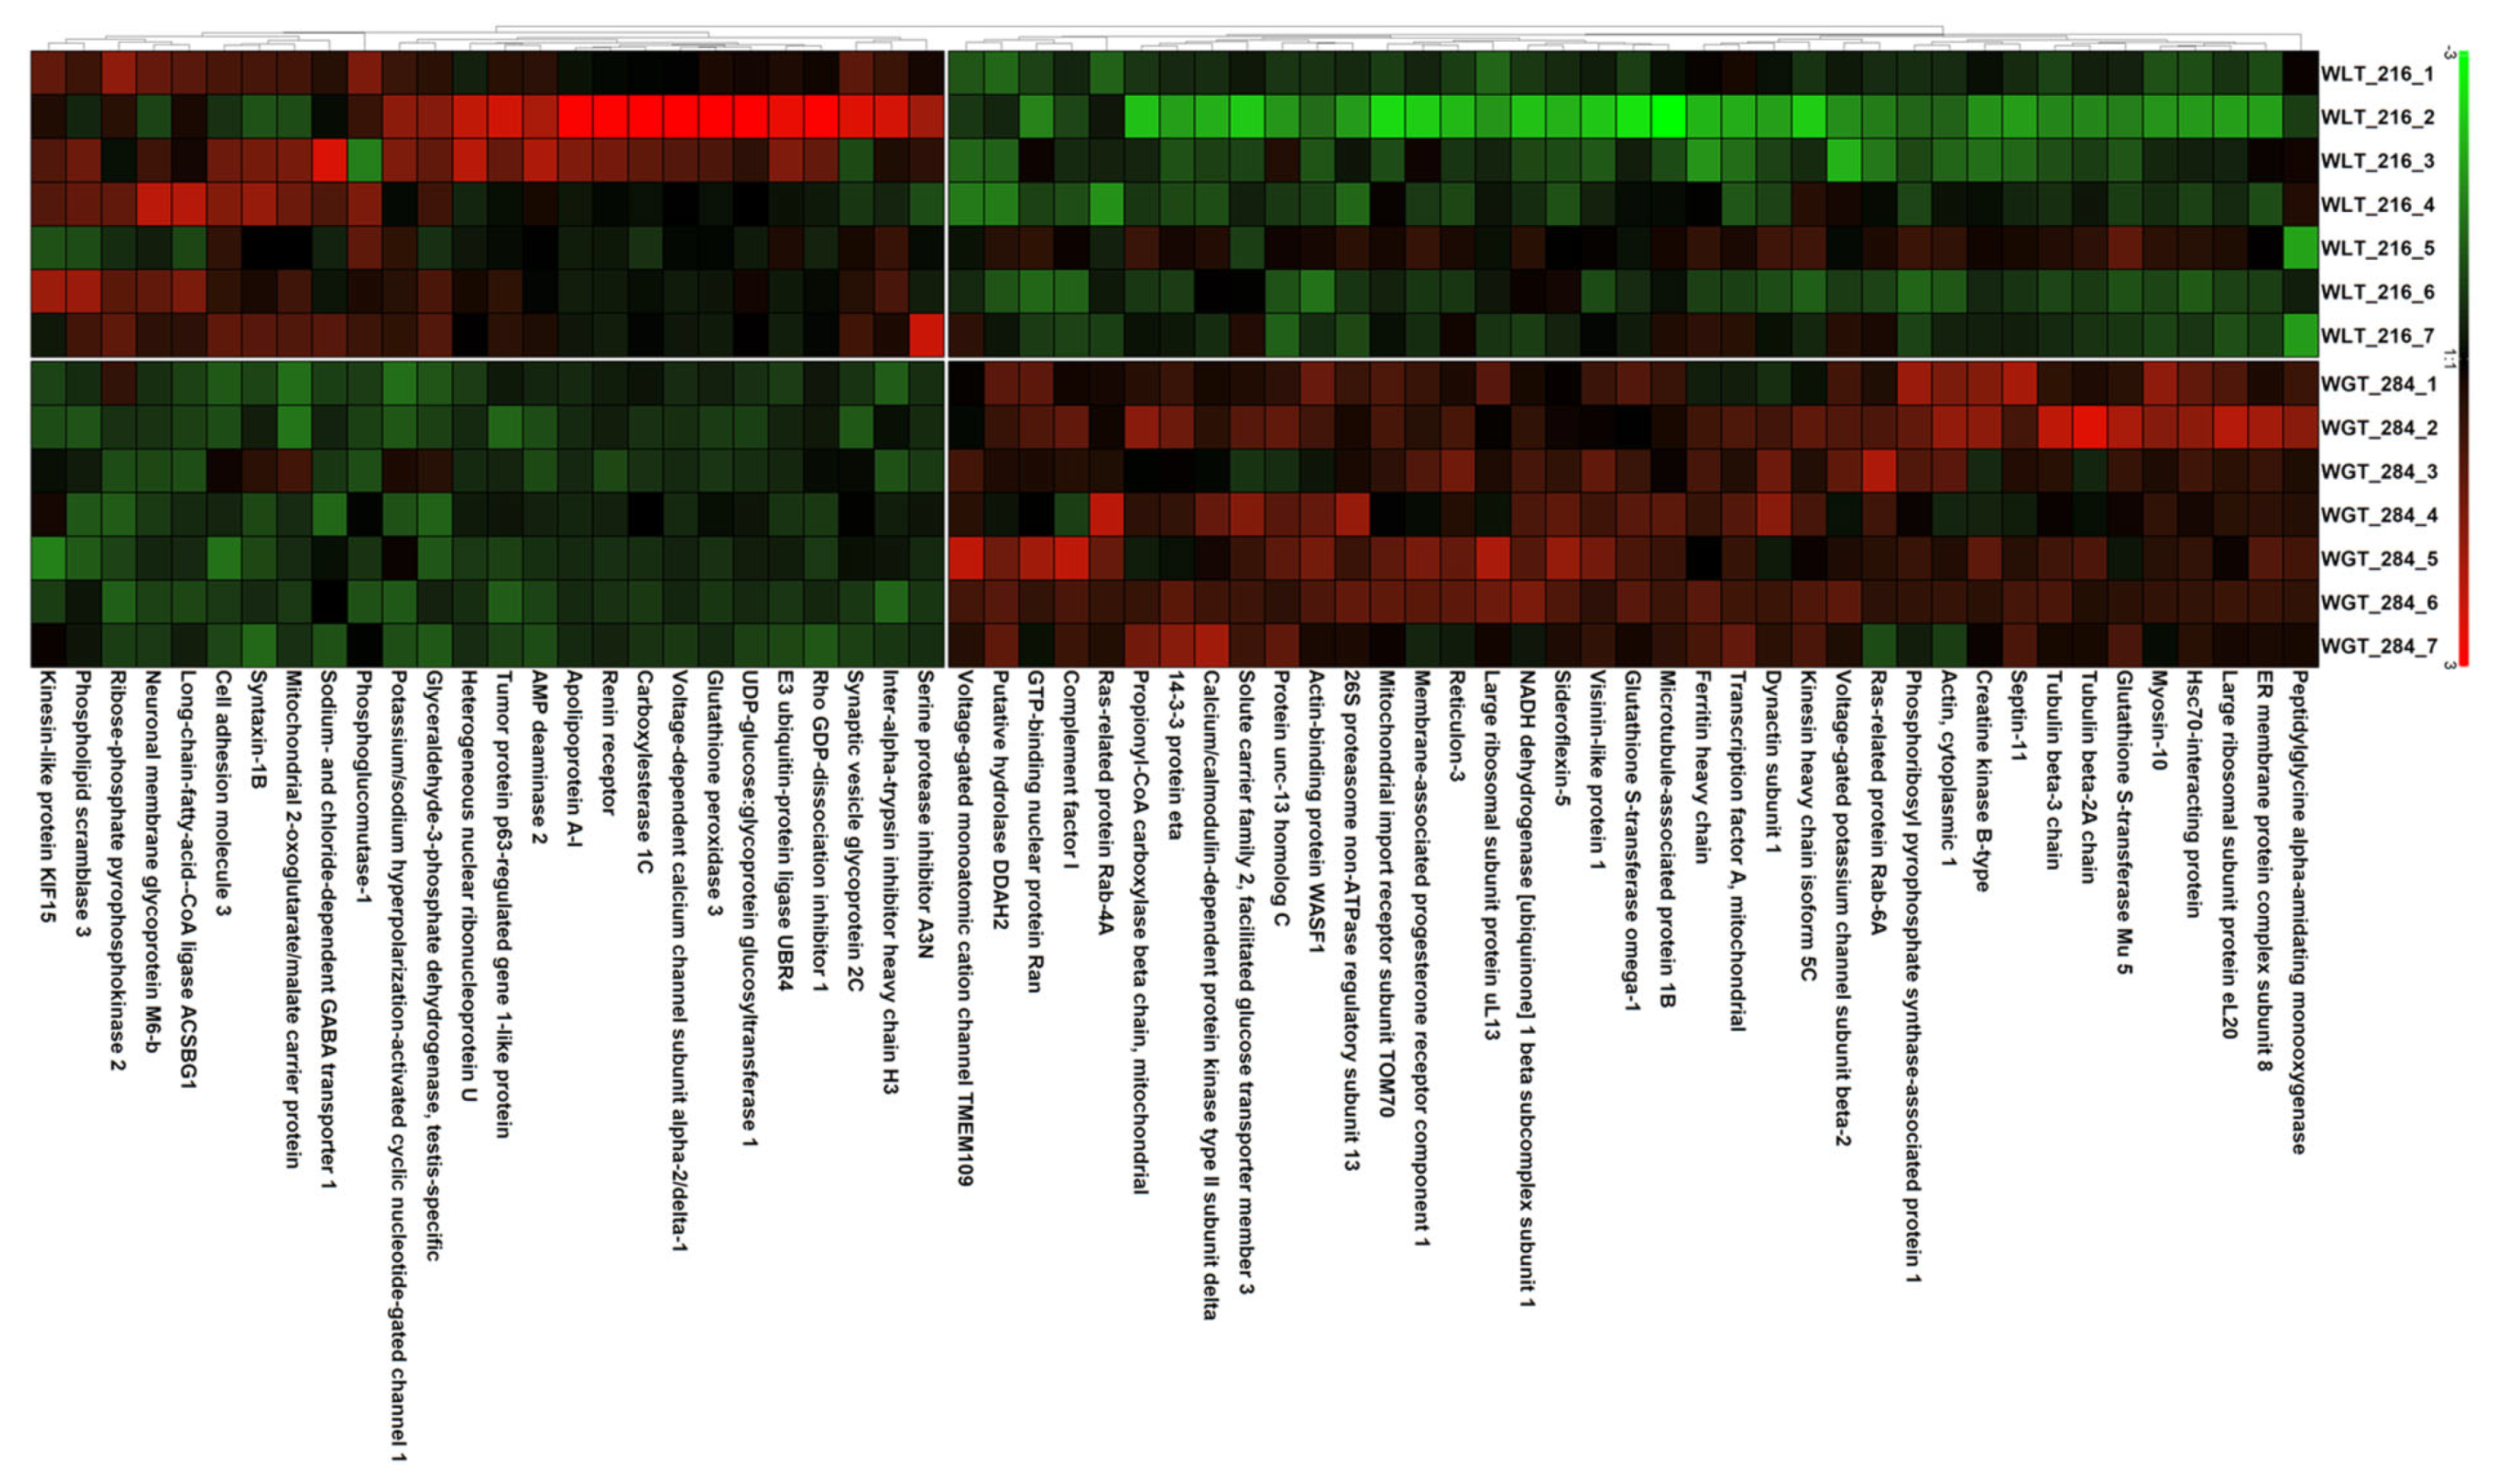
Among the 1294 proteins detected, 65 showed significant differences in relative abundance between underweight (Q1) and overweight (Q4) rats. In Table 2 and Figure 4, proteins downregulated in overweight rats compared to underweight rats are shown in green, and upregulated proteins are shown in red.
Figure 4 shows the heat map of differences in protein expression between Q1 (WLT 216) and Q4 (WGT 284) rats (p ≤ 0.05). Green-colored protein names indicate downregulation in Q4 compared to Q1 rats, while red-colored proteins indicate upregulation. The heat map complements the information in Table 2 above regarding the relative abundance of proteins between Q1 and Q4.
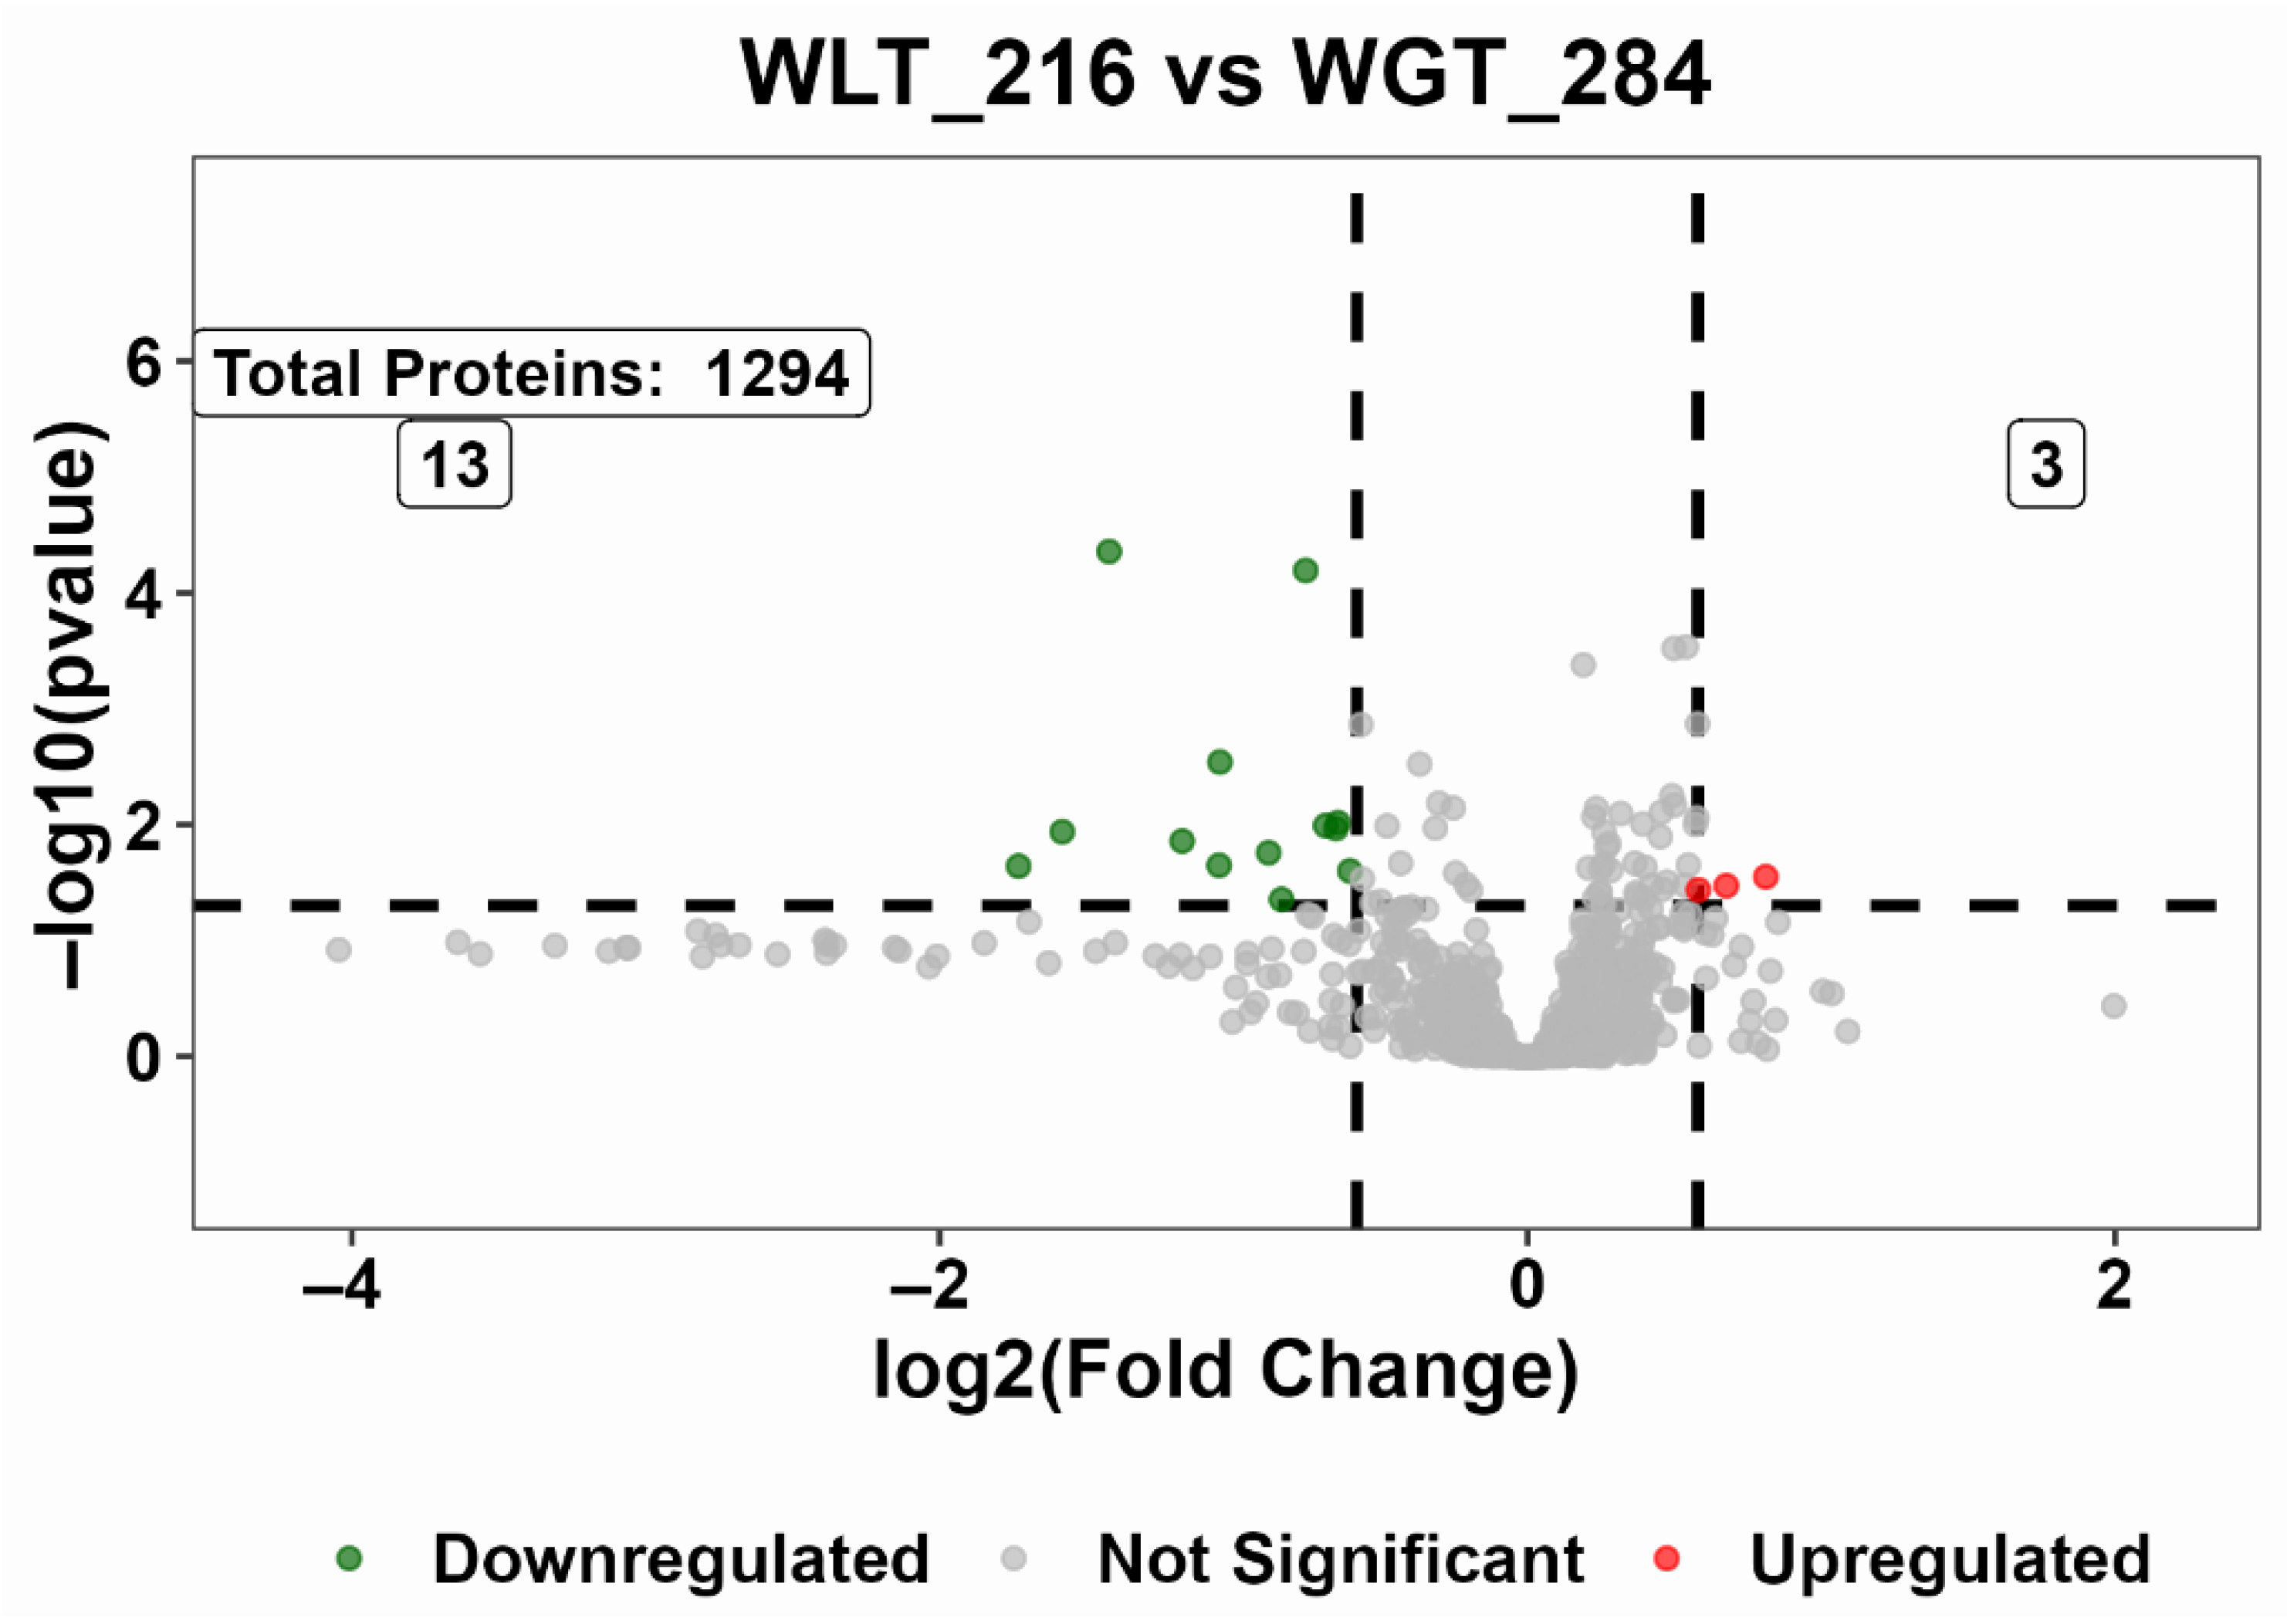
A total of 1294 proteins were quantified and analyzed by a volcano plot (Figure 5). Among these, 65 showed statistically significant differences (p < 0.05) between overweight (Q4) and underweight (Q1) rats. Applying a threshold of log2 fold change ≥ |0.5| (≈50% change in expression), 16 proteins met both criteria: 13 were downregulated (green), and three were upregulated (red) in overweight rats. Table 3 shows possible functions of the corresponding genes for the 16 most altered proteins in overweight versus underweight rats.
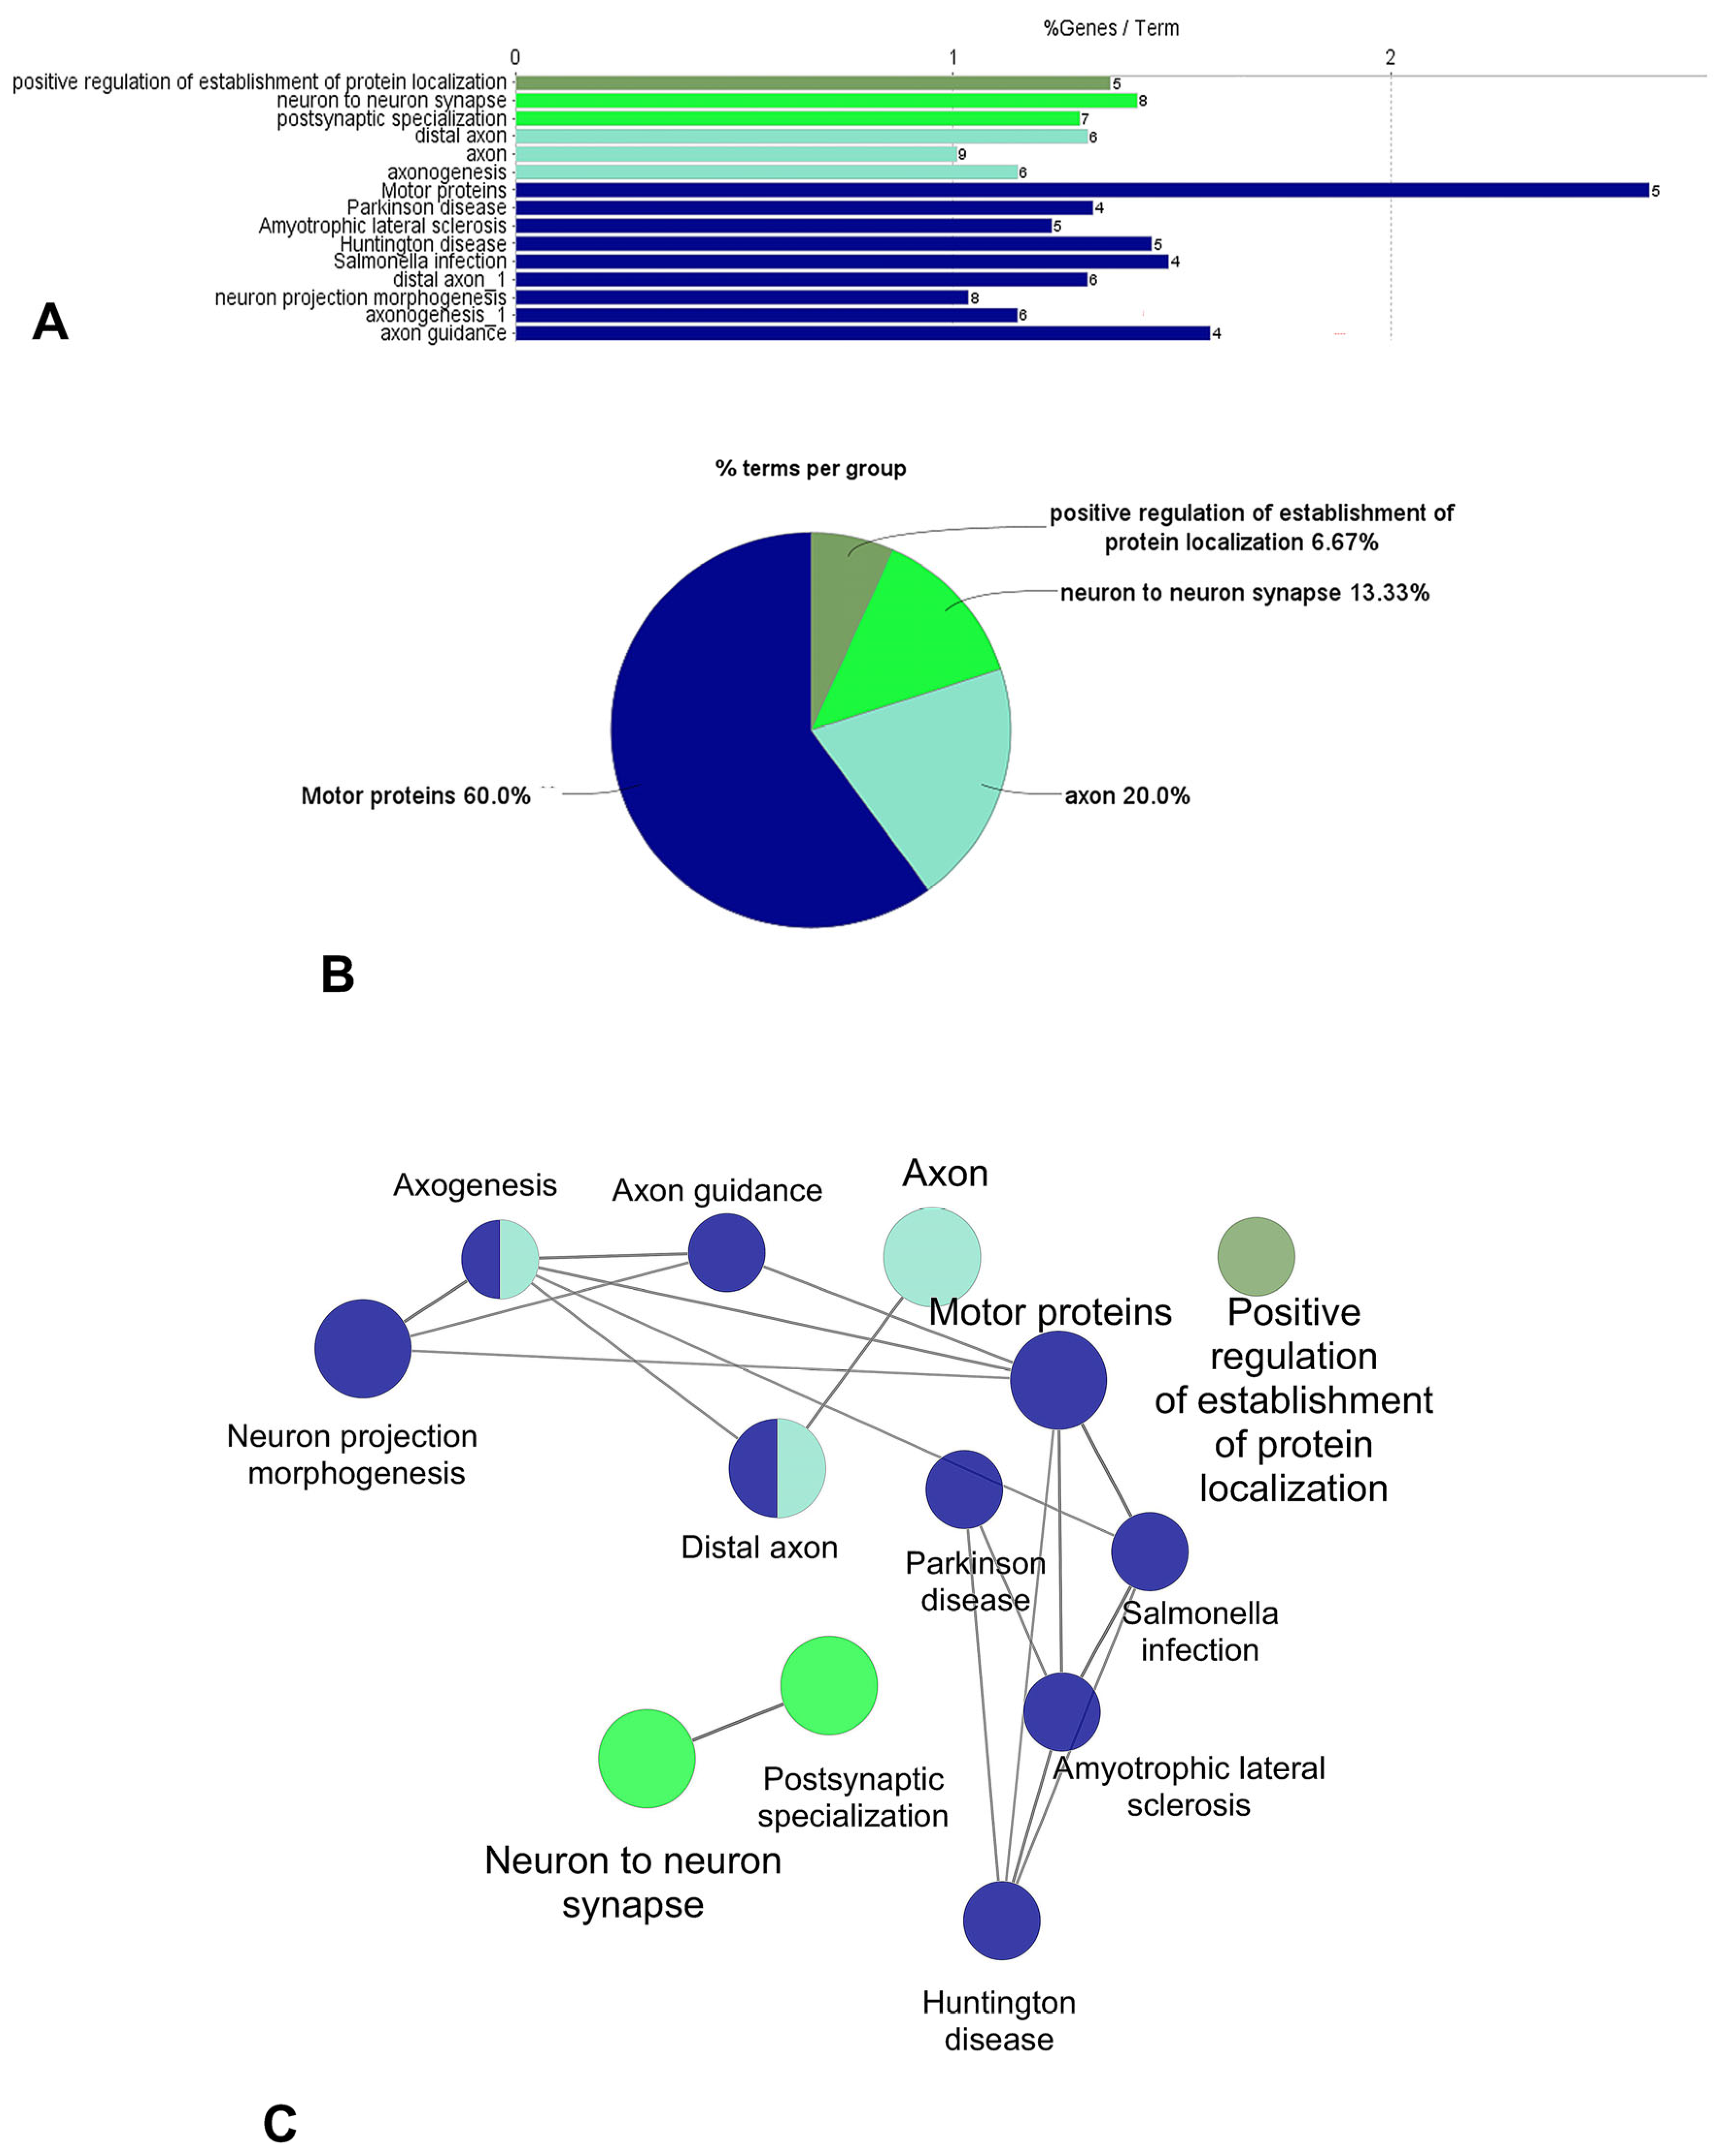
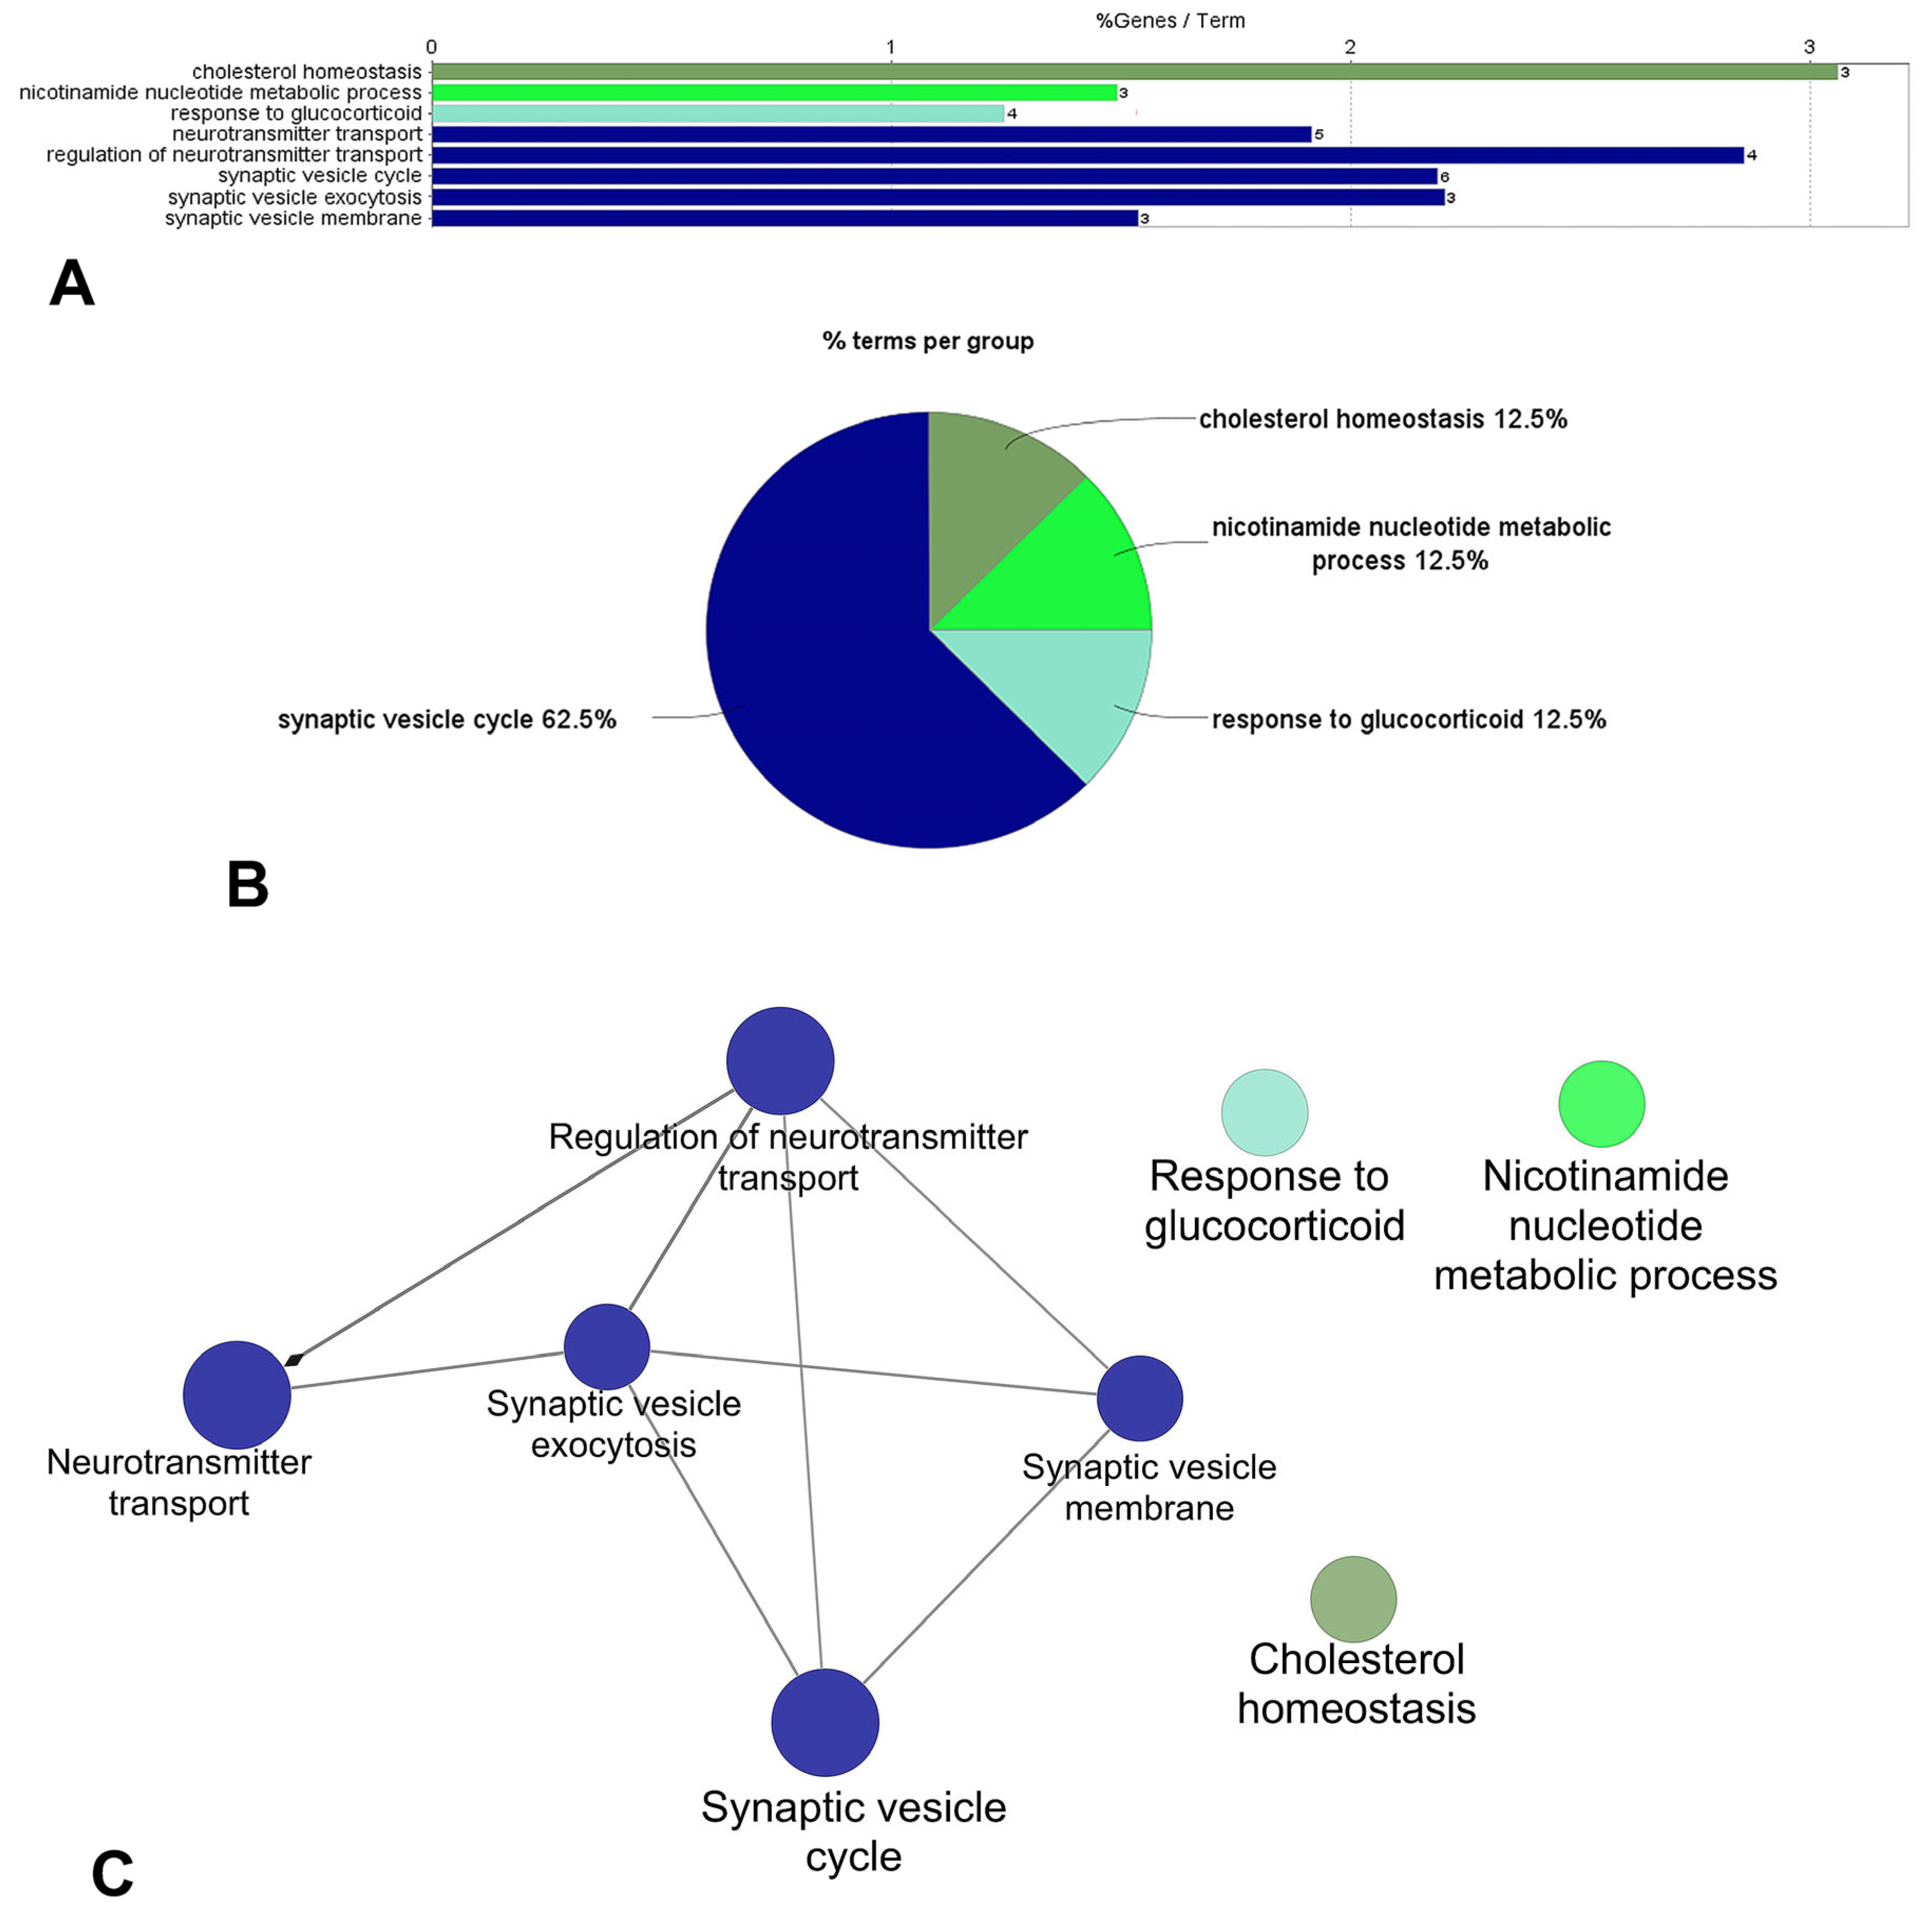
Using the 65 proteins that were significantly different between Q4 and Q1, we performed functional enrichment analysis with Cytoscape v. 3.10.3 and its ClueGo app [30]. Figure 6 and Figure 7 show the functional analysis of hypothalamic proteins upregulated (Figure 6) and downregulated (Figure 7) in overweight rats compared to underweight ones. The data are presented as a bar chart (A) showing the most enriched “functional terms” as percentages of all genes/proteins associated with those terms. In B, the closely related terms are grouped as a pie chart. In Figure 6 and Figure 7, a network map is presented, where node size represents term enrichment (p-value), and color indicates functional similarity between terms.
We can observe that a few terms refer to cytoskeleton organization dynamics and membrane trafficking, as evidenced by the upregulation of ActnB, Myh10, Wasf1 proteins, and members of the Rab family, which also enrich the term “ATPase activator activity” or the related terms “axogenesis” or “neuron projection morphogenesis” in Cytoscape.
Notably, terms related to mitochondrial transport are also enriched due to proteins associated with cytoskeleton dynamics, such as Wasf1 and Map1b.
Figure 7 shows the same analysis carried out using only the proteins downregulated in obese (Q4) compared to underweight rats (Q1). Functional enrichment analysis highlighted terms such as “regulation of neurotransmitter transport” and “synaptic vesicle exocytosis” as being downregulated in susceptible rats compared to resistant ones. The differentially expressed proteins associated with these terms are Stx1b (syntaxin), involved in vesicle docking, and Slc6a1 (GABA transporter 1), which mediates GABA reuptake in the synaptic cleft.
The functional enrichment analysis was also performed using DAVID [66,67] in upregulated proteins in overweight compared to underweight rats. The functional terms observed in this analysis indicated neuronal cytoplasmic differences, as well as terms related to cell division (which also involve cytoplasmic rearrangements). Therefore, the functional enrichment analysis in DAVID indicates a structural shift in the hypothalamus of obese rats compared to those resistant to obesity.
Zooming in on these functional terms, there was an upregulation in cytoskeletal proteins, such as Myh10, Dctn1, and Kif5c, and the tubulin proteins (Tubb3 and Tubb2a) that play a role in transport mediated by microtubules. This is in line with the terms “motor proteins”, “axon guidance” and “positive regulation of establishment of protein localization” observed when using Cytoscape v. 3.10.3 and Cluego software (Figure 6).
Regarding the downregulated proteins observed in overweight compared to underweight rats, the DAVID [66,67] analysis also matched the results obtained with Cytoscape (Figure 7). The terms were associated with neurotransmitter transport and synaptic vesicle cycle. Also, there were functional terms indicating that metabolic functions were altered in our model. Overall, both analyses, performed in DAVID and Cytoscape, highlighted similar processes and molecular functions that were downregulated in overweight rats compared to underweight rats.

4. Discussion

4.1. General Discussion

Although several factors contribute to weight gain (e.g., a sedentary lifestyle; metabolic, genetic, and epigenetic alterations; and environmental factors), chronic stress and a sustained imbalanced diet (e.g., a cafeteria-style diet) are key determinants. Numerous studies have shown that a cafeteria diet increases body mass, alters behavior, and disrupts hypothalamic function in rats [7,68,69]. In this sense, our findings show that 5 weeks on a cafeteria diet in rats is sufficient to produce significant changes in body mass in some rats, while not in others (Figure 2). The extremes (Q1 vs. Q4) may be considered as resistant or susceptible to weight gain, respectively. Rats from Q4 (mean: 304 g) showed 51% more body mass than rats from Q1 (mean: 201 g). Meanwhile, Q2 (mean: 226 g) and Q3 (mean: 272 g) may be considered normal, as both were close to the mean of all body mass data (i.e., 265.5 g; Table 1). Note that all the rats came from the same litter and were exposed to the same environment for 10 weeks. Hence, the experimental conditions were identical for every rat, which is highly desirable [70] to avoid experimental discrepancies.

4.2. The Open Field and Anxiety-like Behaviors

The classic open-field paradigm (Figure 3) was used to assess anxiety-like behavior and locomotor activity across body weight quartiles. None of the parameters evaluated showed significant differences among groups (p > 0.05 for all comparisons). Previous studies have reported that high-fat or fructose-rich diets can increase anxiety-like behavior and depressive symptoms and reduce locomotor activity and cognitive performance when compared to animals fed a standard chow diet [7]. In contrast, our experimental design exposed all subjects to the same obesogenic environment and diet, with random assignment to group housing (seven–eight animals per cage). Social hierarchies were established during the 10 weeks before behavioral testing, which may have contributed to buffering stress responses. Therefore, it is plausible that social regulation minimized anxiety differences across quartiles despite variations in body weight. In addition, the fructose itself, not included in our protocol, may have had an additive effect. Indeed, Kovacevic et al. [21] demonstrated that high fructose consumption in rats resulted in minimal behavioral deficits but reduced synaptic potentiation, as evidenced by reduced CaMKII expression [71]. This finding aligns with our proteomic results, which revealed a significant difference in Camk2d expression between Q1 and Q4 (see the following subsection).
Lastly, in contrast to other studies that housed animals individually or in small groups, which may promote psychoneurosis [72,73,74], our animals were randomly housed in large groups (seven–eight rats per cage), allowing the establishment of a social dynamic that may have, in turn, decreased social anxiety. Housed in groups, in contrast to individually, they showed lower levels of anxiety and maladaptive behaviors [75,76,77]. Hence, after ten weeks of social integration, the lack of differences in anxiety-like behaviors among the quartiles seems reasonable (as the separation in quartiles occurred at the end of the experiments).

4.3. The Hypothalamic Proteome and Its Possible Role in Resistance/Susceptibility to Overweight

Of the 1294 proteins detected through mass-spec proteomics, the relative abundance of 65 was statistically different between Q1 (underweight rats) and Q4 (overweight rats; Table 2). Specifically, 26 proteins were downregulated and 39 were upregulated in Q4 compared to Q1. At this point, we cannot conclusively establish if these differences (i) are directly associated with resistance/susceptibility to overweight; (ii) are the result of the feeding patterns of each quartile; and/or (iii) are just contingencies. In this regard, it would be valuable to determine individual calorie intake and expenditure, which is technically difficult in our facilities.
The proteins ActnB, Myh10, Rab, Wasf1, and Map1b were upregulated in overweight rats (Table 2 and Figure 3). These proteins regulate cytoskeletal dynamics and are associated with ATPase-activating activity, mitochondrial transport, and regulation of energy metabolism. This is in line with the changes in expression of several members of the Rab/Ran GTPases, such as Ran, Rab4a, and Rab6a (upregulated in obese rats), that point out structural differences in the hypothalamus of obese vs. underweight rats.
The functional analysis performed in downregulated proteins in overweight rats (Figure 7) highlighted the term “synaptic vesicle cycle”, which involved the downregulation of syntaxin (Stx1b), a protein necessary for vesicle docking. Interestingly, another synaptic vesicle protein, Sv2c, not enriched in any term, was also significantly downregulated in overweight compared to underweight rats. Along the same line, we observed the downregulation of Slc6a1, which mediates GABA reuptake, a neurotransmitter of great importance in the hypothalamus [78] that plays a key role in feeding behavior [79] and is a metabolic regulator [69] (Figure 6 and Figure 7). Indeed, the GABA agonist muscimol has been shown to decrease spontaneous physical activity induced by orexin A [80]. Thus, the reduction in Slc6a1 expression in our overweight rats and the possible diminishment of GABA reuptake could play an essential role in reducing energy expenditure through locomotion. Also, this finding highlights GABA blockade as a potential target for improving locomotion and energy expenditure. In the future, it will be necessary to investigate in more detail the metabolism and activity of overweight and underweight rats.
The functional enrichment analysis indicates that some terms refer to the dynamics of cytoskeletal organization and possibly cellular transport, evidenced by the upregulation of the proteins ActnB, Myh10, Dctn1, Kif5c and Rab, the latter also enriching the term “ATPase-activating activity”. In addition, terms referring to mitochondrial transport are enriched with proteins associated with the cytoskeleton, such as Wasf1 and Map1b. Likewise, Myh10, Dctn1, and Kif5c participate in microtubule-mediated transport; in this sense, two tubulins (Tubb3 and Tubb2a), were also found to be differently expressed between Q1 and Q4. Taken together, these results suggest that the hypothalamus of overweight rats shows structural differences compared to that of underweight rats. In line with this, a reduction in gray matter was reported in obese individuals [81]. Other proteomic studies have highlighted differences in axon growth, calcium signaling, and other processes between high-fat-diet-induced obese rats and high-fat-diet-resistant rats [19]. Here, we identified changes in proteins between Q1 and Q4 rats that play essential roles in calcium signaling, such as Camk2d, Cacna2d1, Vsnl1, and Tmem109. Indeed, calcium status is essential for neuron homeostasis [82]. Interestingly, the work of Levin and collaborators showed that calcitonin receptor (CTR) downregulation disrupted leptin signaling in the ventromedial hypothalamus and induced weight gain in an inbred obesity-resistant Sprague-Dawley rat [83], in agreement with calcium homeostasis dysregulation observed in this study.
In a separate proteomic study of the hypothalamus, mice fed a high-fat diet exhibited increased neuroinflammation and dysregulation of the neurotransmitter glycine [84]. In line with Manousopoulou et al. [84], our work also observed enrichment for terms related to immune function, as well as several proteins involved in neurotransmitter release, including Slc6a1 (GABA reuptake), Kcnab2, Sv2c, and syntaxin. In addition, we identified several proteins differentially expressed between Q1 and Q4 related to carbohydrate metabolism, energy production and utilization, and biosynthesis of cellular components (nucleotides, carbohydrates) in different tissues (e.g., Gstm5, Glut3, Ckb, Pgm1, Gstk1, and Gapdhs). Along this line, previous studies have shown metabolic alterations in glucose response and leptin signaling in rats susceptible to obesity [85]. We also observed differences in proteins involved in mitochondrial function (e.g., Tfam, Pccb, Sfxn5, Ndufb1, Tomm70, and Slc25a11). In this regard, it is hypothesized that mitochondria in pro-opiomelanocortin hypothalamic neurons regulate energy metabolism and feeding [86,87,88], and could represent a target for preventing weight gain. The above could alter neuroplasticity and mitochondrial responsiveness, results that are in line with previous studies [19,89]. For example, researchers report that a higher abundance of BASP1, a protein involved in synaptic plasticity, increases the likelihood of developing obesity [19]. In our work, we did not observe a high relative abundance of Basp1; however it was present among the 1294 proteins in our database.
On the other hand, Figure 7 shows the functional enrichment analysis of proteins downregulated in obesity or those that may confer resistance to its development. Functional terms associated with the downregulation of syntaxin (Stx1b), involved in vesicle docking, were observed, possibly in line with the downregulation of another synaptic vesicle protein, Sv2c, enriched in the terms “synaptic vesicle cycle” and “regulation of neurotransmitter transport”. In addition, a downregulation of Slc6a1, involved in the reuptake of GABA, one of the most essential neurotransmitters in the hypothalamus [78], was also observed. Consistent with GABA regulation, other researchers have highlighted the roles of proteins such as Frs2 and Shc3 in neurotrophin signaling pathways and their potential as targets for inducing anorexinergic signals, which regulate glutamate excitation and GABA inhibition in the arcuate nucleus of the hypothalamus [69]. In addition, it was observed that metabolic functions were altered in our model; specifically, a downregulation of various proteins involved in carbohydrate metabolism was observed, such as Pgm1 and Gapdhs related to the production and use of energy and the regulation of metabolism in tissues such as the liver, muscle, brain and adipose tissue. Additionally, other proteins, such as the GlyR, although not included in our database, could be a therapeutic option for reducing appetite in response to hypothalamic inflammation induced by a high-fat diet [84].
One limitation of the present study is that individual food intake was not quantified because animals were housed in groups. Therefore, differences in weight gain could reflect variability in metabolic efficiency or energy expenditure among animals. Future studies incorporating individual monitoring of food intake would provide additional insights into the mechanisms underlying differential susceptibility to weight gain.

5. Conclusions

Our findings suggest that chronic exposure to a cafeteria diet generates marked differences in weight gain between genetically matched rats sharing the same environment and the same access to an obesogenic diet from the fifth week onward. When phenotypes are classified as overweight (Q4) or underweight (Q1) based on body mass gain, no significant anxiety-like behavioral variations are observed. In contrast, the overweight rats show overexpression of hypothalamic proteins involved in cytoskeletal dynamics and increased ATPase activity, suggesting increased mitochondrial transport and altered neuroplasticity. Moreover, overweight rats show a lower relative abundance of proteins critical for neurotransmission and energy metabolism, such as syntaxin (Stx1b), Slc6a1, Pgm1, and Gapdh, which could promote an inhibitory–excitatory imbalance and less efficient glucose regulation. All these alterations may be associated with increased susceptibility to weight gain.

Author Contributions

Conceptualization, C.D.G.-R., Y.M. and B.A.M.-C.; Methodology, S.G.-R., J.N., C.D.G.-R., J.C.-R., F.C. and O.D.; Software, S.G.-R., J.N., C.D.G.-R., R.R.-G., F.C., O.D. and T.B.; Formal Analysis, S.G.-R., J.N. and F.C.; Investigation, S.G.-R. and J.N.; Writing—Original Draft, S.G.-R. and B.A.M.-C.; Project Administration, B.A.M.-C.; Funding Acquisition, Y.M. and B.A.M.-C.; Writing—Review & Editing, S.G.-R., J.N., C.D.G.-R., R.R.-G., J.C.-R., O.D., T.B., Y.M. and B.A.M.-C.; Supervision, C.D.G.-R., J.C.-R., Y.M. and B.A.M.-C.; Visualization, R.R.-G.; Data Curation, S.G.-R., J.N., R.R.-G., F.C., O.D. and T.B. All authors have read and agreed to the published version of the manuscript.

Funding

The Autonomous University of Aguascalientes supported this work, grant PIFF24-1. This work was supported by grants from the Robert A. Welch Foundation (No. D-0005), and The CH Foundation.

Institutional Review Board Statement

The experimental protocol was carried out with the permission of the Institutional Ethics Committee (PIFF24-1 CEADIUAA—approved 28 June 2022) and in strict adherence to the national and international standards for the use of laboratory animals of the United States of America and the Animal Research: Reporting of In Vivo Experiments (ARRIVE).

Data Availability Statement

The raw data supporting the conclusions of this article will be made available by the authors on request.

Conflicts of Interest

The authors declare that they have no known competing financial interests or personal relationships that could have influenced the work reported in this paper.

References

  1. Peri, K.; Eisenberg, M. Review on the update in obesity management: Epidemiology. BMJ Public Health 2024, 2, e000247. [Google Scholar] [CrossRef] [Scilit]
  2. Lin, H.; Deng, K.; Zhang, J.; Wang, L.; Zhang, Z.; Luo, Y.; Sun, Q.; Li, Z.; Chen, Y.; Wang, Z.; et al. Biochemical detection of fatal hypothermia and hyperthermia in affected rat hypothalamus tissues by Fourier transform infrared spectroscopy. Biosci. Rep. 2019, 39, BSR20181633. [Google Scholar] [CrossRef] [Scilit]
  3. Mohajan, D.; Mohajan, H. Obesity and Its Related Diseases: A New Escalating Alarming in Global Health. J. Innov. Med. Res. 2023, 2, 12–23. [Google Scholar] [CrossRef] [Scilit]
  4. Purnell, J.Q.; le Roux, C.W. Hypothalamic control of body fat mass by food intake: The key to understanding why obesity should be treated as a disease. Diabetes Obes. Metab. 2024, 26, 3–12. [Google Scholar] [CrossRef] [Scilit] [PubMed]
  5. Odoemelam, C.S.; Naz, A.; Thanaj, M.; Sorokin, E.P.; Whitcher, B.; Sattar, N.; Bell, J.D.; Thomas, E.L.; Cule, M.; Yaghootkar, H. Identifying four obesity axes through integrative multi-omics and imaging analysis. Diabetes 2025, 74, 1168–1183. [Google Scholar] [CrossRef] [Scilit] [PubMed]
  6. Ayuzo Del Valle, N.C.; Pérez-Treviño, P.; Cepeda Lopez, A.C.; Murillo-Torres, R.M.; Castillo, E.C.; Gutierrez-Cantu, D.; Tamez-Rivera, O.; Paez Flores, M.; Flores-Ayuzo, I.; Luévano-Martinez, L.A.; et al. Beyond BMI: A comprehensive approach to pediatric obesity assessment. Front. Pediatr. 2025, 13, 1597309. [Google Scholar] [CrossRef] [Scilit]
  7. Youssef, D.A.; El-Fayoumi, H.M.; Mahmoud, M.F. Beta-caryophyllene alleviates diet-induced neurobehavioral changes in rats: The role of CB2 and PPAR-γ receptors. Biomed. Pharmacother. = Biomed. Pharmacother. 2019, 110, 145–154. [Google Scholar] [CrossRef] [Scilit]
  8. Farr, O.M.; Li, C.R.; Mantzoros, C.S. Central nervous system regulation of eating: Insights from human brain imaging. Metab. Clin. Exp. 2016, 65, 699–713. [Google Scholar] [CrossRef] [Scilit]
  9. Campos, A.; Port, J.D.; Acosta, A. Integrative Hedonic and Homeostatic Food Intake Regulation by the Central Nervous System: Insights from Neuroimaging. Brain Sci. 2022, 12, 431. [Google Scholar] [CrossRef] [Scilit]
  10. Abdalla, M.M. Central and peripheral control of food intake. Endocr. Regul. 2017, 51, 52–70. [Google Scholar] [CrossRef] [Scilit] [PubMed]
  11. Roger, C.; Lasbleiz, A.; Guye, M.; Dutour, A.; Gaborit, B.; Ranjeva, J.P. The Role of the Human Hypothalamus in Food Intake Networks: An MRI Perspective. Front. Nutr. 2021, 8, 760914. [Google Scholar] [CrossRef] [Scilit] [PubMed]
  12. Clemmensen, C.; Müller, T.D.; Woods, S.C.; Berthoud, H.R.; Seeley, R.J.; Tschöp, M.H. Gut-Brain Cross-Talk in Metabolic Control. Cell 2017, 168, 758–774. [Google Scholar] [CrossRef] [Scilit] [PubMed]
  13. Jais, A.; Brüning, J.C. Arcuate Nucleus-Dependent Regulation of Metabolism-Pathways to Obesity and Diabetes Mellitus. Endocr. Rev. 2022, 43, 314–328. [Google Scholar] [CrossRef] [Scilit]
  14. Oliveira, C.; Oliveira, C.M.; de Macedo, I.C.; Quevedo, A.S.; Filho, P.R.; Silva, F.R.; Vercelino, R.; de Souza, I.C.; Caumo, W.; Torres, I.L. Hypercaloric diet modulates effects of chronic stress: A behavioral and biometric study on rats. Stress 2015, 18, 514–523. [Google Scholar] [CrossRef] [Scilit] [PubMed]
  15. Papalini, S. Stress-induced overeating behaviors explained from a (transitory) relief-learning perspective. Physiol. Behav. 2024, 287, 114707. [Google Scholar] [CrossRef] [Scilit]
  16. Wijnant, K.; Klosowska, J.; Braet, C.; Verbeken, S.; De Henauw, S.; Vanhaecke, L.; Michels, N. Stress Responsiveness and Emotional Eating Depend on Youngsters’ Chronic Stress Level and Overweight. Nutrients 2021, 13, 3654. [Google Scholar] [CrossRef] [Scilit]
  17. Levin, B.E.; Dunn-Meynell, A.A.; Balkan, B.; Keesey, R.E. Selective breeding for diet-induced obesity and resistance in Sprague-Dawley rats. Am. J. Physiol.-Regul. Integr. Comp. Physiol. 1997, 273, R725–R730. [Google Scholar] [CrossRef] [Scilit]
  18. Pedroso, A.P.; Watanabe, R.L.H.; Albuquerque, K.T.; Telles, M.M.; Andrade, M.C.C.; Perez, J.D.; Sakata, M.M.; Lima, M.L.; Estadella, D.; Nascimento, C.M.O.; et al. Proteomic profiling of the rat hypothalamus. Proteome Sci. 2012, 10, 26. [Google Scholar] [CrossRef] [Scilit]
  19. Xi, P.; Ma, S.; Tian, D.; Shen, Y. Comparative Hypothalamic Proteomic Analysis Between Diet-Induced Obesity and Diet-Resistant Rats. Int. J. Mol. Sci. 2025, 26, 2296. [Google Scholar] [CrossRef] [Scilit]
  20. Omme, S.; Wang, J.; Sifuna, M.; Rodriguez, J.; Owusu, N.R.; Goli, M.; Jiang, P.; Waziha, P.; Nwaiwu, J.; Brelsfoard, C.L.; et al. Multi-omics analysis of antiviral interactions of Elizabethkingia anophelis and Zika virus. Sci. Rep. 2024, 14, 18470. [Google Scholar] [CrossRef] [Scilit]
  21. Sanni, A.; Goli, M.; Zhao, J.; Wang, J.; Barsa, C.; El Hayek, S.; Talih, F.; Lanuzza, B.; Kobeissy, F.; Plazzi, G.; et al. LC-MS/MS-Based Proteomics Approach for the Identification of Candidate Serum Biomarkers in Patients with Narcolepsy Type 1. Biomolecules 2023, 13, 420. [Google Scholar] [CrossRef] [Scilit]
  22. Makar, M.; Nwaiwu, J.; Agami, M.; Hemdan, M.; Elhamammy, R.; Abuiessa, S.; Daramola, O.; Wahid, A.; Mechref, Y.; El-Yazbi, A. Thermogenic Modulation Reduces Adipose Tissue Inflammation and Complications of Early Metabolic Dysfunction: Impact on Mitochondrial Proteomics and Adipose Lipidomics (Abstract ID: 159767). J. Pharmacol. Exp. Ther. 2025, 392, 100582. [Google Scholar] [CrossRef] [Scilit]
  23. Bayne, K. Revised Guide for the Care and Use of Laboratory Animals available. American Physiological Society. Physiologist 1996, 39, 208–211. [Google Scholar]
  24. McGrath, J.C.; Drummond, G.B.; McLachlan, E.M.; Kilkenny, C.; Wainwright, C.L. Guidelines for reporting experiments involving animals: The ARRIVE guidelines. Br. J. Pharmacol. 2010, 160, 1573–1576. [Google Scholar] [CrossRef] [Scilit] [PubMed]
  25. Lalanza, J.F.; Snoeren, E.M.S. The cafeteria diet: A standardized protocol and its effects on behavior. Neurosci. Biobehav. Rev. 2021, 122, 92–119. [Google Scholar] [CrossRef] [Scilit] [PubMed]
  26. Schindelin, J.; Arganda-Carreras, I.; Frise, E.; Kaynig, V.; Longair, M.; Pietzsch, T.; Preibisch, S.; Rueden, C.; Saalfeld, S.; Schmid, B.; et al. Fiji: An open-source platform for biological-image analysis. Nat. Methods 2012, 9, 676–682. [Google Scholar] [CrossRef] [Scilit]
  27. Gulyás, M.; Bencsik, N.; Pusztai, S.; Liliom, H.; Schlett, K. AnimalTracker: An ImageJ-Based Tracking API to Create a Customized Behaviour Analyser Program. Neuroinformatics 2016, 14, 479–481. [Google Scholar] [CrossRef] [Scilit]
  28. Ibe, C.S.; Onyeanusi, B.I.; Hambolu, J.O. Functional morphology of the brain of the African giant pouched rat (Cricetomys gambianus) Waterhouse, 1840). Onderstepoort J. Vet. Res. 2014, 81, e1–e7. [Google Scholar] [CrossRef] [Scilit]
  29. Paxinos, G.; Watson, C. The Rat Brain in Stereotaxic Coordinates, 7th ed.; Academic Press: New York, NY, USA, 2014. [Google Scholar]
  30. Zheng, J.; Wang, K.; Jin, P.; Dong, C.; Yuan, Q.; Li, Y.; Yang, Z. The association of adipose-derived dimethylarginine dimethylaminohydrolase-2 with insulin sensitivity in experimental type 2 diabetes mellitus. Acta Biochim. Biophys. Sin. 2013, 45, 641–648. [Google Scholar] [CrossRef] [Scilit] [PubMed]
  31. Hasegawa, K.; Wakino, S.; Kimoto, M.; Minakuchi, H.; Fujimura, K.; Hosoya, K.; Komatsu, M.; Kaneko, Y.; Kanda, T.; Tokuyama, H.; et al. The hydrolase DDAH2 enhances pancreatic insulin secretion by transcriptional regulation of secretagogin through a Sirt1-dependent mechanism in mice. FASEB J. 2013, 27, 2301–2315. [Google Scholar] [CrossRef] [Scilit]
  32. Minakuchi, H.; Wakino, S.; Hosoya, K.; Sueyasu, K.; Hasegawa, K.; Shinozuka, K.; Yoshifuji, A.; Futatsugi, K.; Komatsu, M.; Kanda, T.; et al. The role of adipose tissue asymmetric dimethylarginine/dimethylarginine dimethylaminohydrolase pathway in adipose tissue phenotype and metabolic abnormalities in subtotally nephrectomized rats. Nephrol. Dial. Transplant. 2015, 31, 413–423. [Google Scholar] [CrossRef] [Scilit] [PubMed]
  33. Kumar, D.; Mains, R.E.; Eipper, B.A. 60 YEARS OF POMC: From POMC and α-MSH to PAM, molecular oxygen, copper, and vitamin C. J. Mol. Endocrinol. 2016, 56, T63–T76. [Google Scholar] [CrossRef] [Scilit] [PubMed]
  34. Umapathysivam, M.M.; Araldi, E.; Hastoy, B.; Dawed, A.Y.; Vatandaslar, H.; Sengupta, S.; Kaufmann, A.; Thomsen, S.; Hartmann, B.; Jonsson, A.E.; et al. Type 2 Diabetes risk alleles in Peptidyl-glycine Alpha-amidating Monooxygenase influence GLP-1 levels and response to GLP-1 Receptor Agonists. medRxiv 2023. [Google Scholar] [CrossRef] [Scilit]
  35. Ilina, Y.; Kaufmann, P.; Melander, O.; Press, M.; Thuene, K.; Bergmann, A. Immunoassay-based quantification of full-length peptidylglycine alpha-amidating monooxygenase in human plasma. Sci. Rep. 2023, 13, 10827. [Google Scholar] [CrossRef] [Scilit]
  36. Tirincsi, A.; O’Keefe, S.; Nguyen, D.; Sicking, M.; Dudek, J.; Förster, F.; Jung, M.; Hadzibeganovic, D.; Helms, V.; High, S.; et al. Proteomics Identifies Substrates and a Novel Component in hSnd2-Dependent ER Protein Targeting. Cells 2022, 11, 2925. [Google Scholar] [CrossRef] [Scilit]
  37. Zhang, I.X.; Raghavan, M.; Satin, L.S. The Endoplasmic Reticulum and Calcium Homeostasis in Pancreatic Beta Cells. Endocrinology 2020, 161, bqz028. [Google Scholar] [CrossRef] [Scilit]
  38. Jung, M.; Zimmermann, R. Quantitative Mass Spectrometry Characterizes Client Spectra of Components for Targeting of Membrane Proteins to and Their Insertion into the Membrane of the Human ER. Int. J. Mol. Sci. 2023, 24, 14166. [Google Scholar] [CrossRef] [Scilit]
  39. Tang, S.; Tabet, F.; Cochran, B.J.; Cuesta Torres, L.F.; Wu, B.J.; Barter, P.J.; Rye, K.-A. Apolipoprotein A-I enhances insulin-dependent and insulin-independent glucose uptake by skeletal muscle. Sci. Rep. 2019, 9, 1350. [Google Scholar] [CrossRef] [Scilit]
  40. Wei, H.; Averill, M.M.; McMillen, T.S.; Dastvan, F.; Mitra, P.; Subramanian, S.; Tang, C.; Chait, A.; LeBoeuf, R.C. Modulation of adipose tissue lipolysis and body weight by high-density lipoproteins in mice. Nutr. Diabetes 2014, 4, e108. [Google Scholar] [CrossRef] [Scilit] [PubMed]
  41. Cunningham, J.T.; Moreno, M.V.; Lodi, A.; Ronen, S.M.; Ruggero, D. Protein and Nucleotide Biosynthesis Are Coupled by a Single Rate-Limiting Enzyme, PRPS2, to Drive Cancer. Cell 2014, 157, 1088–1103. [Google Scholar] [CrossRef] [Scilit] [PubMed]
  42. Hove-Jensen, B.; Andersen, K.R.; Kilstrup, M.; Martinussen, J.; Switzer, R.L.; Willemoës, M. Phosphoribosyl Diphosphate (PRPP): Biosynthesis, Enzymology, Utilization, and Metabolic Significance. Microbiol. Mol. Biol. Rev. 2017, 81, 10-1128. [Google Scholar] [CrossRef] [Scilit]
  43. Allegrini, S.; Camici, M.; Garcia-Gil, M.; Pesi, R.; Tozzi, M.G. Interplay between mTOR and Purine Metabolism Enzymes and Its Relevant Role in Cancer. Int. J. Mol. Sci. 2024, 25, 6735. [Google Scholar] [CrossRef] [Scilit]
  44. Paoli, D.; Pelloni, M.; Gallo, M.; Coltrinari, G.; Lombardo, F.; Lenzi, A.; Gandini, L. Sperm glyceraldehyde 3-phosphate dehydrogenase gene expression in asthenozoospermic spermatozoa. Asian J. Androl. 2017, 19, 409–413. [Google Scholar] [CrossRef] [Scilit]
  45. Gill, J.G.; Leef, S.N.; Ramesh, V.; Martin-Sandoval, M.S.; Rao, A.D.; West, L.; Muh, S.; Gu, W.; Zhao, Z.; Hosler, G.A.; et al. A Short Isoform of Spermatogenic Enzyme GAPDHS Functions as a Metabolic Switch and Limits Metastasis in Melanoma. Cancer Res. 2022, 82, 1251–1266. [Google Scholar] [CrossRef] [Scilit]
  46. Tran, M.; Mostofa, G.; Picard, M.; Wu, J.; Wang, L.; Shin, D.J. SerpinA3N deficiency attenuates steatosis and enhances insulin signaling in male mice. J. Endocrinol. 2023, 256, e220073. [Google Scholar] [CrossRef] [Scilit] [PubMed]
  47. Guzmán-Herrera, N.; Ruíz-Madrigal, B.; Parés-Hipólito, J.; Salazar-Olivo, L.A. SERPINA3 is expressed in human adipocytes and modulated by TNF-α and vitamin B6. Vitr. Cell. Dev. Biol.-Anim. 2025, 61, 627–634. [Google Scholar] [CrossRef] [Scilit] [PubMed]
  48. Ye, X.; Li, Y.; González-Lamuño, D.; Pei, Z.; Moser, A.B.; Smith, K.D.; Watkins, P.A. Role of ACSBG1 in Brain Lipid Metabolism and X-Linked Adrenoleukodystrophy Pathogenesis: Insights from a Knockout Mouse Model. Cells 2024, 13, 1687. [Google Scholar] [CrossRef] [Scilit] [PubMed]
  49. Kanno, T.; Nakajima, T.; Kawashima, Y.; Yokoyama, S.; Asou, H.K.; Sasamoto, S.; Hayashizaki, K.; Kinjo, Y.; Ohara, O.; Nakayama, T.; et al. Acsbg1-dependent mitochondrial fitness is a metabolic checkpoint for tissue T(reg) cell homeostasis. Cell Rep. 2021, 37, 109921. [Google Scholar] [CrossRef] [Scilit]
  50. Mutch, D.M.; O’Maille, G.; Wikoff, W.R.; Wiedmer, T.; Sims, P.J.; Siuzdak, G. Mobilization of pro-inflammatory lipids in obese Plscr3-deficient mice. Genome Biol. 2007, 8, R38. [Google Scholar] [CrossRef] [Scilit]
  51. Liu, J.; Dai, Q.; Chen, J.; Durrant, D.; Freeman, A.; Liu, T.; Grossman, D.; Lee, R.M. Phospholipid scramblase 3 controls mitochondrial structure, function, and apoptotic response. Mol. Cancer Res. 2003, 1, 892–902. [Google Scholar]
  52. Chang, C.; Worley, B.L.; Phaëton, R.; Hempel, N. Extracellular Glutathione Peroxidase GPx3 and Its Role in Cancer. Cancers 2020, 12, 2197. [Google Scholar] [CrossRef] [Scilit] [PubMed]
  53. Hauffe, R.; Stein, V.; Chudoba, C.; Flore, T.; Rath, M.; Ritter, K.; Schell, M.; Wardelmann, K.; Deubel, S.; Kopp, J.F.; et al. GPx3 dysregulation impacts adipose tissue insulin receptor expression and sensitivity. JCI Insight 2020, 5, e136283. [Google Scholar] [CrossRef] [Scilit] [PubMed]
  54. Quiroga, A.D.; Li, L.; Trötzmüller, M.; Nelson, R.; Proctor, S.D.; Köfeler, H.; Lehner, R. Deficiency of carboxylesterase 1/esterase-x results in obesity, hepatic steatosis, and hyperlipidemia. Hepatology 2012, 56, 2188–2198. [Google Scholar] [CrossRef] [Scilit]
  55. Wang, H.; Wu, S.; Weng, Y.; Yang, X.; Hou, L.; Liang, Y.; Wu, W.; Ying, Y.; Ye, F.; Luo, X. Increased serum carboxylesterase-1 levels are associated with metabolic dysfunction associated steatotic liver disease and metabolic syndrome in children with obesity. Ital. J. Pediatr. 2024, 50, 162. [Google Scholar] [CrossRef] [Scilit]
  56. Yang, H.; Wang, Q.; Xi, Y.; Yu, W.; Xie, D.; Morisaki, H.; Morisaki, T.; Cheng, J. AMPD2 plays important roles in regulating hepatic glucose and lipid metabolism. Mol. Cell Endocrinol. 2023, 577, 112039. [Google Scholar] [CrossRef] [Scilit]
  57. Andres-Hernando, A.; Orlicky, D.J.; Kuwabara, M.; Fini, M.A.; Tolan, D.R.; Johnson, R.J.; Lanaspa, M.A. Activation of AMPD2 drives metabolic dysregulation and liver disease in mice with hereditary fructose intolerance. Commun. Biol. 2024, 7, 849. [Google Scholar] [CrossRef] [Scilit]
  58. Zhao, X.Y.; Li, S.; DelProposto, J.L.; Liu, T.; Mi, L.; Porsche, C.; Peng, X.; Lumeng, C.N.; Lin, J.D. The long noncoding RNA Blnc1 orchestrates homeostatic adipose tissue remodeling to preserve metabolic health. Mol. Metab. 2018, 14, 60–70. [Google Scholar] [CrossRef] [Scilit] [PubMed]
  59. Zhang, X.; Xue, C.; Lin, J.; Ferguson, J.F.; Weiner, A.; Liu, W.; Han, Y.; Hinkle, C.; Li, W.; Jiang, H.; et al. Interrogation of nonconserved human adipose lincRNAs identifies a regulatory role of linc-ADAL in adipocyte metabolism. Sci. Transl. Med. 2018, 10, eaar5987. [Google Scholar] [CrossRef] [Scilit]
  60. Mastrolia, V.; Flucher, S.M.; Obermair, G.J.; Drach, M.; Hofer, H.; Renström, E.; Schwartz, A.; Striessnig, J.; Flucher, B.E.; Tuluc, P. Loss of α(2)δ-1 Calcium Channel Subunit Function Increases the Susceptibility for Diabetes. Diabetes 2017, 66, 897–907. [Google Scholar] [CrossRef] [Scilit]
  61. Yang, Y.; Yamane, S.; Harada, N.; Ikeguchi-Ogura, E.; Yamamoto, K.; Wada, N.; Fauzi, M.; Murakami, T.; Yabe, D.; Hayashi, Y.; et al. Voltage-gated calcium channel α(2)δ-1 subunit is involved in the regulation of glucose-stimulated GLP-1 secretion in mice. Am. J. Physiol. Gastrointest Liver Physiol. 2025, 328, G243–G251. [Google Scholar] [CrossRef] [Scilit]
  62. Zhang, Y.; Liu, Y.; Qu, J.; Hardy, A.; Zhang, N.; Diao, J.; Strijbos, P.J.; Tsushima, R.; Robinson, R.B.; Gaisano, H.Y.; et al. Functional characterization of hyperpolarization-activated cyclic nucleotide-gated channels in rat pancreatic beta cells. J. Endocrinol. 2009, 203, 45–53. [Google Scholar] [CrossRef] [Scilit]
  63. Combe, C.L.; Gasparini, S. I(h) from synapses to networks: HCN channel functions and modulation in neurons. Prog. Biophys. Mol. Biol. 2021, 166, 119–132. [Google Scholar] [CrossRef] [Scilit]
  64. Pan, S.; Souza, L.A.; Worker, C.J.; Reyes Mendez, M.E.; Gayban, A.J.B.; Cooper, S.G.; Sanchez Solano, A.; Bergman, R.N.; Stefanovski, D.; Morton, G.J.; et al. (Pro)renin receptor signaling in hypothalamic tyrosine hydroxylase neurons is required for obesity-associated glucose metabolic impairment. JCI Insight 2024, 9, e174294. [Google Scholar] [CrossRef] [Scilit] [PubMed]
  65. Ren, L.; Sun, Y.; Lu, H.; Ye, D.; Han, L.; Wang, N.; Daugherty, A.; Li, F.; Wang, M.; Su, F.; et al. (Pro)renin Receptor Inhibition Reprograms Hepatic Lipid Metabolism and Protects Mice From Diet-Induced Obesity and Hepatosteatosis. Circ. Res. 2018, 122, 730–741. [Google Scholar] [CrossRef] [Scilit]
  66. Huang, D.W.; Sherman, B.T.; Lempicki, R.A. Systematic and integrative analysis of large gene lists using DAVID bioinformatics resources. Nat. Protoc. 2009, 4, 44–57. [Google Scholar] [CrossRef] [Scilit]
  67. Sherman, B.T.; Hao, M.; Qiu, J.; Jiao, X.; Baseler, M.W.; Lane, H.C.; Imamichi, T.; Chang, W. DAVID: A web server for functional enrichment analysis and functional annotation of gene lists (2021 update). Nucleic Acids Res. 2022, 50, W216–W221. [Google Scholar] [CrossRef] [Scilit] [PubMed]
  68. Chan, C.C.; Harley, I.T.W.; Pfluger, P.T.; Trompette, A.; Stankiewicz, T.E.; Allen, J.L.; Moreno-Fernandez, M.E.; Damen, M.; Oates, J.R.; Alarcon, P.C.; et al. A BAFF/APRIL axis regulates obesogenic diet-driven weight gain. Nat. Commun. 2021, 12, 2911. [Google Scholar] [CrossRef] [Scilit]
  69. Kim, C.Y.; Ahn, J.H.; Han, D.H.; NamKoong, C.; Choi, H.J. Proteome Analysis of the Hypothalamic Arcuate Nucleus in Chronic High-Fat Diet-Induced Obesity. Biomed Res. Int. 2021, 2021, 3501770. [Google Scholar] [CrossRef] [Scilit]
  70. Calvillo-Robledo, A.; Samson, S.; Marichal-Cancino, B.A.; Medina-Pizaño, M.Y.; Ibarra-Martínez, D.; Ventura-Juárez, J.; Muñoz-Ortega, M. Rapid liver self-recovery: A challenge for rat models of tissue damage. Life Sci. 2024, 357, 122975. [Google Scholar] [CrossRef] [Scilit] [PubMed]
  71. Kovačević, S.; Pavković, Ž.; Brkljačić, J.; Elaković, I.; Vojnović Milutinović, D.; Djordjevic, A.; Pešić, V. High-Fructose Diet and Chronic Unpredictable Stress Modify Each Other’s Neurobehavioral Effects in Female Rats. Int. J. Mol. Sci. 2024, 25, 11721. [Google Scholar] [CrossRef] [Scilit]
  72. Pérez, C.; Canal, J.R.; Domínguez, E.; Campillo, J.E.; Guillén, M.; Torres, M.D. Individual housing influences certain biochemical parameters in the rat. Lab. Anim. 1997, 31, 357–361. [Google Scholar] [CrossRef] [Scilit]
  73. Lopak, V.; Eikelboom, R. Pair housing induced feeding suppression: Individual housing not novelty. Physiol. Behav. 2000, 71, 329–333. [Google Scholar] [CrossRef] [Scilit] [PubMed]
  74. Akkaya, A.; Aykan, D.; Gencturk, S.; Unal, G. Intermittent environmental enrichment induces behavioral despair, while intermittent social isolation impairs spatial learning in rats. Pharmacol. Biochem. Behav. 2025, 250, 174001. [Google Scholar] [CrossRef] [Scilit] [PubMed]
  75. Cloutier, S.; Newberry, R.C. Physiological and behavioural responses of laboratory rats housed at different tier levels and levels of visual contact with conspecifics and humans. Appl. Anim. Behav. Sci. 2010, 125, 69–79. [Google Scholar] [CrossRef] [Scilit]
  76. Varlinskaya, E.I.; Spear, L.P.; Spear, N.E. Social Behavior and Social Motivation in Adolescent Rats: Role of Housing Conditions and Partner’s Activity. Physiol. Behav. 1999, 67, 475–482. [Google Scholar] [CrossRef] [Scilit]
  77. Krohn, T.C.; Sørensen, D.B.; Ottesen, J.L.; Hansen, A.K. The effects of individual housing on mice and rats: A review. Anim. Welf. 2006, 15, 343–352. [Google Scholar] [CrossRef] [Scilit]
  78. Decavel, C.; Van den Pol, A.N. GABA: A dominant neurotransmitter in the hypothalamus. J. Comp. Neurol. 1990, 302, 1019–1037. [Google Scholar] [CrossRef] [Scilit] [PubMed]
  79. Jiang, H. Hypothalamic GABAergic neurocircuitry in the regulation of energy homeostasis and sleep/wake control. Med. Rev. 2022, 2, 531–540. [Google Scholar] [CrossRef] [Scilit]
  80. Kotz, C.M.; Wang, C.; Teske, J.A.; Thorpe, A.J.; Novak, C.M.; Kiwaki, K.; Levine, J.A. Orexin A mediation of time spent moving in rats: Neural mechanisms. Neuroscience 2006, 142, 29–36. [Google Scholar] [CrossRef] [Scilit]
  81. Herrmann, M.J.; Tesar, A.K.; Beier, J.; Berg, M.; Warrings, B. Grey matter alterations in obesity: A meta-analysis of whole-brain studies. Obes. Rev. 2019, 20, 464–471. [Google Scholar] [CrossRef] [Scilit]
  82. Mozolewski, P.; Jeziorek, M.; Schuster, C.M.; Bading, H.; Frost, B.; Dobrowolski, R. The role of nuclear Ca2+ in maintaining neuronal homeostasis and brain health. J. Cell Sci. 2021, 134, jcs254904. [Google Scholar] [CrossRef] [Scilit]
  83. Dunn-Meynell, A.A.; Le Foll, C.; Johnson, M.D.; Lutz, T.A.; Hayes, M.R.; Levin, B.E. Endogenous VMH amylin signaling is required for full leptin signaling and protection from diet-induced obesity. Am. J. Physiol.-Regul. Integr. Comp. Physiol. 2015, 310, R355–R365. [Google Scholar] [CrossRef] [Scilit] [PubMed]
  84. Manousopoulou, A.; Koutmani, Y.; Karaliota, S.; Woelk, C.H.; Manolakos, E.S.; Karalis, K.; Garbis, S.D. Hypothalamus proteomics from mouse models with obesity and anorexia reveals therapeutic targets of appetite regulation. Nutr. Diabetes 2016, 6, e204. [Google Scholar] [CrossRef] [Scilit]
  85. Levin, B.E.; Dunn-Meynell, A.A.; Routh, V.H. Brain glucose sensing and body energy homeostasis: Role in obesity and diabetes. Am. J. Physiol.-Regul. Integr. Comp. Physiol. 1999, 276, R1223–R1231. [Google Scholar] [CrossRef] [Scilit]
  86. Luo, X.D.; Tang, S.; Luo, X.Y.; Quzhen, L.; Xia, R.H.; Wang, X.W. Mitochondrial regulation of obesity by POMC neurons. Biochim. Biophys. Acta Mol. Basis Dis. 2025, 1871, 167682. [Google Scholar] [CrossRef] [Scilit] [PubMed]
  87. Michael, N.J.; Simonds, S.E.; van den Top, M.; Cowley, M.A.; Spanswick, D. Mitochondrial uncoupling in the melanocortin system differentially regulates NPY and POMC neurons to promote weight-loss. Mol. Metab. 2017, 6, 1103–1112. [Google Scholar] [CrossRef] [Scilit]
  88. Hu, H.; Lu, X.; He, Y.; Li, J.; Wang, S.; Luo, Z.; Wang, Y.; Wei, J.; Huang, H.; Duan, C.; et al. Sestrin2 in POMC neurons modulates energy balance and obesity related metabolic disorders via mTOR signaling. J. Nutr. Biochem. 2024, 133, 109703. [Google Scholar] [CrossRef] [Scilit]
  89. Wu, X.; Wang, Y.; Du, X.; Liu, Y.; Gao, Y.; Tuo, Y.; Mu, G. Proteomics analysis of the hypothalamus of high-fat diet fed mice after Lactiplantibacillus plantarum Y44 administration. Food Biosci. 2022, 47, 101762. [Google Scholar] [CrossRef] [Scilit]
Figure 1. Diagram of experimental protocols.
Sci 08 00090 g001
Figure 2. Effect of free access to a cafeteria diet on body mass over time. Rats were retrospectively divided into quartiles based on their body mass after 10 weeks of a cafeteria diet (Table 1). All animals had free access to standard pellets, cafeteria diet, and fresh water. *, p < 0.05; π, p < 0.05 among all groups in the corresponding week.
Sci 08 00090 g002
Figure 3. Effect of the cafeteria diet on the anxiety-like response in the open-field paradigm. Rats were divided into four quartiles based on body mass. (A) Frequency of rearing; (B) frequency of grooming; (C) time in the central area; (D) visits to the center; (E) distance traveled; and (F) time of immobility are reported among quartiles. One-way ANOVA.
Sci 08 00090 g003
Figure 4. Shows the heat map of differences in expressed proteins between Q1 (WLT 216) and Q4 (WGT 284) rats (p ≤ 0.05).
Sci 08 00090 g004
Figure 5. Volcano plot representing the results from the differential expression analysis of proteins upregulated in red and downregulated in green among 1294 proteins analyzed between Q1 and Q4. The horizontal dashed line indicates the statistical significance threshold (p < 0.05), while the vertical dashed lines indicate the log2(fold change) thresholds used to define upregulated and downregulated proteins.
Sci 08 00090 g005
Figure 6. Functional enrichment analysis of proteins upregulated in overweight rats (Q4) compared to underweight ones (Q1). In (A), the bars represent the percentage of proteins associated with each specific term covered in our data. In (B), the pie chart groups related terms by color. In (C), data are presented as a network with node size indicating the level of enrichment and color and connections indicating the relationship between the terms.
Sci 08 00090 g006
Figure 7. Functional enrichment analysis of proteins downregulated in overweight rats (Q4) compared to underweight ones (Q1). In (A), the bars represent the percentage of proteins associated with each specific term covered in our data. In (B), the pie chart groups related terms by color. In (C), data are presented as a network with node size indicating the level of enrichment and color and connections indicating the relationship between the terms.
Sci 08 00090 g007
Table 1. Descriptive data of the body mass per quartile after 10 weeks of free access to a cafeteria diet.
Parameter Quartile 1Quartile 2Quartile 3Quartile 4All Subjects
Minimum 201 g226 g272 g304 g201 g
Maximum226 g273 g296 g335 g335 g
Mean216.8 g249.7 g284.3 g313.6 g265.5 g
Median217 g249.5 g289 g308 g272 g
Std. Dev.8.6 g16.9 g9.2 g11.6 g38.2 g
Table 2. Significant differences in protein expression between Q1 (underweight) and Q4 (overweight) rats (p ≤ 0.05). Green-colored gene names indicate downregulation in relative abundance in Q4 compared to Q1 rats, while red indicates higher expression.
GeneUniprotFold Change
Relative Abundance Q1/Q4
p-ValueRelative Abundance Q1Relative Abundance Q4
Apoa1P046393.32090.02290.06740.0203
Prps2P093302.99600.01150.01970.0065
GapdhsQ9ESV62.68200.00000.00880.0032
Serpina3nP090062.25750.01390.01200.0053
Acsbg1Q924N52.06950.02250.02940.0142
Plscr3Q6QBQ42.06530.00290.00790.0038
Gpx3P237641.84110.01750.01030.0056
Ces1cP109591.78610.04430.01920.0107
Ampd2Q023561.68690.00010.03970.0235
HnrnpuQ6IMY81.60940.01020.02770.0172
Cacna2d1P542901.57080.01080.13500.0859
Hcn1Q9JKB01.56360.00960.02880.0184
Atp6ap2Q6AXS41.52000.02510.00960.0063
Tprg1lA8WCF81.48060.00140.03800.0257
ArhgdiaQ5XI731.47560.02950.01760.0119
Sv2cQ9Z2I61.44310.04770.00870.0060
Pgm1P386521.41350.04590.01870.0132
Cadm3Q1WIM31.39220.01030.01730.0124
Gpm6bQ9JJK11.34880.02160.01290.0095
Ubr4Q2TL321.28940.00300.14730.1142
Uggt1Q9JLA31.24250.01070.07060.0568
Slc25a11P977001.23230.00650.14120.1146
Itih3Q634161.19090.00720.02690.0226
Kif15Q7TSP21.18460.02630.14860.1255
Stx1bP612651.15570.03290.19060.1649
Slc6a1P239781.14370.03710.03270.0286
Myh10Q9JLT00.87640.00040.20910.2386
Map1bP152050.86540.02380.15170.1753
Tomm70Q75Q390.85490.00860.07310.0856
Pgrmc1P705800.85360.04330.04800.0562
Vsnl1P627620.85010.00730.11450.1348
CkbP073350.84340.03790.29260.3470
Ndufb1P0DN350.84290.03910.01200.0142
Kif5cP565360.84140.02390.04360.5190
Gsto1Q9Z3390.83740.04990.07050.0842
Dctn1P280230.83660.04930.04870.0582
Unc13cQ627700.83540.02190.12280.1470
Sfxn5Q8CFD00.83460.01160.04180.0501
Slc2a3Q076470.82980.01570.03570.0430
Rtn3Q6RJR60.82510.01470.13430.1628
Kcnab2P624830.82180.02490.01640.0200
Septin11B3GNI60.80230.00800.07450.0929
PccbP076330.77610.02160.01970.0254
Fth1P191320.77420.03880.01150.0149
Rab6aQ9WVB10.77220.04200.02200.0284
Rpl13aP354270.76200.00990.01670.0219
Gstm5Q9Z1B20.75920.04330.01300.0172
TfamQ91ZW10.75770.02330.00390.0052
Tubb2aP851080.74700.03340.52630.7045
Camk2dP157910.73100.01270.00540.0074
RanP628280.72960.00780.00870.0120
Psmd13B0BN930.72710.03620.00780.1070
ActbP607110.71950.03130.97310.3524
YwhahP685110.71120.00570.04080.0574
Rpl18aP627180.70780.00030.04400.0622
St13P505030.70700.00680.03560.0503
Rab4aP057140.68970.03350.00600.0087
Prpsap1Q634680.68750.00030.06670.0971
Wasf1Q5BJU70.68420.02240.01200.0176
CfiQ9WUW30.67310.01000.00590.0087
Emc8Q5FVL20.67060.00880.01260.0188
Tubb3Q4QRB40.66930.00140.05410.0808
Tmem109Q6AYQ40.66820.03660.00510.0076
PamP149250.62550.03370.13380.2139
Ddah2Q6MG600.56990.02830.00370.0065
Table 3. Possible functions in body weight regulation of the 16 proteins that were highly affected. A threshold of log2 fold change ≥ |0.5| was used to select proteins with greater alterations in overweight and underweight rats.
Higher Relative Expression in Overweight (Q4) Than in Underweight Rats (Q1)
GenPossible Function in Metabolism and Body Mass Regulation
Ddah2DDAH2 regulates insulin secretion, sensitivity, energy expenditure, and thermogenesis via asymmetric dimethylarginine-independent pathways. Furthermore, it supports healthy lipid distribution and storage in adipocytes and responds to inflammatory signaling [30,31,32].
PamChanges in PAM activity reshape amidated peptides, impacting appetite, gastric emptying, lipid metabolism, and insulin secretion [33,34,35].
Tmem109Involved in the biogenesis of ER membrane proteins (including lipid droplet formation). It modulates ER/SR Ca2+ permeability, which is closely related to insulin secretion, lipid metabolism, and ER stress responses [36,37,38].
Lower relative expression in overweight (Q4) than in underweight rats (Q1)
GenPossible function in metabolism and body mass regulation
Apoa1It is the main protein of HDL and is essential for reverse cholesterol transport. It has metabolic functions such as improving insulin sensitivity, stimulating insulin secretion, promoting energy expenditure of brown adipose tissue through UCP1, and modulating lipolysis in adipocytes [39,40].
Prps2It generates phosphoribosyl pyrophosphate (PRPP), a central metabolite linking the pentose phosphate pathway with nucleotide and amino acid biosynthesis, integrating nutrient availability and growth signaling through glycolysis, PPP, and the mTOR axis to ensure nucleotide supply [41,42,43].
GapdhsIt modulates cellular metabolism (by altering the glycolytic–oxidative balance and affecting ATP and ROS levels). GAPDHS acts as a metabolic switch in melanoma, reducing glycolysis and limiting metastasis [44,45].
Serpina3nIt is involved in relevant metabolic processes, such as hepatic stasis, non-alcoholic fatty liver disease, regulation of hepatic metabolism, adipose inflammation, insulin resistance, and central control of energy balance [46,47].
Acsbg1It activates long-chain fatty acids, allowing their incorporation into complex lipids, their β-oxidation, and the production of signaling lipids, which enables the synthesis of membrane lipid mediators. Furthermore, it is related to mitochondrial function and specific tissue metabolisms [48,49].
Plscr3It helps remodel mitochondrial phospholipids (particularly cardiolipin), mitochondrial bioenergetics and β-oxidation; regulates lipid droplet formation; and influences the mobilization of pro-inflammatory lipids in adipose tissue, thereby affecting mitochondrial structure and function [50,51].
Gpx3It is an extracellular antioxidant that reduces hydrogen peroxide and lipid hydroperoxides, thereby protecting tissues from oxidative damage. Furthermore, it influences insulin receptor expression and the insulin response in adipocytes [52,53].
Ces1cIt can be considered a metabolic regulatory enzyme that links the storage, mobilization, and flow of lipids throughout the body, with important implications for obesity, non-alcoholic fatty liver disease, hyperlipidemia, and insulin sensitivity [54,55].
Ampd2It functions as a whole-body metabolic regulator, especially in the liver, affecting lipid metabolism, glucose homeostasis, gluconeogenesis, fat mass, fat accumulation, insulin sensitivity, and the metabolic stress response to diet [56,57].
HnrnpuIt acts as an essential cofactor for several lncRNAs expressed in adipose tissue (e.g., Blnc1 and linc-ADAL) that control the thermogenesis of brown adipocytes and the differentiation–lipid accumulation of white adipocytes, influencing adipogenesis, thermogenic gene programs, and lipid storage, processes directly related to energy expenditure and body weight regulation [58,59].
Cacna2d1It plays a vital role in the secretion of hormones (insulin, GLP-1) and therefore in the regulation of glucose homeostasis, energy balance, and, potentially, body weight [60,61].
Hcn1It is a membrane channel that shapes excitability in pancreatic β cells and neurons. Through these effects, it can influence the secretion of insulin and possibly incretins; in addition, it could affect the hypothalamic control of feeding and energy expenditure [62,63].
Atp6ap2It integrates RAS-dependent and RAS-independent signaling and regulates lipid metabolism, glucose metabolism, adipogenesis, hepatic lipid management, energy balance, and the central control (hypothalamic paraventricular nucleus) of glucose [64,65].
Disclaimer/Publisher’s Note: The statements, opinions and data contained in all publications are solely those of the individual author(s) and contributor(s) and not of MDPI and/or the editor(s). MDPI and/or the editor(s) disclaim responsibility for any injury to people or property resulting from any ideas, methods, instructions or products referred to in the content.