Article

Application of Rosa damascena By-Product Extract in Kashkaval Cheese: Effects on Physicochemical, Microbiological, Texture and Sensory Properties

by
Mihaela Ivanova
1,
Aneta Kisova
2,
Alexandar Balabanov
1,
Milena Dimitrova-Dicheva
1,
Nikolay Kolev
3,
Ivelina Ivanova
4,
Georgi Peychev
1,
Desislava Vlahova-Vangelova
3 and
Francesco Vizzarri
5,*
1
Department of Milk and Dairy Technology, University of Food Technologies, 4002 Plovdiv, Bulgaria
2
Faculty of Agrobiology and Food Resources, Institute of Animal Husbandry, Slovak University of Agriculture in Nitra, Tr. A. Hlinku 2, 949-76 Nitra, Slovakia
3
Department of Meat and Fish Technology, University of Food Technologies, 4002 Plovdiv, Bulgaria
4
Department of Analytical Chemistry and Physical Chemistry, University of Food Technologies, 4002 Plovdiv, Bulgaria
5
Department of Nutrition and Small Farm Animals, National Agricultural and Food Centre, Hlohovecká 2, 951-41 Lužianky, Slovakia
*
Author to whom correspondence should be addressed.
Submission received: 29 January 2026 / Revised: 18 March 2026 / Accepted: 24 March 2026 / Published: 31 March 2026
(This article belongs to the Section Biology Research and Life Sciences)

Abstract

The incorporation of natural plant extracts into dairy products has attracted increasing interest due to their potential to enhance nutritional value and product stability. This study evaluated the effects of distilled rose (Rosa damascena Mill.) flower ethanolic extract on the physicochemical, texture, microbiological, and sensory properties of kashkaval cheese. Cheese samples were immersed in solutions containing rose extract at concentrations of 1.25% (S2) and 2.5% (S3) and compared with a control (S1) during ripening. Sensory evaluation showed that S2 achieved the most favorable balance of aroma, flavor, and overall acceptability, whereas S3 exhibited reduced acceptance due to an excessively strong floral aroma. The enrichment did not significantly affect fat (26–29%), water (33–36%), or salt (~2%) content. However, rose extract accelerated proteolysis, with S2 showing the highest maturity index (NPN/TN 13.76% at month 6) compared with the control (11.19%). Enriched samples showed improved amino and organic acid profiles, while the control contained higher levels of saturated fatty acids and cholesterol. All samples met microbiological safety criteria. Rose extract also influenced color and texture properties. These results demonstrate that rose extract can serve as a functional ingredient to improve the quality and technological properties of kashkaval cheese, with optimal effects at 1.25%.

1. Introduction

In recent decades, there has been growing scientific and industrial interest in the development of functional foods that provide health benefits beyond basic nutrition. Dairy products are widely consumed worldwide and represent an important source of essential nutrients due to their high nutritional value and fermentation processes, such as those involved in yogurt and kashkaval cheese production, which promote the release and absorption of bioactive compounds [1]. Enriching dairy products with plant extracts is an innovative approach to enhance their functionality. Such extracts can improve antioxidant capacity, oxidation resistance, probiotic activity, and microbiological stability [2]. Examples include rosemary, green tea, garlic, and other herbs, which have been successfully incorporated into yogurts, cheeses, and other fermented dairy products to enhance antioxidant activity, microbial stability, and sensory appeal [3,4].
Rosa damascena Mill. is one of the most valuable plants in Bulgaria and the Middle East. It is traditionally used in perfumery and cosmetics but also finds application in medicine and gastronomy [5]. Rosa damascena Mill. is distinguished by its rich phytochemical composition, such as flavonoids (quercetin, kaempferol, rutin), with antioxidant and anti-inflammatory effects [6,7]. The extract is also rich in polysaccharides [8]. In addition, the plant contains phenolic acids such as gallic, caffeic, and protocatechuic acid, known for antioxidant and antimicrobial effects [9]. The essential oils in Rosa damascena (citronellol, geraniol, phenylethanol) provide aroma and antimicrobial activity [10]. The diverse composition of rose includes tannins and anthocyanins, which also contribute antioxidant effects and may influence the sensory profile of rose-enriched dairy products [11]. Among natural products and plant-derived extracts, rose extract remains relatively underexplored in dairy systems, thereby justifying its selection and reinforcing the novelty of the present work.
Rosa damascena extracts and its essential oil have been investigated as functional ingredients especially in fresh dairy products due to their antioxidant and antimicrobial properties [6]. Previous studies have demonstrated their useful incorporation into fermented fresh dairy products such as yogurt and whey-based beverages [11,12]. In these studies, rose extract demonstrated enhanced antioxidant activity, stabilized probiotic microflora, improved sensory characteristics, and inhibited the growth of undesirable microorganisms [11,12]. Although these findings revealed the potential of rose-derived compounds to improve the functional and technological properties of fresh dairy products, their application in hard cheeses remains underexplored.
Kashkaval cheese is a traditional hard cheese, from the pasta filata family, widely produced in Eastern Europe [13]. It is characterized by a specific manufacturing process including curd stretching and salting in hot brine solution, followed by molding, blowing and ripening. This leads to its distinguished texture, flavor, and specific biochemical changes during maturation. Due to its relatively high fat content, extended ripening period, and susceptibility to lipid oxidation and microbial changes, kashkaval cheese represents a suitable matrix for the incorporation of natural bioactive compounds aimed at improving product stability, nutritional value, and sensory characteristics. The addition of rose extract is expected to improve physicochemical characteristics, ameliorate nutritional traits, reduce lipid peroxidation, stimulate proteolysis and amino acid release, improve microbial stability, and create a distinctive sensory profile combining traditional taste with floral notes. These effects of rose extract on kashkaval profile, stability, and characteristics during the cheese ripening and storage period have not been investigated. Therefore, this study aimed to evaluate the effect of rose extract incorporation on the physicochemical, microbiological, texture, antioxidant, and sensory properties of kashkaval cheese, therefore contributing to the development of innovative functional dairy products.

2. Materials and Methods

2.1. Materials

Fresh rose petal by-product was obtained after the distillation of rose flowers for rose oil extraction. Distilled rose (Rosa damascena Mill.) flower extract was obtained from fresh rose petals harvested in Plovdiv region, Bulgaria, during the flowering season. All reagents and chemicals used in the study were of analytical grade. Sodium chloride, solvents, and microbiological media were purchased from Fillab Ltd., Plovdiv, Bulgaria. All analyses were performed using standard laboratory equipment available at University of Food Technologies, Plovdiv, Bulgaria.

2.2. Preparation of Rose Extract

The rose extract was obtained from Rosa damascena petals after distillation and prepared according to the method described by [6]. Fresh petals of Rosa damascena Mill. were washed, air-dried, and subjected to extraction using 95% ethanol solution. The extraction was performed at 20 °C for 24 h under continuous stirring. The obtained extract was filtered through Whatman filter paper and stored at 4 °C until use. The extract was subsequently used for cheese immersion at concentrations of 1.25% and 2.5%. A full characterization (polyphenol profile and biological activities) of the rose petal extract was previously conducted and published by the authors [6].

2.3. Kashkaval Cheese Preparation

Kashkaval cheese was prepared from two batches of cow milk supplied by a local dairy farmer. It was produced at the laboratory facility of the Department of Milk and Dairy Technology, University of Food Technologies (Plovdiv, Bulgaria). The classic production process included the following technological operations [14]: cow milk qualification (Milko Scan 133B, Foss Electric, DK-3400 Hillerod, Denmark) with the following indicators: fat content 3.30 ± 0.10%; protein 3.16 ± 0.10%; pH 6.6 ± 0.1; titratable acidity 14 ± 2 °T, density 1.028 g/cm3; freezing point −0.551 ± 0.020 °C; clarification and standardization of milk fat (at 35–45 °C) in order to achieve a casein-to-fat-content ratio of 0.70; thermisation (at 63 ± 2 °C for 15–20 s); cooling (at 33 ± 1 °C); addition of 1% starter culture, WhiteDaily 51 (with composition Lactobacillus delbrueckii subsp. bulgaricus, Lactococcus lactis subsp. cremoris, Lactococcus lactis subsp. lactis, Streptococcus thermophilus) and CO-03 (with composition Lactobacillus helveticus, Streptococcus thermophilus, Lactobacillus delbrueckii subsp. bulgaricus) both provided by Chr. Hansen company (Horsholm, Danmark), calcium dichloride solution (33–35%) in an amount of 30 cm3 per 100 dm3 of milk (previously diluted in water in a 1:10 ratio) and rennet (CHY-MAX® Supreme, Novonesis Group, Horsholm, Denmark; previously diluted in water in a 1:10 ratio) in such an amount that the coagulation started 10–12 min after enzyme addition and a set coagulum was formed after 45 min; cutting the obtained coagulum at two stages, into 3–4 cm grains and after 5–10 min into 6–8 mm grains; stirring and stabilizing the grains for 5–15 min; heating the formed grains (at 40–42 °C for 40–60 min); draining (separated whey titratable acidity 16–24 °T); collecting of curd for pressing (6 kg weight for 1 kg curd for 15–20 min, when pH reached 5.8–5.9); cutting the curd in 50–60 cm parallelepiped slices; cheddaring (1–1.5 h, pH 5.2–5.3); milling of the curd (slices with length of 20–30 cm and width 8–10 mm) and salting in a hot water solution (at 72 °C and 14% salt content); forming in 0.5 kg mold; stabilizing the forms by 3–4 turnings of the molds. Three processing treatments were applied: control sample (S1)—kashkaval cheese without rose extract, surface air-dried for 3 days at 10–12 °C; sample S2—kashkaval cheese immersed for 12 h at 10–12 °C in an aqueous solution containing 1.25% distilled rose extract (previously dissolved in 2 mL of 95% ethanol), followed by air-drying for 3 days; and sample S3—kashkaval cheese subjected to the same treatment as S2 but using an aqueous solution containing 2.5% rose extract. The quantity of rose extract used in kashkaval cheese was established based on previous experiments by Vlahova-Vangelova et al. [15]. After surface air-drying, the products were packaged and left to ripen for 60 days at 8–10 °C. The finished kashkaval cheese was stored for up to six months at a temperature of 2–4 °C.

2.4. Analysis Performed on Kashkaval Cheese

Kashkaval cheese samples were analyzed in dynamics during the ripening and storage periods. Chemical analyses were performed according to Association of Official Analytical Chemists (AOAC) methodology [16] for fat content, sodium chloride content, moisture content and dry matter, ash, total nitrogen (TN), the protein content calculated as the total nitrogen multiplied by 6.38, titratable acidity (TA), pH measurement (pH meter-7110 WTW, Frankfurt, Germany), and color, using the chroma meter (Chroma Meter cr-410, Konica Minolta, CA, USA), measuring the color of the surface and the cut surface. Water-soluble nitrogen (WSN) was also determined by the Kjeldahl method according to the International Dairy Federation (IDF) [15]. The ratios of WSN⁄TN, NCN/TN (non-casein nitrogen/total nitrogen), and NPN/TN (non-protein nitrogen/total nitrogen) were named as ripening indexes and expressed as %. Triplicate analysis was performed for all parameters in consideration.
The texture profile analysis was performed on cheese slices (15 mm thick and 60 mm in diameter) using a TX-700 analyzer equipped with a 25 kg strain gauge (Lamy Rheology, Champagne au Mont d’Or, France). The test was performed using a double compression method with a ½ spherical probe (30 mm in diameter) to compress 70% of the initial height at a compression rate of 1 mm/s and a 5 s delay between compressions. The data were processed using Rheotex software version 2.55 (Lamy Rheology, Champagne au Mont d’Or, France). The texture parameters, hardness, cohesiveness, elasticity, gumminess, chewiness obtained from force and area measurements were determined as described by [16].
The initial extraction of phenolic compounds was performed using 50% methanol in a laboratory homogenizer (D160/10, DLABSCIENTIFIC Co., Ltd., Beijing, China) at 20,000 rpm for 60 s in a sample:solvent ratio of 1:4 and left to rest for 60 min. The mixture was centrifuged at 9000× g for 10 min. The supernatant was collected while the residue was mixed with 70% acetone in a sample:solvent ratio of 1:4 and left to rest for 60 min. Tubes were made to a final volume of 50 mL with distilled water and centrifuged at 9000× g for 10 min. The second supernatant was mixed with the initial one and used for further analyses [17]. Total phenolic content was determined by the Folin–Ciocalteu test, described by [18], with some modifications. Briefly, 250 µL extract was mixed with 500 µL Folin–Ciocalteu reagent and 1500 µL 7.5% Na2CO3 and diluted to 10 mL. Mixtures were incubated for 2 h at room temperature in the dark. Final absorption was spectrophotometrically measured at 760 nm (calibration curve R2 = 0.99289), and total phenolic content is expressed as mg gallic acid e/g sample. Antioxidant activity—via the DPPH (2,2-diphenyl-1-picrylhydrazyl) method—was determined according to [19]. The mixture of 250 µL extract and 2250 µL 6 × 10⁻⁵ M DPPH solution was incubated for 15 min at room temperature in the dark. Absorption measurements were performed at 517 nm (calibration curve R2 = 0.99289) with a UV/Vis spectrophotometer (Helios Omega UV–vis spectrophotometer equipped with VISIONlit 5.4 software—Thermo Fisher Scientific, Madison, WI, USA), and the result is expressed as µmol/Trolox equivalent/g sample extract. For calibration, the FRAP (ferric reducing antioxidant power) method was performed according to [20] with some modifications. Briefly, 2250 μL FRAP reagent (mix of 2.5 mL TPTZ (10 mmol/L) in HCl (40 mmol/L), 2.5 mL FeCl3 in water (20 mmol/L) and 25 mL of an acetate buffer (0.3 mol/L, pH 3.6) and 250 μL sample extract were mixed for 4 min at room temperature in the dark. The absorbance was measured with a spectrophotometer at 593 nm (calibration curve R2 = 0.99584) and the results are expressed as µmol/Trolox equivalent/g sample.
Non-polar and polar metabolites were determined by GC/MS mass spectrometry [21]. Sample Preparation and GC-MS Analysis: Lyophilized cheese samples (100.0 mg) were extracted with 500 µL of methanol, supplemented with internal standards: 50.0 µL ribitol for polar metabolites and 50.0 µL nonadecanoic acid for non-polar metabolites (1.0 mg/mL each). Following vortexing (10 s) and incubation (30 min at 70 °C, 300 rpm), the mixture was cooled, and 300 µL of distilled water and 500 µL of chloroform were added. After phase separation via centrifugation (10 min at 13,000 rpm, 22 °C), the polar and non-polar phases were processed separately. Polar Metabolites: An amount of 300.0 µL of the upper phase was evaporated to dryness under vacuum. Derivatization was performed by adding 100.0 µL of methoxyamine hydrochloride in pyridine (20.0 mg/mL) and incubating at 70 °C for 90 min, followed by silylation with 50.0 µL of BSTFA at 70 °C for 30 min. Fatty Acids: An amount of 300.0 µL of the lower phase was evaporated to dryness. Transmethylation was carried out with 1.0 mL of 1M sulfuric acid in methanol at 96 °C for 90 min. The resulting fatty acid methyl esters (FAMEs) were extracted with hexane (3 × 500 µL), evaporated, and further silylated with 50.0 µL BSTFA and 50.0 µL pyridine at 70 °C for 30 min. GC-MS Conditions: Analysis was performed using an Agilent 7890A GC coupled with a 5975C MS detector, equipped with an HP-5MS column (30 m × 0.32 mm × 0.25 µm). Helium was used as a carrier gas (1.0 mL/min). The injection volume was 1 µL (split ratio 20:1). For polar metabolites, the oven temperature started at 100 °C (2 min), rose to 180 °C at 15 °C/min (1 min), and finally reached 300 °C at 5 °C/min (10 min). For fatty acids, the program started at 70 °C (1 min) and increased to 300 °C at 5 °C/min (10 min). The injector and detector temperatures were maintained at 250 °C, with a mass scan range of m/z 50–550. Retention times for the respective metabolites were compared to a reference library according to the Golm Metabolome Database (GMD) and the National Institute of Standards and Technology (NIST 08) libraries [22].
Microbiological analyses of kashkaval cheese samples were carried out according to ISO 6887-5:2020 [23]. Five grams of the tested sample were transferred to a sterile mortar with a pestle. Then, 45 mL of diluent (20% sodium citrate solution) was added, and the mixture was stirred until the sample was completely dispersed. A 10-1 dilution was prepared, and 1 mL of appropriate dilutions was transferred to Petri dishes. To determine the number of lactic acid lactobacilli, the sample was poured with 15 mL of MRS-agar, cooled to 45 °C. To determine the number of lactic acids, lactococci, the sample was poured with 15 mL of M17-agar, cooled to 45–47 °C. To determine the number of molds and yeasts, the sample was poured with 15 mL of YGC-agar, cooled to 44–47 °C. After solidification of the medium, the Petri dishes were turned over and placed in a thermostat. Incubation was carried out at the respective optimal temperatures for the development of lactic acid bacteria, namely, 43 °C for 72 h for lactobacilli and 37 °C for 48 h for lactococci. When determining the number of molds and yeasts, incubation was carried out at 30 °C for 5–7 days. After incubation, the germinated colonies were counted. When calculating the number of lactic acid bacteria, those Petri dishes presenting a number of colonies between 15 and 300 were selected for counting. For the number of molds and yeasts, those with colonies between 10 and 150 were counted. The number of microorganisms (N—CFU/g or CFU/mL) in 1 g of product is determined by the following formula:
N = ∑c/V(n1 + 0.1n2) d
where ∑c—sum of the counted colonies in the two consecutive dilutions selected for counting; V—volume of the inoculum; n1—number of Petri dishes from the first dilution in which colonies were counted; n2—number of Petri dishes from the second dilution in which colonies were counted; d—dilution factor corresponding to the first dilution in which colonies were counted.
The sensory evaluation of the fresh cheeses was conducted in accordance with the ISO 8589 [24] by 20 trained panelists experienced in dairy product evaluation. The evaluation criteria were the following: taste and aroma—20 points, consistency—15 points, structure and cut surface—10 points, appearance and color—5 points (maximum overall score—50 points). The assessment was performed under controlled conditions but not in individual booths with standard lighting and temperature. Cheese samples were coded with random three-digit numbers and presented in a randomized order to minimize bias. Panelists rinsed their mouths with water between samples. According to institutional and national guidelines, ethical approval was not required for sensory evaluation using trained panelists; however, all participants were informed about the study and provided voluntary consent prior to participation.

2.5. Statistical Analysis

Statistical analysis was performed using one-way and two-way analysis of variance (ANOVA) implemented in Microsoft Excel 2024. The results are presented as mean ± standard deviation (SD) based on four determinations (n = 4). Two independent cheese-making trials (biological replicates) were conducted, and each sample was analyzed in duplicate (analytical replicates). Prior to ANOVA, the assumptions of normality and homogeneity of variance were verified using Cochran’s test. Differences between means were evaluated using Fisher’s least significant difference (LSD) test with Scheffé’s method for multiple comparisons. Sensory scores were expressed as mean values ± standard deviation and subjected to statistical analysis using analysis of variance (ANOVA) followed by post hoc multiple comparison tests to determine significant differences between samples. The level of statistical significance was set at α = 0.05 (p < 0.05). Statistically significant differences between samples are indicated in the tables by different superscript letters.

3. Results and Discussion

3.1. Physicochemical Analysis

Table 1 presents the results of the three tested samples obtained during ripening (0–60 days) and storage (1–6 months).
The observed changes in titratable acidity (p < 0.05) and pH during ripening and storage indicate that the addition of rose extract affects the metabolic activity of the microflora. It should be noted that titratable acidity is not a standardized technological parameter for kashkaval cheese, as it reflects the total concentration of acid-reacting compounds, including lactic acid, amino acids, and other metabolites formed during ripening, rather than a fixed quality indicator. Unlike pH, titratable acidity does not directly measure hydrogen ion activity and therefore does not necessarily correlate with pH values. Its levels may vary depending on the stage of ripening and subsequent storage, and biochemical activity within the cheese matrix, and comparison between experimental treatments is therefore more relevant than comparison with reference ranges [Fox, Fundamentals of cheese science]. At the initial stage of ripening (day 1), the titratable acidity was 70–82 °T for the control sample and lower for the enriched cheese types (70–72 °T). At the end of ripening (60 days), the control reached 212 °T, while the samples with extract remained lower (116–167 °T). The control sample (S1) showed the highest titratable acidity values (up to 254 °T during the third month of storage), while the enriched samples S2 and S3 demonstrated lower levels. This indicates that the rose extract probably modifies the metabolic activity of the microflora and consequently can cause variations in lactose fermentation, proteolysis, and organic acid formation, during maturation and storage, in the cheese matrix without causing technological deviations. Similar behavior was observed in cheddar with Inula britannica, where the addition of extract from this plant affected the course of the fermentation processes but did not lead to technological deviations [25]. The pH varied between 4.2 and 5.7, with the enriched samples maintaining a tendency towards slower acidification. The pH values reported are typical for mature hard cheeses. Traditionally, active acidity ranges between 5.0 and 5.4 [26,27]. The addition of rose extract probably inhibits lactic acid microflora, leading to lower titratable acidity. This is consistent with observations by [28] for cheese enriched with black tea extract, where antioxidant and antimicrobial components suppressed fermentation activity. Similar data were reported by [29] for yogurt enriched with plant extracts—lower acidity and slower pH decrease. This indicates that polyphenols in plant additives can stabilize the product without completely disrupting fermentation.
All samples showed a fluctuation in fat content (22–30%), with S2 and S3 retaining higher (p < 0.05) values after 6 months (up to 29%), compared to the control. This may be due to a weaker lipid degradation in the presence of an extract that limits the lipolytic activity of microorganisms. A similar effect was found [25] in cheddar enriched with plant extracts, where the fat content was more stable compared to the control.
The water content of the control sample varied between 30 and 36%, while it remained relatively, but not significantly, higher in S2 and S3 (up to 39.6% in S2). This suggests that rose extract may influence the water-holding capacity of the milk matrix, possibly by interacting with protein structures. Granato et al. [30] found a similar effect in cheeses enriched with herbal extracts—higher water content and softer texture.
Regarding salt content, it is evident that the control sample has higher (p < 0.05) values (2.20–2.34%), while S2 and S3 maintain a lower level (1.5–2.0%). The lower osmolarity may be the result of a different distribution of water and salt in the enriched cheeses. This may contribute to a milder taste. Silva et al. [31] reported that plant-based additives in cheese can reduce the perceived saltiness and allow for a reduction in the actual NaCl content. In combination with the protective properties of the plant extract, the lower water and salt content in the fortified samples compared to the control is favorable for extending the shelf life of the product [32].
The mineral content ranges from 3.1 to 3.9%. Their amount shows slight variations, with the values in the control being slightly higher, but without a significant difference. The control sample shows sharper drops, while the values in the enriched variants remain more stable. The rose extract probably stabilizes the mineral balance by interacting with calcium and other ions in the matrix. Sopharadee et al. [33] reported that rose extract contains polyphenols with chelating properties, which may aid in maintaining the stability of minerals in food systems.
Fat content (26–29%), water content (33–36%), and salt (~2%) remained within the typical parameters for matured cheese and were not significantly affected by the addition of distilled rose flower extract. Similar results were also reported for cheeses enriched with olive leaf extract, where no significant changes in the main parameters were observed by [34].
Table 2 presents the results obtained for the surface color of the kashkaval cheese samples.
The results in the table show distinct differences in color between the control sample (S1) and the kashkaval cheese enriched with rose extract (S2 and S3). In terms of L* lightness values, the control sample retains high brightness (81–84), while S2 and S3 are significantly (p < 0.05) darker (53–72), especially after prolonged storage. This confirms the effect of plant extracts on light reduction in dairy products, as reported by other authors [35].
In the a* parameter, the control remained greenish (negative values), while the fortified samples had positive values (p < 0.05) that increased during storage. This is typical of dairy products with added plant pigments, which introduce reddish tones. Similar changes were also observed in cheese with pomegranate extract, where a significant increase in a* was reported [36].
In terms of b* values (yellowness), the control remained stable around 20–30, while S2 and S3 showed a decrease (12–18) (p < 0.05) after six months of storage. This is consistent with data from studies on yogurts enriched with rose petal extract, which showed increased instability of kashkaval color over time [37].
Table 3 presents the results for cut surface color obtained for the kashkaval cheese samples. Regarding the L* (lightness) indicator, all three samples (S1, S2, S3) start with very high values (≈89–90) and show a gradual decrease during ripening and storage (≈80–82 at 6 months). The differences between the control sample and the rose-enriched samples are not significant, indicating that the extract has a weaker effect on the lightness of the cut surface than on the surface of the cheese.
The results for the a* indicator (red–green axis) show that in all samples it remains in negative values (greenish tint). In S2 and S3, a slight increase is observed (fewer negative values), which suggests a trend towards a decrease in green shades and the appearance of light reddish kashkaval tones.
The values for the b* index increased over time (from ≈19–20 to ≈23–25), indicating an increase in yellowness during storage. The control had slightly higher values than the fortified samples, suggesting that the rose extract may slightly suppress the intensity of the kashkaval color, but the difference did not reach the statistical significance.
Similar results have been reported by other research teams, who noted that the addition of plant extracts has a stronger effect on the color of the cheese surface than on the cut surface, since the pigments interact primarily with light and oxygen at the surface [38]. This is consistent with the results obtained, where the L* index changes much less in the interior.
Abdelmontaleb et al. [36] applied pomegranate extract to white cheese and also observed limited changes in color on the cut surface compared to the uncut surface. The authors indicated that the lower exposure to oxygen in the interior reduced the effect of the pigments on L* and a*.
Qiu et al. [37] reported that a more pronounced change in b* (yellowness) was observed in dairy products with rose extract (yogurt), which is consistent with the current data, although the effect was more moderate in kashkaval cheese.
The fortified samples had lower L*-values (darker) and higher a*-values (reddish hues) compared to the control sample. Similar changes were also found in cheeses fortified with olive leaf extract or plant pigments, where darkening and change in hue were observed, but without a negative effect on consumer acceptability [34].
Color measurements confirmed that enrichment resulted in lower L* values (darker hue) and higher a* values (reddish hue), especially in the sample with the addition of 2.5% distilled rose extract. This gives a distinctive appearance that can be seen as a marketing advantage.

3.2. Technological Process Analysis

Table 4 presents the results of the three tested samples regarding the degree of maturity of the kashkaval cheese obtained during ripening and storage.
The maturity indices (NCN/TN, NPN/TN and WSN/TN) clearly show that the addition of distilled rose flower extract accelerates proteolysis in the cheese. In the control (S1), the NCN/TN values increased (p < 0.05) gradually from 6.89% (1 day) to 15.70% (6th month), while in S2 and S3, higher levels (p < 0.05) were recorded on the 60th day (12.53% and 12.41%, respectively), with S2 values remaining permanently higher until the end of storage. This result is in line with the studies of [38], who emphasized that higher levels of soluble nitrogen fractions are an indicator of intense proteolysis and lead to a softening of the texture.
A similar trend was observed in NPN/TN, where S2 recorded the highest values (13.76% at the sixth month), significantly (p < 0.05) above the control sample (11.19%). The increased levels of NPN suggest an increased degradation of peptides to amino acids, which is known to affect not only the texture but also the aroma of ripening cheeses [39,40]. In this context, rose extract may act as a stimulator of microbial and enzymatic activity, which is also confirmed by the higher numbers in S2 and S3 at the mid-ripening stage.
WSN/TN also showed an accelerated increase (p < 0.05) in the enriched samples (up to 9.89% in S2 at the third month compared to 8.33% in S1). This is consistent with the observations of [41] that water-soluble nitrogen fractions correlate with the development of a soft and more elastic structure, especially in cheeses with higher proteolytic activity.
This is also confirmed by other literature data on plant additives (e.g., pomegranate extract), which also enhance proteolysis and lead to structural changes in cheese [37].
The textural analysis of the tested kashkaval cheese samples is presented in Table 5. It shows that the extract positively affects the cohesiveness and elasticity of the kashkaval cheese, with products with 1.25% addition achieving the best balance between hardness and gumminess.
Regarding the hardness indicator, the control S1 shows high initial values (54.17 on the first day) but decreases sharply to 13.96 after 6 months. In samples S2 and S3 (1.25% and 2.5% rose extract), a lower (p < 0.05) initial hardness is reported than the control on the first day (≈34–35) and also a decrease (p < 0.05) to ≈13–15 at 6 months. The texture results show that the rose extract reduces the initial hardness compared to the control, and during storage, all samples soften, which is most likely a result of proteolysis, moisture change and other interactions in the cheese. The control has a sharper absolute decrease from a very high initial value. It probably contains more structurally “bound” protein, which is degraded more intensively during ripening. In S2 and S3, the initial matrix is already softer; therefore, the absolute decrease is smaller. Microbial population and enzyme profiles can also alter the rate of degradation.
Cohesion is relatively stable. The values for this indicator are similar between samples (≈0.59–0.64 on day 1) and largely maintain this trend over time with slight fluctuations. This means that although they soften, the structural bonds (the approximate ability to retain shape under deformation) are not permanently destroyed. Similar observations have been described for other fortified products.
Changes are noted between samples in elasticity: S1 retains relatively high values (p < 0.05) in the initial stages of ripening and storage periods (0.74) and drops to 0.61. For S2 and S3, the results are heterogeneous, with a drop and recovery at some intervals. The gumminess and chewiness indicators decrease significantly (p < 0.05) in all samples over time, with the control sample showing the largest absolute drop.
The physicochemical parameters and microbiological results provide clear guidance on the mechanisms determining the texture dynamics of the kashkaval cheese enriched with rose extract. The observed decrease in firmness and gumminess over time correlates with the increased activity of lactic acid bacteria, especially in samples S2 and S3, where the number of colonies reaches higher values compared to the control. During ripening, the increased microbial activity stimulates proteolysis, which leads to the degradation of the casein matrix and softening of the product [42].
Changes in pH and titratable acidity also support these results. At S2 and S3, a more dynamic fluctuation in pH was observed, including drops to 4.2–4.6, which is consistent with higher acidity and more intense proteolytic activity. Such changes are a known factor in reducing the firmness and elasticity of ripening cheeses [43].
Water and salt content also have an impact. Samples with rose extract retained slightly more water, especially at S2 (up to 39.6%), which probably facilitated a softening of the texture and a reduction in chewiness. Similar relationships between high water content and lower hardness have been reported for functional cheeses enriched with plant extracts [44].
The presence of phenolic compounds in rose extract may further modify the protein network by forming complexes with casein, which contributes to the softer structure of kashkaval cheese [6]. Similar mechanisms have been described in cheeses with pomegranate extract, which showed accelerated softening and lower hardness compared to control samples [36].
Texture data showed that rose extract accelerated proteolysis in the cheese, leading to faster softening and lower gumminess compared to the control sample. All samples showed the typical softening of ripening cheese over time. The addition of the extract resulted in significant differences in hardness, elasticity and cohesiveness compared to the control. This is consistent with results from other authors, who found that the addition of plant extracts significantly affected the main textural parameters of hard cheeses [45].

3.3. Antioxidant Activity in Kashkaval Cheese

The results regarding total phenolic content (FC or TPC) and antioxidant activity against DPPH radical (2,2-diphenyl-1-picrylhydrazyl—a free radical used to determine the antioxidant activity of substances), as well as iron chelating ability against iron ions FRAP (ferric reducing antioxidant power—reducing antioxidant activity with iron (III)) are presented in Table 6.
The fortified samples showed a significant increase (p < 0.05) in antioxidant activity and total phenolic content compared to the control. Similar results were found for cheddar fortified with Inula britannica extract, where an increase in total phenolics and DPPH activity was reported [25]. A review of dairy products with the addition of plant extracts also confirmed that similar ingredients enrich the product with biologically active substances without compromising technological performance [46]. The obtained products (S2 and S3) showed significantly higher antioxidant activity (p < 0.05) and content of phenolic compounds compared to the control. This confirms the expectations that the rose extract enriches the kashkaval cheese with bioactive substances and turns it into a functional product. The control sample S1 showed the lowest (p < 0.05) TPC (511.02 mg GAE/g sample on day 1), which is expected since there is no added extract. Samples S2 and S3 with 1.25% and 2.5% extract showed significantly higher (p < 0.05) TPC from day 1, with S3 reaching 598.64 mg GAE/g sample. During the ripening and storage period, TPC increased for all samples, with S3 reaching a maximum of 958.97 mg/g sample. GAE/g sample at day 60, then slightly decreasing at month 6. This is consistent with the observations of [47], who reported a gradual accumulation of phenolics in cheeses during fermentation and storage.
The control (S1) had significantly (p < 0.05) lower antioxidant activity (by DPPH) at the beginning (60.80 µ mol TE/g sample), while S2 and S3 showed significantly (p < 0.05) higher values (407.67 and 529.47 µ mol TE/g). Variability was observed during the storage period for S 1, while the extract samples demonstrated higher and relatively stable activity, although for S 3, there was a decrease at day 60, which may be due to an interaction between milk components and phenolic compounds [2].
The FRAP method showed detection only in the sample with 2.5% extract (S3), confirming that the high concentration of phenols is necessary for the reduction activity. The absence of values in S1 and S2 (“n.d.”) emphasizes that the concentration of phenols is below the limit of the method, confirming the results of TPC and DPPH [48].
Similar trends have been observed in other dairy products enriched with plant extracts. For example, Ref. [45] studies showed that the addition of phenolic extracts to cheeses increased both TPC and antioxidant activity, with the effect being more significant at higher extract percentages.
The decrease in antioxidant activity at some time points (e.g., at S3 at day 60 for DPPH) is also characteristic and was observed by [2], who explained this by potential degradation of some phenolic compounds during long-term storage.

3.4. Non-Polar and Polar Kashkaval Cheese Profile

The results obtained for the lipid profile content of the studied samples are presented in Table 7.
The control sample (S1) had the highest (p < 0.05) values for most saturated fatty acids (C4:0, C6:0, C10:0, C12:0, C14:0, C16:0), which is expected since there is no additive potentially altering fat metabolism.
The extract samples (S2 and S3) showed lower (p < 0.05) levels of saturated fatty acids (especially C14:0 and C16:0), suggesting an antioxidant and/or inhibitory effect of rose polyphenolic compounds on lipid peroxidation.
A slight and significant (p < 0.05) increase in unsaturated fatty acids (C18:1, C18:2, C18:3) was observed in the extract samples (especially S2), which is a favorable trend in terms of nutritional value.
Cholesterol was highest in the control sample (S1), while lower (p < 0.05) content was reported in S2 and S3, especially in the early stages of ripening and storage.
The control (S1) demonstrates a typical profile for kashkaval cheese—a gradual increase in short-chain and long-chain fatty acids during ripening and storage. Cholesterol increases significantly by the sixth month (100.14 mg/100 g). In sample S2 (1.25% extract), relatively lower levels of saturated fatty acids and cholesterol are observed compared to S1, especially at C14:0 and C16:0. This suggests partial protection from oxidative processes. In kashkaval cheeses coded under S3 (2.5% extract), an intermediate effect is observed—the values are often between S1 and S2. It is likely that the higher concentration of extract leads to a more significant change in the enzymatic processes during ripening and there is not always a linear relationship (the higher dose leads to a better effect). Data from [49] show that the extract dosage is critical—too-high concentrations can alter microbial fermentation and enzymatic processes, which explains why S 3 does not always outperform S 2.
Short-chain fatty acids (C4:0–C12:0) increased in all samples but more slowly in S2 and S3. The amount of long-chain fatty acids (C14:0–C22:0) also increased (p < 0.05), reaching the highest values in the control. Monounsaturated and polyunsaturated fatty acids increased their levels during storage, especially in the samples with added extract. This is associated with a more favorable lipid profile. Semeniuc et al. [50] reported that the addition of polyphenols to cheese reduced lipid peroxidation and stabilized the unsaturated fatty acid profile. Cholesterol increased over time in all samples but most significantly in S1 (p < 0.05), indicating that the extract had an apparent “hypocholesterolemic effect”. Similar effects have been described for the use of plant extracts in dairy products. Chandana et al. [51] noted that rose extract is rich in anthocyanins and flavonoids, which act as antioxidants, suppressing lipid autoxidation.
The amount and distribution of polar metabolites in the kashkaval cheese samples are presented in Table 8.
Control S1 shows a classic polar profile—a gradual decrease in most amino and organic acids during storage. Khan et al.’s [45] studies showed that the addition of plant extracts to cheese accelerated proteolysis and increased the content of free amino acids. Sample S2 (1.25% extract) recorded the highest values for most amino and organic acids. This was especially evident for lysine (up to 7.83 g/100 g), lactic acid (>1200 mg/100 g) and acetic acid (177.80 mg/100 g). The third sample S3 (2.5% extract) showed intermediate values. In some cases, the effect was closer to S1, suggesting that the higher dose of extract did not enhance, but even slightly suppressed, the metabolism of the microflora in the cheese. Chandana et al. [51] reported that Rosa extract damascena is rich in biologically active substances that in low doses stimulate bacterial activity but in high concentrations can have an antimicrobial effect. This explains why S2 is more effective than S 3.
The samples with extract (S2 and S3) showed higher (p < 0.05) values for most amino acids (alanine, valine, leucine, lysine, etc.) compared to the control (S1). At the beginning (1–60 days), the levels were highest, then they gradually decreased in all samples. S2 maintained higher values throughout the period. This suggests that the extract stimulates proteolysis and/or protects amino acids from oxidative degradation. Similar dynamics were described by [52]—amino acids accumulate at the beginning of ripening then decline due to secondary metabolism, and organic acids follow a similar curve.
The content of disaccharides (lactose) is slightly lower in S2 and S3 compared to the control—but without reaching significance—probably due to increased fermentation. The amount of lactose gradually decreases, with the decrease being more pronounced in S2 and S3—an indicator of more active lactic acid fermentation.
All organic acids (lactic, acetic, citric, etc.) were higher in S2 and S3 than in S1, especially in S2, which is an indicator of more active microbial metabolic activity. In S2, organic acids remained higher (p < 0.05) throughout the period, while in S3 they often dropped closer to the control sample. The amounts of organic acids reached maximum values around 1 month, after which they decreased (especially lactic and acetic acids). This reflects the dynamic balance between production and degradation during ripening and storage. According to [53], supplementation with plant phenols stimulated lactic acid bacteria, leading to increased levels of lactic and acetic acid—also observed in our data.

3.5. Microbiological Analysis

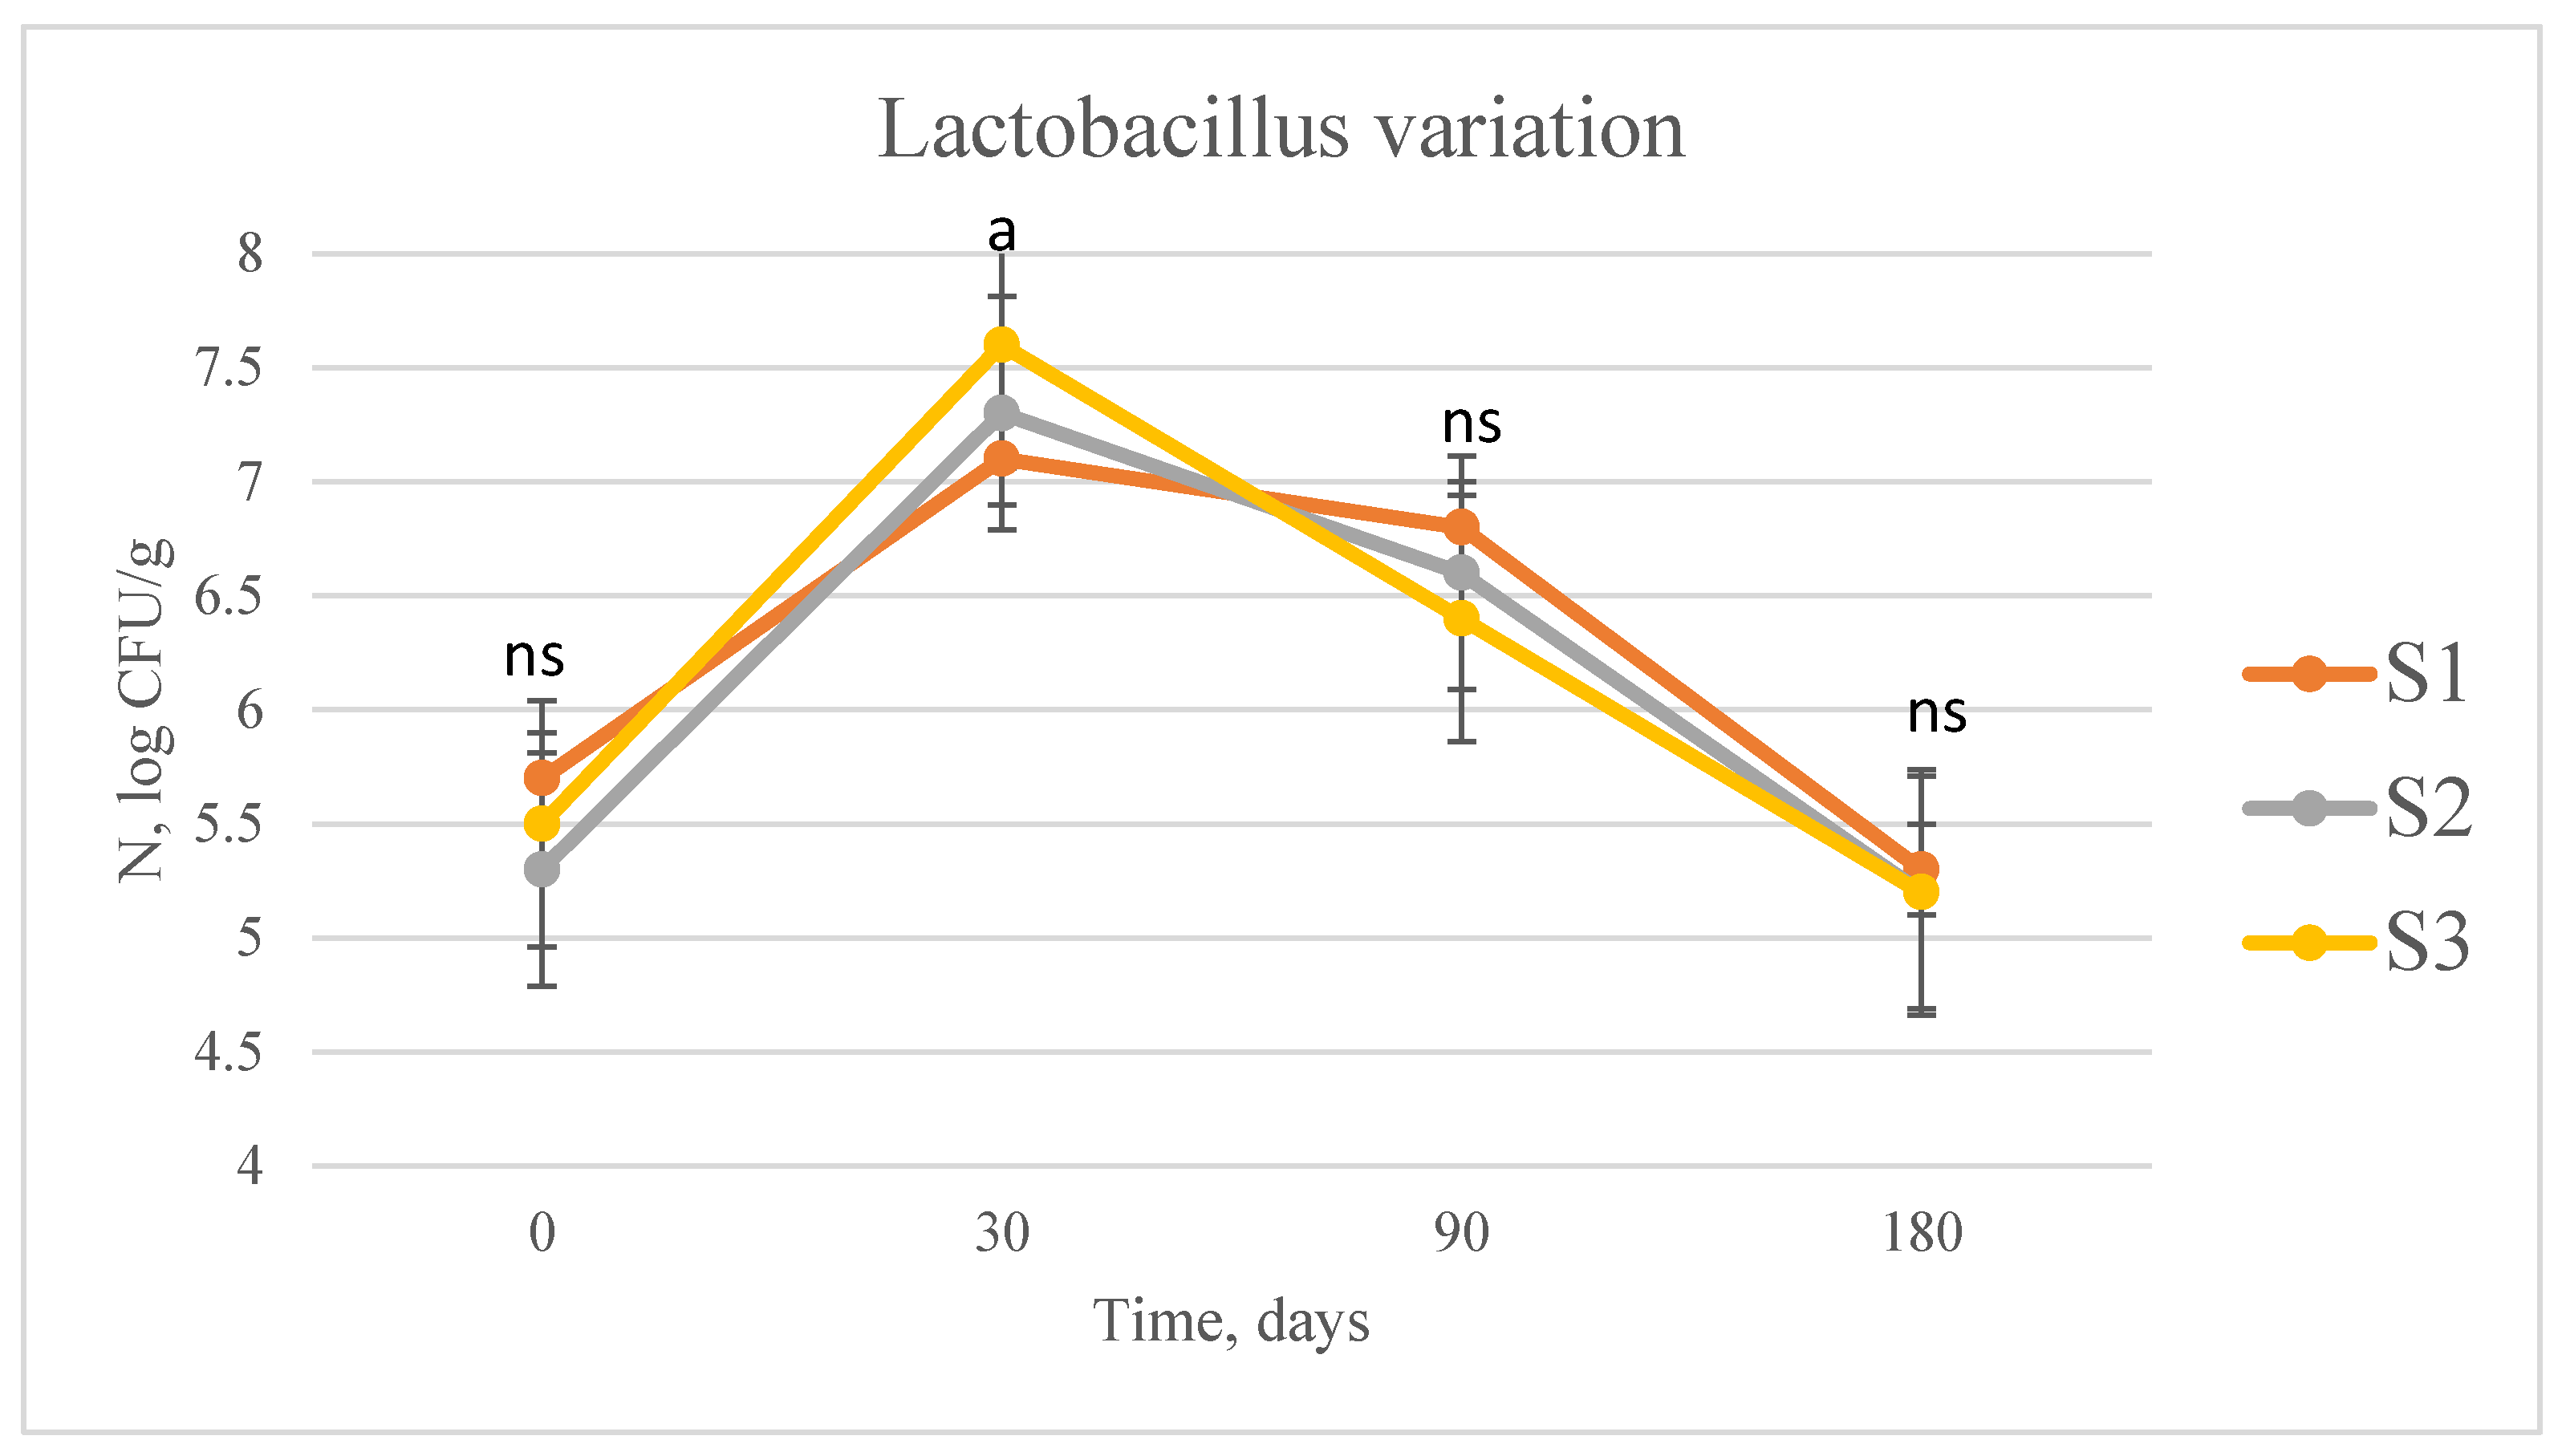
Figure 1 presents data on the dynamics of lactobacilli in kashkaval cheese samples enriched with distilled rose flower extract at different stages of ripening and storage (0, 30, 90 and 180 days). At the beginning of ripening (day 0), the number of lactobacilli is relatively low, with values varying around 5.3–5.8 log CFU/g for the three experimental samples (S1, S2 and S3). This is expected, since immediately after production, the microflora has not yet reached its optimal growth.
The results show that after 30 days of maturation, an increase in the number of lactobacilli was observed, with the highest (p < 0.05) values being recorded in sample S3 (7.6 log CFU/g). This indicates that rose flower extract stimulates the growth of lactobacilli in the early stages of ripening, probably due to the content of phenolic compounds and biologically active substances that act as prebiotic factors [54].
Between days 30 and 90, a slight decline in the lactobacilli population was observed, with values decreasing to around 6.5–6.8 log CFU/g. This corresponds to the natural course of cheese ripening, when nutritional substrates (lactose, peptides) begin to be depleted and changes in pH and water activity occur, limiting the growth of bacterial flora [52].
The results obtained show that by the end of ripening (180 days), the number of lactobacilli decreases to levels close to those at the beginning (about 5.2–5.4 log CFU/g). These results are consistent with data obtained in other studies, which found that during long-term ripening, the number of lactic acid bacteria gradually decreases as a result of autolysis and unfavorable conditions in the cheese matrix [55].
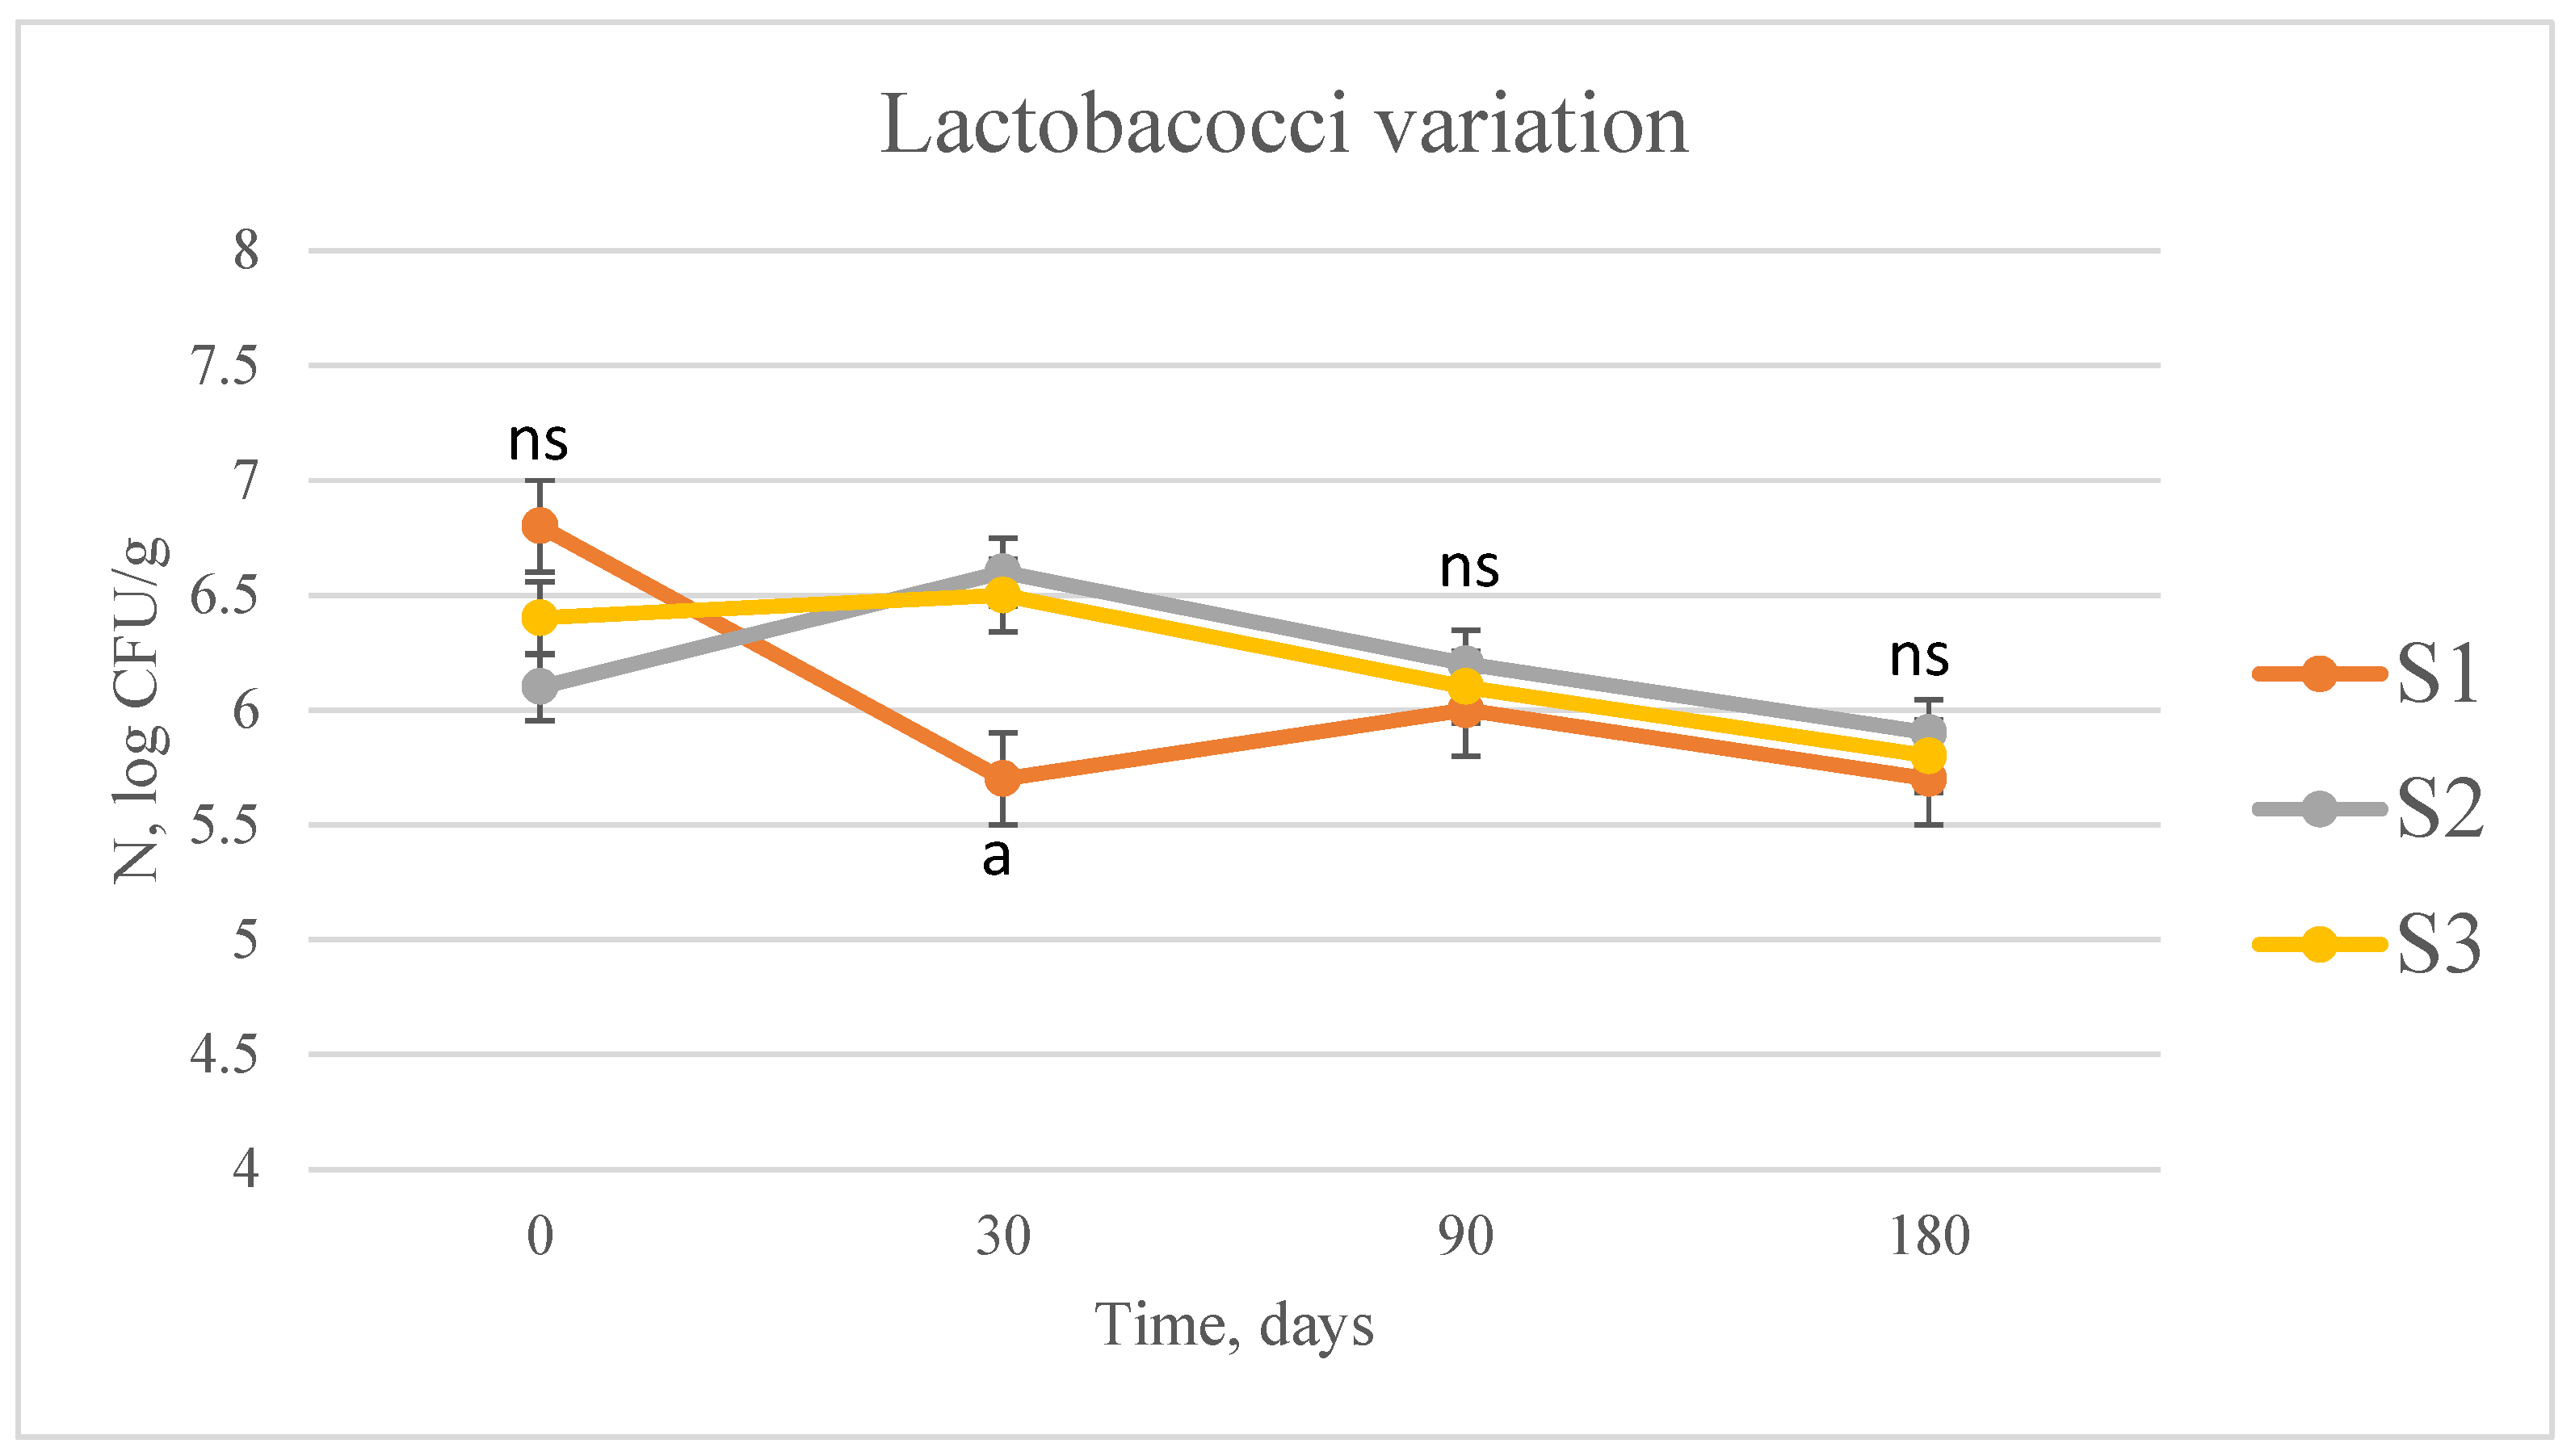
The changes in lactococci during ripening of the studied kashkaval cheese samples are presented in Figure 2. The results show that at the beginning (day 0), the control sample S1 was characterized by higher values (about 6.9 log CFU/g), while the samples enriched with distilled rose flower extract (S2 and S3) had lower levels (6.0 and 6.3 log CFU/g, respectively). This is probably due to differences in the adaptation of the bacteria to the presence of the plant extract.
After 30 days of maturation, a clear decrease in the number of sample S 1 was observed (up to about 5.7 log CFU/g), while in samples S2 and S3 there is a slight increase, with values reaching approximately 6.6 log CFU/g. This is probably due to the potential stimulating effect of the bioactive components in the extracts on lactic acid bacteria [56]. Similar results have been observed by other authors who reported that plant extracts may have different effects on individual strains of lactic acid bacteria depending on the content of phenolic compounds [57].
Between days 30 and 90, the number of lactococci gradually decreased in all samples, with values reaching 6.0–6.2 log CFU/g. This decrease is characteristic of the ripening process, when the activity of lactococci decreases due to the depletion of easily digestible carbohydrates and the occurrence of changes in the cheese matrix [55].
At the end of ripening, the number of lactococci reaches 5.7–6.0 log CFU/g. This is consistent with literature data, according to which lactococci dominate in the early stages of ripening, but as the process progresses, their number gradually decreases due to autolysis and release of intracellular enzymes, which are involved in the development of the flavor profile of the cheese [55].
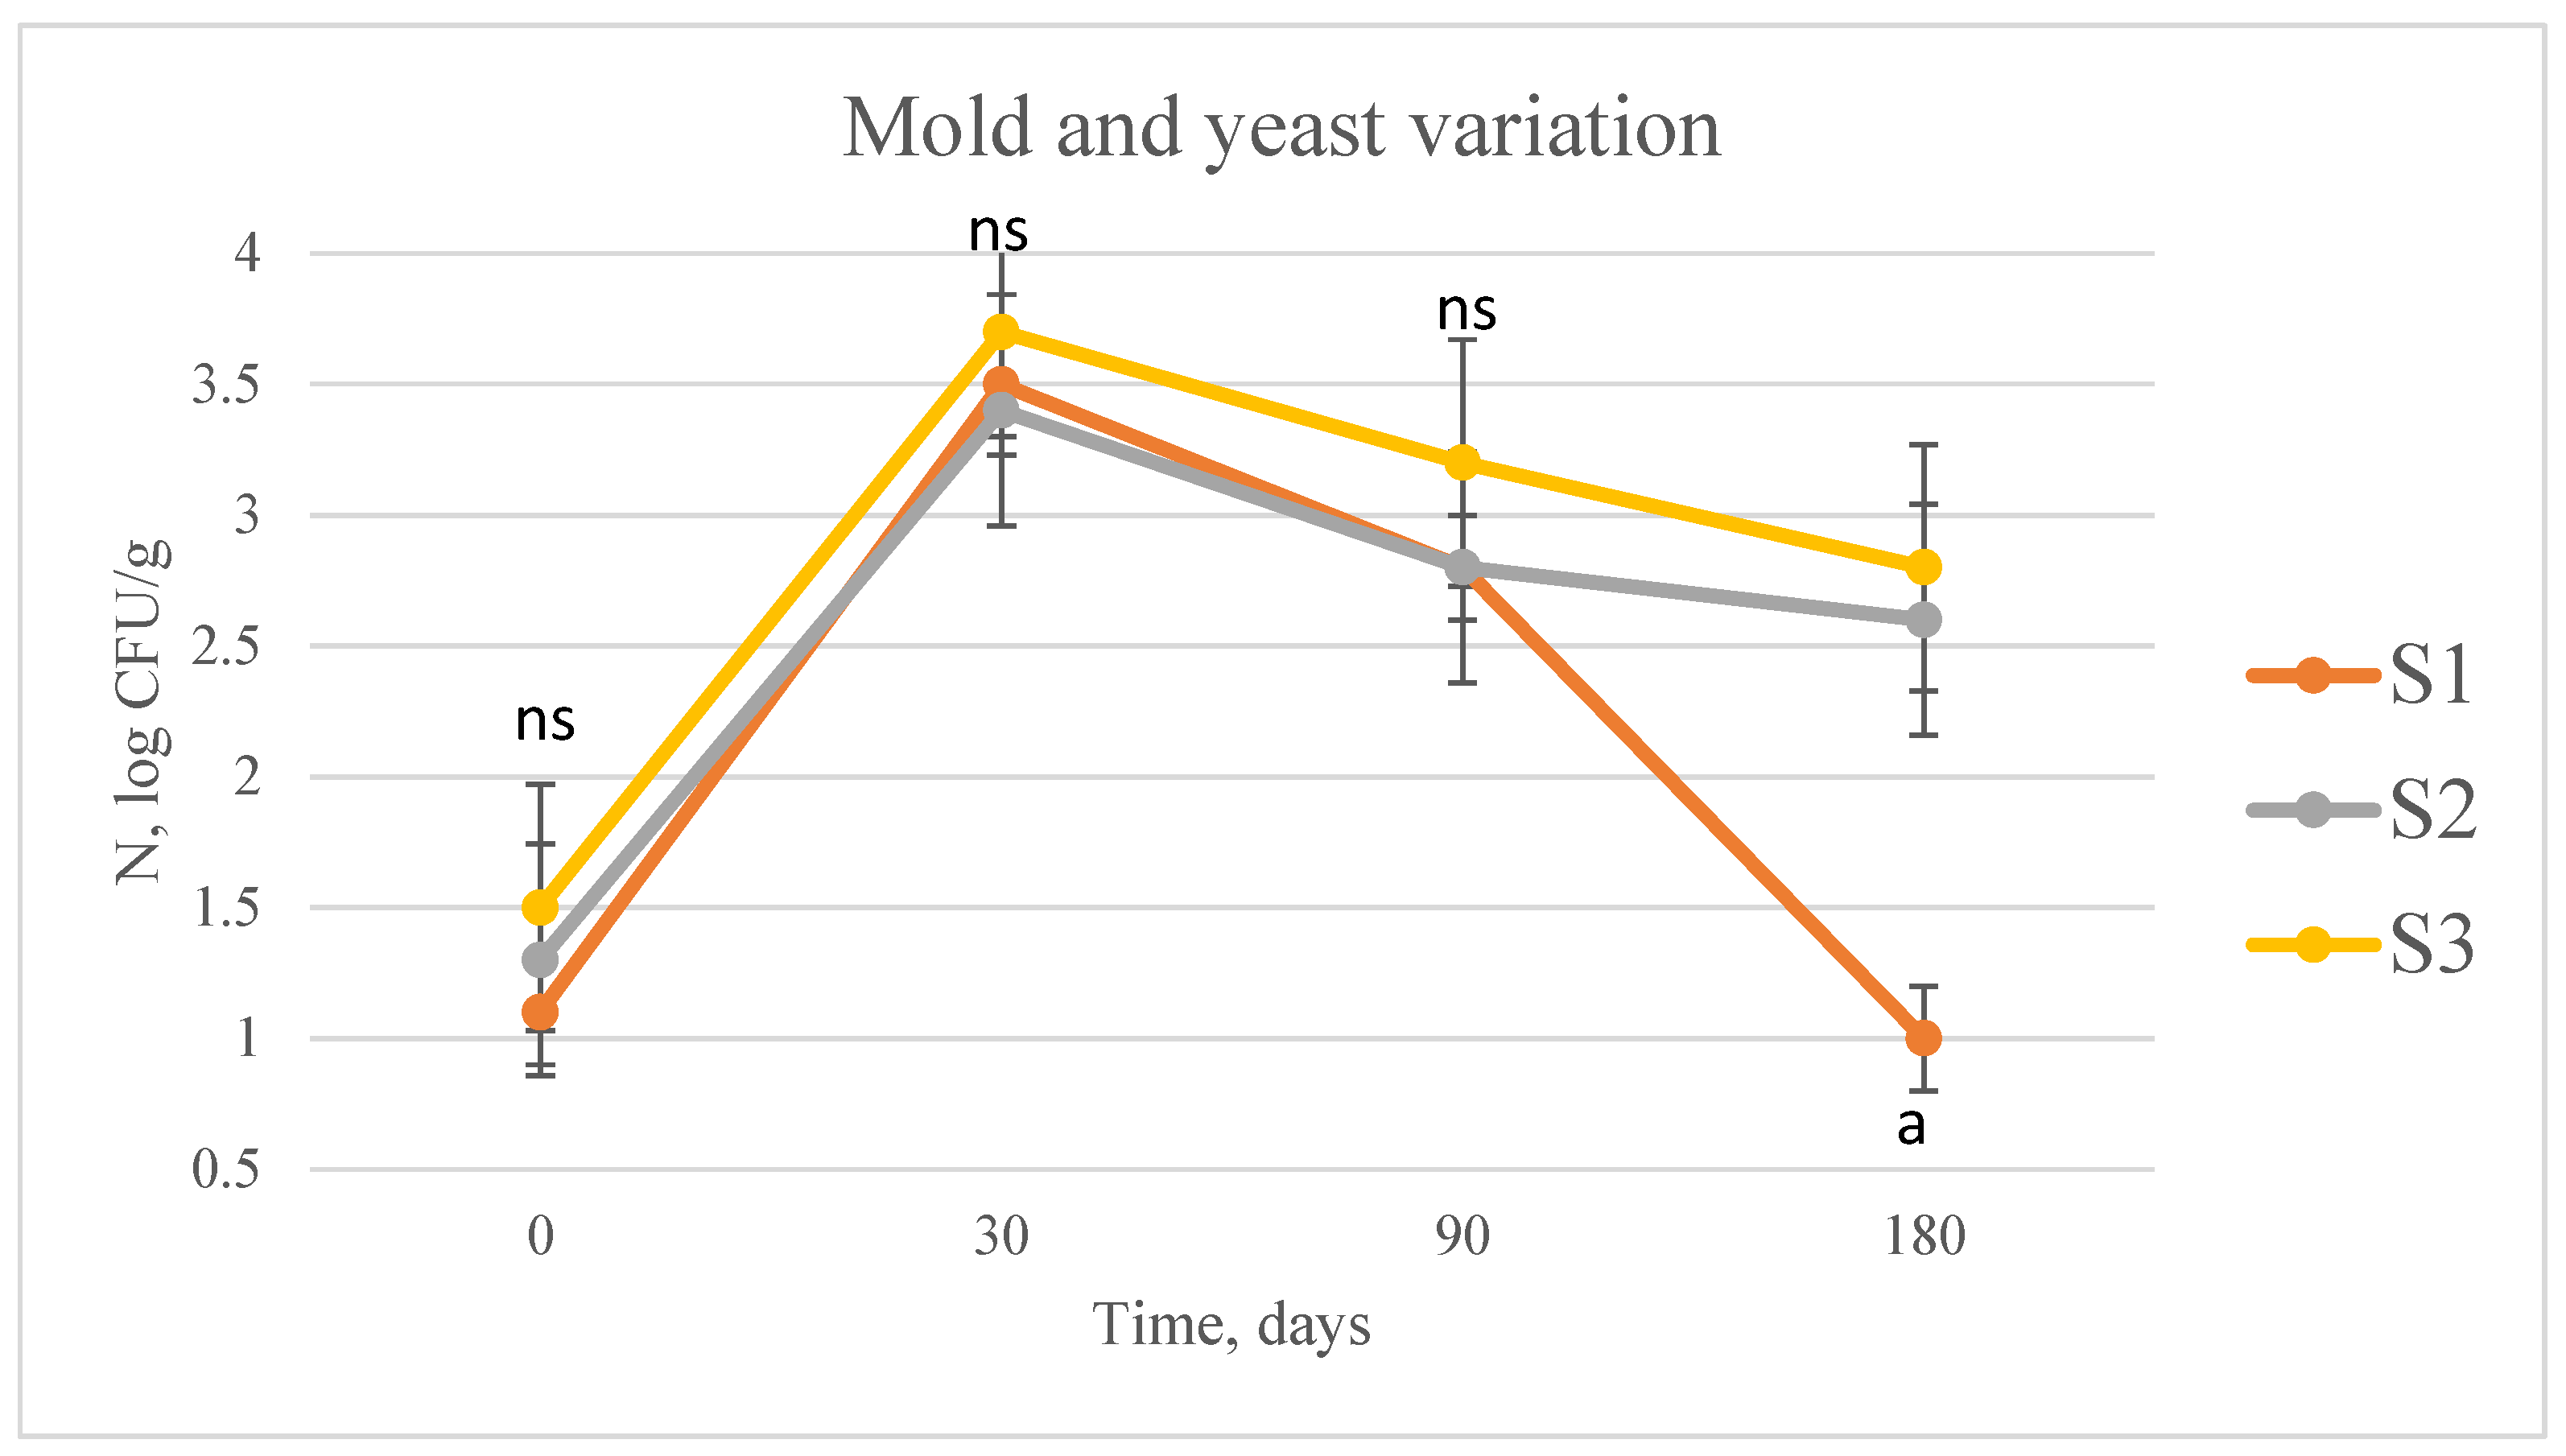
The results for the change in the number of molds and yeasts in the kashkaval cheese samples (S1, S2, S3) during ripening and storage are presented in Figure 3.
The presented data shows that on day 30, an increase in the number was observed in all samples, with the highest values being found in sample S3 (about 3.8 log CFU/g), followed by S 1 (3.6 log CFU/g) and S2 (3.3 log CFU/g), but these differences did not reach significance. This indicates that yeasts and molds are activated in the early stages of ripening, aided by the favorable environment—the presence of residual lactose, peptides and increased oxygen content in the surface layers [58].
In the subsequent stages (90 and 180 days), a significant (p < 0.05) decrease in the number of molds and yeasts was observed, especially clearly expressed in the control sample (S1), in which at the end of the period, their number was about 1.0 log CFU/g. In samples S2 and S3, the number of molds and yeasts remained higher, suggesting that the extracts may provide additional nutrients or create conditions for their longer viability. This is consistent with data from other studies, where it was found that certain phenolic compounds at low concentrations can support the growth of some yeasts, while at high concentrations, they exhibit antimicrobial activity [59,60,61].
Table 6 presents the results of the microbiological analysis for basic sanitary and hygienic indicators: coliform bacteria, Escherichia coli, Salmonella spp., Listeria monocytogenes and Staphylococcus aureus in the kashkaval cheese samples (S1, S2 and S3).
Table 9 presents the results of the microbiological analysis for basic sanitary and hygienic indicators: coliform bacteria, Escherichia coli, Salmonella spp., Listeria monocytogenes and Staphylococcus aureus in the kashkaval cheese samples (S1, S2 and S3). The results obtained show that all kashkaval cheese samples meet the regulatory microbiological criteria for food safety. The samples enriched with distilled rose flower extract, especially sample S3, demonstrate better hygiene indicators compared to the control sample, which highlights the potential of plant extracts as natural antimicrobial agents for improving the microbiological safety and shelf life of dairy products.


3.6. Sensory Analysis

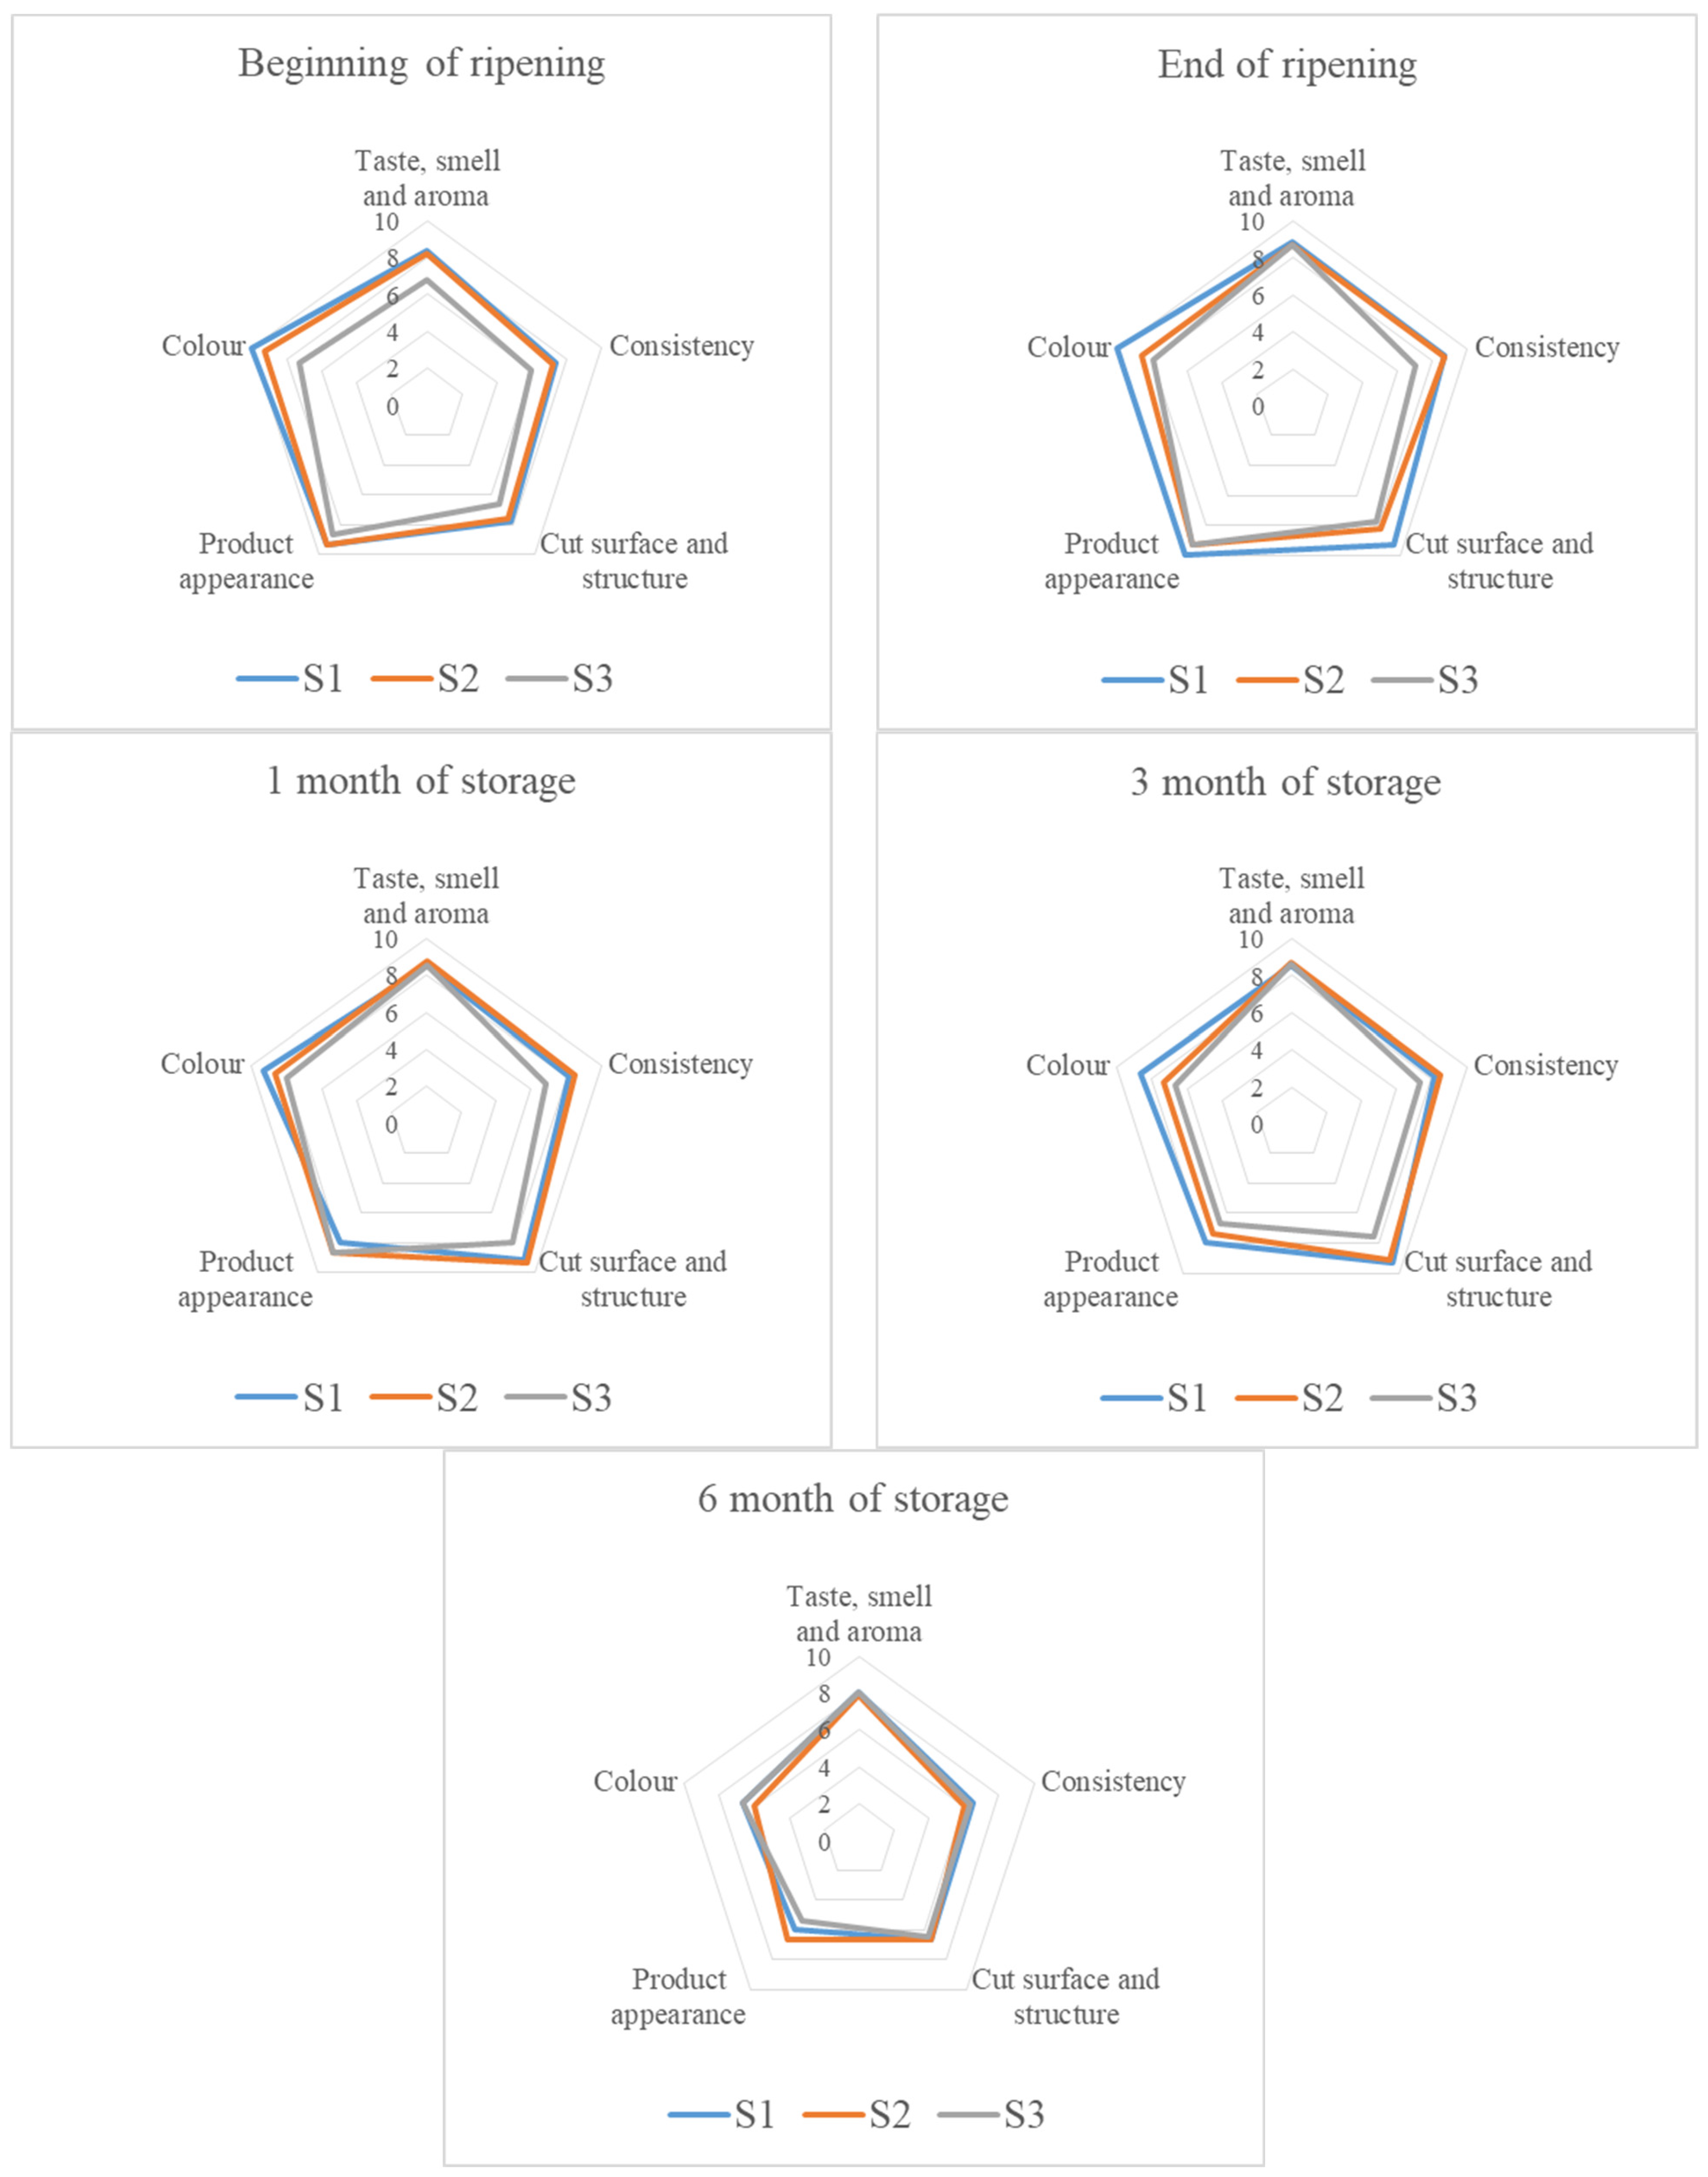
Figure 4 presents the sensory analysis of kashkaval cheese samples enriched with distilled rose flower extract during ripening and storage. The literature notes that the optimal dosage for adding plant extracts is key—at too-high levels, bitterness and other side effects appear [33]. It is expected that the addition of distilled rose flower extract can lead to a floral aroma and a slightly sweet taste of the cheese, as well as a difference in the harmony of the taste. The results from the figure show that the addition of rose flower extract affects the organoleptic characteristics of the cheese to varying degrees depending on the concentration. A moderate amount (1.25%) improves the aroma and overall acceptability of the product, while a higher content (2.5%) leads to a more intense aroma that is not perceived positively by the panelists. Similar trends are found in other scientific studies, which report that thyme extract added to cheese improves flavor at low concentrations, but at higher levels can cause a bitter or overpowering aftertaste [62] Qiu et al. [37] found that adding rose petal extract to yogurt increased antioxidant capacity and overall acceptability, with optimal results observed at moderate levels of supplementation. Wazzan [35] reviewed dairy products with plant additives and emphasized that organoleptic indicators are often improved at low concentrations of extracts, while higher ones can lead to unbalanced taste.
Organoleptic evaluations showed that samples with 1.25% extract were better accepted than those with 2.5%, with tasters rating the floral aroma and slightly sweet taste as pleasant and harmonious.

4. Conclusions

The addition of distilled rose flower extract has a significant impact on the qualities of kashkaval cheese. The most favorable effect is observed at a concentration of about 1.25%, which improves the taste, aroma, lipid and bioactive profile, without causing an overpowering aroma or inhibiting fermentation. At a higher dose (2.5%), the effects are more pronounced but not always desirable from the point of view of organoleptic and technological processes. The extract stimulates proteolysis, increases antioxidant activity and phenolic content, improves lipid balance, water and fat retention and stabilizes the mineral composition. In addition, it limits the development of undesirable microorganisms and promotes lactic acid microflora, while simultaneously changing the color and softening the texture. In summary, rose flower extract presents the potential for a functional additive that enriches the nutritional, biological and sensory characteristics of kashkaval cheese, with the optimal result being achieved at a moderate use of 1.25%.

Author Contributions

Conceptualization, M.I., A.B. and G.P.; methodology, M.I., A.K., A.B., M.D.-D., N.K., I.I., G.P., D.V.-V. and F.V.; investigation, M.I., A.K., A.B., M.D.-D., N.K., I.I., G.P., D.V.-V. and F.V.; data curation, M.I., A.B., G.P. and F.V.; writing—original draft preparation, M.I., A.B. and M.D.-D.; writing—review and editing, M.I., A.K. and F.V.; supervision, M.I. and F.V.; funding acquisition, M.I. and F.V. All authors have read and agreed to the published version of the manuscript.

Funding

This research was funded by Bulgarian National Science Fund (BNSF) with project KP-06-Slovakia/7 from 13 August 2024 and by the Slovak Research and Development Agency with project APVV-SK-BG-23-0002 (grant 27A4-A-64039).

Institutional Review Board Statement

Not applicable.

Informed Consent Statement

Not applicable.

Data Availability Statement

The original contributions presented in this study are included in the article. Further inquiries can be directed to the corresponding author(s).

Acknowledgments

The authors have reviewed and edited the output and take full responsibility for the content of this publication.

Conflicts of Interest

The authors declare no conflicts of interest.

Abbreviations

The following abbreviations are used in this manuscript:
NPNnon-protein nitrogen
AOACAssociation of Official Analytical Chemists
TNTotal nitrogen
TATitratable acidity
IDFInternational Dairy Federation
WSNWater-soluble nitrogen
NSNNon-casein nitrogen
DPPH2,2-diphenyl-1-picrylhydrazyl
FRAPferric reducing antioxidant power
TETrolox equivalents
GC/MSGas Chromatography–Mass Spectrometry
GMDGolm Metabolome Database
NISTNational Institute of Standards and Technology
NaClSodium chloride
NNitrogen
FCFolin–Ciocalteu
TPCTotal phenolic content

References

  1. Granato, D.; Barba, F.J.; Kovačević, D.B.; Lorenzo, J.M.; Cruz, A.G.; Putnik, P. Functional foods: Product development, technological trends, efficacy testing, and safety. Annu. Rev. Food Sci. Technol. 2020, 11, 93–118. [Google Scholar] [CrossRef]
  2. Kandyliari, A.; Potsaki, P.; Bousdouni, P.; Kaloteraki, C.; Christofilea, M.; Almpounioti, K.; Moutsou, A.; Fasoulis, C.K.; Polychronis, L.V.; Gkalpinos, V.K.; et al. Development of dairy products fortified with plant extracts: Antioxidant and phenolic content characterization. Antioxidants 2023, 12, 500. [Google Scholar] [CrossRef] [PubMed]
  3. Ziarno, M.; Kozłowska, M.; Ratusz, K.; Hasalliu, R. Effect of the Addition of Selected Herbal Extracts on the Quality Characteristics of Flavored Cream and Butter. Foods 2023, 12, 471. [Google Scholar] [CrossRef] [PubMed]
  4. Yin, H.; Tian, M.; Li, S.; Tang, S.; Gong, F. Effect of rosmarinic acid on microbial activity, antioxidant capacity, and metabolite profiles of fermented milk containing Lactiplantibacillus plantarum. Food Chem. X 2025, 31, 103203. [Google Scholar] [CrossRef] [PubMed]
  5. Nasery, M.; Hassanzadeh, M.K.; Najaran, Z.T.; Emami, S.A. Rose (Rosa × damascena Mill.) Essential Oils. In Essential Oils in Food Preservation, Flavor and Safety; Academic Press: Cambridge, MA, USA, 2016; pp. 659–665. [Google Scholar] [CrossRef]
  6. Kolev, N.; Ivanova, M.; Vlahova-Vangelova, D.; Balabanov, A.; Tumbarski, Y.; Dimitrova-Dicheva, M.; Vizzarri, F.; Ondruska, L. Bioactive potential of spent Rosa damascena Mill. petals extract: Antioxidant and antimicrobial properties. Sci. Pap. Ser. A Agron. 2025, 68, 792–799. [Google Scholar]
  7. Khezerlou, A.; Mohammadi, K.; Abedini, A.; Sani, M.A.; Sani, M.A.; McClements, D.J. Phytochemicals and bioactive functional ingredients from Rosa damascena: From extraction to application in the food and healthcare sectors. Food Chem. X 2025, 31, 103202. [Google Scholar] [CrossRef]
  8. Slavov, A.; Chalova, V. Physicochemical characterization of pectic polysaccharides from rose essential oil industry by-products. Foods 2024, 13, 270. [Google Scholar] [CrossRef]
  9. Trendafilova, A.; Staleva, P.; Petkova, Z.; Ivanova, V.; Evstatieva, Y.; Nikolova, D.; Rasheva, I.; Atanasov, N.; Topouzova-Hristova, T.; Veleva, R.; et al. Phytochemical profile, antioxidant potential, antimicrobial activity, and cytotoxicity of dry extract from Rosa damascena Mill. Molecules 2023, 28, 7666. [Google Scholar] [CrossRef]
  10. Verešová, A.; Vukic, M.D.; Vukovic, N.L.; Terentjeva, M.; Ban, Z.; Li, L.; Bianchi, A.; Kollár, J.; Ben Saad, R.; Ben Hsouna, A.; et al. Chemical composition, biological activity, and application of Rosa damascena essential oil as an antimicrobial agent in minimally processed eggplant inoculated with Salmonella enterica. Foods 2024, 13, 3579. [Google Scholar] [CrossRef]
  11. Kolev, N.; Ivanova, M.; Balabanov, A.; Vlahova-Vangelova, D.; Kišová, A.; Vizzarri, F. Utilization of agro-industrial residues from the Rosa damascena Mill. oil industry: A literature review on biomass potential for food and feed ingredients. Processes 2025, 13, 1945. [Google Scholar] [CrossRef]
  12. Rashwan, A.K.; Osman, A.I.; Chen, W. Natural nutraceuticals for enhancing yogurt properties: A review. Environ. Chem. Lett. 2023, 21, 1907–1931. [Google Scholar] [CrossRef]
  13. Fox, P.F.; Guinee, T.P.; Cogan, T.M.; McSweeney, P.L.H. Fundamentals of Cheese Science; Springer: New York, NY, USA, 2017. [Google Scholar] [CrossRef]
  14. Balabanov, A.; Ivanov, G.; Balabanova, T.; Uzunova, G.; Ivanova, M. Fatty acid composition of Kashkaval cheese with reduced sodium chloride content. Bio Web Conf. 2024, 102, 01006. [Google Scholar] [CrossRef]
  15. Vlahova-Vangelova, D.B.; Vassilev, K.P.; Nedyalkov, P.; Kolev, N.D. Optimization of bioactive compound mixtures: Polyphenol content, antioxidant activity, and synergistic effect. Food Sci. Appl. Biotechnol. 2025, 8, 99. [Google Scholar] [CrossRef]
  16. Association of Official Analytical Chemists (AOAC). Official Methods of Analysis, 18th ed.; AOAC: Arlington, WA, USA, 2000; Volume 2. [Google Scholar]
  17. ISO 8968-1; Milk and Milk Products: Determination of Nitrogen Content. International Dairy Federation: Brussels, Belgium, 2014.
  18. Maria do Socorro, M.R.; Alves, R.E.; de Brito, E.S.; Pérez-Jiménez, J.; Saura-Calixto, F.; Mancini-Filho, J. Bioactive compounds and antioxidant capacities of 18 non-traditional tropical fruits from Brazil. Food Chem. 2010, 121, 996–1002. [Google Scholar] [CrossRef]
  19. Estévez, M.; Ventanas, S.; Cava, R. Protein oxidation in frankfurters with increasing levels of added rosemary essential oil. J. Food Sci. 2005, 70, c427–c432. [Google Scholar] [CrossRef]
  20. Pimentel-González, D.; Aguilar-García, M.; Aguirre-Álvarez, G.; Salcedo-Hernández, R.; Guevara-Arauza, J.; Campos-Montiel, R. The process and maturation stability of Chihuahua cheese with antioxidants in multiple emulsions. J. Food Process. Preserv. 2014, 39, 1027–1035. [Google Scholar] [CrossRef]
  21. Amirdivani, S.; Baba, A.S. Changes in yogurt fermentation characteristics and antioxidant potential upon inclusion of peppermint, dill and basil. LWT-Food Sci. Technol. 2011, 44, 1458–1464. [Google Scholar] [CrossRef]
  22. Benzie, I.F.F.; Strain, J.J. The ferric reducing ability of plasma (FRAP) as a measure of antioxidant power. Anal. Biochem. 1996, 239, 70–76. [Google Scholar] [CrossRef]
  23. Ivanova, T.; Dincheva, I.; Badjakov, I.; Iantcheva, A. Transcriptional and metabolic profiling of Arabidopsis thaliana transgenic plants expressing HAC1 under abiotic stress. Metabolites 2023, 13, 994. [Google Scholar] [CrossRef]
  24. Manion, J.A.; Huie, R.E.; Levin, R.D.; Burgess, D.R., Jr.; Orkin, V.L.; Tsang, W.; McGivern, W.S.; Hudgens, J.W.; Knyazev, V.D.; Atkinson, D.B.; et al. NIST Chemical Kinetics Database, NIST Standard Reference Database; Version 7.0; National Institute of Standards and Technology: Gaithersburg, MD, USA, 2015.
  25. ISO 6887-5; Microbiology of the Food Chain—Preparation of Test Samples for Milk and Milk Products. ISO: Geneva, Switzerland, 2020.
  26. ISO 8589; Sensory Analysis—General Guidance for the Design of Test Rooms. ISO: Geneva, Switzerland, 2007.
  27. Lee, N.-K.; Jeewanthi, R.K.C.; Park, E.-H.; Paik, H.-D. Physicochemical and antioxidant properties of Cheddar-type cheese fortified with Inula britannica extract. J. Dairy Sci. 2016, 99, 83–88. [Google Scholar] [CrossRef]
  28. Fox, P.F. Cheese: Microbiology, Chemistry and Flavor; Springer: New York, NY, USA, 1993. [Google Scholar]
  29. McSweeney, P.L.H.; Cotter, P.D.; Everett, D.W.; Govindasamy-Lucey, S. Cheese: Chemistry, Physics and Microbiology, 5th ed.; Academic Press: London, UK, 2025. [Google Scholar]
  30. Fadhlurrohman, I.; Setyawardani, T.; Sumarmono, J. Development of cheese as an antioxidant functional food with black tea. Trop. Anim. Sci. J. 2023, 46, 367–374. [Google Scholar] [CrossRef]
  31. Tomar, O.; Akarca, G.; Çağlar, A.; İstek, Ö.; Gök, V. Effect of plant extracts on antioxidant potential and microbial attributes of stirred yoghurt. Mljekarstvo Dairy Experts J. 2020, 71, 35–48. [Google Scholar] [CrossRef]
  32. Granato, D.; Santos, J.S.; Salem, R.D.; Mortazavian, A.M.; Rocha, R.S.; Cruz, A.G. Effects of herbal extracts on quality traits of fermented dairy products. Curr. Opin. Food Sci. 2018, 19, 1–7. [Google Scholar] [CrossRef]
  33. Silva, H.; Balthazar, C.; Silva, R.; Vieira, A.; Costa, R.; Esmerino, E.; Freitas, M.; Cruz, A. Sodium reduction and flavor enhancement in probiotic Prato cheese. J. Dairy Sci. 2018, 101, 8837–8846. [Google Scholar] [CrossRef]
  34. Sleem, M.M.; Shaaban, H.A. Natural antioxidants from herbs and spices for dairy products: A review. J. Multidiscip. Res. 2023, 3, 6–23. [Google Scholar] [CrossRef]
  35. Sopharadee, S.; Kittipitchakul, J.; Srisawas, N.; Neimkhum, W.; Yawootti, A.; Rades, T.; Chaiyana, W. Green approach for Rosa damascena petal extract. Antioxidants 2025, 14, 541. [Google Scholar] [CrossRef]
  36. Innosa, D.; Ianni, A.; Faccia, M.; Martino, C.; Grotta, L.; Saletti, M.A.; Pomilio, F.; Martino, G. Physical, nutritional and sensory properties of cheese from goats fed olive leaves. Animals 2020, 10, 2238. [Google Scholar] [CrossRef]
  37. Wazzan, H. Fortification of dairy products using plant-derived bioactive compounds. Curr. Res. Nutr. Food Sci. 2024, 12, 561–571. [Google Scholar] [CrossRef]
  38. Abdelmontaleb, H.S.; Abdelmeged, D.A.; Hamdy, S.M.; Hammam, M.G.; Ebid, W.M. Pomegranate and mango peel powders as natural additives in white soft cheese. Int. J. Food Microbiol. 2025, 434, 111158. [Google Scholar] [CrossRef]
  39. Qiu, L.; Zhang, M.; Mujumdar, A.S.; Chang, L. Effect of edible rose flower extract on yogurt properties. Food Biosci. 2021, 43, 101249. [Google Scholar] [CrossRef]
  40. Licón, C.C.; Carmona, M.; Molina, A.; Berruga, M.I. Characteristics of ewe milk cheese with saffron during ripening. J. Dairy Sci. 2012, 95, 4263–4274. [Google Scholar] [CrossRef]
  41. McSweeney, P.L.H.; Sousa, M.J. Biochemical pathways for flavour compounds in cheese ripening. Le Lait 2000, 80, 293–324. [Google Scholar] [CrossRef]
  42. Sousa, M.J.; Ardö, Y.; McSweeney, P.L.H. Advances in proteolysis during cheese ripening. Int. Dairy J. 2001, 11, 327–345. [Google Scholar] [CrossRef]
  43. El Soda, M.A. Role of lactic acid bacteria in accelerated cheese ripening. FEMS Microbiol. Rev. 1993, 12, 239–251. [Google Scholar] [CrossRef]
  44. Ricciardi, A.; Guidone, A.; Ianniello, R.G.; Cioffi, S.; Aponte, M.; Pavlidis, D.; Tsakalidou, E.; Zotta, T.; Parente, E. A survey of non-starter lactic acid bacteria in traditional cheeses: Culture dependent identification and survival to simulated gastrointestinal transit. Int. Dairy J. 2015, 43, 42–50. [Google Scholar] [CrossRef]
  45. Das, S.; Saha, A.; Aggarwal, K. Natural biopreservatives for dairy products. Int. Dairy J. 2025, 166, 106256. [Google Scholar] [CrossRef]
  46. Seyrekoglu, F.; Yucel, T. Functional and sensory evaluation of Kashar cheese enriched with plant-based ingredients. Turk. J. Agric.-Food Sci. Technol. 2026, 14, 188–196. [Google Scholar] [CrossRef]
  47. Khan, U.M.; Sameen, A.; Decker, E.A.; Shabbir, M.A.; Hussain, S.; Latif, A.; Abdi, G.; Aadil, R.M. Implementation of plant extracts in cheddar-type cheese production. Food Chem. X 2024, 22, 101256. [Google Scholar] [CrossRef]
  48. Granato, D.; Nunes, D.S.; Barba, F.J. An integrated strategy between food chemistry, biology, nutrition, pharmacology, and statistics in the development of functional foods. Trends Food Sci. Technol. 2017, 62, 13–22. [Google Scholar] [CrossRef]
  49. Kilic, T.; Koyuncu, G. Effect of plant addition and ripening on kashar cheese properties. J. Food Sci. Technol. 2023, 61, 734–742. [Google Scholar] [CrossRef]
  50. Akan, E.; Yerlikaya, O.; Akpinar, A.; Karagozlu, C.; Kinik, O.; Uysal, H.R. The effect of various herbs and packaging material on antioxidant activity and colour parameters of whey (Lor) cheese. Int. J. Dairy Technol. 2021, 74, 554–563. [Google Scholar] [CrossRef]
  51. Christaki, S.; Moschakis, T.; Kyriakoudi, A.; Biliaderis, C.G.; Mourtzinos, I. Recent advances in plant essential oils and extracts: Delivery systems and potential uses as preservatives and antioxidants in cheese. Trends Food Sci. Technol. 2021, 116, 264–278. [Google Scholar] [CrossRef]
  52. Semeniuc, C.A.; Mandrioli, M.; Socaci, B.S.; Socaciu, M.-I.; Fogarasi, M.; Podar, A.S.; Michiu, D.; Jimborean, A.M.; Mureşan, V.; Ionescu, S.R.; et al. Changes in lipid composition and oxidative status during ripening of Gouda-type cheese as influenced by addition of lavender flower powder. Int. Dairy J. 2022, 133, 105427. [Google Scholar] [CrossRef]
  53. Chandana, J.V.S.; Kumar, G.A.; Vaishnavi, B. Review on antioxidant activity of Rosa damascena. Int. J. Res. Rev. 2024, 11, 156–162. [Google Scholar] [CrossRef]
  54. El-Bakry, M.; Mehta, B.M. Processed Cheese Science and Technology; Woodhead Publishing: Cambridge, UK, 2022. [Google Scholar]
  55. Rodríguez, H.; Curiel, J.A.; Landete, J.M.; De las Rivas, B.; de Felipe, F.L.; Gómez-Cordovés, C.; Mancheño, J.M.; Muñoz, R. Food phenolics and lactic acid bacteria. Int. J. Food Microbiol. 2009, 132, 79–90. [Google Scholar] [CrossRef]
  56. Andersen, J.; Bosetti, M.; Mancini, A.; Solovyev, P.; Nardin, T.; Bontempo, L.; Larcher, R.; Franciosi, E. Improvement of Caciotta-like cheese nutritional value by means of enrichment with blackcurrant (Ribes nigrum) and Cornelian cherry (Cornus mas). Front. Nutr. 2023, 9, 1023490. [Google Scholar] [CrossRef]
  57. Coelho, M.C.; Malcata, F.X.; Silva, C.C.G. Lactic acid bacteria in raw-milk cheeses. Foods 2022, 11, 2276. [Google Scholar] [CrossRef]
  58. Agrawal, A.; Houghton, L.A.; Morris, J.; Reilly, B.; Guyonnet, D.; Goupil Feuillerat, N.; Schlumberger, A.; Jakob, S.; Whorwell, P.J. Clinical trial: The effects of a fermented milk product containing Bifidobacterium lactis DN-173 010 on abdominal distension and gastrointestinal transit in irritable bowel syndrome with constipation. Aliment. Pharmacol. Ther. 2009, 29, 104–114. [Google Scholar] [CrossRef]
  59. Daglia, M. Polyphenols as antimicrobial agents. Curr. Opin. Biotechnol. 2012, 23, 174–181. [Google Scholar] [CrossRef]
  60. Ferreira, A.D.; Viljoen, B.C. Yeasts as adjunct starters in matured Cheddar cheese. Int. J. Food Microbiol. 2003, 86, 131–140. [Google Scholar] [CrossRef]
  61. Cueva, C.; Moreno-Arribas, M.V.; Martín-Álvarez, P.J.; Bills, G.; Vicente, M.F.; Basilio, A.; Rivas, C.L.; Requena, T.; Rodríguez, J.M.; Bartolomé, B. Antimicrobial activity of phenolic acids against commensal, probiotic and pathogenic bacteria. Res. Microbiol. 2010, 161, 372–382. [Google Scholar] [CrossRef]
  62. Alkhattat, H. Effect of adding different concentrations of thyme oil on reducing the total microbial count in the soft cheese to increase the shelf life. Biochem. Cell Arch. 2019, 19, 539–542. [Google Scholar]
Figure 1. Dynamics of lactobacilli in kashkaval cheese samples; sample: S1—control (kashkaval cheese without added rose extract); S2—kashkaval cheese with added 1.25% rose extract; S3—kashkaval cheese with added 2.5% rose extract; different letters in the same column means statistical difference for p < 0.05 (*); ns = not significant.
Sci 08 00074 g001
Figure 2. Dynamics of lactococci in kashkaval cheese samples; sample: S1—control (kashkaval cheese without added rose extract); S2—kashkaval cheese with added 1.25% rose extract; S3—kashkaval cheese with added 2.5% rose extract; different letters in the same column mean statistical difference for p < 0.05 (*); ns = not significant.
Sci 08 00074 g002
Figure 3. Molds and yeasts in kashkaval cheese samples; sample: S1—control (kashkaval cheese without added rose extract); S2—kashkaval cheese with added 1.25% rose extract; S3—kashkaval cheese with added 2.5% rose extract; different letters in the same column mean statistical difference for p < 0.05 (*); ns = not significant.
Sci 08 00074 g003
Figure 4. Organoleptic analysis of kashkaval cheese enriched with distilled rose flower extract; sample: S1—control (kashkaval cheese without added rose extract); S2—kashkaval cheese with added 1.25% rose extract; S3—kashkaval cheese with added 2.5% rose extract.
Sci 08 00074 g004
Table 1. Physicochemical analysis of kashkaval cheese enriched with distilled rose flower extract.
IndicatorSample 1Ripening PeriodStorage Period
1 Day60 Days1 Month3 Months6 Months
Titratable acidity, °TS182 ± 2.0 a212 ± 2.0 a168 ± 2.0 b254 ± 2.0252 ± 1.5
S272 ± 1.5 b167 ± 1.0 b182 ± 2.0 b230 ± 1.5234 ± 2.0
S370 ± 2.0 b116 ± 1.0 c228 ± 2.0 a162 ± 2.0 a170 ± 2.0 a
p-value 2*****
pHS15.1 ± 0.15.0 ± 04.7 ± 0.25.16 ± 0.45.2 ± 0.2
S25.3 ± 0.25.3± 0.24.6 ± 0.35.71 ± 0.15.1 ± 0.10
S35.4 ± 0.25.1 ± 0.24.2 ± 0.15.06 ± 0.35.3 ± 0.10
p-valuensnsnsnsns
Fat, %S123.0 ± 0.527.0 ± 0.530.0 ± 0.5 b22.0 ± 0.5 b26.0 ± 0.5 b
S224.0 ± 0.526.0 ± 0.529.0 ± 0.5 b24.0 ± 0.5 b29.0 ± 0.5 a
S324.0 ± 0.526.0 ± 0.527.0 ± 0.5 a17.0 ± 0.5 a27.0 ± 0.5 b
p-valuensns***
Water content, %S135.1 ± 1.235.5 ± 1.030.5 ± 1.236.6 ± 1.4535.2 ± 1.3
S236.7 ± 1.033.7 ± 1.135.0 ± 1.239.6 ± 1.2535.6 ± 1.5
S334.0 ± 0.131.8 ± 1.231.5 ± 1.1636.9 ± 1.1633.4 ± 1.3
p-valuensnsnsnsns
Salt, %S12.2 ± 0.1 a2.2 ± 0.2 a2.3 ± 0.3 a2.2 ± 0.1 b1.9 ± 0.1
S21.8 ± 0.2 ab1.8 ± 0.2 ab1.9 ± 0.1 b2.0 ± 0.1.b2.0 ± 0.2
S31.6 ± 0.2 b1.6 ± 0.1 b1.5 ± 0.1 c1.9 ± 0.1 a2.0 ± 0.2
p-value****ns
Ash, %S14.0 ± 0.33.9 ± 0.24.0 ± 0.13.9 ± 0.13.1 ± 0.2
S23.7 ± 0.23.6 ± 0.43.7 ± 0.33.7 ± 0.23.6 ± 0.2
S33.7 ± 0.33.6 ± 0.33.8 ± 0.43.6 ± 0.23.9 ± 0.3
p-valuensnsnsnsns
Protein, %S126.9 ± 1.328.9 ± 1.427.4 ± 1.427.7 ± 1.227.0 ± 1.3
S227.0 ± 1.325.5 ± 1.326.6 ± 1.426.6 ± 1.226.7 ± 1.1
S328.0 ± 1.327.4 ± 1.226.9 ± 1.225.8 ± 1.227.2 ± 1.3
p-valuensnsnsnsns
1 Sample: S1—control (kashkaval cheese without added rose extract); S2—kashkaval cheese with added 1.25% rose extract; S3—kashkaval cheese with added 2.5% rose extract; 2 different letters in the same column mean statistical difference at p < 0.05 (*); ns = not significant.
Table 2. Surface color of kashkaval cheese enriched with distilled rose flower extract.
IndicatorSample 1Ripening PeriodStorage Period
1 Day60 Days1 Month3 Months6 Months
L*S181.89 ± 0.14 a84.32 ± 0.34 a83.83 ± 0.15 a84.12 ± 0.24 a83.73 ± 0.24 a
S272.31 ± 0.29 b71.44 ± 3.58 b56.32 ± 0.58 b54.93 ± 0.80 b53.55 ± 0.39 b
S366.37 ± 0.69 b65.55 ± 0.78 b56.61 ± 1.55 b56.50 ± 0.38 b62.55 ± 1.30 b
p-value 2*****
a*S1−4.93 ± 0.02 a−2.96 ± 0.09 a−3.06 ± 0.15 a−2.94 ± 0.07 a−2.75 ± 0.05 a
S21.29 ± 0.10 b8.81 ± 8.57 b9.12 ± 0.45 b8.73 ± 0.37 b8.95 ± 0.12 b
S34.32 ± 0.41 b7.06 ± 0.11 b14.69 ± 3.27 b8.53 ± 0.15 b5.41 ± 0.64 b
p-value*****
b*S130.59 ± 0.3622.34 ± 1.08 b22.02 ± 0.36 a20.67 ± 0.08 a22.55 ± 0.28 a
S230.41 ± 0.3641.95 ± 31.62 a17.61 ± 0.96 b12.61 ± 0.48 b13.44 ± 0.39 b
S332.47 ± 0.5218.56 ± 0.46 b17.65 ± 1.48 b14.63 ± 0.47 b16.87 ± 0.92 b
p-valuens****
1 Sample: S1—control (kashkaval cheese without added rose extract); S2—kashkaval cheese with added 1.25% rose extract; S3—kashkaval cheese with added 2.5% rose extract; 2 different letters in the same column means statistical difference for p < 0.05 (*); ns = not significant.
Table 3. Color of the cut surface of kashkaval cheese enriched with distilled rose flower extract.
IndicatorSample 1Ripening PeriodStorage Period
1 Day60 Days1 Month3 Months6 Months
L*S189.06 ± 0.1884.93 ± 0.7683.21 ± 0.1682.65 ± 0.0282.17 ± 1.19
S289.42 ± 0.3485.26 ± 1.5284.16 ± 0.3581.76 ± 0.6880.06 ± 0.26
S390.01 ± 0.2285.57 ± 0.2582.12 ± 1.0282.29 ± 0.4180.69 ± 0.43
p-value 2nsnsnsnsns
a*S1−3.61 ± 0.04−3.34 ± 0.18−3.56 ± 0.06−3.40 ± 0.06−3.24 ± 0.09
S2−3.30 ± 0.08−3.51 ± 0.04−3.42 ± 0.03−3.08 ± 0.13−2.56 ± 0.02
S3−4.14 ± 1.01−2.60 ± 0.05−3.12 ± 0.09−3.36 ± 0.12−3.06 ± 0.08
p-valuensnsnsnsns
b*S119.78 ± 0.1423.70 ± 0.2024.91 ± 0.1125.06 ± 0.1223.38 ± 1.12
S219.14 ± 0.1821.96 ± 1.4524.67 ± 0.0722.96 ± 0.6320.80 ± 0.59
S318.94 ± 0.1020.69 ± 0.1222.52 ± 0.6223.80 ± 0.4723.94 ± 0.24
p-valuensnsnsnsns
1 Sample: S1—control (kashkaval cheese without added rose extract); S2—kashkaval cheese with added 1.25% rose extract; S3—kashkaval cheese with added 2.5% rose extract; 2 ns = not significant.
Table 4. Degree of ripeness of kashkaval cheese enriched with distilled rose flower extract.
IndicatorSample 1Ripening PeriodStorage Period
1 Day60 Days1 Month3 Months6 Months
NCN/TN, %S16.89 ± 0.129.98 ± 0.14 a11.72± 0.14 a13.66 ± 0.14 a15.70 ± 0.14 b
S27.11 ± 0.1212.53 ± 0.13 b14.54 ± 0.15 b16.17 ± 0.19 b16.15 ± 0.16 b
S36.19 ± 1412.41 ± 0.14 b13.9 ± 0.14 b16.56 ± 0.16 b12.61 ± 0.19 a
p-value 2ns****
NPN/TN, %S16.08 ± 0.15 b6.09 ± 0.15 a7.87 ± 0.16 a9.75 ± 0.09 a11.19 ± 0.14 a
S29.65 ± 1.14 a9.93 ± 0.22 b10.46 ± 0.14 b11.28 ± 0.13 b13.76 ± 0.19 b
S33.28 ± 0.09 c9.00 ± 0.14 b10.04 ± 0.12 b10.50 ± 0.12 b12.37 ± 0.12 b
p-value*****
WSN/TN, %S14.08 ± 0.13 b5.82 ± 0.135.65 ± 0.07 b8.33 ± 0.09 b7.74 ± 0.05
S23.92 ± 0.12 b6.31 ± 0.147.72 ± 0.06 a9.89 ± 0.07 a8.61 ± 0.06
S32.69 ± 0.14 a6.05 ± 0.146.94 ± 0.08 b9.29 ± 0.07 b7.83 ± 0.09
p-value*ns**ns
1 Sample: S1—control (kashkaval cheese without added rose extract); S2—kashkaval cheese with added 1.25% rose extract; S3—kashkaval cheese with added 2.5% rose extract; 2 different letters in the same column means statistical difference for p < 0.05 (*); ns = not significant.
Table 5. Texture analysis of kashkaval cheese enriched with distilled rose flower extract.
IndicatorSample 1Ripening PeriodStorage Period
1 Day60 Days1 Month3 Months6 Months
Hardness, NS154.17 ± 11.84 a28.39 ± 5.13 a30.67 ± 7.98 a28.66 ± 6.64 b13.96 ± 2.21
S234.82 ± 6.28 b20.93 ± 8.65 b17.46 ± 6.03 b21.87 ± 8.89 a13.80 ± 4.32
S335.22 ± 7.84 b16.41 ± 2.99 c18.21 ± 3.69 b30.89 ± 9.06 b15.08 ± 3.06
p-value 2****ns
CohesionS10.64 ± 0.050.43 ± 0.050.41 ± 0.05 b0.30 ± 0.020.42 ± 0.06
S20.60 ± 0.090.40 ± 0.050.42 ± 0.08 b0.31 ± 0.040.40 ± 0.05
S30.59 ± 0.060.41 ± 0.060.29 ± 0.01 a0.29 ± 0.040.40 ± 0.02
p-valuensns*nsns
ElasticityS10.74 ± 0.20 b0.74 ± 0.14 a0.71 ± 0.06 a0.53 ± 0.050.61 ± 0.05 b
S20.82 ± 0.02 b0.47 ± 0.08 b0.53 ± 0.11 b0.47 ± 0.070.56 ± 0.07 b
S31.15 ± 0.67 a0.53 ± 0.07 b0.40 ± 0.02 b0.39 ± 0.050.48 ± 0.05 a
p-value***ns*
Gumminess, NS134.66 ± 8.91 a12.15 ± 1.29 a12.50 ± 3.77 a8.76 ± 2.12 b5.74 ± 0.37
S221.02 ± 6.14 b8.19 ± 3.21 b6.96 ± 1.41 b4.63 ± 2.69 a5.35 ± 1.16
S321.27 ± 6.75 b6.66 ± 1.27 b5.48 ± 1.25 b8.96 ± 2.87 b5.97 ± 1.13
p-value****ns
Chewiness, NS135.53 ± 8.51 a7.23 ± 3.96 a8.83 ± 2.77 a4.60 ± 1.073.52 ± 0.41
S217.20 ± 5.38 b3.85 ± 1.50 b3.71 ± 1.10 b3.01 ± 1.272.97 ± 0.67
S322.73 ± 8.81 b3.55 ± 0.94 b2.10 ± 0.37 b3.37 ± 0.752.86 ± 0.62
p-value***nsns
1 Sample: S1—control (kashkaval cheese without added rose extract); S2—kashkaval cheese with added 1.25% rose extract; S3—kashkaval cheese with added 2.5% rose extract; 2 different letters in the same column means statistical difference for p < 0.05 (*); ns = not significant.
Table 6. Total phenolic content and antioxidant activity of kashkaval cheese enriched with distilled rose flower extract.
IndicatorSampleRipening PeriodStorage Period
1 Day60 Days1 Month3 Months6 Months
TPC, mg GAE/g sampleS1511.02 ± 3.42 a695.04 ± 2.14 b705.03 ± 2.16 b766.03 ± 2.95 b879.49 ± 2.30
S2602.96 ± 3.25 b637.13 ± 3.51 b642.16 ± 3.71 b809.85 ± 3.22 b831.16 ± 4.41
S3598.64 ± 3.37 b820.40 ± 3.04 a820.45 ± 3.14 a958.97 ± 5.70 a845.41 ± 2.67
p-value 2****ns
DPPH, µmol TE/g sampleS160.80 ± 4.47 a150.14 ± 5.00 b154.15 ± 5.29 a66.08 ± 3.65 a198.68 ± 4.57 b
S2407.67 ± 1.91 b407.85 ± 4.01 a408.60 ± 4.01 c209.38 ± 3.11 b239.59 ± 5.49 b
S3529.47 ± 4.12 b330.20 ± 4.12 c330.45 ± 4.26 b297.17 ± 4.74 b428.25 ± 6.79 a
p-value****ns
FRAP, µmol TE/g sampleS1n.d.n.d.n.d.n.d.n.d.
S2n.d.n.d.n.d.n.d.n.d.
S3136.86 ± 1.49140.15 ± 1.43148.14 ± 1.73170.11 ± 4.78n.d.
Sample: S1—control (kashkaval cheese without added rose extract); S2—kashkaval cheese with added 1.25% rose extract; S3—kashkaval cheese with added 2.5% rose extract; n.d.—below the detection limit of the method; 2 different letters in the same column means statistical difference for p < 0.05 (*); ns = not significant.
Table 7. Lipid profile of kashkaval cheese enriched with distilled rose flower extract.
IndicatorSample 1Ripening PeriodStorage Period
1 Day60 Days1 Month3 Months6 Months
Medium-chain fatty acids, g/100 g
C 4:0 (Butyric acid)S11.57 ± 0.111.68 ± 0.11 b1.79 ± 0.12 a1.86 ± 0.13 a1.94 ± 0.13 a
S21.42 ± 0.101.51 ± 0.10 b1.28 ± 0.09 b1.40 ± 0.09 b1.45 ± 0.01 b
S31.48 ± 0.101.37 ± 0.09 a1.32 ± 0.09 b1.44 ± 0.10 b1.50 ± 0.10 b
p-value 2ns****
C 6:0 (Caproic acid)S11.06 ± 0.071.13 ± 0.081.20 ± 0.08 a1.25 ± 0.08 a1.30 ± 0.09 a
S20.95 ± 0.061.01 ± 0.070.86 ± 0.06 b0.94 ± 0.06 b0.98 ± 0.07 b
S30.99 ± 0.070.92 ± 0.060.89 ± 0.06 b0.97 ± 0.07 b1.00 ± 0.07 b
p-valuensns***
C 8:0 (Caprylic acid)S10.62 ± 0.040.66 ± 0.040.71 ± 0.05 a0.74 ± 0.05 a0.77 ± 0.05 a
S20.56 ± 0.040.60 ± 0.040.51 ± 0.03 b0.55 ± 0.04 b0.58 ± 0.04 b
S30.58 ± 0.040.54 ± 0.040.52 ± 0.04 b0.57 ± 0.04 b0.59 ± 0.04 b
p-valuensns***
C 10:0 (Capric acid)S11.10 ± 0.071.17 ± 0.081.25 ± 0.08 a1.30 ± 0.09 a1.35 ± 0.09 a
S20.99 ± 0.071.06 ± 0.070.90 ± 0.06 b0.98 ± 0.07 b1.02 ± 0.07 b
S31.03 ± 0.070.96 ± 0.070.92 ± 0.06 b1.01 ± 0.07 b1.05 ± 0.07 b
p-valuensns***
C 12:0 (Lauric acid)S11.26 ± 0.091.35 ± 0.091.44 ± 0.10 a1.50 ± 0.10 a1.56 ± 0.11 a
S21.14 ± 0.081.21 ± 0.081.03 ± 0.07 b1.12 ± 0.08 b1.17 ± 0.08 b
S31.19 ± 0.081.10 ± 0.071.06 ± 0.07 b1.15 ± 0.08 b1.20 ± 0.08 b
p-valuensns***
Long-chain fatty acids, g/100 g
C 14:0 (Myristic acid)S15.16 ±0.355.51 ± 0.375.88 ± 0.40 a6.12 ± 0.41 a6.36 ± 0.43 a
S24.49 ± 0.304.79 ± 0.324.07 ± 0.28 b4.44 ± 0.30 b4.62 ± 0.31 b
S34.85 ± 0.334.51 ± 0.314.33 ± 0.29 b4.72 ± 0.32 b4.91 ± 0.33 b
p-valuensns***
C 16:0 (Palmitic acid)S110.74 ± 0.7311.46 ± 0.7812.24 ± 0.83 a12.73 ± 0.86 a12.24 ± 0.90 a
S29.35 ± 0.639.97 ± 0.688.48 ± 0.57 b9.24 ± 0.63 b9.61 ± 0.65 b
S310.10 ± 0.689.39 ± 0.649.01 ± 0.61 b9.83 ± 0.67 b10.22 ± 0.69 b
p-valuensns***
C 18:0 (Stearic acid)S14.30 ± 0.294.59 ± 0.314.90 ± 0.33 a5.09 ± 0.35 a4.30 ± 0.36
S23.74 ± 0.253.99 ± 0.273.39 ± 0.23 b3.70 ± 0.25 b3.84 ± 0.26
S34.04 ± 0.273.76 ± 0.253.61 ± 0.24 b3.93 ± 0.27 b4.09 ± 0.28
p-valuensns**ns
C 20:0 (Arachidonic acid)S10.13 ± 0.010.14 ± 0.010.15 ± 0.010.15 ± 0.010.16 ± 0.01
S20.11 ± 0.010.12 ± 0.010.10 ± 0.010.11 ± 0.010.11 ± 0.01
S30.12 ± 0.010.11 ± 0.010.11 ± 0.010.12 ± 0.010.12 ± 0.01
p-valuensnsnsnsns
C 22:0 (Bechenic acid)S10.11 ± 0.010.11 ± 0.010.12 ± 0.010.13 ± 0.010.13 ± 0.01
S20.09 ± 0.010.10 ± 0.010.08 ± 0.010.09 ± 0.010.10 ± 0.01
S30.10 ± 0.010.09 ± 0.010.09 ± 0.010.10 ± 0.010.10 ± 0.01
p-valuensnsnsnsns
C 18:1 n9 cis (Oleic acid)S14.65 ± 0.325.25 ± 0.365.40 ± 0.375.57 ± 0.386.00 ± 0.41
S25.33 ± 0.365.48 ± 0.375.65 ± 0.385.82 ± 0.396.27 ± 0.42
S35.02 ± 0.345.74 ± 0.395.90 ± 0.406.08 ± 0.416.55 ± 0.44
p-valuensnsnsnsns
C 18:1 n11 cis (Vaccine acid)S10.52 ± 0.040.78 ± 0.05 b0.87 ± 0.060.59 ± 0.040.55 ± 0.04
S20.60 ± 0.040.89 ± 0.06 ab0.76 ± 0.050.53 ± 0.040.63 ± 0.04
S30.68 ± 0.050.98 ± 0.07 a0.67 ± 0.05 a0.48 ± 0.030.72 ± 0.05
p-valuens*nsnsns
Polyunsaturated fatty acids, g/100 g
C 18:2 cis9cis12 (Linoleic acid)S10.65 ± 0.040.74 ± 0.050.76 ± 0.050.78 ± 0.050.84 ± 0.06
S20.75 ± 0.050.77 ± 0.050.79 ± 0.050.82 ± 0.060.88 ± 0.06
S30.71 ± 0.050.80 ± 0.050.83 ± 0.060.85 ± 0.060.92 ± 0.06
p-valuensnsnsnsns
C 18:3 cis9cis12cis15 (Linolenic acid)S10.10 ± 0.010.11 ± 0.010.12 ± 0.010.12 ± 0.010.13 ± 0.01
S20.12 ± 0.010.12 ± 0.010.12 ± 0.010.13 ± 0.010.14 ± 0.01
S30.11 ± 0.010.12 ± 0.010.13 ± 0.010.13 ± 0.010.14 ± 0.01
p-valuensnsnsnsns
Cholesterol, mg/100 gS188.00 ± 5.9789.99 ± 6.1087.11 ± 5.9192.75 ± 6.29100.14 ± 7.13 b
S268.64 ± 4.6571.99 ± 4.8876.66 ± 5.2083.48 ± 5.6684.11 ± 5.70 a
S378.59 ± 5.3379.19 ± 5.3784.32 ± 5.7291.83 ± 6.2396.31 ± 6.53 b
p-valuensnsnsns*
1 Sample: S1—control (kashkaval cheese without added rose extract); S2—kashkaval cheese with added 1.25% rose extract; S3—kashkaval cheese with added 2.5% rose extract; 2 different letters in the same column means statistical difference for p < 0.05 (*); ns = not significant.
Table 8. Polar metabolites in kashkaval cheese enriched with distilled rose flower extract.
IndicatorSample 1Ripening PeriodStorage Period
1 Day60 Days1 Month3 Months6 Months
Amino acids, g/100 g
AlanineS14.21 ± 0.294.29 ± 0.294.38 ± 0.304.16 ± 0.283.95 ± 0.27
S24.63 ± 0.314.72 ± 0.324.82 ± 0.334.58 ± 0.314.35 ± 0.29
S34.40 ± 0.304.49 ± 0.304.62 ± 0.314.30 ± 0.294.00 ± 0.27
p-value 2nsnsnsnsns
GlycineS10.73 ± 0.050.75 ± 0.050.76 ± 0.050.72 ± 0.050.69 ± 0.05
S20.80 ± 0.050.82 ± 0.060.84 ± 0.060.79 ± 0.050.76 ± 0.05
S30.76 ± 0.050.78 ± 0.050.80 ± 0.050.75 ± 0.050.69 ± 0.05
p-valuensnsnsnsns
ValineS12.29 ± 0.16 b2.34 ± 0.16 b2.38 ± 0.162.2 ± 60.152.15 ± 0.15
S22.52 ± 0.17 a2.57 ± 0.17 a2.62 ± 0.182.49 ± 0.172.37 ± 0.16
S32.39 ± 0.16 b2.44 ± 0.17 b2.51 ± 0.172.34 ± 0.162.17 ± 0.15
p-value**nsnsns
LeucineS13.52 ± 0.243.59 ± 0.243.66 ± 0.253.48 ± 0.243.31 ± 0.22
S23.87 ± 0.263.95 ± 0.274.03 ± 0.243.83 ± 0.263.64 ± 0.25
S33.68 ± 0.253.75 ± 0.253.87 ± 0.263.60 ± 0.243.34 ± 0.23
p-valuensnsnsnsns
IsoleucinS11.44 ± 0.101.46 ± 0.10 b1.49 ± 0.10 b1.42 ± 0.101.35 ± 0.09
S21.58 ± 0.111.61 ± 0.11 a1.64 ± 0.11 a1.56 ± 0.111.48 ± 0.10
S31.50 ± 0.101.53 ± 0.10 b1.58 ± 0.11 b1.47 ± 0.101.36 ± 0.09
p-valuens**nsns
TryptophanS10.23 ± 0.020.23 ± 0.020.24 ± 0.020.23 ± 0.020.22 ± 0.01
S20.25 ± 0.020.26 ± 0.020.260 ± 0.020.25 ± 0.020.24 ± 0.02
S30.24 ± 0.020.25 ± 0.020.25 ± 0.020.23 ± 0.020.22 ± 0.11
p-valuensnsnsnsns
SerineS12.55 ± 0.17 b2.60 ± 0.18 b2.65 ± 0.18 b2.52 ± 0.17 b2.39 ± 0.16 b
S22.81 ± 0.19 a2.86 ± 0.19 a2.92 ± 0.20 a2.77 ± 0.19 a2.63 ± 0.18 a
S32.66 ± 0.18 b2.72 ± 0.18 b2.80 ±0.19 b2.60 ± 0.18 b2.42 ± 0.16 b
p-value*****
ThreonineS11.68 ± 0.111.71 ± 0.121.75 ± 0.121.66 ± 0.111.58 ± 0.11
S21.85 ± 0.131.88 ± 0.131.92 ± 0.131.83 ± 0.121.74 ± 0.12
S31.76 ± 0.121.79 ± 0.121.84 ±0.131.72 ± 0.121.60 ± 0.11
p-valuensnsnsnsns
Aspartic acidS10.13 ± 0.010.13 ± 0.010.14 ± 0.010.13 ± 0.010.12 ± 0.01
S20.14 ± 0.010.15 ± 0.010.15 ± 0.010.14 ± 0.010.13 ± 0.01
S30.14 ± 0.010.14 ± 0.010.14 ±0.010.13 ± 0.010.12 ± 0.01
p-valuensnsnsnsns
MethionineS10.11 ± 0.010.11 ± 0.010.12 ± 0.010.11 ± 0.010.10 ± 0.01
S20.12 ± 0.010.12 ± 0.010.13 ± 0.010.12 ± 0.010.11 ± 0.01
S30.12 ± 0.010.12 ± 0.010.12 ±0.010.11 ± 0.010.11 ± 0.01
p-valuensnsnsnsns
ArginineS11.60 ± 0.11 b1.63 ± 0.11 b1.66 ± 0.11 b1.58 ± 0.11 b1.50 ± 0.10
S21.76 ± 0.12 a1.80 ± 0.12 a1.83 ± 0.12 a1.74 ± 0.12 a1.65 ± 0.11
S31.67 ± 0.11 b1.71 ± 0.12 b1.76 ±0.12 b1.63 ± 0.11 ab1.52 ± 0.10
p-value****ns
OrnithineS10.15 ± 0.010.15 ± 0.010.16 ± 0.010.15 ± 0.010.14 ± 0.01
S20.17 ± 0.010.17 ± 0.010.17 ± 0.010.16 ± 0.010.15 ± 0.01
S30.16 ± 0.010.16 ± 0.010.16 ± 0.010.15 ± 0.010.14 ± 0.01
p-valuensnsnsnsns
GlutamineS10.25 ± 0.020.26 ± 0.020.26 ± 0.020.25 ± 0.020.23 ± 0.02
S20.28 ± 0.020.28 ± 0.020.29 ± 0.020.27 ± 0.020.26 ± 0.02
S30.26 ± 0.020.27 ± 0.020.27 ± 0.020.26 ± 0.020.24 ± 0.02
p-valuensnsnsnsns
Glutamic acidS13.56 ± 0.243.63 ± 0.253.70 ± 0.253.52 ± 0.243.34 ± 0.23
S23.92 ± 0.273.99 ± 0.274.07 ± 0.283.87 ± 0.263.68 ± 0.25
S33.72 ± 0.253.79 ± 0.263.91 ± 0.263.63 ± 0.253.38 ± 0.23
p-valuensnsnsnsns
PhenylalanineS14.05 ± 0.274.13 ± 0.284.21 ± 0.294.00 ± 0.273.80 ± 0.26
S24.46 ± 0.304.54 ± 0.314.63 ± 0.314.40 ± 0.304.18 ± 0.28
S34.23 ± 0.294.32 ± 0.294.45 ± 0.304.14 ± 0.283.85 ± 0.26
p-valuensnsnsnsns
LysineS16.84 ± 0.46 b6.98 ± 0.47 b7.12 ± 0.48 b6.76 ± 0.46 b6.42 ± 0.44
S27.52 ± 0.51 a7.67 ± 0.52 a7.83 ± 0.53 a7.44 ± 0.50 a7.06 ± 0.48
S37.15 ± 0.48 b7.29 ± 0.49 b7.51 ± 0.51 b6.98 ± 0.47 b6.49 ± 0.44
p-value****ns
TyrosineS10.18 ± 0.010.18 ± 0.010.19 ± 0.010.18 ± 0.010.17 ± 0.01
S20.20 ± 0.0110.20 ± 0.010.21 ± 0.010.20 ± 0.010.19 ± 0.01
S30.19 ± 0.010.19 ± 0.010.20 ± 0.010.18 ± 0.010.17 ± 0.01
p-valuensnsnsnsns
Disaccharides, g/100 g
LactoseS11.86 ± 0.131.89 ± 0.131.93 ± 0.131.84 ± 0.121.74 ± 0.12
S21.67 ± 0.111.71 ± 0.121.74 ± 0.121.65 ± 0.111.57 ± 0.11
S31.72 ± 0.121.76 ± 0.121.81 ± 0.121.68 ± 0.111.56 ± 0.11
p-valuensnsnsnsns
Organic acids, mg/100 g
Pyruvic acidS117.12 ± 1.1617.47 ± 1.1817.81 ± 1.2116.92 ± 1.1516.08 ± 1.09
S218.84 ± 1.2819.21 ± 1.3019.60 ± 1.3318.62 ± 1.2617.69 ± 1.20
S317.89 ± 1.2118.25 ± 1.2418.80 ± 1.2717.48 ± 1.1916.26 ± 1.10
p-valuensnsnsnsns
Lactic acidS11059.24 ± 8.26 b1080.43 ± 8.431102.04 ± 8.59 b1046.93 ± 8.17 b994.58 ± 7.75 b
S21165.17 ± 9.08 a1188.47 ± 9.271212.24 ± 9.45 a1151.63 ± 8.98 a1094.05 ± 8.53 a
S31106.91 ± 8.63 b1129.05 ± 8.801162.92 ± 9.07 b1081.51 ± 8.43 b1005.81 ± 7.84 b
p-value*ns***
Oxalic acidS190.18 ± 1.2491.99 ± 1.2793.83 ± 1.2989.14 ± 1.2384.68 ± 1.17
S299.20 ± 1.37101.19 ± 1.40103.21 ± 1.4298.05 ± 1.3593.15 ± 1.29
S394.24 ± 1.3096.13 ± 1.3399.01 ± 1.3792.08 ± 1.2785.63 ± 1.18
p-valuensnsnsnsns
Uric acidS14.02 ± 0.274.10 ± 0.284.18 ± 0.283.97 ± 0.273.77 ± 0.26
S24.42 ± 0.304.51 ± 0.314.60 ± 0.314.37 ± 0.304.15 ± 0.28
S34.20 ± 0.284.28 ± 0.294.41 ± 0.304.10 ± 0.283.81 ± 0.26
p-valuensnsnsnsns
Acetic acidS1155.36 ± 1.67158.47 ± 1.71 b161.64 ± 1.74 b153.55 ± 1.66 b145.88 ± 1.57 b
S2170.90 ± 1.84174.31 ± 1.88 a177.80 ± 1.92 a168.91 ± 1.82 a160.46 ± 1.73 a
S3162.35 ± 1.75165.60 ± 1.79 b170.57 ± 1.84 b158.63 ± 1.71 b147.52 ± 1.59 b
p-valuens****
Formic acidS166.21 ± 1.1167.54 ± 1.1368.89 ± 1.1665.44 ± 1.1062.17 ± 1.04
S272.83 ± 1.2274.29 ± 1.2575.77 ± 1.2771.99 ± 1.2168.39 ± 1.15
S369.19 ± 1.1670.57 ± 1.1872.69 ± 1.2267.60 ± 1.1362.87 ± 1.05
p-valuensnsnsnsns
Hippuric acidS112.47 ± 0.8512.72 ± 0.8612.97 ± 0.8812.33 ± 0.8411.71 ± 0.79
S213.72 ± 0.9313.99 ± 0.9514.27 ± 0.9713.56 ± 0.9212.88 ± 0.87
S313.03 ± 0.8813.29 ± 0.9013.69 ± 0.9312.73 ± 0.8611.84 ± 0.80
p-valuensnsnsnsns
Citric acidS149.54 ± 3.3650.53 ± 3.4351.54 ± 3.4948.96 ± 3.3246.51 ± 3.15
S254.49 ± 3.6955.58 ± 3.7756.69 ± 3.8453.86 ± 3.6551.16 ± 3.47
S351.77 ± 3.5152.80 ± 3.5854.38 ± 3.6950.58 ± 3.4347.04 ± 3.19
p-valuensnsnsnsns
1 Sample: S1—control (kashkaval cheese without added rose extract); S2—kashkaval cheese with added 1.25% rose extract; S3—kashkaval cheese with added 2.5% rose extract; 2 different letters in the same column means statistical difference for p < 0.05 (*); ns = not significant.
Table 9. Microbiological analysis for basic sanitary and hygienic indicators.
IndicatorSample 1Storage Period
6 Months
Coliforms, log CFU/gS13.1 b
S23.2 b
S31.0 a
p-value 2*
E. coli, log CFU/gS11.5 b
S21.7 b
S3under 1 a
p-value*
Salmonella subsp.
presence/absence
S1absence
S2absence
S3absence
L. monocytogenes, presence/absenceS1absence
S2absence
S3absence
Staphylococcus aureus, log CFU/gS1under 1
S2under 1
S3under 1
1 Sample: S1—control (kashkaval cheese without added rose extract); S2—kashkaval cheese with added 1.25% rose extract; S3—kashkaval cheese with added 2.5% rose extract; 2 different letters in the same column mean statistical difference for p < 0.05.
Disclaimer/Publisher’s Note: The statements, opinions and data contained in all publications are solely those of the individual author(s) and contributor(s) and not of MDPI and/or the editor(s). MDPI and/or the editor(s) disclaim responsibility for any injury to people or property resulting from any ideas, methods, instructions or products referred to in the content.