Article

Dispersive Optical Properties and Refractive Index of [BMIM][SCN] Ionic Liquids with Transition Metal Coordination


by
Bilal S. Algnamat
1,*,
Ahmad A. Abushattal
1,
Amani F. Kraishan
1,
Monther Alsboul
1,
Mou’ad A. Tarawneh
1,
Alá S. Alnaimat
2,3 and
Deshinta Arrova Dewi
4
1
Department of Physics, Al-Hussein Bin Tala University, P.O. Box 20, Ma’an 71111, Jordan
2
Department of Chemistry, College of Science, Al-Hussein Bin Talal University, P.O. Box 20, Ma’an 71111, Jordan
3
Trace Element, Spectroscopy and Speciation Group (GETEE), Institute of Materials iMATUS, Department of Analytical Chemistry, Nutrition and Bromatology, Faculty of Chemistry, University of Santiago de Compostela, Avenida das Ciencias, s/n, 15782 Santiago de Compostela, Spain
4
Faculty of Data Science and Information Technology, INTI International University, Nilai 1800, Negeri Sembilan, Malaysia
*
Author to whom correspondence should be addressed.
Submission received: 13 January 2026 / Revised: 17 March 2026 / Accepted: 23 March 2026 / Published: 25 March 2026
(This article belongs to the Section Materials Science)

Abstract

We investigated the influence of transition metal coordination on the optical dispersion and thermo-optic behavior of the ionic liquid 1-butyl-3-methylimidazolium thiocyanate ([BMIM][SCN]). Refractive index measurements in the visible–near-infrared range (400–1000 nm), combined with temperature-dependent characterization (298–323 K), demonstrate that coordination with Al3+, Cd2+, Zn2+, and Mn2+ consistently increases the refractive index relative to the neat ionic liquid. All systems exhibit normal dispersion, following the hierarchy n(Al) > n(Cd) ≳ n(Zn) > n(Mn) > n([BMIM][SCN]), which reflects cooperative contributions from metal-centerd polarizability and coordination-induced modifications to density and electronic structure. Negative thermo-optic coefficients are measured for all samples, with [BMIM]3[Al(SCN)6] displaying the highest temperature sensitivity. Abbe diagrams and group-velocity dispersion analyses confirm a predictable index–dispersion trade-off and show that dispersion-related transport parameters are less temperature dependent than n(T). Collectively, these findings establish a structure–property framework for tuning refractive index, chromatic dispersion, and thermo-optic response via coordination chemistry, supporting the targeted design of thiocyanate-based ionic liquids for photonic components, thermal lenses, and dispersion-managed optical devices.

1. Introduction

Ionic liquids (ILs) have been defined as substances composed entirely of ions, which, despite this, exist in a liquid state at temperatures lower than 100 °C. In recent years, ILs have attracted considerable attention due to their unique physicochemical characteristics. The matching of cations and anions is believed to result in tunable IL characteristics, thus making them highly promising materials for sophisticated material processing techniques [1,2,3,4,5]. ILs have found various uses, such as chemical syntheses, separation processes, functional liquids, electrochemistry, polymer materials, and photonics [6,7,8,9,10]. While their thermophysical characteristics have been well established, there is much less information available about their optical characteristics. Available data have included sodium D-line refractive indices, temperature dependence, UV–Vis spectroscopy, and luminescence characteristics [11,12,13]. Nonlinear effects such as nonlinear absorption and refraction have also been reported [13,14,15,16,17,18,19]. However, detailed dispersion analyses remain limited, and further investigation is required before the optical and photonic potential of ILs can be fully assessed [20]. Materials dispersion, defined as the variation in the refractive index with wavelength, is a critical parameter in optofluidic design, influencing liquid-core fibers, tunable-focus lenses, and refractive-index-based crystal characterization. Calixto et al. [21] measured the refractive index of six ILs across multiple wavelengths and constructed an Abbe diagram, marking the first major assessment of their dispersive behavior. Fröba et al. [22] later confirmed wavelength-dependent refractive indices, but without extensive analysis. Chiappe et al. [1] extended this work by examining nine ILs at five wavelengths (450, 532, 632.8, 964, and 1551 nm) across a range of temperatures. Arosa et al. expanded the scope by characterizing 14 ILs over 400–1000 nm, while a follow-up study demonstrated that the refractive index of 1-alkyl-3-methylimidazolium ILs depends on wavelength, temperature, and alkyl chain length. Using a single-resonance Sellmeier model, trends in refractive index behavior were linked to material structure via fitting parameters [23,24]. Recently, machine learning approaches have also been applied to predict the refractive indices of ionic liquids and identify key structural factors influencing their optical behavior [25]. 1-Butyl-3-methylimidazolium thiocyanate, [BMIM][SCN], is a commercially available IL widely studied among thiocyanate-based systems. Previous work has investigated [BMIM][SCN] in its pure form and in mixtures with solvents such as water [26,27,28], alcohols [29,30,31], and other ILs sharing the same cation [32]. Related thiocyanate-based ILs, including 1-ethyl-3-methylimidazolium thiocyanate [EMIM(SCN)] [33,34,35] and 1-hexyl-3-methylimidazolium thiocyanate [HMIM(SCN)] [36,37], have also been explored. Additionally, pyrrolidinium [28,38] and piperidinium [28,30,33,37,38] thiocyanate ILs continue to attract interest. Molecular simulation studies have been supported by the availability of published potential parameters for [BMIM][SCN] [39]. [BMIM][SCN] also shows potential in practical applications. It has been tested as an electrolyte for supercapacitors and batteries [40,41,42], particularly when combined with lithium salts [43]. Beyond electrochemical systems, it has been applied in liquid fuel desulfurization and other chemical processes [44], as well as in gas separation and carbon capture [45]. Coordination of [BMIM][SCN] with metal cations produces materials with significantly altered physicochemical behavior. The resulting thiocyanate complexes exhibit structural variation depending on the cation, with coordination geometries typically octahedral or tetrahedral. Such systems have been proposed for use as dye-sensitized solar cell electrolyte materials [46]. The crystal structures of zinc and cadmium thiocyanate complexes containing methylimidazole ligands indicate luminescent behavior [47]. Eight newly synthesized metal thiocyanates with 1-butyl-3-methylimidazolium cations were found to exhibit distinct physicochemical properties, including magnetic behavior, thermal capacity, and optical characteristics [44]. Metal-containing ILs therefore represent an emerging class of materials with tunable physicochemical properties suitable for advanced technological applications [48]. In this work, we focus on the optical properties of transition-metal-coordinated thiocyanate ILs containing the [SCN] ligand.
Metal ions such as Al3+, Cd2+, Zn2+, and Mn2+ were selected as representatives of different electronic configurations and charge densities, thus allowing a thorough assessment of the influence of the metal ions on the refractive index dispersion and the thermo-optic properties of the ionic liquid, which have not yet been systematically characterized. In particular, the [BMIM][SCN] ionic liquid was selected as a test system because, in comparison with EMIM-containing analogs, BMIM cations with their longer butyl chain are known to favorably influence polarizability and refractive index values, thus making it a good candidate for investigating the effect of coordination on optical dispersion and thermo-optic properties. Key dispersive parameters, including the Abbe number, group-velocity dispersion, and group refractive index, remain largely unexplored. Our objective is to address this gap by providing refined optical measurements consistent with community calls for improved characterization of functional ILs [49,50,51,52,53,54]. This approach aligns with current trends in materials science that emphasize the connection between molecular and mesoscale structure and macroscopic behavior [55]. Section 2 describes the experimental methodology; Section 3 presents the refractive index dispersion results and analysis; and Section 4 provides the conclusions. This study addresses a specific gap in the literature by delivering the first systematic optical characterization of transition-metal-coordinated [BMIM][SCN] systems across 400–1000 nm and 298–323 K. While previous studies have reported refractive indices or isolated wavelength measurements, comprehensive evaluations of dispersion, thermo-optic behavior, Abbe parameters, and group-velocity dispersion have not been conducted. Our results show that coordination chemistry provides an effective tuning mechanism for refractive index, dispersion magnitude, and thermal sensitivity, enabling a structure–property relationship that links coordination geometry and polarizability density with macroscopic optical behavior. These findings advance current knowledge and support the development of thiocyanate-based ILs as tunable optical fluids for photonic and optoelectronic applications.

2. Materials and Methods

2.1. Materials

1-Butyl-3-methylimidazolium thiocyanate, [BMIM][SCN], was chosen as the base material for this study due to its excellent optical transparency and strong ability to coordinate. The ionic liquid [BMIM][SCN] was purchased from the company Io-Li-Tec, where the purity of the ionic liquid is claimed to be over 99%. No further purification of the ionic liquid was required since it was used as a reference material. To study the effect of the coordination of the transition metals on the optical and dispersive properties of [BMIM][SCN], hybrid materials of the ionic liquid [BMIM][SCN] with thiocyanate–metal complexes were synthesized using the method described by Cabeza et al. [56]. This method uses [BMIM]Cl as the ionic liquid precursor, which facilitates the reaction of the ionic liquid with the thiocyanate–metal complexes. Briefly, the hybrid systems consisting of the organic ionic liquid and the inorganic metal–thiocyanate coordination complexes were synthesized by dissolving the appropriate metal chloride salts in an acetone–methanol solvent system. A solution of potassium thiocyanate in acetone and [BMIM]Cl was then added to the above solution. The resulting solution was refluxed for several hours to favor the exchange of chloride for thiocyanate anions and the coordination of the latter to the metal cations. Potassium chloride precipitated as a by-product and was removed from the system. The resulting solution was concentrated under reduced pressure.
The remaining product was dissolved in dichloromethane to eliminate any possible insoluble products. A second filtration and solvent evaporation were performed. The purity of the synthesized ionic liquids was guaranteed by repeating the filtration process and the solvent evaporation under reduced pressure. The samples were dried under vacuum for 48 h to eliminate any traces of solvents and volatile compounds. While insoluble by-products, such as KCl, are effectively removed by filtration, trace amounts of highly soluble by-products (e.g., BMIMCl and KSCN) cannot be entirely eliminated. However, with rigid control of the stoichiometry of the reagents and qualitative tests with AgNO3, it can be ascertained that trace amounts of by-products are well below detection limits and do not affect the measured optical properties. The water content of all the samples was determined by Karl Fischer titration. The water content of all the samples was found to be less than 500 ppm. The synthesized hybrid ionic liquids, i.e., [BMIM][SCN]–M2+ where M2+ = Cd2+, Zn2+, Mn2+, or Al3+, are given in Table 1 along with their appropriate chemical names and formulas.

2.2. Methods

2.2.1. Vacuum Dryer

The solvent was removed by reducing the internal pressure of the flask using a vacuum system equipped with an evaporation flask and vacuum pump. A magnetic stirrer was used throughout the process to ensure complete mixing of the samples. To minimize residual moisture, all samples were dried under vacuum for more than 48 h at room temperature prior to optical and thermal measurements. To accurately quantify moisture content, the water concentration of each sample was determined using a Mettler Toledo Karl Fischer coulometer. All physicochemical and optical measurements were performed on samples with water concentrations below 500 ppm, ensuring negligible interference from residual water and maintaining measurement precision.

2.2.2. Abbe Refractometer

A multi-wavelength Abbe refractometer (DR-M2) was used to find the refractive indices of the ionic liquids (ILs) at 486 nm, 546 nm, 589 nm, 633 nm, and 680 nm. The instrument was first calibrated by using deionized water prior to the measurement of the ionic liquids. The uncertainty of the experiment for the 589 nm wavelength was ±2 × 10⁻⁴. Temperature regulation of the ionic liquids was carried out by connecting the refractometer to a circulation pump and a constant-temperature water bath. The water bath had a temperature stability of ±0.1 K. By doing so, the refractive indices of the ionic liquids as a function of temperature from 298.15 to 323.15 K could be measured. This would allow the determination of the thermo-optic behavior of the ionic liquids. Moreover, the setup would allow the determination of the refractive index dispersion of the ionic liquids.

2.2.3. Spectral Broadband Interferometry for Refractive Index Determination

In addition to that, the Refractive Index Spectral Broadband Interferometry (RISBI) method based on the Spectral Refraction White Light Interferometry (SRWLI) approach was used to measure chromatic dispersion with sub-nanometer precision [57]. This device allows the determination of refractive index values with high precision within the wavelength range of 400 to 1000 nm. This was achieved by employing a Michelson interferometer with a prism spectrometer. One of the interferometer arms was used to illuminate a sample with a high-intensity lamp with a power rating of 135 W to introduce IL samples. The spectrometer used had a focal length of 315 mm and an F2 diffraction prism that was connected to a linear camera with a resolution of 3648 pixels and a pixel size of 8 × 200 μm2. In addition to that, calibration was performed according to the procedures mentioned in References [54,58] to obtain a precision error less than 1 nm and a refractive index error bound of around 2 × 10⁻⁴. Temperature control was maintained using a water bath and aluminum sample-holder enclosure, achieving a stability of ±0.1 K throughout the experiment. Further details of the RISBI system are provided in References [52,53].

3. Results and Discussion

3.1. Refractive Index

The curves of refractive index dispersion for the ionic liquids studied were derived from the interferometric method described in Section 2.2.3, applying the RISBI method. The wavelength-dependent refractive index n(λ) is derived from the phase difference between the interfering beams of the interferometer, as expressed in Equation (1):
φ ( λ ) = 4 π λ [ d ( n ( λ ) 1 ) L ] 2 k π  
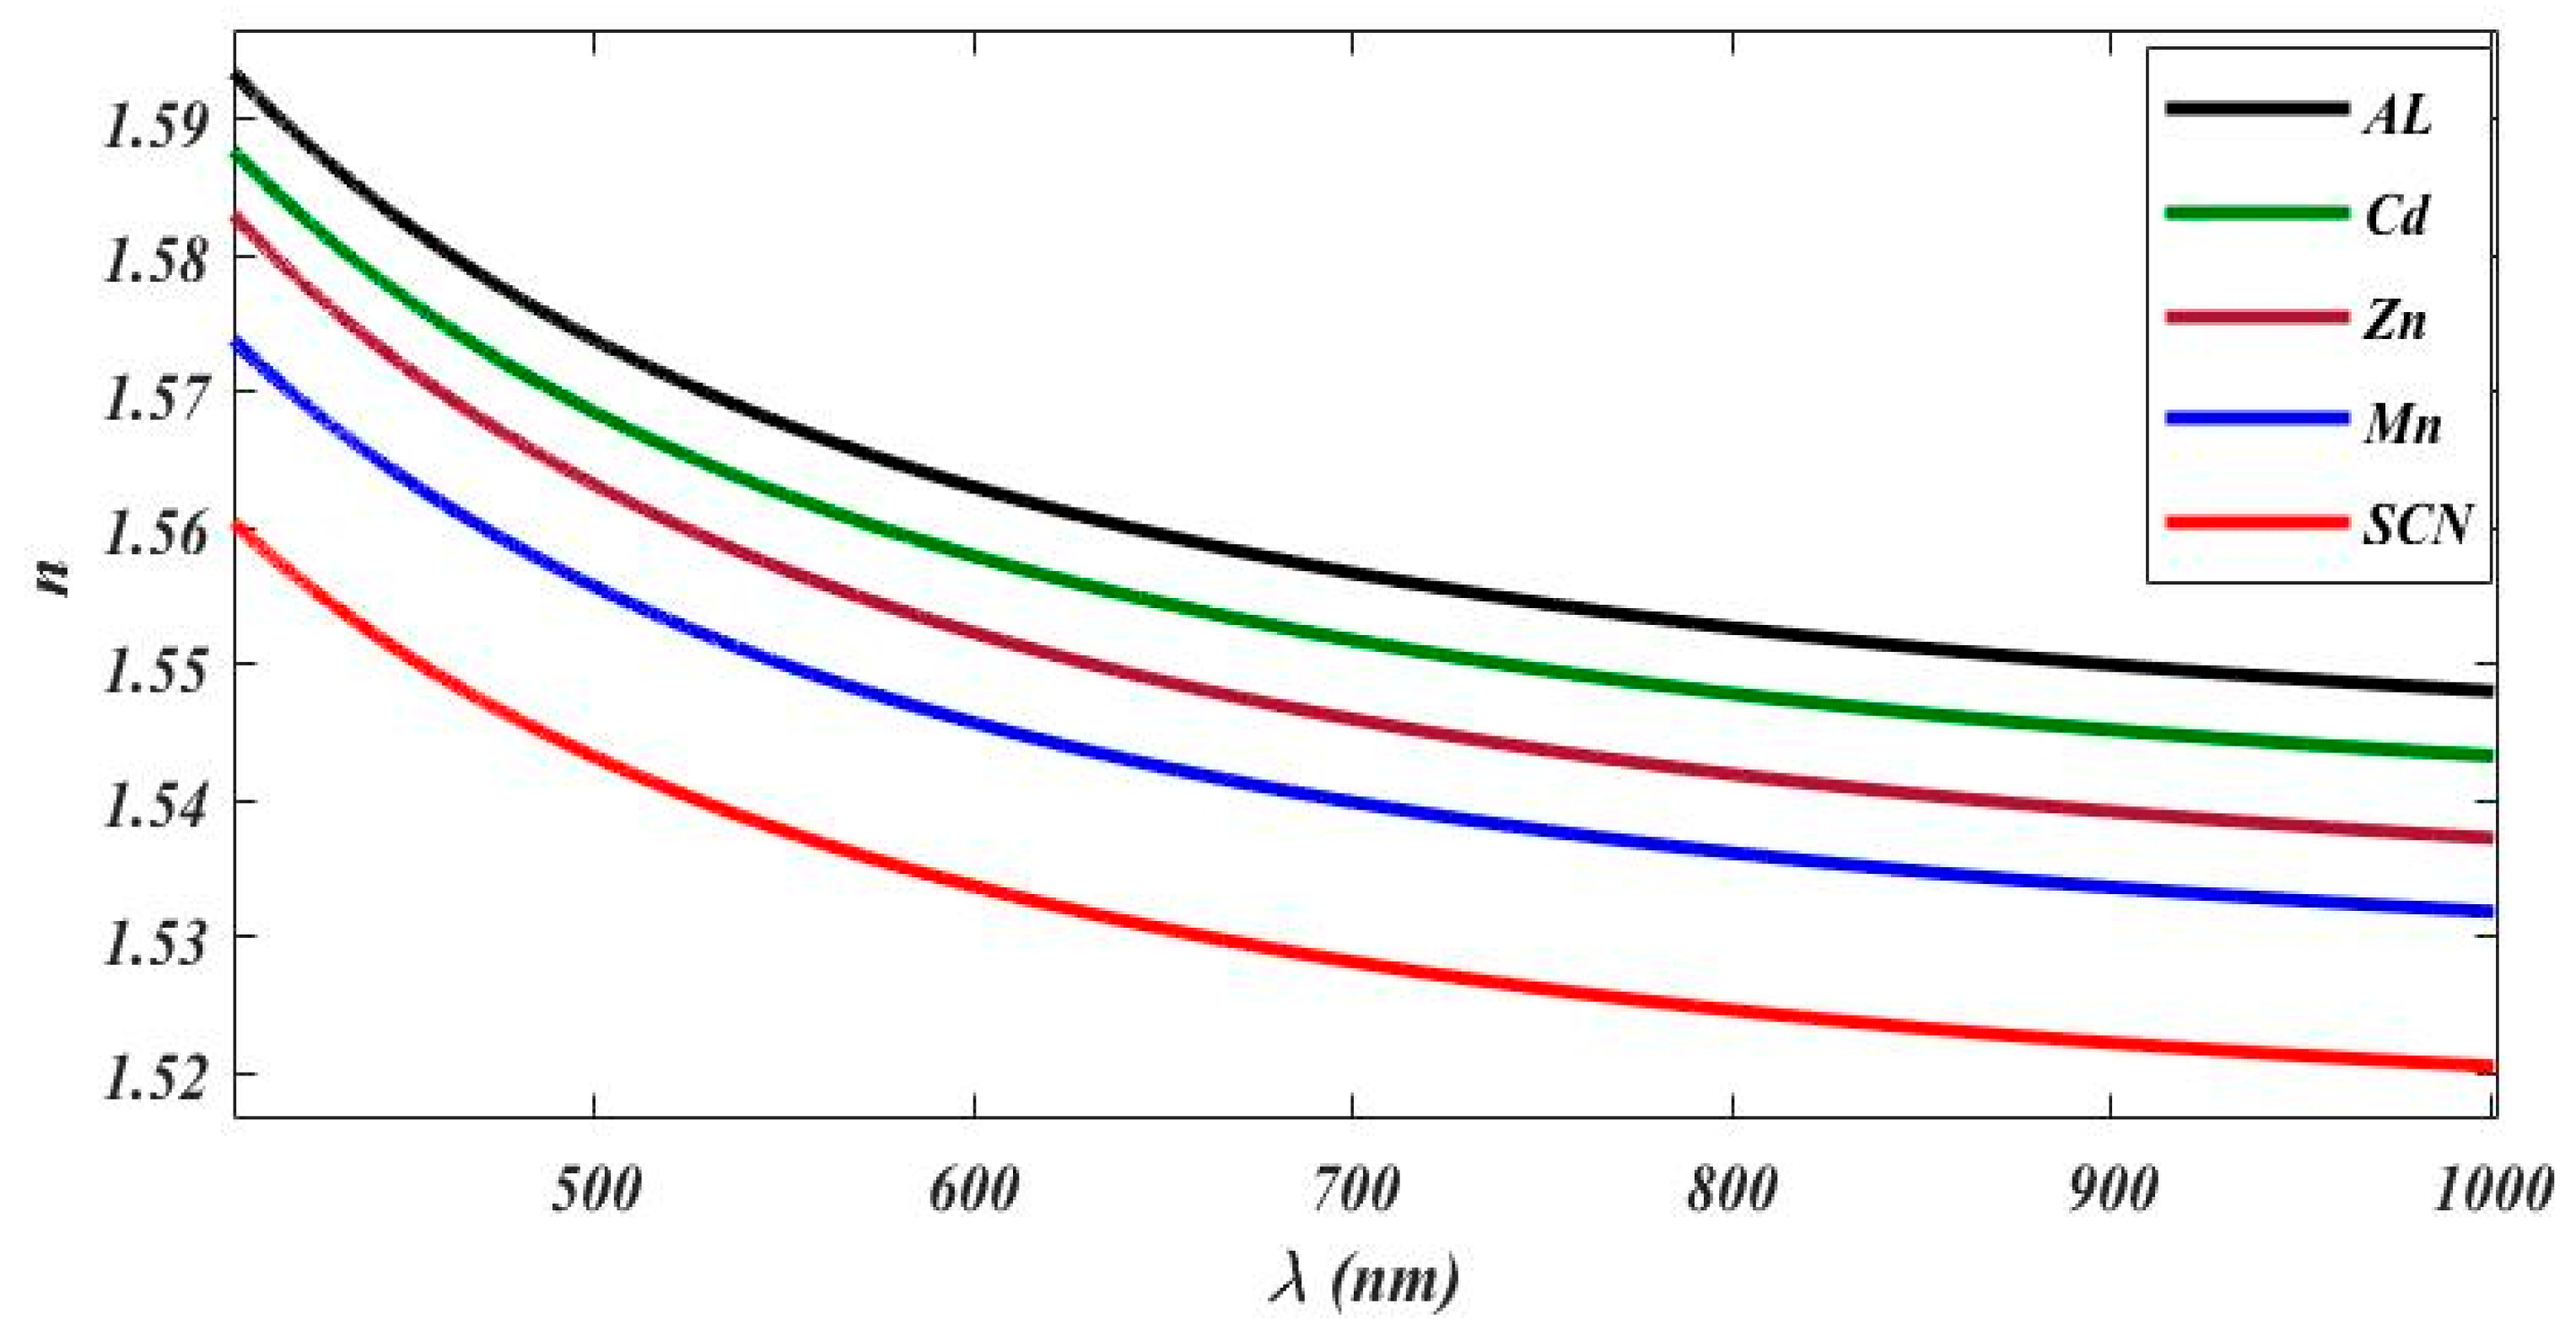
where λ is the wavelength, d is the sample thickness, n is the refractive index, L is the optical path difference in air between the interferometer arms, and k is the interference order corresponding to the last interference maximum. After determining the parameters d, L and k, it is possible to obtain the refractive index dispersion n(λ) directly in the spectral range of 400–1000 nm [52,54,57]. The obtained refractive index values, as shown in Figure 1, are in good agreement with the previously reported data for similar ionic liquids, which proves the accuracy of the adopted procedure for the preparation of the samples and the reproducibility of the RISBI method [52,56,57].
It is worth noting that the same trend is observed for all the studied systems, which consists of the increase in the refractive index with the increase in the alkyl chain length in the studied spectral range. For the investigation of the dispersion of the refractive index and the determination of the physically relevant values, the obtained dispersion data were used to fit the data with the Sellmeier equation given in Equation (2), with a single resonance, which is the most commonly applied formula for the description of the dispersion of transparent materials.
The refractive index was measured across 400–1000 nm, as shown in Figure 1. All samples exhibited normal dispersion, with n(λ) decreasing monotonically across the spectral range and no evidence of anomalies or inflection points. This behavior indicates that electronic polarizability, rather than structural resonance, governs the optical response in the visible–NIR region. A systematic trend is observed when comparing the neat IL [BMIM][SCN] with its transition metal–thiocyanate complexes: incorporation of polarizable metal centers increases the refractive index at visible wavelengths relative to the uncoordinated IL. As shown in Figure 1, the Al-containing complex exhibits the highest refractive index across 400–1000 nm. Although this observation may initially appear counterintuitive, it is consistent with theory: the refractive index depends on the total electronic polarizability per unit volume, rather than the polarizability of isolated metal atoms. Multiple factors may contribute to the elevated n of the Al complex. If the liquid possesses higher density, the increased number density (N) further enhances n according to the Lorentz–Lorenz relation. Additionally, the Sellmeier fits suggest a larger λUV or stronger oscillator strength (B) for the Al complex, producing higher visible-range refractive indices.
The visible-range ordering can therefore be summarized as follows:
nAl > nCd ≳ nZn > nMn > nSCN
Such a hierarchy also proves that the polarizability per unit volume is a function not only of the metal center in question but also of the coordination environment, the environment of the counterions, and density effects. This phenomenon may be understood in the light of the Lorentz–Lorenz equation, which relates the refractive index to the electronic polarizability density of the medium. Alterations in the coordination environment due to the presence of the metal ions cause changes in the electronic environment and the ionic density of the ionic liquid.

3.2. Effect of Temperature on Refractive Index

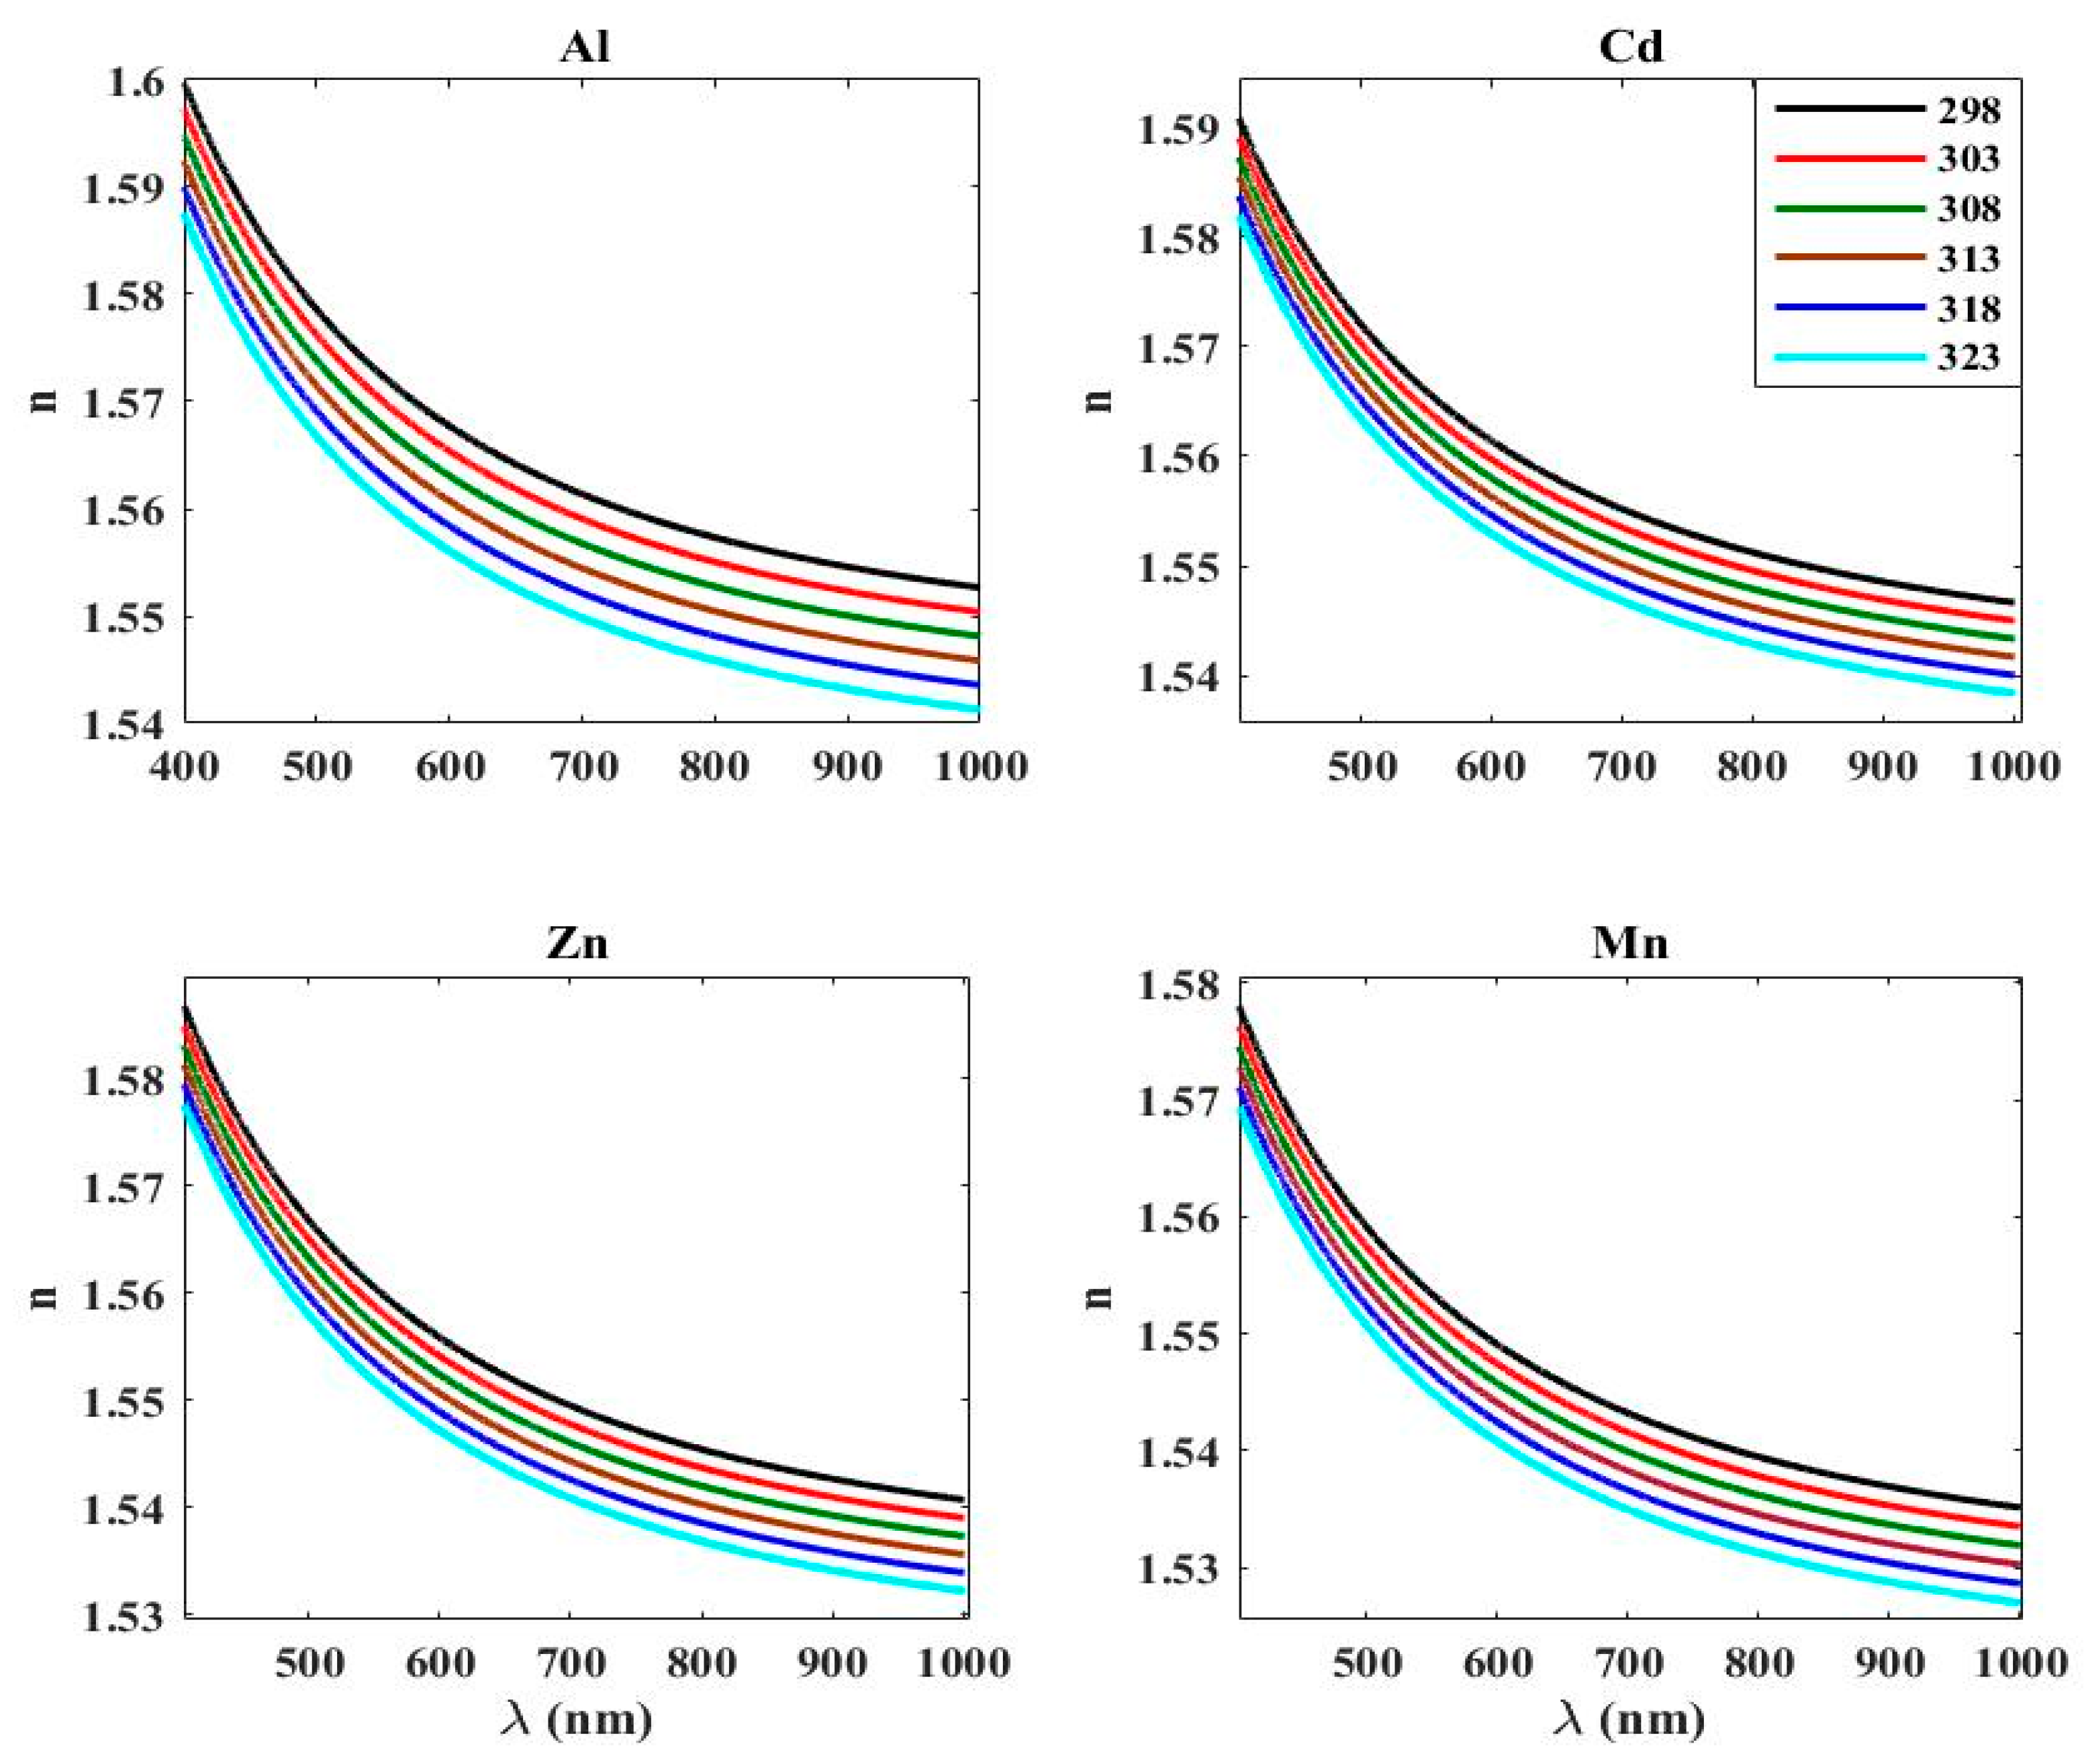
Having established the wavelength dependence of n(λ), we next evaluate the influence of temperature as an external tuning parameter for refractive index control. As can be clearly observed in Figure 2, all the investigated systems demonstrate normal dispersion behavior, with a smooth decrease in the refractive index as the wavelength increases. This behavior confirms that the optical properties are dominated by electronic polarizability without any abnormal behavior within the visible–NIR region. Temperature dependence studies showed that the investigated systems demonstrate a regular though moderate change in the refractive index as the temperature increases from 298 to 323 K. The most significant change in the refractive index was observed in the Al-SCN and Cd-SCN complexes. This indicates that the electronic polarizability of these complexes is significantly affected by thermal fluctuations.
This analysis can be further confirmed through the parameters presented in Table 2. According to this table, the Al-SCN and Cd-SCN complexes demonstrate the most significant change in the coefficient B. This indicates that the effective electronic resonance in these complexes is significantly affected by the temperature. This could be due to the higher polarizability per unit volume. This implies that the change in the coordination volume due to liquid density fluctuations results in a significant change in the refractive index. This analysis clearly indicates that the electronic polarizability of the Al-SCN and Cd-SCN complexes is significantly affected by the thermal fluctuations. This behavior is different from the Zn-SCN, Mn-SCN, and [BMIM][SCN] systems. Figure 2 clearly indicates that the introduction of the transition metal center into the [BMIM][SCN] framework results in a moderate enhancement of the refractive index within the visible–NIR region while simultaneously modulating the thermo-optic response depending on the coordinating metal center.
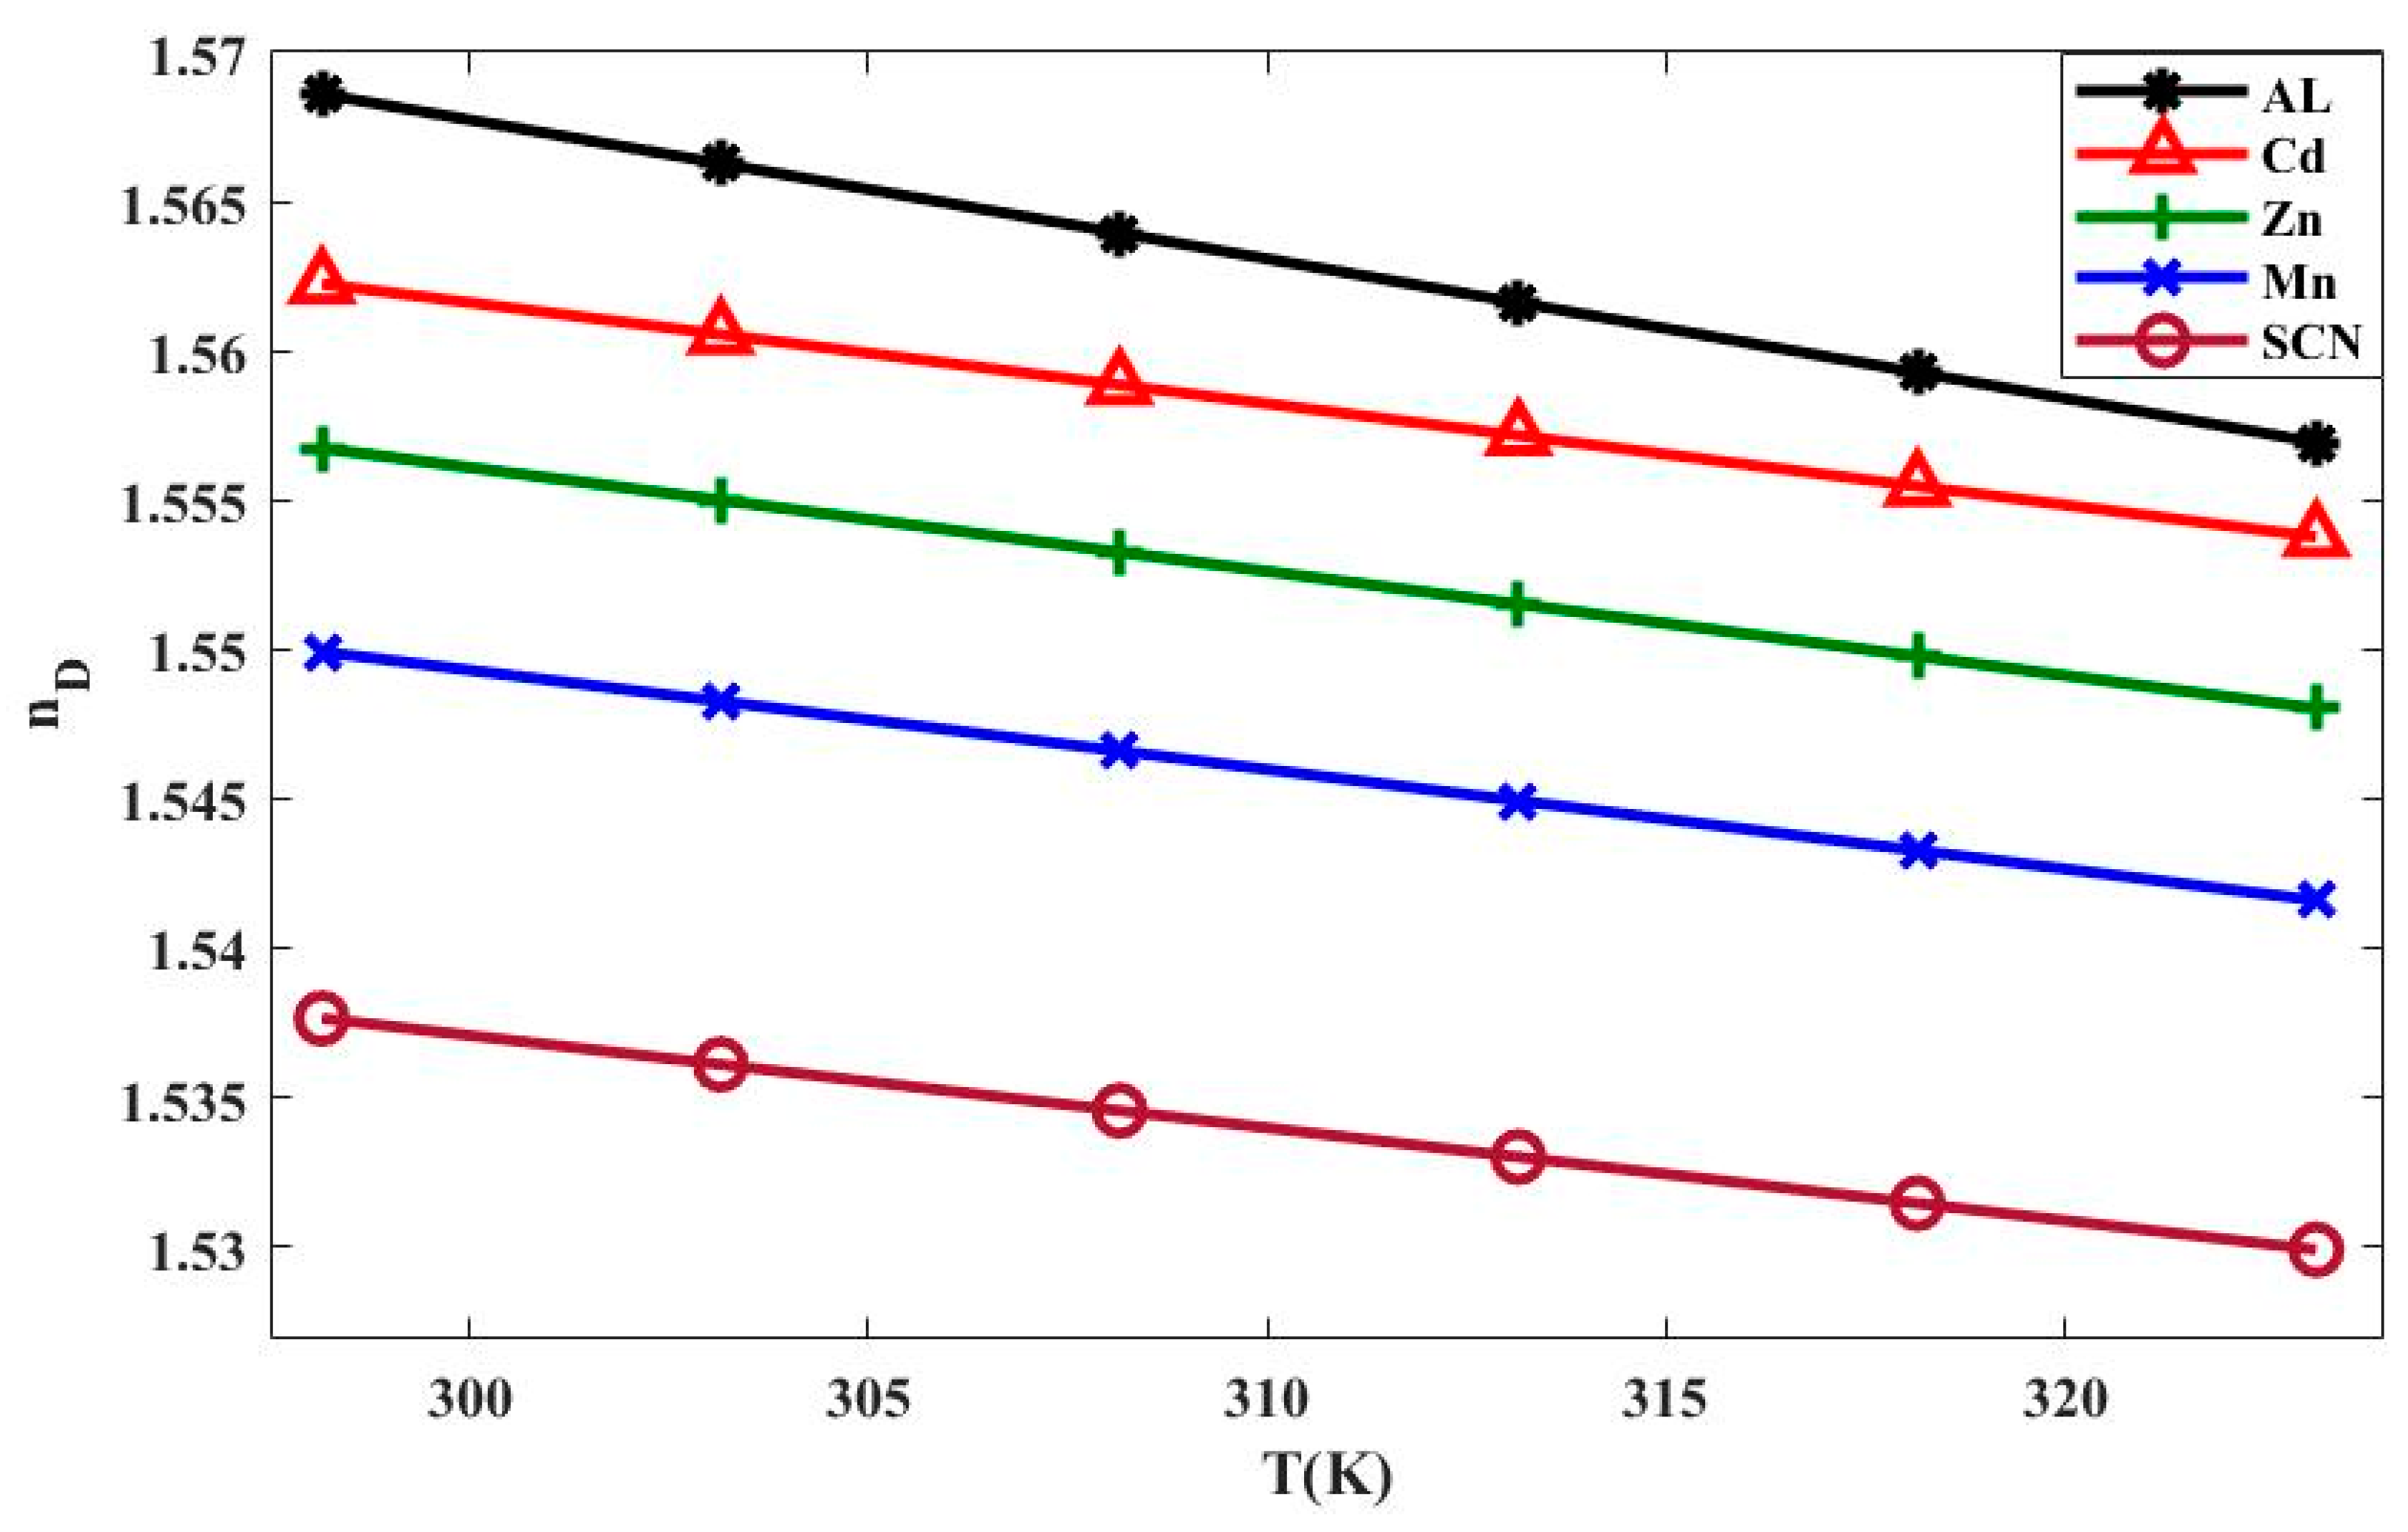
Figure 3 shows the temperature dependence of the refractive index at the sodium D-line (589.3 nm) for the five [BMIM]+ thiocyanate systems: [BMIM][SCN], [BMIM]3[Al(SCN)6], [BMIM]2[Zn(SCN)4], [BMIM]2[Cd(SCN)4], and [BMIM]4[Mn(SCN)6]. Over the range of approximately 295–323 K, n decreases linearly with increasing temperature for all samples, resulting in a negative thermo-optic coefficient (TOC) [40]. The magnitude of the TOC varies among the compounds: the Al complex exhibits the largest negative value, while the neat [BMIM][SCN] displays the smallest, with the Cd and Zn tetrathiocyanate complexes and the Mn hexathiocyanate intermediate between these extremes. This linear temperature dependence is consistent with a first-order description in which both thermal expansion (reducing number density) and the temperature dependence of the effective UV electronic resonance contribute to the decrease in n with T.
An efficient UV resonance Sellmeier model with temperature dependence captures the combined wavelength–temperature behavior of the refractive index:
n 2 ( λ , T ) 1 = ( A + B T ) λ 2 λ 2   λ u v 2
In this formulation, λ U V is an adjustable parameter representing the effective resonance wavelength in the ultraviolet region, while λ denotes the operating wavelength (in μm). The constants A and B define the resonance strength and its linear temperature dependence, respectively. Temperature is incorporated through Δ T = T T 0 , where T 0 = 310.65 , corresponding to the midpoint of the studied temperature interval.
The fitted values of A , B , and λ U V 2 for each IL, together with their one-sigma uncertainties, are presented in Table 2. Reliability was evaluated by comparing the experimental dispersion curves to those generated using Equation (2). For all liquids, residual differences in the refractive index remained consistently below 3 × 10 4 , with the largest deviations appearing at the spectral boundaries and only slightly exceeding the instrumental resolution [40].
Here, the fitted λ U V 2 values for the [BMIM][SCN] family fall in a narrow range of 0.0165–0.0183 μm2 and are essentially insensitive to the coordinated metal within our uncertainties. By contrast, the amplitude terms A and B vary systematically across the series. A increases from 1.2887 for [BMIM][SCN] to 1.3683 for [BMIM]3[Al(SCN)6]. The coefficient B is negative for all liquids, and its magnitude grows from 9.06 × 10⁻⁴ K−1 for neat [BMIM][SCN] through Mn (9.79 × 10⁻⁴ K−1), Cd (1.00 × 10⁻³ K−1) and Zn (1.03 × 10⁻³ K−1), reaching the largest value for Al (1.38 × 10⁻³ K−1). Thus, while the position of the effective UV resonance (λUV) remains nearly constant across compositions, the resonance strength and its first-order thermal sensitivity (captured by A and B) increase from the neat IL to the hexathiocyanato complexes, with [BMIM]3[Al(SCN)6] exhibiting the strongest thermo-optic response.
This behavior can be interpreted in terms of the electronic polarizability of the metal–thiocyanate coordination environment. The observed enhancement arises from two primary contributions: (i) d10 metal centers (Cd2+ and Zn2+) possess inherently higher scalar polarizability than Al3+ and Mn2+, and (ii) the SCN coordination environment amplifies the local electric field around the metal center, producing a stronger optical response in the visible region. Consequently, samples with higher refractive indices also display slightly stronger dispersion (|dn/dλ| in the visible), consistent with a red-shifted effective UV absorption edge in the more polarizable complexes. Within the Sellmeier description, this effect is reflected by the systematic increase in the fitting parameters A and B, while the effective resonance wavelength λUV remains nearly constant across the series, as summarized in Table 2.

3.3. Abbe Number

The Abbe number is an essential optical property that represents the level of chromatic dispersion in a given material. Essentially, it represents the level of change in the refractive index of a material as it changes with the wavelength of the incident light. Therefore, it is directly related to the material’s dispersive power. Materials with high Abbe numbers show a level of chromatic dispersion that is considered low, allowing for the passing of light with minimal chromatic separation, while those with low Abbe numbers show a high level of chromatic dispersion. Conventionally, the Abbe number is defined with respect to the sodium D spectral line (λD) and is expressed mathematically as follows:
ν D = ( n D 1 ) / ( n F n C )
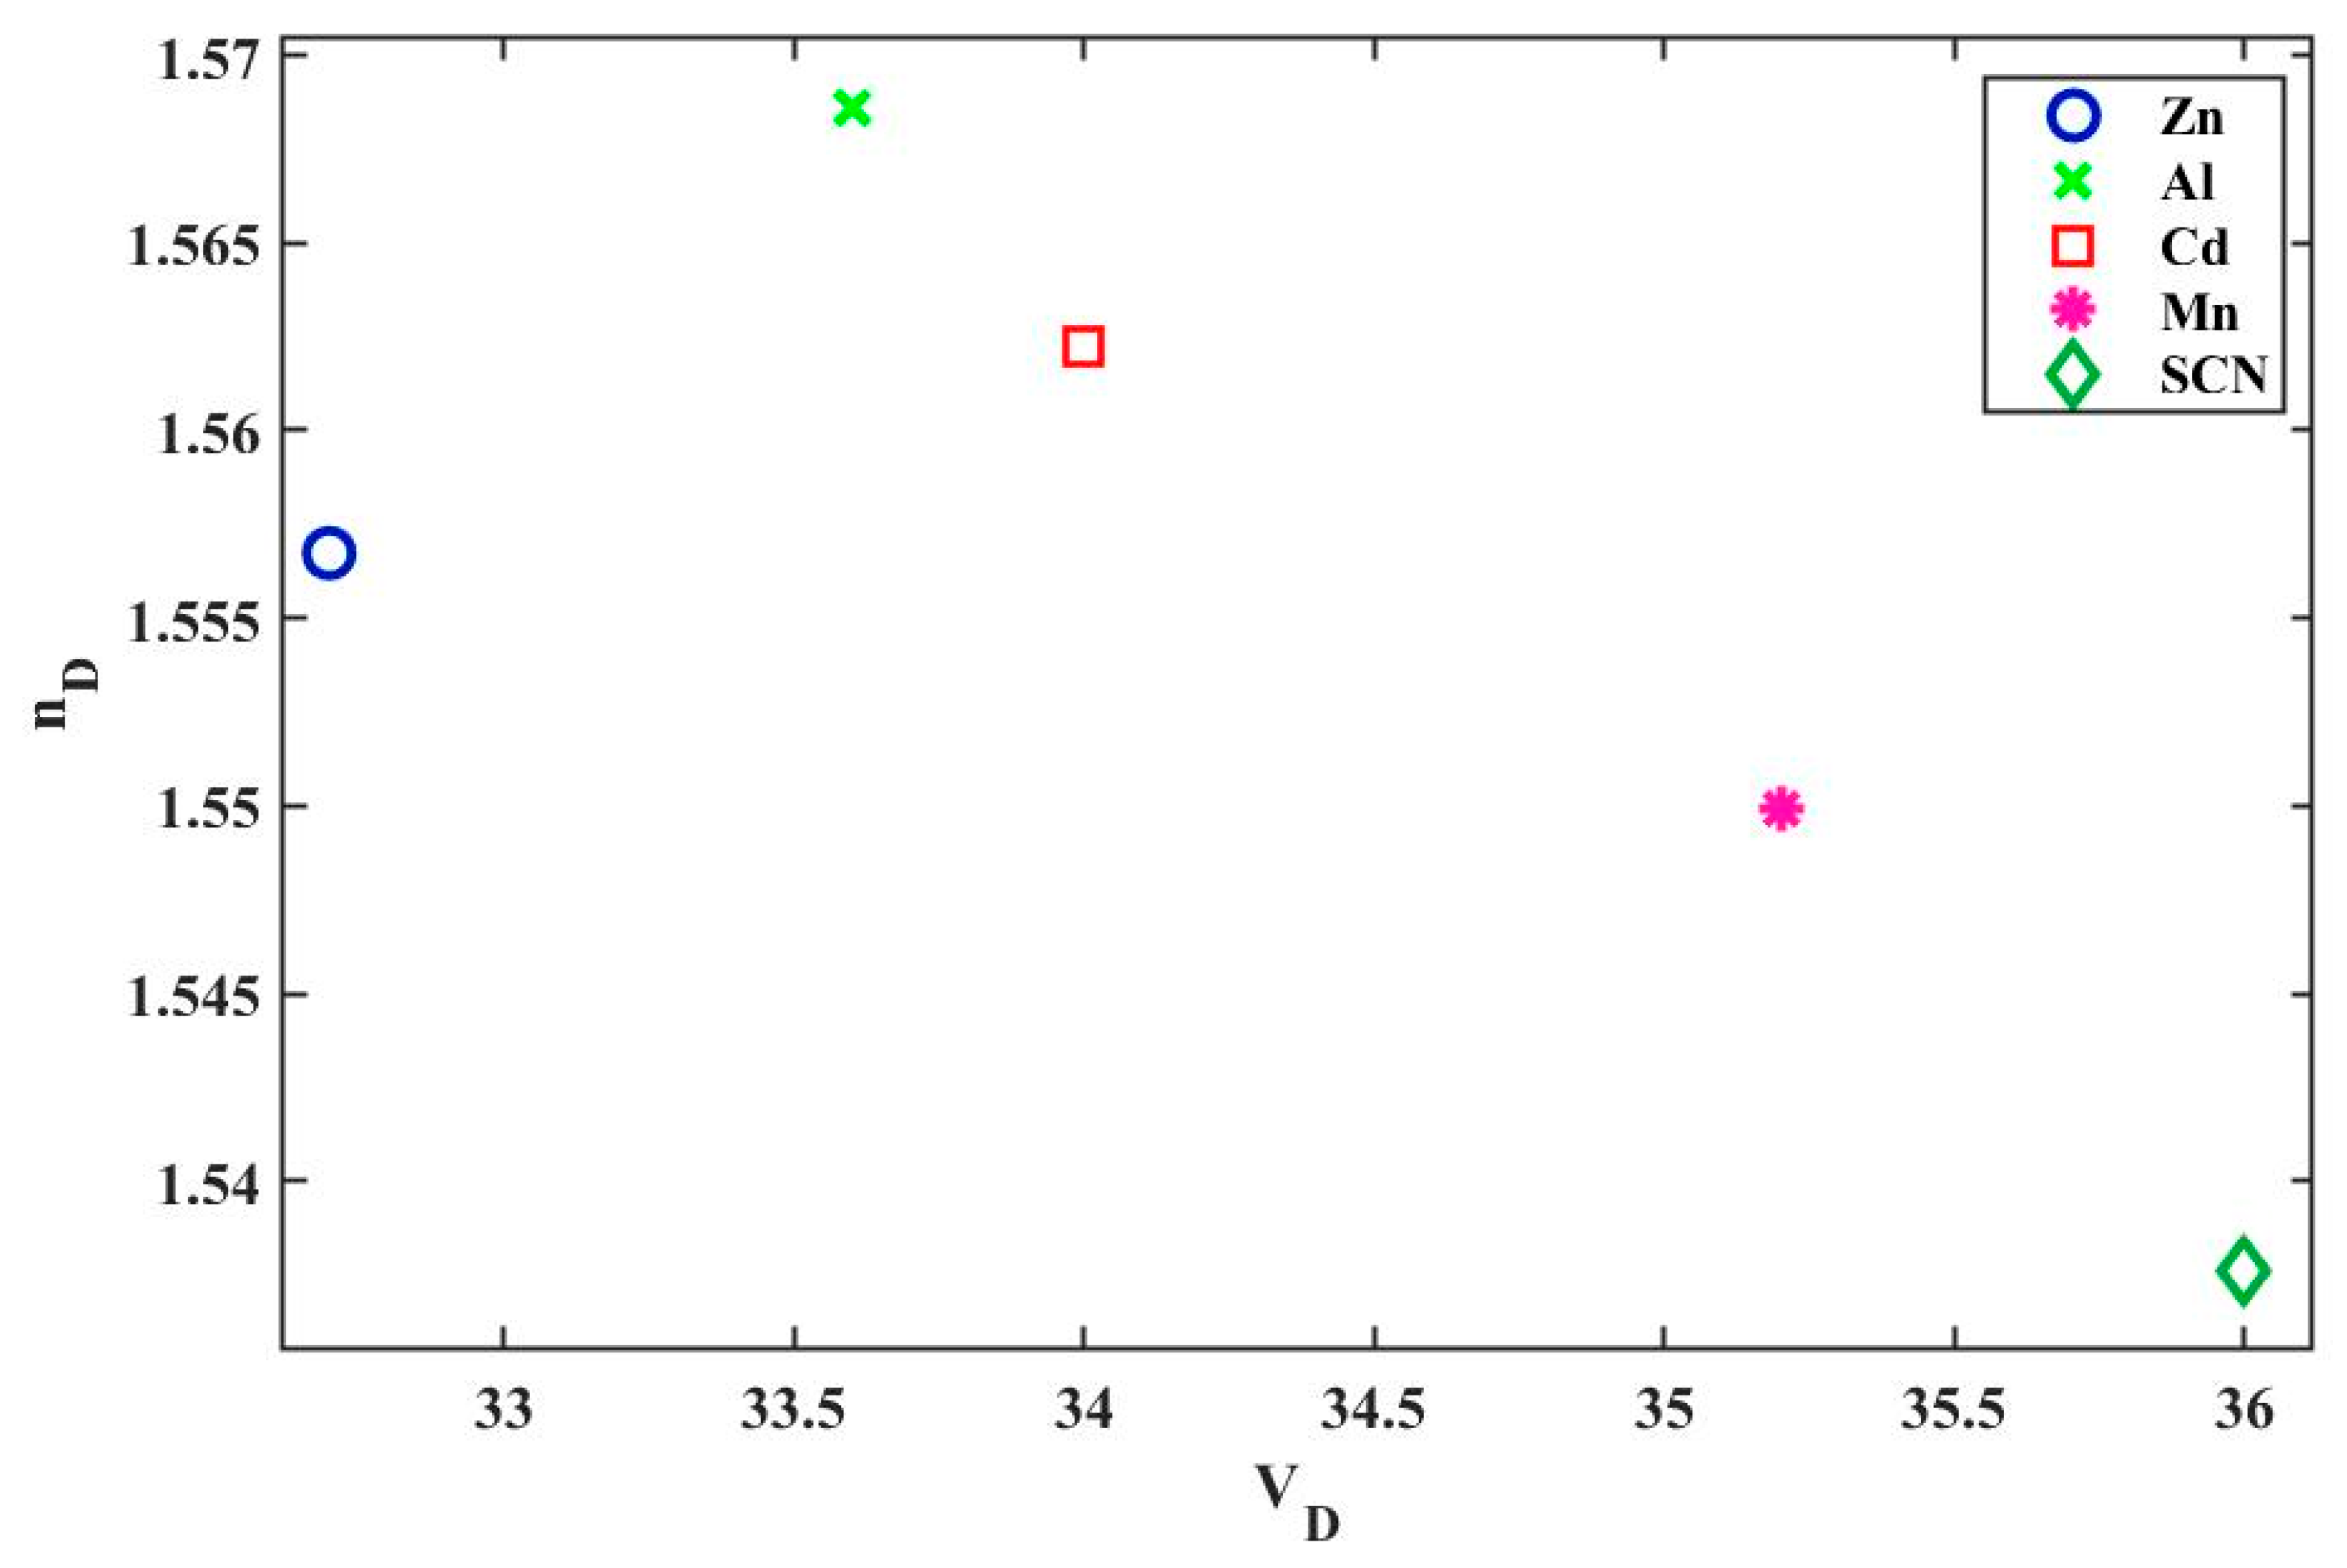
where nF, nD, and nC represent the refractive indices at wavelengths of 486.1, 589.3, and 656.3 nm, respectively. This dimensionless parameter effectively combines both the absolute refractive index and the dispersive behavior of a material. In optical characterization, it is customary to describe a material in terms of its refractive index at (λD), together with its associated Abbe number. Abbe diagrams serve as convenient graphical tools for comparing dispersion characteristics of different materials by displaying the two parameters. As shown in Figure 4, the Abbe diagram for the ILs examined in this study is presented. Based on the plot, we are able to compare how different metal–thiocyanate complexes modify the optical response of the neat [BMIM][SCN] relative to the incorporation of different metal–thiocyanate complexes.
Across these ILs, the Abbe number (VD) and the D-line refractive index (nD) illustrate the expected trade-off between index and dispersion. The neat thiocyanate [SCN] has the lowest index (nD = 1.5376) and the highest VD ≈ 36, indicating the weakest dispersion (flattest n(λ)) among the set. Manganese thiocyanate is similar in dispersion (VD ≈ 35.2) but with a higher index (nD = 1.5499). Cadmium and zinc thiocyanates cluster around nD ≈ 1.56 with lower VD (Cd ≈ 34.0, Zn ≈ 32.7), signaling stronger dispersion. Aluminum thiocyanate stands out with the highest index (nD = 1.5686), yet a mid-to-low VD ≈ 33.6, i.e., it combines strong refraction with comparatively high dispersive power. Plotted on an Abbe diagram, you would see two main groups: (i) Al/Cd/Zn around nD ~ 1.56 and VD ~ 33–34 and (ii) Mn/SCN trending to higher VD and lower nD.
This translates into a higher bend ability with Al, Zn, and Cd salts at the expense of higher chromatic dispersion with applications favoring higher index values over others, like compact elements but with precise chromatic correction required. Among them, Zn, with the lowest VD (≈32.7), would exhibit the steepest dispersion of the series. Mn offers a favorable compromise—moderately high index with relatively tame dispersion—while neat SCN is best when minimal chromatic aberration is needed, albeit at the cost of a lower index. These relationships align with standard Abbe diagram interpretations: higher nD typically accompanies lower VD, and materials separate into clusters that reveal design trade-offs for achromatization or dispersion engineering.

3.4. Dispersion of the Thermo-Optic Coefficient

The TOC is defined as the rate at which the refractive index changes with temperature. A simultaneous measurement of temperature and refractive index is considered useful to study the optical properties of ILs, since the refractive index is highly influenced by the temperature. The TOC, dn/dT, can be obtained directly from the T-derivative Equation (2) as follows:
d n d T = B 2 n ( λ 2 λ 2 λ u v 2 )
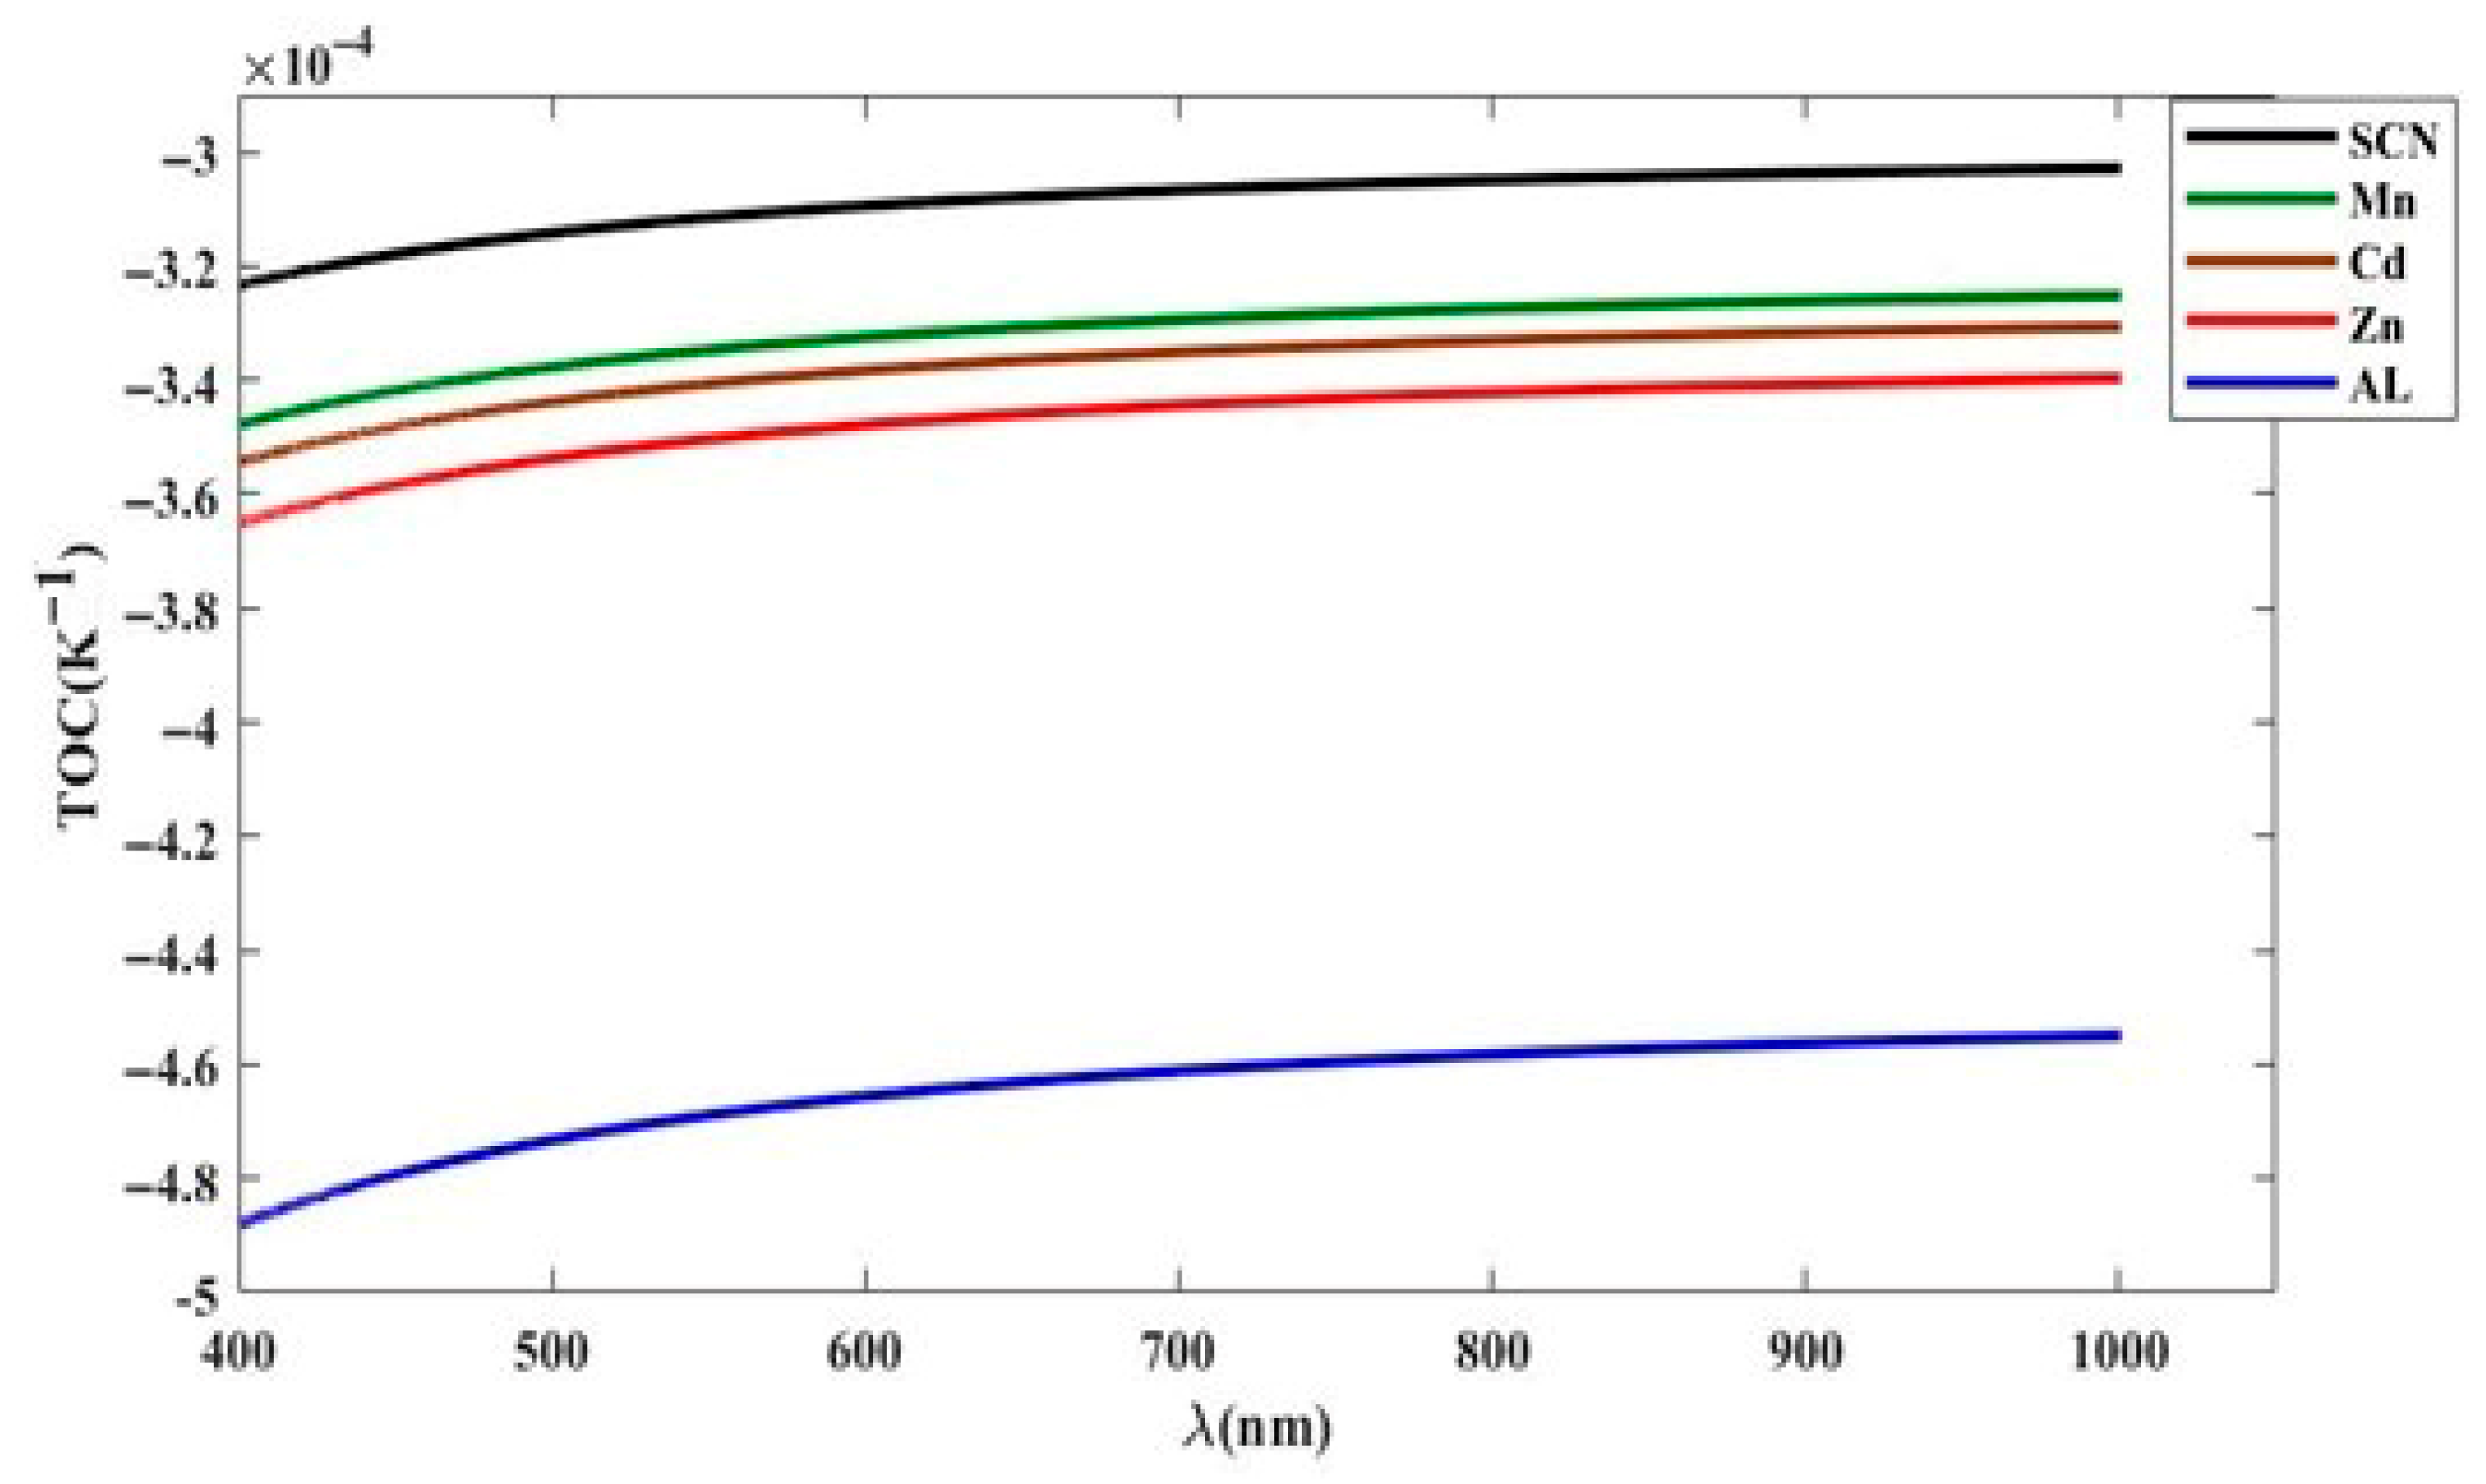
Here the thermo-optic coefficient (TOC ≡ (1/n)(∂n/∂T)) is negative across 400–1000 nm for all five ILs, meaning the refractive index decreases as temperature increases. The wavelength dependence is weak and monotonic: in Figure 5, the curves rise toward longer λ (become less negative) because the dispersion factor λ2/(λ2 − λ2uv) approaches a constant as λ ≫ λuv. Numerically, the values lie around −(3.0–4.7) × 10−4 K−1 over the plotted range, with the slope flattening beyond ~800 nm. This behavior is typical of liquids where the density or thermal expansion dominates over the temperature dependence of electronic polarizability: heating lowers density, reducing n, while the UV resonance term only adds a mild spectral tilt.
Across the series, the differences are governed mainly by the fitted B coefficient (all negative) and, to a lesser extent, by n. The magnitude ordering of the |TOC| is Al > Zn ≈ Cd > Mn > neat [BMIM][SCN], which matches |B|: |BAl| ≈ 1.38 × 10⁻³ K−1 (largest) down to |BSCN| ≈ 9.1 × 10⁻⁴ K−1 (smallest). Consequently, [BMIM]3Al[SCN]6 shows the strongest (most negative) TOC—about −4.7 × 10⁻⁴ K−1 at 400 nm easing toward −4.5 × 10⁻⁴ K−1 at 1 µm—while neat [BMIM][SCN] has the weakest (least negative) TOC, around −3.2 → −3.0 × 10⁻⁴ K−1. Practically, the Al-coordinated IL will exhibit the greatest thermal lensing and temperature sensitivity, whereas neat [BMIM][SCN] is the most thermally stable optically; Mn, Cd, and Zn complexes fall in between, with very similar dispersion and only small separations set by their B values.

3.5. Group Index and Group-Velocity Dispersion

Refractive index dispersion leads to different spectral components of a polychromatic beam propagating at distinct velocities within a dispersive medium. The group velocity, vg, represents the propagation speed of the overall wave packet, and the ratio c/vg defines the group index, ng. The group index can be expressed as follows:
n g = n λ ( n λ )
From Equation (5), it follows that in media exhibiting normal dispersion, the group index ng is greater than the refractive index n. This occurs because the refractive index decreases with increasing wavelength, giving a negative derivative.
Two additional parameters are commonly used to describe dispersive effects on optical pulses: the group-velocity dispersion (GVD) measured in s2/m, and the dispersion parameter, D, measured in ps·nm−1·km−1. These are defined as follows:
D = 1 c ( n λ ) = ( λ c ) ( 2 n λ 2 )
where c is the speed of light. For 1-alkyl-3-methyl-imidazolium-based ILs in the spectral range 400–1000 nm and over the studied temperature interval, both ng and D can be evaluated using the following relations derived from Equation (2):
n g = n + [ ( A + B T ) λ 2   λ u v 2 ( λ 2   λ u v 2 ) 2 . 1 n ]
D = 1 c [ ( A + B T ) λ 2   λ u v 2 n 3 ( λ 2 λ u v 2 ) 3 ( 3 λ 2 n 2 + λ u v 2 ) ]
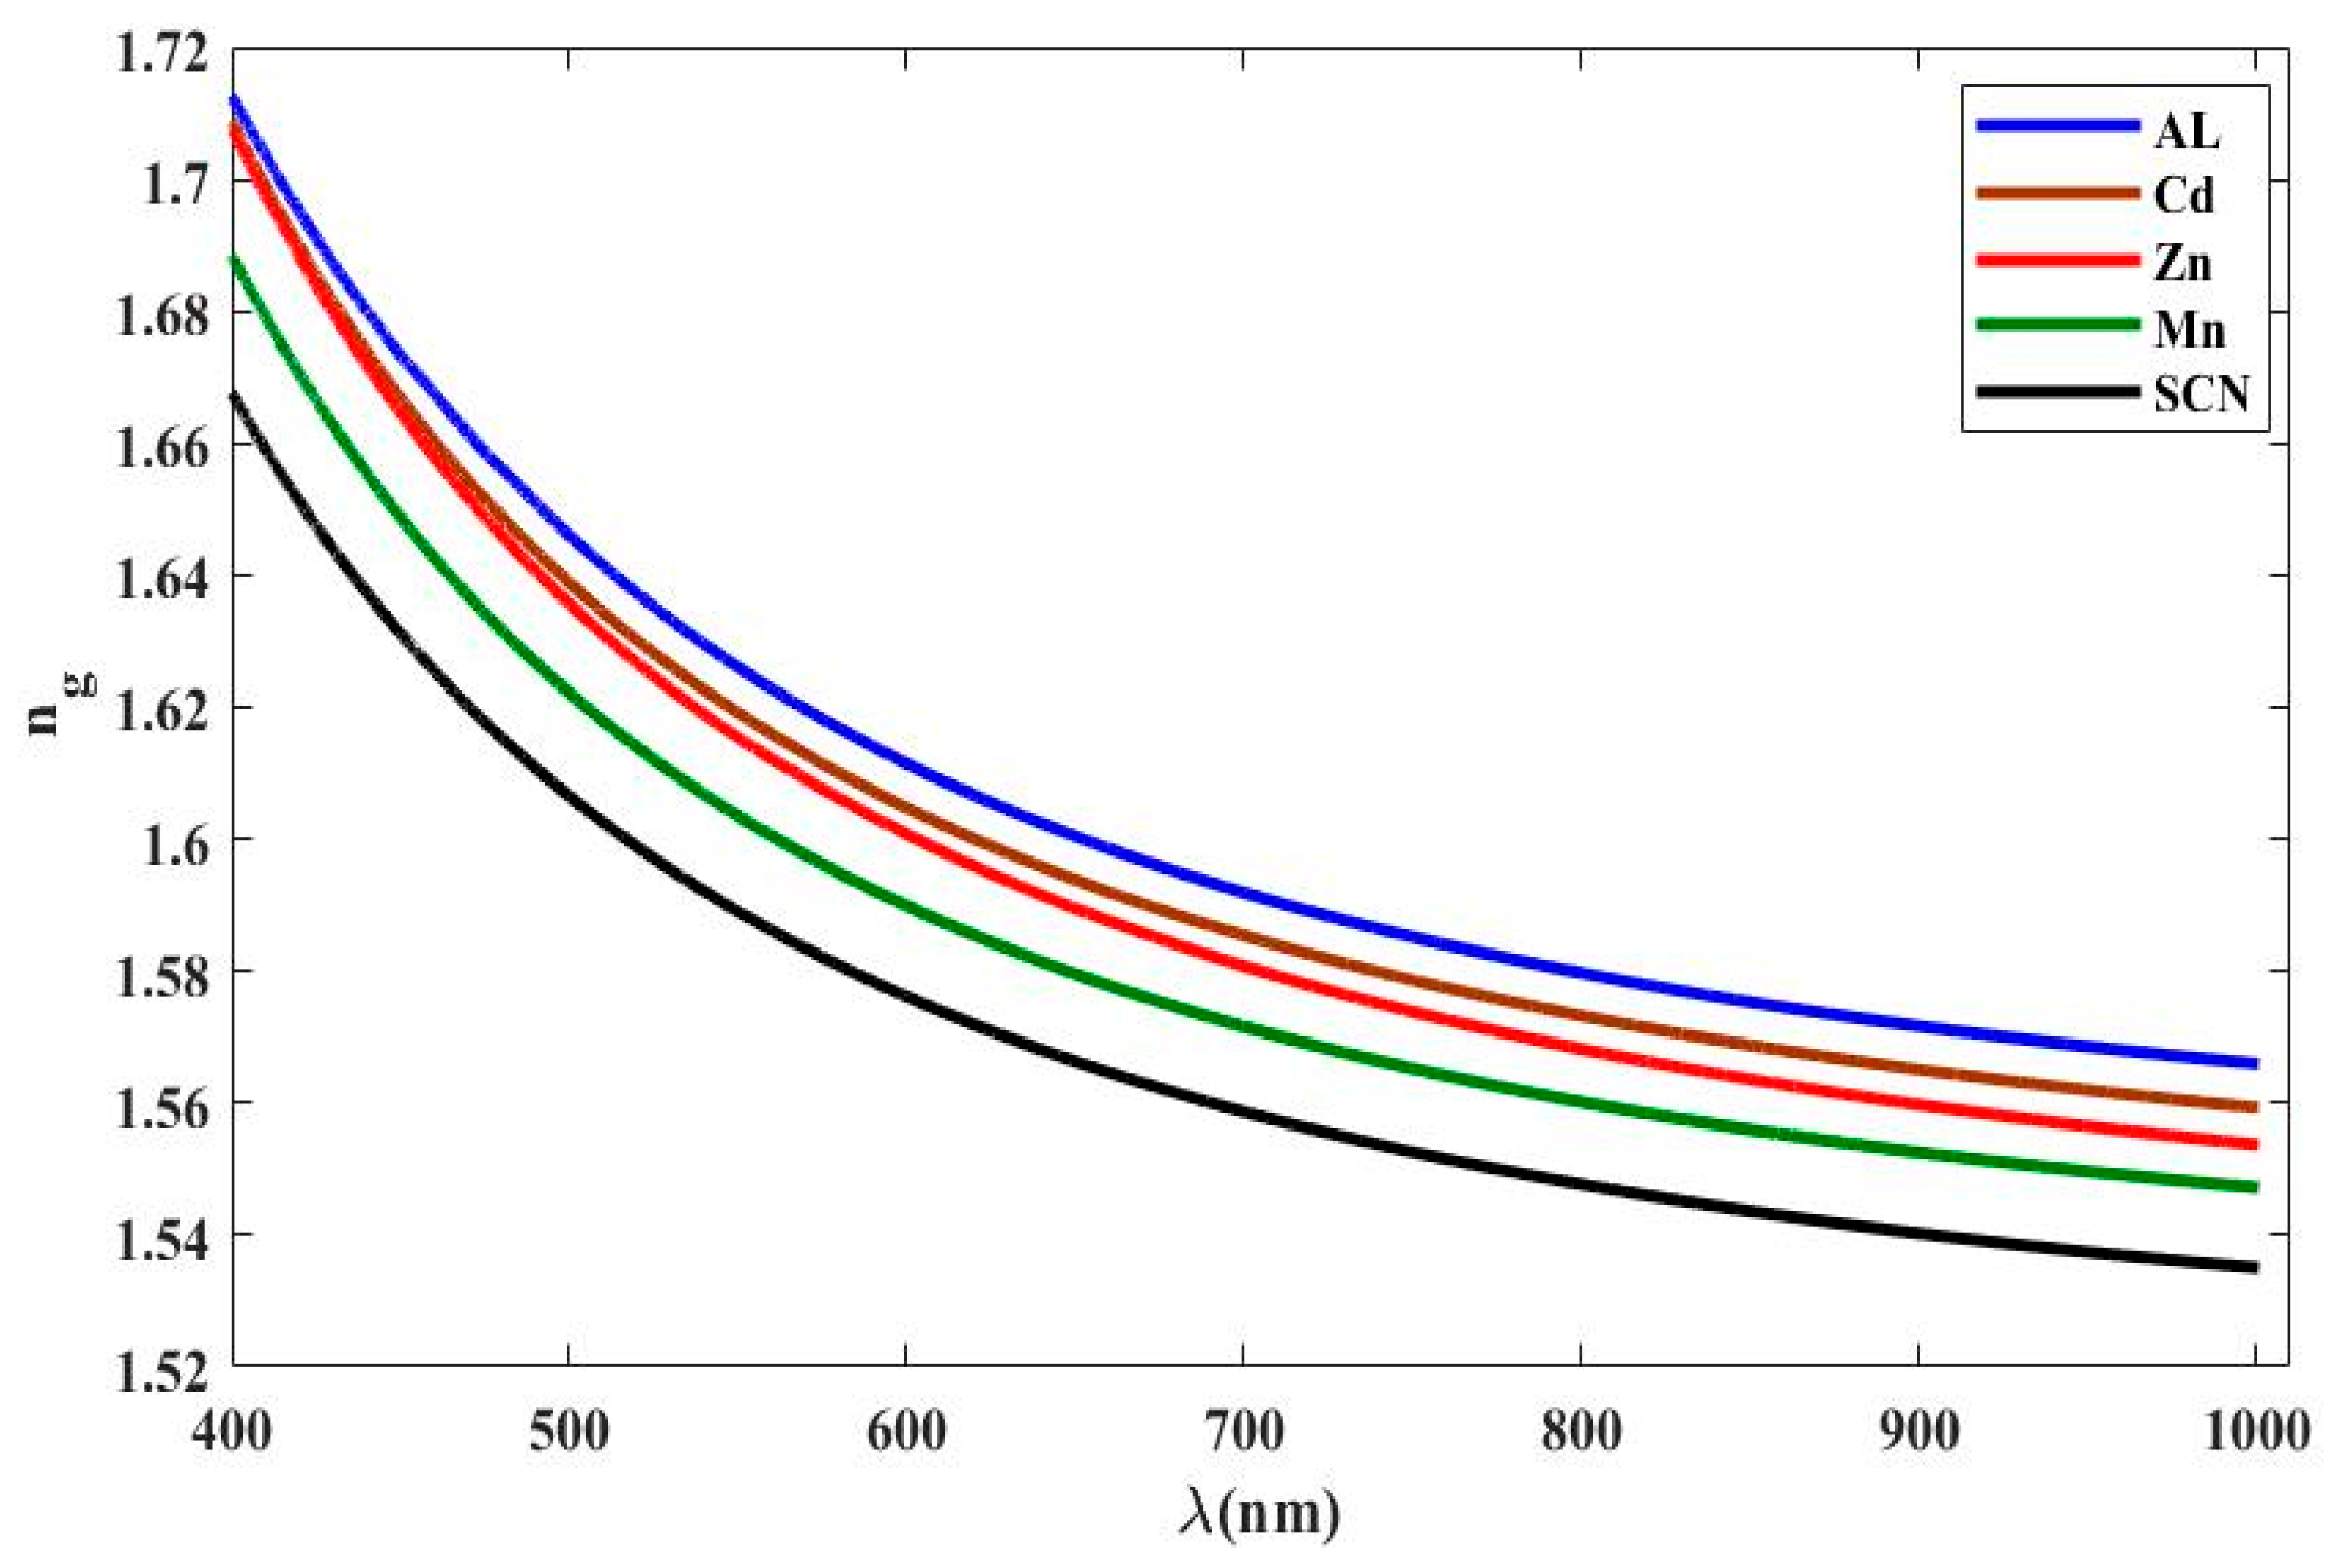
In Figure 6, the group index dispersion of the five ILs studied at 308 K exhibits the typical trend observed in the normal dispersion region. In all cases, the group index ng decreases smoothly as the wavelength increases, mirroring the behavior of the refractive index in this spectral range. However, the relative positions of the curves reveal distinctive features: SCN consistently shows the lowest ng values across the spectrum, while Al and Cd maintain comparatively higher values, followed by Mn and Zn. Interestingly, the curves of some liquids approach each other at certain wavelength ranges, suggesting the possibility of localized intersections similar to those observed in other IL families [52,56]. These near-touching situations reveal the existence of tiny differences within the cationic/anionic interactions and the respective polarizabilities. This phenomenon proves the significance of molecular structure with respect to dispersive characteristics. This serves as an additional reason that supports the applicability of these molecules for opto-electronic purposes.
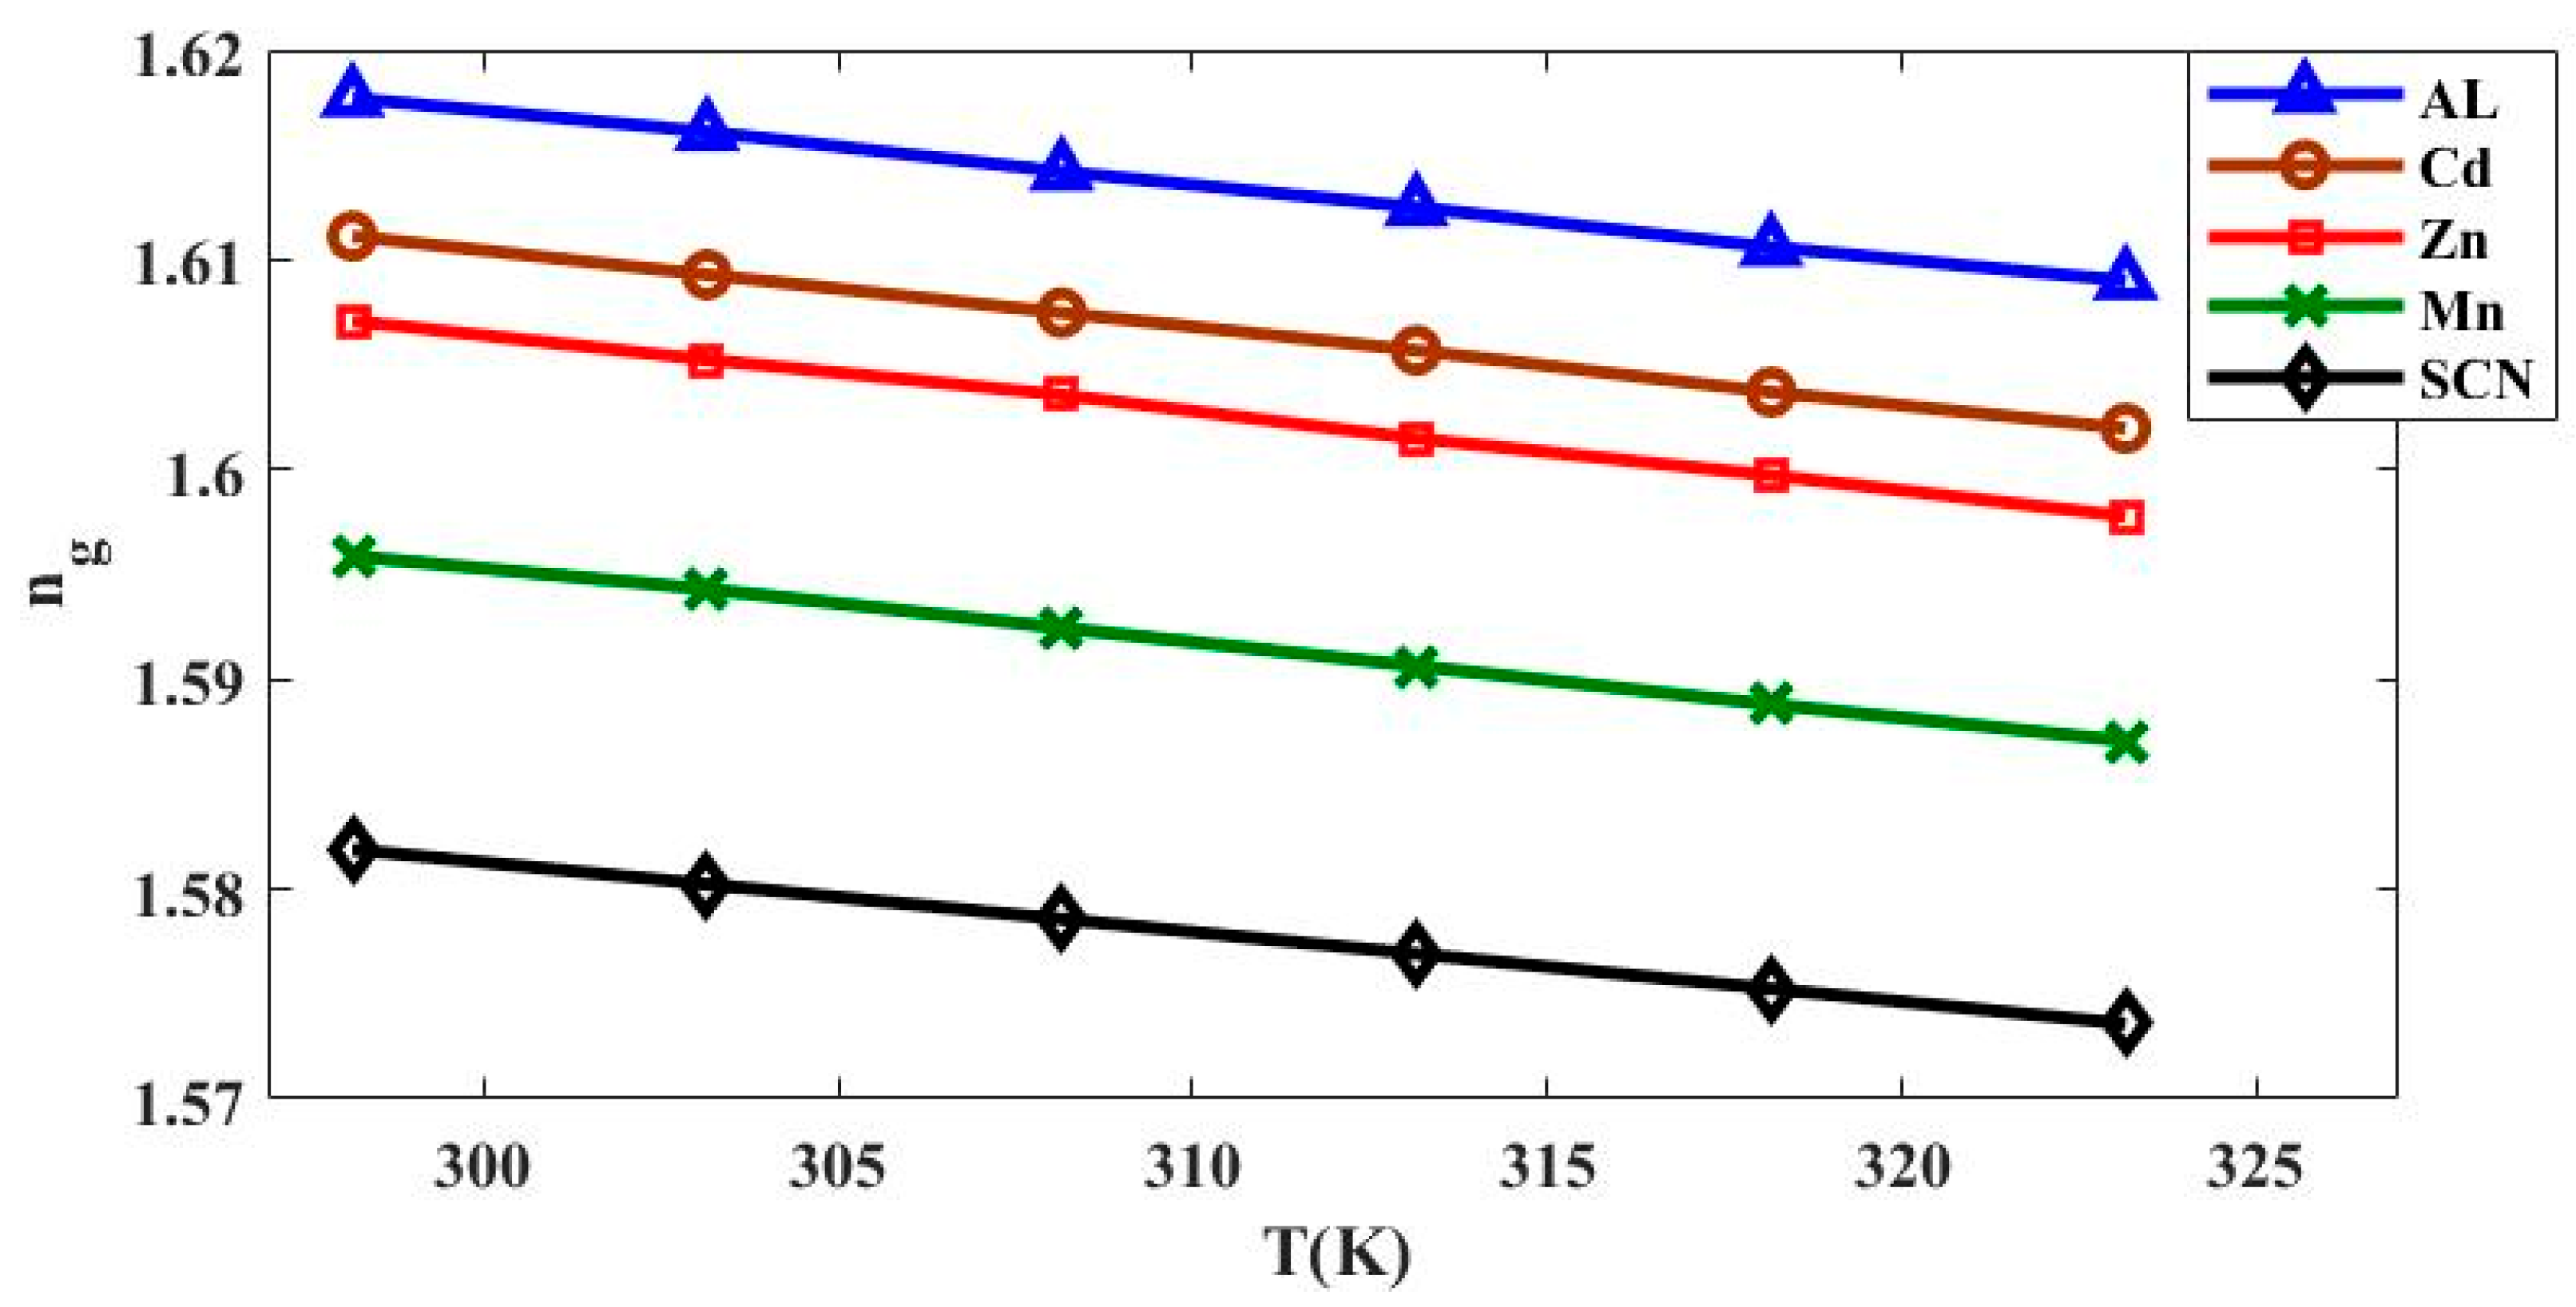
In Figure 7, the group index ng of the investigated ILs varies with temperature according to the characteristics of the normal dispersion region. However, it should be noted that the slopes of the mentioned linear relationships tend to be small, on the order of 3 × 10⁻⁵, and one order of magnitude smaller than the temperature dependence measured by the refractive index n. This fact indicates higher temperature stability of the group index magnitude relative to the refractive index. On the other hand, there are absolute differences between the group index levels of the investigated liquids; the ng of the liquid AL tends to remain the highest under the investigated temperature conditions, whereas the ng of the liquid SCN remains the lowest. These variations reflect differences in molecular structure and polarizability, while the reduced slope confirms that dispersion-related properties are less affected by thermal fluctuations than the refractive index itself.
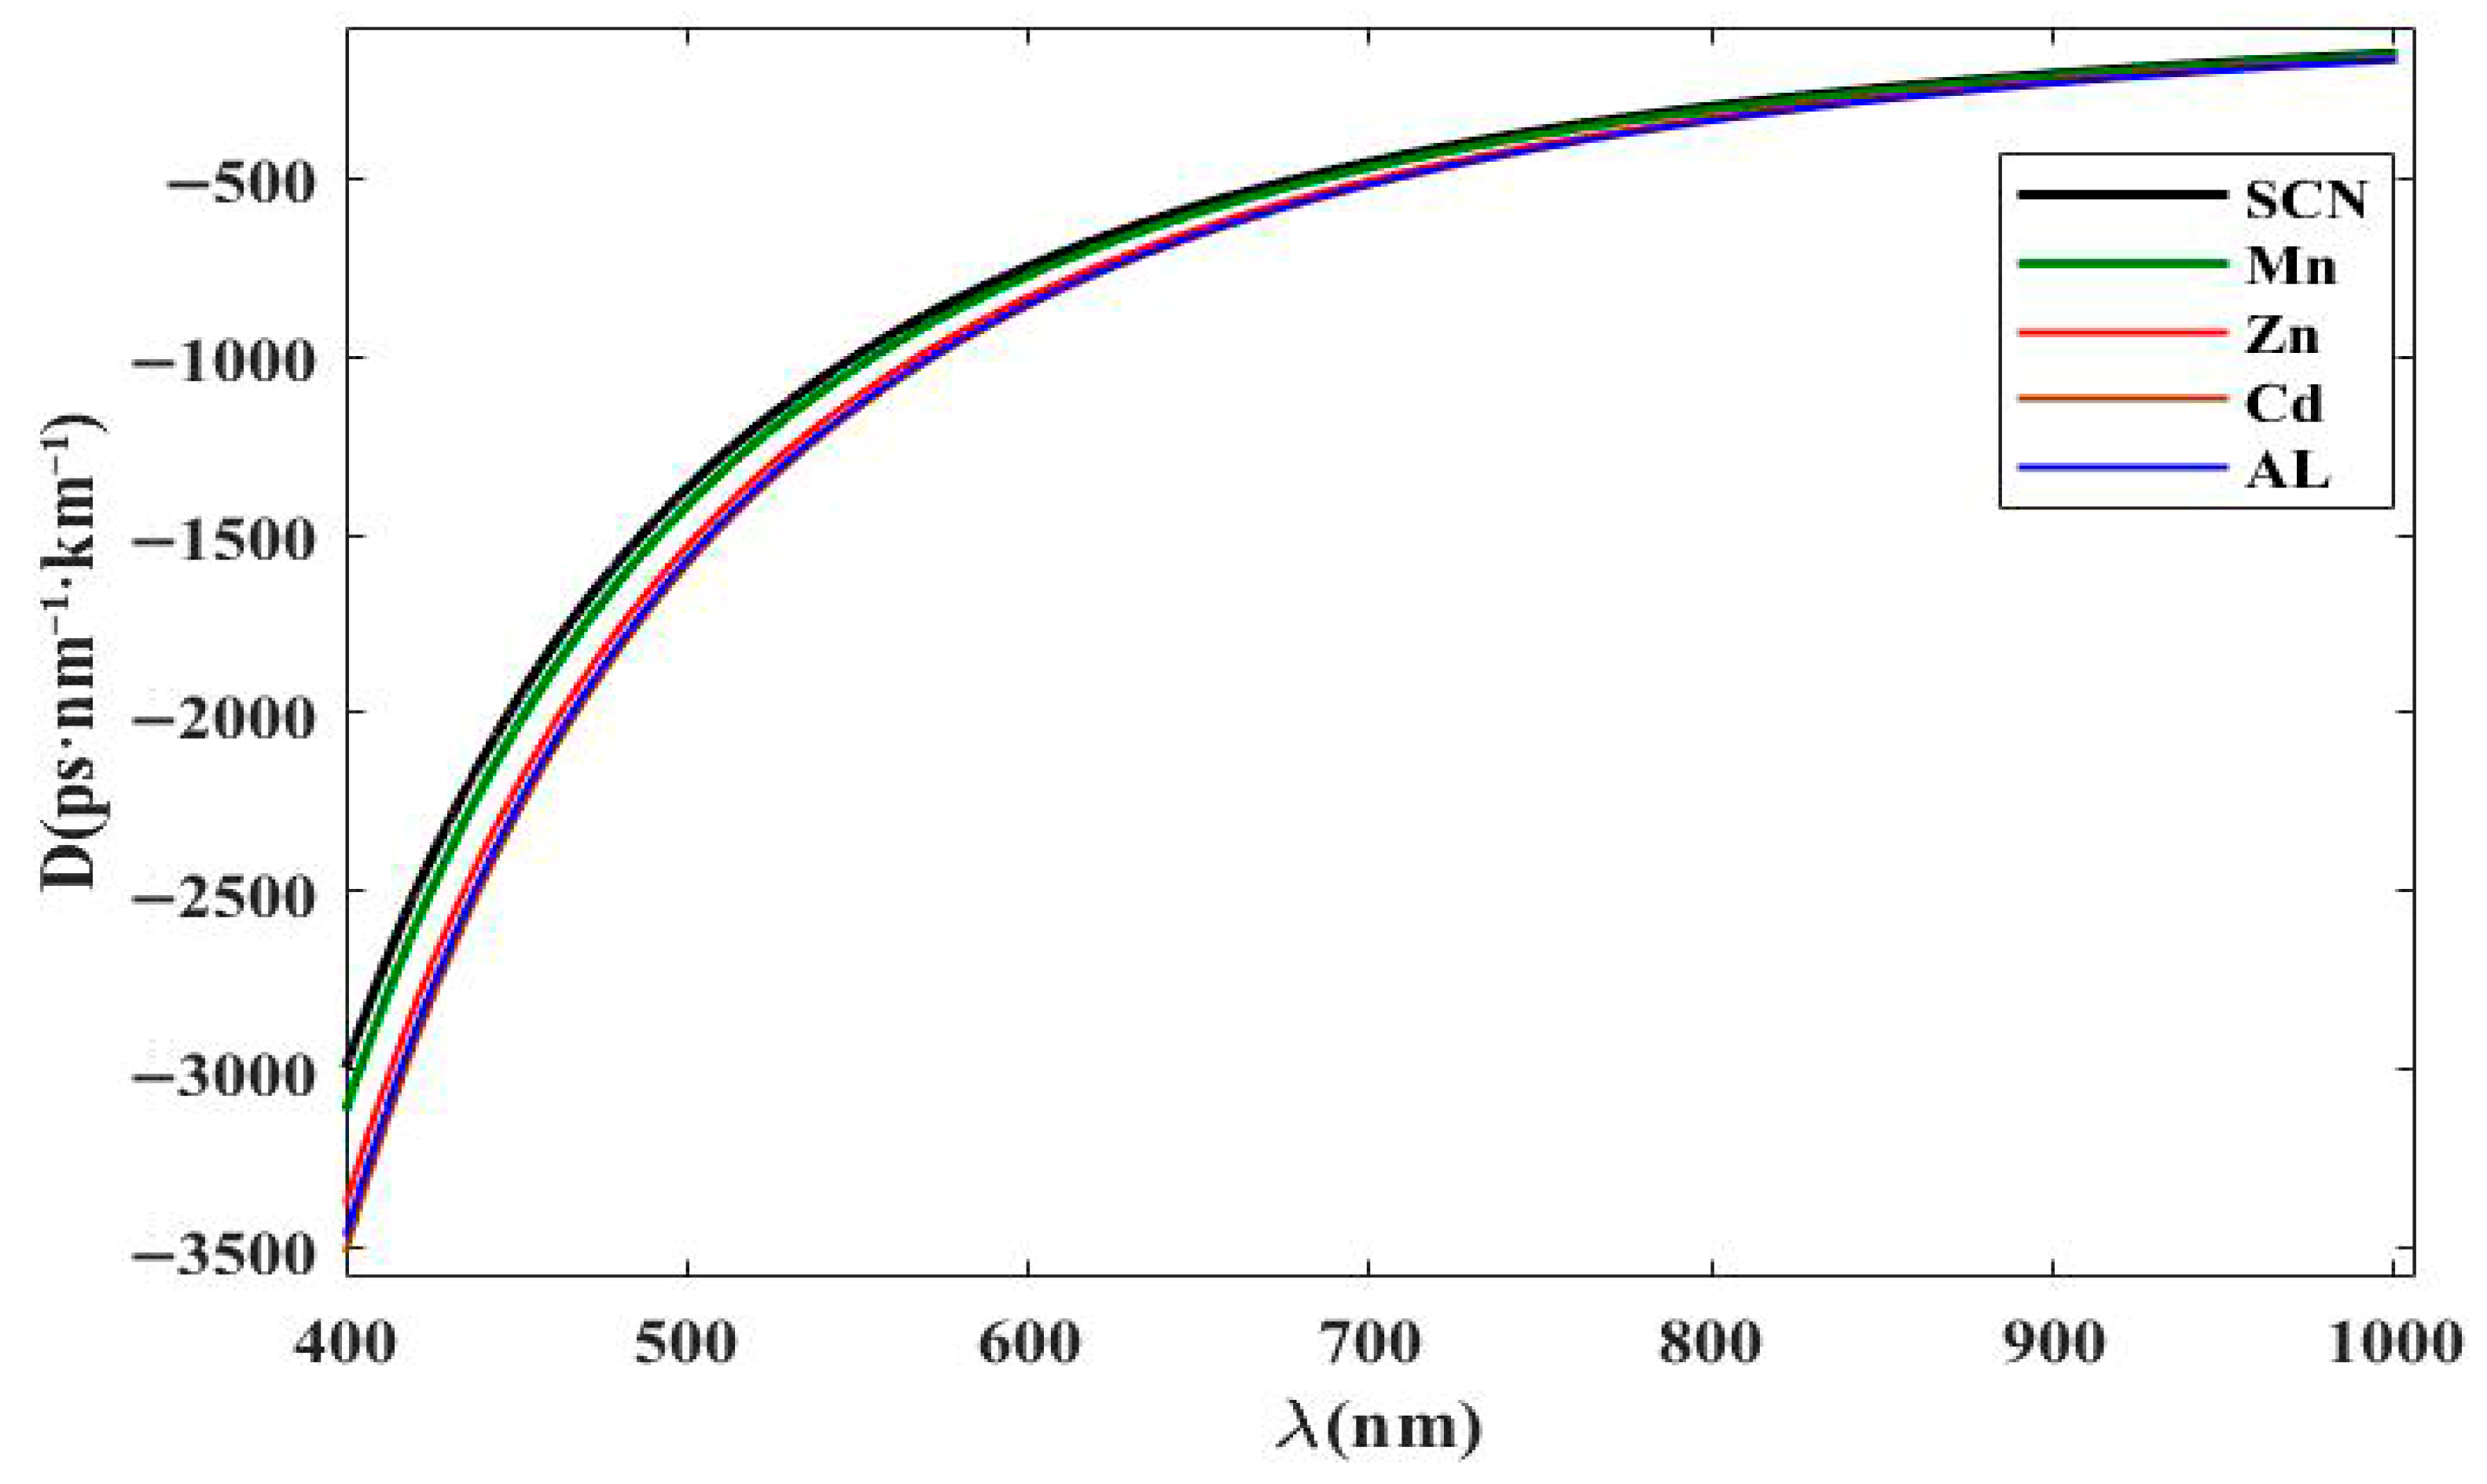
Figure 8 illustrates the influence of coordination anions containing transition metals and isothiocyanate groups on the dispersion parameter D. For the studied ILs, the D values lie within the range of –3500 to –80 ps·nm−1·km−1 over the spectral window of 400–1000 nm, consistent with typical dispersion behavior in this region. At 400 nm, the strongest dispersion effect is observed for [BMIM][SCN], which exhibits the largest absolute D value (approximately –3479 ps·nm−1·km−1), followed closely by [BMIM]4[Mn(SCN)6] and [BMIM]2[Cd(SCN)4], with values around –3350 ps·nm−1·km−1. The compounds based on Zn and Al, such as [BMIM]2[Zn(SCN)4] and [BMIM]3[Al(SCN)6], show slightly less negative values, near –3142 ps·nm−1·km−1, indicating weaker dispersion compared to SCN.
It can be seen that the results show a marked influence of coordination interactions involving the SCN− ligand and the transition metal centers on the dispersion parameter. Since it has been identified that the thiocyanate anion is a common component in all of the systems under investigation, it can also be seen that the variation in the dispersion parameter D is due to a variation in the coordination interactions between SCN− and the metal ions. Thiocyanate is a sulfur-containing ligand known to be highly polarizable; it can coordinate to a transition metal center through both sulfur and nitrogen atoms. Coordination of such a ligand to a transition metal center has a marked influence on the local electronic environment as well as the charge distribution within an ionic liquid, thereby affecting the overall density of polarizability as well as the optical dispersion effects. As a result, it can also be seen that the optical dispersion effects in the transition metal complexes (Mn, Cd, Zn, and Al) are different from those of the ionic liquid due to a variation in coordination interactions involving the thiocyanate anion in the ionic liquid structure.
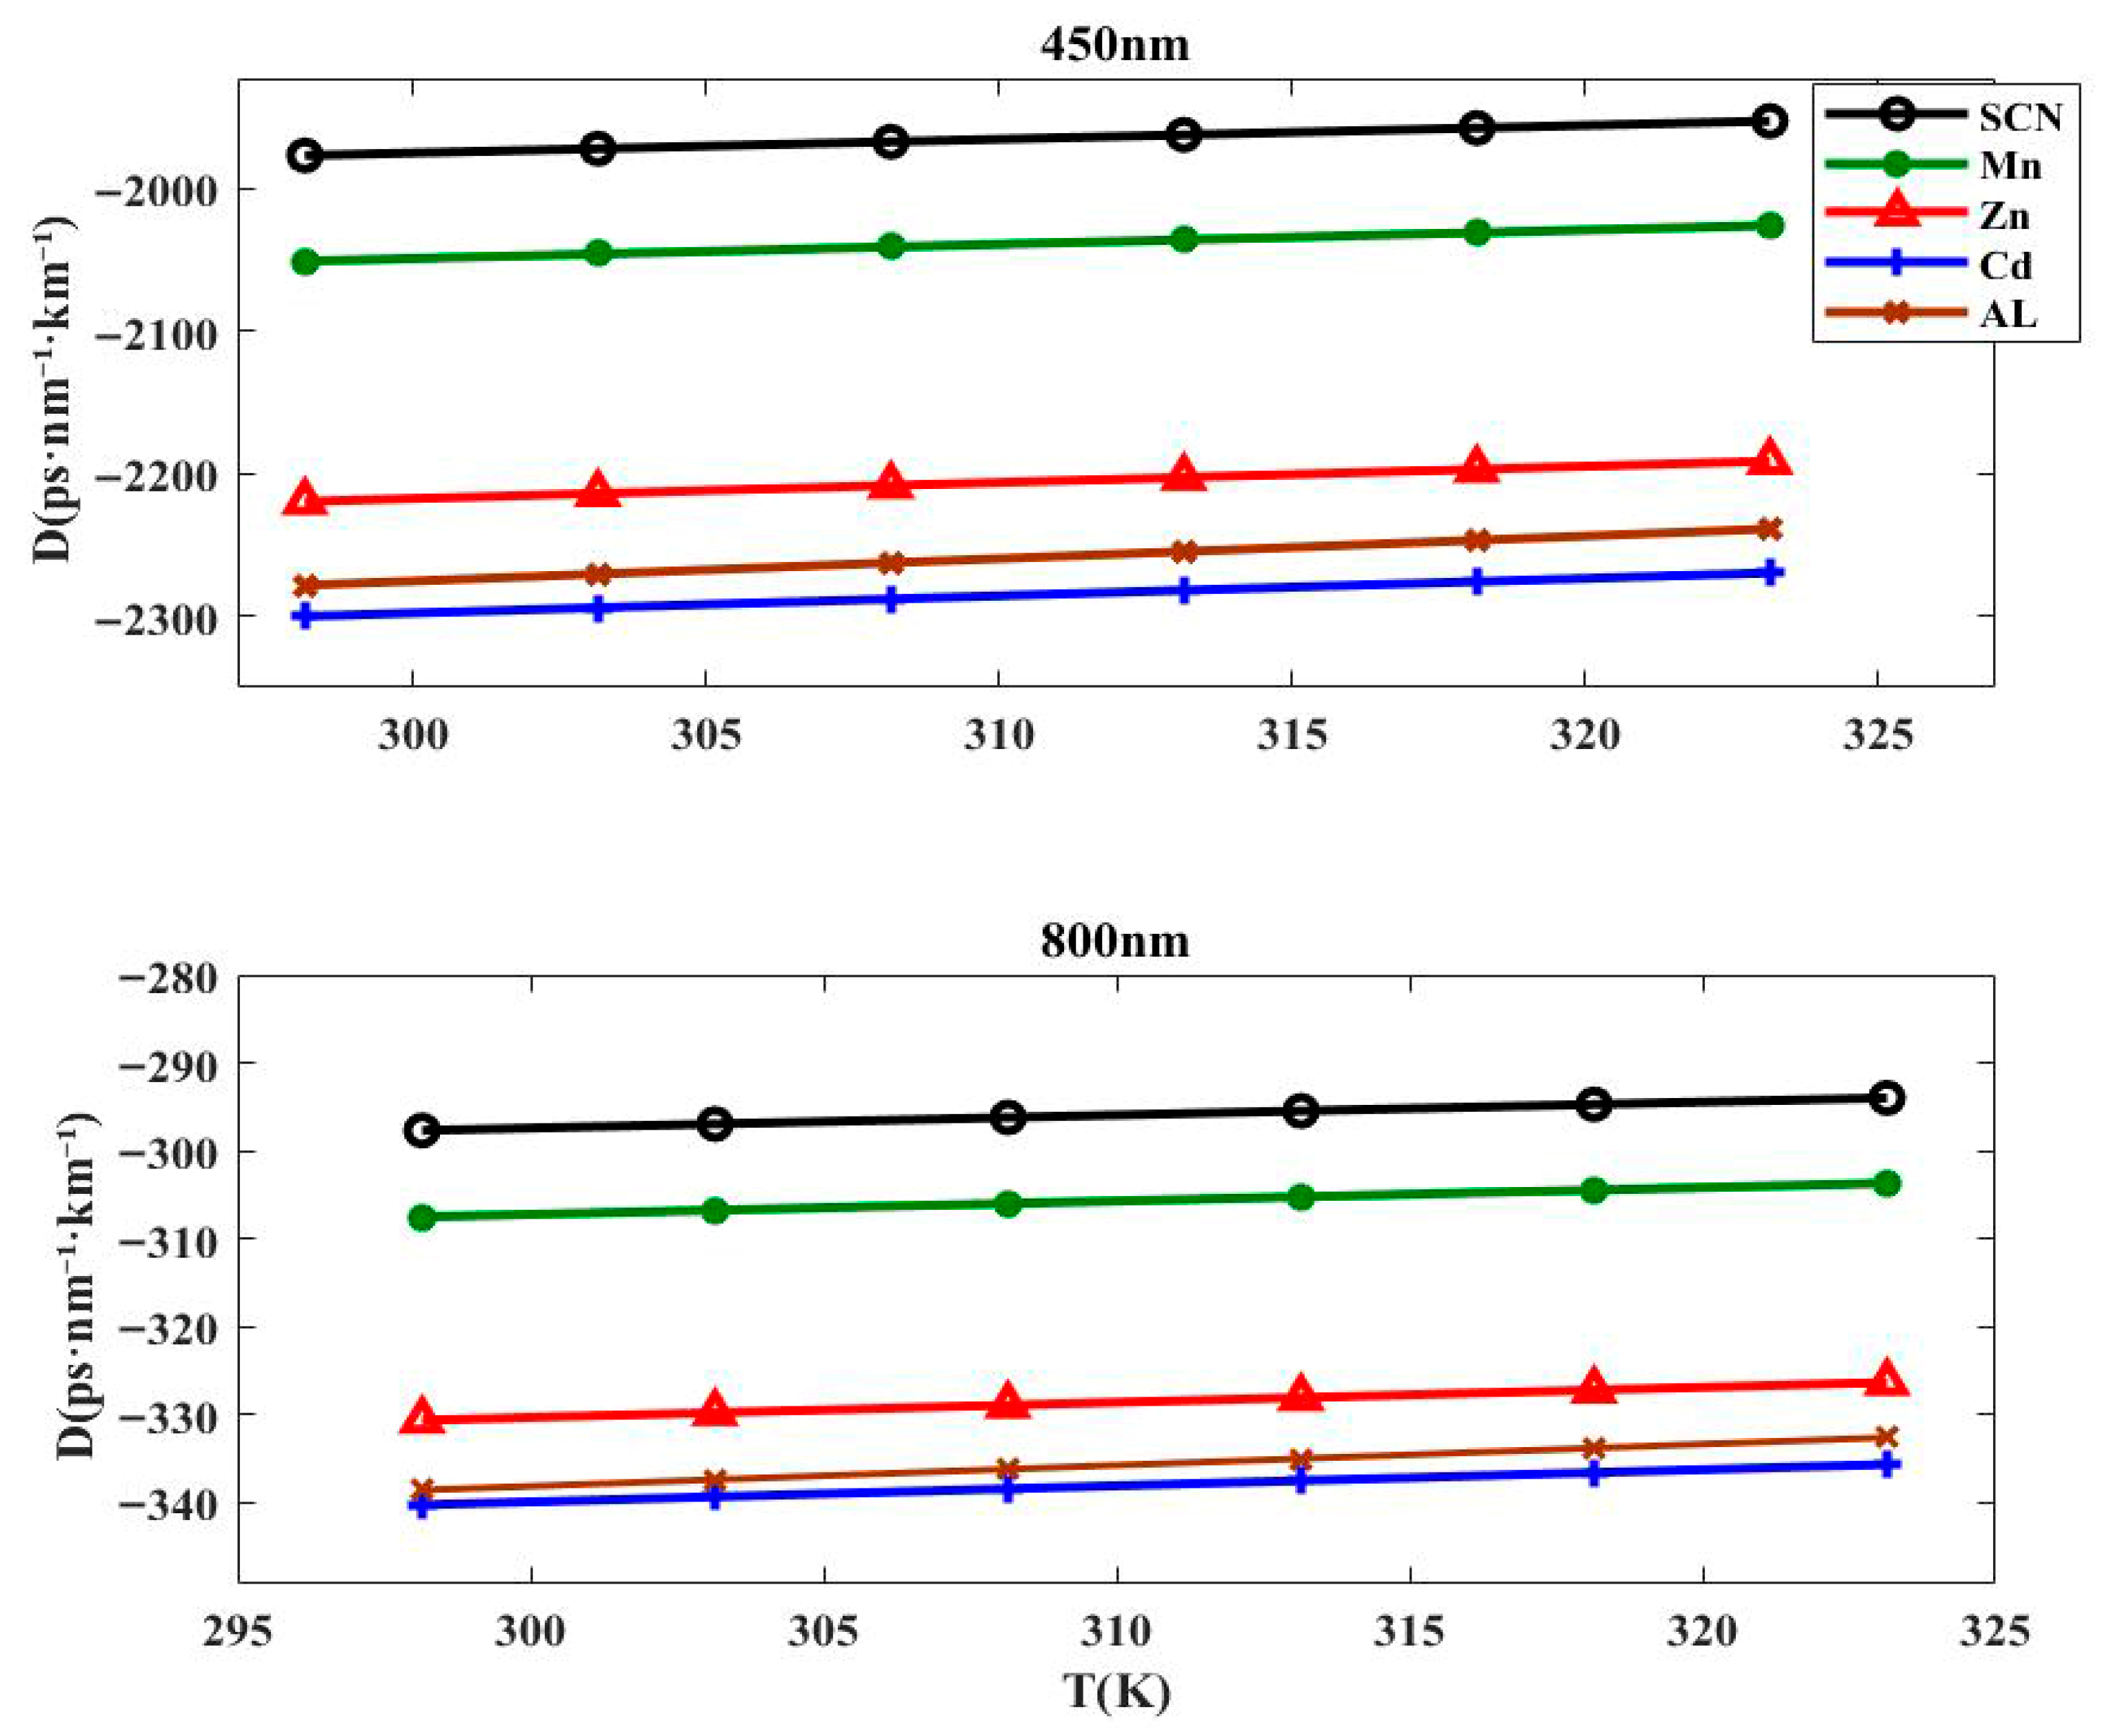
The dispersion parameter (D) was further examined at two distinct spectral points, 450 nm and 800 nm, as shown in Figure 9, to capture the influence of both wavelength and temperature on the optical behavior of [BMIM][SCN] and its Al, Cd, Zn, and Mn complexes. At 450 nm, all systems exhibit strong negative dispersion with values ranging between approximately −1900 and −2300 ps·nm−1·km−1, whereas at 800 nm the dispersion is weaker, ranging between −300 and −340 ps·nm−1·km−1. In both cases, dispersion becomes slightly less negative with increasing temperature, indicating a modest thermal softening of chromatic dispersion. A distinct ranking pattern clearly appears according to which the highest absolute dispersion values are revealed by the Zn- and Al-coordinated systems, followed by an intermediate ranking of Cd, while the Mn-coordinated system and the neat IL form the weakest dispersion response. The above observations clearly confirm that the dispersion property of the IL under investigation depends significantly on both the location of the spectra as well as the coordinating metal ions. This dependence is more prominent in the blue part of the spectra.

4. Conclusions

This work systematically examined the optical dispersion and thermo-optic behavior of [BMIM][SCN] and its transition metal–thiocyanate complexes across 400–1000 nm and 298–323 K. All samples exhibited normal dispersion, with the refractive index decreasing monotonically as a function of the wavelength. Coordination with Al3+, Cd2+, Zn2+, and Mn2+ generated a clear refractive index hierarchy, nAl > nCd ≳ nZn > nMn > nSCN, arising from cooperative contributions of metal-centered polarizability and coordination-induced modifications in density and electronic structure. Thermal measurements confirmed uniformly negative thermo-optic coefficients, with [BMIM]3[Al(SCN)6] displaying the highest temperature sensitivity. Abbe number analysis revealed a predictable index–dispersion trade-off, separating the systems into high-index/high-dispersion (Al/Cd/Zn) and lower-index/low-dispersion (Mn/[BMIM][SCN]) regimes. Group index evaluations further showed that dispersion-related transport parameters exhibited reduced temperature dependence relative to n(T), emphasizing their relative thermal stability. Overall, the results demonstrate that transition metal coordination provides a tunable design pathway for engineering the refractive index, chromatic dispersion, and thermo-optic response in thiocyanate-based ILs. These findings offer practical guidance for the deployment of such materials in thermal lenses, tunable refractive elements, and dispersion-managed photonic components. While the current work focused on optical dispersion properties and thermo-optic behavior, other related transport properties such as viscosity and ionic conductivity might also have a major role to play in the practical applications of the material, which will be explored in the future. Future work will explore alternative ligand chemistries, device-level integration, and the extension of measurements into the mid-infrared region to broaden application relevance.

Author Contributions

Resources, B.S.A. and A.S.A., Conceptualization, B.S.A., Methodology, B.S.A., M.A.T. and A.S.A., Software, B.S.A., Formal Analysis, B.S.A., M.A., M.A.T. and A.S.A., Writing—Original Draft, B.S.A., Writing—Review & Editing, A.A.A., A.F.K., M.A.T. and D.A.D., Visualization, B.S.A., Data Curation, B.S.A., A.A.A. and D.A.D., Validation, B.S.A., A.F.K., M.A. and A.S.A. All authors have read and agreed to the published version of the manuscript.

Funding

This research received no external funding.

Data Availability Statement

The original contributions presented in this study are included in the article. Further inquiries can be directed to the corresponding author.

Conflicts of Interest

The authors declare no conflict of interest.

References

  1. Chiappe, C.; Margari, P.; Mezzetta, A.; Pomelli, C.S.; Koutsoumpos, S.; Papamichael, M.; Giannios, P.; Moutzouris, K. Temperature effects on the viscosity and the wavelength-dependent refractive index of imidazolium-based ionic liquids with a phosphorus-containing anion. Phys. Chem. Chem. Phys. 2017, 19, 8201–8209. [Google Scholar] [PubMed]
  2. Chiappe, C.; Pieraccini, D. Ionic liquids: Solvent properties and organic reactivity. J. Phys. Org. Chem. 2005, 18, 275–297. [Google Scholar]
  3. Hallett, J.P.; Welton, T. Room-temperature ionic liquids: Solvents for synthesis and catalysis. Chem. Rev. 2011, 111, 3508–3576. [Google Scholar] [CrossRef]
  4. Baker, G.A.; Baker, S.N.; Pandey, S.; Bright, F.V. An analytical view of ionic liquids. Analyst 2005, 130, 800–808. [Google Scholar]
  5. Lei, Z.; Chen, B.; Koo, Y.-M.; MacFarlane, D.R. Introduction: Ionic Liquids; ACS Publications: Washington, DC, USA, 2017; pp. 6633–6635. [Google Scholar]
  6. Holbrey, J.D.; Chen, J.; Turner, M.B.; Swatloski, R.P.; Spear, S.K.; Rogers, R.D. Applying Ionic Liquids for Controlled Processing of Polymer Materials; ACS Publications: Washington, DC, USA, 2005. [Google Scholar]
  7. Vander Hoogerstraete, T.; Onghena, B.; Binnemans, K. Homogeneous liquid–liquid extraction of metal ions with a functionalized ionic liquid. J. Phys. Chem. Lett. 2013, 4, 1659–1663. [Google Scholar] [CrossRef] [PubMed]
  8. Ben Hamida, M.B.; Ali, A.B.M.; Singh, N.S.S.; Mostafa, L. Optimization of MXene-based aqueous ionic liquids for solar systems using conventional and AI-based techniques. Sci. Rep. 2025, 15, 20565. [Google Scholar]
  9. Ragab, H.; Diab, N.S.; Khaled, A.M.; Aboelnaga, S.M.; Qasem, A.; Farea, M.O.; Morsi, M.A. Tailoring optical and electrical properties of hybrid polymer nanodielectrics: Synthesis and characterization of CuO/TiO2 nanoparticle-embedded HPMC/NaAlg blend. Ceram. Int. 2025, 51, 17302–17310. [Google Scholar]
  10. Arshad, M.N.; Thiagamani, S.M.K.; Jeyaguru, S.; Muthukumar, C.; Krishnasamy, S.; Subramaniam, J.; Khan, A.; Althomali, R.H. Experimental investigation on the mechanical and acoustic performance of hemp/kenaf hybrid composites: Influence of different stacking sequences. Polym. Compos. 2024, 45, 7484–7494. [Google Scholar] [CrossRef]
  11. Arosa, Y.; Rodríguez-Fernández, C.D.; Lago, E.L.; De la Fuente, R. Refractive Index in Ionic Liquids: Beyond the D Line. In Ionic Liquids-Recent Advances: Recent Advances; IntechOpen: London, UK, 2025; p. 25. [Google Scholar]
  12. Mallick, B.; Balke, B.; Felser, C.; Mudring, A. Dysprosium room-temperature ionic liquids with strong luminescence and response to magnetic fields. Angew. Chem. Int. Ed. 2008, 47, 7635–7638. [Google Scholar]
  13. Polyanskiy, M.N.; Pogorelsky, I.V.; Babzien, M.; Vodopyanov, K.L.; Palmer, M.A. Nonlinear refraction and absorption properties of optical materials for high-peak-power long-wave-infrared lasers. Opt. Mater. Express 2024, 14, 696–714. [Google Scholar]
  14. Nóvoa-López, J.A.; Lago, E.L.; Seijas, J.A.; Vázquez-Tato, M.P.; Troncoso, J.; de la Fuente, R.; Salgueiro, J.R.; Michinel, H. Nonlinear absorption in ionic liquids with transition metallic atoms in the anion. Opt. Mater. 2016, 52, 144–149. [Google Scholar] [CrossRef]
  15. Nóvoa-López, J.; Michinel, H.; López-Lago, E. Ionic Liquids in Separation Technology; Elsevier: Amsterdam, The Netherlands, 2014. [Google Scholar]
  16. Lin, P.-H.; Hsieh, G.-W. Refractive, dielectric and conductivity characteristics of photopolymerized NOA65 doped with ionic liquid. J. Mol. Liq. 2024, 397, 124186. [Google Scholar] [CrossRef]
  17. Nóvoa-López, J.; Lago, E.L.; Domínguez-Pérez, M.; Troncoso, J.; Varela, L.; de la Fuente, R.; Cabeza, O.; Michinel, H.; Rodríguez, J. Thermal refraction in ionic liquids induced by a train of femtosecond laser pulses. Opt. Laser Technol. 2014, 61, 1–7. [Google Scholar] [CrossRef]
  18. Xie, Z.; Zhao, T.; Yu, X.; Wang, J. Nonlinear optical properties of 2D materials and their applications. Small 2024, 20, 2311621. [Google Scholar] [CrossRef]
  19. Rudenko, V.; Tolochko, A.; Bugaychuk, S.; Zhulai, D.; Klimusheva, G.; Yaremchuk, G.; Mirnaya, T.; Garbovskiy, Y. Glass-Forming Ionic Liquid Crystal Gold–Carbon Nanocomposites with Ultrafast Optical Nonlinearity Sign Reversal. J. Compos. Sci. 2025, 9, 472. [Google Scholar]
  20. Ivanov, M.Y.; Surovtsev, N.V.; Fedin, M.V. Ionic liquid glasses: Properties and applications. Russ. Chem. Rev. 2022, 91, RCR5031. [Google Scholar] [CrossRef]
  21. Calixto, S.; Rosete-Aguilar, M.; Sanchez-Marin, F.J.; Torres-Rocha, O.L.; Martinez-Prado, E.M.; Calixto-Solano, M. Optofluidic compound lenses made with ionic liquids. In Applications of Ionic Liquids in Science and Technology; IntechOpen: London, UK, 2011. [Google Scholar]
  22. Fröba, A.P.; Kremer, H.; Leipertz, A. Density, refractive index, interfacial tension, and viscosity of ionic liquids [EMIM][EtSO4],[EMIM][NTf2],[EMIM][N(CN)2], and [OMA][NTf2] in dependence on temperature at atmospheric pressure. J. Phys. Chem. B 2008, 112, 12420–12430. [Google Scholar] [CrossRef]
  23. Arosa, Y.; Fernández, C.D.R.; Lago, E.L.; Amigo, A.; Varela, L.M.; Cabeza, O.; de la Fuente, R. Refractive index measurement of imidazolium based ionic liquids in the Vis-NIR. Opt. Mater. 2017, 73, 647–657. [Google Scholar] [CrossRef]
  24. Lago, E.L.; Seijas, J.A.; de Pedro, I.; Fernández, J.R.; Vázquez-Tato, M.P.; González, J.A.; Rilo, E.; Segade, L.; Cabeza, O.; Fernández, C.D.R.; et al. Structural and physical properties of a new reversible and continuous thermochromic ionic liquid in a wide temperature interval: [BMIM]4[Ni(NCS)6]. New J. Chem. 2018, 42, 15561–15571. [Google Scholar] [CrossRef]
  25. Esmaeili, A.; Hekmatmehr, H.; Atashrouz, S.; Madani, S.A.; Pourmahdi, M.; Nedeljkovic, D.; Hemmati-Sarapardeh, A.; Mohaddespour, A. Insights into modeling refractive index of ionic liquids using chemical structure-based machine learning methods. Sci. Rep. 2023, 13, 11966. [Google Scholar] [CrossRef] [PubMed]
  26. Domańska, U.; Laskowska, M.; Pobudkowska, A. Phase equilibria study of the binary systems (1-butyl-3-methylimidazolium thiocyanate ionic liquid + organic solvent or water). J. Phys. Chem. B 2009, 113, 6397–6404. [Google Scholar]
  27. Domańska, U.; Laskowska, M. Measurements of activity coefficients at infinite dilution of aliphatic and aromatic hydrocarbons, alcohols, thiophene, tetrahydrofuran, MTBE, and water in ionic liquid [BMIM][SCN] using GLC. J. Chem. Thermodyn. 2009, 41, 645–650. [Google Scholar] [CrossRef]
  28. Bahadur, I.; Letcher, T.M.; Singh, S.; Redhi, G.G.; Venkatesu, P.; Ramjugernath, D. Excess molar volumes of binary mixtures (an ionic liquid + water): A review. J. Chem. Thermodyn. 2015, 82, 34–46. [Google Scholar] [CrossRef]
  29. Domańska, U.; Laskowska, M. Temperature and composition dependence of the density and viscosity of binary mixtures of {1-butyl-3-methylimidazolium thiocyanate + 1-alcohols}. J. Chem. Eng. Data 2009, 54, 2113–2119. [Google Scholar] [CrossRef]
  30. Domanska, U.; Królikowska, M. Density and viscosity of binary mixtures of {1-butyl-3-methylimidazolium thiocyanate + 1-heptanol, 1-octanol, 1-nonanol, or 1-decanol}. J. Chem. Eng. Data 2010, 55, 2994–3004. [Google Scholar]
  31. Bagheri, A.; Mirbakhshi, S.A. Study of the surface properties and surface concentration of ionic liquid–alcohol mixtures. Phys. Chem. Liq. 2016, 54, 529–541. [Google Scholar] [CrossRef]
  32. Panja, S.K.; Kumar, S. Weak intra and intermolecular interactions via aliphatic hydrogen bonding in piperidinium based ionic Liquids: Experimental, topological and molecular dynamics studies. J. Mol. Liq. 2023, 375, 121354. [Google Scholar] [CrossRef]
  33. Neves, C.M.; Kurnia, K.A.; Coutinho, J.A.P.; Marrucho, I.M.; Lopes, J.N.C.; Freire, M.G.; Rebelo, L.P.N. Systematic study of the thermophysical properties of imidazolium-based ionic liquids with cyano-functionalized anions. J. Phys. Chem. B 2013, 117, 10271–10283. [Google Scholar] [CrossRef] [PubMed]
  34. Domańska, U.; Królikowska, M.; Królikowski, M. Phase behaviour and physico-chemical properties of the binary systems {1-ethyl-3-methylimidazolium thiocyanate, or 1-ethyl-3-methylimidazolium tosylate + water, or+ an alcohol}. Fluid Phase Equilibria 2010, 294, 72–83. [Google Scholar]
  35. Ficke, L.E.; Novak, R.R.; Brennecke, J.F. Thermodynamic and thermophysical properties of ionic liquid+ water systems. J. Chem. Eng. Data 2010, 55, 4946–4950. [Google Scholar] [CrossRef]
  36. Domańska, U.; Marciniak, A.; Królikowska, M.; Arasimowicz, M. Activity coefficients at infinite dilution measurements for organic solutes and water in the ionic liquid 1-hexyl-3-methylimidazolium thiocyanate. J. Chem. Eng. Data 2010, 55, 2532–2536. [Google Scholar] [CrossRef]
  37. Domanska, U.; Królikowska, M.; Arasimowicz, M. Phase equilibria of (1-hexyl-3-methylimidazolium thiocyanate + water, alcohol, or hydrocarbon) binary systems. J. Chem. Eng. Data 2010, 55, 773–777. [Google Scholar]
  38. Sanchez, L.G.; Espel, J.R.; Onink, F.; Meindersma, G.W.; de Haan, A.B. Density, viscosity, and surface tension of synthesis grade imidazolium, pyridinium, and pyrrolidinium based room temperature ionic liquids. J. Chem. Eng. Data 2009, 54, 2803–2812. [Google Scholar] [CrossRef]
  39. Mondal, A.; Balasubramanian, S. A refined all-atom potential for imidazolium-based room temperature ionic liquids: Acetate, dicyanamide, and thiocyanate anions. J. Phys. Chem. B 2015, 119, 11041–11051. [Google Scholar]
  40. Vadiyar, M.M.; Patil, S.K.; Bhise, S.C.; Ghule, A.V.; Han, S.; Kolekar, S.S. Improved Electrochemical Performance of a ZnFe2O4 Nanoflake-Based Supercapacitor Electrode by Using Thiocyanate-Functionalized Ionic Liquid Electrolytes. Eur. J. Inorg. Chem. 2015, 2015, 5832–5838. [Google Scholar]
  41. Ray, A.; Saruhan, B. Application of ionic liquids for batteries and supercapacitors. Materials 2021, 14, 2942. [Google Scholar] [CrossRef] [PubMed]
  42. Osada, I.; de Vries, H.; Scrosati, B.; Passerini, S. Ionic-liquid-based polymer electrolytes for battery applications. Angew. Chem. Int. Ed. 2016, 55, 500–513. [Google Scholar]
  43. Rosol, Z.P.; German, N.J.; Gross, S.M. Solubility, ionic conductivity and viscosity of lithium salts in room temperature ionic liquids. Green Chem. 2009, 11, 1453–1457. [Google Scholar] [CrossRef]
  44. Dharaskar, S.A.; Wasewar, K.L.; Varma, M.N.; Shende, D.Z. Synthesis, characterization, and application of 1-butyl-3-methylimidazolium thiocyanate for extractive desulfurization of liquid fuel. Environ. Sci. Pollut. Res. 2016, 23, 9284–9294. [Google Scholar]
  45. Deng, D.; Deng, X.; Li, K.; Fang, H. Protic ionic liquid ethanolamine thiocyanate with multiple sites for highly efficient NH3 uptake and NH3/CO2 separation. Sep. Purif. Technol. 2021, 276, 119298. [Google Scholar] [CrossRef]
  46. Wang, Z.; Wang, L.; Zhang, Y.; Guo, J.; Li, H.; Yan, F. Dye-sensitized solar cells based on cobalt-containing room temperature ionic liquid redox shuttles. RSC Adv. 2017, 7, 13689–13695. [Google Scholar] [CrossRef]
  47. Di Santo, A.; Pérez, H.; Echeverría, G.A.; Piro, O.E.; Iglesias, R.A.; Carbonio, R.E.; Altabef, A.B.; Gil, D.M. Exploring weak intermolecular interactions in thiocyanate-bonded Zn (II) and Cd (II) complexes with methylimidazole: Crystal structures, Hirshfeld surface analysis and luminescence properties. RSC Adv. 2018, 8, 23891–23902. [Google Scholar] [CrossRef]
  48. Cui, J.; Li, Y.; Chen, D.; Zhan, T.; Zhang, K. Ionic liquid-based stimuli-responsive functional materials. Adv. Funct. Mater. 2020, 30, 2005522. [Google Scholar]
  49. Zhang, H.; Zhang, C.; Vaziri, S.; Kenarangi, F.; Sun, Y. Microfluidic ionic liquid dye laser. IEEE Photonics J. 2020, 13, 1–8. [Google Scholar]
  50. Chen, L. Thermo-Optical Properties of Polymer Dispersed Liquid Crystals. Ph.D. Thesis, RMIT University, Melbourne, Australia, 2024. [Google Scholar]
  51. Fernández, C.D.R.; Arosa, Y.; Algnamat, B.; Lago, E.L.; de la Fuente, R. An experimental and computational study on the material dispersion of 1-alkyl-3-methylimidazolium tetrafluoroborate ionic liquids. Phys. Chem. Chem. Phys. 2020, 22, 14061–14076. [Google Scholar] [CrossRef]
  52. Algnamat, B.S.; Arosa, Y.; Lago, E.L.; de la Fuente, R. An inspection of the dispersive properties of imidazolium-based ionic liquids in the Vis-NIR. Opt. Mater. 2020, 102, 109764. [Google Scholar] [CrossRef]
  53. Arosa, Y.; Lago, E.L.; Varela, L.M.; de la Fuente, R. Spectrally resolved white light interferometry to measure material dispersion over a wide spectral band in a single acquisition. Opt. Express 2016, 24, 17303–17312. [Google Scholar] [CrossRef]
  54. Arosa, Y.; Algnamat, B.S.; Rodríguez, C.D.; Lago, E.L.; Varela, L.M.; de la Fuente, R. Modeling the temperature-dependent material dispersion of imidazolium-based ionic liquids in the VIS-NIR. J. Phys. Chem. C 2018, 122, 29470–29478. [Google Scholar] [CrossRef]
  55. Wilson, A.J.; Devasia, D.; Jain, P.K. Nanoscale optical imaging in chemistry. Chem. Soc. Rev. 2020, 49, 6087–6112. [Google Scholar] [CrossRef]
  56. Cabeza, O.; Varela, L.M.; Rilo, E.; Segade, L.; Domínguez-Pérez, M.; Ausín, D.; de Pedro, I.; Fernández, J.R.; González, J.; Vazquez-Tato, M.P.; et al. Synthesis, microstructure and volumetry of novel metal thiocyanate ionic liquids with [BMIM] cation. J. Mol. Liq. 2019, 283, 638–651. [Google Scholar] [CrossRef]
  57. Arosa, Y.; ELópez-Lago, E.; de la Fuente, R. Spectrally resolved white light interferometer for measuring dispersion in the visible and near infrared range. Measurement 2018, 122, 6–13. [Google Scholar] [CrossRef]
  58. de la Fuente, R. White light spectral interferometry as a spectrometer calibration tool. Appl. Spectrosc. 2014, 68, 525–530. [Google Scholar] [CrossRef] [PubMed]
Figure 1. Refractive index dispersion of [BMIM][SCN] and its coordinated metal–SCN complexes at 308 K (400–1000 nm). All samples exhibit normal dispersion (dn/dλ < 0). The visible-range index follows Al > Cd ≳ Zn > Mn > SCN, reflecting coordination-enhanced polarizability.
Sci 08 00069 g001
Figure 2. Temperature-dependent refractive index dispersion (298–323 K) for all ILs. Increasing temperature reduces n in every case, yielding negative thermo-optic behavior. The Al and Cd complexes show the strongest thermal sensitivity, indicating enhanced modulation of electronic resonance with temperature.
Sci 08 00069 g002
Figure 3. Refractive index at the sodium D-line (589.3 nm) as a function of temperature. Linear fits confirm negative thermo-optic coefficients, with magnitudes following Al > Cd ≳ Zn > Mn > SCN. Coordination therefore increases both refractive index and its temperature sensitivity.
Sci 08 00069 g003
Figure 4. Abbe diagram (nD vs. VD) for the investigated ILs at 298 K. The expected index–dispersion trade-off is observed: higher nD correlates with lower VD. Al-, Cd-, and Zn-coordinated systems cluster at high index/strong dispersion, whereas Mn and [BMIM][SCN] show lower index and reduced chromatic spread.
Sci 08 00069 g004
Figure 5. Wavelength-dependent thermo-optic coefficient (dn/dT) at 308 K. All values are negative and become less negative toward longer wavelengths, consistent with the Sellmeier model prediction. The strongest thermo-optic response occurs for [BMIM]3[Al(SCN)6], confirming coordination-driven thermal modulation.
Sci 08 00069 g005
Figure 6. Group index (ng) dispersion at 308 K derived from Sellmeier parameters. All liquids show ng > n due to normal dispersion. Coordination increases ng, with Al and Cd complexes yielding the highest values across most of the spectral window.
Sci 08 00069 g006
Figure 7. Temperature dependence of the group index at 589.3 nm. Changes in ng are small (≈10−5 K−1), indicating greater thermal stability in group-velocity behavior compared with n(T). Coordination increases ng but does not significantly affect its temperature dependence.
Sci 08 00069 g007
Figure 8. Dispersion parameter D as a function of wavelength at 308 K. All ILs show negative dispersion across the visible–NIR region. The magnitude of D decreases with λ, with Zn- and Al-coordinated systems showing the strongest dispersion and [BMIM][SCN] the weakest.
Sci 08 00069 g008
Figure 9. Dispersion parameter D at 450 nm and 800 nm as a function of temperature. Increasing temperature slightly reduces |D|, indicating thermal softening of chromatic dispersion. The ranking Al ≳ Zn > Cd > Mn > SCN is preserved at both wavelengths, confirming coordination-governed tunability.
Sci 08 00069 g009
Table 1. Names and abbreviations of the neat IL and transition metal–thiocyanate complexes.
Chemical NameCompound
1-Butyl-3-methylimidazolium thiocyanate[BMIM][SCN]
Bis(1-butyl-3-methylimidazolium) Hexathiocyanato Manganese[BMIM]4[Mn(SCN)6]
Bis(1-butyl-3-methylimidazolium) Tetrathiocyanato Cadmium[BMIM]2[Cd(SCN)4]
Bis(1-butyl-3-methylimidazolium) Tetrathiocyanato zincate[BMIM]2[Zn(SCN)4]
1-butyl-3-methylimidazolium hexathiocyanato aluminate (III)[BMIM]3[Al(SCN)6]
Table 2. Coefficients A, B, and λ U V 2 resulting from fitting of Sellmeier equation (Equation (2)) to the refractive index data of each IL.
IL λ u v 2 ( μ m 2 ) AB (K−1)
[BMIM][SCN]0.0164971.28867−0.0009057
[BMIM]4[Mn(SCN)6]0.0169881.32143−0.0009793
[BMIM]2[Zn(SCN)4]0.0182271.33593−0.0010252
[BMIM]2[Cd(SCN)4]0.0175891.35512−0.0010026
[BMIM]3[Al(SCN)6]0.0178281.36825−0.0013834
Disclaimer/Publisher’s Note: The statements, opinions and data contained in all publications are solely those of the individual author(s) and contributor(s) and not of MDPI and/or the editor(s). MDPI and/or the editor(s) disclaim responsibility for any injury to people or property resulting from any ideas, methods, instructions or products referred to in the content.