Review

Review on Exploring Machine Learning Classifiers in the Diagnosis of Chronic Kidney Disease

by
Sonam Bhandurge
1,
Kuldeep Sambrekar
1,
Rashmi Laxmikant Malghan
2,* and
Karthik M C Rao
2
1
Department of Computer Science and Engineering (Artificial Intelligence & Machine Learning), KLS, Gogte Institute of Technology (GIT), Visvesvaraya Technological University (VTU), Belagavi 590018, India
2
Manipal Institute of Technology, Manipal Academy of Higher Education, Manipal 576104, India
*
Author to whom correspondence should be addressed.
Submission received: 14 January 2026 / Revised: 15 February 2026 / Accepted: 25 February 2026 / Published: 24 March 2026

Abstract

Chronic kidney disease (CKD) is a global healthcare issue that highlights the need for early identification for better quality of life for patients. This study evaluates various machine learning (ML) classifiers on datasets from UCI and self-collected sources in search of the best methods for CKD classification. This review examines commonly used ML models like support vector machine, K-nearest neighbor, naïve Bayes, decision trees, random forest, logistic regression and boosting-based ensemble methods. The results demonstrated the highest performance of ensemble methods. Despite these promising results, challenges related to model integration and interpretability still exist. Transparent models that are reliable and efficient are suitable for enhancement of clinical application(s). By overcoming these challenges, the work highlights importance of ML for CKD detection and treatment paving the way for artificial intelligence (AI)-driven healthcare solutions that are both effective and trustworthy.

1. Introduction

The kidneys are an important pair of organs of the human body that play a vital role by purifying the blood by filtering impurities, excess fluids, waste, and other contaminants. The human body removes all the impurities, waste, and contaminants via urine. Additionally, the kidneys control the amount of acid, potassium, and salt content in the human body [1]. Furthermore, they generate hormones that influence blood pressure and cholesterol, assist with the development of bones, and manage the generation of blood cells [2]. Considering the importance of kidney functions, healthy ones are fundamental to a person’s good health. Kidney disease arises whenever they sustain damage accidentally or by themselves because of age and health, which damages their ability to eliminate waste efficiently. This damage would result in the accumulation of waste and problems with fluid balance within the human body [3]. Kidney disease may be acute (sudden onset) or chronic (gradual), and chronic forms can lead to permanent kidney failure [4]. Among all the kidney diseases, chronic kidney disease (CKD) is a major issue as it frequently remains undetected until it reaches more severe stages [5]. CKD usually has major impacts on various body parts. With the decline in kidney functions, there will be an accumulation of toxins, which result in symptoms that include drowsiness, vomiting, inflammation within legs and ankles and shortness of breath [6]. CKD leads to problems such as anemia, inadequate dietary intake, high cholesterol levels, weakened bones, blood pressure and even damage to nerves. This complication can further worsen the patient’s health condition, affecting the cardiovascular system and increasing the risk of heart attacks and strokes [7]. Millions of individuals around the world deal with CKD every year, making it a major public health issue. More than 850 million individuals worldwide are estimated to be impacted by various forms of kidney disease, with CKD impacting around 10% of the worldwide population [8]. Every year, millions of people die due to complications related to CKD. Earlier epidemiological reports estimated that CKD affected over 850 million individuals worldwide; however, recent GBD 2023 estimates provide updated global prevalence and mortality trends [9]. Hence, there is a need for better awareness, efficient treatment strategies, and immediate detection to address the growing challenge of CKD.
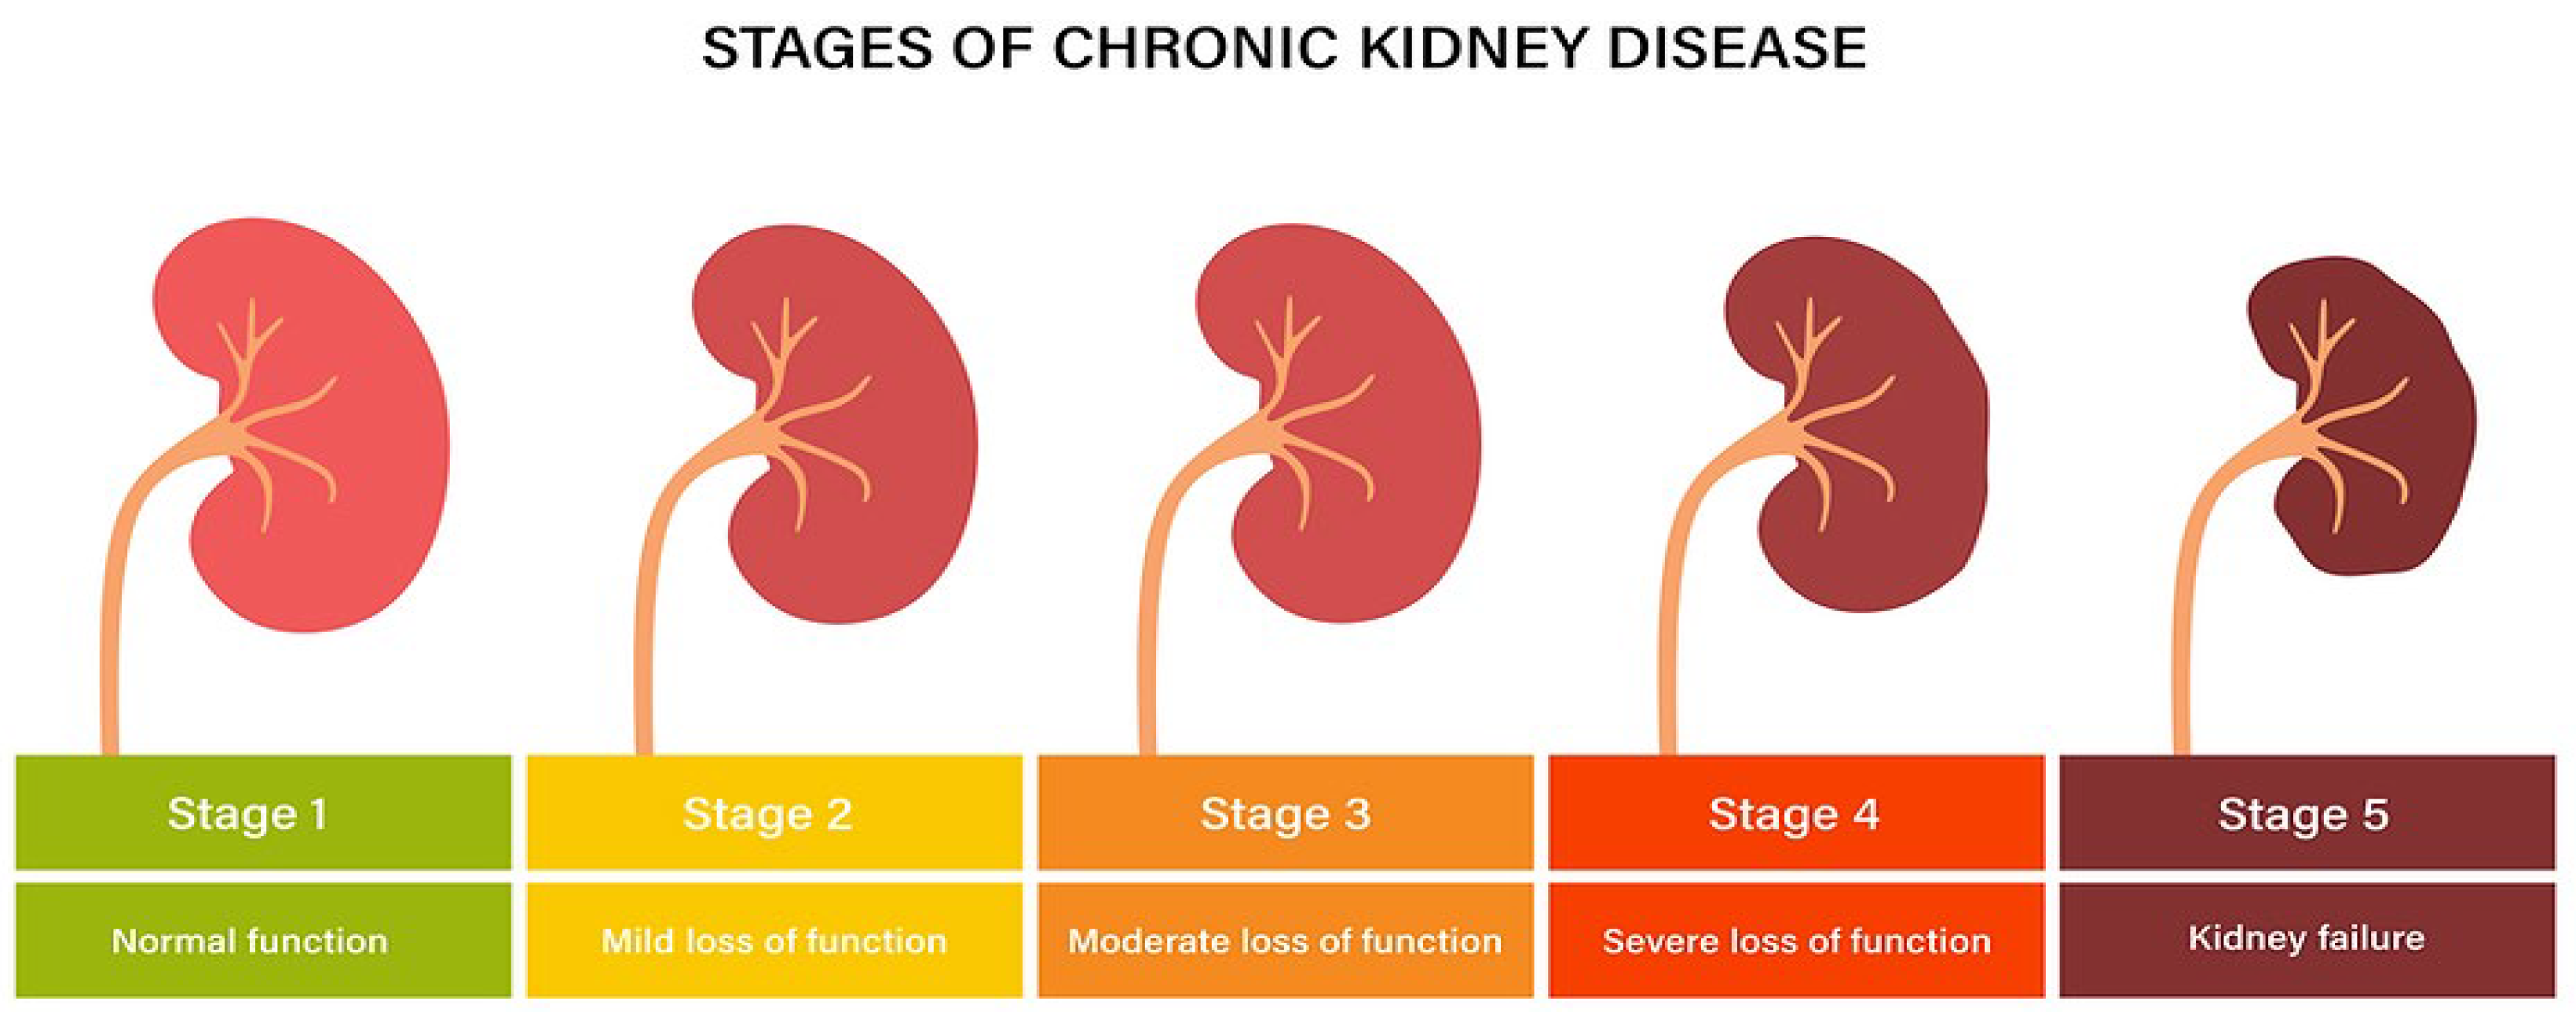
Advanced CKD results in end-stage renal disease (ESRD), which needs kidney transplant or dialysis to stay alive [10]. Figure 1 shows the various stages of CKD. The various risk factors that contribute to the development of CKD are cardiovascular conditions, excess weight, hypertension, and diabetes [11]. Hence, early identification of CKD is crucial in preventing its progression to ESRD. Early detection of CKD is often identified by regular tests for patients having diabetes and hypertension [12]. Lifestyle adjustments and pharmacological treatments for managing blood pressure and glucose levels can slow down ESRD [13]. Technological advances, especially in machine learning (ML), have helped the identification of many chronic illnesses, one of which is CKD [14,15,16]. ML approaches can evaluate a huge amount of data to uncover patterns linked to CKD, which helps in accurate and precise diagnosis [17,18]. ML approaches can evaluate multiple features, including medical records, lab tests, and patient information, to estimate the probability of an individual developing CKD [19]. This helps for early prediction, early actions, lowering medical expenses and enhancing the treatment of patients [20].
Hence, this work aims to evaluate existing ML approaches presented for detecting and predicting CKD. By reviewing recent advancements, methodology and application of ML in the field of CKD, it provides insights into how these technologies are being used to enhance management and identification of CKD. The contribution of this work includes a comprehensive analysis of existing ML models, their effectiveness in detecting and predicting CKD, and the challenges and opportunities for future research. This study highlights the potential of ML to transform CKD diagnosis and management, which leads to improving patients’ lifestyles. The manuscript is organized in the following way. In Section 2, a methodological overview of various studies is discussed in brief. In Section 3, a detailed review of ML classifiers is discussed, where different ML approaches are discussed in detail. In Section 4, findings from different studies are mentioned in detail. In Section 5, the issues, challenges and possible solutions are discussed in detail. Finally, in Section 6, the conclusion and future work are discussed.

2. Methodological Overview

2.1. Data Sources

Most of the studies used the UCI CKD dataset, which includes demographic parameters, laboratory values, and clinical attributes. There are studies that included independent hospital datasets. Hence, the dataset size varied significantly, thus influencing model robustness.

2.2. Data Preprocessing

Data preprocessing plays a critical role in the development of reliable ML models for CKD classification. Medical data or clinical samples often contain missing values, heterogeneous categorical attributes and redundant variables. If systematic preprocessing is not done, then model performance may be biased, unstable or misleading.

2.3. Handling Missing Values

Clinical datasets usually contain missing records due to unperformed laboratory tests or recording errors. Several studies [21] addressed missing data using statistical imputation techniques. The most common approach used was mean imputation for continuous variables and mode imputation for categorical attributes. Varied descriptions of the different ways studies have processed missing values reduce transparency and increase the difficulty of reproducibility and reliable evaluations of comparative model performance outcome evaluations.

2.4. Data Standardization

CKD datasets usually contain features measured on different scales, such as serum creatinine levels, blood pressure readings, and age. Distance-based classifiers like K-nearest neighbors and margin-based methods such as support vector machines [22] are particularly sensitive to feature scaling. To tackle this problem, a lot of researchers conducted min-max normalization, which scales variables to a bounded interval (typically 0 to 1), and Z-score standardization, which adjusts variables to zero mean and unit variance. Clinical datasets include categorical attributes such as sex, presence or absence of hypertension, and qualitative urine test results. Since most ML algorithms require numerical input, categorical features were transformed using encoding techniques. The most frequently used encoding strategies were binary encoding and one-hot encoding for multi-category attributes. Improper encoding may increase dimensionality, especially in small datasets, thus leading to an overfitting problem.

2.5. Parameter Selection

High-dimensional datasets containing numerous correlated variables can degrade model generalization. Feature reduction techniques were used by most studies to eliminate redundant parameters and improve computational efficiency. The various feature selection approaches used were correlation-based feature selection, information gain ranking, recursive feature elimination, wrapper-based selection methods and embedded methods integrated within tree-based classifiers. Certain research works have applied dimensionality reduction methods like principal component analysis (PCA). In addition to decreasing the dimensionality of the dataset, feature selection improves the interpretability.

2.6. Evaluation Methods

The effectiveness of ML models developed for CKD classification is measured using various evaluation metrics in the studies examined to provide a broad range of performance analysis. Reports of effectiveness are based on a single measure of the overall accuracy of correct predictions. Because medical datasets often have class imbalance issues, measures of performance that go beyond accuracy are also considered. Alongside accuracy, additional metrics that are often considered include sensitivity, specificity, recall, precision, and the F1 score. The detection of CKD cases is important, and sensitivity is the measure used to gauge the CKD case detection capability of the model. On the other hand, the detection of non-CKD cases is evaluated using specificity, which helps to alleviate false alarms in the clinical setting.
The evaluation of models by several studies using the ROC and the AUC is to evaluate the trade off from the true positives and false positives at various thresholds. The applicability and robustness of k-fold cross-validation have been widely documented in the training and testing of the model against multiple splits. Furthermore, the classification outcomes have been evaluated and documented using confusion matrices. The various metrics used for evaluation enable model comparisons to be performed evenly and provide a broad range of performance analysis.

3. Review of ML Classifiers

The review of ML classifiers on CKD prediction and detection explains various ML techniques that have been used to increase classification accuracy. Various traditional methods like K-nearest neighbor (KNN), support vector machine (SVM), logistic regression (LR), naïve Bayes (NB) and decision trees (DTs) have been widely used due to their simplicity. SVM is efficient to handle high-dimensional data. KNN is a straightforward approach to classification based on proximity. NB is important for its efficiency with categorical data, and DTs are popular for rule-based structure. LR remains a preferred method for binary classification problems that gives clear probabilistic interpretations. In recent years, ensemble learning methods like random forest (RF) and various other boosting approaches have gained importance. Aggregating multiple DTs gives an RF that provides robust predictions and reduces the risk of overfitting. Gradient boosting (GB), XGBoost (XGB), CatBoost (CB), AdaBoost (AB), and LightGBM (LGBM) are the boosting techniques that have increased CKD prediction and detection by focusing on improving model accuracy through iterative learning and combining weak learners into strong predictive models. These methods are good at capturing complex and nonlinear relationships. These relationships are within the data, which enhances the ability to predict CKD classification. Hence, this section discusses the different ML classifiers that have been presented recently for binary classification of CKD approaches.

3.1. Support Vector Machine

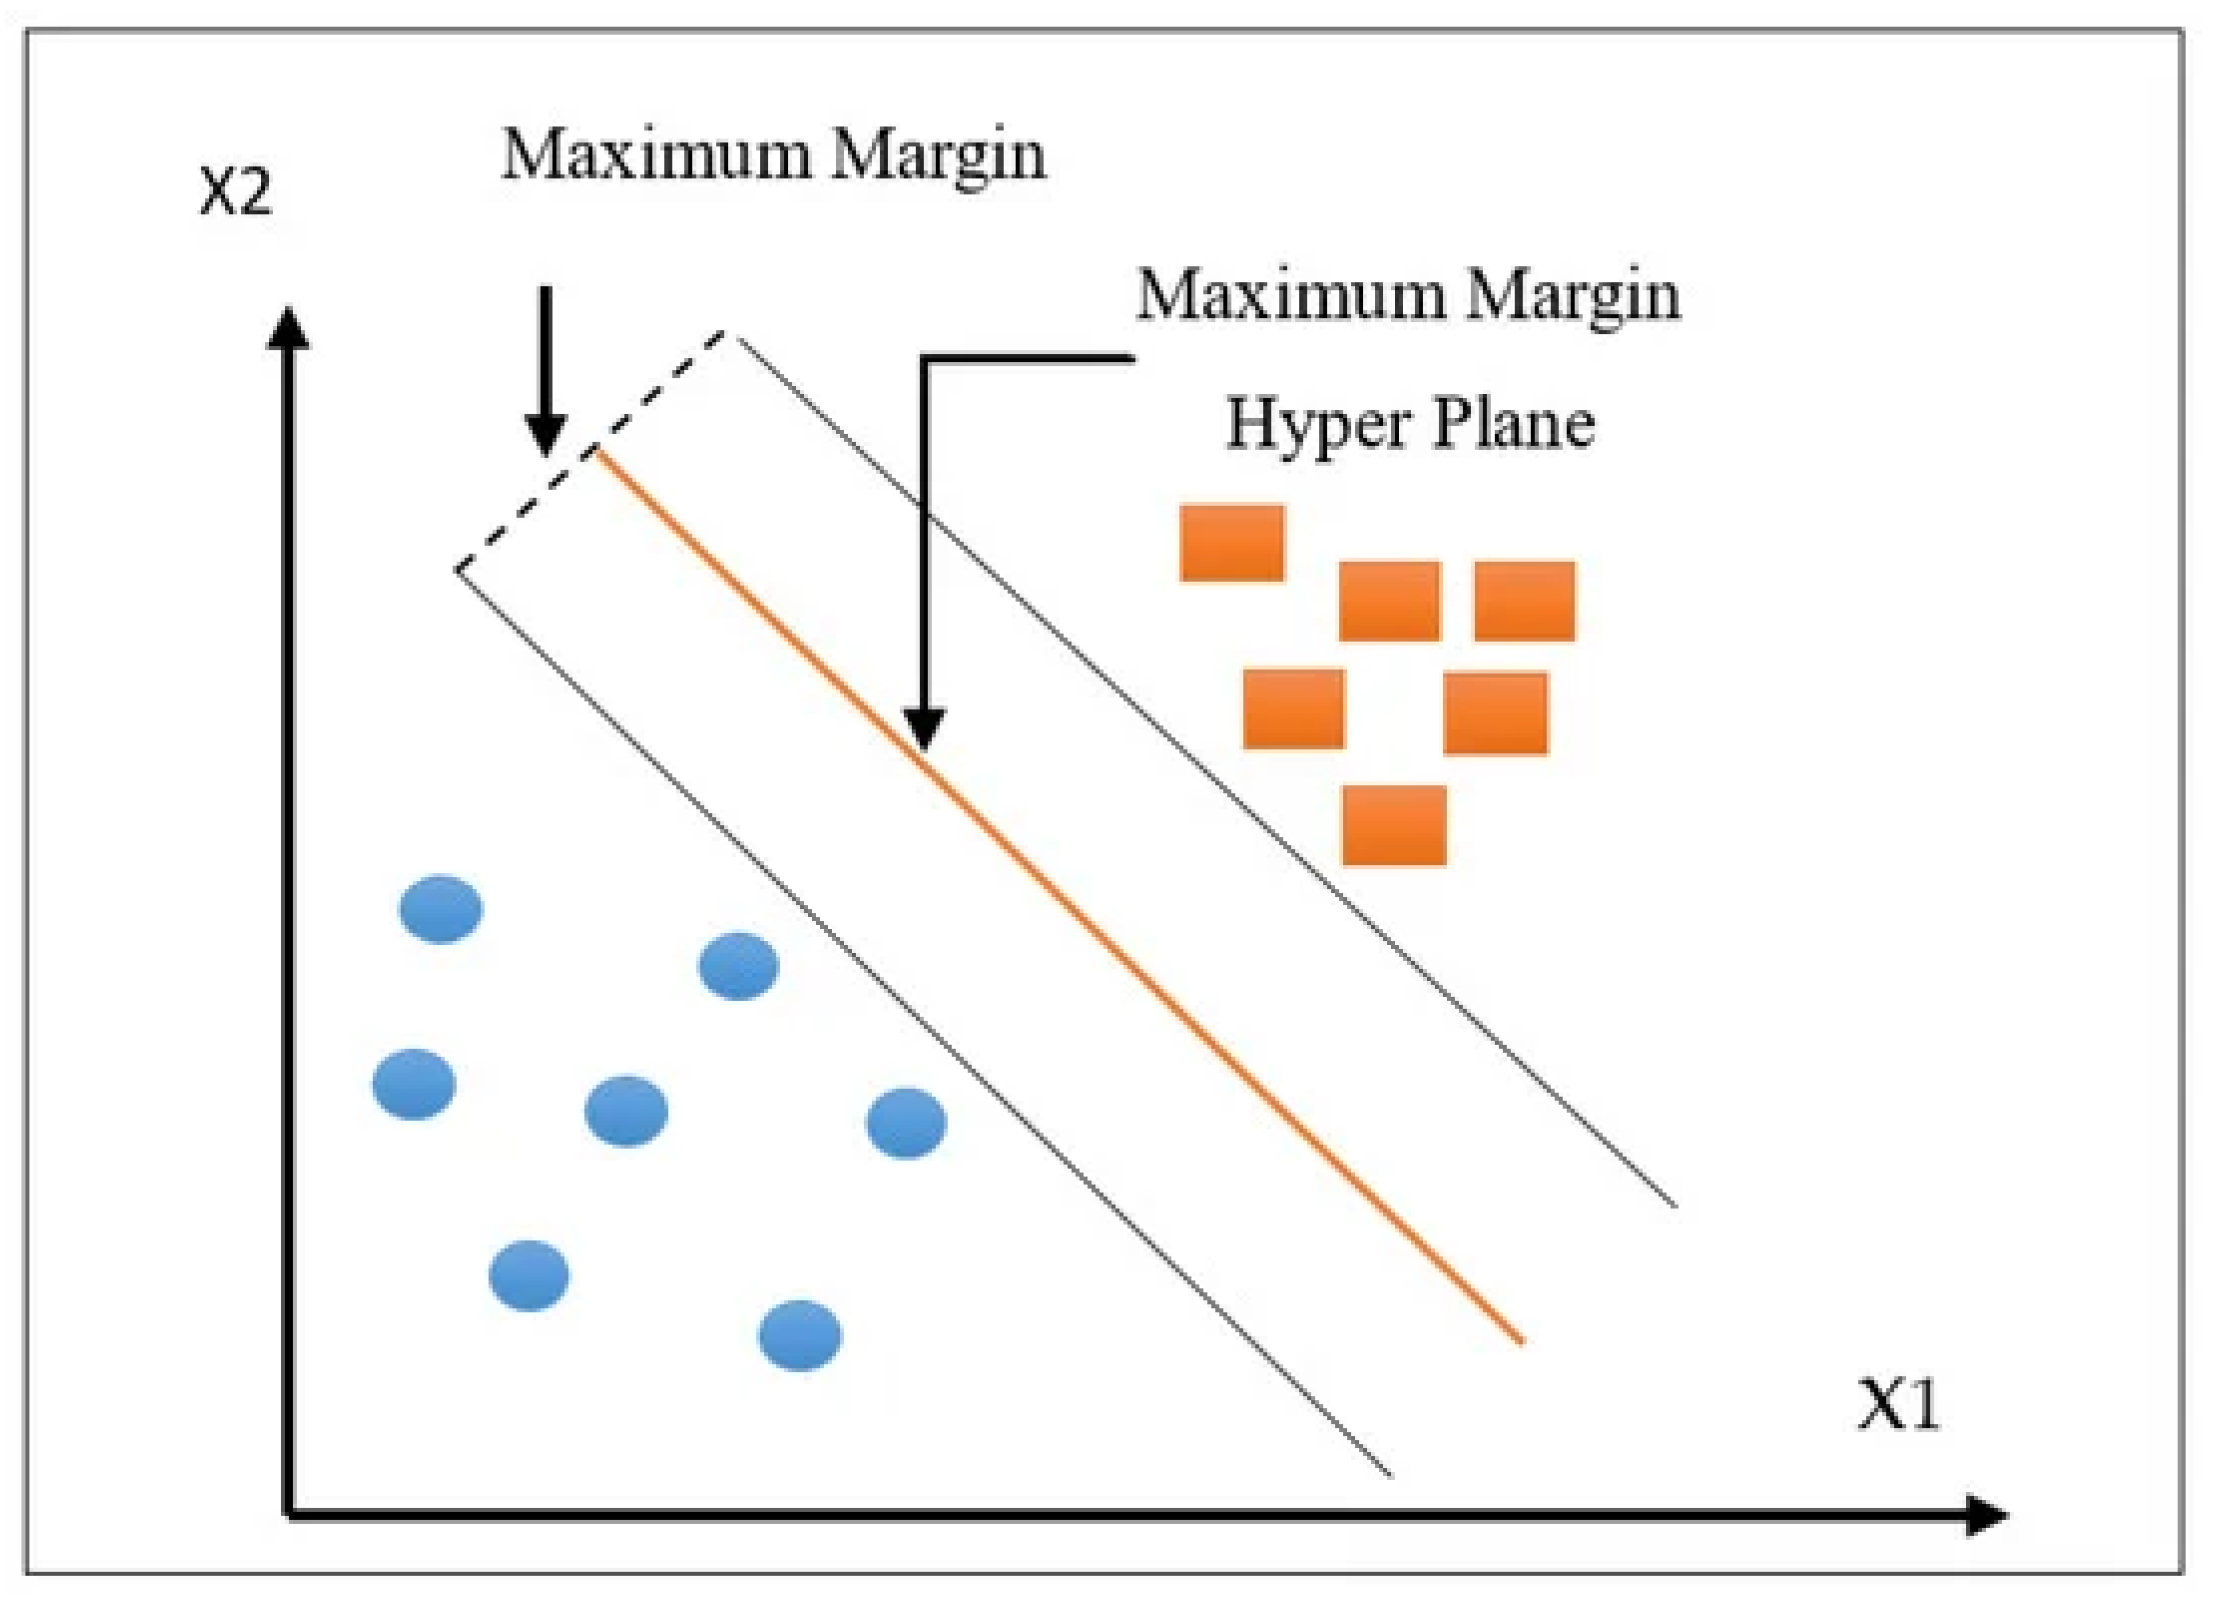
SVMs are highly effective ML models as they find the best hyper-plane that separates various classes within feature space for CKD classification and prediction and, hence, can accurately distinguish between CKD and not CKD. Figure 2 illustrates the basic structure of an SVM [21] used for binary classification. X1 and X2 represent two independent input features selected from the UCI dataset to illustrate the decision boundary of the classifier. It shows a two-dimensional feature space with two distinct classes represented by blue circles and orange squares. According to Figure 2, the SVM searches for the best hyper-plane (orange line) that divides the two classes. Moreover, the objective function of SVM is to maximize the margin, i.e., the distance among the hyper-plane and the nearest data-points from every class, called support vectors. Figure 2 highlights the “maximum margin”, which ensures that the SVM hyper-plane is positioned in such a manner that it maximizes separation among two classes, according to the dataset trained, hence improving the approach capability for generalizing new and unseen data. This margin maximization is central to the SVM’s effectiveness in classification tasks as it leads to better decision boundaries that minimize the risk of misclassification.
A. S. Shanthakumari et al. [22] aimed at combining different ML approaches and creating an ensemble approach for CKD prediction. Their work first converted all the CKD attributes into binary for training, then used the best first function for feature selection, trained the ML ensemble classifiers using the binary, and finally used unseen data for testing. Among the different ML ensemble approaches, ensemble SVM (ESVM) showed better performance for the Indian CKD dataset [23], the UCI CKD dataset [24], and the Kaggle CKD dataset [25], achieving 80%, 98.2%, and 98.8% accuracy, respectively. K. Harsha et al. [26] considered the UCI CKD dataset and divided data into a 75:25 ratio for training and testing, respectively. For predicting CKD, the authors presented an optimized SVM approach and compared outcomes with DT, where the optimized SVM achieved 96.3% accuracy. D. Swain et al. [27] considered the UCI dataset for predicting CKD. They used different pre-processing steps, i.e., the dataset was imputed wherever missing values were there, outliers were removed and the synthetic-minority oversampling technique (SMOTE) was used for handling class imbalance. For feature selection, they used a Chi-squared test and presented a hyper-tuned SVM for prediction, where the SVM achieved 99.3% accuracy for 10-fold cross-validation (CV). The findings also showed that RF achieved better accuracy for CKD prediction. H. Iftikhar et al. [28] used various ML models for CKD prediction, which included KNN, LR, RF, DT and various variants of SVM (radial-basis-kernel, Bessel, Laplacian and linear). For evaluating the performance of the ML model, they collected a CKD dataset from a hospital located in Buner, Khyber-Pakhtunkhwa, Pakistan. For effective prediction comparison with ML models, they conducted the Diebold and Mariano test for accurate prediction outcomes. Further, from findings, the SVM Laplace-kernel function achieved better results, i.e., 90.52% accuracy. E. Listiana et al. [29] created an ensemble approach using SVM and AB. They used information-gain (IG) for feature selection, and AB and SVM were combined to create an ensemble classifier. The UCI dataset was used for evaluation, where IG + AB + SVM achieved 99.75% accuracy for 10-fold CV. N. I. Md. Ashafuddula et al. [30] collected and built a real-world dataset, which was collected from Bangladeshi patients. They used PCA for reducing feature dimensionality, and a hyper-tuned SVM was used as the classifier. For evaluation, the UCI CKD dataset and the collected dataset were used, where 100% accuracy was achieved for both datasets. To better understand the performance, they merged the UCI CKD and collected datasets and evaluated them, finding 97.37% accuracy for the CKD prediction.
Limitations of SVM are as follows: no transparency, may not inspire trust in physicians, vulnerable to the choice of kernel and hyperparameters, and expensive in terms of computation if datasets are large.

3.2. K-Nearest Neighbors

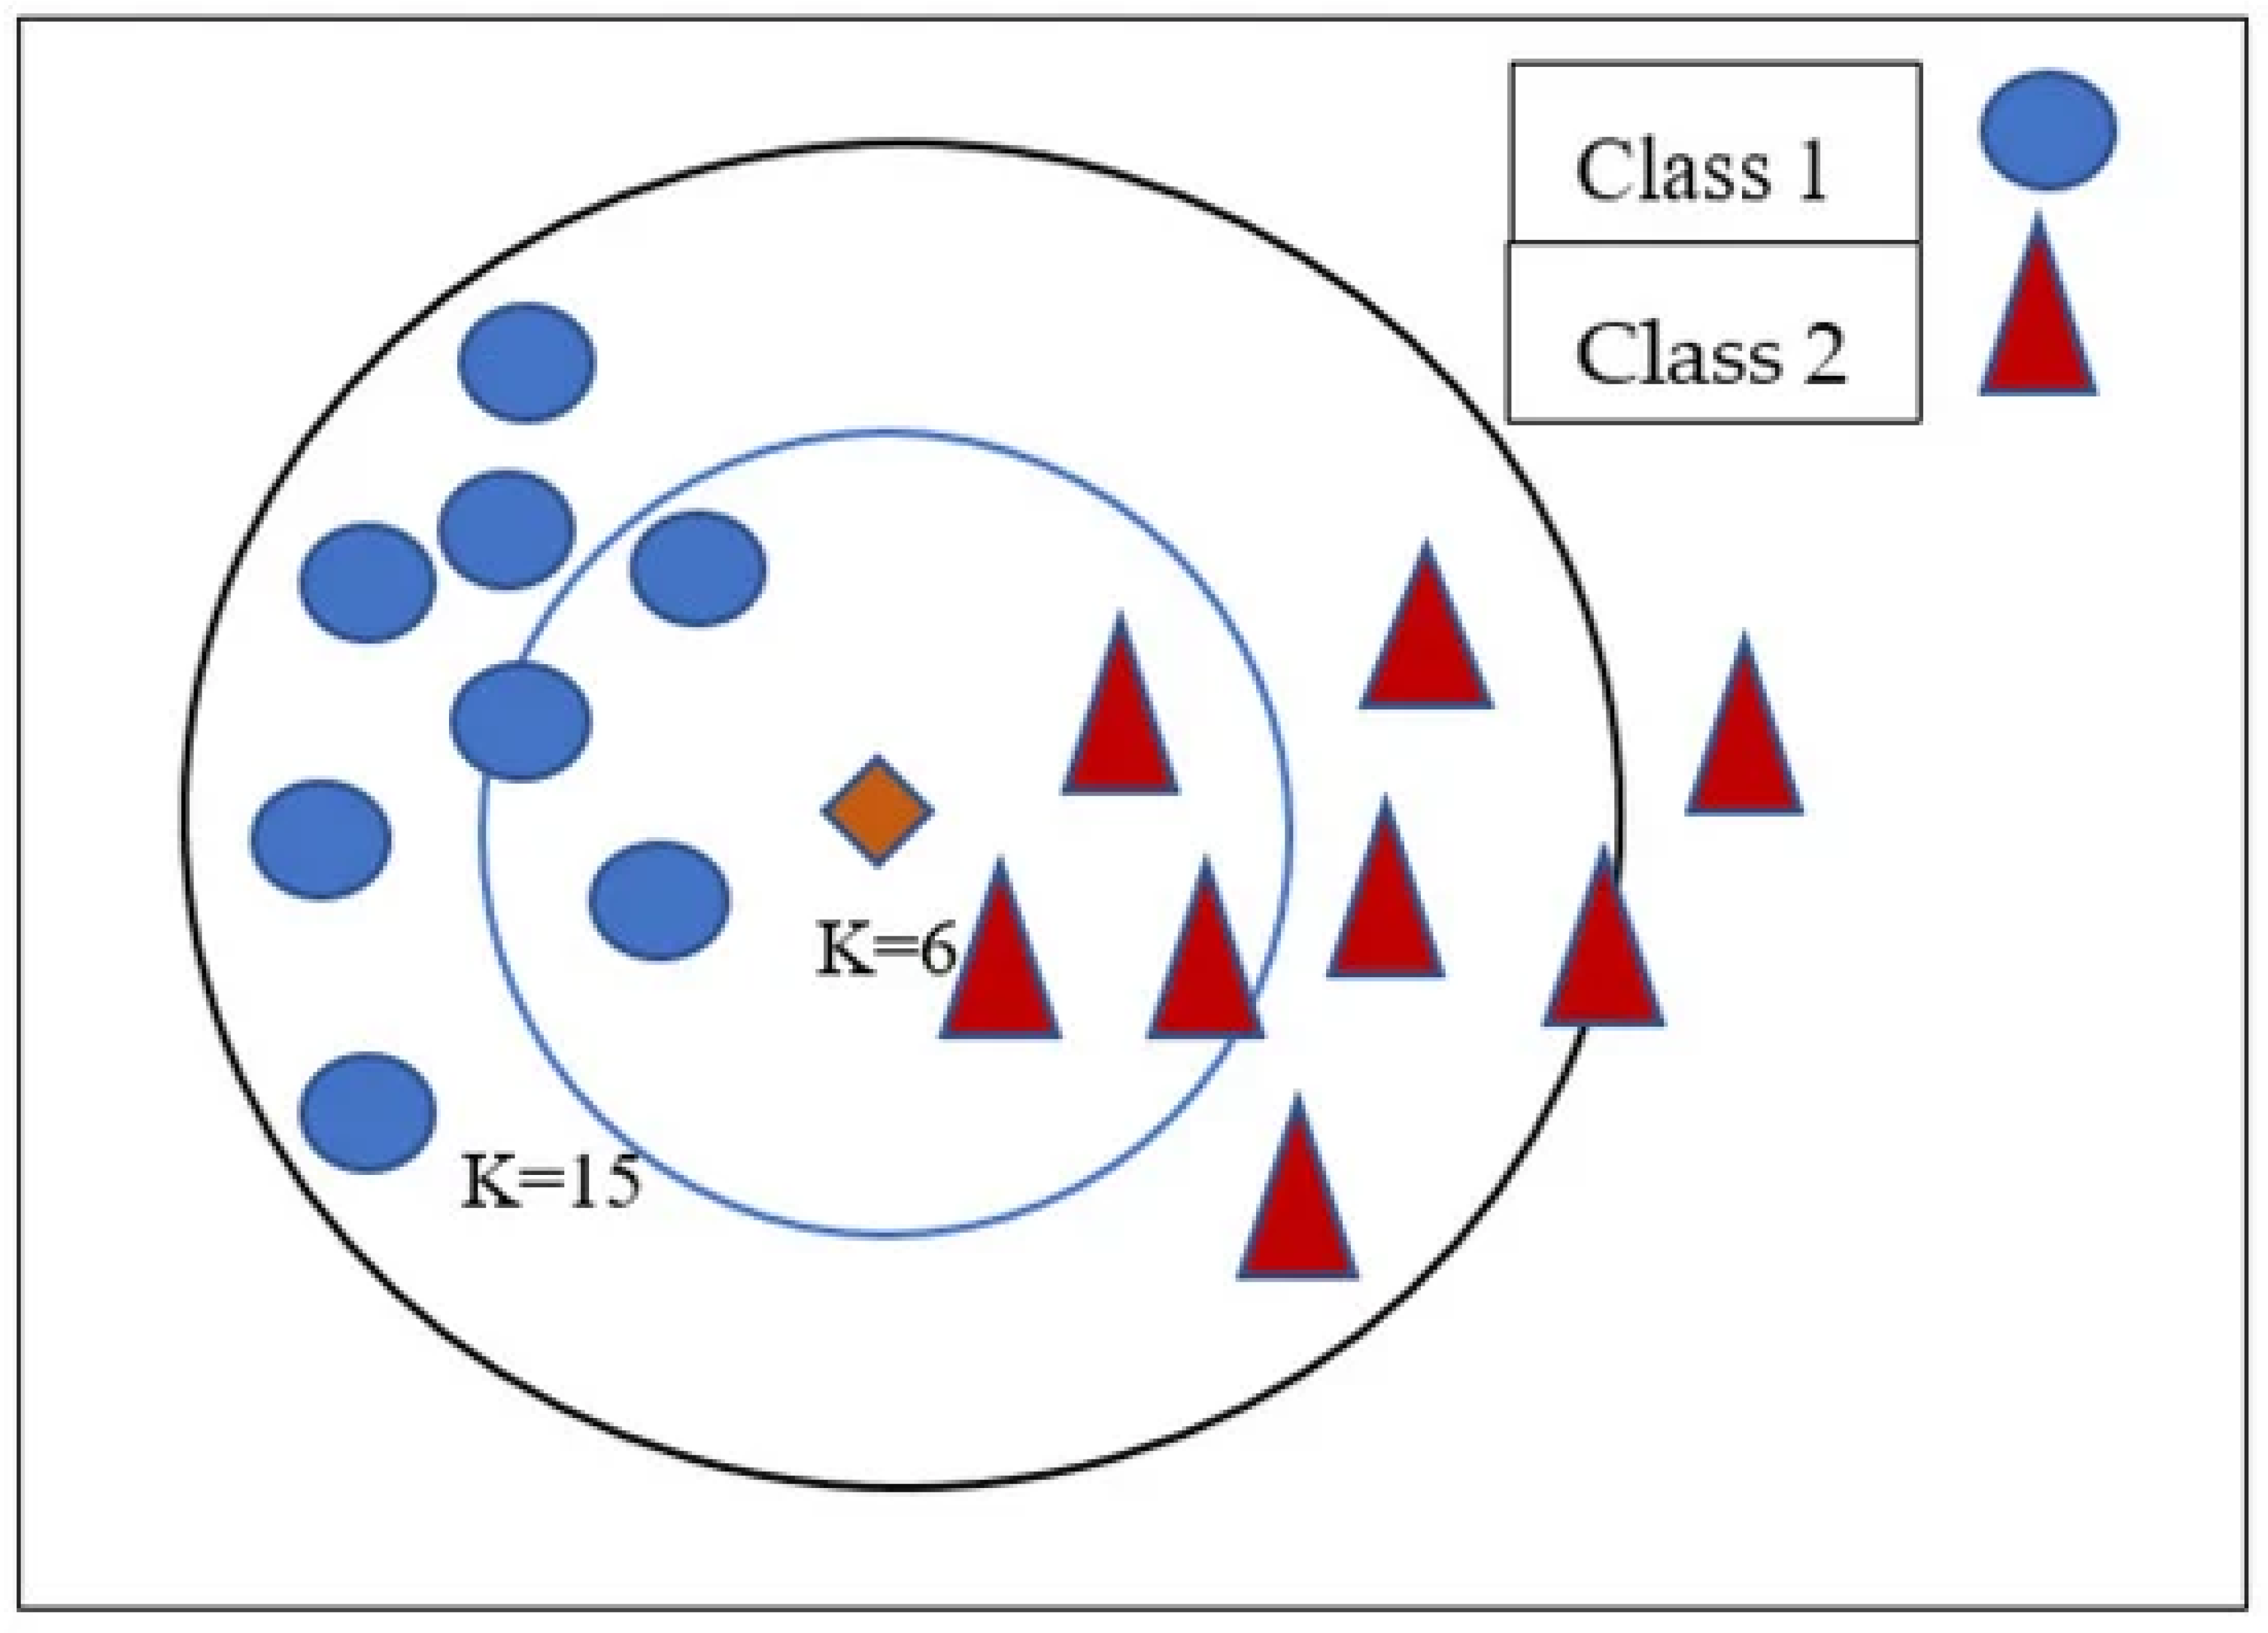
KNN is a simple and instinctive distance-based approach that has widely been used for CKD prediction studies. By classifying patients on the basis of similarities of their clinical features, KNN identifies the closest data points, often referred to as “neighbors”, in the feature space. Figure 3 illustrates the structure of the KNN algorithm [21] in a two-class classification problem. It shows two classes, i.e., class 1 (blue) and class 2 (red). The goal of KNN is to classify a new data point, shown as an orange diamond, based on its proximity to existing points in the feature space. Figure 3 depicts two possible scenarios with two different K values, i.e., K = 6 and K = 15. For K = 6, the new point is classified by considering the six closest neighbors within the smaller circle. In this case, most nearest-neighbors belong to class 2 (red triangles), so the new point is likely classified as class 2. In contrast, if K = 15 is used, which considers a larger set of neighbors within the larger circle, the decision might be influenced by more points from class 1 (blue circles), potentially altering the classification. This visualization highlights how selection of K-values changes the decision boundary and ultimately the classification outcome in KNN, making it crucial to select an appropriate K-value for specified data distribution.
The values shown in the figures are meant for conceptual illustration purposes only and are not the experimentally devised K values from the reviewed studies. The reviewed studies demonstrate a wide variety of K choices. Some researchers used a small K = 2, while others used cross-validation to find the best K. In many cases, the K value was not stated. Because K is very sensitive in KNN, this is the reason for the large differences in accuracy. Hence, the K values in Figure 3 are for example purposes only and should not be considered to be a given, or a recommended, setting.
A. S. Shanthakumari et al. [22], similar to ESVM, presented the enhanced KNN (EKNN) approach, where the used the BestFirst function for feature selection. The findings showed 58.8%, 98.8% and 99.2% accuracy for the Indian CKD dataset, the UCI CKD dataset and the Kaggle CKD dataset, respectively. B. Deepika et al. [31] aimed at building an application for CKD prediction, which used ML approaches, mainly KNN and NB, for prediction. They fine-tuned both the approaches and evaluated on the UCI dataset, where they achieved 97% accuracy for KNN and 91% accuracy for NB. R. Bose et al. [32] first considered the Indian CKD dataset, pre-processed, imputed missing values, and extracted features for prediction. Further, they used the KNN approach with extracted features, which achieved 97% accuracy for CKD prediction. M. E. Barakat et al. [33] used the CKD dataset and evaluated ML approaches, i.e., DT, KNN and linear regression (LR), where KNN with K = 2 achieved 99% accuracy. I. W. Supriana et al. [34] presented the modified KNN (MKNN) approach, which was modified using the genetic approach (GA). The GA helped in finding the best K-value for KNN, for better CKD prediction. The MKNN was tested on the Indian CKD dataset, where all 24 features were selected for prediction, which achieved 93% accuracy. N. Alturki et al. [35] presented an ensemble approach, called TrioNet, which combined Extra-Trees (ET), XGB, and RF for CKD prediction. For imputation, the KNN imputer was used, and to handle imbalance issues, SMOTE was used. For evaluation, the UCI dataset was used, where KNN-Imputer + SMOTE + TrioNet achieved 98.97% accuracy.
Limitations of KNN are as follows: The model can be unstable due to poorly selected K, it can be highly influenced by the K, and large datasets can reduce the model performance.

3.3. Naïve Bayes

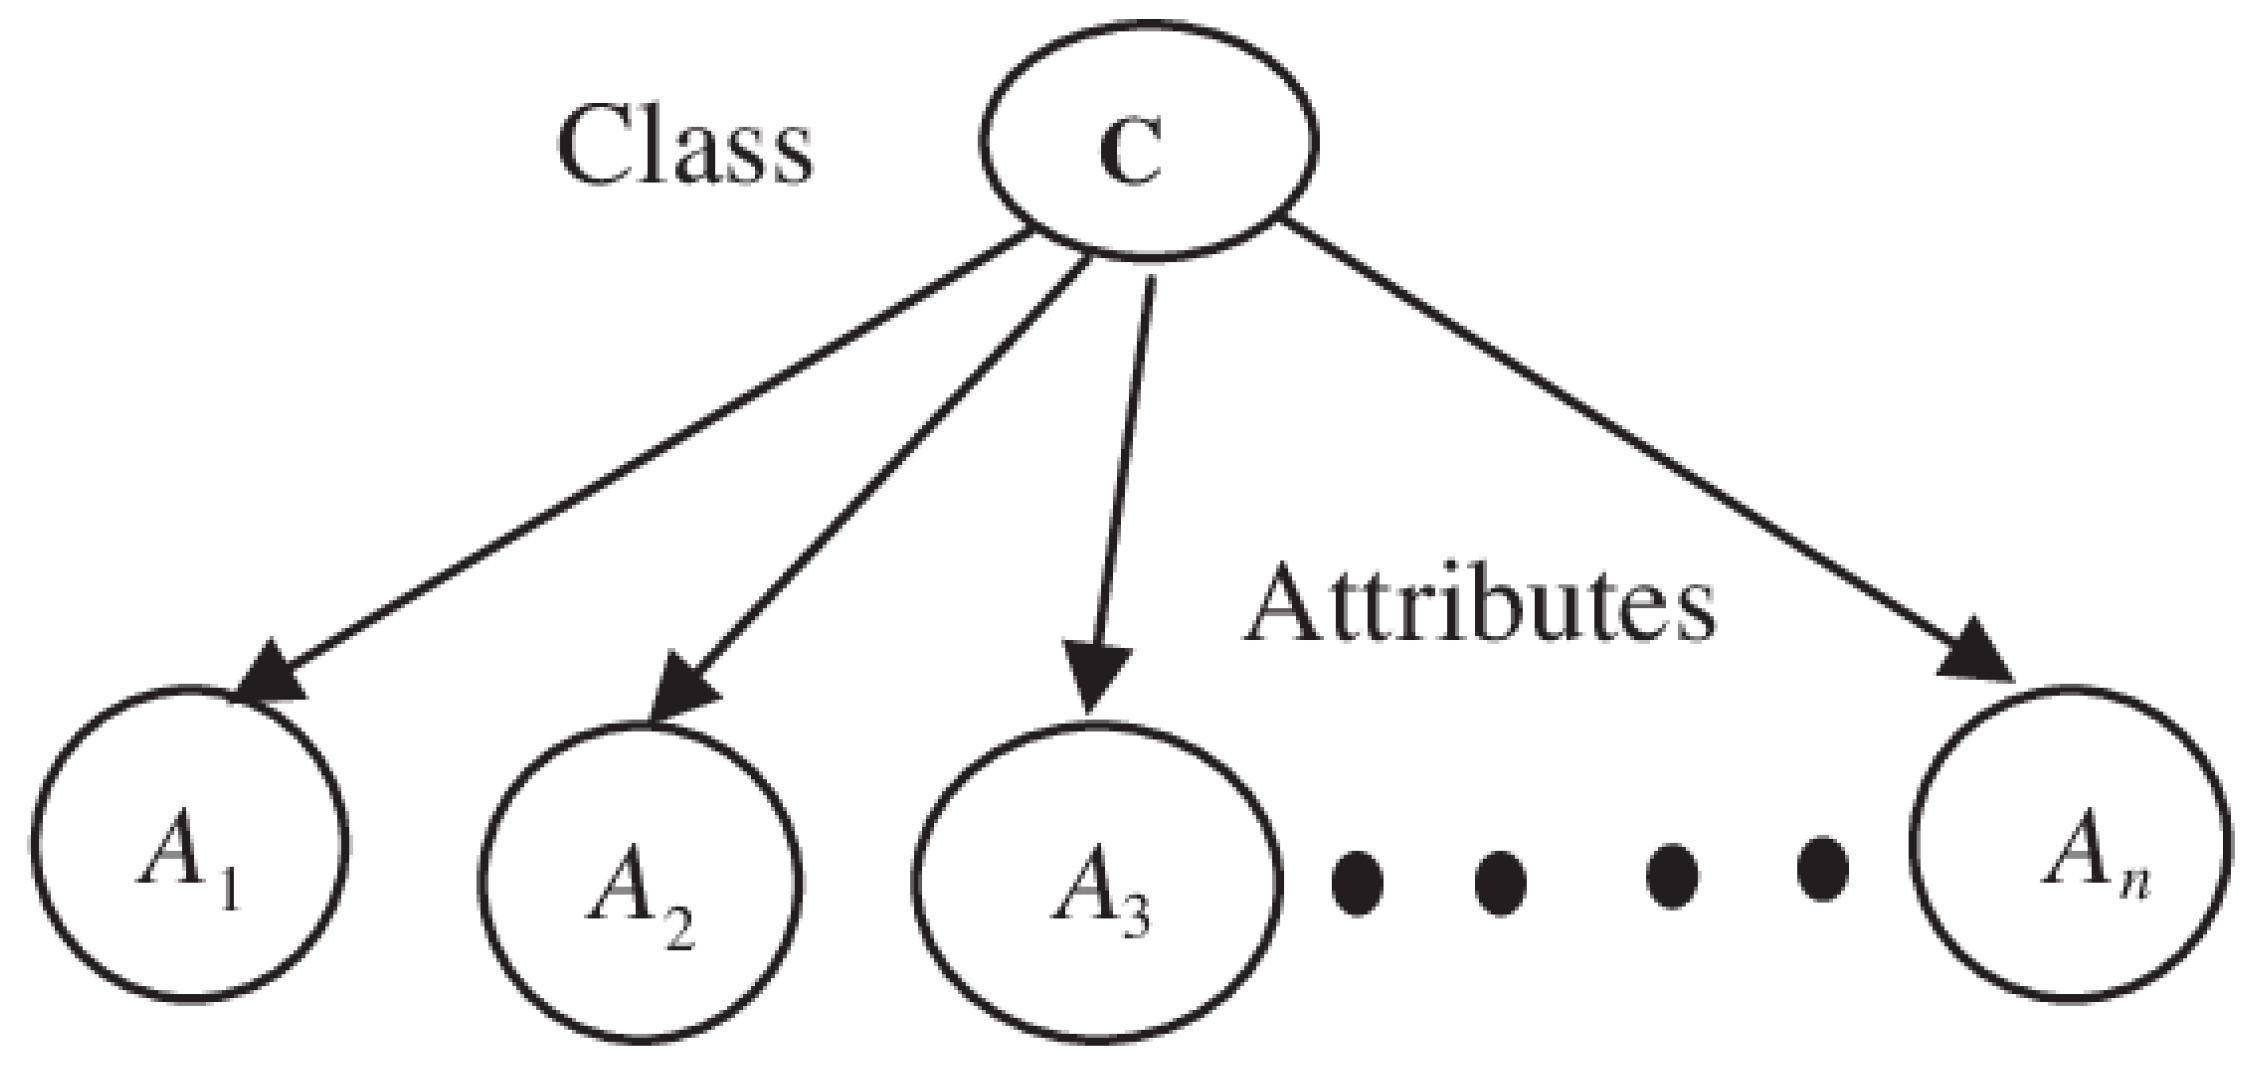
NB is a probability approach that is sometimes applied to the diagnosis of CKD. By utilizing Bayes theorem, NB calculates patient probability of belonging to normal or CKD or to a specific class on the basis of the patient’s clinical features like serum creatinine, blood pressure, and other factors. NB assumes that all features are independent, which allows it to work efficiently even with small datasets. This makes NB particularly useful for early CKD detection. Figure 4 shows the NB structure [36], where a single class node is connected to multiple attribute nodes (A1, A2, …, An). For CKD prediction, the class node shows CKD absence or CKD presence, while the attribute nodes represent various patient features like blood glucose level, blood pressure, age, and other relevant medical features. The NB algorithm assumes that all attributes are conditionally independent for every class. This assumption may not strictly hold true in real-world scenarios like disease prediction, where certain attributes might be correlated.
I. Santiko et al. [36] used featured-correlation-based selection (CFS) for selecting features for the NB approach for predicting CKD. Evaluations were conducted on the Indian CKD dataset, where two methods were evaluated, i.e., the NB approach without CFS and the NB approach with CFS, which achieved 93.54% and 93.58%, respectively. O. A. Jongbo et al. [37] created ensemble methods by combining ML approaches, mainly DT, NB and KNN with random-subspace and bagging, and evaluated the approaches using the Indian CKD and UCI CKD datasets, where findings showed that NB with random-subspace achieved the highest results, i.e., 94.2% accuracy. K. M. Almustafa et al. [38] used the UCI CKD dataset for classifying CKD, using multiple ML classifiers, which included stochastic-gradient descent (SGD), NB, DT, J48, KNN, and RF with feature selection. Findings showed that NB achieved better results with 95% accuracy. R. C. Poonia et al. [39] used two feature selection approaches, i.e., Chi-square and recursive feature elimination (RFE) with ML approaches, which included artificial neural networks (ANNs), NB, SVM and KNN for predicting CKD. Findings showed that with features, NB achieved 95% accuracy for the UCI CKD dataset. A. Syarif et al. [40] conducted a performance study about how ML classifiers can predict CKD using ML approaches, which included evaluating NB, SVM and DT. For evaluation, authors considered the Kaggle CKD dataset, where NB achieved 96% accuracy. M. F. Azizah et al. [41] used the Gaussian NB (GNB) approach with k-fold CV for predicting CKD. The GNB approach was evaluated using the Kaggle CKD dataset, where using 5 k-fold CV with GNB achieved 89.93% accuracy.
Limitations of NB are as follows: Due to simplistic assumptions, it may not model the more complex overlapping pathology of CKD and is poor in the presence of highly correlated features.

3.4. Decision Tree

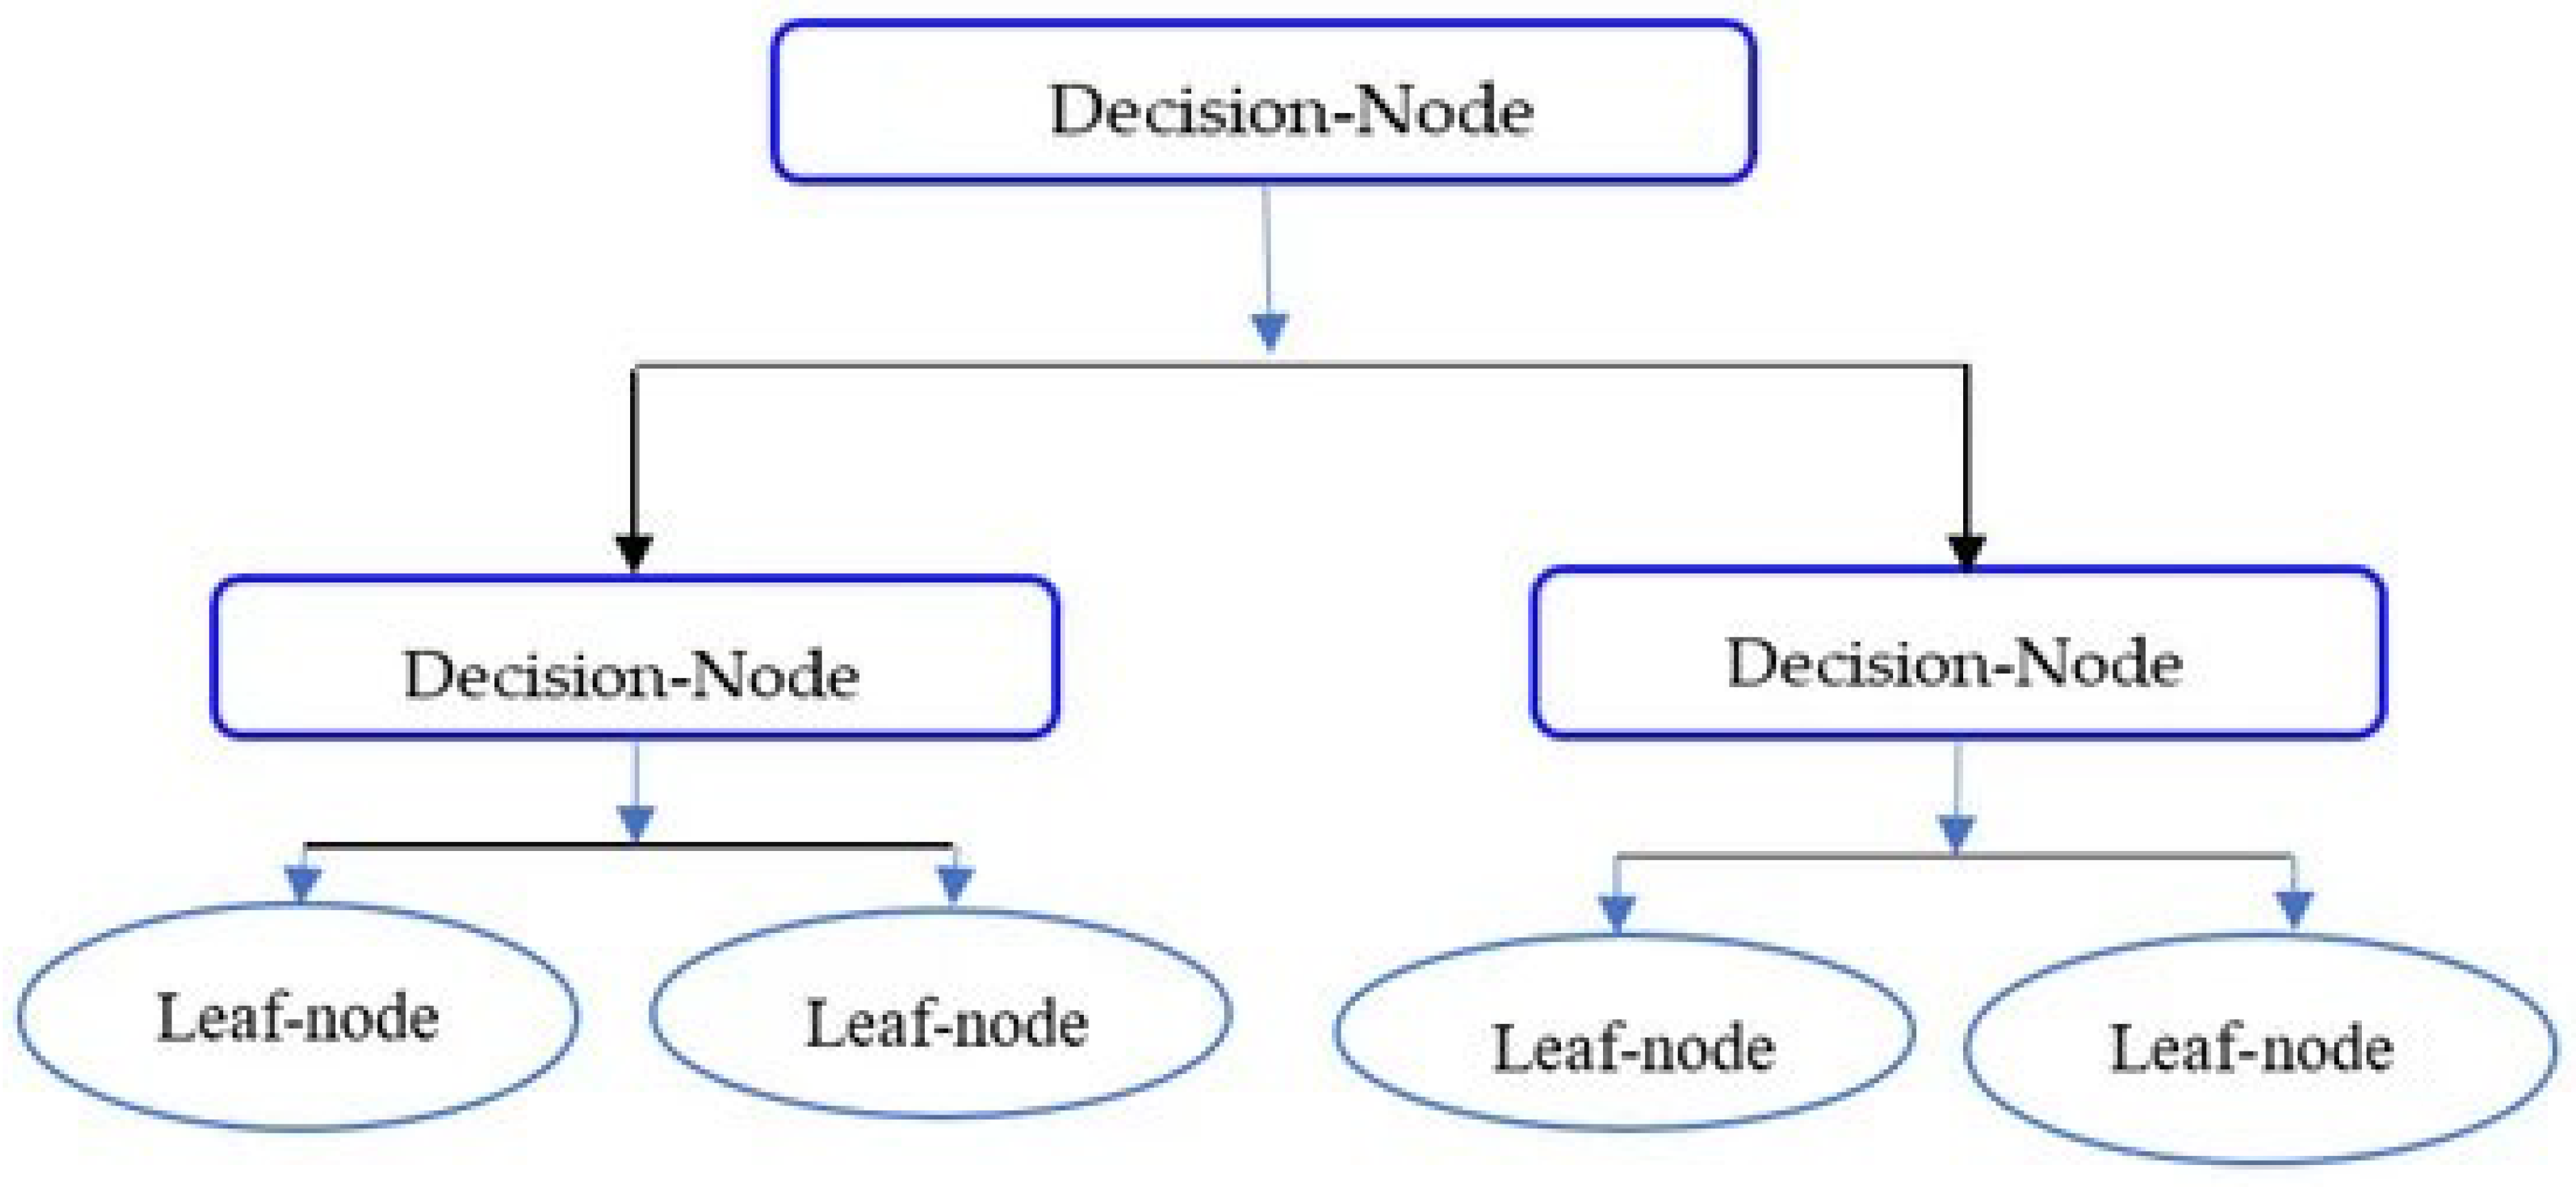
DTs are a powerful tool for diagnosing and managing CKD. By dividing complicated clinical data into simple series, interpretable decisions, DTs help to classify patients based on critical factors. Each node in DT signifies a feature, and every branch resembles a decision rule, leading to a final classification at the leaves. The structure of DTs makes them valuable in clinical settings, where healthcare professionals can make quick decisions about a patient’s CKD status. Figure 5 shows a basic DT structure [42] with multiple decision nodes and leaf nodes. For CKD prediction, every decision node shows a test for a specific patient attribute. Depending on the test result, the decision path leads to subsequent decision nodes or terminal leaf nodes. These leaf nodes represent the final prediction. The simplicity of explanation and usefulness of DTs make them an effective tool for CKD prediction. On the other hand, pruning and ensemble strategies can help reduce their overfitting behavior.
I. A. Pasadana et al. [42] used various variants of DT, which included random tree (RT), NBTree, REPTree, J48, consolidated-tree construction (CTC), Hoeffding tree (HT), decision stump (DS), simple cart (SC), J48Graft, and RF. The evaluations were conducted on the UCI CKD dataset, where RF showed better performance, achieving 100% accuracy. A. K. Chaudhuri et al. [43] used RFE for feature selection and presented an enhanced DT (EDT) approach for predicting CKD. Evaluations were conducted on the UCI CKD dataset, where it was seen that EDT with or without feature selection achieved 100% accuracy. H. Ilyas et al. [44] aimed at predicting CKD stages, for which they used two ML approaches, i.e., J48 and RF. For evaluation, they considered the UCI CKD dataset, where J48 approach achieved 85.30% accuracy. J. Rohith et al. [45] presented a DT model called novel DT (NDT) for predicting CKD with fewer training samples. The evaluations were conducted using Indian CKD dataset, the authors compared LR with NDT, which achieved 85.25% and 96.66%, respectively. R. K. Halder et al. [46] aimed at developing a web application for predicting CKD, which used ML approaches, including DT, SVM, NB, XGB, GB, AB, and RF. Evaluations were conducted on the UCI CKD dataset, where DT achieved 96.6% accuracy.
Limitations of DT are as follows: It can show contradictory predictions on different datasets, and it is overfitting prone/may show high variance given small changes in the dataset.

3.5. Random Forest

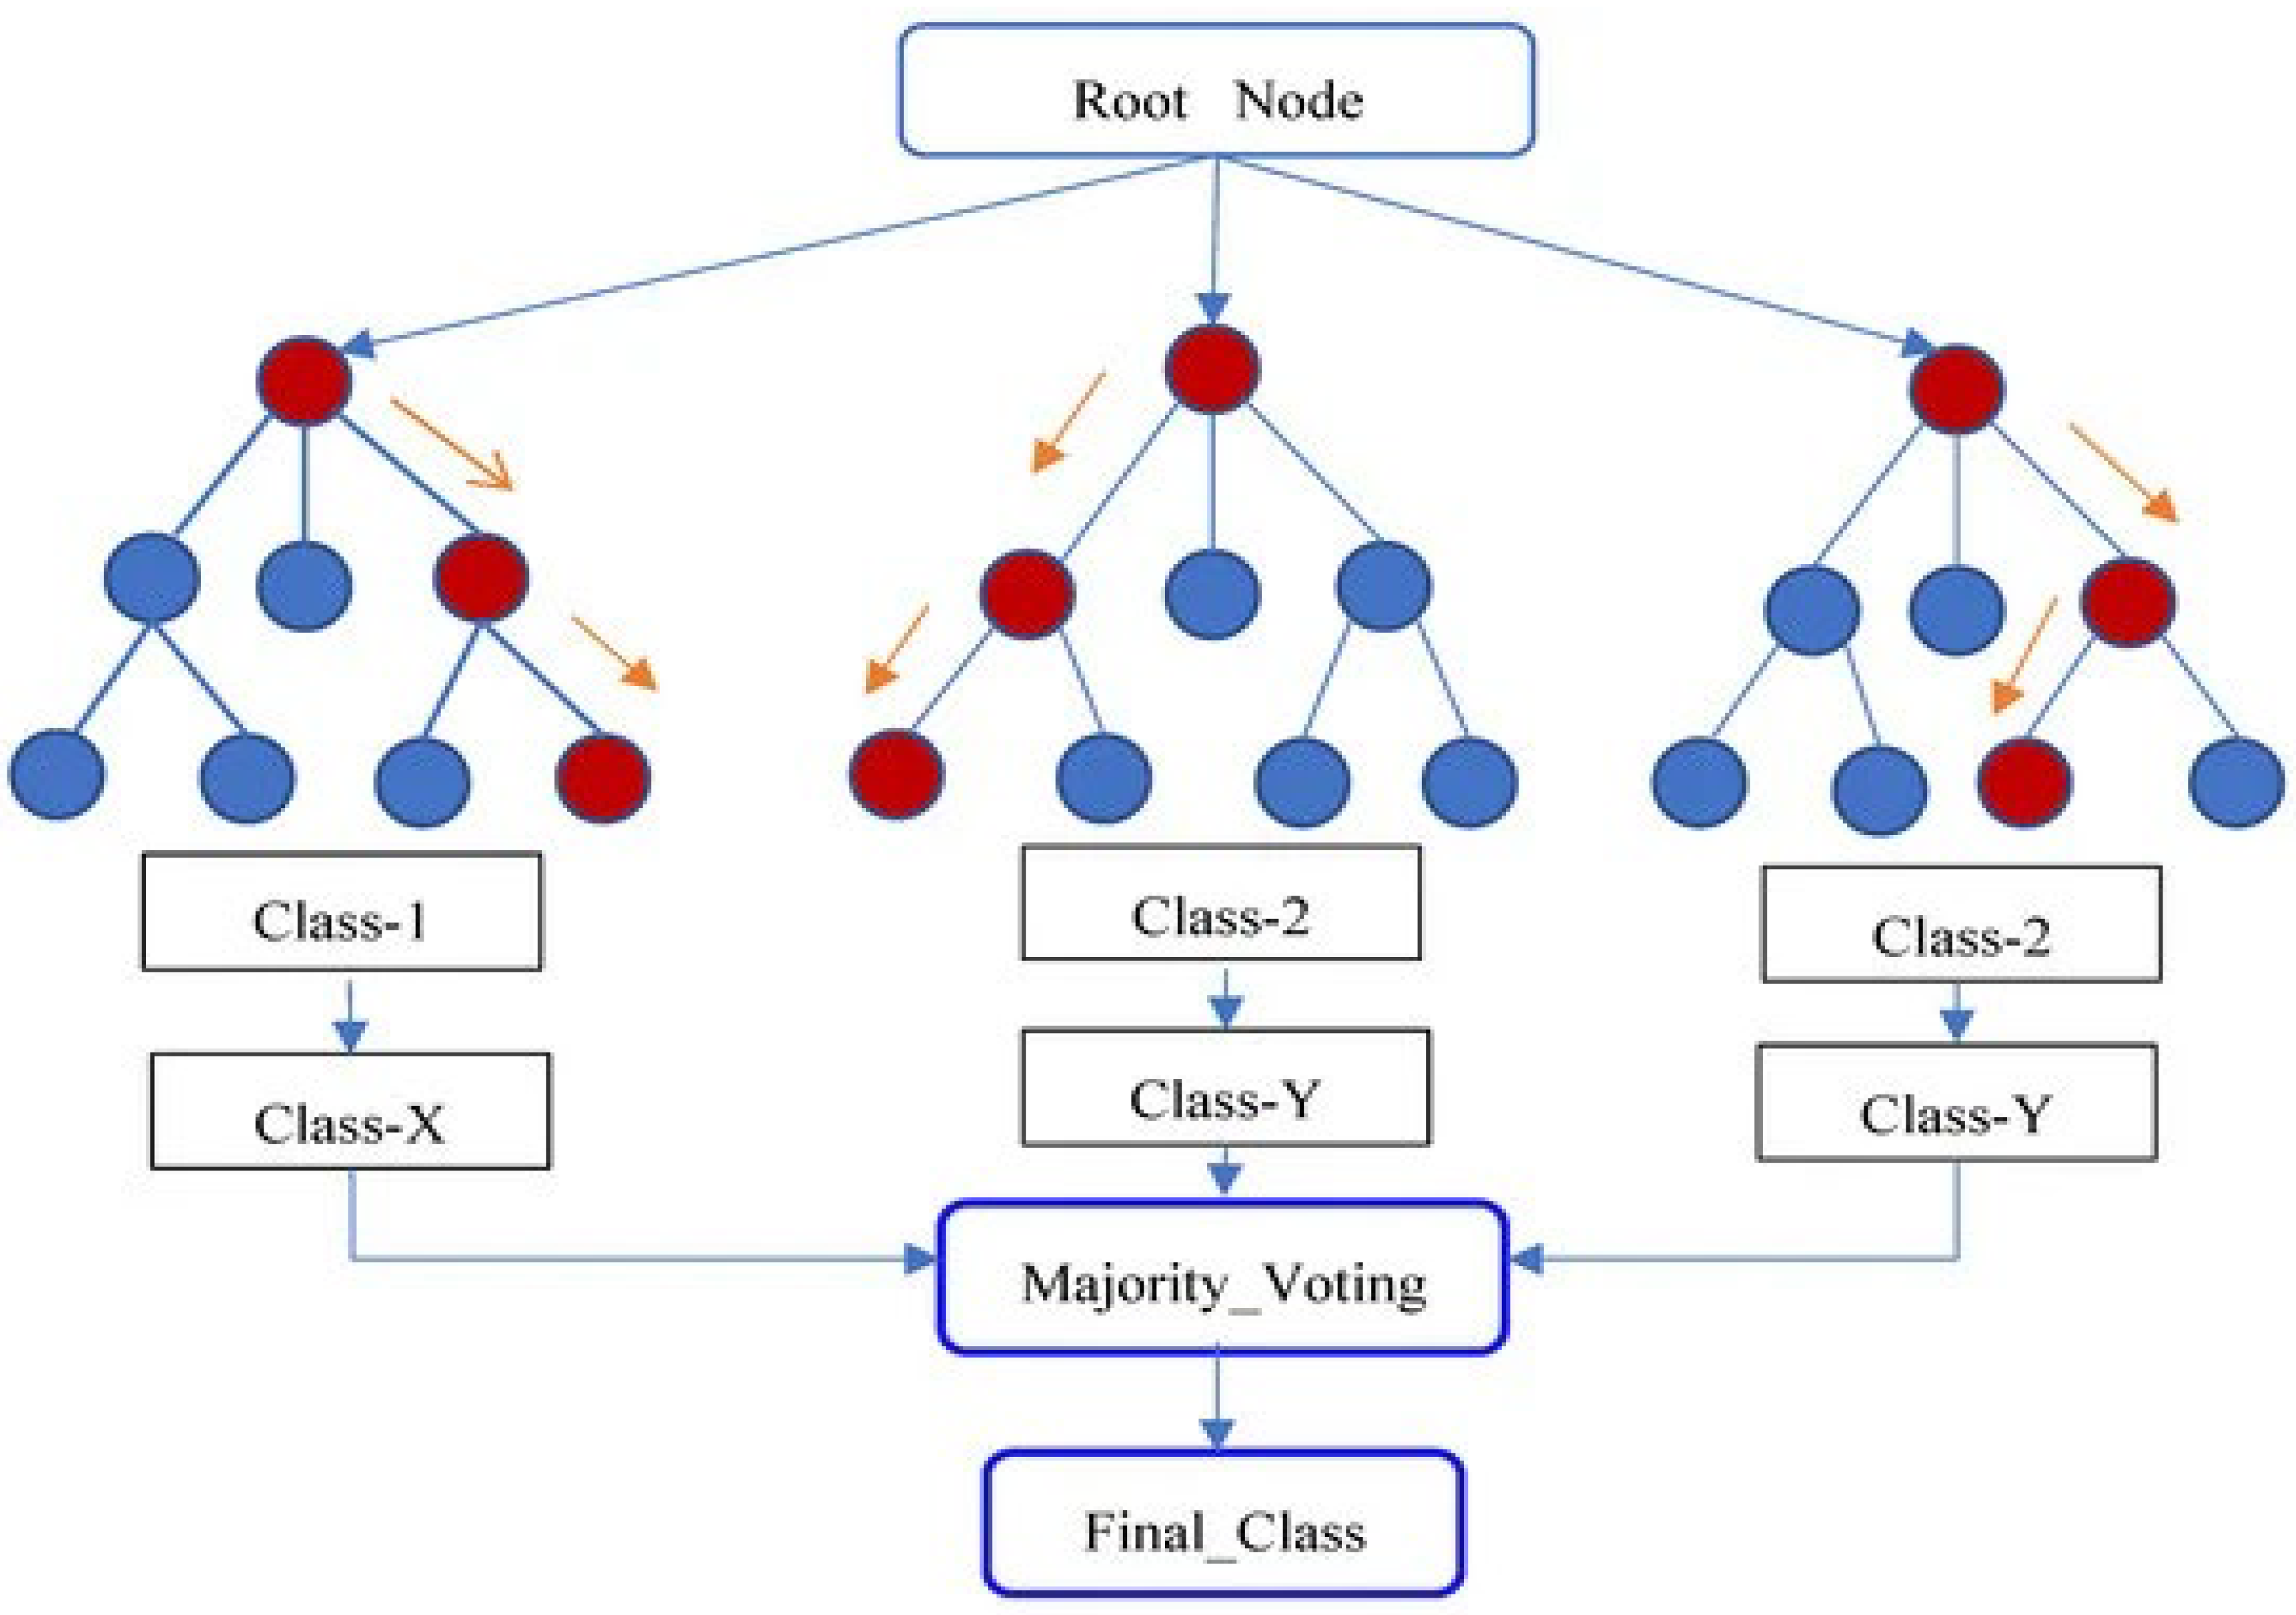
RF is an ensemble learning approach that is used for diagnosis of CKD. RF is achieved by combining multiple DTs. It can handle complex interactions between clinical variables, such as glomerular filtration rate (GFR) and serum and creatinine levels, which are important for determining kidney function. Figure 6 shows the structure of an RF. The process begins at the root node, where data is initially fed to an RF algorithm and split into multiple subsets, where each subset is used to construct an individual DT. Three separate DTs are shown in Figure 6 [27]; each DT represents a different model within the RF. By randomly selecting features and data samples from the original dataset, trees are created. The nodes within each tree represent decisions. Nodes are split based on specific features. Each DT then makes a classification decision by labeling the input data into one of the possible classes, either class 1 or class 2. The final classification in a RF is determined using majority voting, where every DT votes for its predicted class. The class having most votes is elected for final output. The outcome of this majority voting process is the final predicted class. This ensemble method results in providing accurate outcomes when compared with using a single DT, highlighting the key aspects of the RF algorithm in providing the most accurate result.
D. Swain et al. [27] used the CV approach with RF for predicting CKD using the UCI CKD dataset, where the RF and CV approach together achieved 98.67% accuracy. M. Rashed-Al-Mahfuz et al. [47] used feature selection and k-fold CV with various ML classifiers for predicting CKD. Evaluations were conducted on the UCI CKD dataset, where the findings showed that RF with feature selection and k-fold CV achieved better results, i.e., 99.50% accuracy. D. Chicco et al. [48] used the dataset from [49] for predicting CKD, which included CKD patients from the United Arab Emirates (UAE). From the dataset they evaluated the best features for prediction through feature ranking and found that creatinine, GFR and age were main factors for prediction. Using these features, they trained and tested ML approaches, where RF showed 84.3% accuracy. P. A. Moreno-Sánchez et al. [50] explored explainable artificial intelligence (XAI) and used the feature selection approach with different ML approaches. Among the best features included hypertension, gravity and hemoglobin in the UCI CKD dataset. During evaluations, they considered 5 k-fold CV, where RF achieved 97.5% accuracy. Y. Dubey et al. [51] conducted a study on different ML approaches, which included histogram boost (HB), XGB, GB, KNN, DT and RF. They used feature selection and found that blood pressure, creatinine level and age were important features that help in predicting better results for CKD prediction. Evaluations were conducted on the UCI CKD dataset, where RF achieved 98.75% accuracy. P. Liu et al. [52] collected data from CKD patients for 5 years and used the RF approach for evaluating the best features and accuracy for predicting CKD. Among the best features from the collected dataset included working status, albuminuria, creatinine level and age.
Limitations of RF are as follows: High-stakes clinical decisions need more explainability. RF tends to overfit to noisy data, and interpretability is less than that of single tree models.

3.6. Logistic Regression

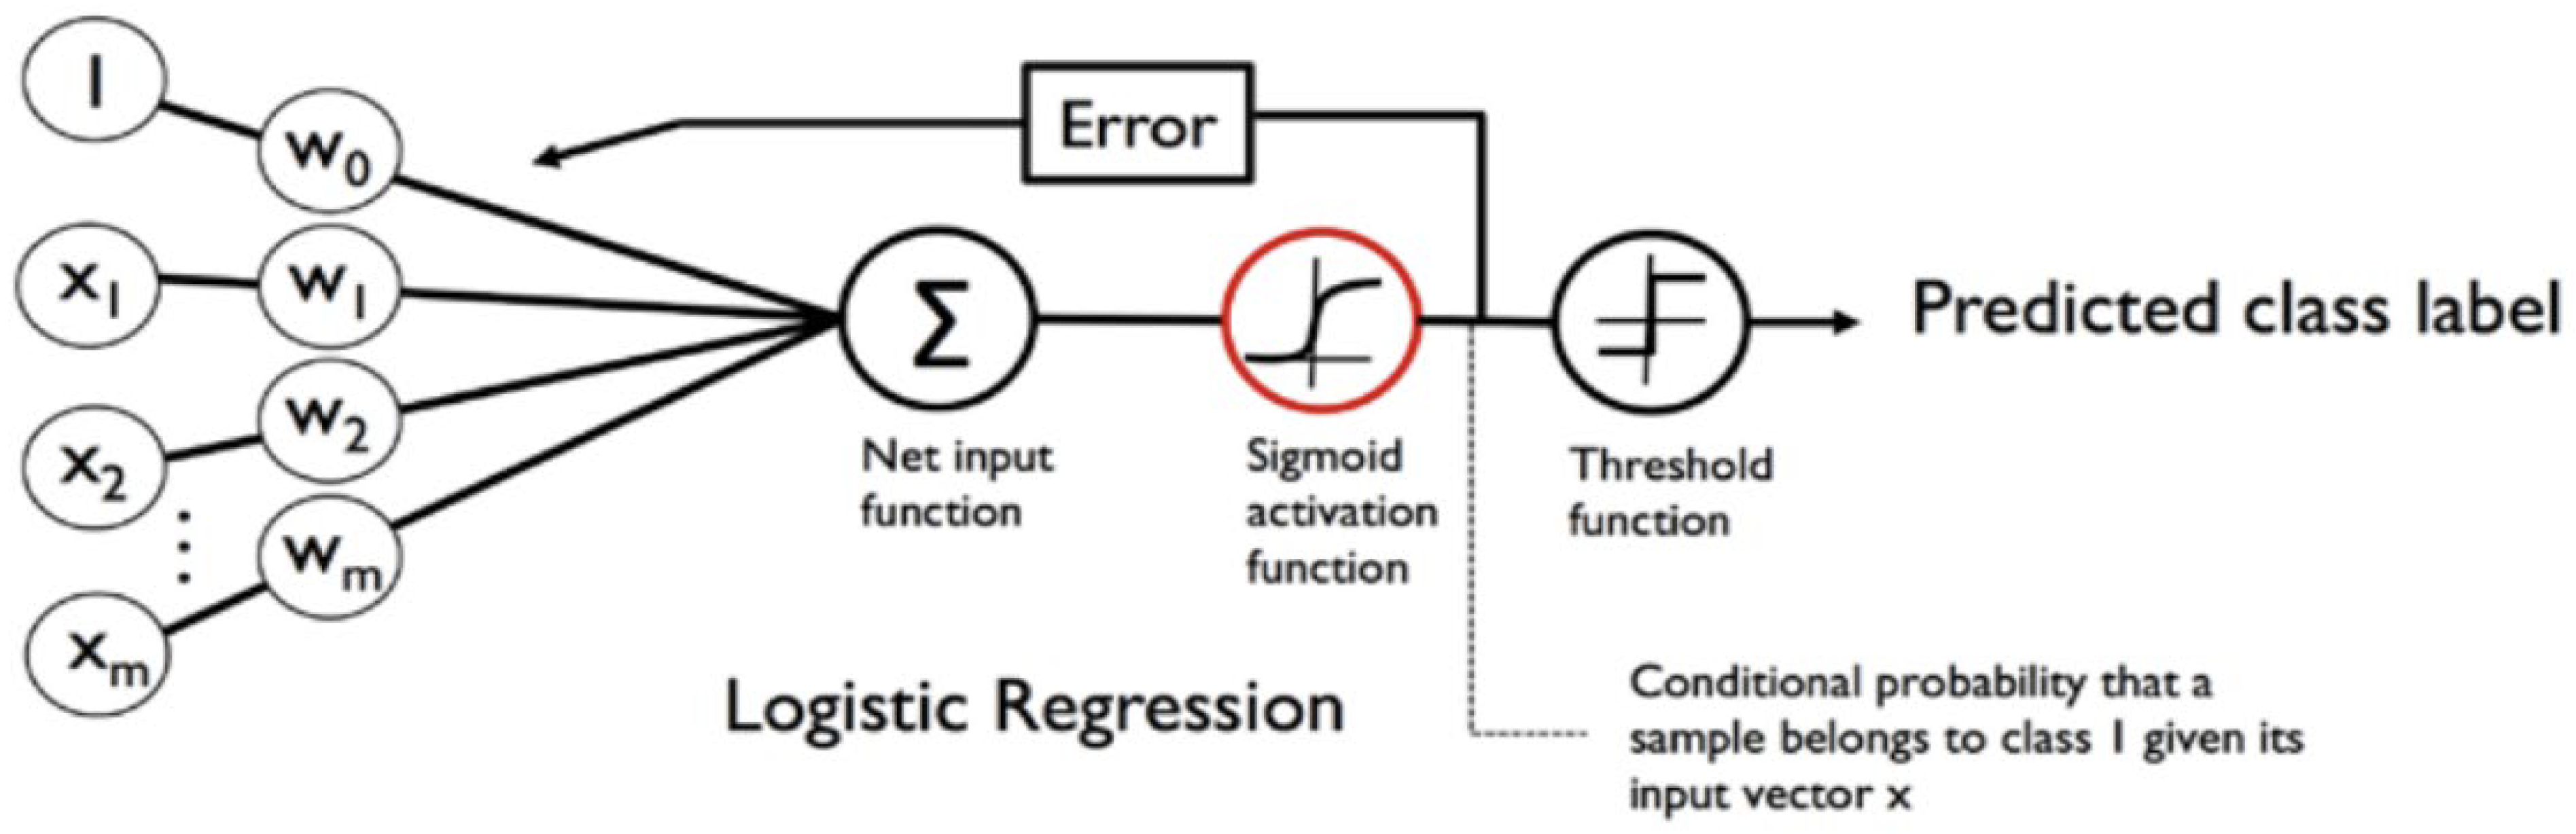
LR is an important tool for prediction of CKD disease. By analyzing patient data, such as sugar level, blood pressure level, age, and other parameters, LR models can identify CKD prediction. Its interpretability and efficiency make it a preferred choice in clinical settings for identifying risk and guiding treatment decisions in CKD disease. Figure 7 depicts an LR model [39], which is used for binary classification problems like CKD prediction. In this model, patient attributes ( X 1 , X 2 , …, X m ) are multiplied by their respective weights ( W 1 , W 2 , …, W m ) and added for calculating the net input. This net input is then passed to a sigmoid activation function to produce a value in between 0 and 1, representing the probability of a patient having CKD. A threshold is applied to this probability to make a final prediction.
R. C. Poonia et al. [39] used Chi-square for feature selection and used the LR approach [53] for predicting CKD using the UCI CKD dataset, which achieved 98.75% accuracy. J. Qin et al. [54] considered the UCI CKD dataset and preprocessed it by filling missing values using the KNN imputer and then used ML classifiers, mainly feed-forward neural network, NB, KNN, SVM, RF and LR. From the findings it was seen that the ensemble of LR with RF achieved 99.83% accuracy. P. Chittora et al. [55] used SMOTE, SMOTE + selection-operator regression + least absolute shrinkage, selection-operator regression + least absolute shrinkage, and the wrapper approach. They used the correlation-based approach for feature selection and used C5.0, ANN, the Chi-square automated interactive detection approach, linear SVM with two penalty level RT and LR for predicting CKD. The evaluations were conducted considering the UCI CKD dataset, where LR + wrapper with all features showed 78.54% accuracy.
Limitations of LR are as follows: It may overlook some of the more intricate patterns of CKD progression due to non-linear complex patterns and may require extensive feature construction.

3.7. Boosting Approaches

Boosting approaches, such as GB, XGB, CB, AB and LGBM, are increasingly used in the analysis and prediction of CKD. These techniques increase the performance [55] of predictive models by consecutively merging weak learners to strong ensembles, which improves the accuracy in identifying CKD risk factors and disease progression. Boosting approaches provide support for early detection by handling complex and nonlinear relationships in patient data.

3.7.1. Gradient Boosting (GB)

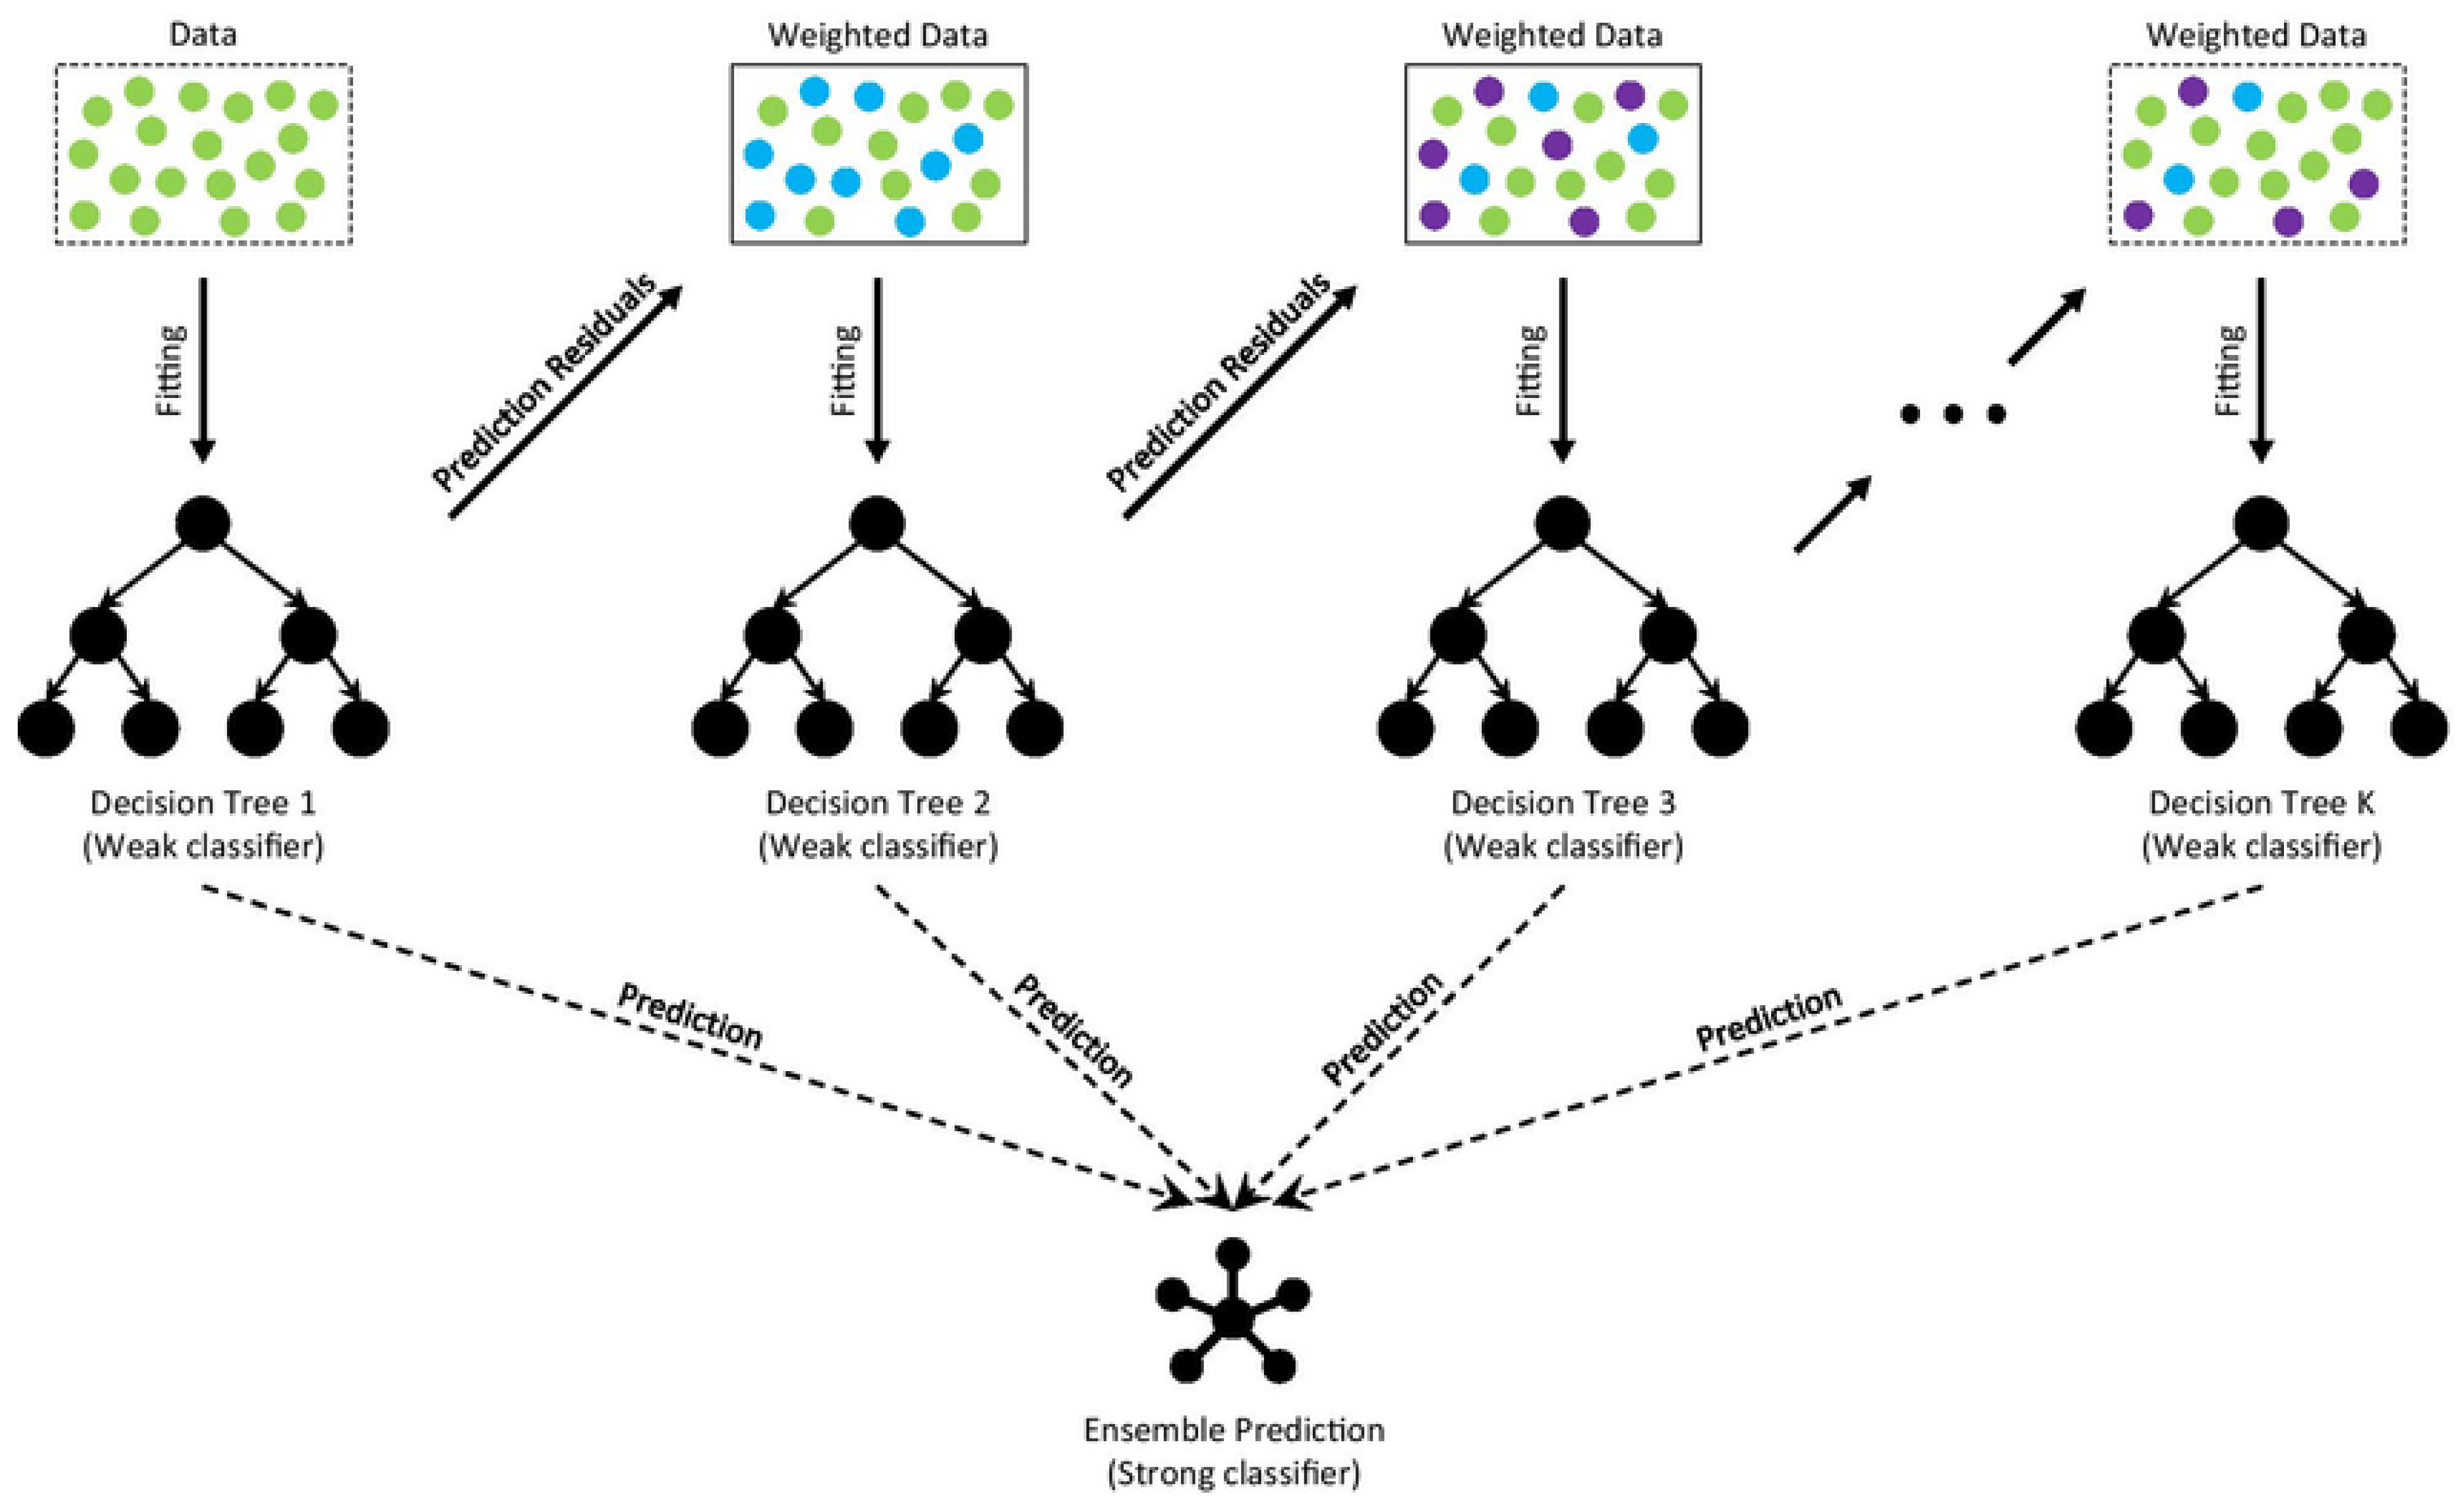
GB is an ML technique used in CKD detection and prediction. It enhances the accuracy and reliability of CKD prediction by iteratively refining predictions through the combination of weak models. Figure 8 shows the GB process [56]. It is a powerful ensemble method for CKD prediction that involves sequentially building multiple DTs; each tree in DT focuses on correcting the errors of the previous trees. The weighted data and prediction residual steps show how the algorithm assigns more weight to misclassified rows. This ensures that subsequent trees concentrate on difficult to predict cases. The final prediction combines the predictions of all DTs, often achieving highest accuracy compared with individual DT. This approach effectively uses strong points of multiple approaches for improving CKD prediction.
P. Ghosh et al. [57] considered the UCI CKD dataset and used ML approaches, which included linear discriminant analysis (LD), GB, AB and SVM for CKD prediction. Among all the approaches, the GB approach achieved the best results, i.e., 99.80% accuracy. D. Baidya et al. [58] used various ML approaches, i.e., AB, ET, RF, GNB, DT, XGB, GB and KNN, for predicting CKD. Evaluations were conducted on the UCI CKD dataset where it was seen that KNN and ET showed better outcomes, achieving 99% accuracy, and GB achieved 98% accuracy. P. Karkare et al. [59] used ML approaches, i.e., AB, XGB, GB, RF, DT and SGB methods, incorporated with feature selection using Pearson correlation coefficient (PCC). Evaluations were conducted on two datasets, i.e., the UCI CKD and the Kaggle dataset, where GB and SGB achieved better results. S. M. Ganie et al. [60] used different boosting approaches, which included AB, GB, LGBM, CB and XGB for predicting CKD. They used feature selection and hyper-tuned each model for the UCI CKD dataset. For evaluations, they considered the UCI CKD dataset, where GB achieved 97.46% accuracy.

3.7.2. XGBoost (XGB)

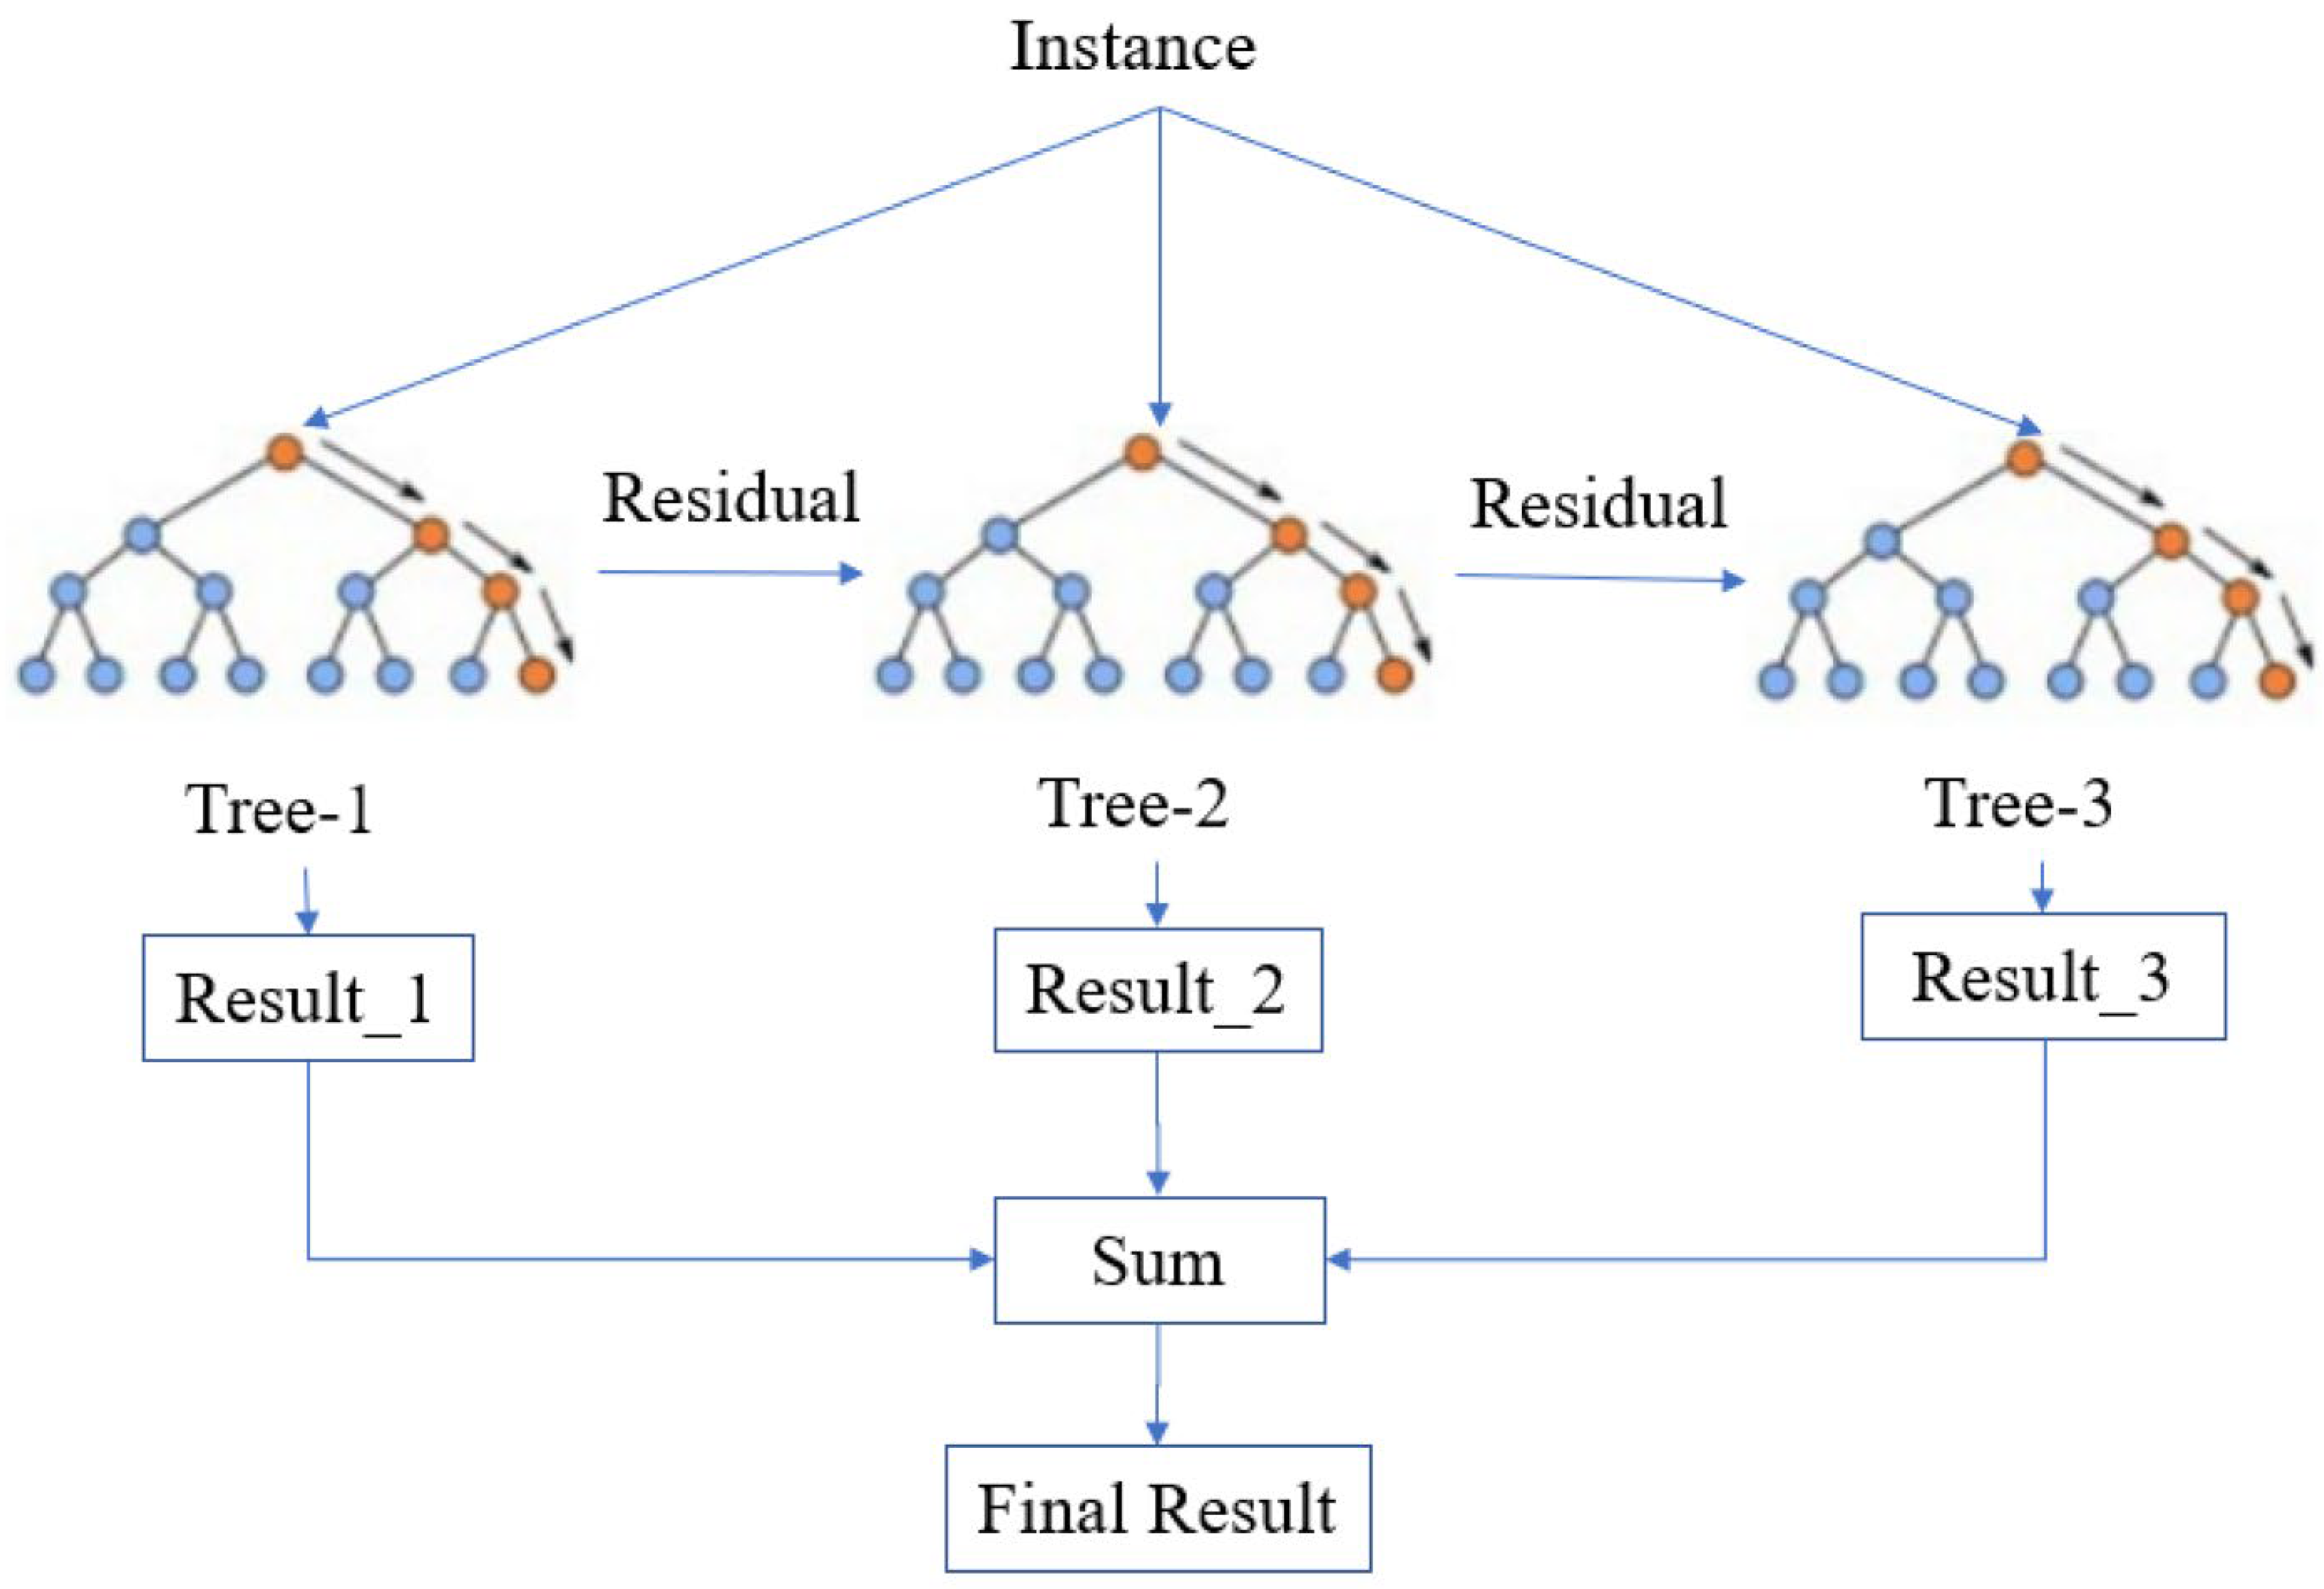
XGB is an ML implementation of GB, which is used in the prediction of CKD. Due to its strong learning efficiency and high predictive accuracy, XGB has become an important technique for developing reliable predictive models. Figure 9 demonstrates the working mechanism of XGB [61], which is an ensemble learning method commonly used for tasks like CKD prediction. XGB constructs multiple DTs in a sequential manner where each successive tree learns from the errors or residuals of the preceding trees. As illustrated, an input instance is first processed by tree 1 to produce an initial output. The difference between the actual value and this output is then passed to tree 2, and the process continues across several trees. The final prediction is obtained by combining the results of all the trees.
R. A. Busi et al. [62] used the XGB approach for predicting CKD using the UCI CKD dataset, which achieved 95.93% accuracy. M. Kumar [63] used the UCI dataset, applied mean-mode imputation for imputing missing values, used the RFE approach for selecting features and used different ML approaches with CV for predicting CKD. Among the different approaches, the XGB approach with the best features achieved 99.5% accuracy. S. K. Ghosh et al. [64] collected data from CKD patients and normal patients and used ML approaches, which included XGB, NB, DT, RF and LR. For selecting the best features, they considered local-interpretable model-agnostic explanation (LIME) and Shapley additive explanation (SHAP). For the collected dataset, XGB showed better results, achieving 93.29% accuracy. Z. Chen et al. [65] also collected data from CKD patients and used ML approaches, i.e., KNN, LGBM, SVM and XGB, for predicting CKD. All the models were trained using selected features attained using SHAP and XGB, with 5 k-fold CV showing 95% accuracy. G. Dharmarathne et al. [66] used the UCI CKD dataset for predicting CKD, where it was seen that XGB without feature selection achieved 97.5% accuracy.

3.7.3. CatBoost

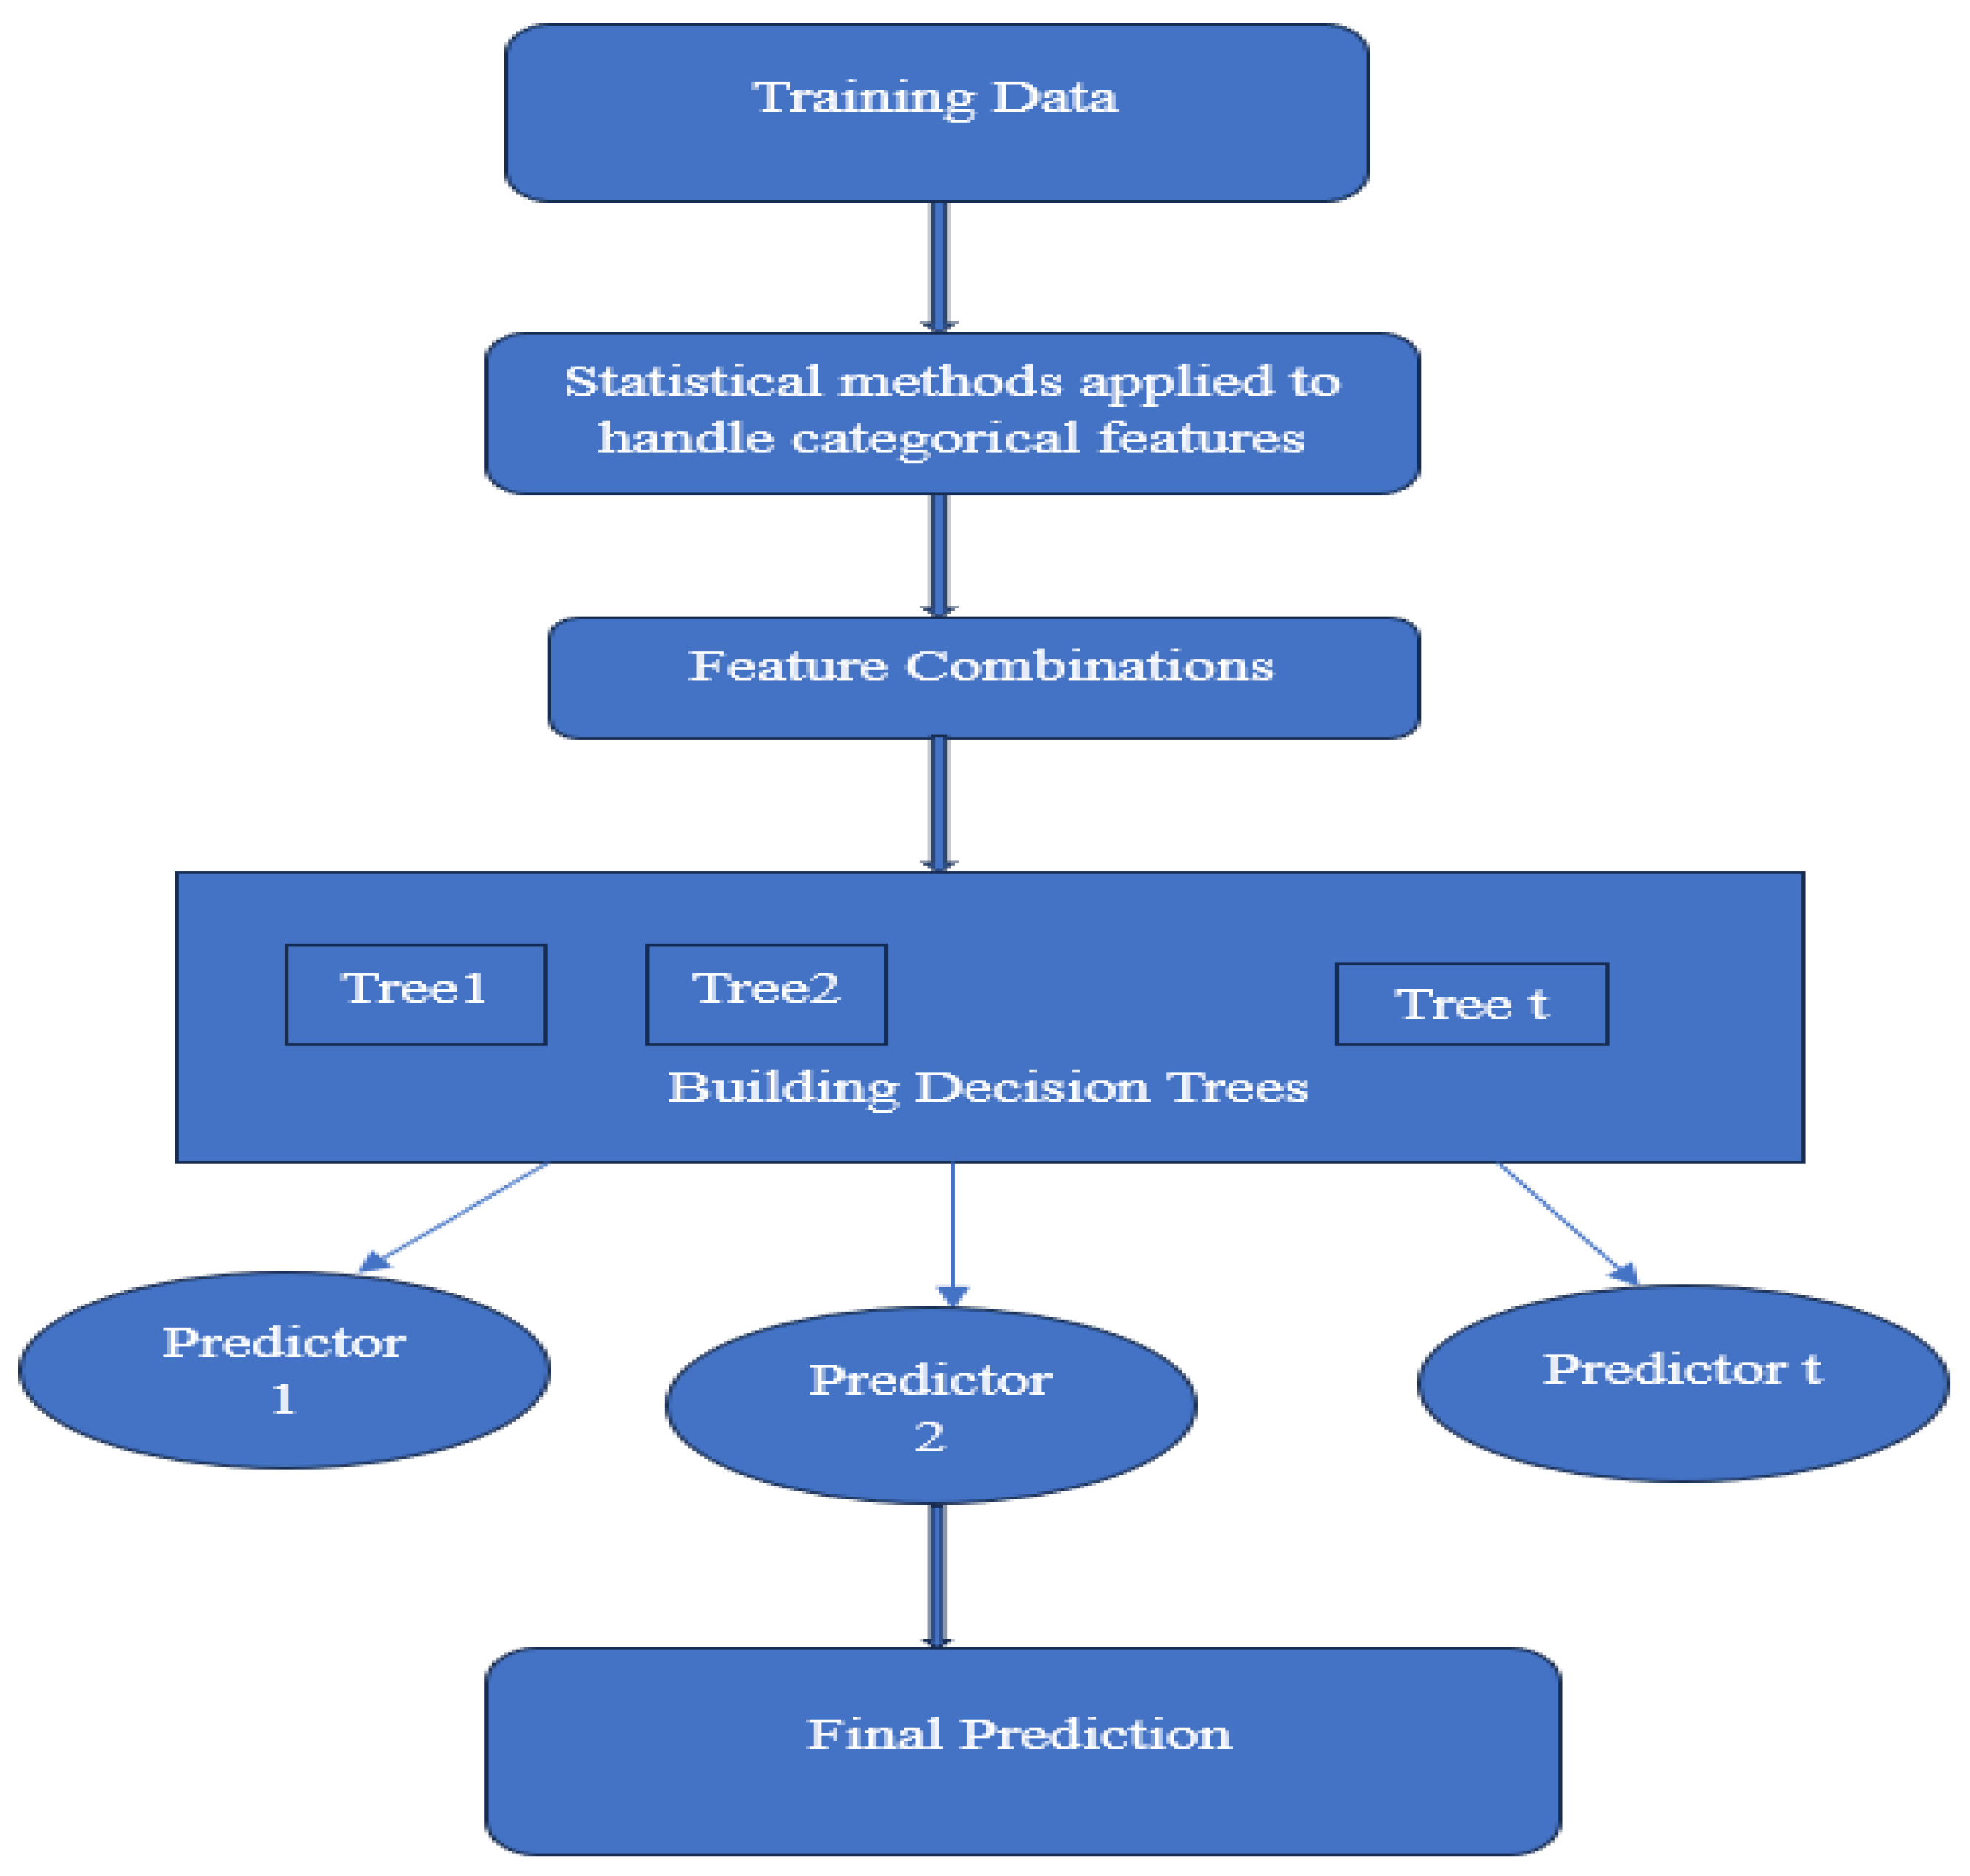
CB is an advanced GB approach that is designed to handle categorical features. It can handle complex feature interactions while reducing overfitting, which makes it well suited for developing reliable risk assessment tools and personalized treatment plans. Figure 10 illustrates the CB approach [67], which is designed for handling categorical data efficiently. For CKD prediction, CB can handle both numerical and categorical patient attributes. As shown in the figure, CB builds an ensemble of DT predictors using the GB approach. The use of target statistics is the only difference to handle categorical features, which helps improve accuracy and prevent overfitting problems. CB employs bootstrap sampling and weighting increase techniques to further enhance performance. The final prediction is achieved by combining predictions of all trees through a weighted average.
M. Gollapalli et al. [68] used the UCI CKD dataset and divided it into an 80:20 ratio for training and testing. They considered all the features for both training and testing. For training, they considered two ML approaches, i.e., RF and CB. Findings showed that CB achieved 99% accuracy. S. K. Dey et al. [69] considered the UCI CKD dataset and first used various preprocessing steps, which included imputation, outlier removal, encoding category features, scaling, and handling imbalance issues. For selecting features, they considered mutual information (MI), Chi-square, and PCC. Findings showed that CB achieved 96% accuracy for CKD prediction, while ET achieved 98% accuracy. R. Rani et al. [70] presented an ensemble CB approach, which combined the deer-hunting optimized approach combined with CB (DHO-CB) for CKD prediction. For evaluation, they considered the UCI CKD dataset, and findings showed 97.2% accuracy for prediction. M. Imran et al. [71] used various boosting approaches, which included ET, CB, XGB, RF, AB, and GB, for predicting CKD. Findings showed that CB achieved 98.33% accuracy for the UCI CKD dataset.

3.7.4. AdaBoost (AB)

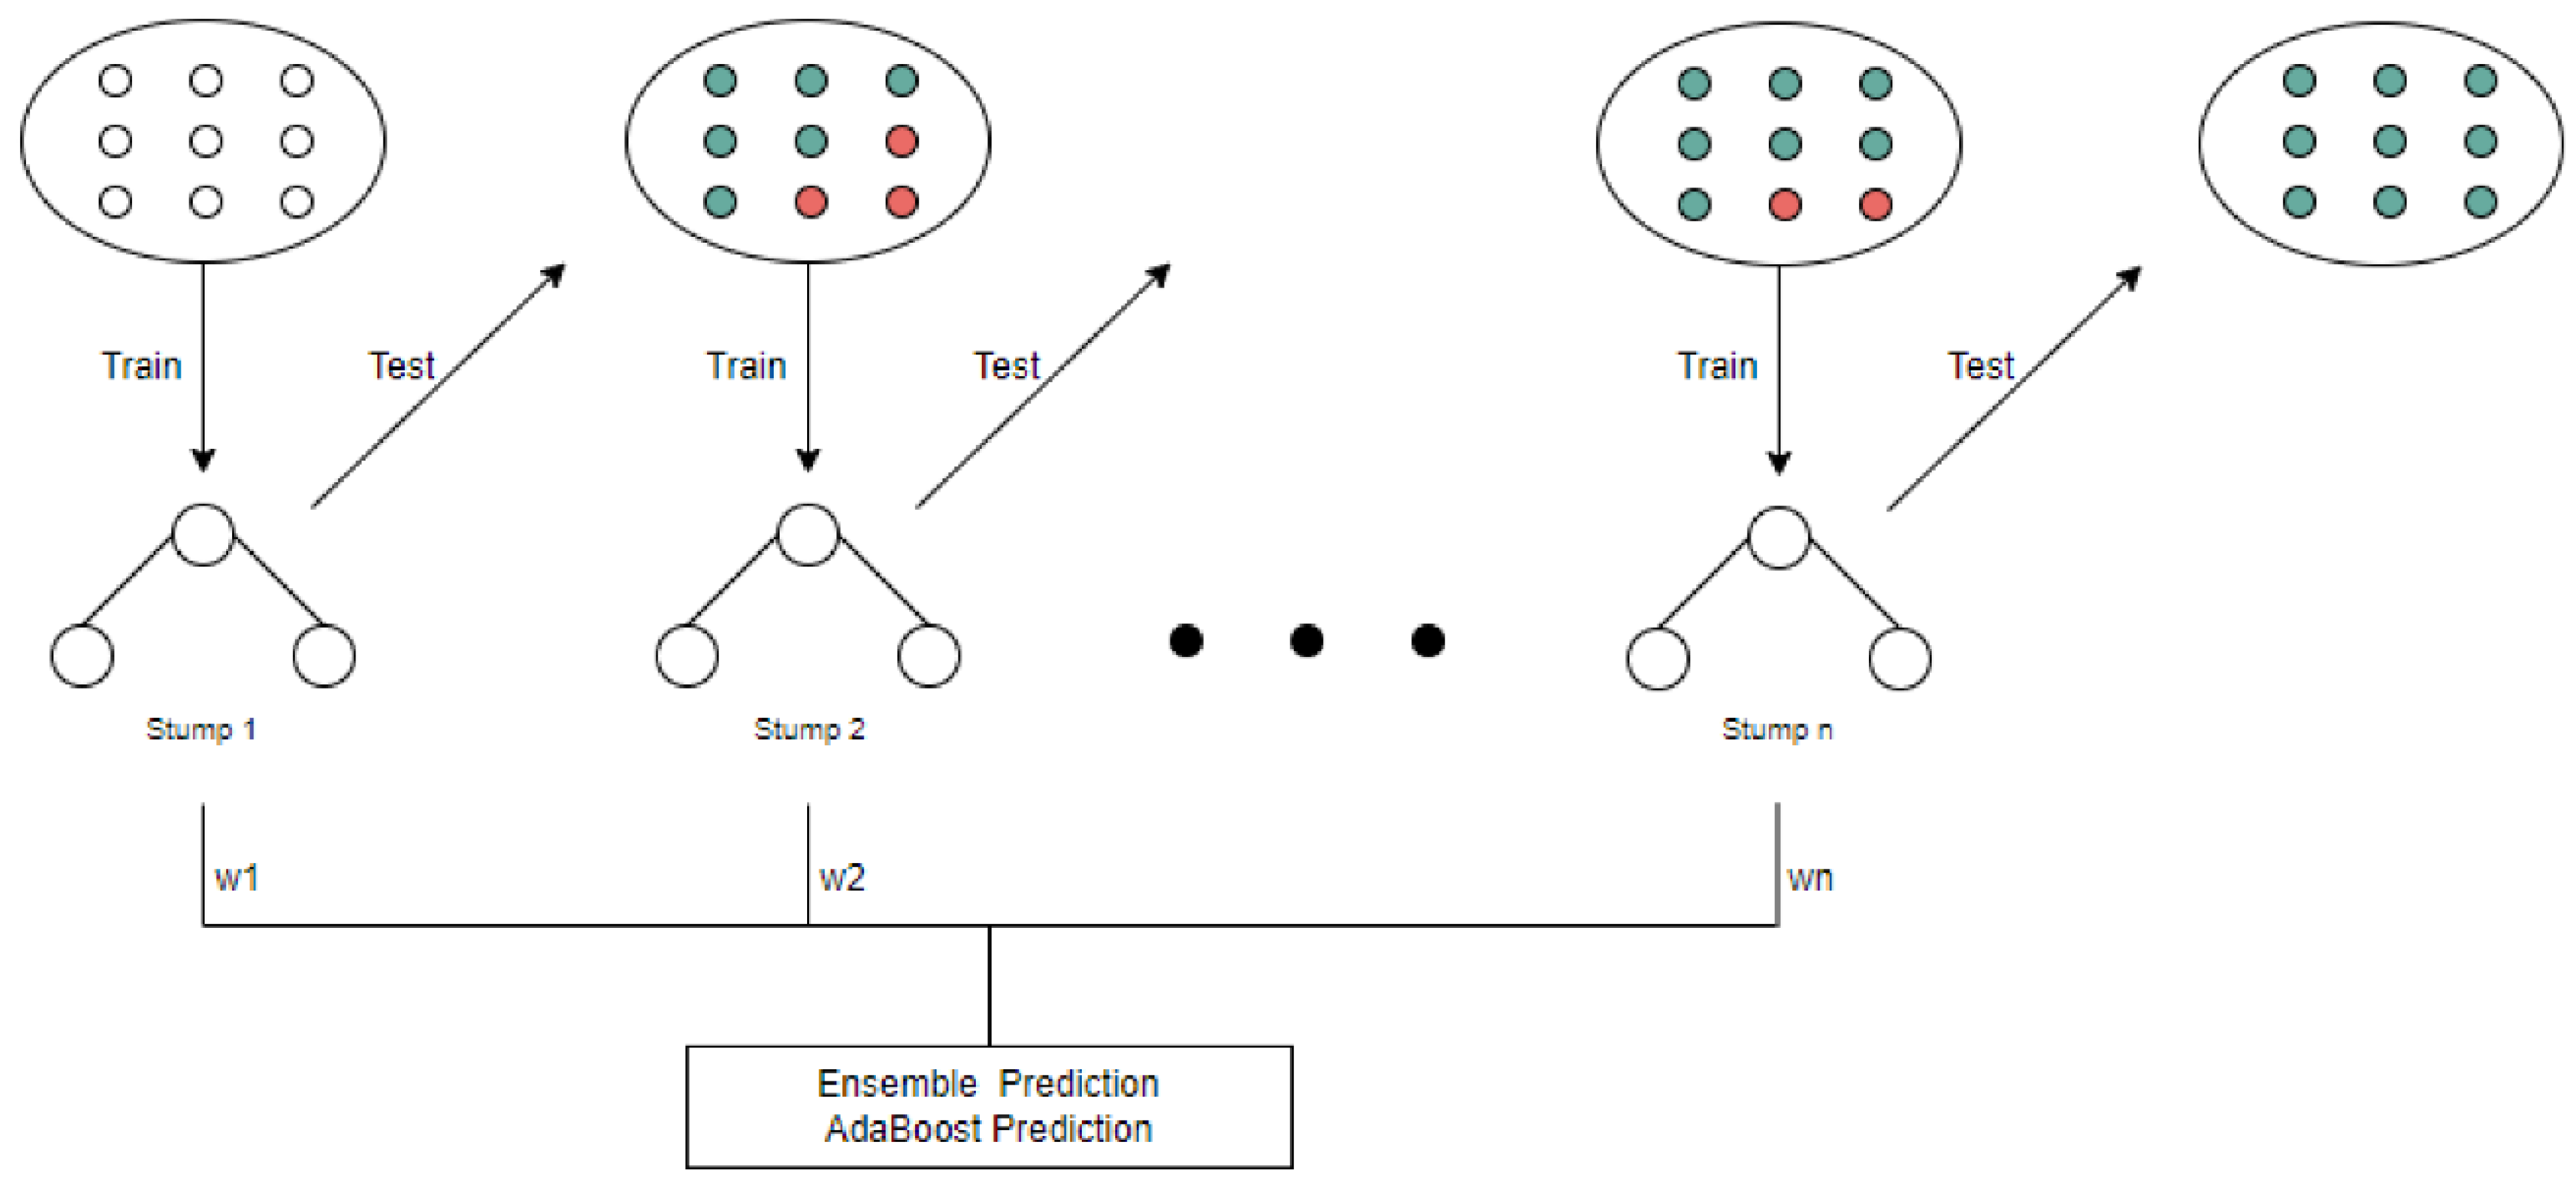
AB is an adaptive boosting algorithm. By iteratively combining weak classifiers to create a strong ensemble model, AB improves the ability to identify key risk factors and predict disease progression. It focuses on misclassified instances, which helps refine predictions over successive iterations, making it particularly useful for detecting patterns in a patient’s information, like laboratory outcomes and clinical data, which lead to better diagnosis of CKD. Figure 11 shows the AB algorithm [72], which is an ensemble learning method used for improving the prediction accuracy of various ML models, including those used for CKD prediction. AB typically uses simple decision trees called stumps as base learners. These stumps are weak learners that make relatively inaccurate predictions on their own. The figure shows the division of the dataset into testing and training sets. The training set is utilized for training every stump, while the testing set evaluates the model’s performance. AB assigns weights to each data point. Initially, all weights are equal. After each stump is trained, the weights of misclassified instances are increased by focusing stumps on learning to predict cases. The final prediction is a weighted combination of the predictions from all the stumps. The weights assigned to each stump help in the contribution to the overall prediction accuracy of the model.
P. A. Moreno-Sanchez [73] used the cross-industry-standard process of data-mining (CRISP-DM) for predicting CKD. The different steps of CRISP-DM were used for preprocessing, and ML classifiers were used for prediction. For evaluation, they considered the UCI CKD dataset, where findings showed that AB achieved better results for 12 features, i.e., 100% accuracy. N. M. Suganthi et al. [74] used the UCI CKD dataset for prediction with ML approaches with k-fold CV. The ML approaches included LR, NB, RF, DT, KNN and various ensembles. Among the different models, ensemble of AB with RF achieved 99% accuracy for predicting CKD. S. M. Imran et al. [75] used a probability weighting approach with AB for predicting CKD using the UCI CKD dataset, where the approach achieved 99% accuracy. S. A. Ebiaredoh-Mienye et al. [76] used the IG for feature selection and presented a cost-sensitive AB (CSAB) approach and evaluated their work on the UCI CKD dataset, where findings showed 99.8% accuracy. Z. N. Al-Kateeb et al. [77] presented a fast-predicting CKD approach called ABCoTCKD, which provides faster results with less latency and faster responses. The evaluations were conducted using the UCI CKD dataset, where the approach achieved 99.97% accuracy.

3.7.5. Light Gradient Boosting (LGBM)

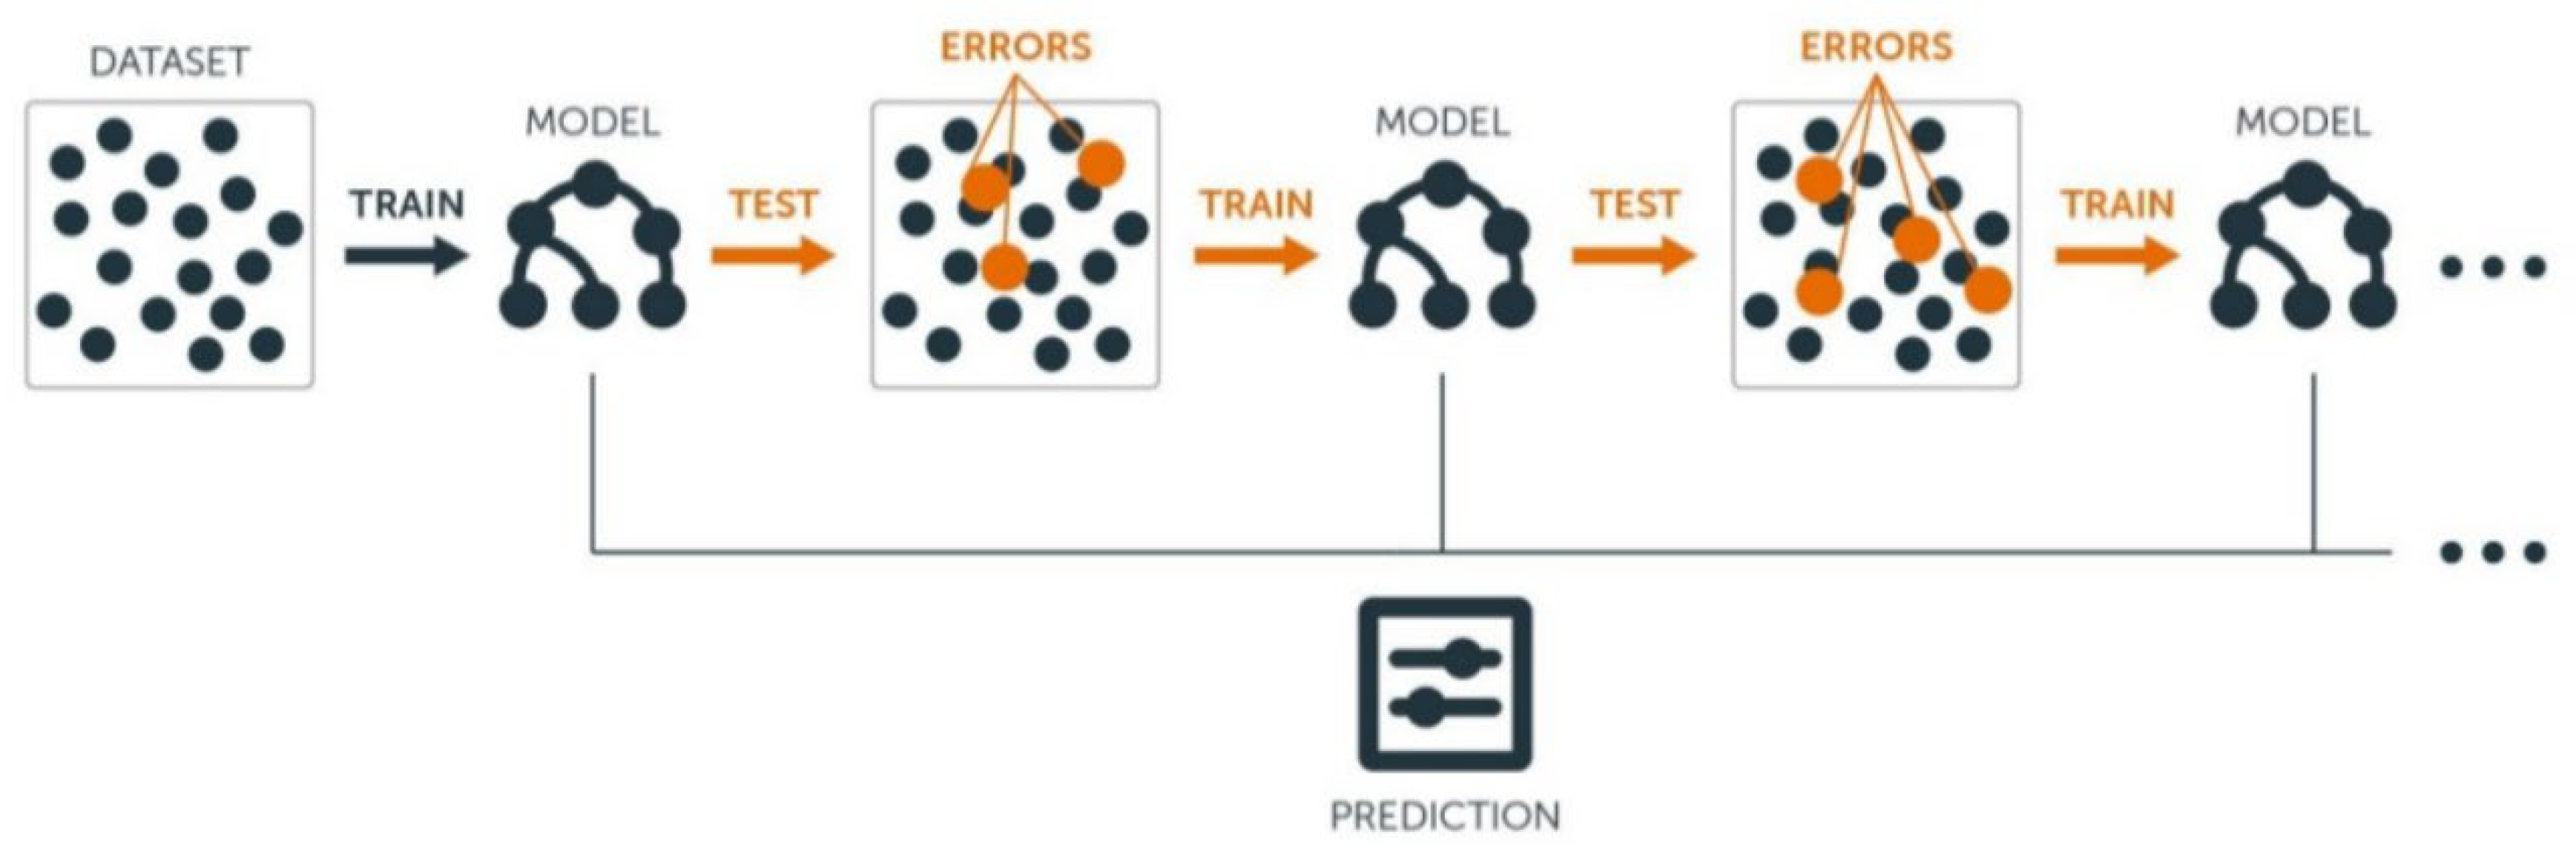
LGBM, or LightGBM, is a GB framework that plays a significant role in CKD prediction and management. It has advanced features that include support for large datasets and fast training speeds and make it well suited for handling complex patient information, like lab outcomes, medical data, and demographic data. LGBM has the ability to manage categorical features and handle high-dimensional data, which helps in predictive accuracy and robustness. Figure 12 shows the LGBM algorithm [78], which is an optimized GB framework developed for effective training and prediction. For CKD prediction, LGB constructs an ensemble of DTs iteratively. Every tree focuses on learning from errors of the previous trees, as illustrated by the ERRORS blocks in the figure. LightGBM uses techniques like gradient-based one-side sampling (GOSS) and exclusive feature bundling (EFB) for reducing memory usage and training time, which makes it applicable for large datasets. The final predictive outcome is achieved by combining predictions of all trees, achieving the highest accuracy and efficiency in CKD prediction models.
D. Ma et al. [78] presented a novel multi-modal model built using bidirectional-encoder representations from transformers ensembled with LGB (MD-BERT-LGB) for predicting CKD. For evaluation, they collected data from CKD patients and compared it with LGB, LR and convolutional neural network, where the MD-BERT-LGB achieved better results, i.e., 78.12% accuracy. M. M. Rahman et al. [79] presented different ensemble approaches for predicting CKD using the UCI CKD dataset. First, they used the MICE imputer for imputing data and then used SVM + SMOTE for handling class imbalance issues. For selecting features, the used RFE and Boruta approaches. Moreover, every ensemble approach was hyper-tuned according to the dataset for providing better results. Among the different approaches, the LGB achieved better outcomes, providing 99.75% accuracy. M. Li et al. [80] collected CKD data from patients, used ML approaches for predicting CKD, and aimed at developing an app. They used SHAP for interpreting data and used the LGB approach for predicting CKD, where the approach achieved 95% accuracy.
Limitations of boosting algorithms are as follows: A lack of transparency may limit use in medical fields, it may be influenced by noisy data and outliers, and it may have a high computational expense.

4. Findings

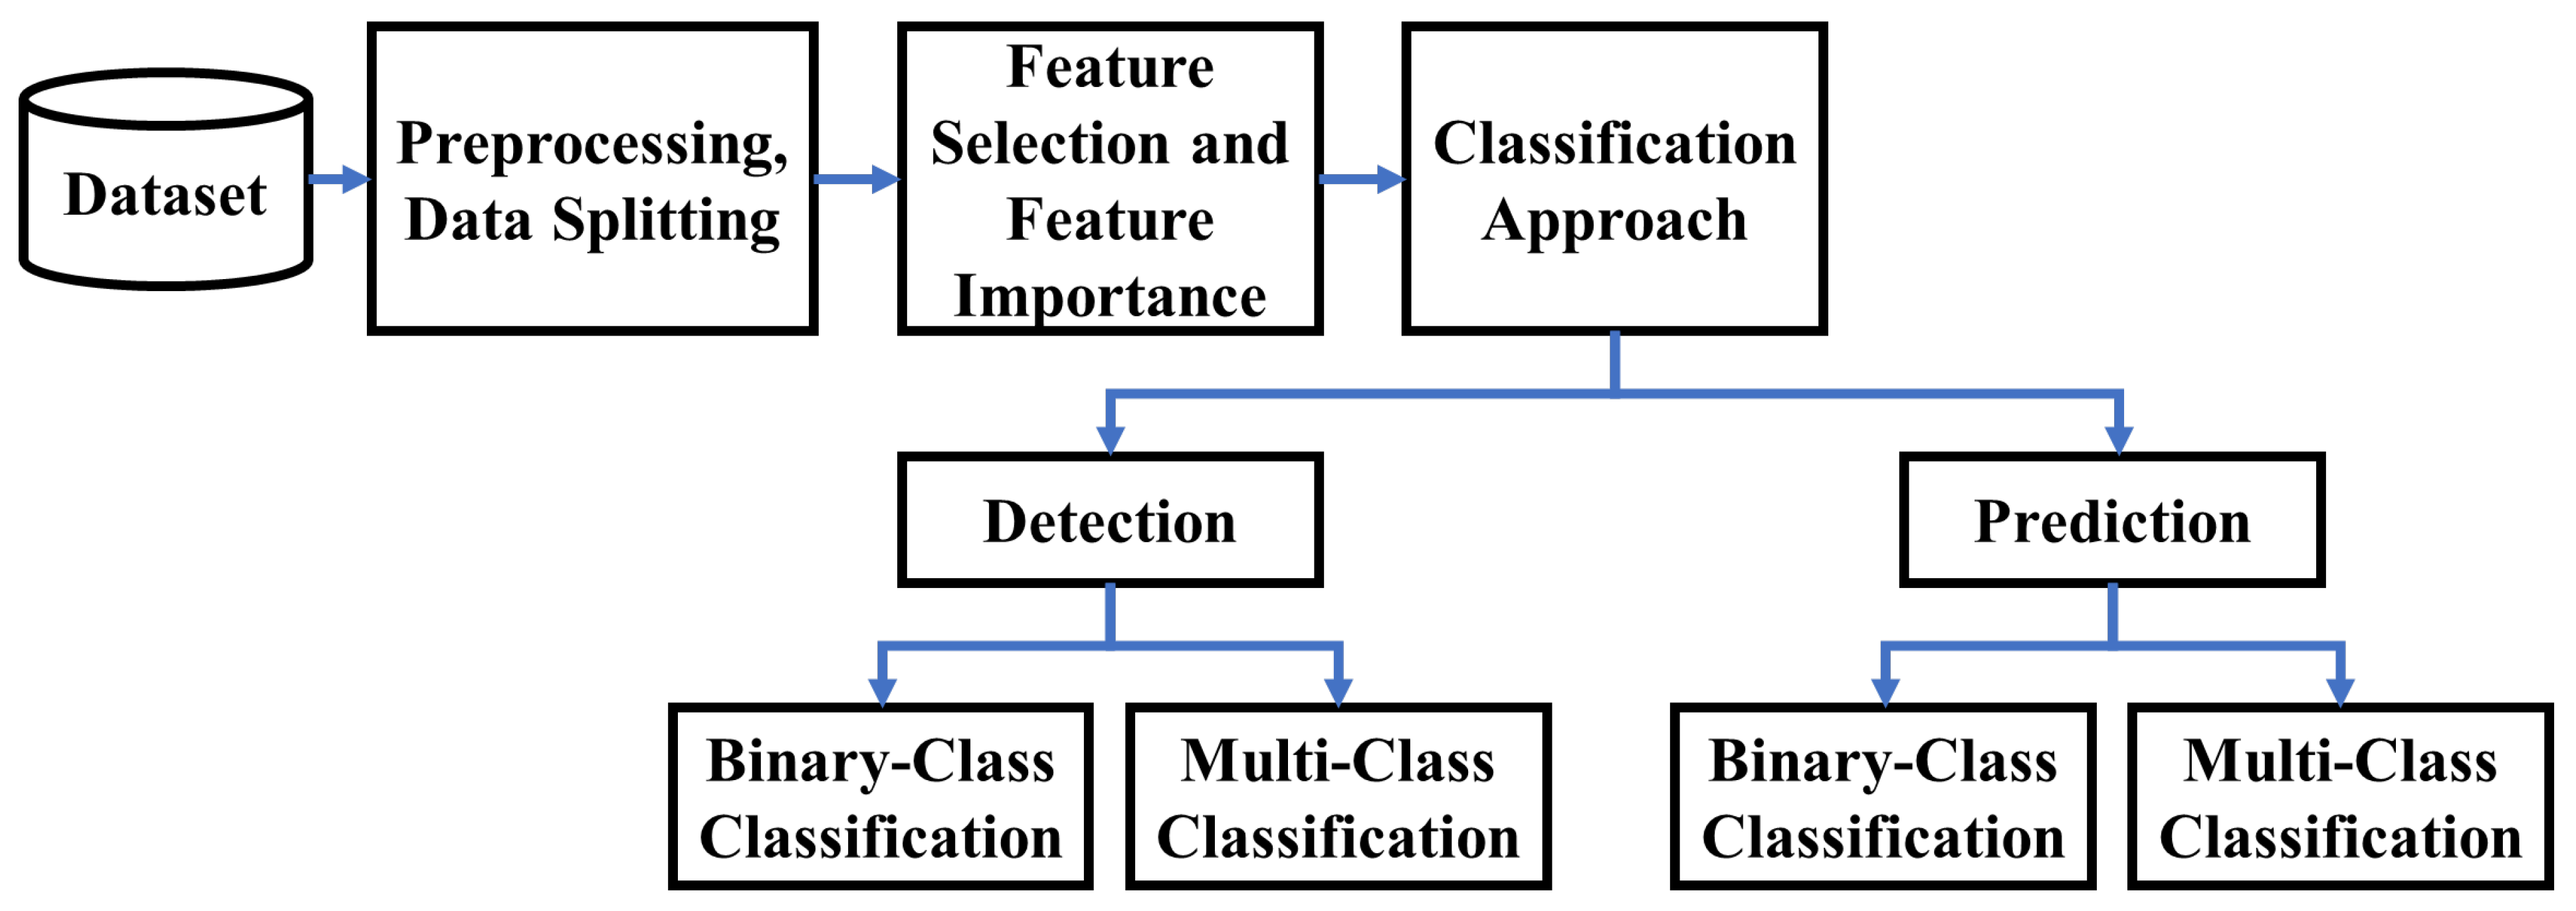
The flow presented in Figure 13 outlines a structured process for detecting and predicting CKD using ML techniques that the current existing approaches have followed. The first step in model training is considering the dataset, which consists of patient records with features such as demographics, medical history, and lab results where most of the dataset used is from the UCI repository. This dataset must perform preprocessing and data splitting, which is a critical step in model training where data is cleaned to address missing values, outliers, and noise. It also involves imputing missing values, normalizing or standardizing data, and transforming categorical variables into numerical formats. The data is then split into a training dataset and a testing dataset to evaluate the performance of the model, where the next phase is feature selection and feature importance, where important features are selected by identifying those most relevant for model prediction. This step is important in reducing the dataset’s dimensionality, solving overfitting problem, and improving the model’s generalization capability. The most important part is the classification approach, which entails dividing into detection and prediction methods, where detection involves identifying the presence of CKD, while prediction focuses on forecasting the disease’s progression. Both prediction and detection can be implemented using binary class classification, which identifies CKD and non-CKD. The multi-class classification categorizes the data into multiple stages based on the severity levels of CKD. The results achieved by the existing approaches are discussed in Table 1.
Table 1 shows a comprehensive comparison of various ML models applied to CKD prediction and detection across various datasets like CKD specifically from hospitals, the UCI repository, and Kaggle datasets. The table also highlights the research gaps. The models used a wide range of approaches from SVM and KNN, which are traditional algorithms, to ensemble methods like RF, boosting approaches, and hybrid models combining different techniques. The performance of SVM differs depending on the dataset and achieved the highest accuracy when combined with PCA on the UCI datasets and collected datasets. RF also has achieved highest accuracy on the UCI dataset; XGBoost and CatBoost also showed the highest performance, with XGBoost reaching up to 99.5% accuracy on the UCI dataset. AdaBoost when used alone or in combination with other methods also achieved the highest accuracy, with some models achieving perfect accuracy, precision, recall, and F-score.

5. Issues, Challenges and Possible Solutions

While existing approaches to CKD classification using ML techniques have shown promising results, there are issues and challenges. Here are some key issues faced as mentioned in the research gap shown in Table 1:
  • Data Quality and Preprocessing
    Heterogeneous Data: CKD datasets often come from different sources with various formats and standards; this leads to inconsistencies in dataset, which is the main problem in the CKD dataset.
    Missing Values: Medical datasets such as the UCI CKD dataset have missing or incomplete data, which affects the model performance, making it nonreliable.
    Imbalanced Data: Medical datasets are usually imbalanced, and UCI CKD datasets are imbalanced; that is, the number of CKD and NOT CKD samples are not equal, which can lead to complications in model training and biased prediction.
  • Model Performance
    Overfitting: Overfitting is the major issue, which means high-performing models may not generalize well on new data, especially when models are overly complex, which is challenging.
    Model Interpretability: Many high-performing models like RF and XGB act as black-box models, which makes it difficult for clinicians or doctors to interpret and trust the results of the model as they are unaware of the workings of the model.
  • Computational Challenges
    Resource Intensive: Many ensemble ML techniques require large computational power and memory for training the CKD model, which is a challenging task as it requires large resources.
    Scalability: Scalability becomes an issue as the volume of the CKD dataset increases; it results in the need for more efficient ML algorithms and hardware to handle large datasets.
  • Integration with Clinical Practice
    Clinical Validation: Many ML models perform well in a research setting but lack validation in real-world clinical environments, which is a challenging task; hence, clincal validation is required.
    User Acceptance: Clinicians or doctors may be hesitant to adopt ML models due to a lack of understanding or trust in the technology, which is the major challenging task.
    Regulatory Hurdles: Implementing ML models in healthcare requires the need for handling complex regulations to ensure compliance with health standards and patient privacy laws.
  • Specific Issues with Techniques
    Imbalanced Data Handling: There are advanced techniques like SMOTE that help in solving the data imbalance issue, and it can be solved by introducing synthetic data that may not match real-world data accurately.
    Feature Selection: Identifying the most relevant features for CKD classification is a challenging task and critical for model accuracy, and not performing feature selection can lead to poor model performance, which is a challenging task.
  • Generalization and Adaptability
    Generalization Across Populations: It is a challenging issue if models are trained on only one specific population’s datasets as they may not generalize well to diverse populations due to the demographic and genetic differences.
    Evolving Medical Knowledge: As medical knowledge advances, there is a need for the models to be continuously updated for new findings and practices, and this is a challenging issue as they need to build interdisciplinary teams between the clinicians and researchers.
Addressing the above challenges in CKD classification using ML requires a comprehensive solution approach. Data quality can be improved by standardizing data collection methods and also by improving data preprocessing methods by using robust imputation techniques for missing values for clinical records. Imbalanced datasets are common issues in clinical data, which can be solved using advanced sampling methods like SMOTE and its variations.
To solve overfitting and enhance model interpretability, rule-based systems can be employed. Also, by using explainable AI methods, clinicians can be helped by understanding and trusting the model prediction as most of the ML models act like black boxes.
Using many optimizing algorithms and using efficient hardware like GPUs and TPUs can solve the computational challenges by reducing training times. To understand the model output for the clinicians, it is important to integrate ML models into clinical practice, which requires thorough clinical validation and user-friendly interfaces. Also, it is important to build interdisciplinary teams with clinicians, data scientists and regulatory experts who can help with healthcare regulations.
Models should be trained on diverse populations, which can enhance generalization, and the models should continously be updated to adapt to new medical knowledge and practices, which, in turn, can enhance adaptability. Hence, by addressing all these challenges with the targeted solutions, researchers can develop more accurate, reliable, and clinically useful ML models for CKD classification.

6. Conclusions

The application of ML techniques in CKD classification shows strong potential to improve early detection. This review does not aim at finding the best ML model for CKD diagnosis. Instead, it attempts to provide a comparative understanding of the existing models with a focus on the merits, demerits, and possible applicability in different clinical scenarios. The comprehensive survey of various models along with RF, SVM, and XGB shows significant potential in identifying CKD, but their practical deployment is restricted by computational intensity and lack of interpretability. Current research struggles with various practical challenges like inconsistent or incomplete data, difficulty in auditing model decisions and computational efficiency. Hence, to overcome these barriers, it is important to implement advanced preprocessing techniques for inconsistent data and transparent AI methodologies like explainable AI for model interpretability. Such improvements will not only improve reliability but also ensure that predictive models are sufficiently robust and understandable for clinical application and become trustworthy. By focusing on solving the existing challenges and using technological advancements, we can find the way for more effective and trustworthy AI-driven healthcare solutions for CKD classification models.

Author Contributions

Conceptualization, K.S. and R.L.M.; Methodology, S.B. and K.S.; Validation, S.B. and K.S.; Formal Analysis, S.B., R.L.M. and K.M.C.R.; Investigation, S.B.; Resources, R.L.M.; Data Curation, S.B.; Writing—Original Draft Preparation, S.B.; Writing—Review & Editing, K.S., R.L.M. and K.M.C.R.; Visualization, K.M.C.R.; Supervision, R.L.M.; Project Administration, R.L.M. and K.M.C.R. All authors have read and agreed to the published version of the manuscript.

Funding

This research received no external funding.

Data Availability Statement

The data supporting the findings of this study are available in UCI and Kaggle repository at https://archive.ics.uci.edu/dataset/336/chronic+kidney+disease (accessed on 13 January 2026). and https://www.kaggle.com/datasets/mansoordaku/ckdisease (accessed on 13 January 2026) with reference number [24,25].

Conflicts of Interest

The authors declare no conflict of interest.

References

  1. Saraswat, T.; Pathak, S.; Sachdeva, S.; Sahu, K.; Sawhney, R. Kidney Disease Detection and Identification Using Artificial Intelligence. In Proceedings of the 2023 13th International Conference on Cloud Computing, Data Science & Engineering (Confluence), Noida, India, 19–20 January 2023; pp. 537–543. [Google Scholar] [CrossRef] [Scilit]
  2. Ameer, O.Z. Hypertension in chronic kidney disease: What lies behind the scene. Front. Pharmacol. 2022, 13, 949260. [Google Scholar] [CrossRef] [Scilit] [PubMed]
  3. Pujitha, K.; Soni, N.B.; Eram, L.F.; Sai, P.N.; Divija, S.; Supriya, R.S. Chronic Kidney Disease Detection Using Machine Learning Approach. In Proceedings of the 2023 2nd International Conference on Vision Towards Emerging Trends in Communication and Networking Technologies (ViTECoN), Vellore, India, 5–6 May 2023; pp. 1–5. [Google Scholar] [CrossRef] [Scilit]
  4. Farjana, A.; Liza, F.T.; Pandit, P.P.; Das, M.C.; Hasan, M.; Tabassum, F.; Hossen, M.H. Predicting Chronic Kidney Disease Using Machine Learning Algorithms. In Proceedings of the 2023 IEEE 13th Annual Computing and Communication Workshop and Conference (CCWC), Las Vegas, NV, USA, 8–11 March 2023; pp. 1267–1271. [Google Scholar] [CrossRef] [Scilit]
  5. Shukla, G.; Dhuriya, G.; Pillai, S.K.; Saini, A. Chronic Kidney Disease Prediction Using Machine Learning Algorithms and the Important Attributes for the Detection. In Proceedings of the 2023 IEEE IAS Global Conference on Emerging Technologies (GlobConET), London, UK, 19–21 May 2023; pp. 1–4. [Google Scholar] [CrossRef] [Scilit]
  6. Xu, J.H.; Toledo, I.; DeFranco, E.A.; Warshak, C.R.; Czarny, H.N.; Rossi, R.M. Risk of severe maternal morbidity and mortality among pregnant patients with chronic kidney disease. Am. J. Obstet. Gynecol. MFM 2025, 7, 101594. [Google Scholar] [CrossRef] [Scilit]
  7. Kushwaha, R.; Vardhan, P.S.; Kushwaha, P.P. Chronic Kidney Disease Interplay with Comorbidities and Carbohydrate Metabolism: A Review. Life 2023, 14, 13. [Google Scholar] [CrossRef] [Scilit]
  8. Francis, A.; Harhay, M.N.; Ong, A.C.; Tummalapalli, S.L.; Ortiz, A.; Fogo, A.B.; Fliser, D.; Roy-Chaudhury, P.; Fontana, M.; Nangaku, M.; et al. Chronic kidney disease and the global public health agenda: An international consensus. Nat. Rev. Nephrol. 2024, 20, 473–485. [Google Scholar] [CrossRef] [Scilit] [PubMed]
  9. GBD 2023 Chronic Kidney Disease Collaborators. Global, regional, and national burden of chronic kidney disease in adults, 1990–2023, and its attributable risk factors: A systematic analysis for the Global Burden of Disease Study 2023. Lancet 2025, 406, 2461–2482. [Google Scholar] [CrossRef] [Scilit] [PubMed]
  10. Fukuzaki, H.; Nakata, J.; Nojiri, S.; Shimizu, Y.; Shirotani, Y.; Maeda, T.; Kano, T.; Mishiro, M.; Nohara, N.; Io, H.; et al. Outpatient clinic specific for end-stage renal disease improves patient survival rate after initiating dialysis. Sci. Rep. 2023, 13, 5991. [Google Scholar] [CrossRef] [Scilit]
  11. Kim, Y.T.; Chung, H.J.; Park, B.R.; Kim, Y.Y.; Lee, J.H.; Kang, D.R.; Kim, J.Y.; Lee, M.Y.; Lee, J.Y. Risk of Cardiovascular Disease and Chronic Kidney Disease According to 2017 Blood Pressure Categories in Diabetes Mellitus. Hypertension 2020, 76, 766–775. [Google Scholar] [CrossRef] [Scilit]
  12. Shlipak, M.G.; Tummalapalli, S.L.; Boulware, L.E.; Grams, M.E.; Ix, J.H.; Jha, V.; Kengne, A.P.; Madero, M.; Mihaylova, B.; Tangri, N.; et al. The Case for Early Identification and Intervention of Chronic Kidney Disease: Conclusions from a Kidney Disease: Improving Global Outcomes (KDIGO) Controversies Conference. Kidney Int. 2020, 99, 34–47. [Google Scholar] [CrossRef] [Scilit]
  13. Alkhatib, L.; Diaz, L.A.; Varma, S.; Chowdhary, A.; Bapat, P.; Pan, H.; Kukreja, G.; Palabindela, P.; Selvam, S.A.; Kalra, K. Lifestyle Modifications and Nutritional and Therapeutic Interventions in Delaying the Progression of Chronic Kidney Disease: A Review. Cureus 2023, 15, e34572. [Google Scholar] [CrossRef] [Scilit]
  14. Jayaprabha, M.S.; Vishwa Priya, V. Chronic Kidney Disease (CKD) Prediction Using Stochastic Deep Radial Basis for Feature Extractiona Residual Neural Network. SN Comput. Sci. 2024, 5, 962. [Google Scholar] [CrossRef] [Scilit]
  15. Shivahare, B.D.; Singh, J.; Ravi, V.; Chandan, R.R.; Alahmadi, T.J.; Singh, P.; Diwakar, M. Delving into Machine Learning’s Influence on Disease Diagnosis and Prediction. Open Public Health J. 2024, 17. [Google Scholar] [CrossRef] [Scilit]
  16. Jallow, A.W.; Bah, A.N.S.; Bah, K.; Hsu, C.-Y.; Chu, K.-C. Machine Learning Approach for Chronic Kidney Disease Risk Prediction Combining Conventional Risk Factors and Novel Metabolic Indices. Appl. Sci. 2022, 12, 12001. [Google Scholar] [CrossRef] [Scilit]
  17. Islam, M.A.; Akter, S.; Hossen, M.S.; Keya, S.A.; Tisha, S.A.; Hossain, S. Risk Factor Prediction of Chronic Kidney Disease Based on Machine Learning Algorithms. In Proceedings of the 2020 3rd International Conference on Intelligent Sustainable Systems (ICISS), Thoothukudi, India, 3–5 December 2020. [Google Scholar] [CrossRef] [Scilit]
  18. Kanda, E.; Suzuki, A.; Makino, M.; Tsubota, H.; Kanemata, S.; Shirakawa, K.; Yajima, T. Machine learning models for prediction of HF and CKD development in early-stage type 2 diabetes patients. Sci. Rep. 2022, 12, 20012. [Google Scholar] [CrossRef] [Scilit] [PubMed]
  19. Krishnamurthy, S.; Ks, K.; Dovgan, E.; Luštrek, M.; Gradišek Piletič, B.; Srinivasan, K.; Li, Y.C.; Gradišek, A.; Syed-Abdul, S. Machine Learning Prediction Models for Chronic Kidney Disease Using National Health Insurance Claim Data in Taiwan. Healthcare 2021, 9, 546. [Google Scholar] [CrossRef] [Scilit]
  20. Kalantar-Zadeh, K.; Lockwood, M.B.; Rhee, C.M.; Tantisattamo, E.; Andreoli, S.; Balducci, A.; Laffin, P.; Harris, T.; Knight, R.; Kumaraswami, L.; et al. Patient-centred approaches for the management of unpleasant symptoms in kidney disease. Nat. Rev. Nephrol. 2022, 18, 185–198. [Google Scholar] [CrossRef] [Scilit] [PubMed]
  21. Singh, V.; Asari, V.K.; Rajasekaran, R. A Deep Neural Network for Early Detection and Prediction of Chronic Kidney Disease. Diagnostics 2022, 12, 116. [Google Scholar] [CrossRef] [Scilit] [PubMed]
  22. Shanthakumari, A.S.; Jayakarthik, R. Utilizing support vector machines for predictive analytics in chronic kidney diseases. Mater. Today Proc. 2023, 91, 951–956. [Google Scholar] [CrossRef] [Scilit]
  23. Kumar, V.; Yadav, A.K.; Sethi, J.; Ghosh, A.; Sahay, M.; Prasad, N.; Varughese, S.; Parameswaran, S.; Gopalakrishnan, N.; Kaur, P.; et al. The Indian Chronic Kidney Disease (ICKD) study: Baseline characteristics. Clin. Kidney J. 2021, 15, 60–69. [Google Scholar] [CrossRef] [Scilit]
  24. Rubini, L.; Soundarapandian, P.; Eswaran, P. Chronic Kidney Disease. UCI Machine Learning Repository. 2015. Available online: https://archive.ics.uci.edu/dataset/336/chronic+kidney+disease (accessed on 13 January 2026).
  25. Chronic Kidney Disease Dataset. Available online: https://www.kaggle.com/datasets/mansoordaku/ckdisease (accessed on 23 March 2025).
  26. Harsha, K.; Grace, A. Efficient detection of kidney disease using novel support vector machine in comparison with decision tree classifier. AIP Conf. Proc. 2023, 2821, 020032. [Google Scholar] [CrossRef] [Scilit]
  27. Swain, D.; Mehta, U.; Bhatt, A.; Patel, H.; Patel, K.; Mehta, D.; Acharya, B.; Gerogiannis, V.C.; Kanavos, A.; Manika, S. A Robust Chronic Kidney Disease Classifier Using Machine Learning. Electronics 2023, 12, 212. [Google Scholar] [CrossRef] [Scilit]
  28. Iftikhar, H.; Khan, M.; Khan, Z.; Khan, F.; Alshanbari, H.M.; Ahmad, Z. A Comparative Analysis of Machine Learning Models: A Case Study in Predicting Chronic Kidney Disease. Sustainability 2023, 15, 2754. [Google Scholar] [CrossRef] [Scilit]
  29. Listiana, E.; Muzayanah, R.; Muslim, M.A.; Sugiharti, E. Optimization of support vector machine using information gain and adaboost to improve accuracy of chronic kidney disease diagnosis. J. Soft Comput. Explor. 2023, 4, 152–158. [Google Scholar]
  30. Ashafuddula, N.I.M.; Islam, B.; Islam, R. An Intelligent Diagnostic System to Analyze Early-Stage Chronic Kidney Disease for Clinical Application. Appl. Comput. Intell. Soft Comput. 2023, 2023, 1–17. [Google Scholar] [CrossRef] [Scilit]
  31. Deepika, B.; Kr, V.R.; Rampure, D.N.; Prajwal, P.; Devan Gowda, G. Early Prediction of Chronic Kidney Disease by using Machine Learning Techniques. Int. J. Appl. Sci.-Res. Rev. 2020, 8, 7. [Google Scholar]
  32. Regin Bose, K.; Bhuvaneshwar, N.; Dinesh Kumar, D.; Brearley, B.J. Analysis of Chronic Kidney Disease Prediction Using Decision Tree and K-Nearest Neighbor Classification. J. Nambian Stud. 2023, 34, 1086–1097. [Google Scholar]
  33. Barakat, M.E.; Chung, G.C.; Lee, I.E. Performance Analysis of Chronic Kidney Disease Detection Based on K-Nearest Neighbors Data Mining. Int. J. Intell. Syst. Appl. Eng. 2023, 11, 393–400. [Google Scholar]
  34. Supriana, I.W.; Pramartha, C.; Putra, C.; Raharja, M.D.A.; Wiguna, P.P.K. Modified K-Nearest Neighbor Optimization with Genetic Algorithm in Chronic Kidney Disease Classification. In Advances in Computer Science Research; Atlantis Press: Dordrecht, The Netherlands, 2024; pp. 204–213. [Google Scholar] [CrossRef] [Scilit]
  35. Alturki, N.; Altamimi, A.; Umer, M.; Saidani, O.; Alshardan, A.; Alsubai, S.; Omar, M.; Ashraf, I. Improving Prediction of Chronic Kidney Disease Using KNN Imputed SMOTE Features and TrioNet Model. Comput. Model. Eng. Sci. 2024, 139, 3513–3534. [Google Scholar] [CrossRef] [Scilit]
  36. Santiko, I.; Honggo, I. Naive Bayes Algorithm Using Selection of Correlation Based Featured Selections Features for Chronic Diagnosis Disease. IJIIS Int. J. Inform. Inf. Syst. 2019, 2, 56–60. [Google Scholar] [CrossRef] [Scilit]
  37. Jongbo, O.A.; Adetunmbi, A.O.; Ogunrinde, R.B.; Badeji-Ajisafe, B. Development of an ensemble approach to chronic kidney disease diagnosis. Sci. Afr. 2020, 8, e00456. [Google Scholar] [CrossRef] [Scilit]
  38. Almustafa, K.M. Prediction of chronic kidney disease using different classification algorithms. Inform. Med. Unlocked 2021, 24, 100631. [Google Scholar] [CrossRef] [Scilit]
  39. Poonia, R.C.; Gupta, M.K.; Abunadi, I.; Albraikan, A.A.; Al-Wesabi, F.N.; Hamza, M.A.; B, T. Intelligent Diagnostic Prediction and Classification Models for Detection of Kidney Disease. Healthcare 2022, 10, 371. [Google Scholar] [CrossRef] [Scilit]
  40. Syarif, A.; Riana, O.D.; Shofiana, D.A.; Junaidi, A. A Comprehensive Comparative Study of Machine Learning Methods for Chronic Kidney Disease Classification: Decision Tree, Support Vector Machine, and Naive Bayes. Int. J. Adv. Comput. Sci. Appl. 2023, 14. [Google Scholar] [CrossRef] [Scilit]
  41. Azizah, M.F.; Paramitha, A.T. Predictive Modelling of Chronic Kidney Disease Using Gaussian Naive Bayes Algorithm. Int. J. Artif. Intell. Med. Issues 2024, 2, 125–135. [Google Scholar] [CrossRef] [Scilit]
  42. Pasadana, I.A.; Hartama, D.; Zarlis, M.; Sianipar, A.S.; Munandar, A.; Baeha, S.; Alam, A.R. Chronic Kidney Disease Prediction by Using Different Decision Tree Techniques. J. Phys. Conf. Ser. 2019, 1255, 012024. [Google Scholar] [CrossRef] [Scilit]
  43. Chaudhuri, A.K.; Sinha, D.; Banerjee, D.K.; Das, A. A novel enhanced decision tree model for detecting chronic kidney disease. Netw. Model. Anal. Health Inform. Bioinform. 2021, 10, 29. [Google Scholar] [CrossRef] [Scilit]
  44. Ilyas, H.; Ali, S.; Ponum, M.; Hasan, O.; Mahmood, M.T.; Iftikhar, M.; Malik, M.H. Chronic kidney disease diagnosis using decision tree algorithms. BMC Nephrol. 2021, 22, 273. [Google Scholar] [CrossRef] [Scilit]
  45. Rohith, J.; Uma Priyadarsini, P.S. An Analysis of Chronic Kidney Disease Using Novel Decision Tree Algorithm by Comparing Logistic Regression for Obtaining Better Accuracy. Cardiometry 2023, 1779–1785. [Google Scholar] [CrossRef] [Scilit]
  46. Halder, R.K.; Uddin, M.N.; Uddin, M.A.; Aryal, S.; Saha, S.; Hossen, R.; Ahmed, S.; Rony, M.A.; Akter, M.F. ML-CKDP: Machine learning-based chronic kidney disease prediction with smart web application. J. Pathol. Inform. 2024, 15, 100371. [Google Scholar] [CrossRef] [Scilit]
  47. Rashed-Al-Mahfuz, M.; Haque, A.; Azad, A.; Alyami, S.A.; Quinn, J.M.W.; Moni, M.A. Clinically Applicable Machine Learning Approaches to Identify Attributes of Chronic Kidney Disease (CKD) for Use in Low-Cost Diagnostic Screening. IEEE J. Transl. Eng. Health Med. 2021, 9, 4900511. [Google Scholar] [CrossRef] [Scilit]
  48. Chicco, D.; Lovejoy, C.A.; Oneto, L. A Machine Learning Analysis of Health Records of Patients with Chronic Kidney Disease at Risk of Cardiovascular Disease. IEEE Access 2021, 9, 165132–165144. [Google Scholar] [CrossRef] [Scilit]
  49. Al-Shamsi, S.; Regmi, D.; Govender, R.D. Chronic kidney disease in patients at high risk of cardiovascular disease in the United Arab Emirates: A population-based study. PLoS ONE 2018, 13, e0199920. [Google Scholar] [CrossRef] [Scilit] [PubMed]
  50. Moreno-Sánchez, P.A. Data-Driven Early Diagnosis of Chronic Kidney Disease: Development and Evaluation of an Explainable AI Model. IEEE Access 2023, 11, 38359–38369. [Google Scholar] [CrossRef] [Scilit]
  51. Dubey, Y.; Mange, P.; Barapatre, Y.; Sable, B. Prachi Palsodkar, Roshan Umate, Unlocking Precision Medicine for Prognosis of Chronic Kidney Disease Using Machine Learning. Diagnostics 2023, 13, 3151. [Google Scholar] [CrossRef] [Scilit]
  52. Liu, P.; Liu, Y.; Liu, H.; Xiong, L.; Mei, C.; Yuan, L. Random Forest Algorithm for Assessing Risk factors associated with Chronic Kidney Disease (Preprint). Asian Pac. Isl. Nurs. J. 2024, 8, e48378. [Google Scholar] [CrossRef] [Scilit] [PubMed]
  53. Torres, R.; Ohashi, O.; Pessin, G. A Machine-Learning Approach to Distinguish Passengers and Drivers Reading While Driving. Sensors 2019, 19, 3174. [Google Scholar] [CrossRef] [Scilit]
  54. Qin, J.; Chen, L.; Liu, Y.; Liu, C.; Feng, C.; Chen, B. A Machine Learning Methodology for Diagnosing Chronic Kidney Disease. IEEE Access 2020, 8, 20991–21002. [Google Scholar] [CrossRef] [Scilit]
  55. Chittora, P.; Chaurasia, S.; Chakrabarti, P.; Kumawat, G.; Chakrabarti, T.; Leonowicz, Z.; Jasiński, M.; Jasiński, Ł.; Gono, R.; Jasińska, E.; et al. Prediction of Chronic Kidney Disease—A Machine Learning Perspective. IEEE Access 2021, 9, 17312–17334. [Google Scholar] [CrossRef] [Scilit]
  56. Deng, H.; Zhou, Y.; Wang, L.; Zhang, C. Ensemble learning for the early prediction of neonatal jaundice with genetic features. BMC Med. Inform. Decis. Mak. 2021, 21, 338. [Google Scholar] [CrossRef] [Scilit]
  57. Ghosh, P.; Shamrat, F.M.J.M.; Shultana, S.; Afrin, S.; Anjum, A.A.; Khan, A.A. Optimization of Prediction Method of Chronic Kidney Disease Using Machine Learning Algorithm. In Proceedings of the 2020 15th International Joint Symposium on Artificial Intelligence and Natural Language Processing (iSAI-NLP), Bangkok, Thailand, 18–20 November 2020; pp. 1–6. [Google Scholar] [CrossRef] [Scilit]
  58. Baidya, D.; Umaima, U.; Islam, M.N.; Shamrat, F.M.J.M.; Pramanik, A.; Rahman, M.S. A Deep Prediction of Chronic Kidney Disease by Employing Machine Learning Method. In Proceedings of the 2022 6th International Conference on Trends in Electronics and Informatics (ICOEI), Tirunelveli, India, 28–30 April 2022; pp. 1305–1310. [Google Scholar] [CrossRef] [Scilit]
  59. Karkare, P. The Artistry of Stochastic Gradient Boosting and Gradient Boosting Classifiers in Chronic Renal Disease Classification. J. Electr. Syst. 2024, 20, 2405–2415. [Google Scholar] [CrossRef] [Scilit]
  60. Ganie, S.M.; Dutta, K.; Mallik, S.; Zhao, Z. Chronic kidney disease prediction using boosting techniques based on clinical parameters. PLoS ONE 2023, 18, e0295234. [Google Scholar] [CrossRef] [Scilit]
  61. Wang, W.; Chakraborty, G.; Chakraborty, B. Predicting the Risk of Chronic Kidney Disease (CKD) Using Machine Learning Algorithm. Appl. Sci. 2020, 11, 202. [Google Scholar] [CrossRef] [Scilit]
  62. Busi, R.A.; Stephen, M.J. Effective Classification of Chronic Kidney Disease Using Extreme Gradient Boosting Algorithm. Int. J. Softw. Innov. 2023, 11, 1–18. [Google Scholar] [CrossRef] [Scilit]
  63. Kumar, M. Early detection of chronic kidney disease using recursive feature elimination and cross-validated XGBoost model. Int. J. Comput. Mater. Sci. Eng. 2023, 13, 2350036. [Google Scholar] [CrossRef] [Scilit]
  64. Ghosh, S.K.; Khandoker, A.H. Investigation on explainable machine learning models to predict chronic kidney diseases. Sci. Rep. 2024, 14, 3687. [Google Scholar] [CrossRef] [Scilit] [PubMed]
  65. Chen, Z.; Tin, M.; Su, Z. Interpretable machine learning model integrating clinical and elastosonographic features to detect renal fibrosis in Asian patients with chronic kidney disease. J. Nephrol. 2024, 37, 1027–1039. [Google Scholar] [CrossRef] [Scilit] [PubMed]
  66. Dharmarathne, G.; Bogahawaththa, M.; McAfee, M.; Rathnayake, U.; Meddage, D.P.P. On the diagnosis of chronic kidney disease using a machine learning-based interface with explainable artificial intelligence. Intell. Syst. Appl. 2024, 22, 200397. [Google Scholar] [CrossRef] [Scilit]
  67. Pandey, M.; Karbasi, M.; Jamei, M.; Malik, A.; Pu, J.H. A Comprehensive Experimental and Computational Investigation on Estimation of Scour Depth at Bridge Abutment: Emerging Ensemble Intelligent Systems. Water Resour. Manag. 2023, 37, 3745–3767. [Google Scholar] [CrossRef] [Scilit]
  68. Gollapalli, M.; Saad, B.; Alabdulkarim, J.; Sendi, R.; Alsabt, R.; Alsharif, S. Detection of Chronic Kidney Disease Using Machine Learning Approach. In Proceedings of the 2022 14th International Conference on Computational Intelligence and Communication Networks (CICN), Al-Khobar, Saudi Arabia, 4–6 December 2022; pp. 460–465. [Google Scholar] [CrossRef] [Scilit]
  69. Dey, S.K.; Uddin, K.M.M.; Babu, H.M.H.; Rahman, M.M.; Howlader, A.; Uddin, K.M.A. Chi2-MI: A hybrid feature selection based machine learning approach in diagnosis of chronic kidney disease. Intell. Syst. Appl. 2022, 16, 200144. [Google Scholar] [CrossRef] [Scilit]
  70. Rani, R.; Patel, D.J.; Jain, S.K.; Jyothi, R.R. A novel deer hunting optimized cat boost approach for interactive medical decision-making system. Multidiscip. Sci. J. 2024, 6, 2024ss0610. [Google Scholar] [CrossRef] [Scilit]
  71. Imran, M.; Aslam, N.; Ahmad, H.; Mazhar, F.; Bhatti, Y.I.; Abid, U. Predictive Modeling of Chronic Kidney Disease Using Extra Tree Classifier: A Comparative Analysis with Traditional Methods. J. Comput. Biomed. Inform. 2024, 6, 261–271. [Google Scholar]
  72. Son, J.; Yang, S. A New Approach to Machine Learning Model Development for Prediction of Concrete Fatigue Life under Uniaxial Compression. Appl. Sci. 2022, 12, 9766. [Google Scholar] [CrossRef] [Scilit]
  73. Moreno-Sanchez, P.A. Chronic Kidney Disease Early Diagnosis Enhancing by Using Data Mining Classification and Features Selection. In IoT Technologies for HealthCare. HealthyIoT 2020; Lecture Notes of the Institute for Computer Sciences, Social Informatics and Telecommunications Engineering; Springer: Berlin/Heidelberg, Germany, 2021; pp. 61–76. [Google Scholar] [CrossRef] [Scilit]
  74. Suganthi, N.M.; Jemin, V.M.; Rama, P.; Chandralekha, E. Chronic Kidney Disease Detection Using AdaBoosting Ensemble Method and K-Fold Cross Validation. In Proceedings of the 2022 International Conference on Automation, Computing and Renewable Systems (ICACRS), Pudukkottai, India, 13–15 December 2022; pp. 979–983. [Google Scholar] [CrossRef] [Scilit]
  75. Imran, S.M.; Prakash, D.N. ReBoost: A Robust Chronic Kidney Disease detection using Probability Reweighted AdaBoost. Telematique 2022, 21. Available online: https://www.provinciajournal.com/index.php/telematique/article/view/416 (accessed on 13 January 2026).
  76. Ebiaredoh-Mienye, S.A.; Swart, T.G.; Esenogho, E.; Mienye, I.D. A Machine Learning Method with Filter-Based Feature Selection for Improved Prediction of Chronic Kidney Disease. Bioengineering 2022, 9, 350. [Google Scholar] [CrossRef] [Scilit]
  77. Al-Kateeb, Z.N.; Abdullah, D.B. AdaBoost-powered cloud of things framework for low-latency, energy-efficient chronic kidney disease prediction. Trans. Emerg. Telecommun. Technol. 2024, 35, e5007. [Google Scholar] [CrossRef] [Scilit]
  78. Ma, D.; Li, X.; Mou, S.; Cheng, Z.; Yan, X.; Lu, Y.; Yan, R.; Cao, S. Prediction of chronic kidney disease risk using multimodal data. In Proceedings of the 2021 The 5th International Conference on Compute and Data Analysis, Sanya, China, 2–4 February 2021. [Google Scholar] [CrossRef] [Scilit]
  79. Rahman, M.M.; Al-Amin, M.; Hossain, J. Machine learning models for chronic kidney disease diagnosis and prediction. Biomed. Signal Process. Control 2024, 87, 105368. [Google Scholar] [CrossRef] [Scilit]
  80. Li, M.; Han, S.; Liang, F.; Hu, C.; Zhang, B.; Hou, Q.; Zhao, S. Machine Learning for Predicting Risk and Prognosis of Acute Kidney Disease in Critically Ill Elderly Patients During Hospitalization: Internet-Based and Interpretable Model Study. J. Med. Internet Res. 2024, 26, e51354. [Google Scholar] [CrossRef] [Scilit] [PubMed]
Figure 1. Stages of chronic kidney disease.
Sci 08 00068 g001
Figure 2. Support vector machine structure.
Sci 08 00068 g002
Figure 3. KNN structure.
Sci 08 00068 g003
Figure 4. Naïve Bayes structure.
Sci 08 00068 g004
Figure 5. Decision tree structure.
Sci 08 00068 g005
Figure 6. Random forest structure.
Sci 08 00068 g006
Figure 7. Logistic regression structure.
Sci 08 00068 g007
Figure 8. Gradient boosting structure.
Sci 08 00068 g008
Figure 9. XGB structure.
Sci 08 00068 g009
Figure 10. CatBoost structure.
Sci 08 00068 g010
Figure 11. AdaBoost structure.
Sci 08 00068 g011
Figure 12. Light GBM structure.
Sci 08 00068 g012
Figure 13. Methodology of the discussed ML classifiers.
Sci 08 00068 g013
Table 1. Findings from literature survey.
RefDatasetModelAccuracyPrecisionRecallF-ScoreResearch Gap
[22]CKDESVM80808080Missing values, severity was not identified and heterogeneous data
UCI98.298.498.498.4
Kaggle98.898.698.698.6
CKDEKNN58.858.658.658.6
UCI98.898.698.698.6
Kaggle99.299.299.299.2
[26]UCISVM96.396.196.596.2Missing values
[27]UCISVM99.39910099Limited-size dataset
RF98.679710099
[28]CollectedSVM + Laplace90.5285.8594.4993.04Imbalanced data
[29]UCIAB + IG + SVM99.7599.5699.6599.45Missing values
[30]UCISVM + PCA100100100100Overfitting
Collected100100100100
UCI+ Collected97.37999697
[31]UCIKNN97979797Missing values, severity was not identified
[32]CKDKNN97.597.8795.8396.84Overfitting
[33]CKDKNN (k = 2)9998.698.898.8Overfitting
[34]CKDMKNN9393.293.293.2Overfitting
[35]UCIKNN + SMOTE98.9798.9299.8499.76Missing values, severity was not identified
[36]CKDNB93.5893.5493.1293.52Overfitting
[37]UCINB94.297.388.995.50Imbalanced data
[38]UCINB9594.894.694.5Limited-size dataset
[39]UCINB95959595Missing values, severity was not identified
LR97.5989798
[40]KaggleNB96969696Overfitting
[41]KaggleGNB89.9388.1589.9388.42Imbalanced data
[42]UCIDS9292.69292.1Model interpretability, limited sample size, overfitting
HT95.7596.295.895.8
J4899999999
CTC9797.29797
J48Graft98.7598.798.898.7
LMT9898.19898
NBTree98.598.598.598.5
RF100100100100
RT95.595.695.595.5
REPTree96.7596.896.896.7
SC97.597.597.597.5
[43]UCIEDT100100100100Severity was not identified, overfitting
[44]UCIJ4885.3085.285.285.2Model interpretability
[45]CKDNDT96.6696.296.396.4Imbalanced data
[46]UCIDT96.696.296.595.6Overfitting
[47]UCIRF99.5010098.75100Model interpretability
[48]CKDRF84.379.385.255.0Missing values
[50]UCIRF97.510010098Model interpretability
[51]UCIRF98.75606261Imbalanced data
[52]UCIRF9392.591.592.5Handling missing values
[54]UCILR+RF99.8399.8499.8099.86Imbalanced data
[55]UCILR + Wrapper + FS78.5498.5510099.27Model interpretability
[57]UCIGB99.8097.5698.1598.45Overfitting
[58]UCIGB9897.597.697.4Handling missing values
[59]UCIGB99.29810098Missing values, severity was not identified, heterogeneous data, overfitting
SGB99.29810099
KaggleGB100100100100
SGB100100100100
[60]UCIGB97.4697.4397.4297.12Model interpretability, severity was not identified
XGB95.9395.5595.4695.58
CB96.4496.4296.1296.35
AB98.4698.5698.4298.45
[62]UCIXGB99.2999.1798.9799.65Imbalanced data
[63]UCIXGB99.599.299.399.4Handling missing values
[64]Collected XGB93.2991.8094.7393.13
[65]CollectedXGB + SHAP + CV95908690Model Interpretability
[66]UCIXGB97.598.797.4098Severity was not identified
[68]UCICB9998.1298.2198.46Model interpretability
[69]UCICB96969596Overfitting
[70]UCICB97.296.595.597.7Handling missing values
[71]UCICB98.33969798Imbalanced data
[73]UCIAB100100100100Overfitting
[74]UCIAB + RF99999999Handling missing values, severity was not identified
[75]UCIWeight + AB99999999Imbalanced data
[76]UCICSAB99.810099.899.8Overfitting
[77]UCIAdaBoostCoTCKD99.9799.9699.9599.96Model interpretability
[78]CollectedMD-BERT-LGB78.1275.1275.6576.42Advanced technique may limit the accessibility of the model for healthcare professionals
[79]UCILGB99.7599.4099.4199.61Imbalanced data
[80]CollectedLGB959494.294.4Overfitting
Disclaimer/Publisher’s Note: The statements, opinions and data contained in all publications are solely those of the individual author(s) and contributor(s) and not of MDPI and/or the editor(s). MDPI and/or the editor(s) disclaim responsibility for any injury to people or property resulting from any ideas, methods, instructions or products referred to in the content.