Abstract
Agricultural markets are increasingly exposed to global risks as climate change intensifies and macro-financial volatility becomes more prevalent. This study examines the dynamic interconnection between major agricultural commodities—soybeans, corn, wheat, rough rice, and sugar—and key uncertainty indicators, including climate policy uncertainty, global economic policy uncertainty, geopolitical risk, financial market volatility, oil price volatility, and the U.S. Dollar Index. Using a Time-Varying Parameter Vector Autoregressive (TVP-VAR) model with monthly data, we assess both internal spillovers within the commodity system and external spillovers from macro-level uncertainties. On average, the external shock from the VIX to corn reaches 12.4%, and the spillover from RGEPU to wheat exceeds 10%, while internal links like corn to wheat remain below 8%. The results show that external uncertainty consistently dominates the connectedness structure, particularly during periods of geopolitical or financial stress, while internal interactions remain relatively subdued. Unexpectedly, recent global disruptions such as the COVID-19 pandemic and the Russia–Ukraine conflict do not exhibit strong or persistent effects on the connectedness patterns, likely due to model smoothing, stockpiling policies, and supply chain adaptations. These findings highlight the importance of strengthening international macro-financial and climate policy coordination to mitigate the propagation of external shocks. By distinguishing between internal and external connectedness under climate stress, this study contributes new insights into how systemic risks affect agri-food systems and offers a methodological framework for future risk monitoring.
1. Introduction
The growing intensity of global climate change has fundamentally transformed the risk landscape for agricultural commodity markets, creating unprecedented challenges for food security, financial stability, and sustainable development [1,2]. As extreme weather events become more frequent and climate policies evolve rapidly, understanding the interconnected dynamics of agricultural markets under climate stress has emerged as a critical research frontier in financial economics and environmental policy [3,4]. Agricultural commodities occupy a unique position in the global financial system, serving simultaneously as essential inputs for food security and increasingly important components of diversified investment portfolios [5,6]. However, their inherent vulnerability to climate variability creates complex spillover patterns that traditional financial models struggle to capture adequately [7,8].
Recent research demonstrates that climate-related shocks manifest asymmetrically across market conditions, with “spillover effects higher in extreme market conditions than in normal market conditions” [9]. This evidence suggests that conventional mean-based analytical approaches may significantly underestimate the true extent of climate stress transmission [10,11]. Studies employing quantile-based methodologies reveal that “connectedness measures estimated at the lower and upper quantiles are much higher than those estimated at the median” [12], indicating that climate stress effects are particularly pronounced during extreme market conditions [13,14]. Furthermore, research on climate policy uncertainty demonstrates that spillover dynamics exhibit temporal asymmetry, with climate policy uncertainty acting as a “net transmitter in extreme market scenarios but serves as a net receiver in stable markets” [15,16].
Despite substantial progress in understanding commodity market connectedness [17,18], critical knowledge gaps remain regarding climate-specific transmission mechanisms. The existing literature predominantly focuses on traditional financial and energy shocks, with limited attention to climate stressors [19,20]. Research demonstrates that climate policy uncertainty spillovers “concentrate significantly in soybeans and corn markets,” particularly during extreme conditions [21]. However, comprehensive analysis of how climate stress propagates dynamically through diverse agricultural commodity networks remains inadequately addressed [22,23]. Most studies employ static models that fail to capture the evolving nature of market relationships during climate-related disruptions, despite evidence that crisis periods fundamentally alter connectedness structures [24,25,26].
This study addresses these critical gaps by analyzing the connectedness of five strategically selected agricultural commodities—corn, soybeans, wheat, rice, and sugar—under climate stress using a comprehensive time-varying parameter vector autoregression (TVP-VAR) approach with quantile connectedness analysis. This study contributes a novel distinction between internal and external connectedness, offering a structured lens to disentangle the roles of macro-financial and climate-related uncertainty versus commodity-specific dynamics. This analytical separation allows for a clearer attribution of spillover sources, enhancing our understanding of how systemic external shocks—such as financial volatility or global uncertainty—interact with internal market linkages within the agricultural sector. The commodity selection is grounded in [5,27]. Corn and soybeans emerge as particularly critical given their dual roles in food production and biofuel manufacturing, creating complex linkages between agricultural markets, energy systems, and climate policies [22,28]. Wheat’s pronounced sensitivity to geopolitical and climate shocks has been documented during recent crises, with significant volatility transmission observed during the Russia–Ukraine conflict [26,29]. Rice and sugar complete the analysis by representing regional market dynamics and climate policy transmission mechanisms through their roles in food systems and industrial applications, including biofuel production [30,31].
The incorporation of uncertainty variables into the analytical framework is theoretically and empirically justified by the uncertainty transmission mechanisms in agricultural commodity markets under conditions of climate stress. Climate policy uncertainty (CPU) serves as a critical transmission channel linking environmental regulatory frameworks to agricultural market dynamics, as policy shifts directly affect production costs, technological adoption, and market expectations [32]. The Global Economic Policy Uncertainty (GEPU) index captures broader macroeconomic uncertainty that propagates through international trade channels, affecting commodity demand and supply chain stability during climate-related disruptions [33,34]. Geopolitical risk emerges as particularly relevant given the concentration of agricultural production in geopolitically sensitive regions, with events such as the Russia–Ukraine conflict demonstrating how geopolitical tensions amplify climate-related market volatilities [34]. Financial market uncertainty, measured through the VIX and OVX indices, reflects the risk perception mechanisms that influence commodity pricing during extreme weather events and climate policy announcements [35]. Finally, the U.S. Dollar Index (DXY) captures currency-mediated transmission effects, as variations in dollar strength significantly impact international commodity trade flows and pricing dynamics, particularly during periods of climate-induced supply disruptions [36]. Theoretically, a strong dollar may amplify the effects of climate shocks by reducing the competitiveness of commodity exports from dollar-linked economies, thereby exacerbating supply-demand mismatches and volatility in global food prices. This comprehensive uncertainty framework enables the identification of multiple transmission channels through which climate stress propagates across agricultural commodity networks, addressing the multi-dimensional nature of climate-related market risks.
The methodological contribution integrates time-varying parameter estimation with quantile-specific connectedness analysis to capture both the dynamic nature of market relationships and their differential impacts across [12,16]. This approach addresses evidence that “climate risks and oil shocks are more pronounced in the short term” [23] while accommodating the asymmetric spillover patterns documented in extreme market scenarios [9,15]. The TVP-VAR framework specifically addresses the temporal dimension of climate stress transmission [29,37], while quantile connectedness analysis reveals how these effects vary across different market states [10,13]. The temporal scope of 2000–2025 strategically encompasses multiple crisis periods—including the 2008 Global Financial Crisis [14,38,39].
This research makes several contributions to existing literature. First, it provides a comprehensive analysis of climate stress transmission mechanisms across multiple agricultural commodities, utilizing advanced time-varying and quantile-specific methodologies [15,16]. Second, it extends understanding of agricultural commodity connectedness beyond traditional financial shocks to explicitly incorporate climate-related stressors through direct measurement of climate policy uncertainty [21,23]. Third, it offers practical insights for policymakers, investors, and risk managers by identifying how climate stress propagates through agricultural commodity networks under different market conditions, addressing the growing need for climate-aware risk management in an increasingly volatile global economy [2,3].
The remainder of this paper is organized as follows. Section 2 reviews the relevant literature on commodity market connectedness and the transmission of climate stress. Section 3 presents the methodological framework, including the TVP-VAR model specification and quantile connectedness measures. Section 4 describes the data and presents empirical results, including static and dynamic connectedness measures across different quantiles. Section 5 discusses the implications for portfolio management, risk assessment, and policy formulation. Section 6 concludes with directions for future research.
2. Literature Review and Research Framing
2.1. Historiograph
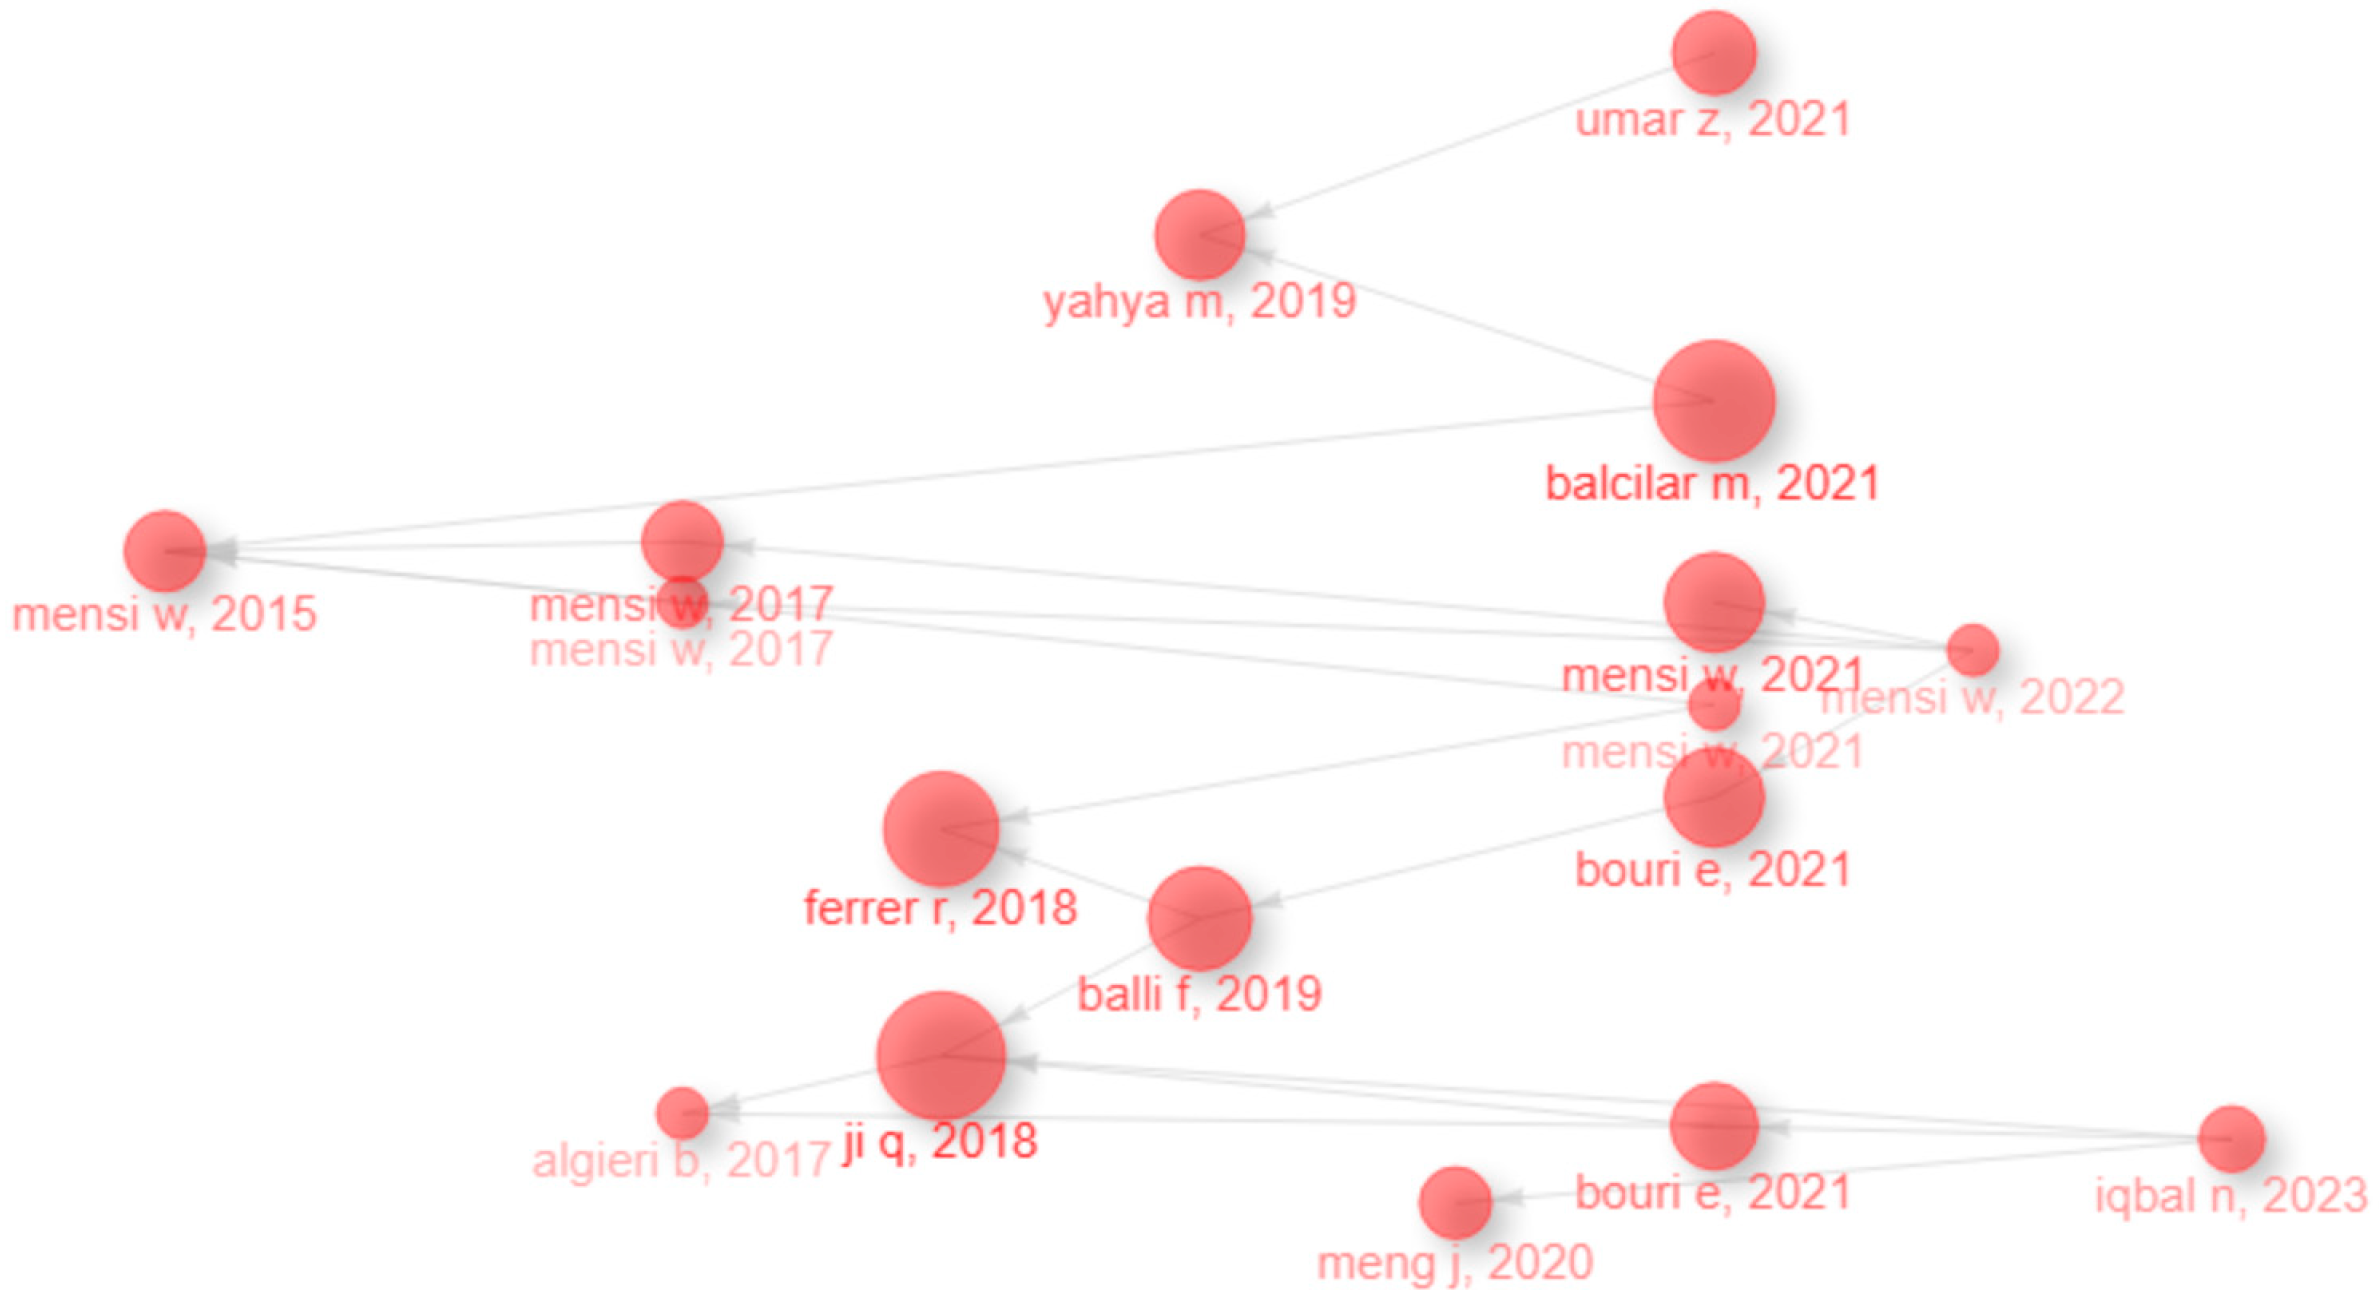
Figure 1 illustrates a historiographic map that depicts the chronological evolution and thematic clustering within agricultural commodity connectedness research, highlighting a critical literature gap that the present study addresses. The visualization demonstrates a single cohesive cluster indicating a concentrated lineage of influence within the field, with interconnected nodes representing foundational works that have shaped the academic development of commodity market analysis and Time-Varying Parameter Vector Autoregressive (TVP-VAR) methodologies [40,41]. While existing research has extensively examined agricultural commodity connectedness during financial crises, oil price shocks, and periods of general market volatility, as evidenced by the dense network of studies spanning from 2015 to 2023 [42,43,44,45], the literature lacks a systematic investigation of how climate-specific stress factors influence agricultural commodity market interdependencies. Previous studies have predominantly focused on traditional economic and financial drivers of connectedness, with climate considerations remaining largely implicit or absent from the analytical framework [42,43].
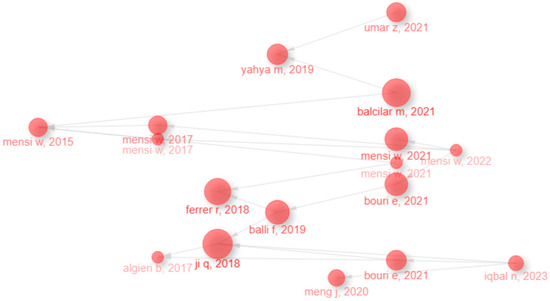
Figure 1.
Historiographic map based on keyword co-occurrence derived from bibliometric analysis. Source: Authors’ elaboration using Bibliometrix [44] from Scopus and WoS databases.
The historiographic structure reveals that foundational studies have established core methodologies for examining spillover effects and market connectedness, with subsequent research building upon these frameworks to analyze specific financial variables, macroeconomic indicators, and crisis-driven transmission mechanisms [18,45,46]. The temporal progression shown in Figure 1 demonstrates how methodological innovations have evolved from basic correlation analyses to sophisticated TVP-VAR approaches [47,48]. However, none of the interconnected studies have systematically isolated climate-induced stress as a distinct driver of agricultural market interdependence. This represents a significant omission given the increasing frequency and severity of climate-related disruptions affecting global agricultural production and supply chains, particularly evident in the recent surge of research focusing on contemporary global challenges without explicitly addressing environmental factors [49,50].
Furthermore, the current research fills this identified gap by explicitly incorporating climate stress variables into the TVP-VAR methodology, extending beyond the conventional approach that treats agricultural commodity connectedness as primarily driven by macroeconomic uncertainty, oil price fluctuations, and financial market conditions [12,48,51]. The historiographic map [52,53] has not systematically analyzed climate-induced stress as a unique transmission mechanism, which is the methodological innovation contributed by this study [43,54].
This approach addresses the literature’s limitation in capturing the unique characteristics of climate-driven market disruptions, which may exhibit different temporal dynamics, persistence patterns, and cross-commodity transmission mechanisms compared to purely financial or economic shocks [12,46,47]. The research thus bridges the gap between climate science and financial market analysis, building upon the solid methodological foundation illustrated in Figure 1 while extending into uncharted territory [40,41,48]. By positioning climate stress as a central analytical component rather than a peripheral consideration, this study offers crucial insights for portfolio managers, policymakers, and agricultural stakeholders operating in an era of unprecedented climate volatility, thereby contributing to the next phase of academic development in agricultural commodity connectedness research [49,51,53].
2.2. Thematic Map
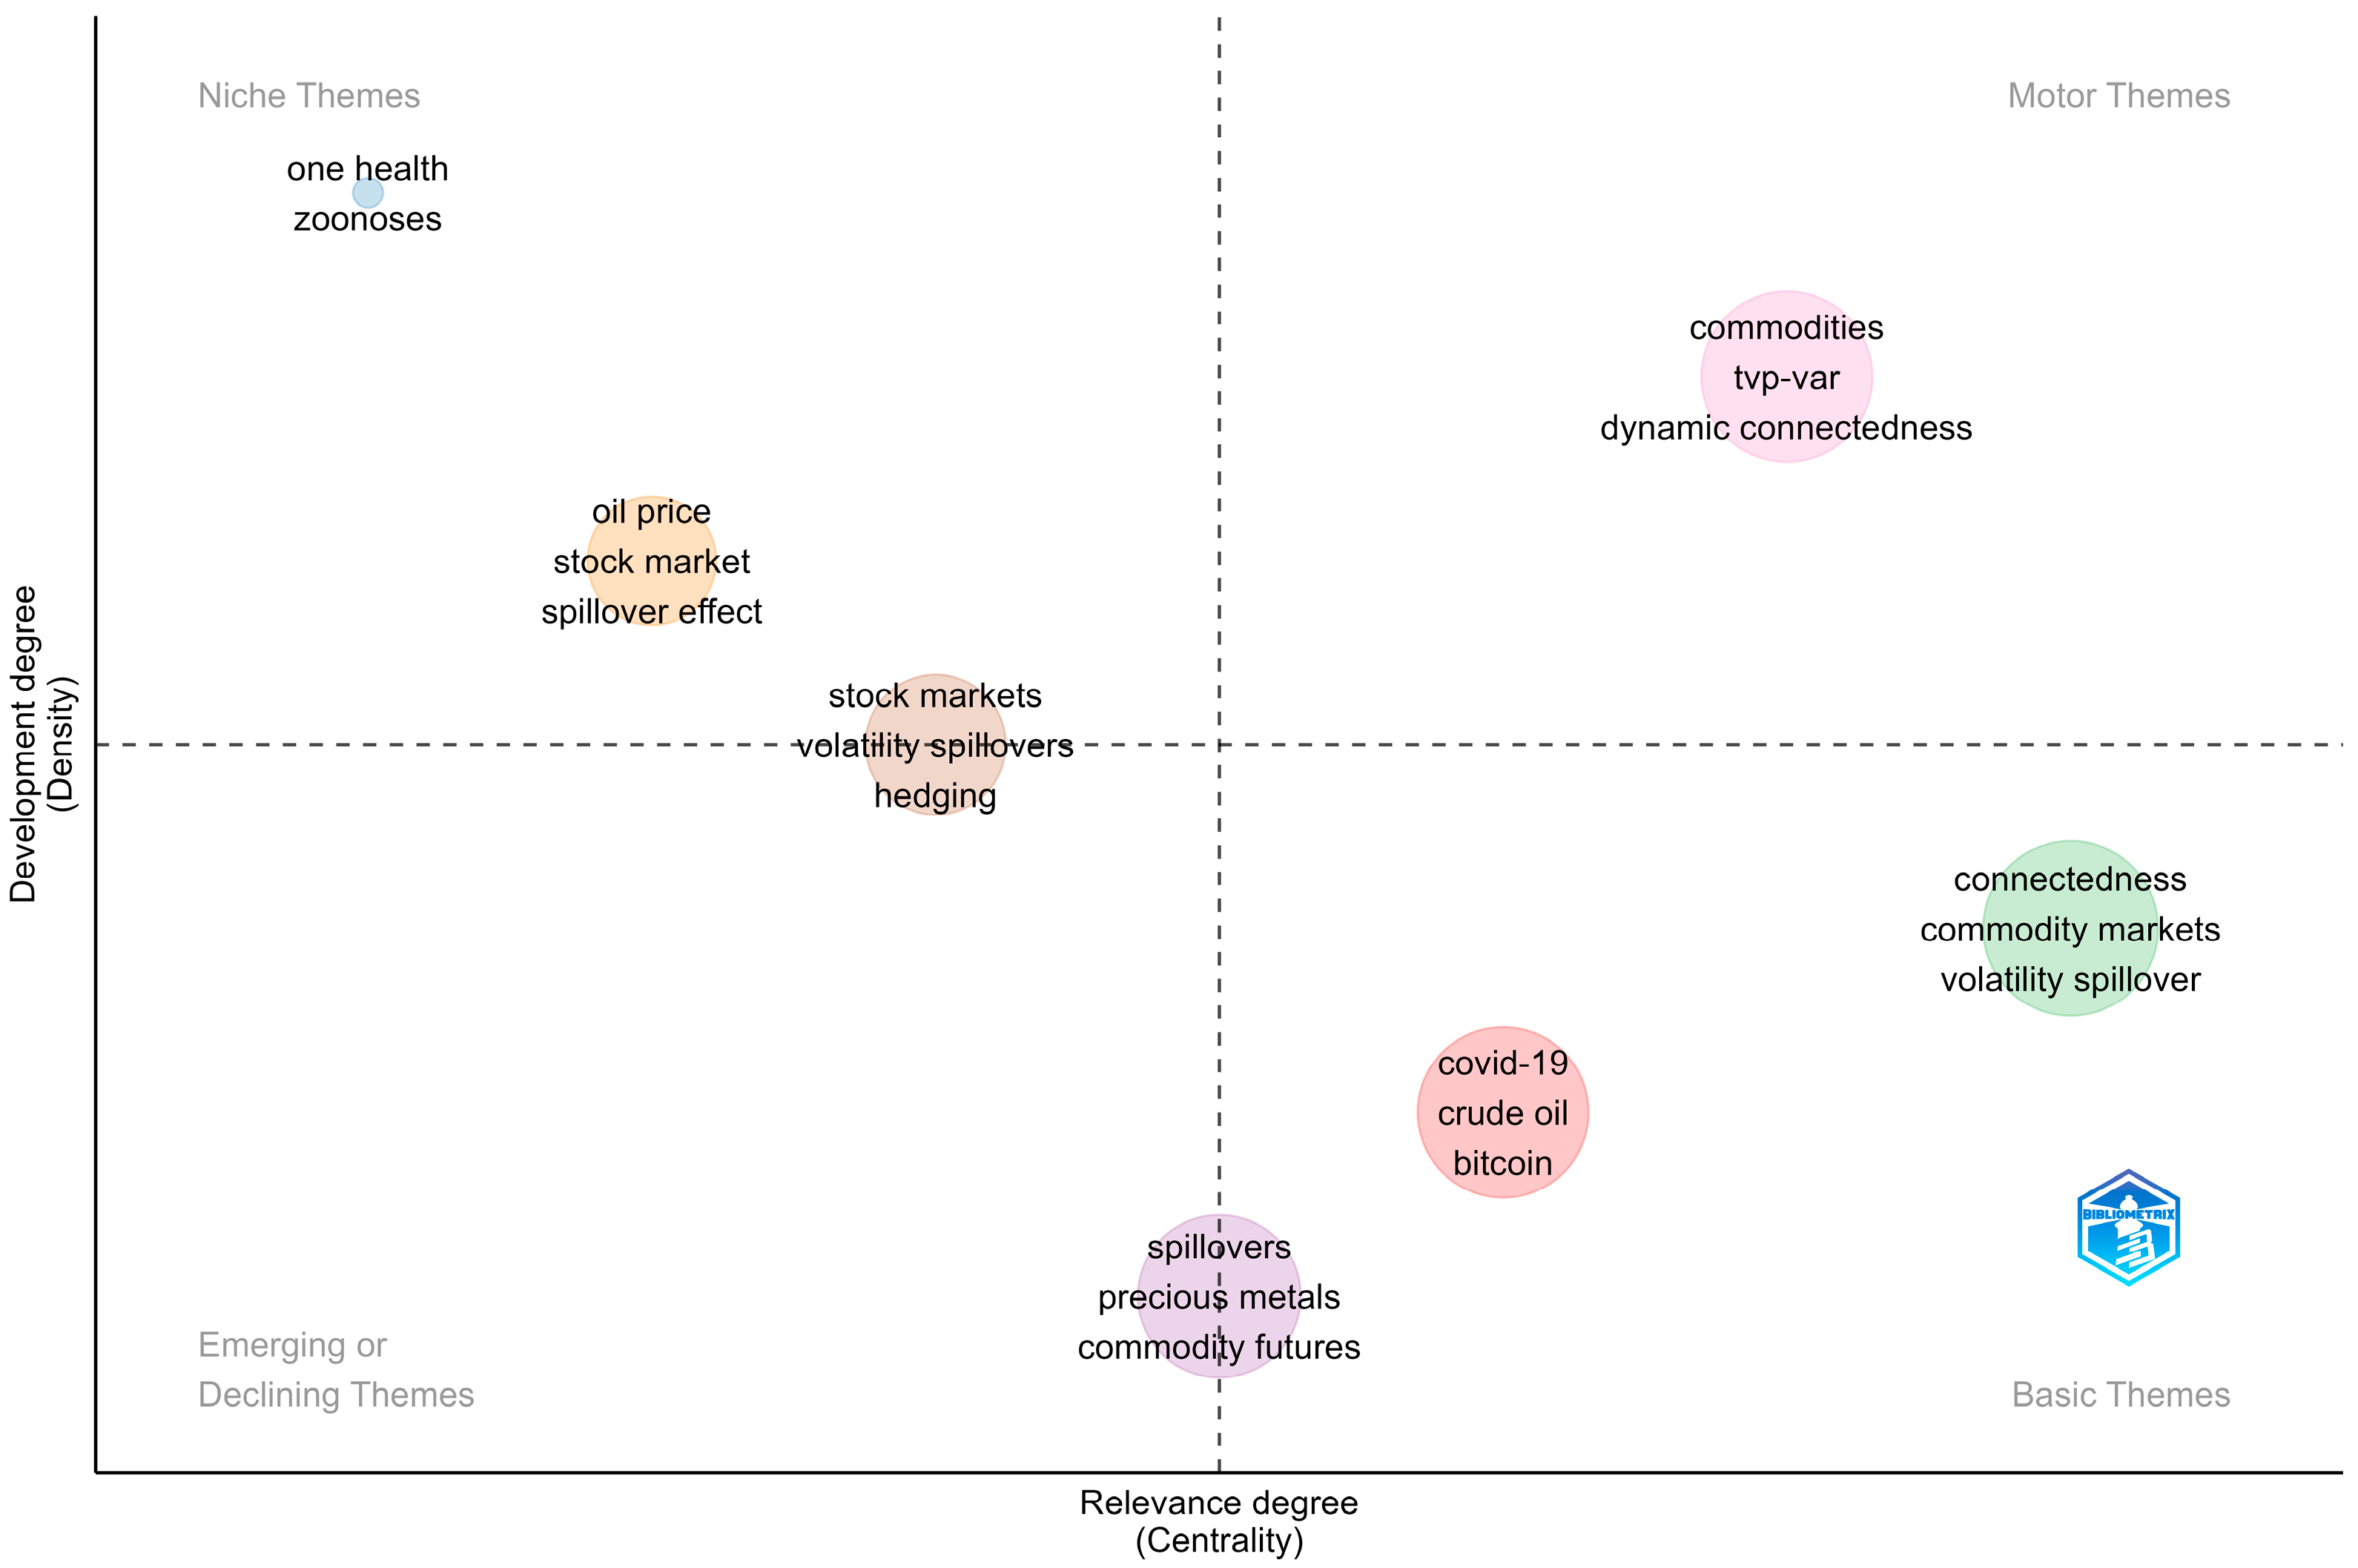
The thematic map analysis (Figure 2) reveals four distinct research quadrants based on the density and centrality of topics within the commodity connectedness literature. The upper-right quadrant, characterized as “Motor Themes,” demonstrates the highest relevance and development density, featuring core concepts including “commodities,” “tvp-var,” and “dynamic connectedness.” This cluster represents the most mature and central research area, indicating substantial scholarly attention and methodological sophistication. The prevalence of TVP-VAR methodology within this quadrant aligns with our literature review findings, where TVP-VAR appear [15,16,29], establishing it as the dominant analytical framework for examining dynamic relationships in commodity markets. The positioning of “volatility spillover” and “connectedness” as central themes corroborates empirical evidence that spillover analysis has become fundamental to understanding market interdependencies, particularly during crisis periods [25,37].
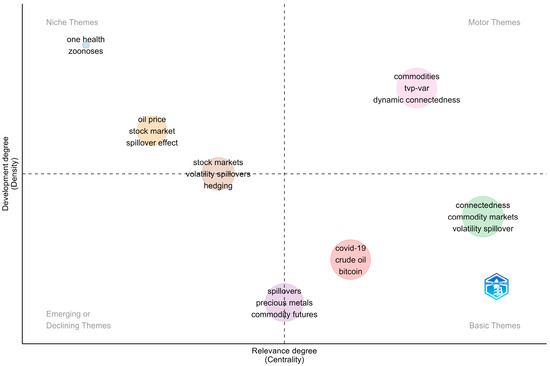
Figure 2.
Thematic map. Source: Authors’ elaboration using Bibliometrix [44] from Scopus and WoS databases.
Notably absent from the Motor Themes quadrant are climate-specific variables, with “COVID-19,” “crude oil,” and “bitcoin” appearing in the lower-right as Basic Themes with moderate centrality but lower development density. This positioning underscores the identified research gap in our study, where climate stress transmission mechanisms remain underexplored despite growing evidence of their significance. The literature review demonstrates that while traditional financial and energy shocks dominate the connectedness research [10,13], climate-specific stressors such as climate policy uncertainty receive limited attention, with only isolated studies examining their spillover effects in agricultural commodity markets [21,23]. This thematic analysis validates our research contribution by highlighting the need to integrate established TVP-VAR methodologies from the Motor Themes cluster with climate stress variables, thereby advancing climate-specific research from its current peripheral position toward the central research agenda in commodity market connectedness.
This study strategically bridges this identified gap by synthesizing the methodological rigor of the Motor Themes cluster with the emerging imperative for climate-aware financial analysis. By employing the well-established TVP-VAR framework enhanced with quantile connectedness analysis—both central methodologies in the dominant research cluster—we extend the analytical frontier to explicitly incorporate climate policy uncertainty as a primary driver of agricultural commodity interconnectedness. This approach transforms climate stress from a peripheral research concern into a core analytical focus, leveraging the sophisticated methodological infrastructure already established in the connectedness literature [9,12]. Furthermore, our focus on the five most climate-sensitive agricultural commodities addresses the documented evidence that “spillovers concentrate significantly in soybeans and corn markets” during extreme conditions [21] while extending this analysis to wheat, rice, and sugar to provide comprehensive coverage of global food security implications. This integration positions our research to advance climate-related topics from their current status as Basic or Emerging Themes toward the Motor Themes quadrant, contributing to the evolution of commodity connectedness research to meet the pressing analytical demands of an increasingly climate-constrained global economy.
2.3. Research Questions and Hypotheses
The gaps identified in the historiographic and thematic analyses provide the basis for this study’s central research questions. While the literature has extensively explored the role of financial and macroeconomic volatility in shaping commodity market interdependencies, it has not systematically addressed how climate-related uncertainty—particularly climate policy uncertainty (CPU)—propagates through agri-food systems using dynamic and distribution-sensitive models.
To address this limitation, the following research questions guide the empirical investigation:
- RQ1: Do external sources of uncertainty—such as climate policy, financial volatility, and geopolitical risk—dominate the connectedness structure of agricultural commodity markets under climate stress?
- RQ2: How does the intensity of connectedness vary across different market states (e.g., normal vs. extreme conditions)?
- RQ3: What is the specific role of climate policy uncertainty (CPU) in the propagation of systemic risk across agri-food markets?
These research questions motivate the following hypotheses:
H1.
External uncertainty factors exert stronger and more persistent spillover effects than internal commodity interactions.
H2.
Connectedness becomes more pronounced under extreme market conditions, particularly during climate-related or geopolitical crises.
H3.
CPU acts as a net transmitter of volatility in stressed markets and as a net receiver under stable conditions.
By formulating these hypotheses, the study extends the scope of traditional connectedness analysis and explicitly incorporates climate-related risk into the empirical model.
3. Empirical Data and Methodological Approach
3.1. The Data
Table 1 presents the variables used in the empirical analysis. It includes monthly future prices for five key agricultural commodities—soybean, corn, wheat, rough rice, and sugar—traded on the Chicago Board of Trade (CBT) and the NYSE LIFFE. These commodities are selected due to their relevance to global food security and sensitivity to climate variability.

Table 1.
Overview of variables: Agricultural commodities and climate-related uncertainty indicators.
Table 1 also includes six external uncertainty indicators: the U.S. Climate Policy Uncertainty (CPU) Index, the Global Economic Policy Uncertainty (GEPU) Index, the Geopolitical Risk (GPR) Index, the CBOE Volatility Index (VIX), the Crude Oil Volatility Index (OVX), and the U.S. Dollar Index (DXY). These measures capture different dimensions of global uncertainty—climate, economic, geopolitical, financial, energy, and currency-related—that may influence the dynamic connectedness of commodity markets.
The analysis spans the period from January 2008 to March 2025, based on the availability of the CPU Index, yielding 206 monthly observations. The 2025 data only extend through March due to the limited release of updated uncertainty indices at the time of writing. Given the model’s time-varying structure and the smoothing effects of the Kalman filter, the early truncation of 2025 does not significantly bias the results or affect their robustness. Moreover, the main conclusions are drawn from long-term dynamics and multiple episodes of external stress over the 2008–2024 period.
Table 2 presents key descriptive statistics and diagnostic tests for the monthly returns of five agricultural commodities—soybean (RSM1), corn (RC1), wheat (RW1), rough rice (RRR1), and sugar (RQW1)—alongside six uncertainty indices, including climate policy uncertainty (RCPU), global economic policy uncertainty (RGEPU), geopolitical risk (RGPR), financial market volatility (RVIX), oil price volatility (ROVX), and the U.S. Dollar Index (RDXY).

Table 2.
Descriptive statistics and diagnostic tests for returns of commodities and uncertainty indices.
The average returns are statistically indistinguishable from zero across all variables, indicating no strong directional bias in the underlying series. Variance measures indicate that uncertainty indices, particularly RCPU (0.126), RVIX (0.055), and ROVX (0.039), exhibit higher return volatility compared to most agricultural commodities, reflecting their inherently unstable nature as proxies for systemic risk. This sharp contrast supports our core finding: agricultural commodities are more exposed to external uncertainty shocks than to internal dynamics. It further justifies the interpretation that external factors dominate the interconnectedness structure under climate stress.
The skewness and excess kurtosis measures reveal significant non-normality in many series. For instance, soybean (RSM1) and corn (RC1) exhibit significant left skewness, while RVIX shows extreme right skewness (1.283, p < 0.01), suggesting a high frequency of large positive shocks, typically observed during periods of market stress. High kurtosis values, especially for RVIX and RGEPU, further indicate the presence of fat tails, highlighting susceptibility to extreme values.
The Jarque–Bera (JB) test confirms departures from normality in the majority of series, particularly for soybean (RSM1), corn (RC1), and all uncertainty indices except RDXY and RCPU. These deviations necessitate the use of robust econometric methods, such as the TVP-VAR approach, to account for non-Gaussian features in the data.
The ERS unit root test results strongly reject the null hypothesis of a unit root in most series, supporting the stationarity of returns—a prerequisite for VAR-based modeling. However, the presence of conditional heteroskedasticity, as revealed by significant Q (20) and Q2 (20) statistics in several variables (e.g., RCPU, RVIX, and ROVX), underscores the dynamic and potentially volatile nature of the relationships among these variables.
These findings provide essential empirical groundwork for the subsequent TVP-VAR analysis by confirming that the return series are suitable for modeling connectedness under time-varying conditions. The high volatility and excess kurtosis observed in uncertainty indices, such as RCPU and RVIX, reinforce their role as potential transmitters of external shocks to agricultural markets, particularly under climate stress. Conversely, the relatively lower variance and more symmetric distributions in commodity returns suggest that these markets may be more influenced by exogenous uncertainty than by their own intrinsic dynamics.
Ultimately, the diagnostic profile in Table 2 supports the study’s hypothesis that external uncertainty—particularly climate- and policy-related—plays a critical role in shaping the volatility structure and spillover dynamics of key global agricultural commodities. This justifies the use of advanced, time-varying models to capture the evolution of such interconnected risks accurately.
Table 3 presents the Kendall’s Tau correlation coefficients among the returns of five key agricultural commodities—soybean (RSM1), corn (RC1), wheat (RW1), rough rice (RRR1), and sugar (RQW1)—and six exogenous uncertainty indices: climate policy uncertainty (RCPU), global economic policy uncertainty (RGEPU), geopolitical risk (RGPR), financial market volatility (RVIX), crude oil volatility (ROVX), and the U.S. Dollar Index (RDXY).

Table 3.
Kendall’s Tau correlations among commodity returns and uncertainty indices.
The results indicate strong and statistically significant positive correlations among the core commodities. For example, corn (RC1) and wheat (RW1) exhibit a Kendall’s Tau of 0.460, while soybean (RSM1) is moderately correlated with both corn (RC1 = 0.357) and wheat (RW1 = 0.312). These findings suggest a high level of co-movement among staple grains, likely reflecting common exposure to global supply and demand shocks, weather events, and policy-driven distortions.
In contrast, the correlations between commodity returns and uncertainty indices are generally weak and, in several cases, negative. Notably, the U.S. Dollar Index (RDXY) shows the most consistent negative association with commodity returns—especially with wheat (RW1 = −0.215), soybean (RSM1 = −0.144), and corn (RC1 = −0.174)—which aligns with the dollar-denominated pricing mechanism of global commodities. When the dollar strengthens, commodity prices tend to fall due to decreased affordability in non-dollar economies.
The weak and mixed correlations between agricultural returns and uncertainty indices such as RCPU, RGEPU, and RGPR suggest that the transmission of uncertainty to commodity markets may be nonlinear or time-varying, justifying the use of a TVP-VAR framework in this study. For instance, the Climate Policy Uncertainty Index (RCPU) shows only negligible and mostly insignificant correlations with all commodities, suggesting that its impact might emerge more clearly during specific high-stress climate events or policy transitions, effects that are better captured through dynamic modeling.
Additionally, volatility indices such as RVIX and ROVX exhibit low or negative correlations with commodity returns, which may indicate that financial and energy market shocks operate through different mechanisms than those driving agricultural prices directly. However, their indirect effects—such as risk aversion and portfolio rebalancing during crisis periods—might still play a significant role in the overall spillover dynamics, as explored later in the GFEVD analysis.
Then, Table 3 highlights the need to move beyond static correlation analysis when assessing the complex and evolving interdependence between agricultural markets and macro-financial uncertainties. The observed heterogeneity and asymmetry in correlation patterns reinforce the rationale for the TVP-VAR approach used in this article to capture connectedness under climate stress.
This study effectively leverages monthly data to capture the transmission of uncertainty across agricultural commodity markets. The chosen frequency enables consistent monitoring of medium- to long-term spillover dynamics, thereby reducing the influence of short-term volatility while preserving meaningful trends. This is particularly relevant for climate-related analyses, as the effects of environmental stressors and policy uncertainty often materialize over extended periods. Moreover, the monthly resolution supports more strategic insights for stakeholders in agri-food systems, where interconnected supply chains and exposure to global uncertainty make the sector especially vulnerable to persistent external shocks.
3.2. Time-Varying Parameter Vector Autoregressive (TVP-VAR) Model
This study explores the dynamic transmission mechanisms of climate-induced shocks across agricultural commodity markets using a Time-Varying Parameter Vector Autoregressive (TVP-VAR) model. Initially introduced by [56] and later refined to examine macroeconomic uncertainty spillovers [57], this approach builds upon the connectedness framework established by [58,59]. We adopt a stochastic volatility specification instead of fixed volatility to flexibly account for the heteroskedastic nature of financial and climate-related shocks. This approach captures abrupt shifts in volatility and better reflects the structural uncertainty during stress periods. Following [56], we highlight that stochastic volatility improves the adaptability of the Kalman filter in tracking time-varying dynamics. The TVP-VAR model, estimated via Kalman filtering with forgetting factors, provides a robust structure to capture the evolving inter-market spillovers over time. In our context, the analysis focuses on how climate-related stressors affect the interconnectedness among key agricultural commodities. The TVP-VAR model, estimated with stochastic volatility via a Kalman filter incorporating forgetting factors, provides a flexible structure to capture the evolving nature of inter-market spillovers over time.
The TVP-VAR specification follows the following mathematical formulation:
Here, is an vector of endogenous variables, and is the corresponding vector of lagged variables. The coefficient matrix varies over time. The disturbance term has a time-varying covariance matrix , and the evolution of parameters is governed by the innovation with .
To estimate dynamic connectedness measures, the TVP-VAR is recast into its Vector Moving Average (VMA) form [60,61]:
where is an elector matrix, and . The matrices denote the time-varying VMA coefficients.
The Generalized Impulse Response Function (GIRF) of variable to a shock in variable at forecast horizon is given by the following:
Assuming the shock , the GIRF simplifies to the following:
where is the GIRF of variable , is the forecast horizon, is a selection vector, and is the information set up to . Finally, is a selection vector with 1 in the -th position.
The Generalized Forecast Error Variance Decomposition (GFEVD) for horizon measures the contribution of shocks in variable to the forecast error variance of variable :
This decomposition satisfies the following:
Using these shares, we construct the Total Connectedness Index (TCI):
We further compute directional connectedness:
- To others:
- From others:
- Net connectedness:
A positive indicates that variable iii is a net transmitter of shocks, while a negative value suggests it is a net receiver.
Finally, Net Pairwise Directional Connectedness (NPDC) between variables and is defined as the following:
This study examines the dynamic interconnections among major agricultural commodities in response to climate-related stress. Using a Time-Varying Parameter Vector Autoregressive (TVP-VAR) model with monthly data, we capture the evolving structure of spillover effects and dependencies across commodity markets. This approach enables a flexible examination of how climate-induced shocks in one commodity transmit over time, reflecting the complex and time-sensitive nature of market responses to environmental pressures. The model is particularly effective in tracing systemic risk and cross-commodity linkages in the context of increasing climate volatility.
While our framework distinguishes between “internal” (agricultural commodities) and “external” (uncertainty indicators) nodes for analytical clarity, we acknowledge that this separation is a simplification. In reality, shocks originating in agricultural markets—such as climate-induced crop failures or price spikes—can feed back into macro-financial variables (e.g., VIX, GEPU) by influencing inflation, food security concerns, and monetary responses. Although the TVP-VAR framework captures some of these dynamics through its evolving structure, future extensions could adopt structural VAR or mixed-frequency models that better account for bi-directional causality and endogenous system interactions.
4. Empirical Findings
4.1. General Connectedness Results
Table 4 presents the results of the Generalized Forecast Error Variance Decomposition (GFEVD) based on the Time-Varying Parameter Vector Autoregressive (TVP-VAR) model. This framework enables the quantification of how much of the forecast error variance of each variable is attributable to shocks originating from other variables (off-diagonal elements), versus those stemming from its own innovations (diagonal elements).

Table 4.
Cross-commodity spillover effects and net transmission under climate and policy uncertainty.
The “FROM” column captures the total share of variance a variable receives from all others, reflecting its vulnerability to external shocks. Conversely, the “TO” row measures the influence a variable exerts on the rest of the system. The “NET” measure is obtained by subtracting “FROM” from “TO” and identifies whether a variable behaves as a net transmitter (positive values) or net receiver (negative values) of volatility. The Total Connectedness Index (TCI) summarizes the system-wide average level of interconnectedness.
The results underscore the significant role of key agricultural commodities—soybean (RSM1), corn (RC1), and wheat (RW1)—as net transmitters of volatility within the network. Corn, in particular, exhibits the strongest net transmission (+10.58), with 70.60% of its shocks having an impact on other variables. These findings reflect the systemic influence of staple crops in the agricultural economy and their susceptibility to transmitting climate-related and policy-induced volatility across markets.
On the other hand, rough rice (RRR1) and sugar (RQW1) display high levels of own variance (63.04% and 71.35%, respectively) and low outgoing spillovers (TO = 26.87% and 21.69%), classifying them as net receivers of shocks. Their isolated behavior may stem from lower market liquidity, specialized supply chains, or reduced exposure to climate-sensitive uses such as biofuel production.
Among the uncertainty indices, the VIX (RVIX) emerges as a dominant net transmitter (+15.52), highlighting the central role of global financial sentiment in propagating volatility to agricultural commodities. In contrast, the Climate Policy Uncertainty Index (RCPU) and Global Economic Policy Uncertainty Index (RGEPU) exhibit moderate net receiver positions, suggesting that while policy uncertainty does influence the system, it is less dominant compared to market-based volatility measures.
The overall Total Connectedness Index (TCI) stands at 40.32%, indicating that over 40% of the system’s forecast error variance is driven by cross-variable spillovers. This level of systemic interdependence underscores the fragility of agricultural markets under conditions of climate and policy uncertainty, highlighting the need for integrated risk management and adaptive policy frameworks to safeguard food security.
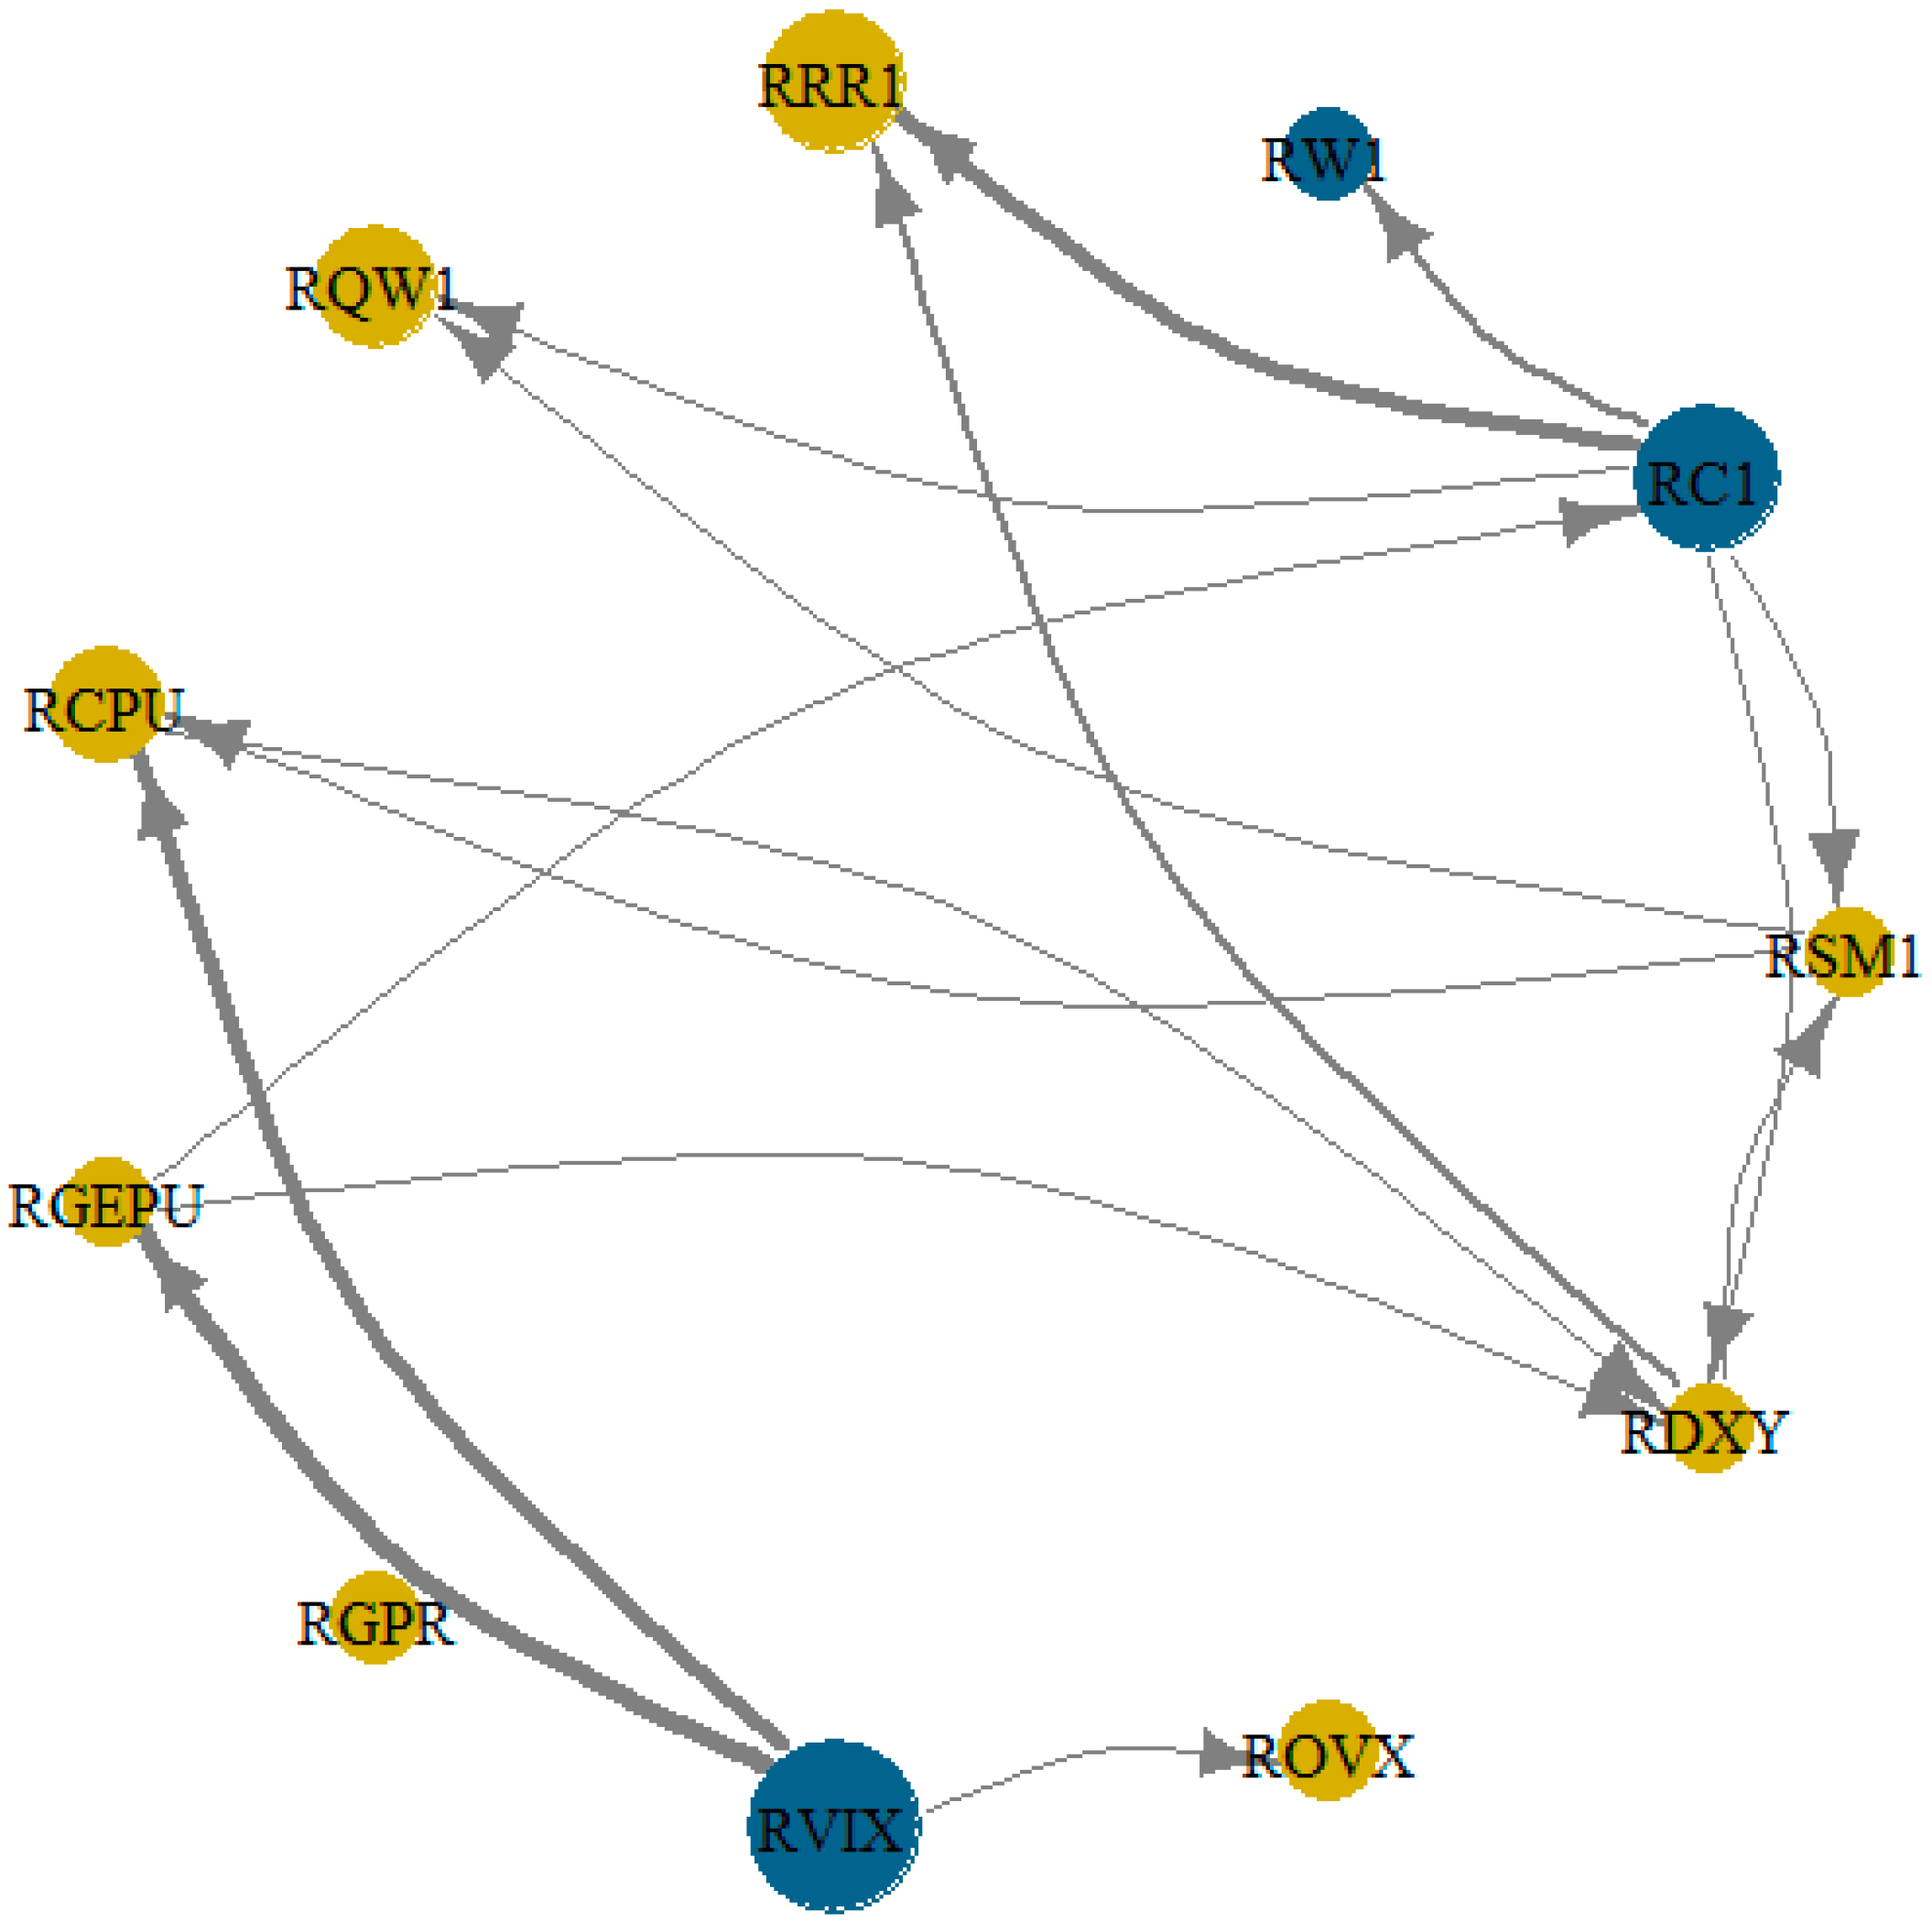
Figure 3 presents the network diagram of net pairwise directional spillovers among the variables included in the TVP-VAR model for the year 2022. Nodes represent each variable, while arrowheads indicate the direction of influence, and arrow thickness reflects the magnitude of spillovers, ranging from 2.4% to 11.8%. Solid lines denote statistically significant connections. Notably, RVIX, RC1, and RDXY emerge as central hubs, confirming their roles as dominant transmitters of external shocks. Among commodities, soybeans and corn exhibit moderate outgoing spillovers of 8.7% and 9.2%, respectively, directed primarily toward wheat and rice. These patterns reinforce the conclusion that internal connectedness is relatively weak compared to the influence of external uncertainty factors.
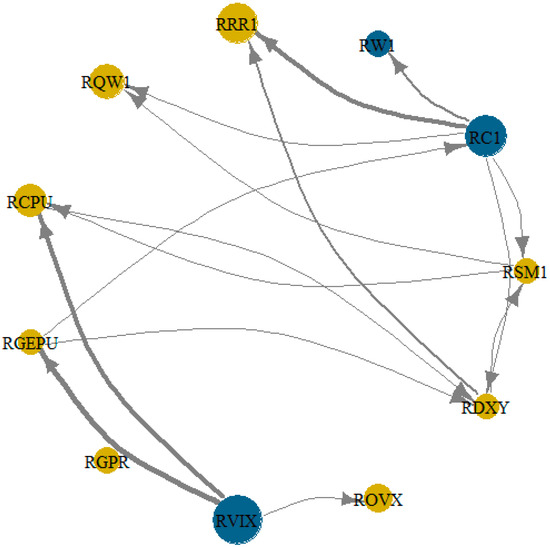
Figure 3.
Network representation of cross-commodity and uncertainty spillovers. Source: author’s own research.
This visual configuration confirms the structural findings from Table 4. Corn (RC1) and RVIX exhibit strong outward spillovers toward commodities, such as rough rice (RRR1), and macro-financial indicators, respectively. Similarly, RDXY shows multiple outbound links, consistent with its sizable “TO” value. In contrast, variables like RQW1 (sugar), ROVX (oil volatility), and RGPR (geopolitical risk) exhibit fewer and thinner outbound arrows, highlighting their relatively passive roles. The figure thus reinforces the asymmetrical transmission structure under climate and policy uncertainty, emphasizing the centrality of financial stress (RVIX), exchange rate fluctuations (RDXY), and staple crops in shaping volatility contagion across the system.
The evidence from Table 4 and Figure 3 reveals a highly interconnected structure of spillovers among agricultural commodities and uncertainty indices, particularly under climate and policy stress. The central roles played by corn (RC1), the U.S. Dollar Index (RDXY), and the VIX (RVIX) demonstrate that market volatility and global financial conditions significantly shape the transmission of shocks across the agri-commodity space. Their status as net transmitters suggests they serve as critical channels through which broader systemic risks propagate.
These dynamics carry substantial implications. First, the prominence of financial variables (RVIX and RDXY) in transmitting volatility underlines the vulnerability of agricultural markets to macroeconomic and investor sentiment shocks, especially during periods of heightened uncertainty. Second, the relatively passive behavior of commodities like sugar (RQW1) and rough rice (RRR1) highlights asymmetries in market responses, likely driven by differences in liquidity, global trade exposure, and production cycles. Finally, the visual confirmation of these spillover patterns in Figure 3 reinforces the need for targeted risk management strategies, particularly in the face of climate-driven policy shifts and global financial instability. This interconnectedness demands coordinated responses from policymakers and market participants to safeguard food security and price stability in increasingly volatile environments.
4.2. Internal and External Connectedness Findings
In the context of this study, internal connectedness refers to the interactions and volatility spillovers among agricultural commodities—specifically soybean (RSM1), corn (RC1), wheat (RW1), rough rice (RRR1), and sugar (RQW1). These variables were analyzed to capture the degree of endogenous transmission within commodity markets under climate-related stressors. Conversely, external connectedness encompasses the influence of six exogenous uncertainty indices: climate policy uncertainty (RCPU), global economic policy uncertainty (RGEPU), geopolitical risk (RGPR), financial market volatility (RVIX), crude oil volatility (ROVX), and the U.S. Dollar Index (RDXY). By distinguishing between internal (commodity-driven) and external (macro-financial and geopolitical) sources of uncertainty, the analysis offers a more nuanced understanding of how climate stress and global policy risks propagate through the agricultural system.
This delineation allows for a clearer identification of the sources and pathways of systemic risk. It enables policymakers and market participants to distinguish whether volatility originates from intrinsic market dynamics or broader exogenous shocks. Such insights are crucial for designing targeted interventions, whether through commodity-specific stabilization tools or through macroprudential measures aimed at buffering external uncertainties, especially in a climate-sensitive global economy.
4.2.1. Dynamic Total Connectedness Index (TCI)
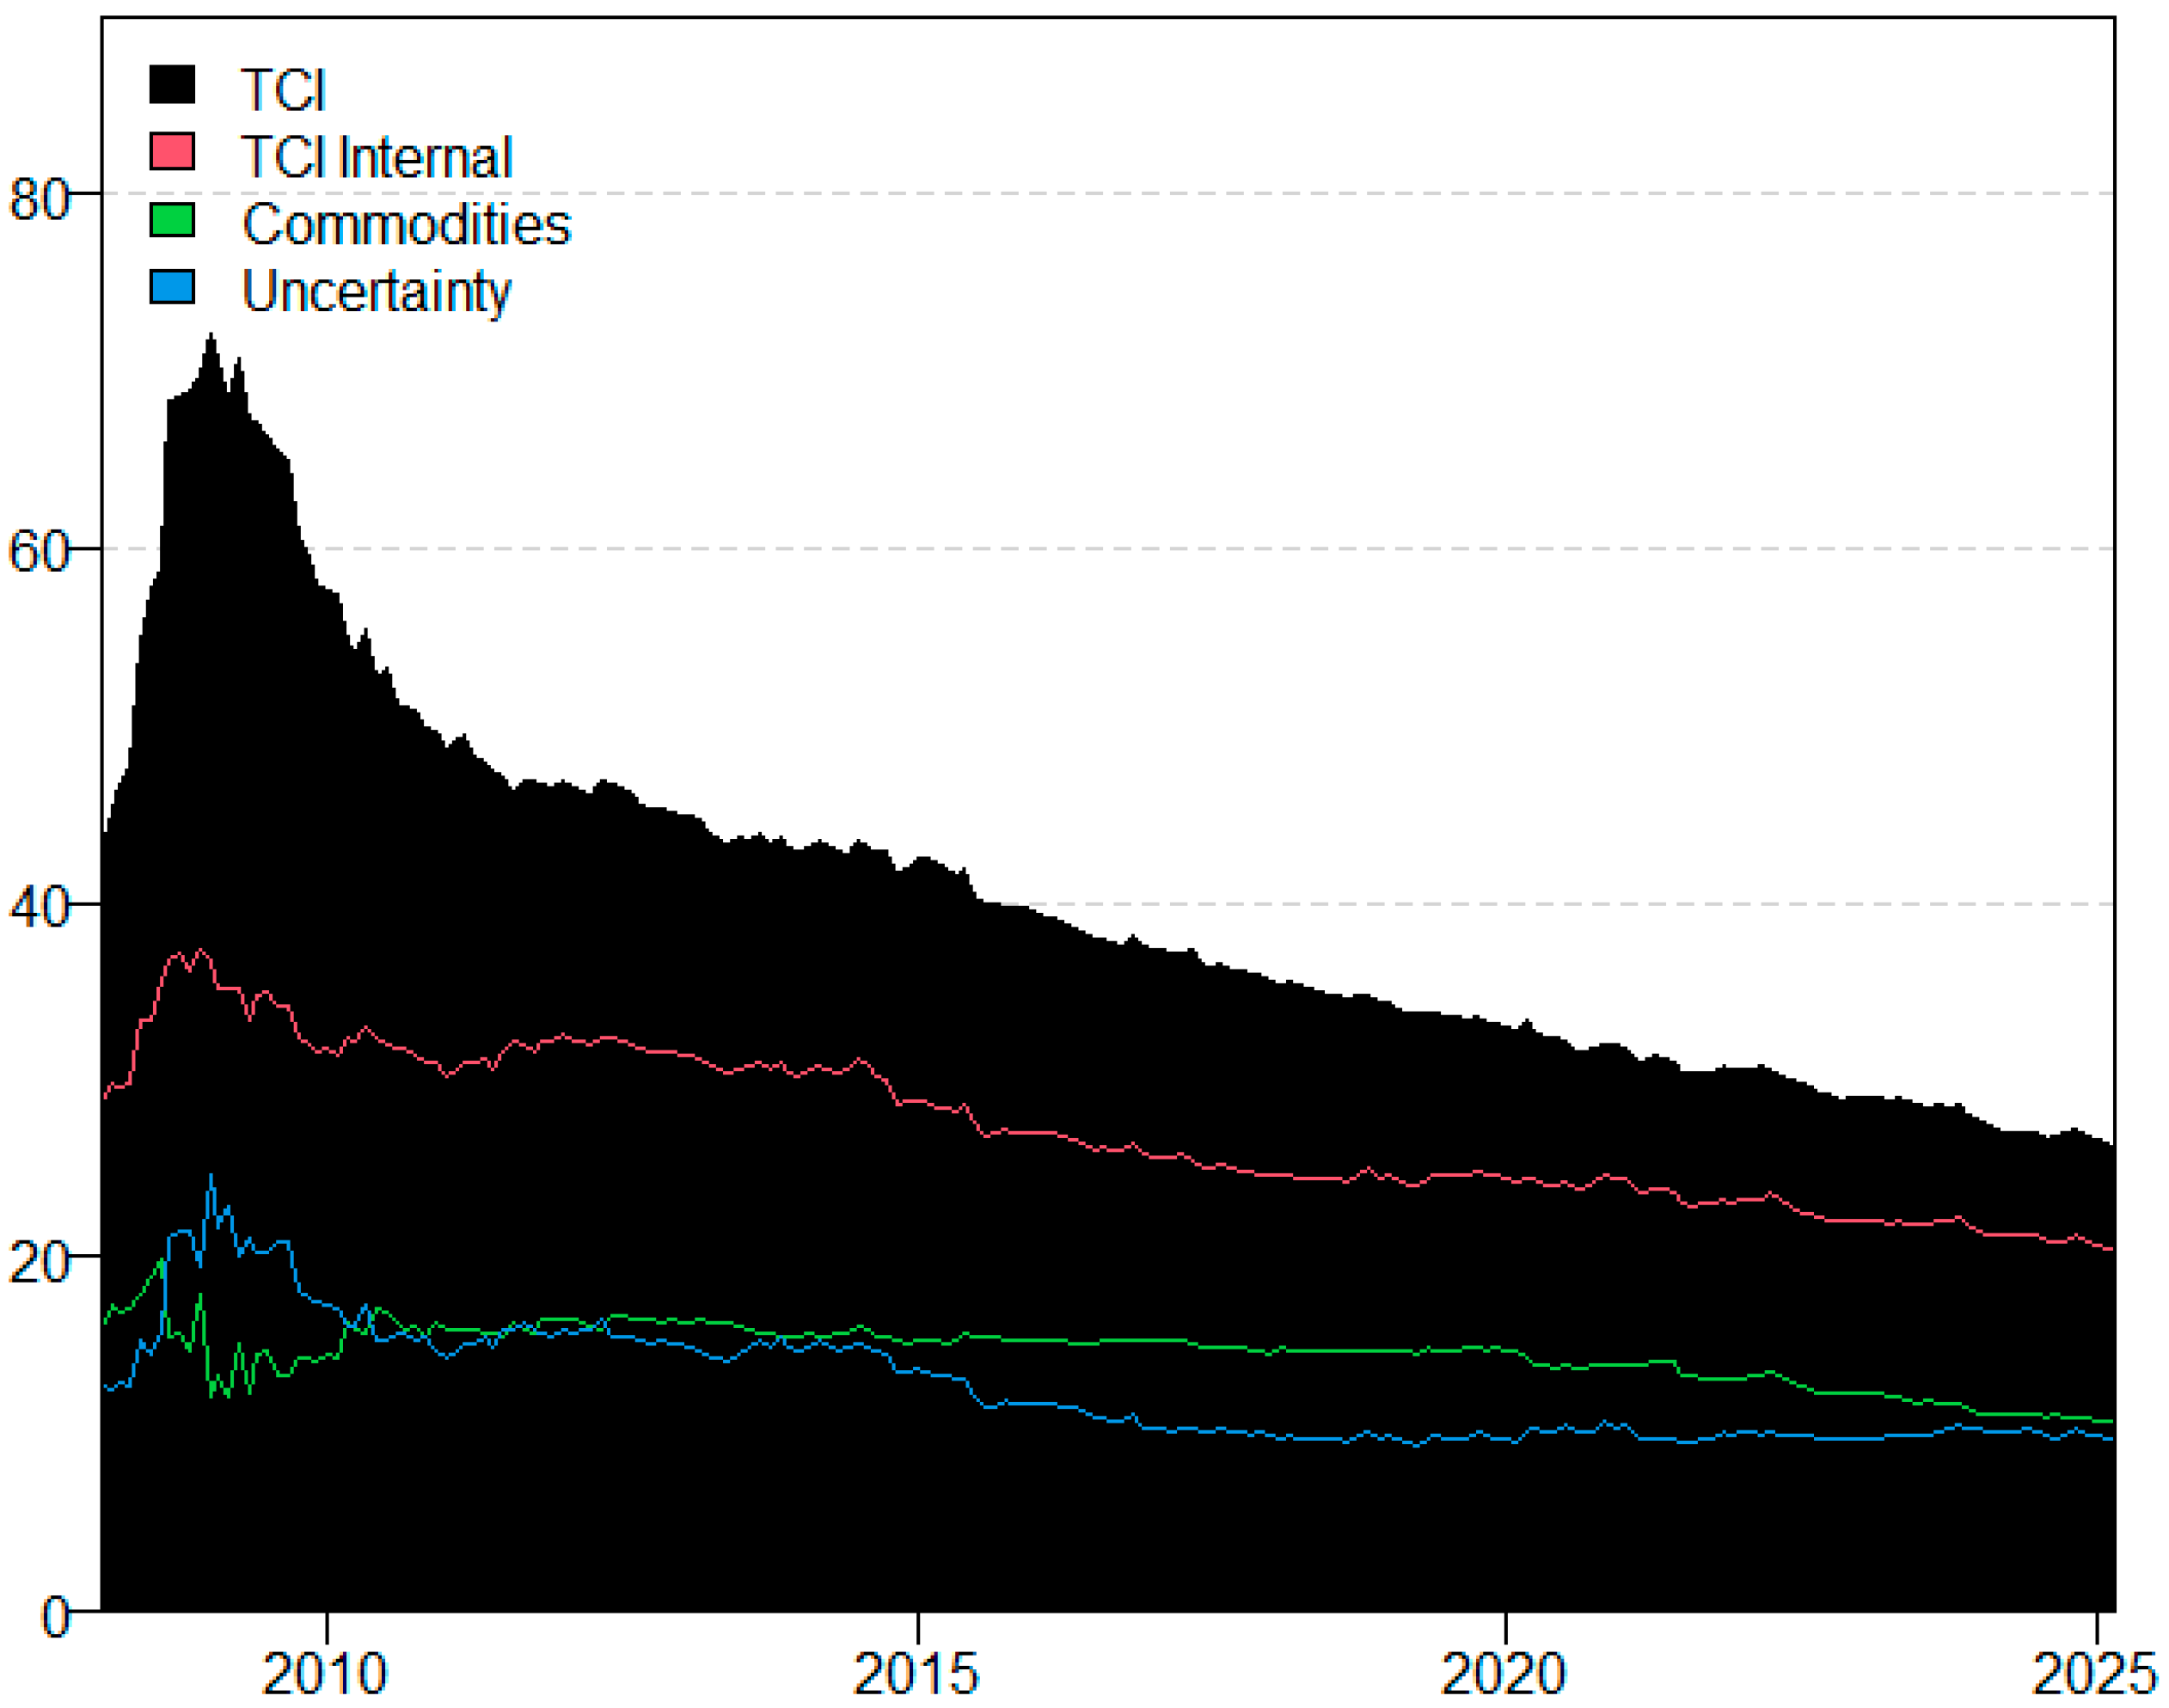
Figure 4 illustrates the dynamic evolution of the Total Connectedness Index (TCI) from January 2008 to March 2025, along with its internal decomposition. The black shaded area captures the overall degree of interconnectedness across all variables in the system, while the red and blue lines represent average internal spillovers within the commodity and uncertainty clusters, respectively. The TCI peaked during the 2008–2009 global financial crisis, exceeding 65%, and has since exhibited a gradual downward trend, stabilizing around 30% in recent years. This suggests a decline in synchronized volatility transmission across variables, potentially due to improved market resilience and diversification strategies.
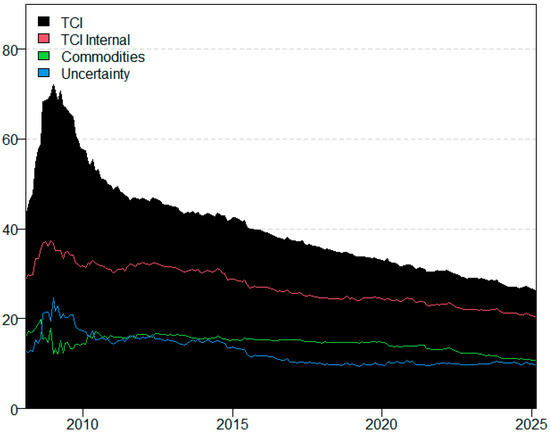
Figure 4.
Time-Varying Total Connectedness Index (TCI) and Subgroup Indices for Commodities and Uncertainty Variables. Notes: The black area shows overall connectedness (TCI), while the red line focuses on internal spillovers among commodities. The green and blue lines reflect connectedness within commodities and among uncertainty indices globally, respectively. Source: author’s own research.
This decoupling trend may also reflect structural changes in global agricultural trade policies. In particular, many of the export restrictions implemented during the 2007–2008 food crisis were progressively lifted in the following decade, enhancing trade fluidity and reducing cross-market dependencies. These liberalization efforts during the 2010s likely contributed to lower systemic connectedness. However, recent events such as the COVID-19 pandemic have reversed some of this progress, reintroducing protectionist measures and exposing the system to renewed fragmentation. Thus, the observed decline in the TCI captures both institutional and structural transitions that shape the evolution of risk transmission in agricultural markets.
4.2.2. Net Total Directional Connectedness
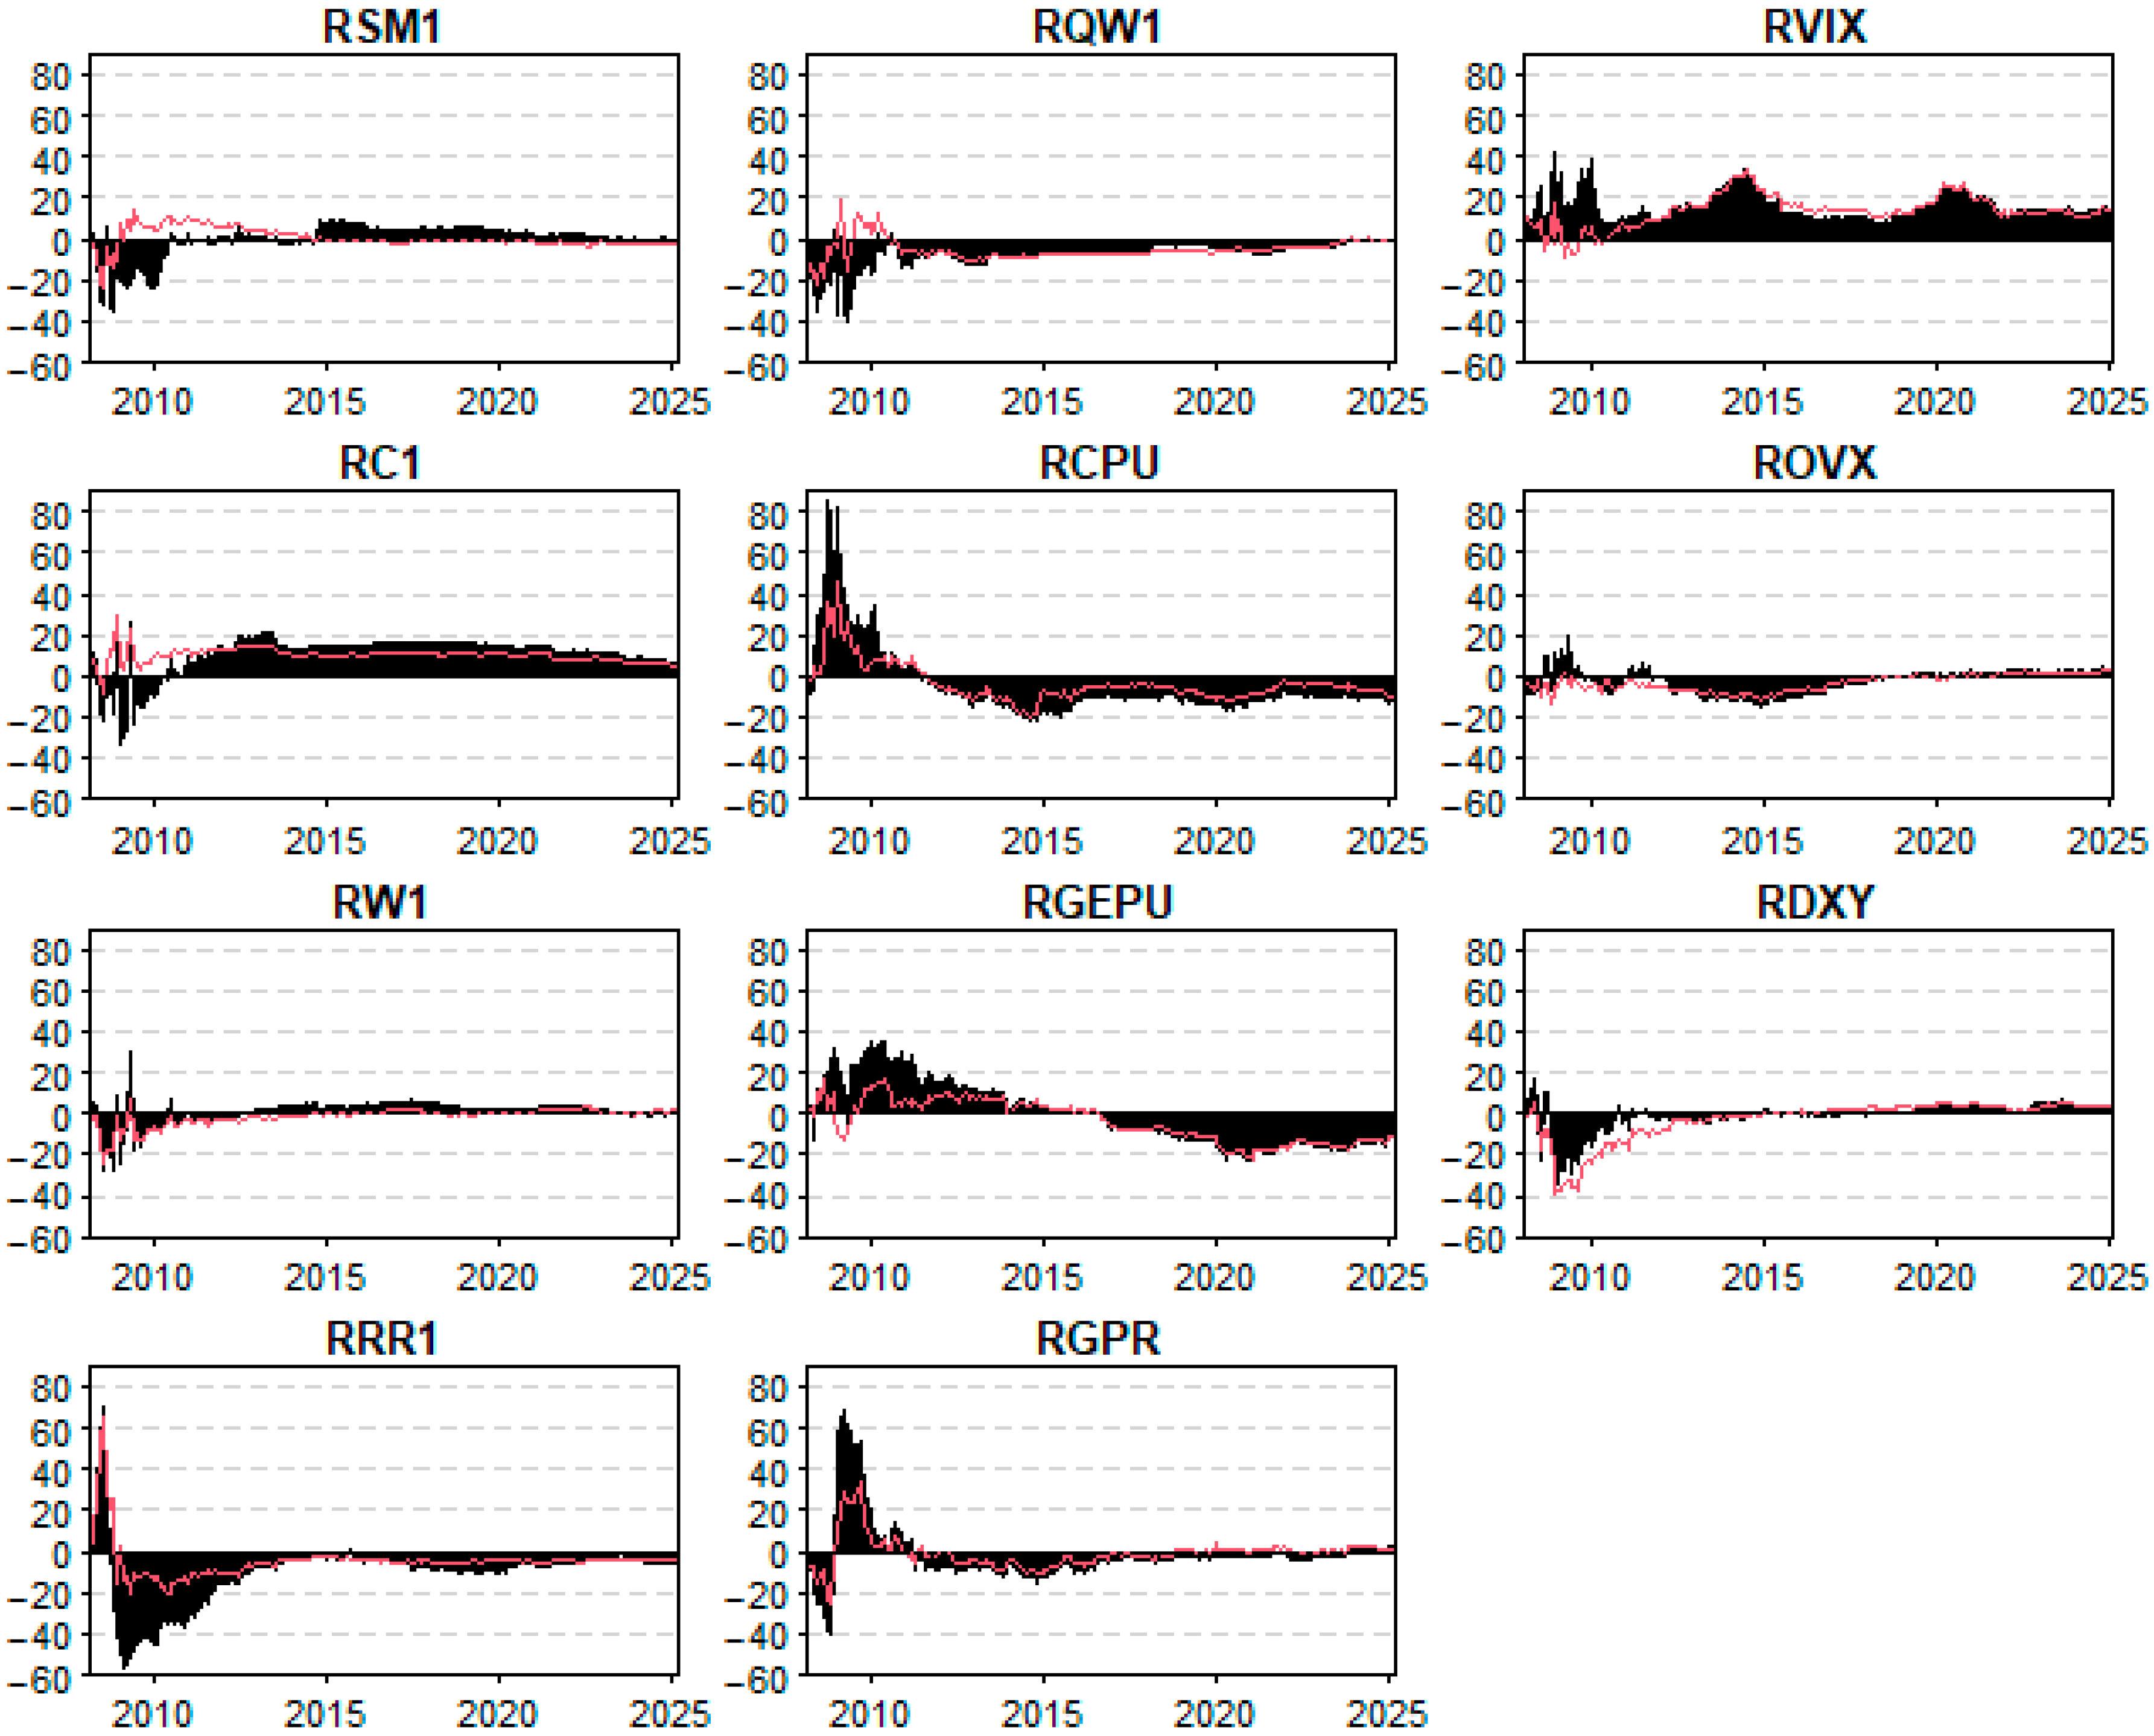
Figure 5 presents the time-varying net total directional connectedness of agricultural commodities and uncertainty indices, differentiating between external (black shaded areas) and internal (red lines) spillover effects. These visualizations reveal that external spillovers, driven by exogenous forces such as global economic and policy uncertainty, consistently dominate the connectedness structure throughout the period. This pattern is particularly pronounced during major global stress episodes, including the aftermath of the 2008 financial crisis and periods of geopolitical or climate-related turmoil.
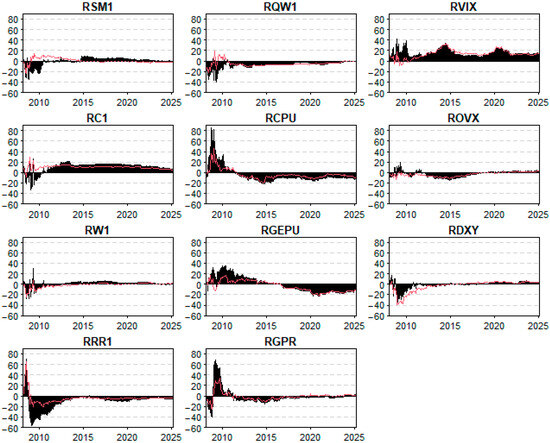
Figure 5.
Net total directional connectedness: External and internal spillovers. Notes: The black shaded areas depict the influence of external spillovers on connectedness. In contrast, the red lines capture internal spillovers. Source: author’s own research.
These observations confirm several earlier findings. First, they support Table 4, where uncertainty indices like RVIX and RGEPU were identified as major net transmitters of shocks and agricultural commodities as net recipients. Second, the persistence of external influence on commodities such as soybean (RSM1), corn (RC1), and wheat (RW1) aligns with the patterns observed in Figure 4, where external connectedness consistently exceeded internal contributions. Third, Figure 3 showed limited influence among commodities themselves, consistent with the relatively subdued internal spillovers observed in the red lines of Figure 5.
Figure 5 shows that RCPU behaves differently from other uncertainty variables, exhibiting higher volatility and more persistent spikes. This reflects the unique sensitivity of climate-related policy discourse to long-term risk narratives, international negotiations, and media cycles, which may not align with short-term market responses.
The dominance of external over internal dynamics highlights the systemic vulnerability of agri-food markets to exogenous shocks. This underscores the importance of incorporating global risk factors—such as climate policy uncertainty, financial volatility, and macroeconomic disruptions—into agricultural policy design and risk management frameworks. These results suggest that CPU should be integrated into agricultural policy design and early warning systems, particularly in frameworks such as the FAO’s Agricultural Market Information System (AMIS) or national-level climate risk dashboards. Developing adaptive mechanisms to monitor and respond to these external threats is crucial for supporting market stability under climate stress.
To enhance interpretability, we retained Figure 5 as a single visualization showing the full directional connectedness matrix but addressed its complexity by adding a summary table (Table 5) that highlights the most relevant transmission patterns.

Table 5.
Summary of directional spillovers in the TVP-VAR network.
This complementary table summarizes key directional spillovers—including external-to-internal (e.g., RVIX → corn), macro-financial (e.g., RGEPU → wheat), and internal commodity (e.g., corn → wheat) dynamics—offering a clearer interpretation of the network structure. This dual approach balances comprehensiveness with clarity, ensuring the results remain accessible to both technical and policy-oriented audiences.
According to Table 5, the strongest observed spillover originates from RVIX to corn (12.4%), underscoring the dominance of financial market volatility in influencing agricultural commodity dynamics. This suggests that episodes of investor panic or risk aversion in equity markets may rapidly transmit to food prices, potentially via investment portfolio rebalancing or futures markets.
Global economic uncertainty, captured by RGEPU, shows a significant directional effect on wheat (10.1%), highlighting macro-financial shocks as important drivers of staple food volatility. This supports the notion that wheat markets are particularly sensitive to shifts in global growth expectations, inflation fears, or international trade disruptions.
The influence of climate policy uncertainty (RCPU) on soybeans (5.3%) is more modest but still notable, suggesting that climate-related regulatory signals can shape price expectations for climate-sensitive crops. This effect becomes more relevant under stress scenarios, as suggested in recent quantile-based studies.
Internal spillovers—particularly corn to wheat (7.6%)—reflect strong interdependencies within the grain supply chain. These may be driven by input substitution, similar harvesting seasons, or shared market infrastructure, reinforcing the need for integrated commodity risk monitoring.
Other spillovers, such as soybeans to rice (4.8%) and the feedback from sugar to RCPU (1.2%), appear weaker, indicating limited second-order interactions or feedback effects. These findings align with the net transmitter/receiver classification and confirm the asymmetric nature of risk propagation across the network.
4.2.3. Total Directional Connectedness Received from External and Internal Spillovers
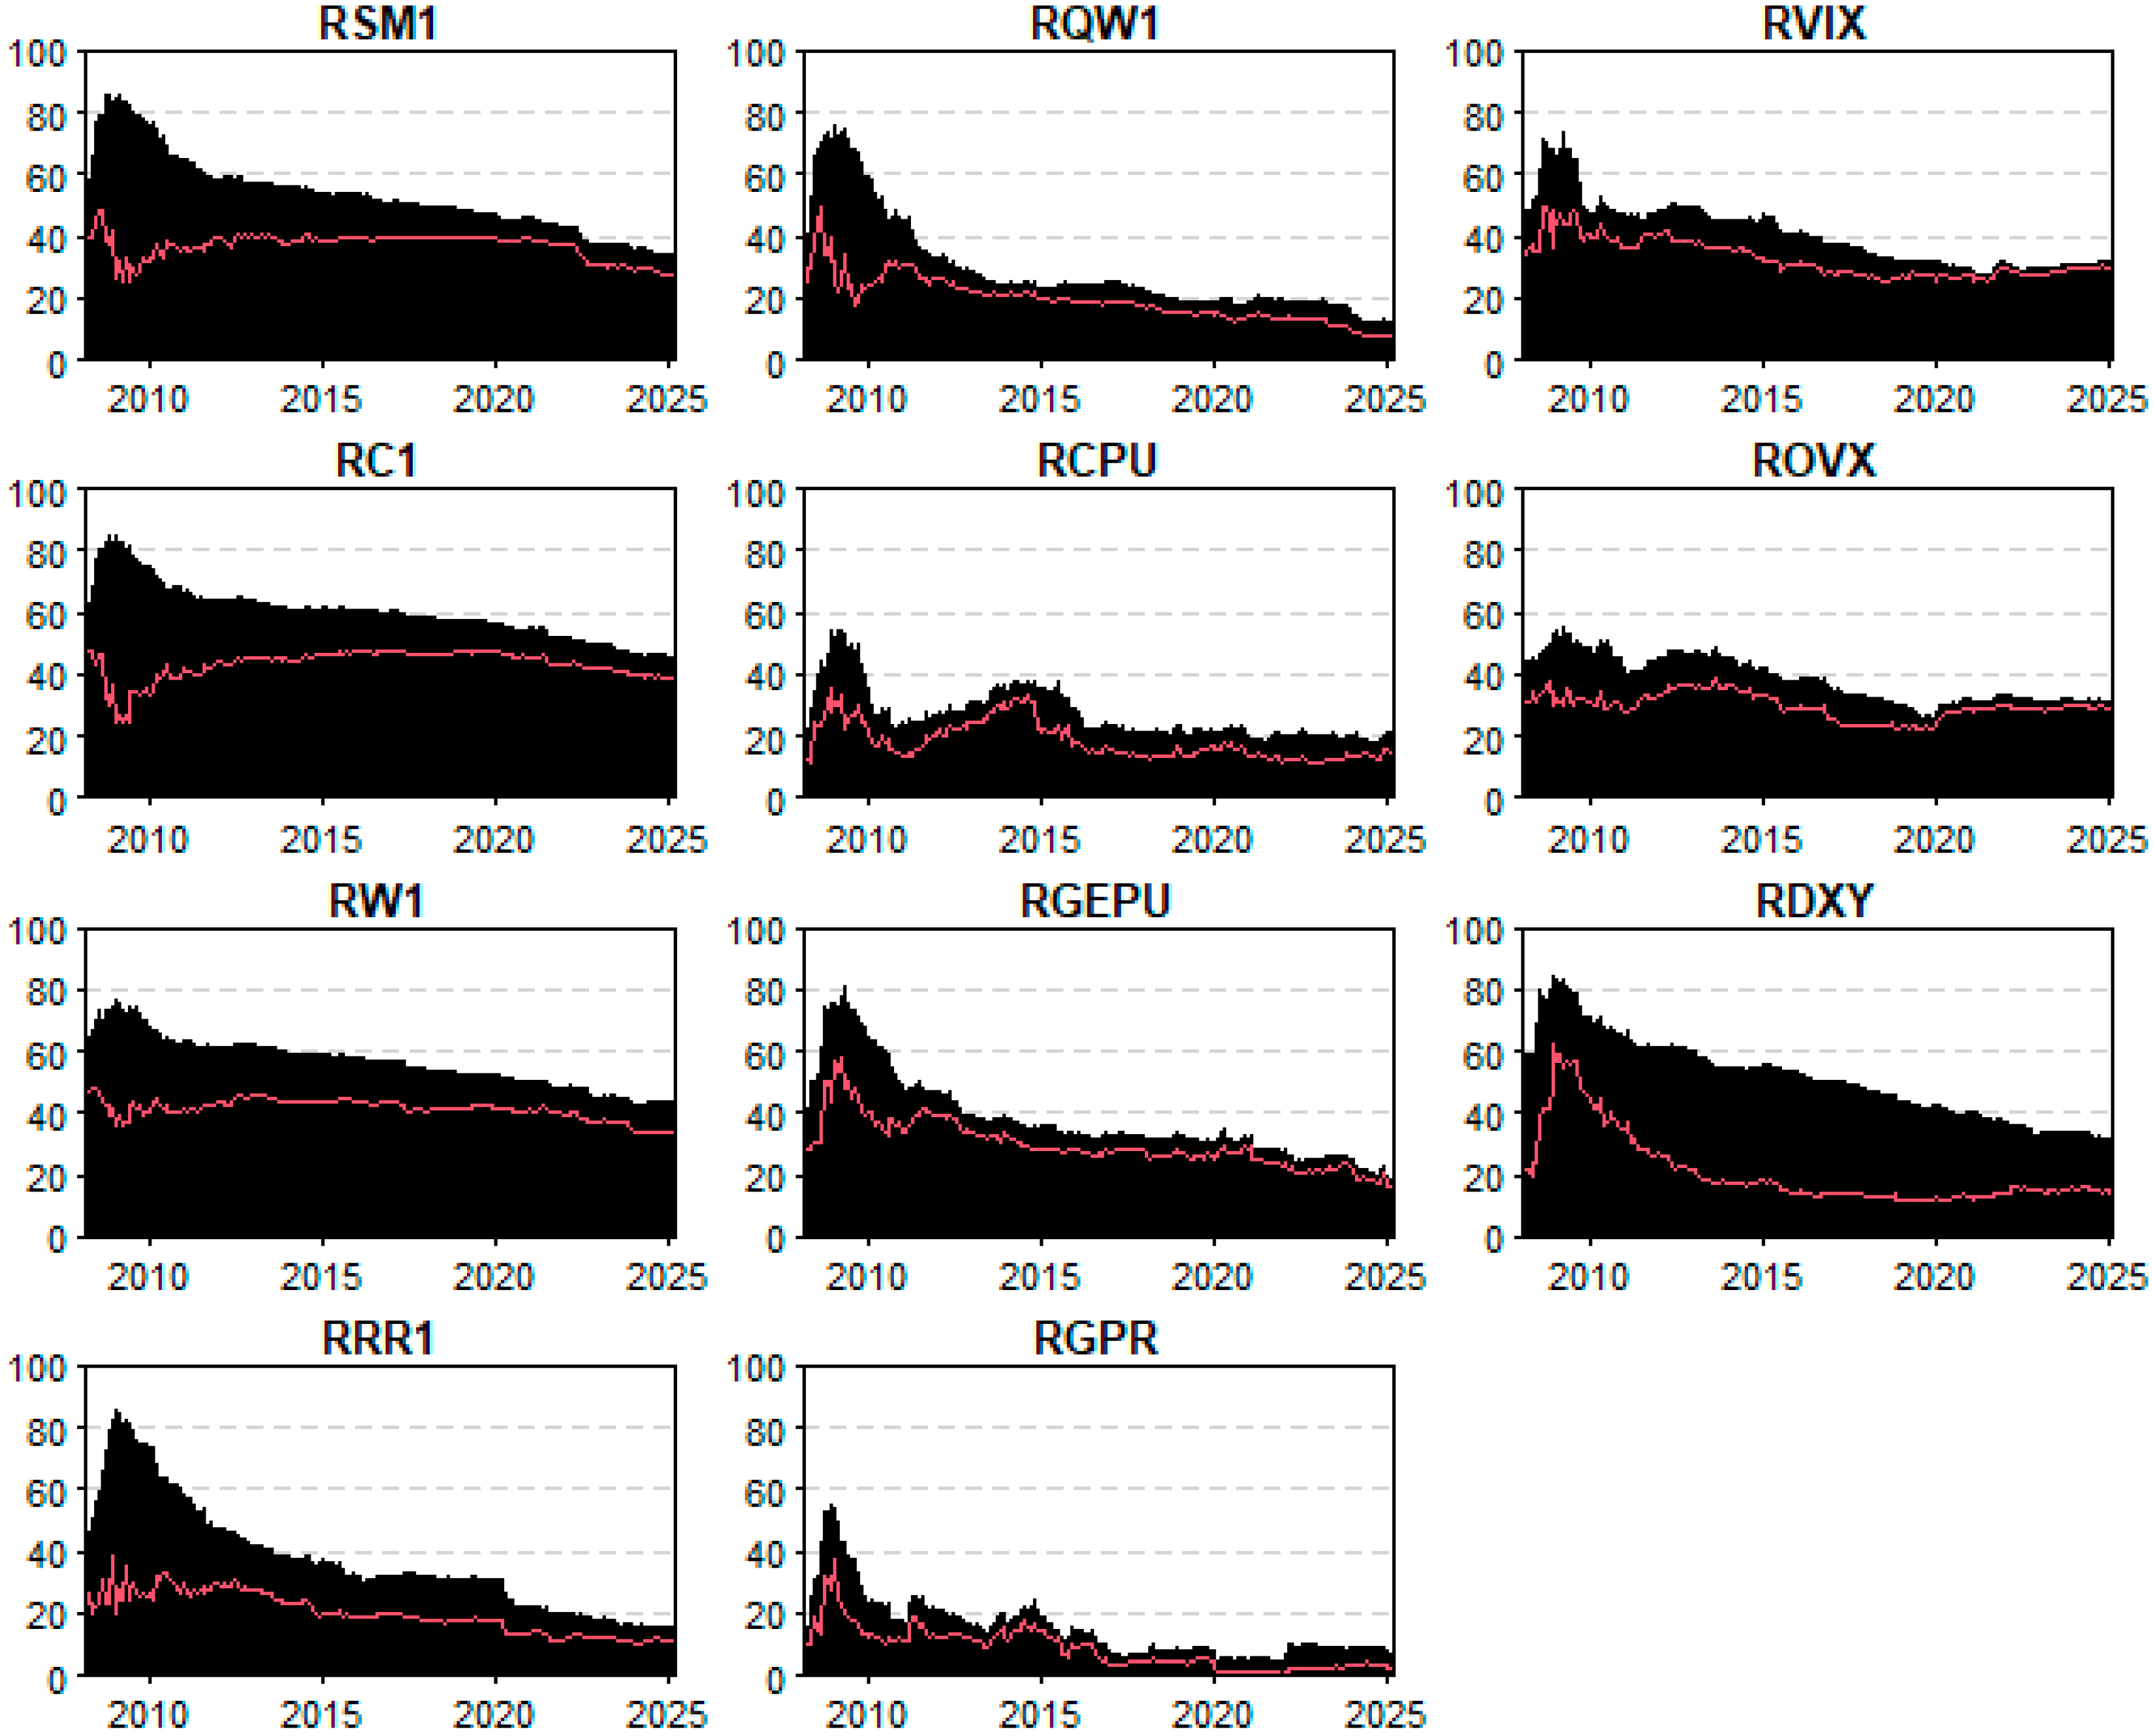
Figure 6 presents the evolution of net total directional connectedness for each agricultural commodity and uncertainty index, distinguishing between external spillovers (black shaded areas) and internal spillovers (red lines). The analysis confirms earlier findings from Table 4 and Figure 3, Figure 4 and Figure 5, reinforcing that external spillovers consistently dominate the connectedness structure over time.
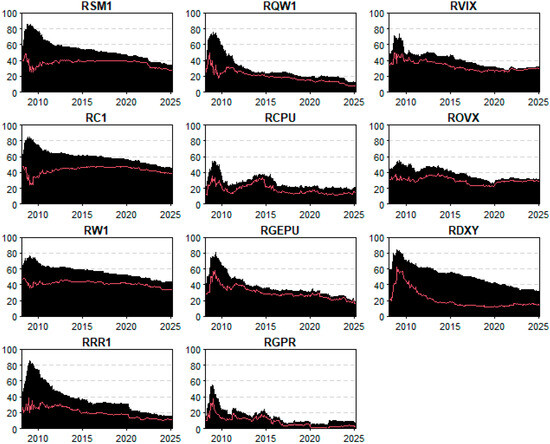
Figure 6.
Total directional connectedness received from external and internal spillovers. Notes: The black shaded areas depict the influence of external spillovers on connectedness. In contrast, the red lines capture internal spillovers. Source: author’s own research.
Notably, the magnitude of external influences remains elevated across all series during major global shocks (e.g., 2008–2009), while internal spillovers exhibit more muted and stable behavior. Commodities like soybean (RSM1), corn (RC1), and wheat (RW1) show persistent exposure to external drivers, aligning with their identified roles as net transmitters in the system. Similarly, indices such as VIX, RGEPU, and RDXY maintain high external connectedness, underscoring the systemic sensitivity of agricultural markets to macro-financial and policy-related uncertainty.
These patterns reaffirm the central argument of the article: under climate stress, the interconnectedness of agricultural commodities is significantly shaped by exogenous sources of uncertainty. Consequently, policymakers and market participants must incorporate global volatility signals into risk mitigation frameworks to safeguard food and economic stability.
4.2.4. Total Directional Connectedness Transmitted to Other Economies: External and Internal Spillovers
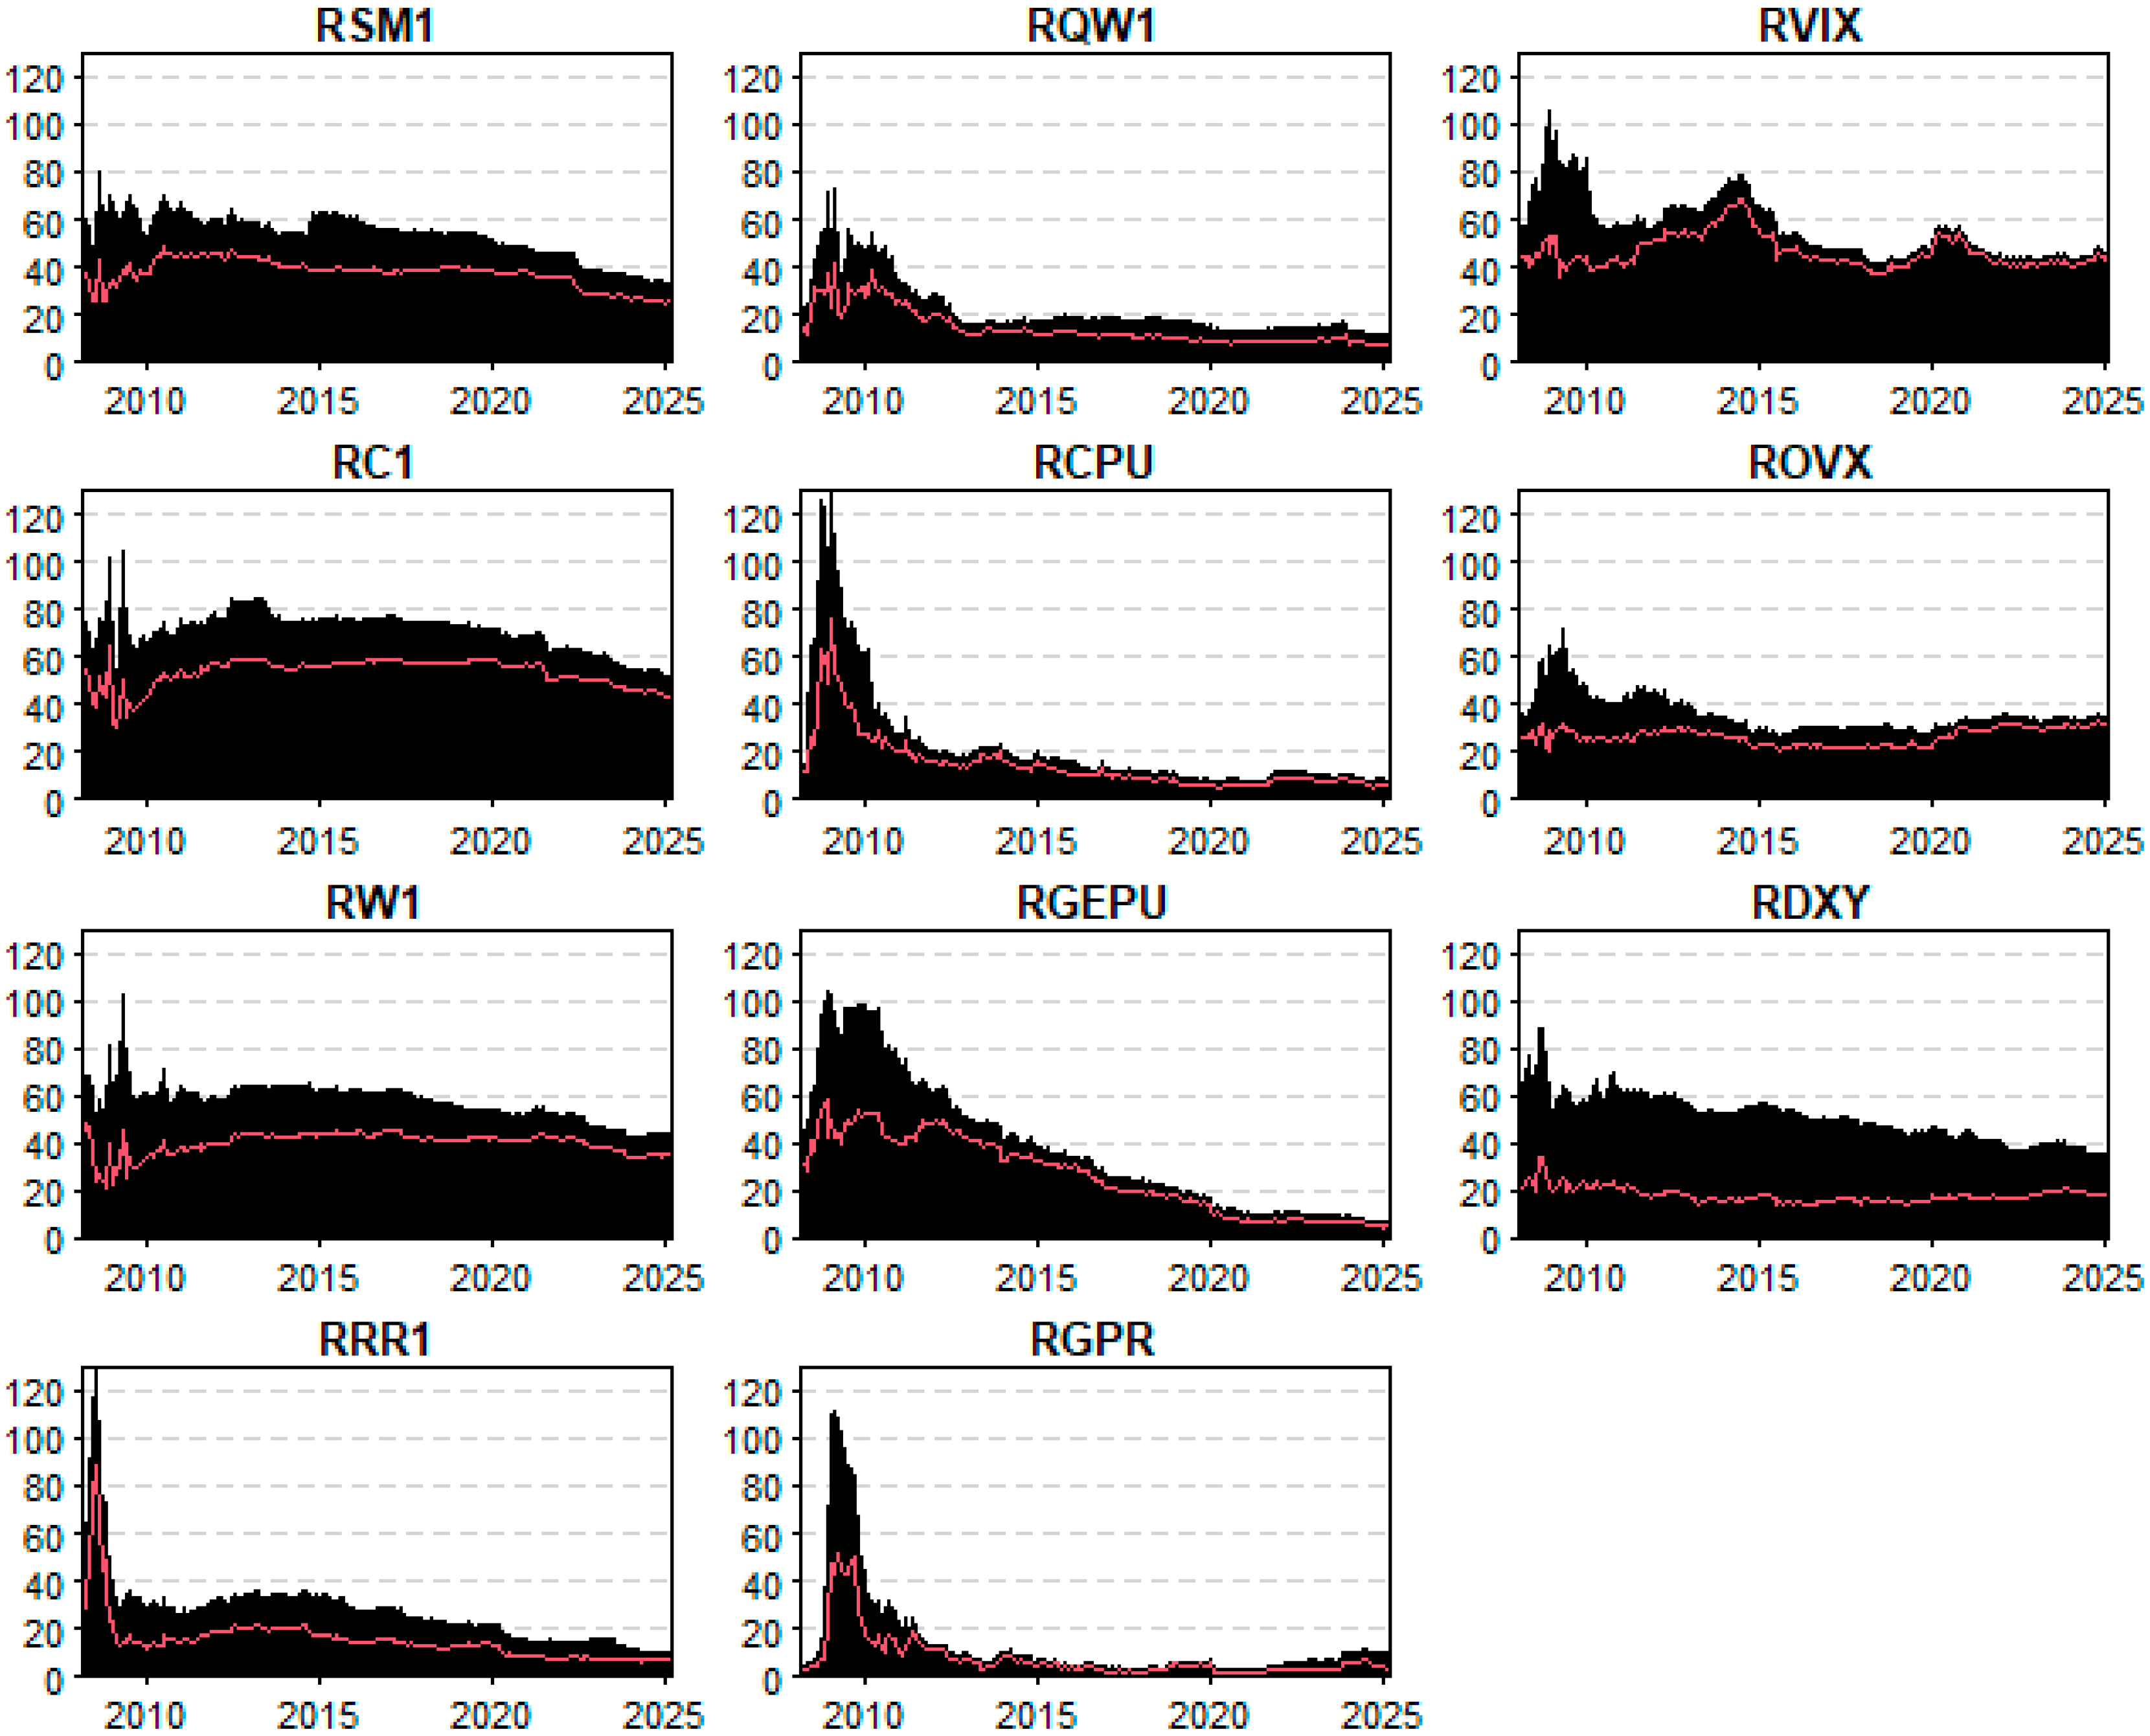
Figure 7 presents the total directional connectedness transmitted by each agricultural commodity and uncertainty index to the rest of the network, distinguishing between external (black shaded areas) and internal (red lines) spillovers. The results clearly confirm previous findings: external spillovers consistently dominate across all variables, particularly for uncertainty indices such as RGEPU, RVIX, and RDXY, which act as persistent transmitters of systemic shocks. Commodities like soybean (RSM1), corn (RC1), and wheat (RW1) also transmit shocks externally, though less intensively.
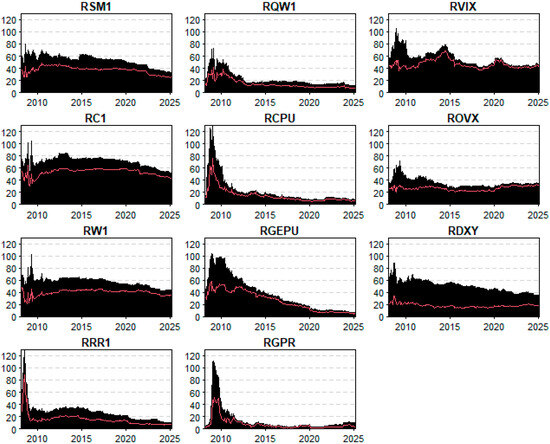
Figure 7.
Total directional connectedness transmitted to other economies: External and internal spillovers. Notes: The black shaded areas depict the influence of external spillovers on connectedness. In contrast, the red lines capture internal spillovers. Source: author’s own research.
The subdued behavior of internal spillovers aligns with earlier observations, reinforcing the notion that while commodities are interconnected, their influence is minor compared to exogenous uncertainty. This consistency across figures highlights the structural vulnerability of agricultural markets to global stressors, supporting the need for resilient policy strategies that integrate external risk management.
4.2.5. Internal Net Pairwise Total Directional Connectedness
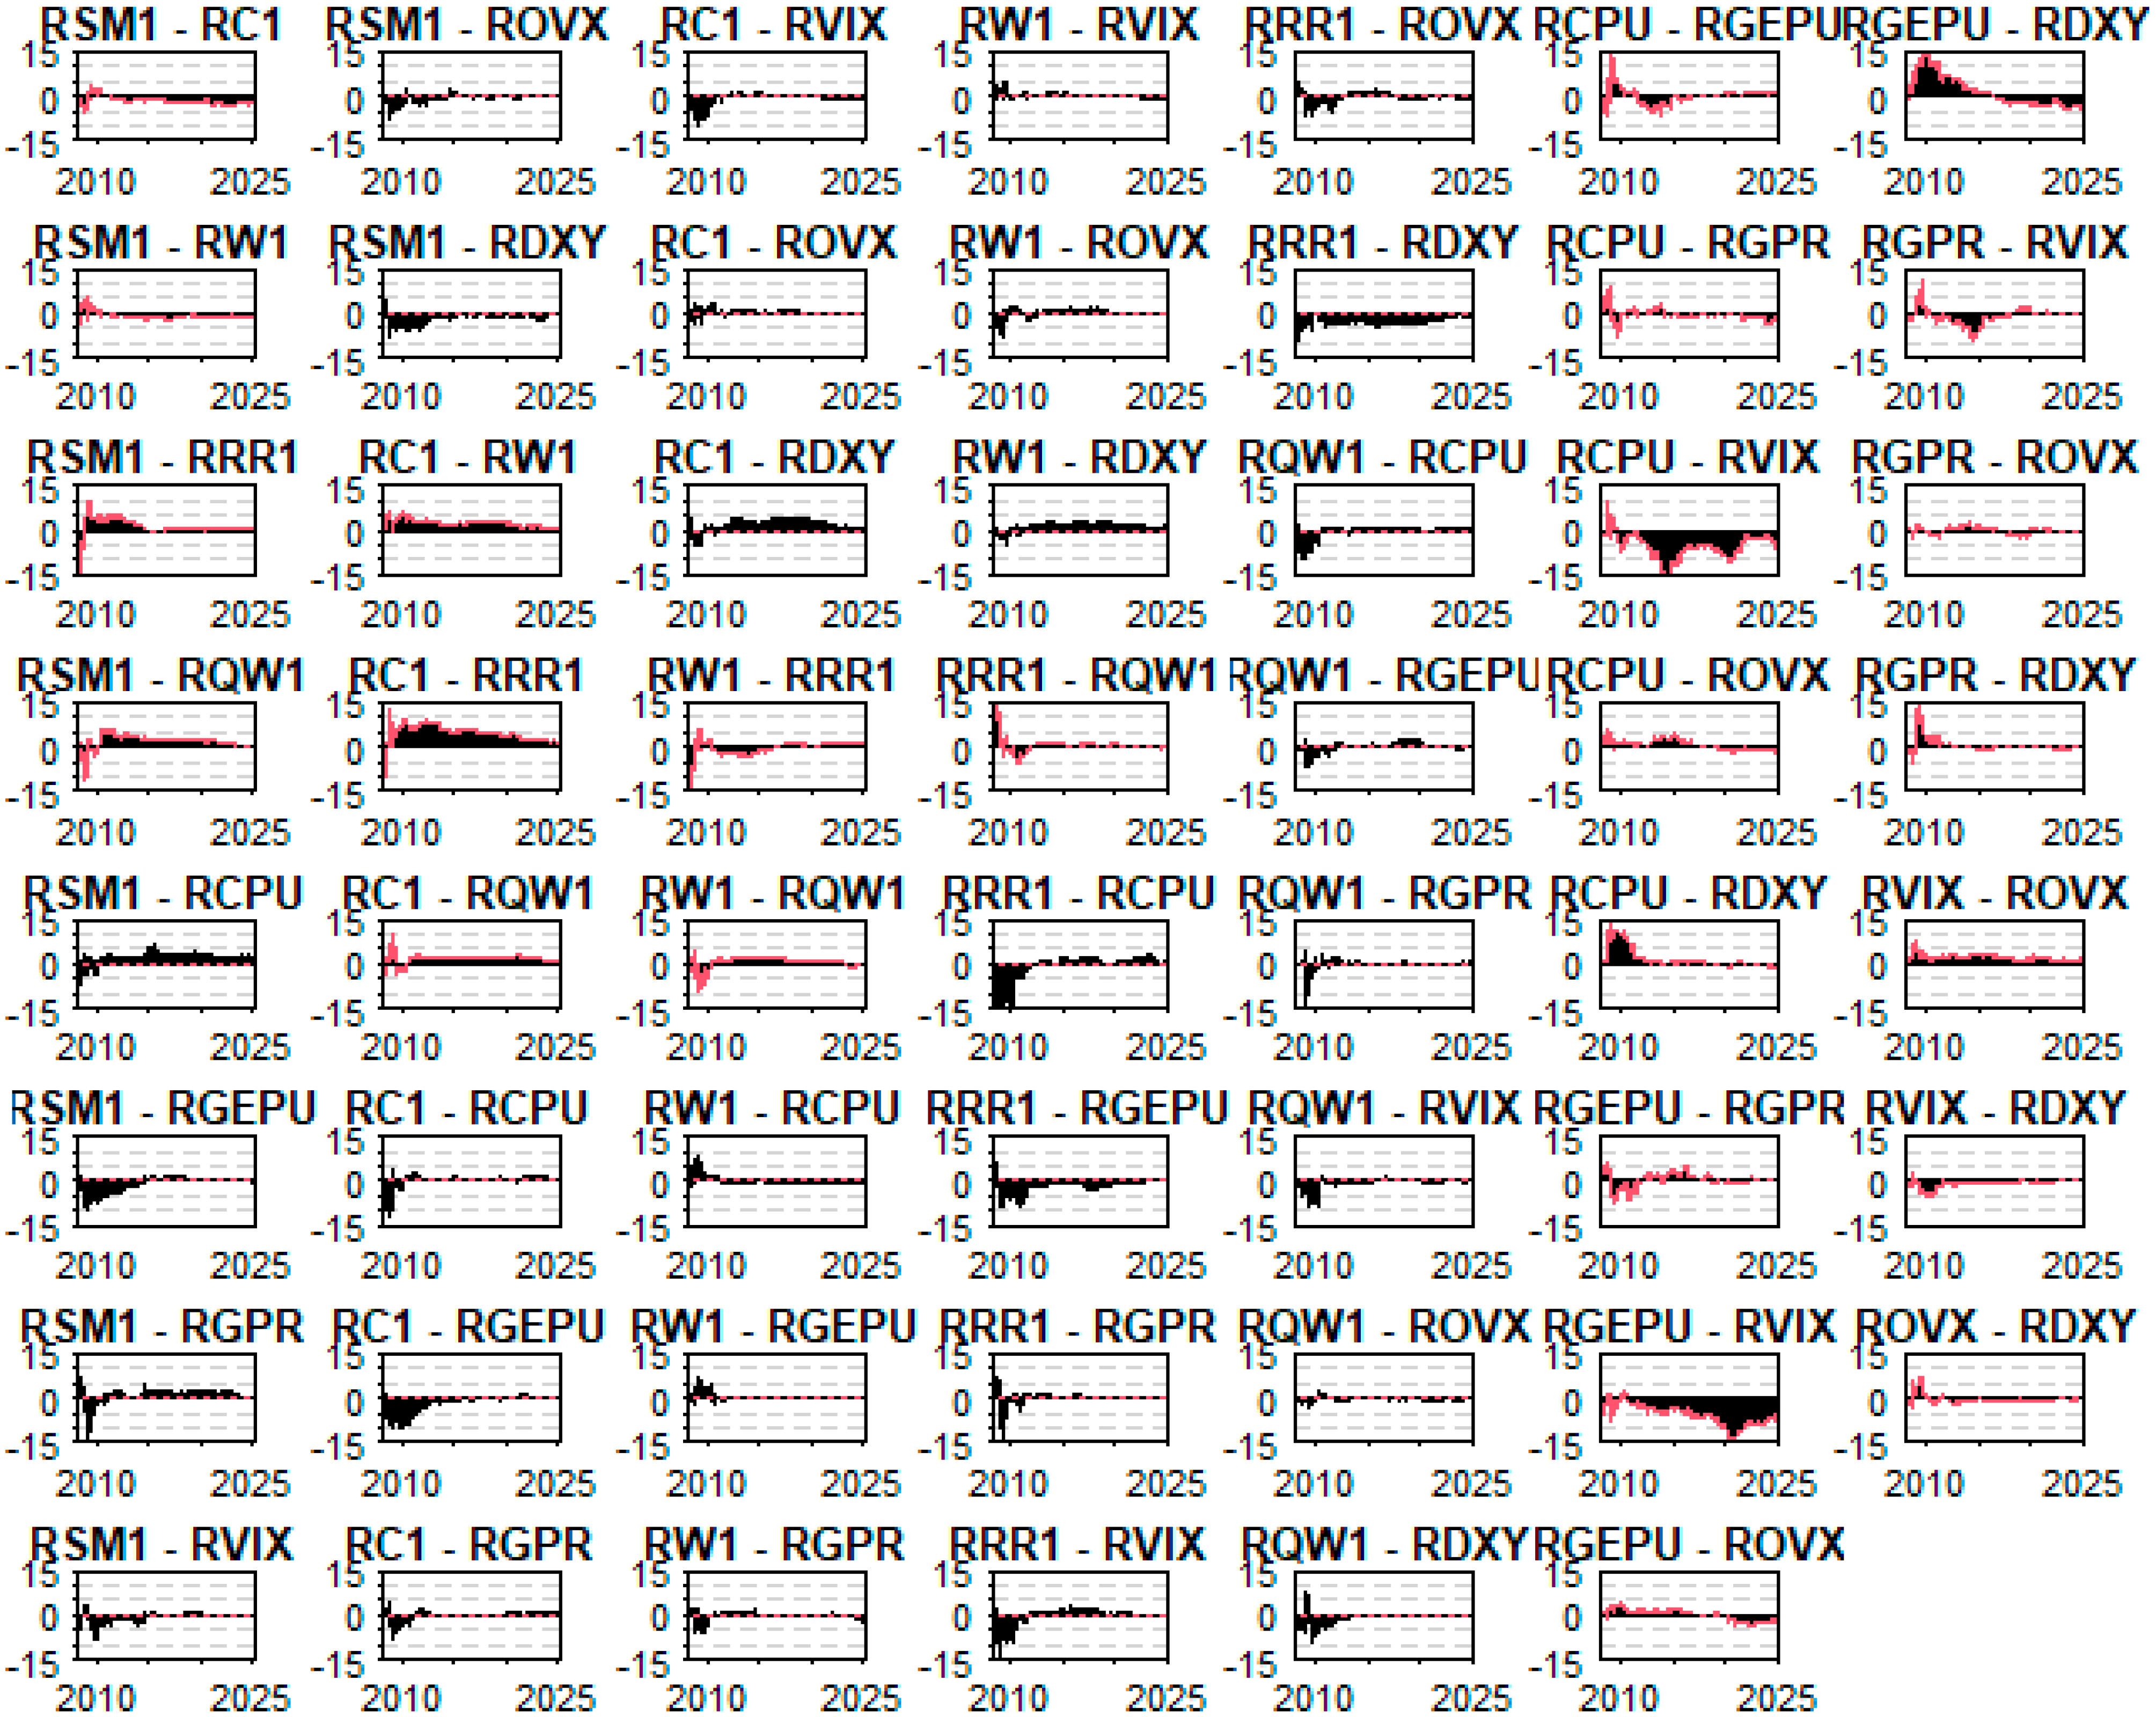
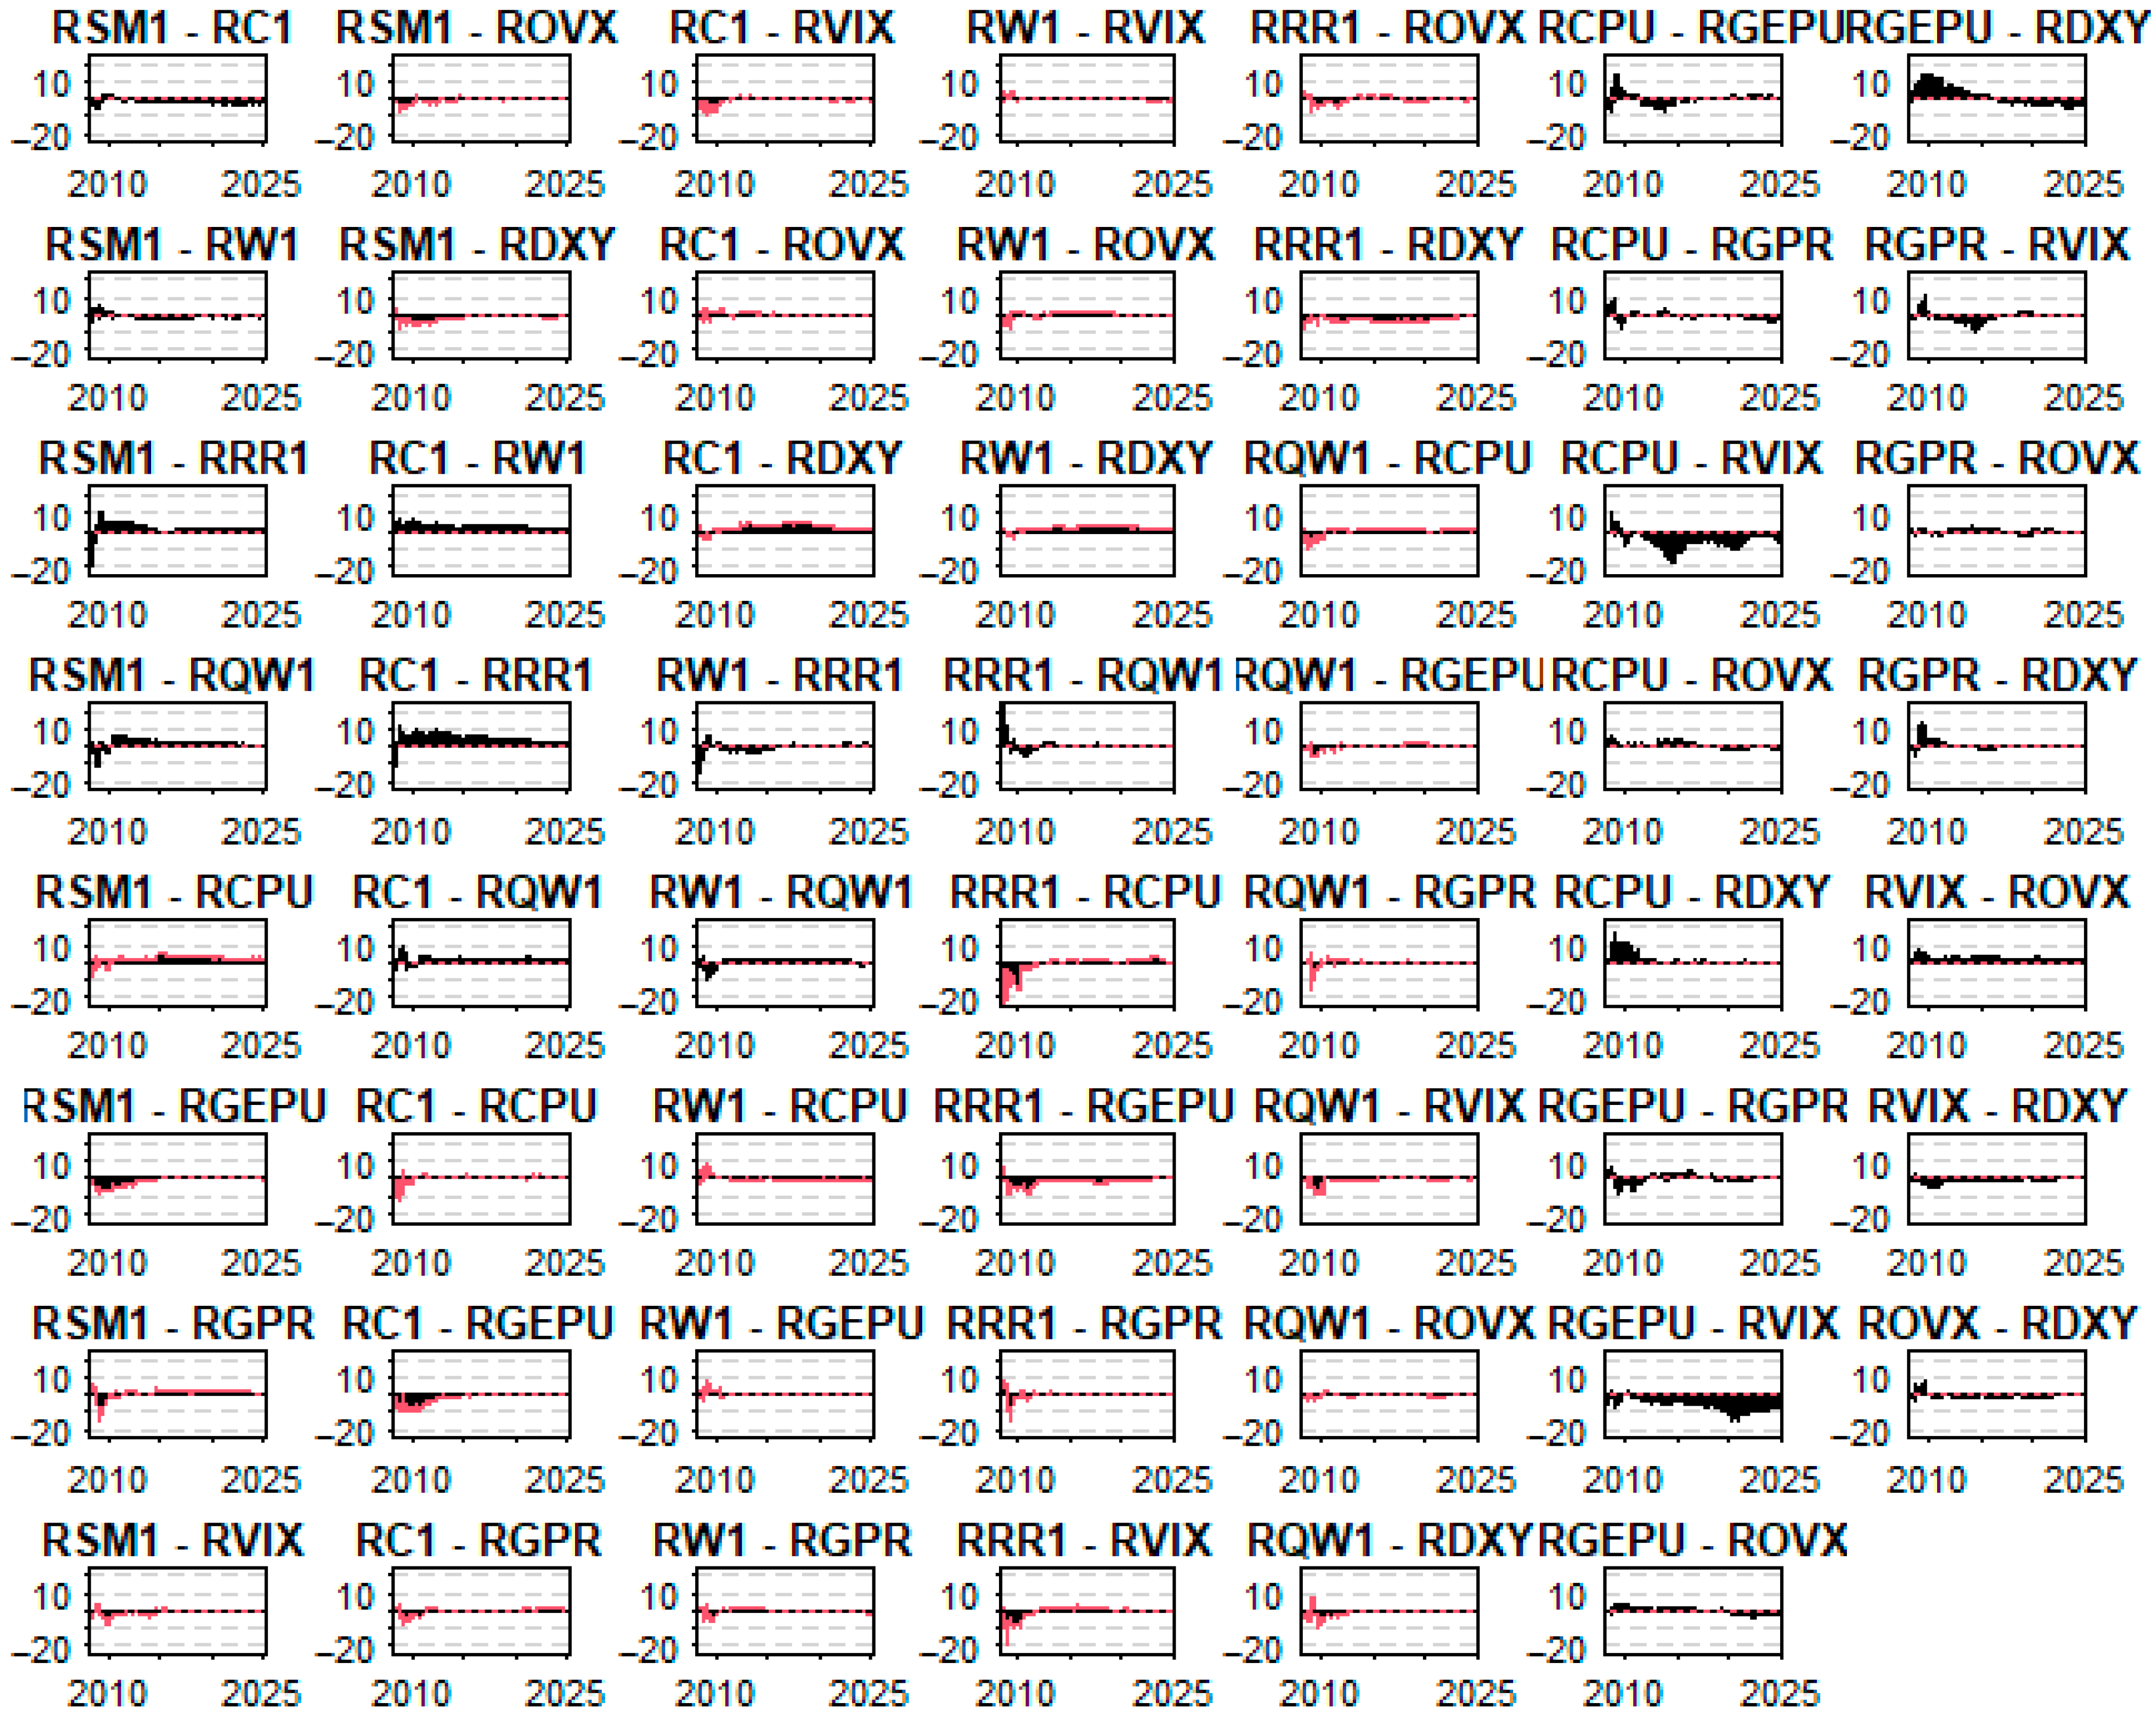
Figure 8 displays the time-varying internal net pairwise total directional connectedness among agricultural commodities and uncertainty indices. Each subplot illustrates the bilateral net transmission of shocks between two variables within the network, where values above zero denote net transmitters and values below zero indicate net receivers. The red lines highlight the direction and magnitude of internal connectedness over time.
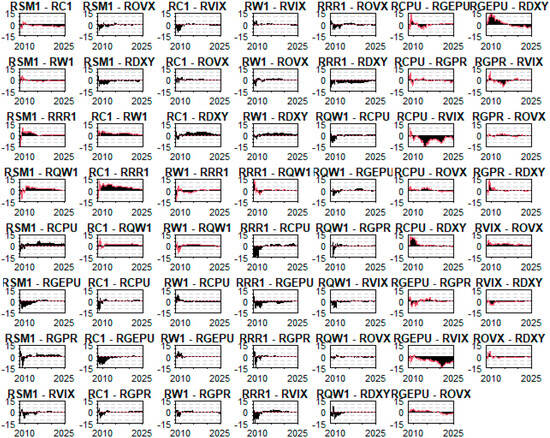
Figure 8.
Internal net pairwise total directional connectedness among agricultural commodities and uncertainty indices. Source: author’s own research.
This figure confirms previous findings: internal spillovers are generally weak and relatively stable, with most relationships oscillating near zero. The dynamics reveal that no individual commodity or index persistently dominates as a source or sink of internal transmission, reinforcing the earlier conclusion that agricultural markets are more susceptible to external systemic forces than to internal feedback loops. The sparse and low-amplitude internal connectedness further supports the asymmetry between internal and external dynamics observed from Figure 5, Figure 6 and Figure 7.
From a policy perspective, these results highlight the limited role of internal propagation in driving systemic risk within agricultural networks, underscoring the need to prioritize exogenous risk factors—such as climate and financial volatility—when designing resilience strategies in the agri-food sector.
4.2.6. External Net Pairwise Total Directional Connectedness
Figure 9 presents the external net pairwise total directional connectedness between agricultural commodities and uncertainty indices. Each subplot captures the directional influence exerted through external spillovers—such as global macroeconomic shocks or climate-related uncertainties—where values above zero indicate that the variable acts as a net external transmitter and values below zero denote net receivers. The black areas represent the intensity of external connectedness, while the red lines indicate its evolution over time.
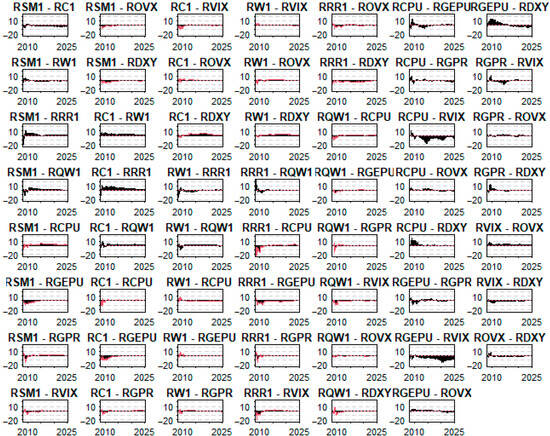
Figure 9.
External net pairwise total directional connectedness among agricultural commodities and uncertainty indices. Source: author’s own research.
This figure confirms the findings reported in Figure 5, Figure 6, Figure 7 and Figure 8: external spillovers are the dominant channels of systemic interaction. Notably, macroeconomic uncertainty indices (e.g., RGEPU, RVIX, and RCPUs) frequently emerge as net transmitters, particularly during periods of heightened global stress. In contrast, agricultural commodities such as soybean (RSM1), corn (RC1), and wheat (RW1) more often appear as net receivers of external shocks, highlighting their vulnerability to macro-financial and climate-driven disturbances.
These results reinforce the conclusion that forces beyond the commodity group itself primarily shape the interconnectedness of agricultural markets. Therefore, policy frameworks aimed at strengthening agri-food system resilience must integrate external risk monitoring and stress-testing mechanisms to safeguard against cascading shocks triggered by global uncertainty dynamics.
These results highlight the importance of strengthening resilience in agri-food systems against external shocks. Policymakers and market participants should consider integrating external risk monitoring into agricultural strategies. Tools such as hedging, market diversification, and early warning systems can help mitigate the impact of global volatility on commodity markets, particularly in the face of ongoing climate stress.
5. Discussion
The findings of our TVP-VAR analysis reveal a persistently dominant role of external spillovers—originating from uncertainty indices such as RGEPU, RCPU, and RVIX—over internal spillovers within agricultural commodity networks. This dominance is particularly pronounced during episodes of global financial distress and climate-related policy uncertainty. These results align with the existing literature, which underscores the systemic influence of uncertainty on commodity dynamics.
For instance, Ref. [21] emphasizes the importance of integrating climate policy uncertainty into economic modeling, advocating for its inclusion in agricultural planning frameworks. Our results empirically support this argument, as RCPU consistently transmits sizable shocks to agricultural markets, reflecting its relevance in shaping agri-food volatility patterns. Similarly, Refs. [9,62] use quantile-based frequency models to show that financial and geopolitical shocks disproportionately affect commodity returns during stress periods—a finding confirmed by our observation of heightened external connectedness following the 2008 crisis and during subsequent periods of instability.
Furthermore, Ref. [22] demonstrates dynamic spillovers among global risk indicators, reinforcing the notion that agri-food systems are deeply embedded within global uncertainty cycles. Our findings corroborate this perspective, with general economic and climate-related uncertainties (RGEPU and RCPU) exerting notable and persistent influence beyond traditional financial assets, affecting agricultural value chains. Finally, Ref. [16] highlights the strategic role of stable and sustainable climate policies by stabilizing agricultural market dynamics. Consistent with this, our results suggest that the relatively muted internal spillovers among agricultural commodities point to the need for resilience-building focused on exogenous drivers of volatility, rather than solely on sector-specific inefficiencies.
Table 5 summarizes the most relevant spillovers in the network. Financial volatility (RVIX) emerges as the strongest external influence, particularly on corn, while global economic uncertainty (RGEPU) significantly affects wheat. Climate policy uncertainty (RCPU) shows a moderate effect on soybeans, reinforcing its crop-specific relevance under certain conditions. Internal linkages—such as corn to wheat and soybeans to rice—highlight interdependencies within agricultural markets. Finally, feedback from commodities to uncertainty indices is minimal. This table complements Figure 5 by distilling the key transmission patterns most relevant to policy and market resilience.
While climate policy uncertainty (RCPU) emerges as a net receiver of shocks in the full-sample connectedness network, its role becomes more prominent under extreme market conditions. This aligns with recent literature suggesting that climate-related uncertainty does not consistently transmit risk under normal market states but exhibits significant transmission dynamics during tail events (e.g., 0.05 and 0.95 quantiles) [21,22]. As such, although macro-financial uncertainty (e.g., VIX) dominates overall connectedness, climate policy uncertainty contributes meaningfully to asymmetric spillovers, especially in commodity-sensitive segments like corn and soybeans. This nuanced role highlights the need to monitor climate-related uncertainty even when it appears as a secondary transmitter in average metrics.
A noteworthy and somewhat unexpected result of our analysis is the limited evidence of strong transmission effects from recent global disruptions—namely, the COVID-19 pandemic and the Russia–Ukraine conflict—on the connectedness structure of agricultural commodities and uncertainty indicators. Several plausible explanations may account for this muted response. First, the TVP-VAR model inherently applies temporal smoothing through the Kalman filter and forecast error variance decomposition, which may dampen the visibility of short-lived or rapidly absorbed shocks. These features are particularly relevant in the context of shocks that trigger immediate but transient responses in commodity markets.
Second, adaptive behavior by market participants and governments may have effectively buffered the volatility typically expected during such crises. For example, during the 2022 wheat export crisis caused by the Russia–Ukraine war, major importers such as Egypt and India implemented stockpiling strategies and released government reserves, mitigating short-term supply disruptions and price shocks. Third, structural adjustments in global food systems—including supply chain diversification, alternative sourcing, and targeted trade interventions—may have reduced the susceptibility of agricultural markets to systemic spillovers during this period. Fourth, the uncertainty indices used in our model—such as RCPU, REPU, and RVIX—are largely macro-financial or text-based and may underrepresent sector-specific disruptions. This limitation has been noted in the literature, including [63], which cautions that macro-level indices may fail to capture commodity-specific or regional shocks.
Finally, methodological considerations such as the size of the rolling estimation window, the focus on medium- to long-term connectedness, and the lag structure of the TVP-VAR model may limit the model’s sensitivity to discrete, short-run events unless they lead to lasting regime shifts.
Our findings may initially appear to diverge from those reported by [26], who document a significant rise in agricultural commodity connectedness during the Russia–Ukraine conflict. However, their study employs a quantile-based connectedness framework using high-frequency daily data, which is particularly sensitive to tail risk and short-term volatility clustering. In contrast, our monthly TVP-VAR model captures time-averaged connectedness over a 10-step forecast horizon, focusing on persistent, systemic transmission rather than episodic or quantile-specific effects. Indeed, Jiang and Chen note that the most pronounced spillovers occurred at extreme upper quantiles (0.9–0.95), while average connectedness effects were more muted—consistent with our findings. This distinction underscores the importance of aligning model frequency and design with the nature of the shocks being studied. Moreover, as highlighted in [2], short-run disruptions during global crises are often buffered by institutional and trade policy responses within the food–energy–water nexus, further reducing the transmission of volatility across systems. Therefore, the results of both studies should not be seen as contradictory, but rather as complementary perspectives: one capturing immediate, quantile-specific stress episodes and the other reflecting longer-term structural resilience.
It is also important to explicitly acknowledge that part of the muted transmission effect of recent crises may be a direct consequence of our methodological choice. The TVP-VAR model applied to monthly data captures evolving structural dynamics but is inherently less sensitive to short-term, high-frequency disruptions. This is a well-recognized limitation of monthly VAR-type models, which smooth over transitory volatility unless such episodes generate persistent structural shifts. As such, the limited response to events like COVID-19 or the Russia–Ukraine war may not solely reflect market resilience but also the model’s low responsiveness to discrete, short-lived shocks.
On the other hand, in light of the asymmetric dominance of external uncertainty, we recommend the development of an early warning system for agri-food markets. Such a system could integrate leading indicators from both financial and environmental domains, including the RVIX (financial market volatility), the Climate Policy Uncertainty (RCPU) Index, and major geopolitical risk indices. A composite warning indicator based on threshold exceedance or volatility clustering could serve as a risk signal, enabling preemptive action by stakeholders in supply chains, trade, and policy. Similar frameworks have been proposed in the context of financial contagion and energy markets and could be adapted to the agri-food domain.
Additionally, we suggest the establishment of cross-sectoral risk monitoring platforms that integrate data from agriculture, finance, trade, and climate governance institutions. By enabling real-time sharing of uncertainty measures, supply metrics, and price data, such platforms would facilitate early detection of systemic stress. Coordination between ministries of agriculture, central banks, and meteorological agencies would enhance the ability to respond rapidly to compound risks emerging from climate shocks and market volatility.
6. Conclusions
6.1. Contribution and Conceptual Innovation
Climate-related disruptions are increasingly reshaping the stability and dynamics of global agricultural markets. The growing frequency and intensity of extreme weather events, coupled with heightened economic and geopolitical uncertainty, necessitate a deeper understanding of how shocks propagate across agricultural systems. In this context, uncertainty indices—particularly those related to climate, policy, and market volatility—offer a valuable lens through which to evaluate risk transmission. While prior studies have focused on static or regional dynamics, a gap remains in understanding the evolving patterns of connectedness between agricultural commodities and global uncertainty factors. This conceptual distinction directly responds to RQ1.
6.2. Principal Findings
This study employs a Time-Varying Parameter Vector Autoregressive (TVP-VAR) model with monthly data to examine the dynamic interconnectedness between agricultural commodities and exogenous uncertainty factors under climate stress. Internal connectedness is defined as the transmission of shocks among key agricultural commodities—soybean (RSM1), corn (RC1), wheat (RW1), rough rice (RRR1), and sugar (RQW1)—capturing the endogenous dynamics within the commodity system. In contrast, external connectedness refers to the spillover effects stemming from six uncertainty indices: climate policy uncertainty (RCPU), global economic policy uncertainty (RGEPU), geopolitical risk (RGPR), financial market volatility (RVIX), crude oil volatility (ROVX), and the U.S. Dollar Index (RDXY).
This study highlights key spillover patterns across agricultural commodities and uncertainty indicators. The results confirm that macro-financial uncertainty, especially from RVIX and RGEPU, plays a dominant role in shaping agricultural market dynamics, with the strongest transmission effects observed on corn and wheat. While climate policy uncertainty (RCPU) acts as a net receiver in the overall network, it exhibits targeted influence on climate-sensitive crops like soybeans. Internal commodity linkages—such as corn → wheat and soybeans → rice—further reflect structural interdependencies within the agri-food system. By summarizing these findings in Table 5, the study enhances the interpretability of the connectedness network and reinforces the relevance of monitoring both financial and environmental indicators in agricultural risk management. Then, our results offer empirical evidence on the dominance of macro-financial over climate policy uncertainty in agricultural markets, highlighting the conditional and asymmetric influence of climate stress.
The results reveal that agricultural commodity markets are predominantly influenced by external uncertainty, particularly during episodes of global financial or geopolitical stress. Interestingly, recent crises such as the COVID-19 pandemic and the Russia–Ukraine war do not produce strong or persistent signals in the connectedness patterns. This may reflect the smoothing effect of the TVP-VAR model on short-term shocks or the resilience of agricultural markets due to supply chain adaptations, emergency stockpiling, and targeted trade interventions. Overall, these findings highlight the systemic vulnerability of food systems to macro-financial and policy-related shocks, with internal commodity interactions playing a secondary role. The distinction between internal and external spillovers provides critical insights into the asymmetric nature of risk propagation, emphasizing the importance of integrating macro-level risk assessments into agricultural resilience and policy frameworks.
This study provides robust empirical evidence that external uncertainty shocks—especially those arising from global economic policy (RGEPU), climate policy (RCPU), and financial volatility (RVIX)—consistently dominate the connectedness structure among agricultural commodities. The subdued and relatively stable nature of internal spillovers suggests that agri-food systems are increasingly tethered to global risk cycles rather than internal market dynamics. This is consistent with prior work by [9], who document the prevailing influence of climate policy uncertainty over grains markets using quantile and time–frequency analysis, and by [1], who show that climate risk shocks contribute significantly to tail risk in agricultural markets. These findings provide robust support for RQ1 and confirm Hypothesis H1, which posits the dominance of external over internal transmission mechanisms.
Climate policy uncertainty (RCPU) exhibits a more complex behavior. While it does not appear as a primary net transmitter across the full sample, it does show stronger spillover effects under extreme market states, particularly for climate-sensitive commodities like soybeans. This conditional role directly addresses RQ3 and supports Hypothesis H3. The asymmetric nature of this behavior aligns with recent findings in quantile-based and time-frequency literature.
6.3. Interpretation of Crisis Effects
Notably, the absence of strong signals from recent global disruptions—such as the COVID-19 pandemic and the Russia–Ukraine conflict—is somewhat unexpected. Several plausible explanations exist. First, the TVP-VAR model, by construction, captures smoothed trends over time and may attenuate high-frequency, short-lived effects unless they lead to sustained regime shifts. This modeling structure may obscure rapid spillover dynamics associated with fast-moving crises, especially when using monthly data. Future research could address this by incorporating higher-frequency data—such as weekly or daily futures prices for key agricultural commodities—which would allow for more precise detection of short-term market reactions to geopolitical shocks or extreme weather events. Second, during these crises, many agricultural markets may have exhibited decoupled dynamics due to government interventions, logistical reconfigurations, and domestic buffer stocks. Third, the uncertainty indices used—based primarily on macroeconomic or textual data—may lack the granularity to fully capture commodity-specific disruptions, especially in supply chains, as suggested by [38].
Finally, a limitation of the current model is its inability to account for spatial heterogeneity in climate exposure. For example, drought events in the U.S. Midwest or floods in Southeast Asia may have differential impacts on crop yields, prices, and spillover dynamics. Future research could address this by incorporating spatial econometric techniques or panel TVP-VAR models with regional disaggregation, allowing for geographically differentiated assessments of uncertainty transmission.
These observations are particularly relevant to RQ2, as they highlight how transmission intensity varies by market condition and crisis type. The results offer support for Hypothesis H2, in that external connectedness remains dominant but is not uniformly heightened during every crisis episode, suggesting that short-lived shocks may be absorbed or muted in monthly data.
6.4. Limitations and Future Research Directions
To address these limitations, future research could incorporate high-frequency models such as Dynamic Conditional Correlation GARCH or wavelet-based methods, which may better capture short-term volatility clustering. Another promising avenue is the use of spatial econometric techniques or regionally disaggregated TVP-VAR models, which could account for the spatial heterogeneity of climate impacts—such as droughts in the U.S. Midwest or floods in Southeast Asia—on agricultural commodity spillovers. Additionally, more tailored uncertainty indicators that reflect agricultural policy shocks, climate anomalies, and logistics disruptions could offer sharper insights into sector-specific risk propagation. Mixed-frequency data models and machine learning-based topic modeling (e.g., BERTopic) can also provide alternative strategies for uncovering hidden uncertainty signals in news-based or social media datasets.
6.5. Policy Implications and Final Remarks
From a policy and practical standpoint, our results underscore an urgent need to enhance the resilience of agricultural markets to global uncertainty shocks. Monitoring external risk indices—especially those capturing climate policy and macro-financial conditions—should become integral to early warning systems, market stabilization strategies, and insurance mechanisms. For researchers and analysts, the study underscores the importance of dynamic modeling frameworks in monitoring the evolving impact of global risks on food systems. The implications are particularly critical in the context of climate change, as increasing uncertainty threatens to exacerbate volatility and compromise food security.
In summary, this study contributes to the literature by distinguishing between internal and external connectedness in agricultural markets under climate stress. It confirms that systemic vulnerabilities are primarily external and highlights methodological and practical pathways to better understand, anticipate, and mitigate their impacts.
Then, our results contribute to a growing body of evidence suggesting that while agricultural commodities are vulnerable to exogenous shocks, the actual transmission of these shocks is context-dependent and often mediated by policy responses, market structures, and data limitations. Future research should consider high-frequency models, alternative uncertainty proxies, and sector-specific indicators to better capture the impact of transient but consequential global events on commodity networks.
Author Contributions
Methodology, N.J.M.-R. and J.D.G.-R.; validation, N.J.M.-R., J.D.G.-R. and S.B.; formal analysis, N.J.M.-R., J.D.G.-R. and S.B.; investigation, N.J.M.-R., J.D.G.-R. and S.B.; writing—original draft, N.J.M.-R. and J.D.G.-R.; writing—review and editing, N.J.M.-R., J.D.G.-R. and S.B. All authors have read and agreed to the published version of the manuscript.
Funding
This research received no external funding.
Institutional Review Board Statement
Not applicable.
Informed Consent Statement
Not applicable.
Data Availability Statement
The data presented in this study are available on request from the corresponding author due to access restrictions. Please note that the Bloomberg, Scopus, and Web of Science databases used in this research are subscription-based and require institutional or individual access.
Acknowledgments
We sincerely appreciate the thoughtful suggestions and constructive critiques from the four reviewers and the editor, whose contributions have substantially strengthened our research.
Conflicts of Interest
The authors declare no conflicts of interest.
References
- Khalfaoui, R.; Goodell, J.W.; Mefteh-Wali, S.; Chishti, M.Z.; Gozgor, G. Impact of Climate Risk Shocks on Global Food and Agricultural Markets: A Multiscale and Tail Connectedness Analysis. Int. Rev. Financ. Anal. 2024, 93, 103206. [Google Scholar] [CrossRef]
- Le, T.H.; Pham, L.; Do, H.X. Price Risk Transmissions in the Water-Energy-Food Nexus: Impacts of Climate Risks and Portfolio Implications. Energy Econ. 2023, 124, 106787. [Google Scholar] [CrossRef]
- Mao, X.; Wei, P.; Ren, X. Climate Risk and Financial Systems: A Nonlinear Network Connectedness Analysis. J. Environ. Manag. 2023, 340, 117878. [Google Scholar] [CrossRef]
- Coskun, M.; Khan, N.; Saleem, A.; Hammoudeh, S. Spillover Connectedness Nexus Geopolitical Oil Price Risk, Clean Energy Stocks, Global Stock, and Commodity Markets. J. Clean. Prod. 2023, 429, 139583. [Google Scholar] [CrossRef]
- Ghosh, B.; Ghosh, A. Change in Dietary Pattern of Agri Commodities in the Past Six Decades: Time-Varying VAR Approach. Glob. Food Secur. 2025, 44, 100823. [Google Scholar] [CrossRef]
- Xue, H.; Du, Y.; Gao, Y.; Su, W.-H. Spatial Price Transmission and Dynamic Volatility Spillovers in the Global Grain Markets: A TVP-VAR-Connectedness Approach. Foods 2024, 13, 3317. [Google Scholar] [CrossRef]
- Mubenga-Tshitaka, J.-L.; Muteba Mwamba, J.W.; Dikgang, J.; Gelo, D. Risk Spillover between Climate Variables and the Agricultural Commodity Market in East Africa. Clim. Risk Manag. 2023, 42, 100561. [Google Scholar] [CrossRef]
- Chen, M.; Xiao, H.; Zhao, H.; Liu, L. The Power of Attention: Government Climate-Risk Attention and Agricultural-Land Carbon Emissions. Environ. Res. 2024, 251, 118661. [Google Scholar] [CrossRef]
- Zeng, H.; Xu, W.; Lu, R. Quantile Frequency Connectedness between Crude Oil Volatility, Geopolitical Risk and Major Agriculture and Livestock Markets. Appl. Econ. 2025, 57, 3345–3360. [Google Scholar] [CrossRef]
- Tiwari, A.K.; Abakah, E.J.A.; Adewuyi, A.O.; Lee, C.-C. Quantile Risk Spillovers between Energy and Agricultural Commodity Markets: Evidence from Pre and during COVID-19 Outbreak. Energy Econ. 2022, 113, 106235. [Google Scholar] [CrossRef]
- Li, Y.; Chen, S.; Sensoy, A.; Wang, L. Over-Expected Shocks and Financial Market Security: Evidence from China’s Markets. Res. Int. Bus. Financ. 2024, 68, 102194. [Google Scholar] [CrossRef]
- Iqbal, N.; Bouri, E.; Grebinevych, O.; Roubaud, D. Modelling Extreme Risk Spillovers in the Commodity Markets around Crisis Periods Including COVID-19. Ann. Oper. Res. 2023, 330, 305–334. [Google Scholar] [CrossRef]
- Dai, Z.; Zhu, H. Dynamic Risk Spillover among Crude Oil, Economic Policy Uncertainty and Chinese Financial Sectors. Int. Rev. Econ. Financ. 2023, 83, 421–450. [Google Scholar] [CrossRef]
- Yousfi, M.; Bouzgarrou, H. Quantile Time–Frequency Connectedness between Energy and Agriculture Markets: A Study during the COVID-19 Crisis and the Russo–FUkrainian Conflict. J. Financ. Econ. Policy 2024, 16, 559–579. [Google Scholar] [CrossRef]
- Yan, W.-L.; Cheung, A.; Wai, K. Quantile Connectedness among Climate Policy Uncertainty, News Sentiment, Oil and Renewables in China. Res. Int. Bus. Financ. 2025, 76, 102814. [Google Scholar] [CrossRef]
- Wu, G.; Hu, G. Asymmetric Spillovers and Resilience in Physical and Financial Assets amid Climate Policy Uncertainties: Evidence from China. Technol. Forecast. Soc. Change 2024, 208, 123701. [Google Scholar] [CrossRef]
- Caporin, M.; Naeem, M.A.; Arif, M.; Hasan, M.; Vo, X.V.; Hussain Shahzad, S.J. Asymmetric and Time-Frequency Spillovers among Commodities Using High-Frequency Data. Resour. Policy 2021, 70, 101958. [Google Scholar] [CrossRef]
- Balli, F.; Naeem, M.A.; Shahzad, S.J.H.; de Bruin, A. Spillover Network of Commodity Uncertainties. Energy Econ. 2019, 81, 914–927. [Google Scholar] [CrossRef]
- Pham, L.; Kamal, J. Bin Blessings or Curse: How Do Media Climate Change Concerns Affect Commodity Tail Risk Spillovers? J. Commod. Mark. 2024, 34, 100407. [Google Scholar] [CrossRef]
- Lucey, B.; Ren, B. Time-Varying Tail Risk Connectedness among Sustainability-Related Products and Fossil Energy Investments. Energy Econ. 2023, 126, 106812. [Google Scholar] [CrossRef]
- Wang, K.-H.; Kan, J.-M.; Qiu, L.; Xu, S. Climate Policy Uncertainty, Oil Price and Agricultural Commodity: From Quantile and Time Perspective. Econ. Anal. Policy 2023, 78, 256–272. [Google Scholar] [CrossRef]
- Zeng, H.; Abedin, M.Z.; Ahmed, A.D.; Lucey, B. Quantile and Time–Frequency Risk Spillover Between Climate Policy Uncertainty and Grains Commodity Markets. J. Futures Mark. 2025, 45, 659–682. [Google Scholar] [CrossRef]
- Ren, Y.; Wang, N.; Zhu, H. Dynamic Connectedness of Climate Risks, Oil Shocks, and China’s Energy Futures Market: Time-Frequency Evidence from Quantile-on-Quantile Regression. N. Am. J. Econ. Financ. 2025, 75, 102263. [Google Scholar] [CrossRef]
- Zeng, H.; Lu, R.; Ahmed, A.D. Return Connectedness and Multiscale Spillovers across Clean Energy Indices and Grain Commodity Markets around COVID-19 Crisis. J. Environ. Manag. 2023, 340, 117912. [Google Scholar] [CrossRef]
- Tan, X.; Wang, X.; Ma, S.; Wang, Z.; Zhao, Y.; Xiang, L. COVID-19 Shock and the Time-Varying Volatility Spillovers Among the Energy and Precious Metals Markets: Evidence From A DCC-GARCH-Connectedness Approach. Front. Public Health 2022, 10, 906969. [Google Scholar] [CrossRef] [PubMed]
- Jiang, W.; Chen, Y. Impact of Russia-Ukraine Conflict on the Time-Frequency and Quantile Connectedness between Energy, Metal and Agricultural Markets. Resour. Policy 2024, 88, 104376. [Google Scholar] [CrossRef]
- Ghosh, B.; Paparas, D. Quantile Connectedness in Agri-Commodity Markets: What Has Changed over Past Six Decades? Heliyon 2023, 9, e13463. [Google Scholar] [CrossRef]
- Jiang, Y.; Ao, Z.; Mo, B. The Risk Spillover between China’s Economic Policy Uncertainty and Commodity Markets: Evidence from Frequency Spillover and Quantile Connectedness Approaches. N. Am. J. Econ. Financ. 2023, 66, 101905. [Google Scholar] [CrossRef]
- Polat, O.; Doğan Başar, B.; Torun, E.; Ekşi, İ.H. Dynamic Interlinkages between Geopolitical Stress and Agricultural Commodity Market: Novel Findings in the Wake of the Russian Ukrainian Conflict. Borsa Istanb. Rev. 2023, 23, S74–S83. [Google Scholar] [CrossRef]
- Karkowska, R.; Urjasz, S. Importance of Geopolitical Risk in Volatility Structure: New Evidence from Biofuels, Crude Oil, and Grains Commodity Markets. J. Commod. Mark. 2024, 36, 100440. [Google Scholar] [CrossRef]
- Ge, J.; Min Du, A.; Lin, B. Volatility in a Mug Cup: Spillovers among Cocoa, Coffee, Sugar Futures and the Role of Climate Policy Risk. Res. Int. Bus. Financ. 2025, 73, 102634. [Google Scholar] [CrossRef]
- Baker, S.R.; Bloom, N.; Davis, S.J. Measuring Economic Policy Uncertainty. Q. J. Econ. 2016, 131, 1593–1636. [Google Scholar] [CrossRef]
- Jurado, K.; Ludvigson, S.C.; Ng, S. Measuring Uncertainty. Am. Econ. Rev. 2015, 105, 1177–1216. [Google Scholar] [CrossRef]
- Caldara, D.; Iacoviello, M. Measuring Geopolitical Risk. Am. Econ. Rev. 2022, 112, 1194–1225. [Google Scholar] [CrossRef]
- Whaley, R.E. Understanding the VIX. J. Portf. Manag. 2009, 35, 98–105. [Google Scholar] [CrossRef]
- Cochrane, J.H. Monetary Policy with Interest on Reserves. J. Econ. Dyn. Control. 2014, 49, 74–108. [Google Scholar] [CrossRef]
- Adekoya, O.B.; Oliyide, J.A. How COVID-19 Drives Connectedness among Commodity and Financial Markets: Evidence from TVP-VAR and Causality-in-Quantiles Techniques. Resour. Policy 2021, 70, 101898. [Google Scholar] [CrossRef] [PubMed]
- Wu, Y.; Ren, W.; Wan, J.; Liu, X. Time-Frequency Volatility Connectedness between Fossil Energy and Agricultural Commodities: Comparing the COVID-19 Pandemic with the Russia-Ukraine Conflict. Financ. Res. Lett. 2023, 55, 103866. [Google Scholar] [CrossRef]
- Zhou, X.; Enilov, M.; Parhi, M. Does Oil Spin the Commodity Wheel? Quantile Connectedness with a Common Factor Error Structure across Energy and Agricultural Markets. Energy Econ. 2024, 132, 107468. [Google Scholar] [CrossRef]
- Mensi, W.; Hammoudeh, S.; Kang, S.H. Precious Metals, Cereal, Oil and Stock Market Linkages and Portfolio Risk Management: Evidence from Saudi Arabia. Econ. Model. 2015, 51, 340–358. [Google Scholar] [CrossRef]
- Algieri, B.; Leccadito, A. Assessing Contagion Risk from Energy and Non-Energy Commodity Markets. Energy Econ. 2017, 62, 312–322. [Google Scholar] [CrossRef]
- Mensi, W.; Hammoudeh, S.; Al-Jarrah, I.M.W.; Sensoy, A.; Kang, S.H. Dynamic Risk Spillovers between Gold, Oil Prices and Conventional, Sustainability and Islamic Equity Aggregates and Sectors with Portfolio Implications. Energy Econ. 2017, 67, 454–475. [Google Scholar] [CrossRef]
- Ji, Q.; Bouri, E.; Roubaud, D.; Shahzad, S.J.H. Risk Spillover between Energy and Agricultural Commodity Markets: A Dependence-Switching CoVaR-Copula Model. Energy Econ. 2018, 75, 14–27. [Google Scholar] [CrossRef]
- Aria, M.; Cuccurullo, C. Bibliometrix: An R-Tool for Comprehensive Science Mapping Analysis. J. Informetr. 2017, 11, 959–975. [Google Scholar] [CrossRef]
- Ferrer, R.; Shahzad, S.J.H.; López, R.; Jareño, F. Time and Frequency Dynamics of Connectedness between Renewable Energy Stocks and Crude Oil Prices. Energy Econ. 2018, 76, 1–20. [Google Scholar] [CrossRef]
- Yahya, M.; Oglend, A.; Dahl, R.E. Temporal and Spectral Dependence between Crude Oil and Agricultural Commodities: A Wavelet-Based Copula Approach. Energy Econ. 2019, 80, 277–296. [Google Scholar] [CrossRef]
- Meng, J.; Nie, H.; Mo, B.; Jiang, Y. Risk Spillover Effects from Global Crude Oil Market to China’s Commodity Sectors. Energy 2020, 202, 117208. [Google Scholar] [CrossRef]
- Bouri, E.; Lucey, B.; Saeed, T.; Vo, X.V. The Realized Volatility of Commodity Futures: Interconnectedness and Determinants. Int. Rev. Econ. Financ. 2021, 73, 139–151. [Google Scholar] [CrossRef]
- Mensi, W.; Shafiullah, M.; Vo, X.V.; Kang, S.H. Volatility Spillovers between Strategic Commodity Futures and Stock Markets and Portfolio Implications: Evidence from Developed and Emerging Economies. Resour. Policy 2021, 71, 102002. [Google Scholar] [CrossRef]
- Bouri, E.; Lei, X.; Jalkh, N.; Xu, Y.; Zhang, H. Spillovers in Higher Moments and Jumps across US Stock and Strategic Commodity Markets. Resour. Policy 2021, 72, 102060. [Google Scholar] [CrossRef]
- Mensi, W.; Al Rababa’a, A.R.; Vo, X.V.; Kang, S.H. Asymmetric Spillover and Network Connectedness between Crude Oil, Gold, and Chinese Sector Stock Markets. Energy Econ. 2021, 98, 105262. [Google Scholar] [CrossRef]
- Umar, Z.; Jareño, F.; Escribano, A. Agricultural Commodity Markets and Oil Prices: An Analysis of the Dynamic Return and Volatility Connectedness. Resour. Policy 2021, 73, 102147. [Google Scholar] [CrossRef]
- Mensi, W.; Yousaf, I.; Vo, X.V.; Kang, S.H. Asymmetric Spillover and Network Connectedness between Gold, BRENT Oil and EU Subsector Markets. J. Int. Financ. Mark. Inst. Money 2022, 76, 101487. [Google Scholar] [CrossRef]
- Balcilar, M.; Gabauer, D.; Umar, Z. Crude Oil Futures Contracts and Commodity Markets: New Evidence from a TVP-VAR Extended Joint Connectedness Approach. Resour. Policy 2021, 73, 102219. [Google Scholar] [CrossRef]
- Gavriilidis, K. Measuring Climate Policy Uncertainty. 2021. Available online: https://papers.ssrn.com/sol3/papers.cfm?abstract_id=3847388 (accessed on 30 May 2025).
- Antonakakis, N.; Gabauer, D. Refined Measures of Dynamic Connectedness Based on TVP-VAR. MPRA Pap. 2017, 78282. [Google Scholar]
- Antonakakis, N.; Gabauer, D.; Gupta, R.; Plakandaras, V. Dynamic Connectedness of Uncertainty across Developed Economies: A Time-Varying Approach. Econ. Lett. 2018, 166, 63–75. [Google Scholar] [CrossRef]
- Diebold, F.X.; Yilmaz, K. Measuring Financial Asset Return and Volatility Spillovers, with Application to Global Equity Markets. Econ. J. 2009, 119, 158–171. [Google Scholar] [CrossRef]
- Diebold, F.X.; Yilmaz, K. Better to Give than to Receive: Predictive Directional Measurement of Volatility Spillovers. Int. J. Forecast. 2012, 28, 57–66. [Google Scholar] [CrossRef]
- Koop, G.; Pesaran, M.H.; Potter, S.M. Impulse Response Analysis in Nonlinear Multivariate Models. J. Econom. 1996, 74, 119–147. [Google Scholar] [CrossRef]
- Pesaran, H.H.; Shin, Y. Generalized Impulse Response Analysis in Linear Multivariate Models. Econ. Lett. 1998, 58, 17–29. [Google Scholar] [CrossRef]
- Gao, W.; Wei, J.; Zhang, H.; Zhang, H. Does Climate Policy Uncertainty Exacerbate Extreme Risk Spillovers between Green Economy and Energy Metals? Resour. Policy 2024, 91, 104946. [Google Scholar] [CrossRef]
- Zhang, J.; Zhang, Y.; Wei, Y.; Wang, Z. Normal and Extreme Impact and Connectedness between Fossil Energy Futures Markets and Uncertainties: Does El Niño-Southern Oscillation Matter? Int. Rev. Econ. Financ. 2024, 89, 188–215. [Google Scholar] [CrossRef]
Disclaimer/Publisher’s Note: The statements, opinions and data contained in all publications are solely those of the individual author(s) and contributor(s) and not of MDPI and/or the editor(s). MDPI and/or the editor(s) disclaim responsibility for any injury to people or property resulting from any ideas, methods, instructions or products referred to in the content. |
© 2025 by the authors. Licensee MDPI, Basel, Switzerland. This article is an open access article distributed under the terms and conditions of the Creative Commons Attribution (CC BY) license (https://creativecommons.org/licenses/by/4.0/).

