Abstract
Access to clean and safe drinking water is crucial for global health and well-being, formally recognised as a fundamental human right within the United Nations’ Sustainable Development Goals. However, the integrity of water supply is increasingly threatened by microbial contamination, a risk aggravated by the conditions driven from climate change, which promotes the proliferation, resilience, and facilitation of the dissemination of microorganisms. Pathogens like Legionella, Cryptosporidium, Giardia, Escherichia coli, and Vibrio cholerae can be present in water supplies, developing survival strategies (e.g., biofilm, cysts, inside protozoa). The risk of microorganisms in water requires both effective treatment at drinking water treatment plants and vigilant process control throughout drinking water distribution systems. Globally, a great number of disease outbreaks have been linked to contaminated drinking water. Despite strong regulations in the European Union and the Drinking Water Directive aim to guarantee the safety and quality of potable water, outbreaks persist; recent Legionella cases in Italy in 2024 and Cryptosporidiosis in 2019 linked to rainfalls and insufficient disinfection treatment, respectively, are an example of this. Although cholera is not common in Europe, there is evidence of high incidence of this disease in Africa mainly due to the poor hygienic conditions in the DWTS. In Europe, the data of waterborne diseases and outbreaks are submitted by European Countries to the European Centre for Disease Prevention and Control (ECDC) to give faster and effective response to outbreaks. Determining the origin of the contamination is essential to face the solution of outbreaks and ensure public health safety.
1. Introduction
Having access to clean and safe drinking water is essential for maintaining health and well-being. The United Nations in 2015 recognised access to clean water and sanitation as a basic human right by including it in the Sustainable Development Goals (SDG 6), aiming to ensure universal and fair access to safe and affordable drinking water for all by 2030 [1,2]. Drinking water quality reflects the properties of a raw water source, including physicochemical and microbiological characteristics. Recent research highlights the significant impact of microorganisms on the quality of drinking water, revealing complex interactions between microbial communities and public health [3,4,5,6,7]. The microbiological safety of drinking water is fundamental to guarantee its quality. Bacteria, viruses, protozoa, and endotoxins are the most common microbiological contaminants in drinking water [8,9,10,11,12,13]. Often, a raw water source requires treatments before being considered potable, according to potable water standards established in the corresponding regulations in each country. Furthermore, drinking water is delivered to the consumer through kilometres of pipes, and maintenance of water quality in these long ways to the tap is a prime concern for drinking water and can be a challenging task [3], particularly in regions with inadequate sanitation infrastructure. Microbiological contaminants can appear anywhere in the drinking water supply, even in developed countries with strict regulations and monitoring. High level of microbiological contamination may result in an increase in waterborne diseases, affecting mainly to vulnerable populations.
Despite improvements in recent decades, access to good quality drinking water remains a critical issue [14]. It is important to know the risk of microbial contamination in the source of drinking water for preventing it and try to mitigate its potential impact on the population [15]. Microbial contamination in surface water sources can be intensified due to climate change and extreme weather events [16,17,18,19]. Climate change is a pressing issue that has significant impacts on our planet and affects every region worldwide, having a deep impact on microorganisms, affecting their distribution, behaviour, and interactions with the environment. Microorganisms occupy large areas of the Earth thanks to their ability to adapt, even to very extreme environmental conditions [20]. The National Oceanic and Atmospheric Administration (NOAA) shows that as global average surface temperatures have increased significantly, leading to more frequent and intense heatwaves. Earth’s temperature has risen by an average of 0.06 °C per decade since 1850 and this rate has become 0.20 °C since 1982. Average global temperatures have risen by more than 1 °C since the 1850s, with 2024 recorded as the warmest year since global temperature records began [21]. Figure 1, developed from NOAA’s Global Time Series data, illustrates the global average surface temperature up to June 2025 [22]. As can be seen in Figure 1, the average annual temperature has been on a steady rise, accelerating significantly since 1970. However, in January 2025, previous temperature records were surpassed as 2.29 °C was reached [23].
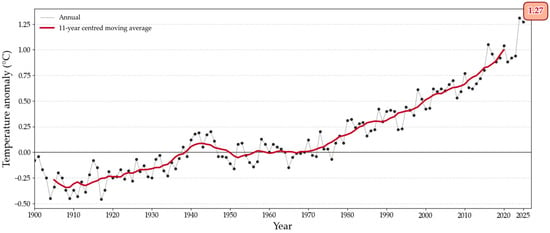
Figure 1.
Global surface (land and ocean) average temperatures anomalies. Source: based on NOAA’s Global Time Series data [22].
Higher temperatures are associated with changes in the water cycle driven to more frequent and extreme weather events, heatwaves, changes in precipitation patterns, floods and droughts, and hurricanes, which can lead to critical problems regarding the accessibility of quality water resources, among other impacts. Rising temperatures play a critical role in intensifying the hydrological cycle. As global mean temperature rises, the intensity of land–atmosphere feedback increases, driven by greater atmospheric water demand (AWD). With less frequent periods of precipitation and higher AWD, droughts are more probable [24]. Researchers have found a positive correlation between temperature and flood occurrence, which posits that higher temperatures enhance the atmosphere’s moisture-holding capacity, which increases the potential for more intense rainfall and, subsequently, a higher risk of floods. The Clausius–Clapeyron relation provides a scientific basis for this connection as it states that as the temperature rises, the atmosphere’s capacity to hold water vapour increases exponentially. This means that under warmer conditions, more moisture is available to fuel extreme precipitation events [25].
Assessing health risks from climate change is one of the priority research areas of the World Health Organization (WHO) [26]. These challenges have been studied by a lot of researchers establishing a direct relation between the surface temperature increase and climate change impacts, leading to critical issues regarding the accessibility and quality of water resources [24,25,27,28,29,30,31,32,33,34]. Figure 2 shows some of the main challenges that climate change leads to.
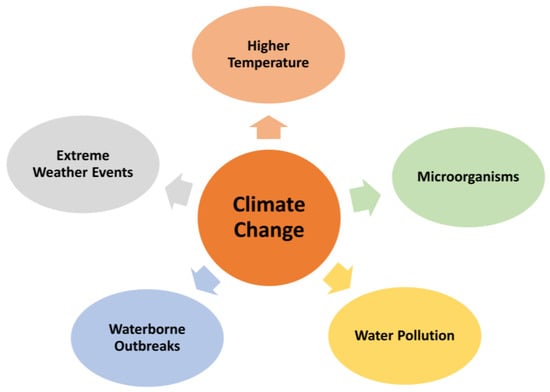
Figure 2.
Main challenges associated with climate change.
2. Materials and Methods
A bibliographic search was conducted to identify the relevant literature across multiple databases, including Web of Science (WoS), Scopus, ScienceDirect, and PubMed. Articles were retrieved using keywords such as “Climate Change”, “Earth surface temperature”, “Weather Events”, “Flooding”, “Droughts”, “Drinking Water”, “Microorganisms”, “Waterborne Diseases”, “Escherichia coli”, “Hepatitis”, “Legionella”, “Salmonella”, “Shigella”, “Vibrio”, “Campylobacter”, “Giardia”, “Cryptosporidium”, and “Water parasites”. These terms were applied individually or in Boolean combinations (AND, OR) to refine the search. Systematic studies can enhance their methodological rigour, enabling an assessment of the adequacy of the methods and, consequently, the reliability of the results [35].
The inclusion criteria selected were as follows: published between 2005 and 2025, due to an increase in extreme weather events in recent decades; written in English or Spanish; accessible in full-text format, to ensure the retrieval of all the relevant information in its proper context; focused on the pollution of water sources resulting from extreme weather events; microbiological development due to an increase in pollutants and nutrients in drinking water sources; reported on the effects of microorganisms in drinking water on human health.
Studies were excluded if they were published before 2005; written in a language different than English or Spanish; lacked full-text access; did not examine pollution of water sources linked with extreme weather events; and did not describe effects of microorganisms in drinking water on human health. The PRISMA flow diagram, Figure 3, facilitates the review methodology.
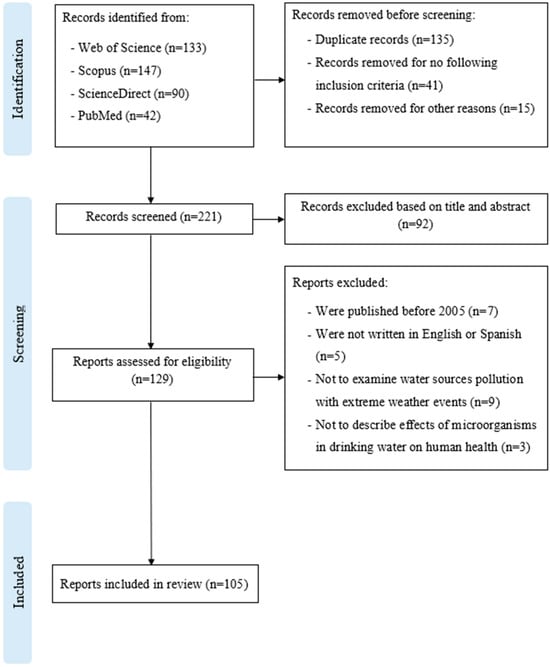
Figure 3.
PRISMA flowchart showing the process of the search, including and excluding criteria.
The historical databases (NOAA, ECDC) were examined in their entirety, without temporal restrictions, to understand the evolution of microbiological pollution in drinking water sources associated with changes in weather patterns driven by climate change.
3. Microbiological Risks in Water Sources Due to Extreme Weather Events
The increase in temperature leads to warm conditions, between 30 and 50 °C, that can promote the growth and metabolic activity of pathogen microorganisms in aquatic environments, so they proliferate faster, that is the case, for instance, of Escherichia coli or Legionella, two of the most frequent microorganisms found in both surface and groundwater. Because of that, the risk of contamination of drinking water sources grows exponentially, reflecting the direct link between microbial behaviour and environmental temperature.
It is important to note that the presence of bacteria in drinking water per se is not an issue, if no pathogenic organisms are present. There are bacteria in drinking water, even in relatively high number (103–106 cells/mL), without consequences on human health [36,37,38,39]. However, unwanted or excessive microorganism growth can cause deterioration of microbial water quality, leading to taste, odour, and safety concerns. This deterioration can occur both at the water source and within treated potable water supplies.
Periods of increasingly extreme precipitation, floods, and storms can contaminate drinking water sources with human and animal waste, agricultural soils, urban runoff, and poorly treated wastewater introducing pathogens into water supply systems. Excessive or heavy rainfall events can increase runoff of water from fields, transporting microorganisms into rivers, lakes, wells, and any flow of water [33,40]. In addition, extreme precipitation increases turbidity and total suspended solids (TSS) in water sources [41], which may present important challenges for water treatment facilities. After precipitation, some TSS carried by the runoff would absorb the microbiological contamination in water sources and deposit at the bottom of the source. That can lead to a high microbial concentration in water sources [42,43]. Research indicates that total coliforms and Escherichia coli exhibited the strongest adsorption with fine particles between 3.2 and 4.2 µm particles [42]. The association with small particles was due to their high number concentration and the effective surface area available for attachment [42].
Figure 4 illustrates that surface runoff generated by extreme precipitation constitutes one of the primary sources of exogenous pollution in water sources [33]. Such runoff can mobilise and transport a wide array of contaminants. These processes can be amplified by the hydrodynamic energy of extreme precipitation flows, which can resuspend sediments releasing previously deposited contaminants back into the water column. In addition, humidity can create favourable conditions for the proliferation of certain bacteria, which, in combination with pollutant influx and sediment disturbance, poses a significant challenge to water quality management, increasing the operational demands on water treatment facilities and the need of continuous monitoring of water requirements.
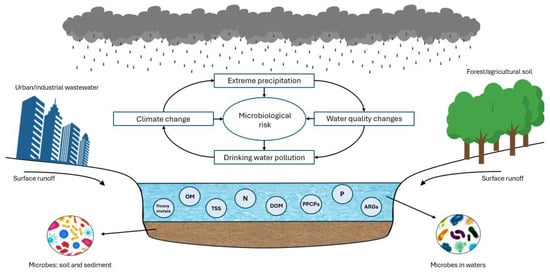
Figure 4.
Impacts of extreme precipitation on quality and microbiological risk of water sources. ARGs: antibiotic resistance genes; OM: organic matter; DOM: dissolved organic matter; TSS: total suspended solids; N: nitrogen compounds; P: phosphorus compounds; PPCPs: pharmaceutical and personal care products.
Heavy rain and flooding can lead to the overflow of sewage and wastewater systems, carrying ARGs from treatment plants and urban areas into natural bodies like rivers and streams [44]. Increased temperatures have been directly linked to higher rates of antibiotic resistance genes (ARGs). McFadden et al. found specifically that an increase in temperature of 10 °C correlated with increases in resistance of 4.2% for Escherichia coli, 2.2% for Klebsiella pneumoniae, and 2.7% for Staphylococcus aureus. Antibiotic resistance can spread by the horizontal transmission of specific genomic resistance mechanisms and the selection of resistant strains [45].
During drought conditions, many soil microorganisms experience cell rupture and death due to water scarcity, while others adapt by altering physiological functions. Adaptations may include modifying cell wall permeability and accumulating compatible solutes to retain intracellular water [33]. These drought-tolerant microbes often reduce metabolic activity during desiccation and resume growth once moisture levels are restored [46]. Such resilience suggests that certain microbes can maintain their viability throughout gradual declines in soil water content and can remain metabolically active even under prolonged periods of droughts.
In addition, droughts can lead to the concentration of nutrients (many of them proceeding from organic matter decomposition, such as ammonium, nitrate, nitrite, and phosphorus) and pathogens in water as the volume decreases. These nutrients can fuel the growth of microorganisms, leading to harmful algae blooms (HABs) that can produce toxins and bacteria [47,48,49,50]. Algae have different optimal growth temperature ranges, 30.6 ± 2.3 °C for Cyanobacteria, 25.7 ± 0.1 °C for green algae, and 24.0 ± 0.4 °C for diatoms [51]. Toxins are produced and stored inside the cyanobacteria cells. The release of these toxins into the water occurs when the cells die or are broken. This can lead to dangerously high concentrations of cyanotoxins in a water body. The retention of nutrients within a lake or reservoir can benefit HABs, especially when droughts follow periods of heavy rainfall [50]. HABs can cause the mortality of aquatic animals, plants, and even algae themselves, increasing the OM that consume dissolved oxygen driving to anoxic conditions. Additionally, OM can be used as a carbon source for microorganisms. The whole process can lead to an increase in microbial concentration, increasing the microbiological risks associated with drinking water sources [33]. Recent satellite-based analyses of nearly 2000 large lakes worldwide demonstrate that bloom frequency has risen by approximately 1.8% per year over the past two decades, with significant correlations observed between bloom occurrence and rising temperatures [52].
An insufficient supply of water may lead to lower hygienic standards [53], especially in developing countries. In addition, when microorganisms face droughts, they are thought to have two different responses, resistance and resilience [54], and because of that they become very challenging. Figure 5 presents a table that presents the interrelationships between key climate change events, their impact on aquatic resources, and their subsequent effects on water availability for supply.
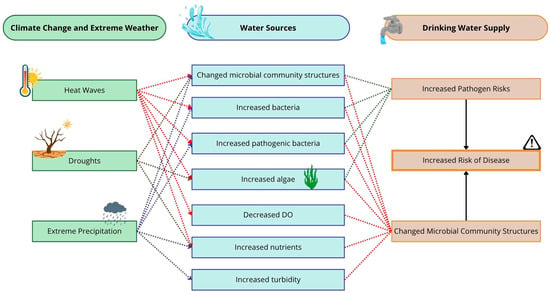
Figure 5.
Relationships between most common climate change events and final effects on drinking water supply. DO: dissolved oxygen.
4. Effects of Extreme Weather Events on Microbial Risks in Drinking Water Treatment and Distribution Systems
Extreme weather events can affect conventional treatment processes in drinking water treatment plants (DWTPs), including coagulation–sedimentation, filtration, and disinfection. These impacts arise primarily from alterations in source water quality, which becomes increasingly variable under extreme weather conditions (turbidity, TSS, OM, nutrients concentration, microorganisms, HABs, etc.). Increased turbidity and organic matter can reduce the efficiency of processes of coagulation–sedimentation and filtration, while higher nutrient levels may promote microbial regrowth in distribution systems. Likewise, elevated organic matter can react with disinfectants, lowering disinfection efficacy and increasing the formation of potentially harmful disinfection by-products. Together, these changes compromise treatment performance and can significantly elevate microbiological risks throughout drinking water systems. Figure 6 illustrates a schematic diagram of a drinking water treatment plant (DWTP).
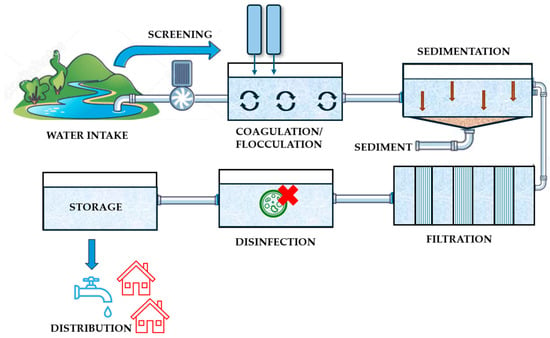
Figure 6.
Diagram of a drinking water treatment plant.
4.1. Coagulation-Flocculation-Sedimentation
Dissolved organic matter (DOM) presents a persistent challenge for drinking water treatment plants (DWTPs) as it is observed in undesirable colour, taste, and odour. DWTPs need to improve the removal of pollutants, enhancing the processes of coagulation, flocculation, and sedimentation [55]. The primary methods to improve the efficiency of coagulation, flocculation, and sedimentation include adjusting the water pH, selecting appropriate coagulants according to water nature and characteristics, optimising the dosages, increasing mixing speed and intensity according to jar-tests experiments, and extending sedimentation time.
Floods and extreme precipitation can rapidly alter water source quality, and the objective in these situations is to improve TSS and turbidity removal efficiency, using in any type of organic or inorganic coagulants.
4.2. Filtration
Heat waves and droughts can reduce the effectiveness of the coagulation and sedimentation processes in removing microorganisms, hydrophilic dissolved organic matter, and inorganic nutrients. If the previous processes cannot be kept under control after extreme precipitation with sudden increases in TSS, pollutants, and microbes, filtration may become overloaded [56]. Under these conditions, filters need more frequent backwashing to prevent microbial breakthrough, but intensified backwashing can disrupt microbial communities and increase biofilm detachment risk [57]. The main types of filters used are rapid sand filters that consist of a bed of sand through which water flows quickly, slow sand filters that operate at lower flow rates, allowing the development of a biologically active layer, and membrane filters that use semi-permeable membranes that block physically particles, bacteria, and viruses. These last ones are based on microfiltration or ultrafiltration and, although they are very efficient, they are also very expensive.
This step is essential for ensuring drinking water clarity and microbiological safety before disinfection and distribution.
4.3. Disinfection
This is a critical step in DWTPs that ensures microbiological safety by removing or inactivating pathogenic microorganisms [58]. Conventional disinfection methods include radiation (UV), chlorination, filtration, chlorine dioxide, peracetic acid (PAA), and ozonation. However, these technologies present problems such as reduced efficiency or the formation of potentially harmful disinfection by-products (DBPs) such as trihalomethanes (THMs) which are strictly regulated.
The impact of heat waves on disinfectant decay is substantial. Inlet water temperatures ranging from 10.0 °C to 30.0 °C resulted in chlorine decay rates of 38.0% to 75.0%. At an inlet water temperature of 20.0 °C, chlorine decay varied between 50.5% and 56.5% when the temperature in the disinfection tank was adjusted from 17.0 °C to 22.5 °C [33,59].
Despite its many advantages, such as reducing DBPs concentration and active microbes in the effluent water [60], when turbidity and DOM are high, UV treatment can have negative effects as it can modify its molecular structure into low molecular weight fractions more easily metabolised by bacteria stimulating microbial regrowth and biofilm formation [61,62]. To prevent regrowth, UV treatment is often followed by sequential chemical disinfection (chlorine) to provide a residual disinfectant barrier.
Assessing and controlling protozoa such as Cryptosporidium and Giardia is a critical challenge in DWTPs as they exhibit high resistance to conventional disinfection processes. Ultrafiltration or nanofiltration have demonstrated superior efficacy against chlorine-resistant protozoa.
4.4. Drinking Water Distribution Systems (DWDSs)
DWDSs are the final step in the supply of drinking water consumers and temperature is a crucial factor as it influences the absorption of disinfectants, the rate at which, for example, chlorine, the most usual disinfectant used, decays. It also affects the growth of biofilms, which can act as reservoirs of opportunistic pathogens that may then release into drinking water [63,64]. During heat waves the temperature of pipe network increases and this promotes the microbial use of the OM still present in water and the growth of pathogens that have nutrients on demand. The World Health Organization (WHO) guidelines recommend a maximum temperature limit of 25 °C at the tap [11]. The virulence of different microorganisms is known to be highly influenced by temperature; however, there is little legislation found to this effect. Directive (EU) 2020/2184 of the European Union on the quality of water for human consumption does not establish a temperature limit value for water at the consumer’s tap.
5. Main Microorganisms in Drinking Water and Diseases They Lead to
The pathogens that may be transmitted through contaminated drinking water are diverse in characteristics, behaviour, and resistance. Although their mere presence is a cause of concern, their impact on human health is directly affected by its optimal virulence temperature and only some strains may contribute to the development of disease [65]. The main microorganisms identified in drinking water include bacteria such as Salmonella, Shigella, Escherichia coli (E. coli), Vibrio cholerae, Giardia, Pseudomonas, Legionella spp., Cryptosporidium, Clostridium perfringens, Aeromonas, and Campylobacter [11,12,66,67,68,69]. The presence of viruses such as adenovirus, hepatitis A and E, and norovirus has also been frequently detected in drinking water sources, as well as several types of parasites. All of them have developed strategies to survive under challenging conditions and arrive at the consumer’s tap. Microbial cells can aggregate forming biofilms, creating a protective environment against disinfectants, predation from protozoa that feed on bacteria, or environmental fluctuations such as changes in pH and salinity. Some bacteria like Clostridium can form spores, and other pathogens like protozoa Giardia or Cryptosporidium form cysts, which protect them from disinfectants and adverse conditions. Other microorganisms can survive inside protozoa (amoebae) that ingest them but do not digest them, providing a protective environment and a nutrient source.
Although consumption of contaminated drinking water represents the greatest risks, other routes of transmission can also lead to disease. Certain serious illnesses result from inhalation of water droplets (aerosols) in which the causative organisms have multiplied because of warm waters and the presence of nutrients, induced by the effects of climate change. Some parasites are transmitted when the larval stage penetrates the skin, causing diseases that can lead to severe gastrointestinal illness [11]. In addition, contact with toxins from cyanobacteria, algae, and some bacteria can be harmful to humans when drinking contaminated water. These pathogens can cause injuries and symptoms like allergies and severe liver and kidney damage, neurological disorders, and cancer [70,71,72].
Temperature is known to play a very important role in Legionella growth and virulence, with an optimal range of 35 °C to 42 °C. At this temperature, Legionella seems to express the most virulence factors that can infect immunosuppressed host, especially at 37 °C (human body temperature). Below 20 °C, Legionella does not multiply but it can still survive for long periods and become active again if temperature increases. Above 50 °C, the bacteria begin to die off and at 70 °C total disinfection occurs [11,73]. Bacteria can survive and grow as parasites within free-living protozoa and within biofilms which develop in water systems [73].
However, other pathogens are host dependent, such as Cryptosporidium, and can persist although gradually lose viability and the ability to infect [74]. That is also the case of the protozoa Giardia, which can survive for months to more than one year in cool water (approximately 5 °C or less) [49,75]. Nevertheless, Giardia cysts gradually lose viability when the temperature rises, while some studies found that at 21 °C they were viable for 5 to 24 days, while those at 37 °C never survived for more than 4 days [76]. Persistence of many microorganisms is affected by several factors with temperature being one of the most important and which may be mediated by the lethal effects of ultraviolet (UV) radiation in sunlight acting especially near the water surface [11].
Between the contaminants that can be found in drinking water, pathogenic microorganisms from human and animal faeces pose the greatest danger to public health. Escherichia coli, thermotolerant coliform bacteria (44–45 °C), is the most widely used indicator of faecal contamination in drinking water supplies but does not usually multiply in drinking water [77]. Nevertheless, selection reference pathogens can be subjected to differences in criteria. The presence of Escherichia coli in a DWDS can indicate a recent faecal contamination and its presence may be reliable indicator for Salmonella spp. and Shigella spp. [11]. Both, Salmonella and Shigella have a short persistence in water supplies, although their health significance is high [11]. Their virulence in optimal temperature is 37 °C (host’s body temperature), decreasing significantly below 10 °C and above 70 °C. Vibrio are bacteria that live in relatively warm and low-salinity marine environments [78] whose temperature of greatest virulence is 37 °C, and prevalence decreases as water temperatures fall below 20 °C [11,79].
Table 1 highlights some of the most common microorganisms found in drinking water supplies, the source of pollution, their route of infection, and their adverse effects on human health.

Table 1.
Most common microorganisms associated with drinking water.
6. Incidence of Waterborne Diseases in Europe Associated with Drinking Water
It is a fact that many disease outbreaks resulting from drinking water pathogens occur after periods of flooding [82,89,90,91,92]. An example is the significant presence of microorganisms, including bacteria, fungi, and parasites, identified in drinking water after the devasting floods in October 2024 in the Valencian Community (Spain) [93].
The European Union (EU) has established regulations to ensure the quality and safety of drinking water. The recast of the Drinking Water Directive (DWD) was adopted in December 2020 and entered into force in January 2021. The Member States must transpose the Directive into national law and comply with its provision by 12 January 2023 and report all the information required in the DWD to the European Centre for Disease and Control (ECDC) [94].
In the data series reported by European countries, a growing trend is observed for many of the microorganisms studied, which is not solely due to an increase in microorganisms in water sources of drinking water but also to a specialisation in identification techniques using PCR (polymerase chain reaction). However, the PCR methods have the advantages of being quick and specific but cannot determine the viability of the organisms detected [95], that can lead to a health alert, even after an adequate disinfection of potable distribution systems and conventional culture methods that evaluate the viability of microorganisms.
The ECDC supplies current data on outbreaks, which are regularly reported, highlighting the significant need of proper hygiene control in drinking water distribution systems. Based on these dates, some of the most significative waterborne diseases are described in the graphs below.
One of the most recently reported outbreaks linked to drinking water supply systems was Legionnaire’s disease in Italy (Lombardy Region) with 49 confirmed cases, including three deaths, in summer 2024 [96]. Figure 7 displays the incidence of Legionnaires’ disease in Europe since 2005, with Italy, France, Germany, and Spain being the most affected countries [97]. These countries experience high summer temperatures, often between 35 and 40 °C, which falls within the optimal growth range for Legionella bacteria. Indeed, the 1976 Philadelphia outbreak, which gave the disease its name, occurred during a heatwave. This increase in temperature can lead to droughts and water stagnation in supply pipes, the establishment of biofilms, and the proliferation of the bacteria, which then disseminates as aerosol droplets through cooling systems or potable water supplies. The persistence of Legionella in drinking water, despite disinfections, is due to its ability to find favourable growth conditions and this is reflected in the increasing trend of detected cases in Europe and all around the world.
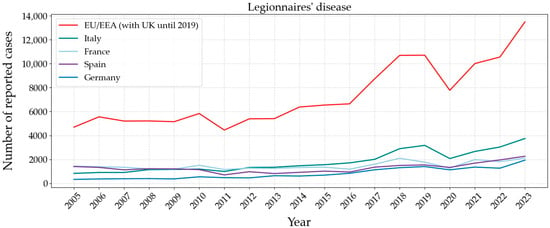
Figure 7.
Number of reported cases between 2005 and 2023 in Europe of Legionnaire’s disease caused by bacteria Legionella spp. Graph based on data provided by the ECDC [97].
Figure 8 shows the evolution of Cryptosporidiosis in Europe. The United Kingdom, Germany, Belgium, and Spain are the countries with a higher number of reported cases. The available information from investigations indicates that one of the causes may be climatic drivers, such as the increased rainfall in the summer of 2012 in the United Kingdom and Germany [98]. A peak is shown in 2019 in Italy, where an outbreak of cryptosporidiosis occurred in August, in a small town in North-eastern Italy. The origin was an insufficient disinfection treatment of the water supply, spring water, that highlighted the vulnerability of small water supplies [90].
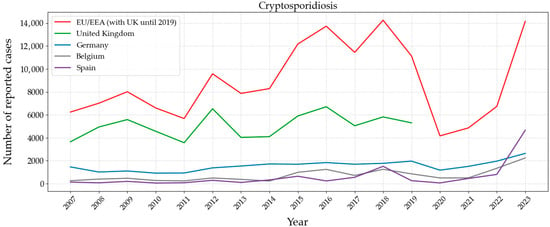
Figure 8.
Number of reported cases between 2007 and 2023 in Europe of Cryptosporidiosis caused by parasitic protist Cryptosporidium. Graph based on data provided by the ECDC [99].
Cholera is not a common problem in Europe due to high standards of hygiene, al-though the infection may spread by ingestion of contaminated water. Evolution of the disease in Europe is shown in Figure 9. The highest incidence was observed in the United Kingdom, according to ECDC statistical data up to 2019. Sweden, France, and Germany reported in 2022 less than ten cases, but it was not possible to identify the source of the bacteria. However, in other countries such as Angola, Sudan, Mozambique, Ethiopia, and Zimbabwe, there is a very important impact, mainly due to the poor hygienic conditions in the drinking water supply [100].
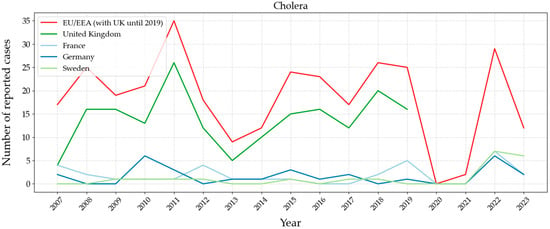
Figure 9.
Number of reported cases between 2007 and 2023 in Europe of cholera caused by bacteria Vibrio cholerae. Graph based on data provided by the ECDC [101].
One of the routes of transmission of hepatitis A is through drinking water. Many cases of this disease, which has a high immunisation rate, were reported in 2017. As it is shown in Figure 10, Spain and Romania were the most affected countries. Although in Romania the lack of hygienic conditions in water supply seemed to be an important driver, that was not the case in Spain. Subsequently, there was a decreased incidence rate, possibly due to the general acquired immunity and the improvement of health regulations because of the pandemic in 2020–2021.
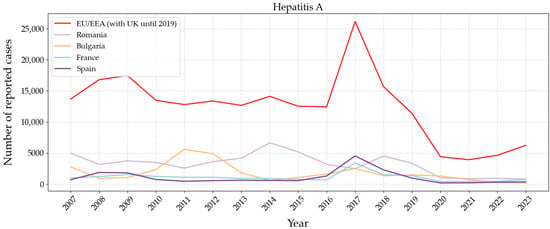
Figure 10.
Number of reported cases between 2007 and 2023 in Europe of hepatitis A caused by virus Hepatitis A. Graph based on data provided by the ECDC [102].
In 2020 there was a drastic decrease in the number of reported cases in all the microorganisms studied that is attributed to the COVID-19 pandemic that reduced human exposure and increased hygienic protocols and regulations, especially in water supplies. Networks should be managed to avoid the presence of pathogens to the consumer’s tap [87].
7. Conclusions
Microbial contamination of drinking water is one of the most significant threats in both developed and developing countries. Water pollution arises not only from anthropogenic activities but also from the increasing frequency of extreme weather events driven by climate change. Industrial effluents, intensive farming, and agricultural activities, in combination with runoff due to heavy precipitations, release contaminants into surface and groundwater. Droughts can concentrate pathogens and nutrients and create the optimal conditions for microorganisms’ growth. At the same time, the increment of temperatures induces conditions that can promote the survival, resilience, and spread of these microorganisms. The challenge for controlling waterborne pathogens is not just providing adequate treatment of the source water but managing and maintaining the water network all the way to the consumer’s tap. There is evidence that, if there are not adequate disinfection protocols, contaminated water sources can lead to outbreaks that must be effectively managed by healthy authorities. The outbreaks studied by the ECDC confirm that there is a strong correlation between extreme weather events and outbreaks. Identifying the pathogen and determining the origin of the contamination is essential to face the control of the outbreak.
Regulations are aimed to control the drinking water supplies as well as all the factors that may influence the quality of the drinking water, from the source to the consumer, and establish the protocols to face possible health problems.
Author Contributions
Conceptualization, A.P.-G., J.N.-P., and M.B.A.-C.; methodology, A.P.-G., J.N.-P., and M.B.A.-C.; software, T.R.-E. and V.S.-S.; validation, A.P.-G., M.M.J., and V.S.-S.; formal analysis, A.P.-G. and J.N.-P.; investigation, A.P.-G., M.B.A.-C., and T.R.-E.; resources, A.P.-G., M.B.A.-C., and V.S.-S.; data curation, A.P.-G., M.B.A.-C., I.G.L., and T.R.-E.; writing—original draft preparation, A.P.-G., J.N.-P., and M.B.A.-C.; writing—review and editing, A.P.-G., A.A.Z., I.G.L., and M.M.J.; visualisation, A.P.-G. and A.A.Z.; supervision, I.G.L. and J.N.-P.; project administration, A.P.-G. All authors have read and agreed to the published version of the manuscript.
Funding
Research supported with the own financial support of the institution, no external funding.
Data Availability Statement
All data are available in the citations mentioned, in the text, and in the tables. For more details, contact the corresponding author.
Conflicts of Interest
The authors declare no conflicts of interest.
Abbreviations
The following abbreviations are used in this manuscript:
| ECDC | European Centre for Disease Prevention and Control Digital Publishing Institute |
| SDG | Sustainable Development Goals |
| NOAA | National Oceanic and Atmospheric Administration |
| AWD | Atmospheric water demand |
| WHO | World Health Organization |
| WoS | Web of Science |
| TSS | Total Suspended Solids |
| ARGs | Antibiotic Resistance Genes |
| OM | Organic Matter |
| DOM | Dissolved Organic Matter |
| PPCPs | Pharmaceutical and Personal Care Products |
| HABs | Harmful Algae Blooms |
| DO | Dissolved Oxygen |
| DWTPs | Drinking Water Treatment Plants |
| UV | Ultraviolet |
| PAA | Peracetic Acid |
| DBPs | Disinfection By-products |
| THMs | Trihalomethanes |
| DWDS | Drinking Water Distribution System |
| EU | European Union |
| PCR | Polymerase Chain Reaction |
References
- United Nations. Goal 6: Ensure Access to Water and Sanitation for All. Available online: https://www.un.org/sustainabledevelopment/water-and-sanitation/ (accessed on 17 October 2024).
- United Nations Economic Commission for Europe. Equitable Access to Water and Sanitation. Available online: https://unece.org/environment-policy/water/areas-work-protocol/equitable-access-water-and-sanitation (accessed on 17 October 2024).
- Bruno, A.; Agostinetto, G.; Fumagalli, S.; Ghisleni, G.; Sandionigi, A. It’s a Long Way to the Tap: Microbiome and DNA-Based Omics at the Core of Drinking Water Quality. Int. J. Environ. Res. Public Health 2022, 19, 7940. [Google Scholar] [CrossRef]
- Sidibe, I.; Coulibaly, T.; Togola, A.; Keita, M.; Guindo, M.; Kassambara, M. Assessment of Drinking Water Quality in Peri-urban Areas of Bamako City, Mali. E3S Web Conf. 2024, 537, 03004. [Google Scholar] [CrossRef]
- Lakhani, S.; Shah, N.V.; Bhalodia, N. Microbial Quality of Water Used as Drinking Sources in Urban and Rural Households of Gujarat, India: A Cross-Sectional Study. Int. J. Health Sci. Res. 2024, 14, 309–320. [Google Scholar] [CrossRef]
- Nyika, J.M.; Dinka, M.O. A Scientometric Study on Quantitative Microbial Risk Assessment in Water Quality Analysis Across 6 Years (2016–2021). J. Water Health 2022, 20, 329–343. [Google Scholar] [CrossRef]
- Douterelo, I.; Sharpe, R.; Husband, S.; Fish, K.E.; Boxall, J. Understanding Microbial Ecology to Improve Management of Drinking Water Distribution Systems. Wiley Interdiscip. Rev. Water 2019, 6, e1325. [Google Scholar] [CrossRef]
- Simazaki, D.; Hirose, M.; Hashimoto, H.; Yamanaka, S.; Takamura, M.; Watanabe, J.; Akiba, M. Occurrence and Fate of Endotoxin Activity at Drinking Water Purification Plants and Healthcare Facilities in Japan. Water Res. 2018, 145, 1–11. [Google Scholar] [CrossRef] [PubMed]
- Rossi, F.; Santonicola, S.; Amadoro, C.; Marino, L.; Colavita, G. Food and Drinking Water as Sources of Pathogenic Protozoans: An Update. Appl. Sci. 2024, 14, 5339. [Google Scholar] [CrossRef]
- Omarova, A.; Tussupova, K.; Berndtsson, R.; Kalishev, M.; Sharapatova, K. Protozoan Parasites in Drinking Water: A System Approach for Improved Water, Sanitation and Hygiene in Developing Countries. Int. J. Environ. Res. Public Health 2018, 15, 495. [Google Scholar] [CrossRef] [PubMed]
- World Health Organization. Guidelines for Drinking-Water Quality, 4th ed.; World Health Organization: Geneva, Switzerland, 2022; Available online: https://iris.who.int/bitstream/handle/10665/352532/9789240045064-eng.pdf (accessed on 11 June 2025).
- Rani, D.; Rana, V.; Rani, A.; Malyan, S.K.; Kumar, A.; Dhaka, R.K.; Rana, A. Microbial Contamination in Municipal Water: Potential Sources, Analytical Methods and Remediation Strategies. In Algae Based Bioelectrochemical Systems for Carbon Secuestration, Carbon Storage, Bioremediation and Bioproduct Generation, 1st ed.; Mahapatra, D.M., Kumar, S.S., Singh, L., Eds.; Academic Press: Cambridge, MA, USA, 2024; Volume 3, pp. 125–141. [Google Scholar] [CrossRef]
- Rodgers, M.; Boczek, L. Microbes and Water Quality in Developed Countries. In Encyclopedia of Environmental Health; Nriagu, J.O., Ed.; Elsevier: Amsterdam, The Netherlands, 2011; pp. 749–756. ISBN 9780444522726. [Google Scholar] [CrossRef]
- Levallois, P.; Villanueva, C.M. Drinking Water Quality and Human Health: An Editorial. Int. J. Environ. Res. Public Health 2019, 16, 631. [Google Scholar] [CrossRef]
- Islam, M.M.M. Quantifying Microbial Risk from Drinking Water Production Process under Changing Climate and Socio-Economic Conditions. Microb. Risk Anal. 2024, 27–28, 100321. [Google Scholar] [CrossRef]
- Freeman, J.T.; Anderson, D.J.; Sexton, D.J. Seasonal Peaks in Escherichia coli Infections: Possible Explanations and Implications. Clin. Microbiol. Infect. 2009, 15, 951–953. [Google Scholar] [CrossRef]
- Hofstra, N. Quantifying the Impact of Climate Change on Enteric Waterborne Pathogen Concentrations in Surface Water. Curr. Open Environ. Sustain. 2011, 3, 471–479. [Google Scholar] [CrossRef]
- Mohammed, H.; Seidu, R. Climate-Driven QMRA Model for Selected Water Supply Systems in Norway Accounting for Raw Water Sources and Treatment Processes. Sci. Total Environ. 2019, 660, 306–320. [Google Scholar] [CrossRef]
- Funari, E.; Manganelli, M.; Sinisi, L. Impact of Climate Change on Waterborne Diseases. Ann. Ist. Super. Sanita 2012, 48, 473–487. [Google Scholar] [CrossRef]
- De los Ríos, M.A. Los Microorganismos son los Grandes Olvidados en los Modelos de Cambio Climático. 2022. Available online: https://www.csic.es/es/actualidad-del-csic/los-microorganismos-son-los-grandes-olvidados-en-los-modelos-de-cambio-climatico (accessed on 19 June 2025).
- NOAA. Climate Change: Global Temperature. Available online: https://www.climate.gov/news-features/understanding-climate/climate-change-global-temperature (accessed on 11 June 2025).
- NOAA. Climate at a Glance: Global Time Series. Available online: https://www.ncei.noaa.gov/access/monitoring/climate-at-a-glance/global/time-series/globe/tavg/land_ocean/12/5/1900-2025 (accessed on 19 June 2025).
- NOAA. Climate at a Glance: Haywood. Available online: https://www.ncei.noaa.gov/access/monitoring/climate-at-a-glance/global/haywood (accessed on 11 August 2025).
- Parvaze, S.; Kumar, R.; Khan, J.N.; Parvaze, S. Climate Change, Drought, and Water Resources. In Book Integrated Drought Management, 1st ed.; Singh, V.P., Jhajharia, D., Mirabbasi, R., Kumar, R., Eds.; Taylor and Francis Group: Boca Raton, FL, USA, 2023; Volume 1. [Google Scholar] [CrossRef]
- Alobid, M.; Chellai, F.; Szűcs, I. Trends and Drivers of Flood Occurrence in Germany: A Time Series Analysis of Temperature, Precipitation, and River Discharge. Water 2024, 16, 2589. [Google Scholar] [CrossRef]
- World Health Organization. Climate Change. 2013. Available online: https://www.who.int/news-room/fact-sheets/detail/climate-change-and-health (accessed on 17 October 2024).
- Korkmaz, M. Impacts of Climate Change: Examining Precipitation, Temperature Anomalies, and Effects on Water Resources in Turkey. J. Anatol. Environ. Anim. Sci. 2024, 9, 558–569. [Google Scholar] [CrossRef]
- Dowlati, M.; Seyedin, H.; Behnami, A.; Marzban, A.; Gholami, M. Water Resources Resilience Model in Climate Changes with Community Health Approach: Qualitative Study. Case Stud. Chem. Environ. Eng. 2023, 8, 100521. [Google Scholar] [CrossRef]
- Wang, D.; Chen, Y.; Jarin, M.; Xie, X. Increasingly Frequent Extreme Weather Events Urge the Development of Point-of-Use Water Treatment Systems. npj Clean Water 2022, 5, 36. [Google Scholar] [CrossRef]
- Chand, M.B.; Bhattarai, B.C.; Pradhananga, N.S.; Baral, P. Trend Analysis of Temperature Data for the Narayani River Basin, Nepal. Sci 2021, 3, 1. [Google Scholar] [CrossRef]
- Myhre, G.; Alterskjær, K.; Stjern, C.W.; Hodnebrog, O.; Marelle, L.; Samser, B.H.; Sillmann, J.; Schaller, N.; Fisher, E.; Schulz, M.; et al. Frequency of Extreme Precipitation Increases Extensively with Event Rareness under Global Warming. Sci. Rep. 2019, 9, 16063. [Google Scholar] [CrossRef]
- Li, J.; Thompson, D.W.J. Widespread Changes in Surface Temperature Persistence under Climate Change. Nature 2021, 599, 425–430. [Google Scholar] [CrossRef]
- Xiao, X.; Fu, J.; Yu, X. Impact of Extreme Weather on Microbiological Risk of Drinking Water in Coastal Cities: A Review. Curr. Pollut. Rep. 2023, 9, 259–271. [Google Scholar] [CrossRef]
- Konapala, G.; Mishra, A.K.; Wada, Y.; Mann, M.E. Climate Change will Affect Global Water Availability through Compounding Changes in Seasonal Precipitation and Evaporation. Nat. Commun. 2020, 11, 3044. [Google Scholar] [CrossRef]
- Page, M.J.; McKenzie, J.E.; Bossuyt, P.M.; Boutron, I.; Hoffmann, T.C.; Mulrow, C.D.; Shamseer, L.; Tetzlaff, J.M.; Akl, E.A.; Brennan, S.E.; et al. Updating guidance for reporting systematic reviews: Development of the PRISMA 2020 statement. J. Clin. Epidemiol. 2021, 134, 103–112. [Google Scholar] [CrossRef]
- Prest, E.I.; Hammes, F.; van Loosdrecht, M.C.M.; Vrouwenvelder, J.S. Biological Stability of Drinking Water: Controlling Factors, Methods, and Challenges. Front. Microbiol. 2016, 7, 45. [Google Scholar] [CrossRef]
- Hoefel, D.; Monis, P.T.; Grooby, W.L.; Andrews, S.; Saint, C.P. Profiling Bacterial Survival through a Water Treatment Process and Subsequent Distribution System. J. Appl. Microbiol. 2005, 99, 175–186. [Google Scholar] [CrossRef]
- Hammes, F.; Berney, M.; Wang, Y.; Vital, M.; Koster, O.; Egli, T. Flow-Cytometric Total Bacterial Cell Counts as a Descriptive Microbiological Parameter for Drinking Water Treatment Processes. Water Res. 2008, 42, 269–277. [Google Scholar] [CrossRef] [PubMed]
- Vital, M.; Dignum, M.; Magic-Knezev, A.; Ross, P.; Rietveld, L.; Hammes, F. Flow Cytometry and Adenosine Tri-Phosphate Analysis: Alternative Possibilities to Evaluate Major Bacteriological Changes in Drinking Water Treatment and Distribution Systems. Water Res. 2012, 46, 4665–4676. [Google Scholar] [CrossRef] [PubMed]
- Cann, K.F.; Thomas, D.R.; Salmon, R.L.; Wyn-Jones, A.P.; Kay, D. Extreme Water-Related Weather Events and Waterborne Disease. Epidemiol. Infect. 2013, 141, 671–686. [Google Scholar] [CrossRef]
- Tornevi, A.; Bergstedt, O.; Forsberg, B. Precipitation Effects on Microbial Pollution in a River: Lag Structures and seasonal Effect Modification. PLoS ONE 2014, 9, e98546. [Google Scholar] [CrossRef] [PubMed]
- Hipsey, M.R.; Brookes, J.D.; Regel, R.H.; Antenucci, J.P.; Burch, M.D. In Situ Evidence for the Association of Total Coliforms and Escherichia coli with Suspended Inorganic Particles in an Australian Reservoir. Water Air Soil Pollut. 2006, 170, 191–209. [Google Scholar] [CrossRef]
- Liao, C.; Liang, X.; Soupir, M.L.; Jarboe, L.R. Cellular, Particle and Environmental Parameters Influencing Attachment in Surface Waters: A Review. J. Appl. Microbiol. 2015, 119, 315–330. [Google Scholar] [CrossRef]
- Bagra, K.; Kneis, D.; Padfield, D.; Szekeres, E.; Teban-Man, A.; Coman, C.; Singh, G.; Berendonk, T.U.; Klümper, U. Contrary effects of increasing temperatures on the spread of antimicrobial resistance in river biofilms. Environ. Microbiol. 2024, 9, e00573-23. [Google Scholar] [CrossRef]
- MacFadden, D.R.; McGough, S.F.; Fisman, D.; Santillana, M.; Brownstein, J.S. Antibiotic Resistance Increases with Local Temperature. Nat. Clim. Change 2018, 8, 510–514. [Google Scholar] [CrossRef]
- Meisner, A.; Leizeaga, A.; Rousk, J.; Bååth, E. Partial drying accelerates bacterial growth recovery to rewetting. Soil. Biol. Biochem. 2017, 112, 269–273. [Google Scholar] [CrossRef]
- United States Environmental Protection Agency (EPA). Harmful Algal Blooms (HABs) in Water Bodies. Available online: https://www.epa.gov/habs (accessed on 22 June 2025).
- Mosley, L.M. Drought Impacts on the Water Quality of Freshwater Systems; Review and Integration. Earth-Sci. Rev. 2015, 140, 203–2014. [Google Scholar] [CrossRef]
- Coffey, R.; Paul, M.J.; Stamp, J.; Hamilton, A.; Johnson, T. A Review of Water Quality Responses to Air Temperature and Precipitation Changes 2: Nutrients, Algal Blooms, Sediment, Pathogens. J. Am. Water Res. Assoc. 2019, 55, 844–868. [Google Scholar] [CrossRef]
- Wiley, D.Y.; McPherson, R.A. The Role of Climate Change in the Proliferation of Freshwater Harmful Algal Blooms in Inland Water Bodies of the United States. Earth Interact 2024, 28, e230008. [Google Scholar] [CrossRef]
- Nalley, J.O.; O’Donnell, D.R.; Litchman, E. Temperature Effects on Growth Rates and Fatty Acid Content in Freshwater Algae and Cyanobacteria. Algal. Res. 2018, 35, 500–507. [Google Scholar] [CrossRef]
- Wang, Y.; Zhao, D.; Woolway, R.I.; Yan, H.; Paerl, H.W.; Zheng, Y.; Zheng, C.; Feng, L. Global Elevation of Algal Bloom Frequency in Large L and akes over the Past Two Decades. Natl. Sci. Rev. 2025, 12, nwaf011. [Google Scholar] [CrossRef]
- Bryan, K.; Ward, S.; Roberts, L.; White, M.P.; Landeg, O.; Taylor, T.; McEwen, L. The Health and Well-Being Effects of Drought: Assessing Multi-Stakeholder Perspectives through Narratives from the UK. Clim. Change 2020, 163, 2073–2095. [Google Scholar] [CrossRef]
- Winterfeldt, S.; Cruz-Paredes, C.; Rousk, J.; Leizeaga, A. Microbial Resistance and Resilience to Drought across a European Climate Gradient. In Proceedings of the EGU General Assembly, Vienna, Austria, 14–19 April 2024. [Google Scholar] [CrossRef]
- Sillanpää, M.; Ncibi, M.C.; Matilainen, A.; Vepsäläinen, M. Removal of Natural Organic Matter in Drinking Water Treatment by Coagulation: A Comprehensive Review. Chemosphere 2018, 190, 54–71. [Google Scholar] [CrossRef] [PubMed]
- Levine, A.D.; Yang, Y.J.; Goodrich, J.A. Enhancing Climate Adaptation Capacity for Drinking Water Treatment Facilities. J. Water Clim. Change 2016, 7, 485–497. [Google Scholar] [CrossRef]
- Gerrity, D.; Arnold, M.; Dickenson, E.; Moser, D.; Sackett, J.D.; Wert, E.C. Microbial Community Characterization of Ozone-Biofiltration Systems in Drinking Water and Potable Reuse Applications. Water Res. 2018, 135, 2017–2219. [Google Scholar] [CrossRef] [PubMed]
- Lutukurthi, D.N.V.V.K.; Dutta, S. Chapter 12—Recent Advances on the Technologies for the Disinfection of Drinking Water. In Advances in Drinking Water Purification. Small Systems and Emerging Issues; Bandyopadhyay, S., Ed.; Elsevier: Amsterdam, The Netherlands, 2024; pp. 271–293. [Google Scholar] [CrossRef]
- Goodarzi, D.; Abolfathi, S.; Borzooei, S. Modelling Solute Transport in Water Disinfection Systems: Effects of Temperature Gradient on the Hydraulic and Disinfection Efficiency of Serpentine Chlorine Contact Tanks. J. Water Process Eng. 2020, 37, 101411. [Google Scholar] [CrossRef]
- Ao, X.; Chen, Z.; Li, S.; Lu, Z.; Sun, W. The Impact of UV Treatment on Microbial Control and DBPs Formation in Full-Scale Drinking Water Systems in Northern China. J. Environ. Sci. 2020, 87, 398–410. [Google Scholar] [CrossRef] [PubMed]
- Buchanan, W.; Roddick, F.; Porter, N.; Drikas, M. Fractionation of UV and VUV Pretreated Natural Organic Matter from Drinking Water. Environ. Sci. Technol. 2005, 39, 4647–4654. [Google Scholar] [CrossRef]
- Goslan, E.H.; Gurses, F.; Banks, J.; Parsons, S.A. An Investigation into Reservoir NOM Reduction by UV Photolysis and Advanced Oxidation Processes. Chemosphere 2006, 65, 1113–1119. [Google Scholar] [CrossRef] [PubMed]
- Agudelo-Vera, C.; Avvedimento, S.; Boxall, J.; Creaco, E.; de Kater, H.; Di Nardo, A.; Djukic, A.; Douterelo, I.; Fish, K.E.; Iglesias Rey, P.L.; et al. Drinking Water Temperature around the Globe: Understanding, Policies, Challenges and Opportunities. Water 2020, 12, 1049. [Google Scholar] [CrossRef]
- van der Wielen, P.W.J.J.; Dignum, M.; Donocik, A.; Prest, E.I. Influence of Temperature on Growth of Four Different Opportunistic Pathogens in Drinking Water Biofilms. Microorganisms 2023, 11, 1574. [Google Scholar] [CrossRef]
- Lam, O.; Wheeler, J.; Tang, C.M. Thermal Control of Virulence Factors in Bacteria: A Hot Topic. Virulence 2014, 5, 852–862. [Google Scholar] [CrossRef]
- Batool, A.; Shafqat, M.; Kazmi, S.S.; Imad, S.; Ghufran, M.A.; Samad, N. Drinking Water Quality, Water Distribution Systems and Human Health: A Microbial Evaluation of Drinking Water Sources in Salt Range. Int. J. Hydrog. 2018, 5, 542–547. [Google Scholar] [CrossRef][Green Version]
- Yates, M.V. Drinking Water Microbiology. In Encyclopedia of Microbiology, 4th ed.; Schmidt, T.M., Ed.; Academic Press: Cambridge, MA, USA, 2019; pp. 83–89. [Google Scholar] [CrossRef]
- Atnafu, B.; Desta, A.; Assefa, F. Microbial Community Structure and Diversity in Drinking Water Supply, Distribution Systems as well as Household Point of Use Sites in Addis Ababa City, Ethiopia. Microb. Ecol. 2022, 84, 73–89. [Google Scholar] [CrossRef] [PubMed]
- Plutzer, J.; Törökné, A. Free-Living Microscopic Organisms as Indicator of Changes in Drinking-Water Quality. Water Pract. Technol. 2012, 7, wpt2012050. [Google Scholar] [CrossRef]
- Melaram, R.; López-Dueñas, B. Detection and Occurrence of Microcystins and Nodularins in Lake Manatee and Lake Washington Two Floridian Drinking Water Systems. Front. Water 2022, 4, 899572. [Google Scholar] [CrossRef]
- Melaram, R.; Newton, A.R.; Chafin, J. Microcystin Contamination and Toxicity: Implications for Agriculture and Public Health. Toxins 2022, 14, 350. [Google Scholar] [CrossRef]
- Mokoena, M.M. Microcystins in Water Containers Used in the Home: A Review of their Potential Health Effects. Ecotoxicol. Environ. Saf. 2024, 269, 115787. [Google Scholar] [CrossRef]
- World Health Organization. Legionellosis. 2022. Available online: https://www.who.int/news-room/fact-sheets/detail/legionellosis#:~:text=The%20bacteria%20live%20and%20grow,which%20develop%20in%20water%20systems (accessed on 14 August 2025).
- World Health Organization. Drinking-Water. 2023. Available online: https://www.who.int/news-room/fact-sheets/detail/drinking-water (accessed on 26 June 2025).
- Ziemer, C.J.; Bonner, J.M.; Cole, D.; Vinje, J.; Constantini, V.; Goyal, S.; Gramer, M.; Mackie, R.; Meng, X.J.; Myers, G.; et al. Fate and Transport of Zoonotic, Bacterial, Viral, and Parasitic Pathogens during Swine Manure Treatment, Storage, and Land Application. J. Anim. Sci. 2010, 88, 84–94. [Google Scholar] [CrossRef]
- Smoguła, M.; Wesołowski, R.; Pawłowska, M.; Mila-Kierzenkowska, C. Influence of Selected Factors on the Survival Assessment and Detection of Giardia intestinalis DNA in Axenic Culture. Pathogens 2023, 12, 316. [Google Scholar] [CrossRef]
- Health Canada. Consultation on Escherichia coli in Drinking Water. Available online: https://www.canada.ca/en/health-canada/programs/consultation-e-coli-drinking-water/document.html#a4-2 (accessed on 14 August 2025).
- Baker-Austin, C.; Trinanes, J.; Gonzalez-Escalona, N.; Martinez-Urtaza, J. Non-Cholera Vibrios: The Microbial Barometer of Climate Change. Trends Microbiol. 2017, 25, 76–84. [Google Scholar] [CrossRef]
- Mahieddine, F.C.; Mathieu-Denoncourt, A.; Duperthuy, M. Temperature Influences Antimicrobial Resistance and Virulence of Vibrio parahaemolyticus Clinical Isolates from Quebec, Canada. Pathogens 2025, 14, 521. [Google Scholar] [CrossRef]
- Kristanti, R.A.; Hadibarata, T.; Syafrudin, M.; Yilmaz, M.; Abdullah, S. Microbiological Contaminants in Drinking Water: Current Status and Challenges. Water Air Soil Pollut. 2022, 233, 299. [Google Scholar] [CrossRef]
- Salvadori, M.I.; Sontrop, J.M.; Garg, A.X.; Moist, L.M.; Suri, R.S.; Clark, W.F. Epidemiological Association between Climate and Renal Disease: A Potential Role for Heat- and Drought-related Water Quality. Kidney Int. 2009, 76, 1139–1146. [Google Scholar] [CrossRef]
- Acosta-España, J.D.; Romero-Álvarez, D.; Luna, C.; Rodríguez-Morales, A.J. Infectious Disease Outbreaks in the Wake of Natural Flood Disasters: Global Patterns and Local Implications. Infez. Med. 2024, 32, 451–462. [Google Scholar] [CrossRef] [PubMed]
- Rath, S. Microbial Contamination of Drinking Water. In Water Pollution and Management Practices; Singh, A., Agrawal, M., Agrawal, S.B., Eds.; Springer: Singapore, 2021; pp. 1–17. [Google Scholar] [CrossRef]
- Chung The, H.; Bodhidatta, L.; Pham, D.T.; Mason, C.J.; Thanh, T.H.; Vinh, P.V.; Turner, P.; Hem, D.A.B.; Newton, P.N.; Phetsouvanh, R.; et al. Evolutionary Histories and Antimicrobial Resistance in Shigella flexneri and Shigella sonnei in Southeast Asia. Commun. Biol. 2021, 4, 353. [Google Scholar] [CrossRef]
- Mondino, S.; Schmidt, S.; Schmidt, S.; Rolando, M.; Escoll, P.; Gomez-Valero, L.; Buchrieser, C. Legionnaires’ Disease: State of the Art Knowledge of Pathogenesis Mechanisms of Legionella. Annu. Rev. Pathol. Mech. Dis. 2020, 15, 439–466. [Google Scholar] [CrossRef] [PubMed]
- Kunz, J.M.; Lawinger, H.; Miko, S.; Miko, S.; Gerdes, M.; Thuneibat, M.; Hannapel, E.; Roberts, V.A. Surveillance of Waterborne Disease Outbreaks Associated with Drinking Water—United States, 2015–2020. MMWR Surveill. Summ. 2024, 73, 1–23. [Google Scholar] [CrossRef]
- LeChevallier, M.W.; Prosser, T.; Stevens, M. Opportunistic Pathogens in Drinking Water Distribution Systems—A Review. Microorganisms 2024, 12, 916. [Google Scholar] [CrossRef] [PubMed]
- Franceschelli, A.; Bonadonna, L.; Cacciò, S.M.; Sannella, A.R.; Cintori, C.; Gargiulo, R.; Coccia, A.M.; Paradiso, R.; Iaconelli, M.; Briancesco, R.; et al. An Outbreak of Cryptosporidiosis associated with Drinking Water in North-Eastern Italy, August 2019: Microbiological and Environmental Investigations. Euro Surveill. 2022, 27, 2200038. [Google Scholar] [CrossRef]
- Wójcik, O.P.; Holt, J.; Kjerulf, A.; Müller, L.; Ethelberg, S.; Molbak, K. Personal Protective Equipment, Hygiene Behaviours and Occupational Risk of Illness after July 2011 Flood in Copenhagen, Denmark. Epidemiol. Infect. 2013, 141, 1756–1763. [Google Scholar] [CrossRef]
- Gertler, M.; Dürr, M.; Renner, P.; Poppert, S.; Askar, M.; Breidenbach, J.; Frank, C.; Preussel, K.; Schielke, A.; Werber, D.; et al. Outbreak of Cryptosporidium Hominis following River Flooding in the City of Halle (Saale), Germany, August 2013. BMC Infect. Dis. 2015, 15, 88. [Google Scholar] [CrossRef]
- Bratburd, J.R.; McLellan, S.L. Waterborne Diseases. In Climate Change and Public Health, 2nd ed.; Levy, B.S., Patz, J.A., Eds.; Oxford Academic: New York, NY, USA, 2024; pp. 133–152. [Google Scholar] [CrossRef]
- Marcheggiani, S.; Puccinelli, C.; Ciadamidaro, S.; Della Bella, V.; Carere, M.; Blasi, M.F.; Mancini, L. Risks of Water-Borne Disease Outbreaks after Extreme Events. Toxicol. Environ. Chem. 2010, 92, 593–599. [Google Scholar] [CrossRef]
- Mas-Coma, S.; Artigas, P.; Cuervo, P.F.; De Elías-Escribano, A.; Fantozzi, M.C.; Colangeli, G.; Córdoba, A.; Marquez-Guzman, D.J.; Mas-Bargues, C.; Borrás, C.; et al. Infectious Disease Risk after the October 2024 Flash Flood in Valencia, Spain: Disaster Evolution, Strategic Scenario Analysis, and Extrapolative Baseline for a One Health Assessment. One Health 2025, 21, 101093. [Google Scholar] [CrossRef] [PubMed]
- European Commission. Drinking Water. Available online: https://environment.ec.europa.eu/topics/water/drinking-water_en (accessed on 15 July 2025).
- LeChevallier, M.W. Occurrence of culturable Legionella pneumophila in drinking water distribution systems. AWWA Water Sci. 2019, 1, e1139. [Google Scholar] [CrossRef]
- European Centre for Disease Prevention and Control (ECDC). Communicable Disease Threats Report, 3–9 August 2024, Week 32; ECDC: Stockholm, Sweden, 2024; Available online: https://www.ecdc.europa.eu/sites/default/files/documents/communicable-disease-threats-report-week-32-2024.pdf (accessed on 15 July 2025).
- European Centre for Disease Prevention and Control (ECDC). Surveillance Atlas of Infectious Diseases. Legionnaires’ Disease. Available online: https://atlas.ecdc.europa.eu/public/index.aspx?Dataset=27&HealthTopic=30 (accessed on 15 July 2025).
- European Centre for Disease Prevention and Control (ECDC). Rapid Risk Assessment. Increased Cryptosporidium Infections in the Netherland, United Kingdom and Germany in 2012; ECDC: Stockholm, Sweden, 14 November 2012; Available online: https://www.ecdc.europa.eu/sites/default/files/media/en/publications/Publications/cryptosporidium-infectionss-netherlands-united-kingdom-germany-risk-assessment.pdf (accessed on 16 July 2025).
- European Centre for Disease Prevention and Control (ECDC). Surveillance Atlas of Infectious Diseases. Cryptosporidiosis Disease. Available online: https://atlas.ecdc.europa.eu/?Dataset=27&HealthTopic=15&Indicator=891995&GeoResolution=2&TimeResolution=Year&StartTime=2007&EndTime=2023&CurrentTime=2023&Distribution=892005&DistributionRepresentation=B&TimeSeries=region&TimeSeriesRepresentation=T (accessed on 16 July 2025).
- European Centre for Disease Prevention and Control (ECDC). Cholera Worldwide Overview. Available online: https://www.ecdc.europa.eu/en/all-topics-z/cholera/surveillance-and-disease-data/cholera-monthly (accessed on 17 July 2025).
- European Centre for Disease Prevention and Control (ECDC). Surveillance Atlas of Infectious Diseases. Cholera Disease. Available online: https://atlas.ecdc.europa.eu/ (accessed on 17 July 2025).
- European Centre for Disease Prevention and Control (ECDC). Surveillance Atlas of Infectious Diseases. Hepatitis A Disease. Available online: https://atlas.ecdc.europa.eu/ (accessed on 17 July 2025).
Disclaimer/Publisher’s Note: The statements, opinions and data contained in all publications are solely those of the individual author(s) and contributor(s) and not of MDPI and/or the editor(s). MDPI and/or the editor(s) disclaim responsibility for any injury to people or property resulting from any ideas, methods, instructions or products referred to in the content. |
© 2025 by the authors. Licensee MDPI, Basel, Switzerland. This article is an open access article distributed under the terms and conditions of the Creative Commons Attribution (CC BY) license (https://creativecommons.org/licenses/by/4.0/).