Review

High Resolution Mapping of Orientation and Strain Gradients in Metals by Synchrotron 3D X-ray Laue Microdiffraction

by
Yubin Zhang
1,* and
Rozaliya I. Barabash
2
1
Department of Mechanical Engineering, Technical University of Denmark, 2800 Kgs. Lyngby, Denmark
2
Materials Science & Technology Division, Oak Ridge National Laboratory, P.O. Box 2008, Oak Ridge, TN 37831-6118, USA
*
Author to whom correspondence should be addressed.
Quantum Beam Sci. 2019, 3(1), 6; https://doi.org/10.3390/qubs3010006
Submission received: 15 May 2018 / Revised: 3 August 2018 / Accepted: 14 February 2019 / Published: 11 March 2019
(This article belongs to the Special Issue Strain, Stress and Texture Analysis with Quantum Beams)

Abstract

:
Synchrotron 3D X-ray Laue microdiffraction, available at beamline 34-ID-E at Advanced Photon Source in Argonne National Laboratory, is a powerful tool for 3D non-destructive mapping of local orientations and strains at sub-micron scale in the bulk. With this technique, it is possible to study local residual stresses developed during manufacturing or while in service due to interactions between, for example, different phases and/or grains with different orientations in materials containing multiple or single phase(s). Such information is essential for understanding mechanical properties and designing advanced materials, but is largely non-existent in the current generation of materials models. In the present paper, the principle and experimental set-up of the 3D microdiffraction are introduced, followed by a description of a method for quantification of the local plastic deformation based on high-angular-resolution orientation maps. The quantification of local residual stresses in two model materials, ductile cast iron (two phases) and partially recrystallized pure nickel (single phase), using 3D microdiffraction will then be presented. The results show that 3D microdiffraction is important for understanding the origin of local residual stresses and to relate them to the microstructural evolution. Finally, the limitations of the 3D microdiffraction on the current generation synchrotron source and new possibilities after the synchrotron upgrade are discussed.

1. Introduction

Most engineering materials are polycrystalline, containing grain boundaries and, in the case of multiphase material, phase interfaces. When such materials are exposed to thermal-mechanical loading during manufacturing or service, a heterogeneous stress field develops among and within grains due to crystal anisotropy and grain/phase interactions, with local stress “hot spots” [1,2,3]. Upon unloading, residual stresses remain and can be detrimental to the performance of a component. The local distribution of residual stresses is much more difficult to predict than the external in-service stresses on which they superimpose, because they depend on the local microstructural variations and the load history. Local residual stresses are thus an important reason for unpredicted catastrophic failure [4]. To optimize the materials performance and to design advanced materials, it is, therefore, crucial to determine non-destructively the local residual stresses and relate them to the local materials inhomogeneities in 3D.
During the last 20 years, several characterization methods using synchrotron X-rays have been invented that allow non-destructive 3D characterization of microstructures and local elastic strains (from which stresses are derived) in the bulk. These techniques include 3D X-ray diffraction [5,6,7,8,9] (also known as high-energy X-ray diffraction microscopy [10,11]), diffraction contrast tomography [12,13], dark field X-ray microscopy [14], Bragg coherent diffraction imaging [15,16,17] and 3D X-ray Laue microdiffraction (also known as differential aperture X-ray microscopy (DAXM)) [18,19,20]. Among these techniques, the DAXM allows real-space orientation and elastic strain mapping of crystalline materials at sub-micron scale [21,22,23]. With this technique, local elastic strain distributions inside individual grains/subgrains have been measured in e.g., deformed single phase metals [24,25,26,27] and composites [25,26,27,28,29,30,31,32,33,34]. Moreover, the high-angular-resolution DAXM orientation maps provide a unique possibility for precise quantification of local plastic deformation (i.e., microstructural inhomogeneities) [23,35,36,37]. Very recently, it has been shown that the combination of the plastic strains, quantified based on DAXM orientation maps, and the local elastic strain maps is in particular useful for understanding the formation of thermal stresses originated due to the interaction between different grains and/or different phases during cooling [38,39].
In this paper, the experimental set-up and the principles of DAXM for orientation and elastic strain measurements are introduced. A method for quantifying the local plastic deformation based on the orientation maps is described. To show the potentials of the technique, recent studies of ductile cast iron and partially recrystallized pure nickel led by the present authors using DAXM are then presented. It is demonstrated that the characterization of both the plastic and elastic strains by DAXM is essential for advancing the current understanding of the formation of residual stresses and their role on the mechanical properties.

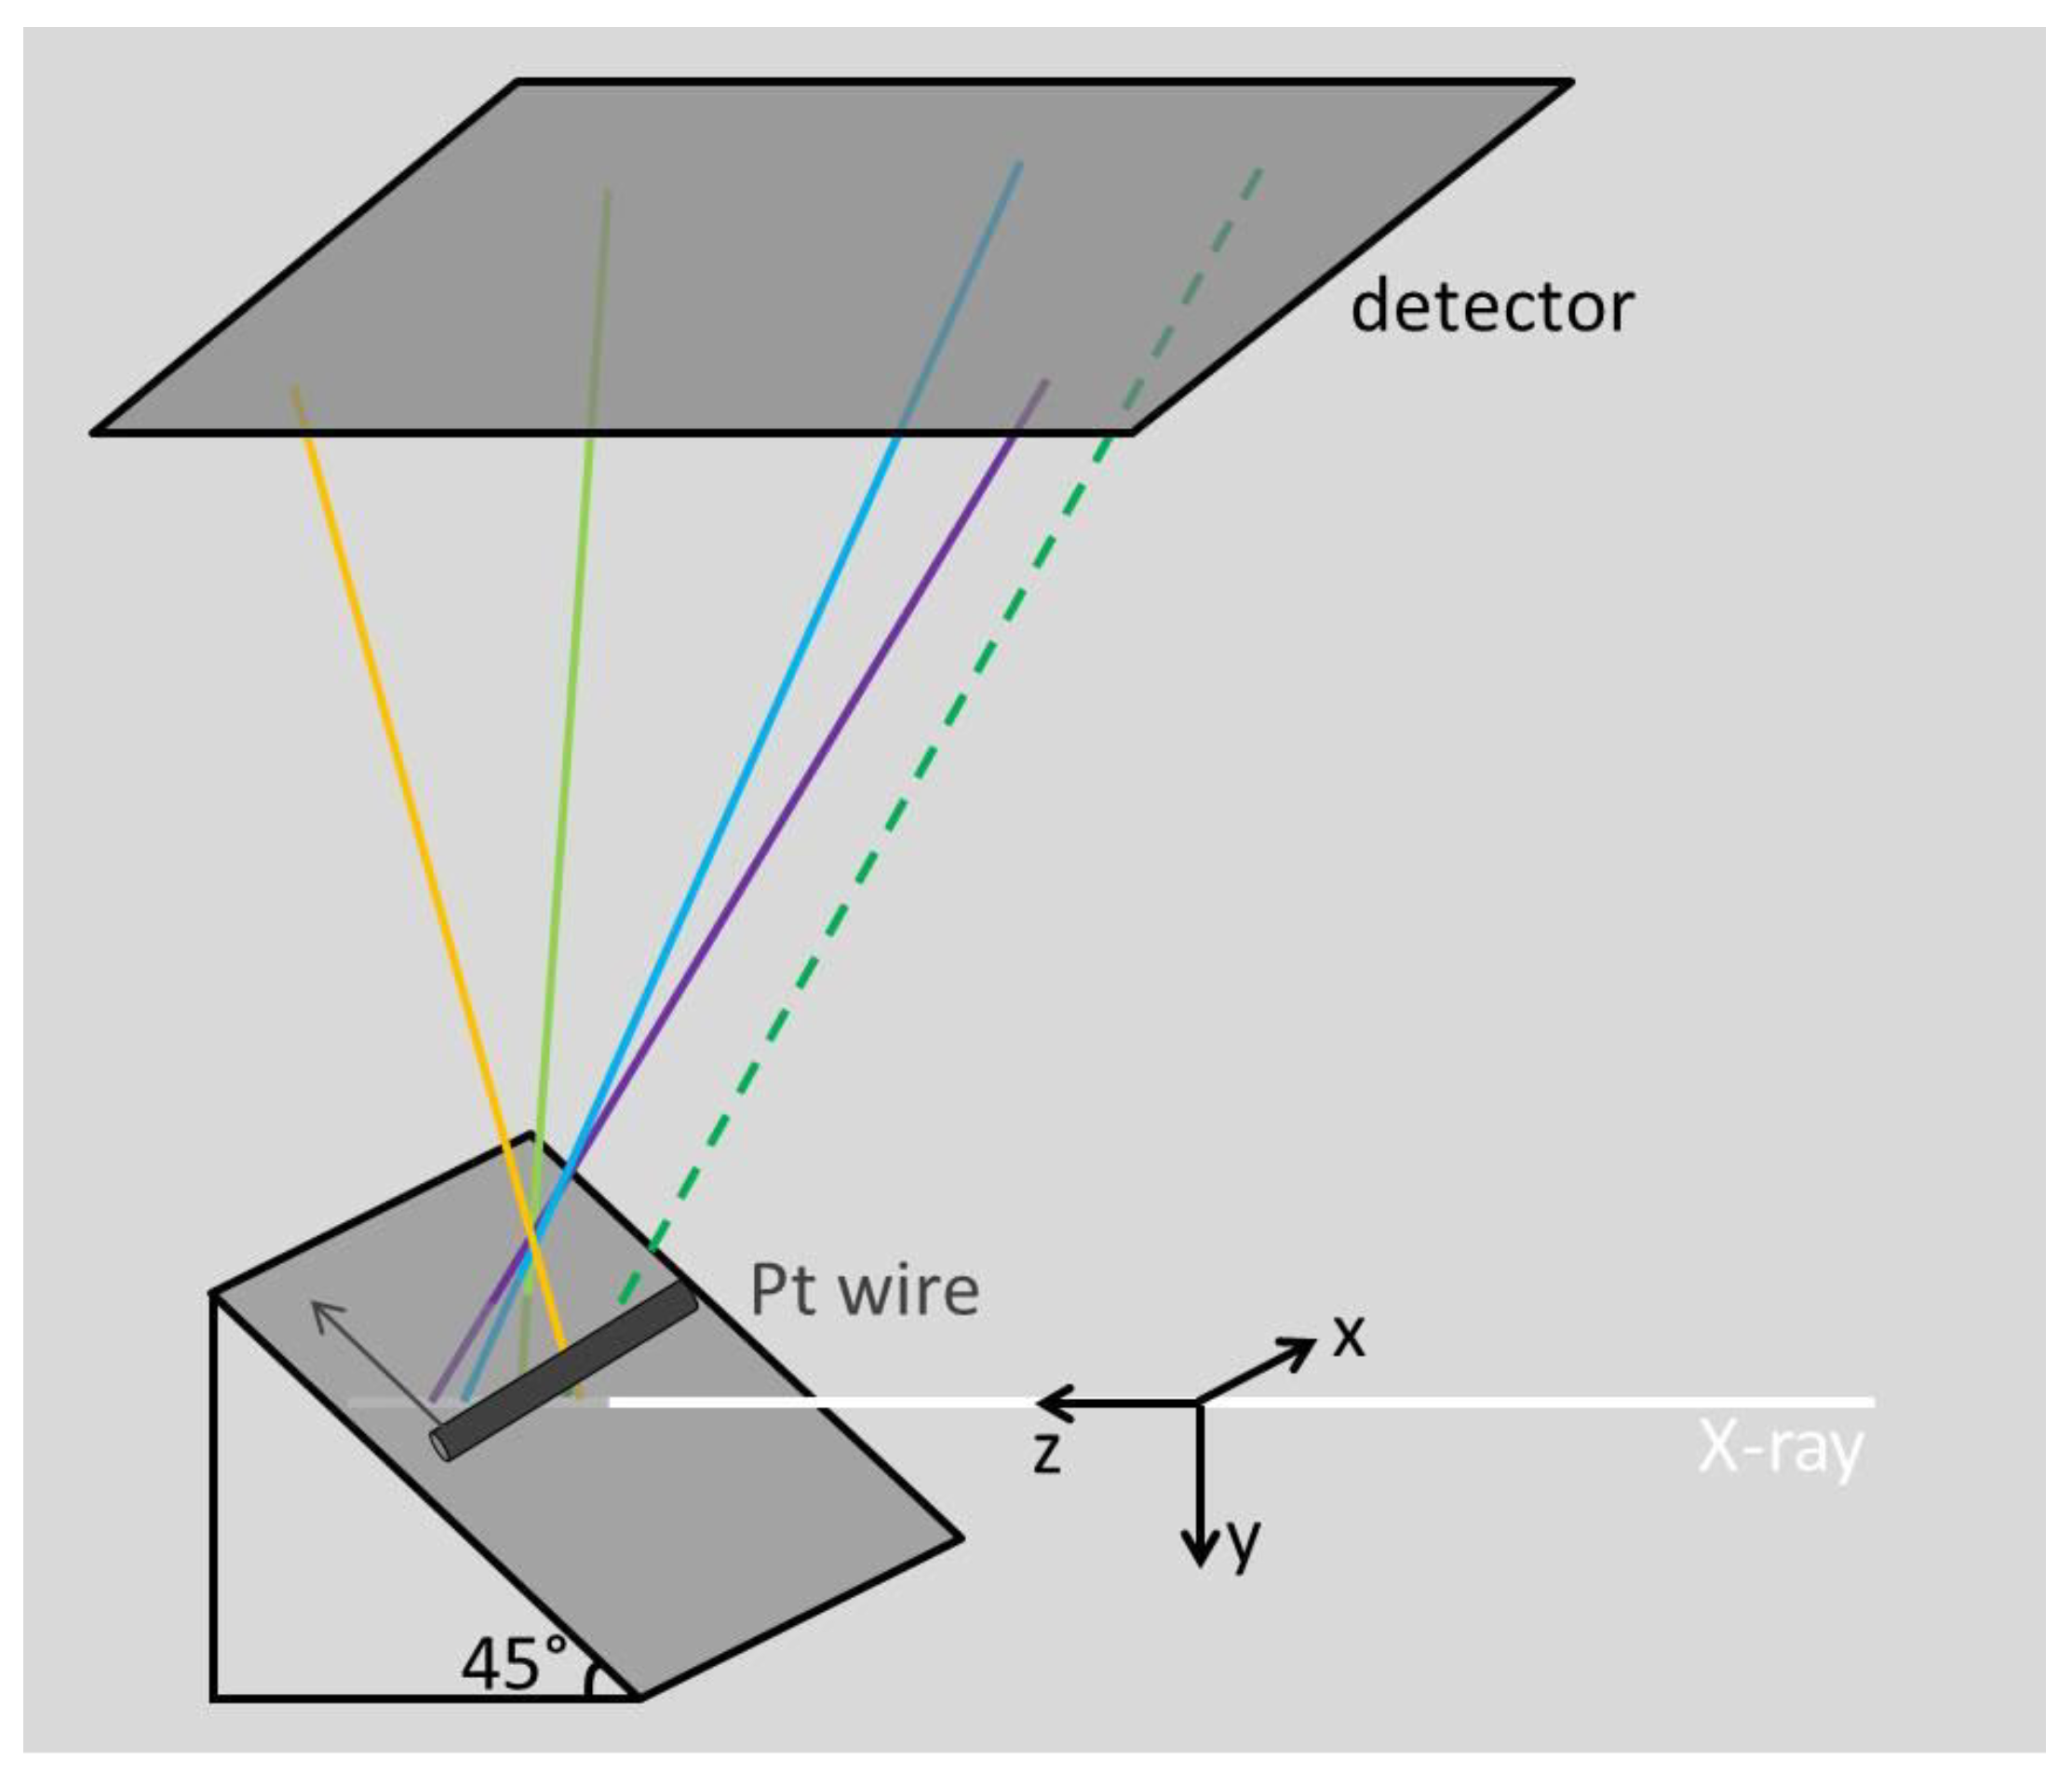
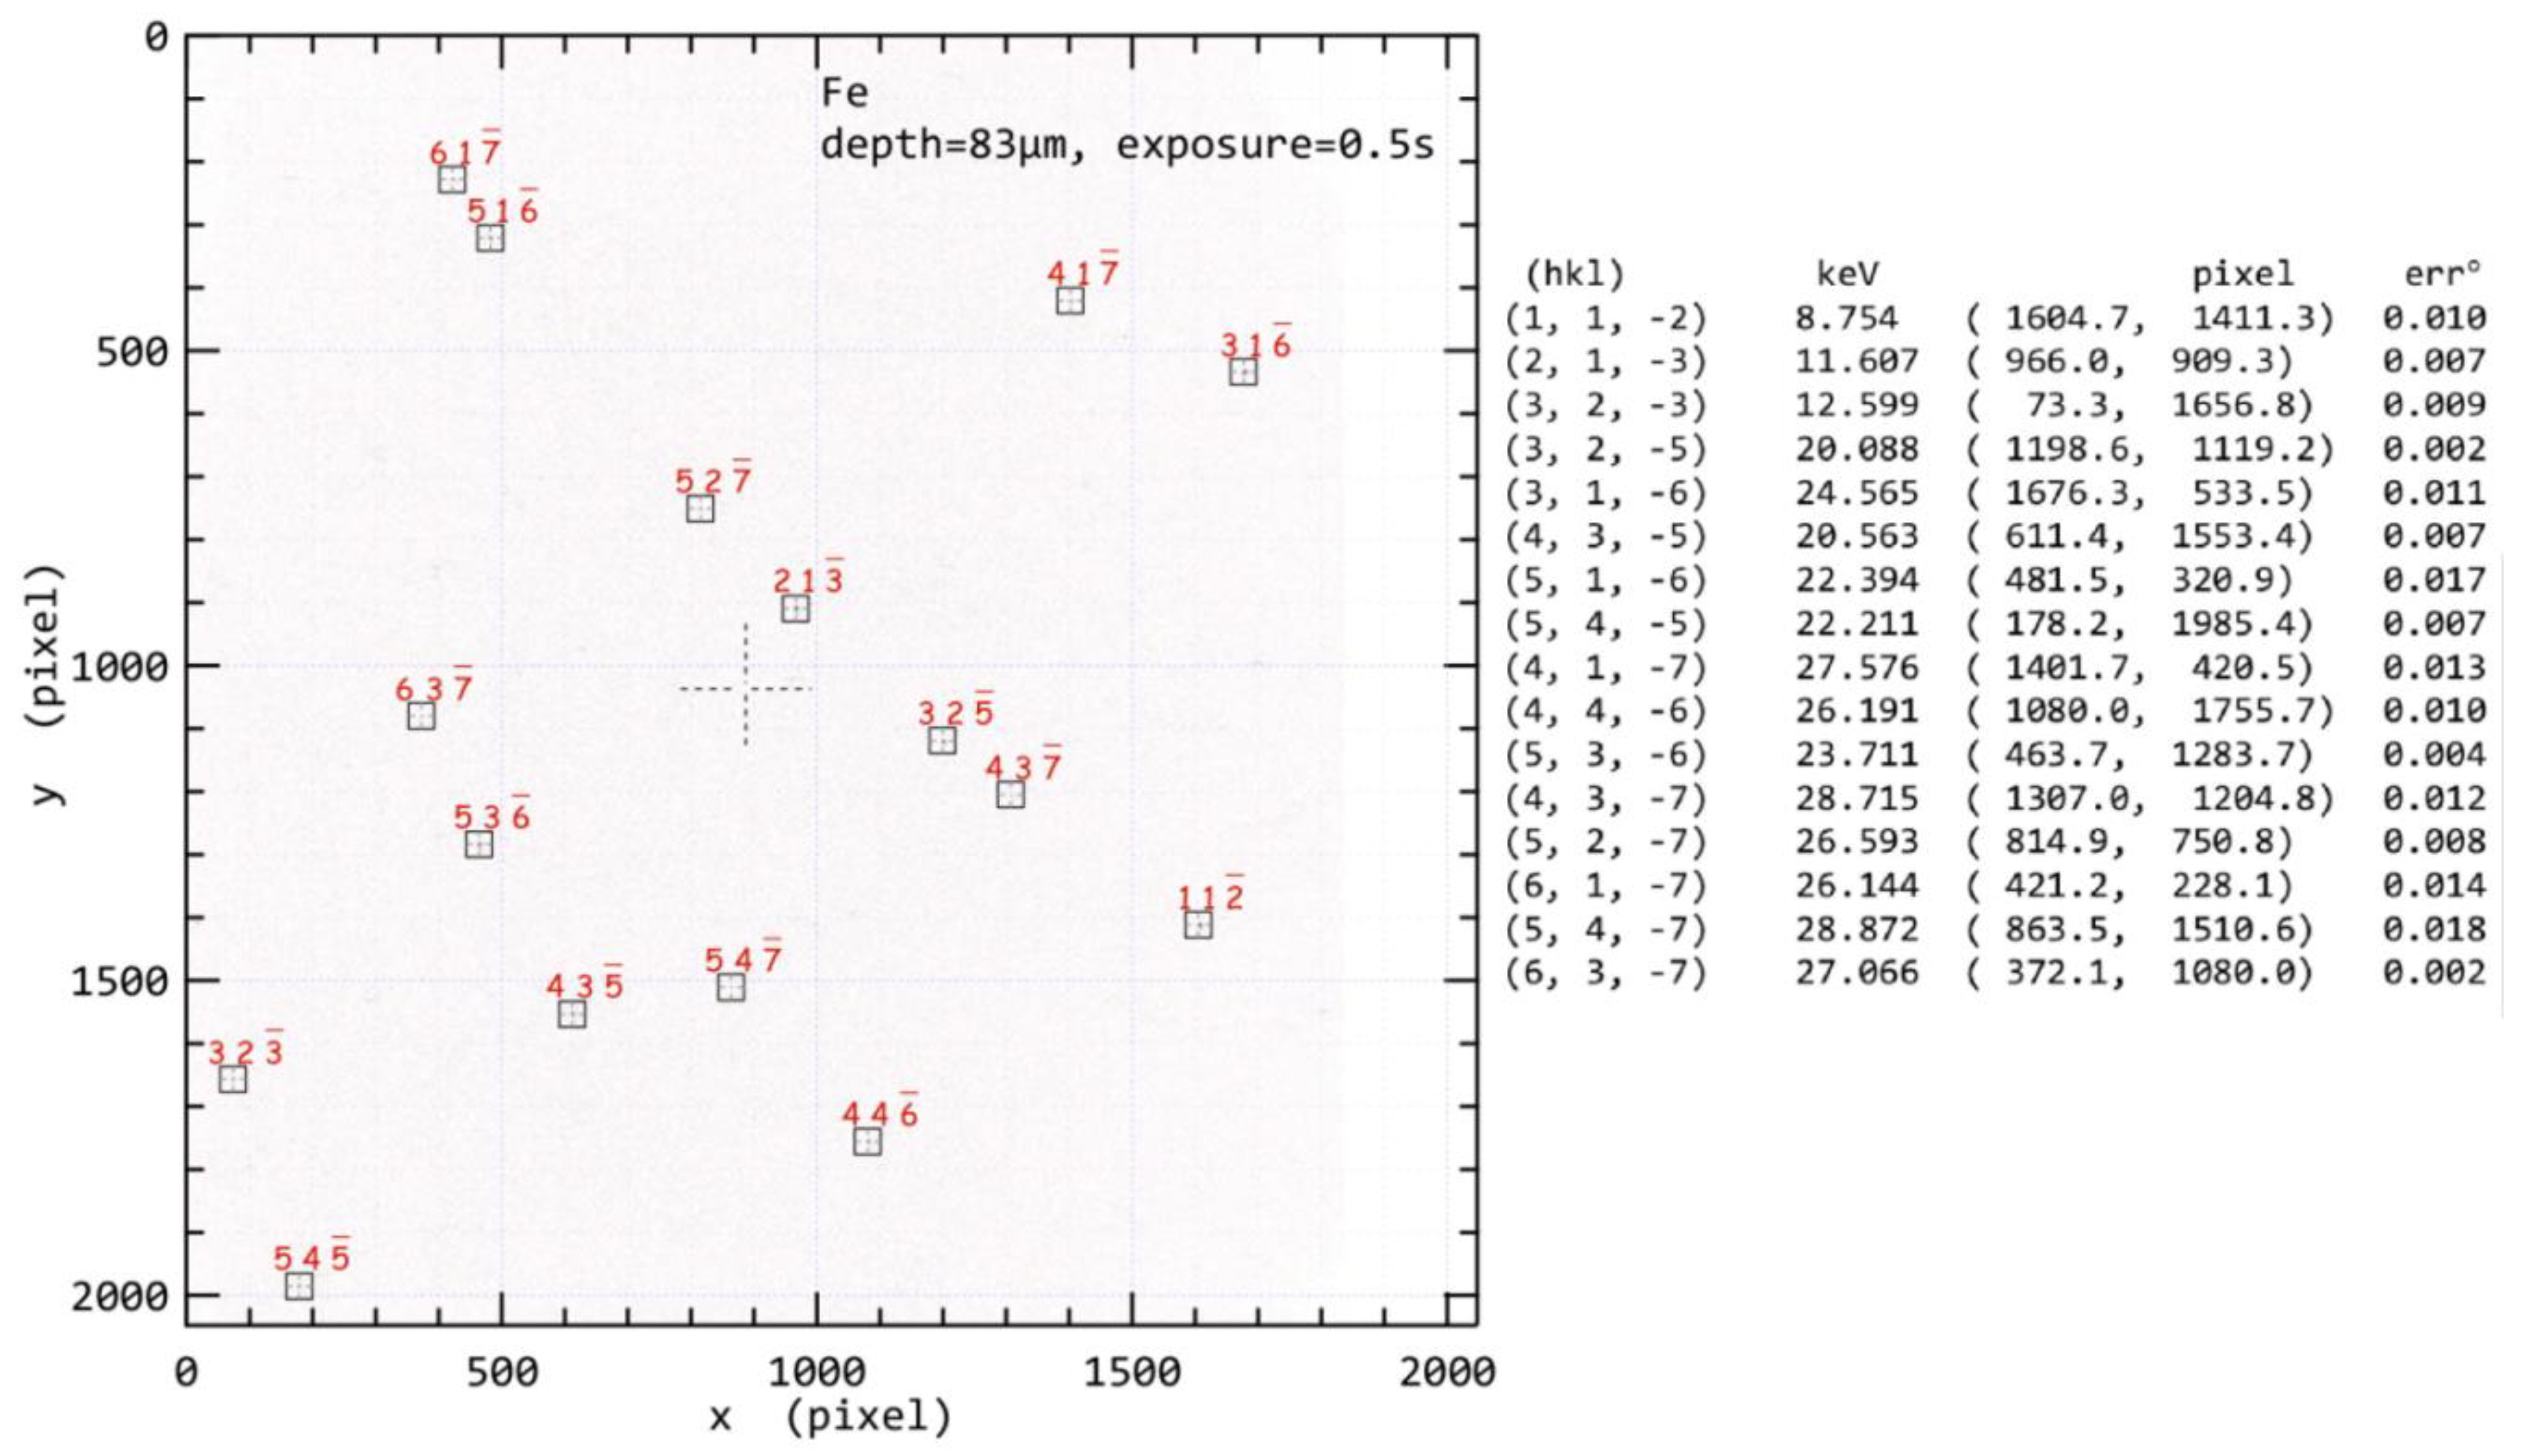
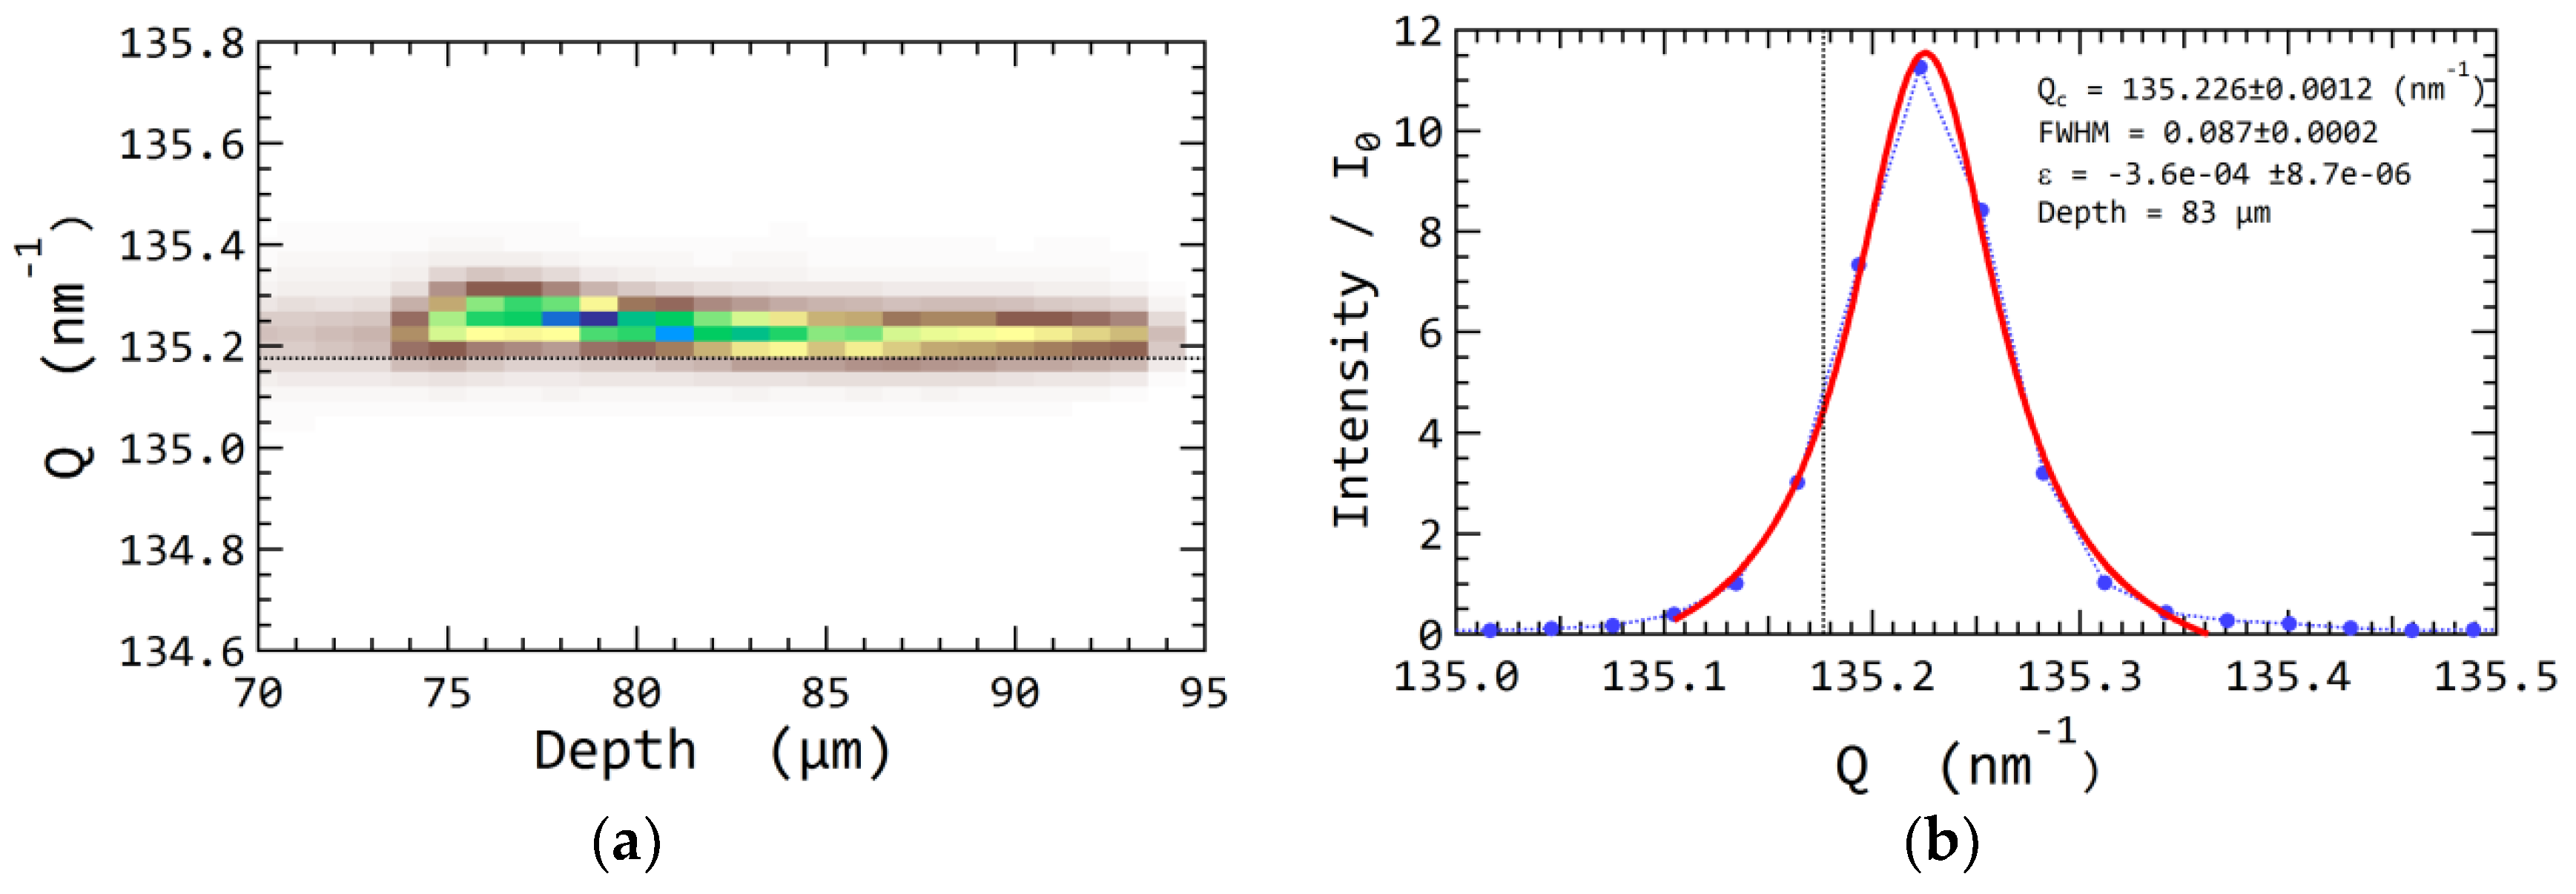
2. Differential Aperture X-ray Microscopy

The DAXM resumed in this paper is based on the experimental set-up at beam line 34-ID-E at the Advanced Photon Source (APS) in Argonne National Laboratory. This technique was developed by a group from Oak Ridge National Laboratory in collaboration with the team from APS [18,19,20,21,22,23,40,41,42,43]. In a DAXM experiment, a polychromatic X-ray beam, with energies in the range of 5–30 keV, is focused using two non-dispersive Kirkpatrick-Baez focusing mirrors, producing a beam with a Lorentzian profile with a full width half maximum of ~0.5 µm. A sample with a flat surface is mounted on an inclined sample holder at a 45° incidence angle to the X-ray beam. A Pt wire, 100 µm in diameter, is used as a differential aperture, which is scanned continually (in so-called fly-scan mode) in a plane parallel, to the sample surface at a distance of ~200 µm (see Figure 1). The scanning range of the wire is optimized to cover most diffracted beams coming from a volume illuminated by the incoming X-rays to a depth of typically ~100 µm below the sample surface. A typical wire scan with 1 µm resolution takes about 3–5 min.
During each wire scan, the Laue diffraction pattern from all grains intercepted by the incident beam at each scanned position is recorded on a Perkin-Elmer flat panel detector (409.6 × 409.6 mm2, 2048 × 2048 pixels, amorphous Si, CsI scintillator, 16-bit dynamic range corresponding to 65,536 counts) mounted in 90° reflection geometry 510.3 mm above the sample (see Figure 1). The detector’s geometry with respect to the incident beam is calibrated using a standard strain-free silicon single crystal. The origin of the scattered contributions arising from different depths along the beam is then determined by ray-tracing from the wire scan patterns (see Figure 1). The diffraction pattern at each depth is then reconstructed and indexed using the in-house LaueGo software available at APS beamline 34-ID-E [44]. An example of an indexed depth-resolved Laue diffraction pattern from a polychromatic scan is shown in Figure 2, where the hkl indices of individual spots as well as their corresponding X-ray energies are calculated. By scanning the sample horizontally and vertically, 3D orientation mapping of the microstructure can be conducted. The sub-micron beam and precision of the wire motion allow a sub-micron spatial resolution, while the angular resolution is determined by the pixel size and the distance between sample and detector to be about 0.01° [21].
In practice, a monochromator can be inserted automatically to switch the polychromatic beam to the monochromatic beam mode for determining absolute lattice parameters and in turn the local elastic strains of selected grains. By scanning the X-ray energy around the calculated value for a selected Laue diffraction spot in the monochromatic beam mode, the intensity distribution as a function of the diffraction vector Q = 2π/d (Q-distribution) can be determined for the selected diffraction spot at all depths, see the example in Figure 3a, which is obtained from the Laue spot 32-5 shown in Figure 2. At each depth, the Q-distribution is fitted using a Gaussian function and the center of the distribution, QC, is used to determine the absolute diffraction plane spacing, d. The elastic strain, ε, can then be determined using Equation (1):
ε = (dd0)/d0,
where d0 is the plane spacing for strain-free situation (see Figure 3b). By repeating the energy and wire scan at different locations, 3D strain maps can be obtained. Depending on the orientation and strain spreads within the grains, an energy wire scan can take from about 10 min to 10 h.

3. Quantification of Plastic Strain and Geometrically Necessary Dislocation Density Based on Orientation Maps

In plastically deformed materials, stored dislocations are generally divided into geometrically necessary dislocations (GND), which accommodate a lattice curvature from a deformation gradient, and statistically stored dislocations, which accumulate due to statistical entanglements [42]. Previously, DAXM has been used to quantify the dislocation density based on the line profiles from monochromatic energy scan (e.g., Figure 3b) [25,29]. In these studies, the crystallographic orientations have not been used. In the present work, a method to calculate the GND density based on the crystallographic misorientations [45] is adapted, taking advantage of the high angular resolution of the DAXM. Assuming that elastic stresses can be neglected, the lower bound of the GND density can be derived using Equation (2) from the orientation differences between neighboring voxels [45,46,47]:
ρ = α/u·θ/b,
where α is a number typically in the range of 1–2, u is the unit length (typically the step size of the map), θ is the misorientation angle, and b is Burgers vector. For typical metals such as iron (b = 0.248 nm), the angular resolution of DAXM, 0.01°, corresponds to a GND density of the order of 1012 m−2. The average GND density within the characterized volume or different sub-regions can then be determined based on the average misorientation angle, θav.

4. Local Thermal Residual Stress in Metal Composite

Ductile cast iron (DCI) is a model composite material, consisting of graphite nodules embedded in a metal matrix [48,49]. The differences in the thermal expansion coefficients between the different components of the composite result in local thermal residual stresses at graphite nodules during cooling from the processing temperature to room temperature [38,50]. The presence of the local residual stresses may lead to fatigue cracks and thus failure of the material [51]. However, due to the lack of proper experimental characterization tools, very little knowledge about the local residual stresses in DCI is known. With DAXM, it is now possible to quantify both the magnitude and distribution of the thermal residual stresses.
In the following, the results of DAXM characterization including both local elastic and plastic strains on a DCI sample will be presented. The DCI sample contains almost spherical graphite nodules within a metal matrix with a relatively homogeneous structure, being mainly ferrite with a small fraction of perlite (~5%). The graphite nodules are distributed relatively homogeneously. The mean size and volume fraction of the graphite nodules are ~30 µm and 11.5%, respectively. More details about the sample can be found in [38].

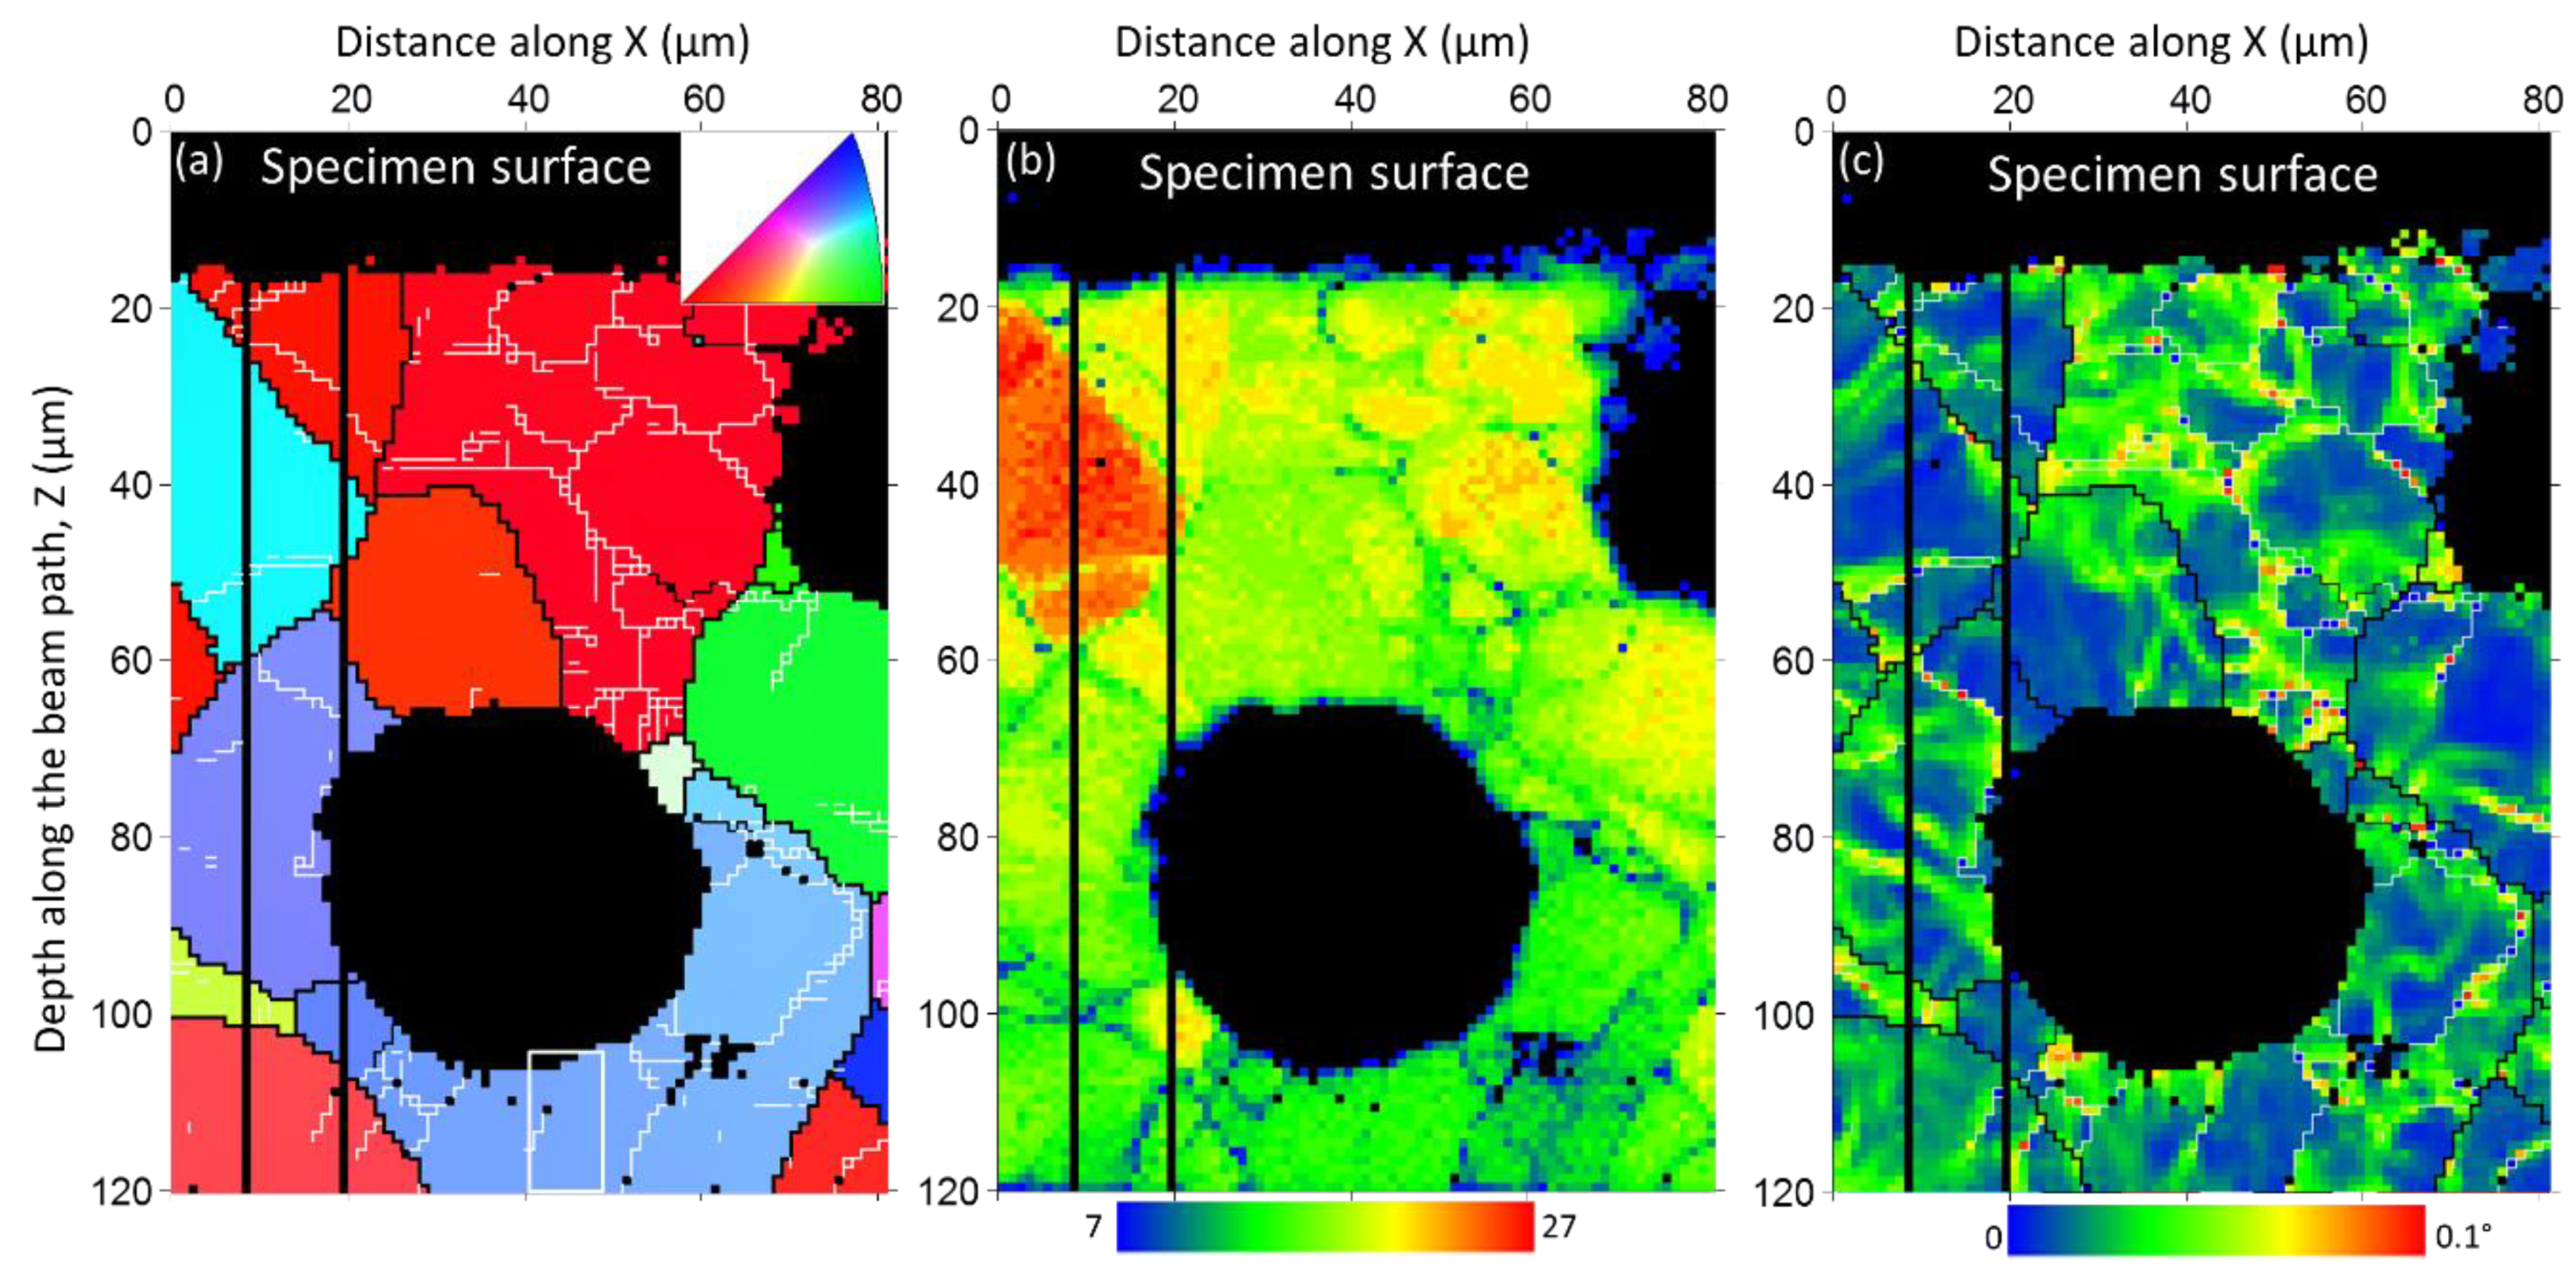
4.1. Microstructure of Ductile Cast Iron

The depth-dependent grain orientation map obtained using DAXM around a graphite nodule with size of 50 µm is shown in Figure 4. With the high angular precision of DAXM, dislocation boundaries with low misorientation angles can be revealed. In the map, a critical angle of 0.1° is used for revealing the dislocation boundary structure, and a critical angle of 3° is used for defining individual grains in the matrix. It is evident that most of the deformed grains are containing dislocation boundaries with misorientation angles below 1°, and the dislocation boundaries are organized in a cell structure.
To reveal the orientation variations within the cells, the kernel average misorientation (KAM) for each pixel is calculated and shown in Figure 4b. The KAM is here defined for a given pixel as the average misorienation of that pixel to all its immediate neighbors, which is calculated with the proviso that misorientation angles above a cut-off angle (0.1° for this study) are not counted in the averaging process. It is evident that within individual cells there are sub-structures: at some locations continual color changes are seen, which correspond typically to the presence of GNDs, while at some other locations continual line features are seen, which correspond to dislocation boundaries with misorientation <0.1°.

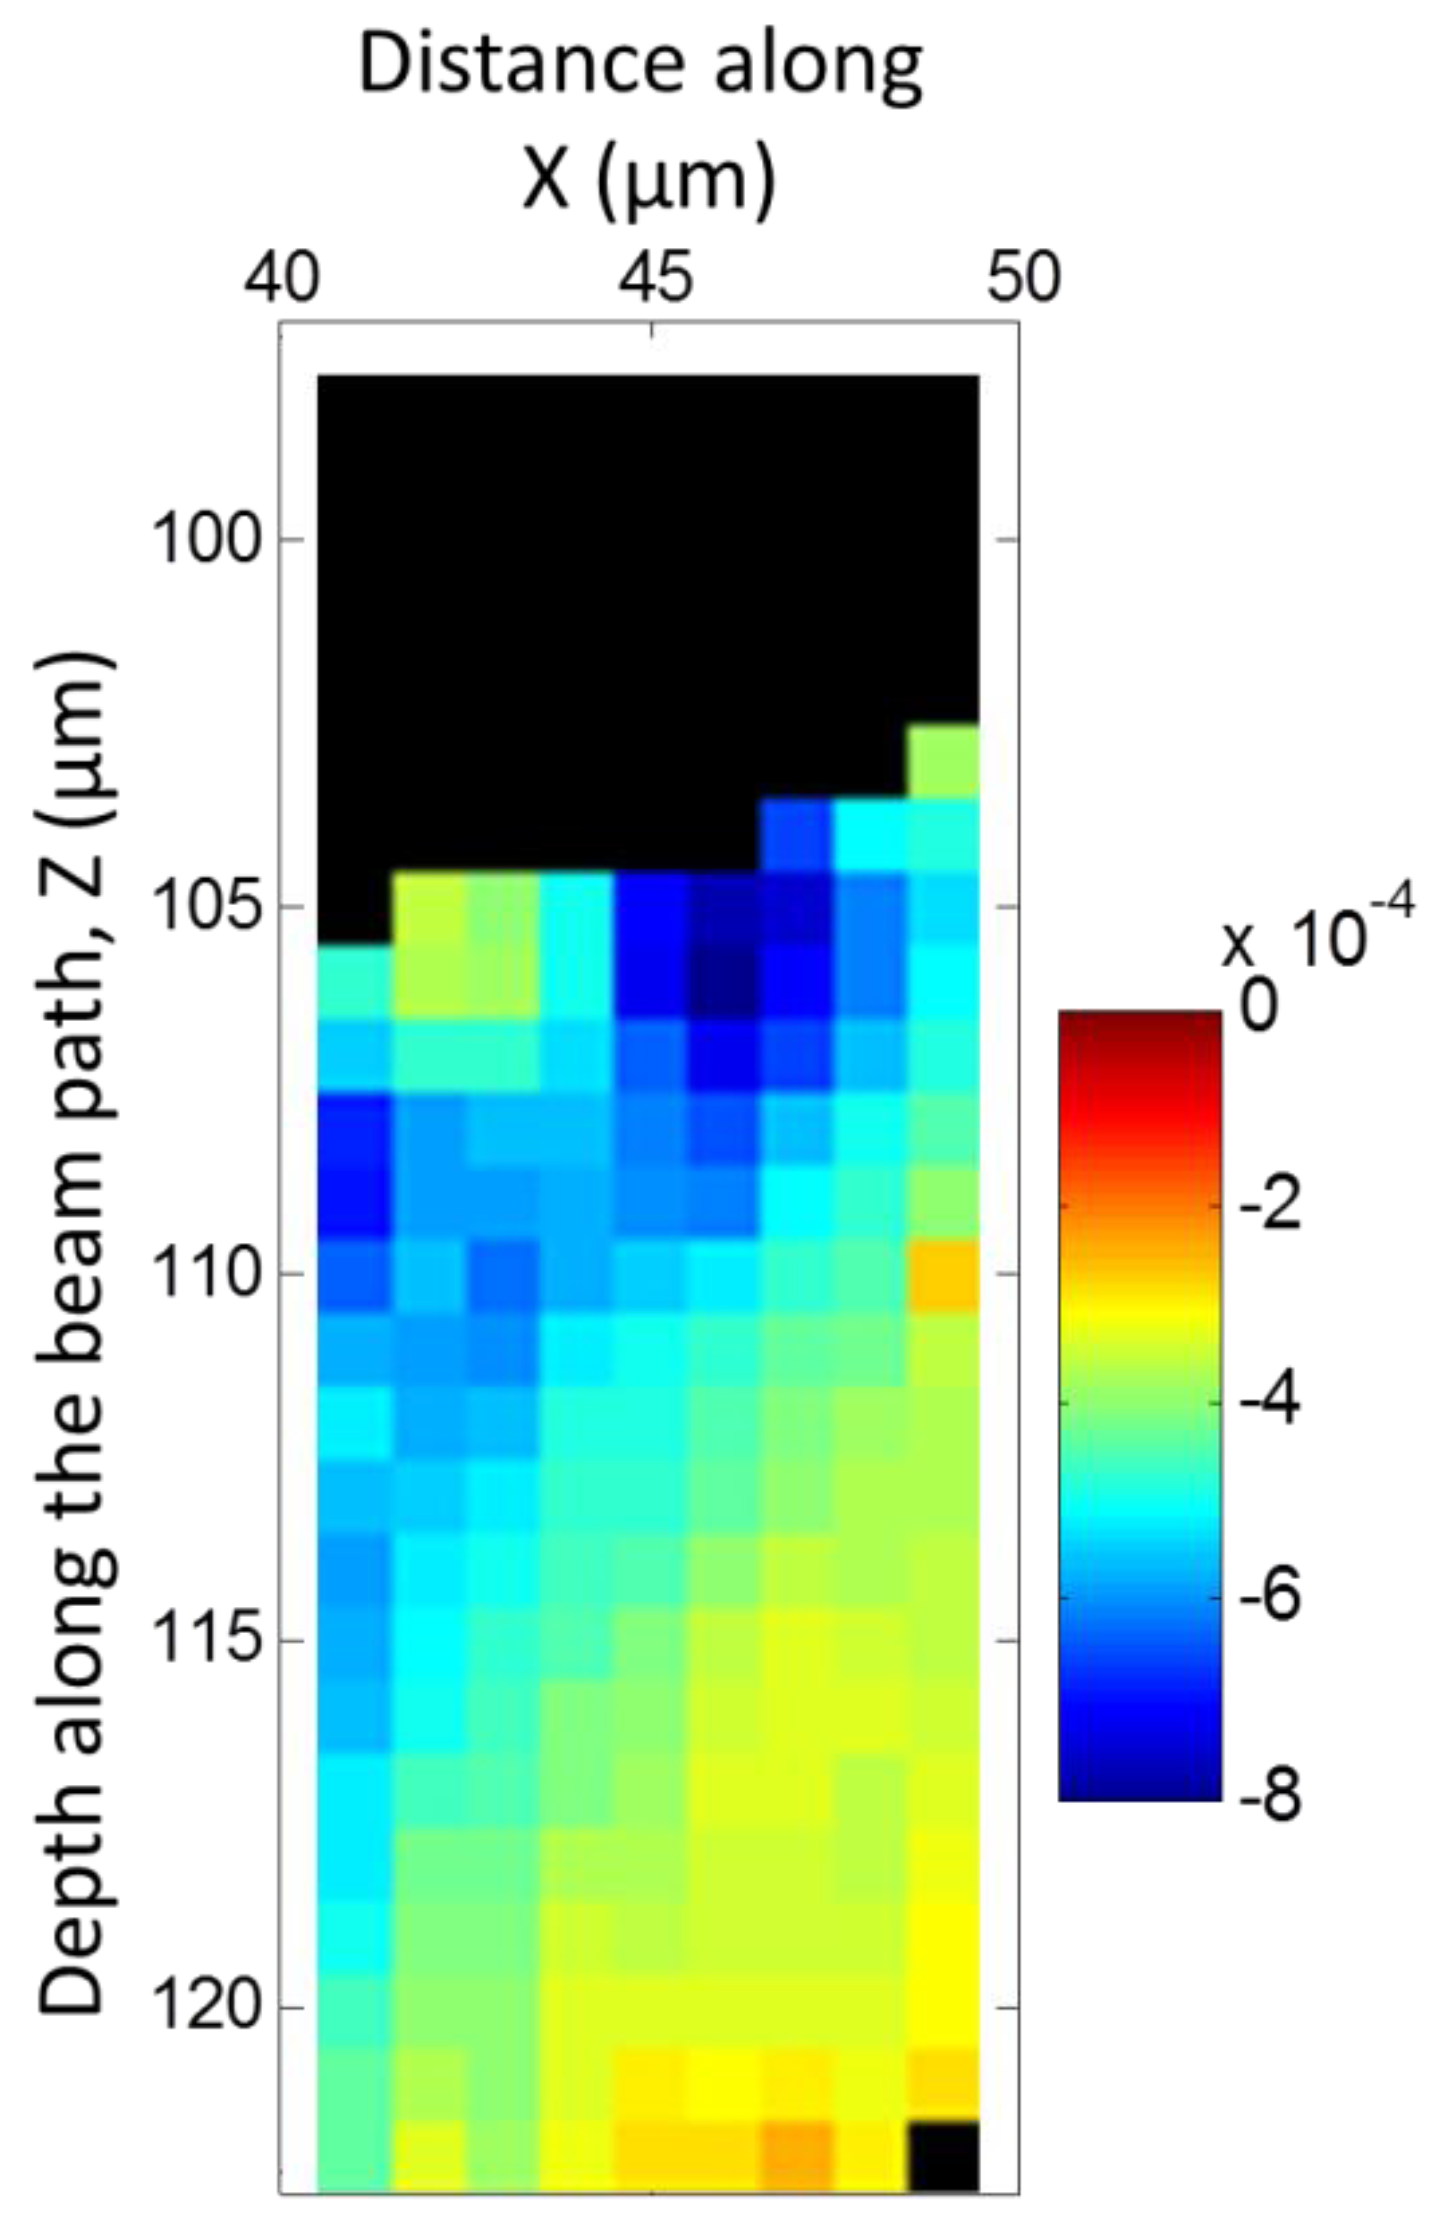
4.2. Elastic Strain Distribution

The local elastic lattice strains of the grain within the white box in Figure 4a were determined by monochromatic energy scans. This grain is chosen as (i) the grain is relatively large and has smaller orientation spread; the strain distribution within a longer range can thus be determined within relatively short scanning time, and (ii) stress relief by the free specimen surface is avoided. A depth-resolved diffraction pattern of this grain is shown in Figure 2. For the energy scan, diffraction from the (3 2 -5) plane was used. The normal of this plane is nearly parallel to the specimen normal direction (see Figure 2), with a deviation angle of ~3.5°. Also, the intensity of this spot is high, and its corresponding X-ray energy is within the range where the monochromator is well calibrated. Based on the measured absolute crystallographic plane spacing, the elastic strains were determined using Equation (1). The reference d0 is determined based on the chemical composition of the DCI (see details in [38]).
The results are shown in Figure 5. Compressive strains are observed for most part of the grain, and they are higher at regions close to the interface than in the interior volume, i.e., the elastic strain is not uniformly distributed but have a gradient. The maximal compressive strain is −8 × 10⁻⁴. It should be noted that the maximum compressive strains are located about 2–5 µm from the interface. As demonstrated by recent finite element modelling [52], it is very likely that the strain fluctuation in this range is a result of the local anisotropy of the internal structure of graphite nodules.

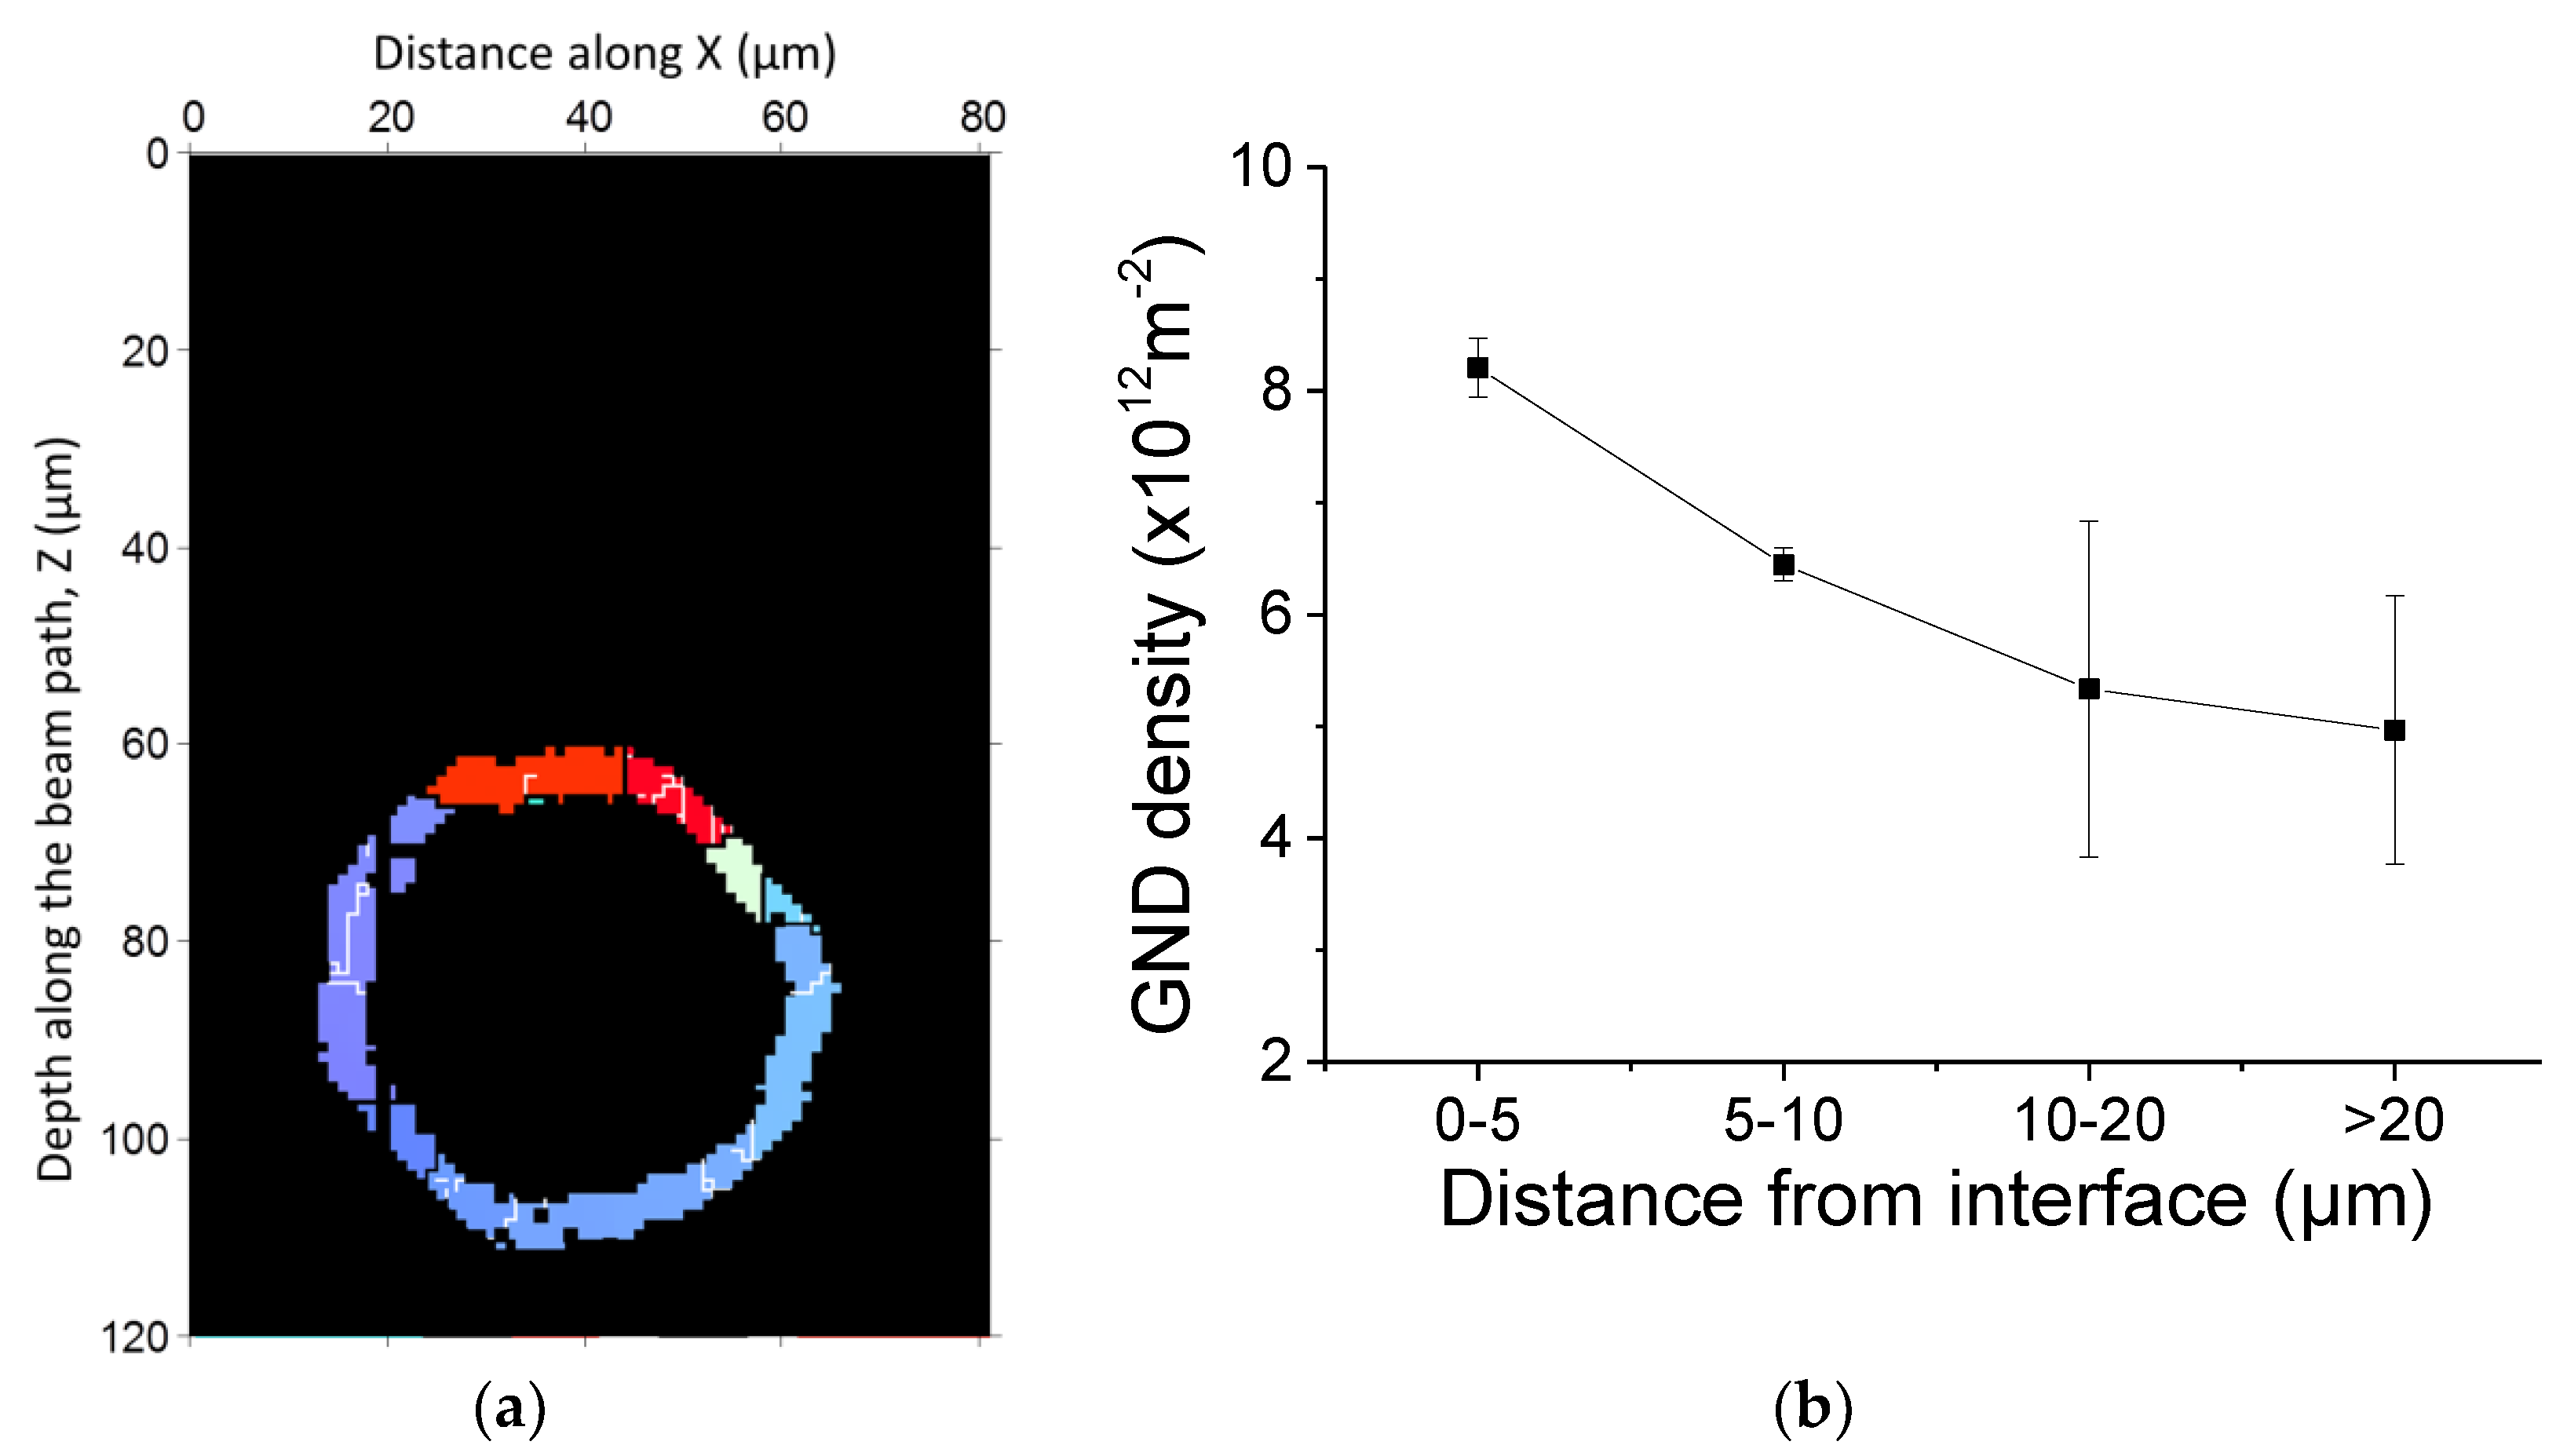
4.3. Quantification of Geometrically Necessary Dislocation Density

As only one strain component is determined here, it is not possible to precisely determine the contribution from elastic stress to the lattice curvature. However, a simple estimation based on Figure 5 is conducted. Assuming the strain gradient along the vertical direction seen in Figure 5 is due to bending, the maximum and average elastic strain gradients of ~1 × 10⁻⁴/µm and ~2 × 10⁻⁵/µm correspond to lattice misorientations between neighboring voxels along the bending direction of 0.006° and 0.001°, respectively. As most of the misorientation angles observed in Figure 4 are higher than 0.01°, it is, therefore, reasonable to assume that the contribution from elastic stresses to the lattice distortion can be neglected in this sample.
The lower bound of the GND density can be determined using Equation (2). To study the interaction between the graphite nodule and the metal matrix, GND densities within regions at different distance from the nodule/matrix interface are calculated (see Figure 6). It is found that the average GND densities are large at places close to the nodule, and decrease with increasing distance from the nodule/matrix interface. The maximum average GND density is ~8 × 10¹² m−2 at the graphite nodule, while the average GND density in the matrix away (>20 µm) from nodule is ~ 5 × 10¹² m−2.

4.4. Discussion

With DAXM, it is now possible to prove the existence of the thermal residual stresses around graphite nodules in DCI. It is evident that the thermal stresses have led to plastic deformation in the ferrite matrix grains during cooling (see Figure 4). When the matrix is plastically deformed, part of the thermal residual stresses is released, and the rest remains in the elastic form (see Figure 5). Another important observation is that both plastic and elastic fields originated from thermal stresses are not uniform, but exhibit gradients from the nodule/matrix to the interior of the matrix. The affected range of the thermal residual stresses is about 20 µm, which is close to the radius of the investigated nodule of 25 µm. On the other hand, the presence of both the plastic and elastic strain gradients is an important input for understanding the development of thermal stresses during cooling of DCI [38,39,50].
The level of the thermal residual stresses can be crudely estimated based on the measured elastic strain by means of the direction-dependent Young’s modulus. The Young’s modulus along the [3 2 −5] directions is ~220 GPa using the elastic constants for pure iron [53]. The maximum thermal residual stress at the characterized graphite nodule is therefore about 175 MPa, which is more than half of the yield stress of the matrix strength [54]. The residual stresses in the matrix grains therefore cannot be neglected for the mechanical properties.
In addition, it is known that the cooling rate is an important factor influencing the microstructure and properties of DCI. For the same chemical composition, increasing cooling rate typically refines the structure and affects the mechanical properties of DCI [51,55,56]. More characterization and analysis on DCI manufactured with different cooling rates are required to clarify the effects of the cooling rate and hence also the size of graphite nodules on the thermal residual stresses.

5. Local Residual Stress in Single Phase Metals

When deformed metals are annealed, recrystallized grains will nucleate and grow consuming the surrounding deformation matrix [57]. Although the recrystallized grains and its surrounding matrix in a partially recrystallized sample are of the same phase, they are typically considered as soft and hard “phases”, respectively, due to their different hardness [58]. In that sense, partially recrystallized pure metals can also be considered as a type of composite material. It is however unknown whether significant local residual stresses develop between recrystallized grains and their surrounding matrix during recrystallization. This knowledge is important for understanding the mechanical properties of partially recrystallized materials [59,60] and may be critical for the microstructural evolution during subsequent annealing or deformation.
In the following, some new results showing the residual elastic strains within recrystallized grains in partially recrystallized nickel measured using DAXM are presented. The sample was deformed by accumulative roll bonding (ARB) to a von Mises strain of 4.8, followed by annealing at 220 °C for 15 min and air cooling to room temperature. More details about the sample can be found in [61,62].

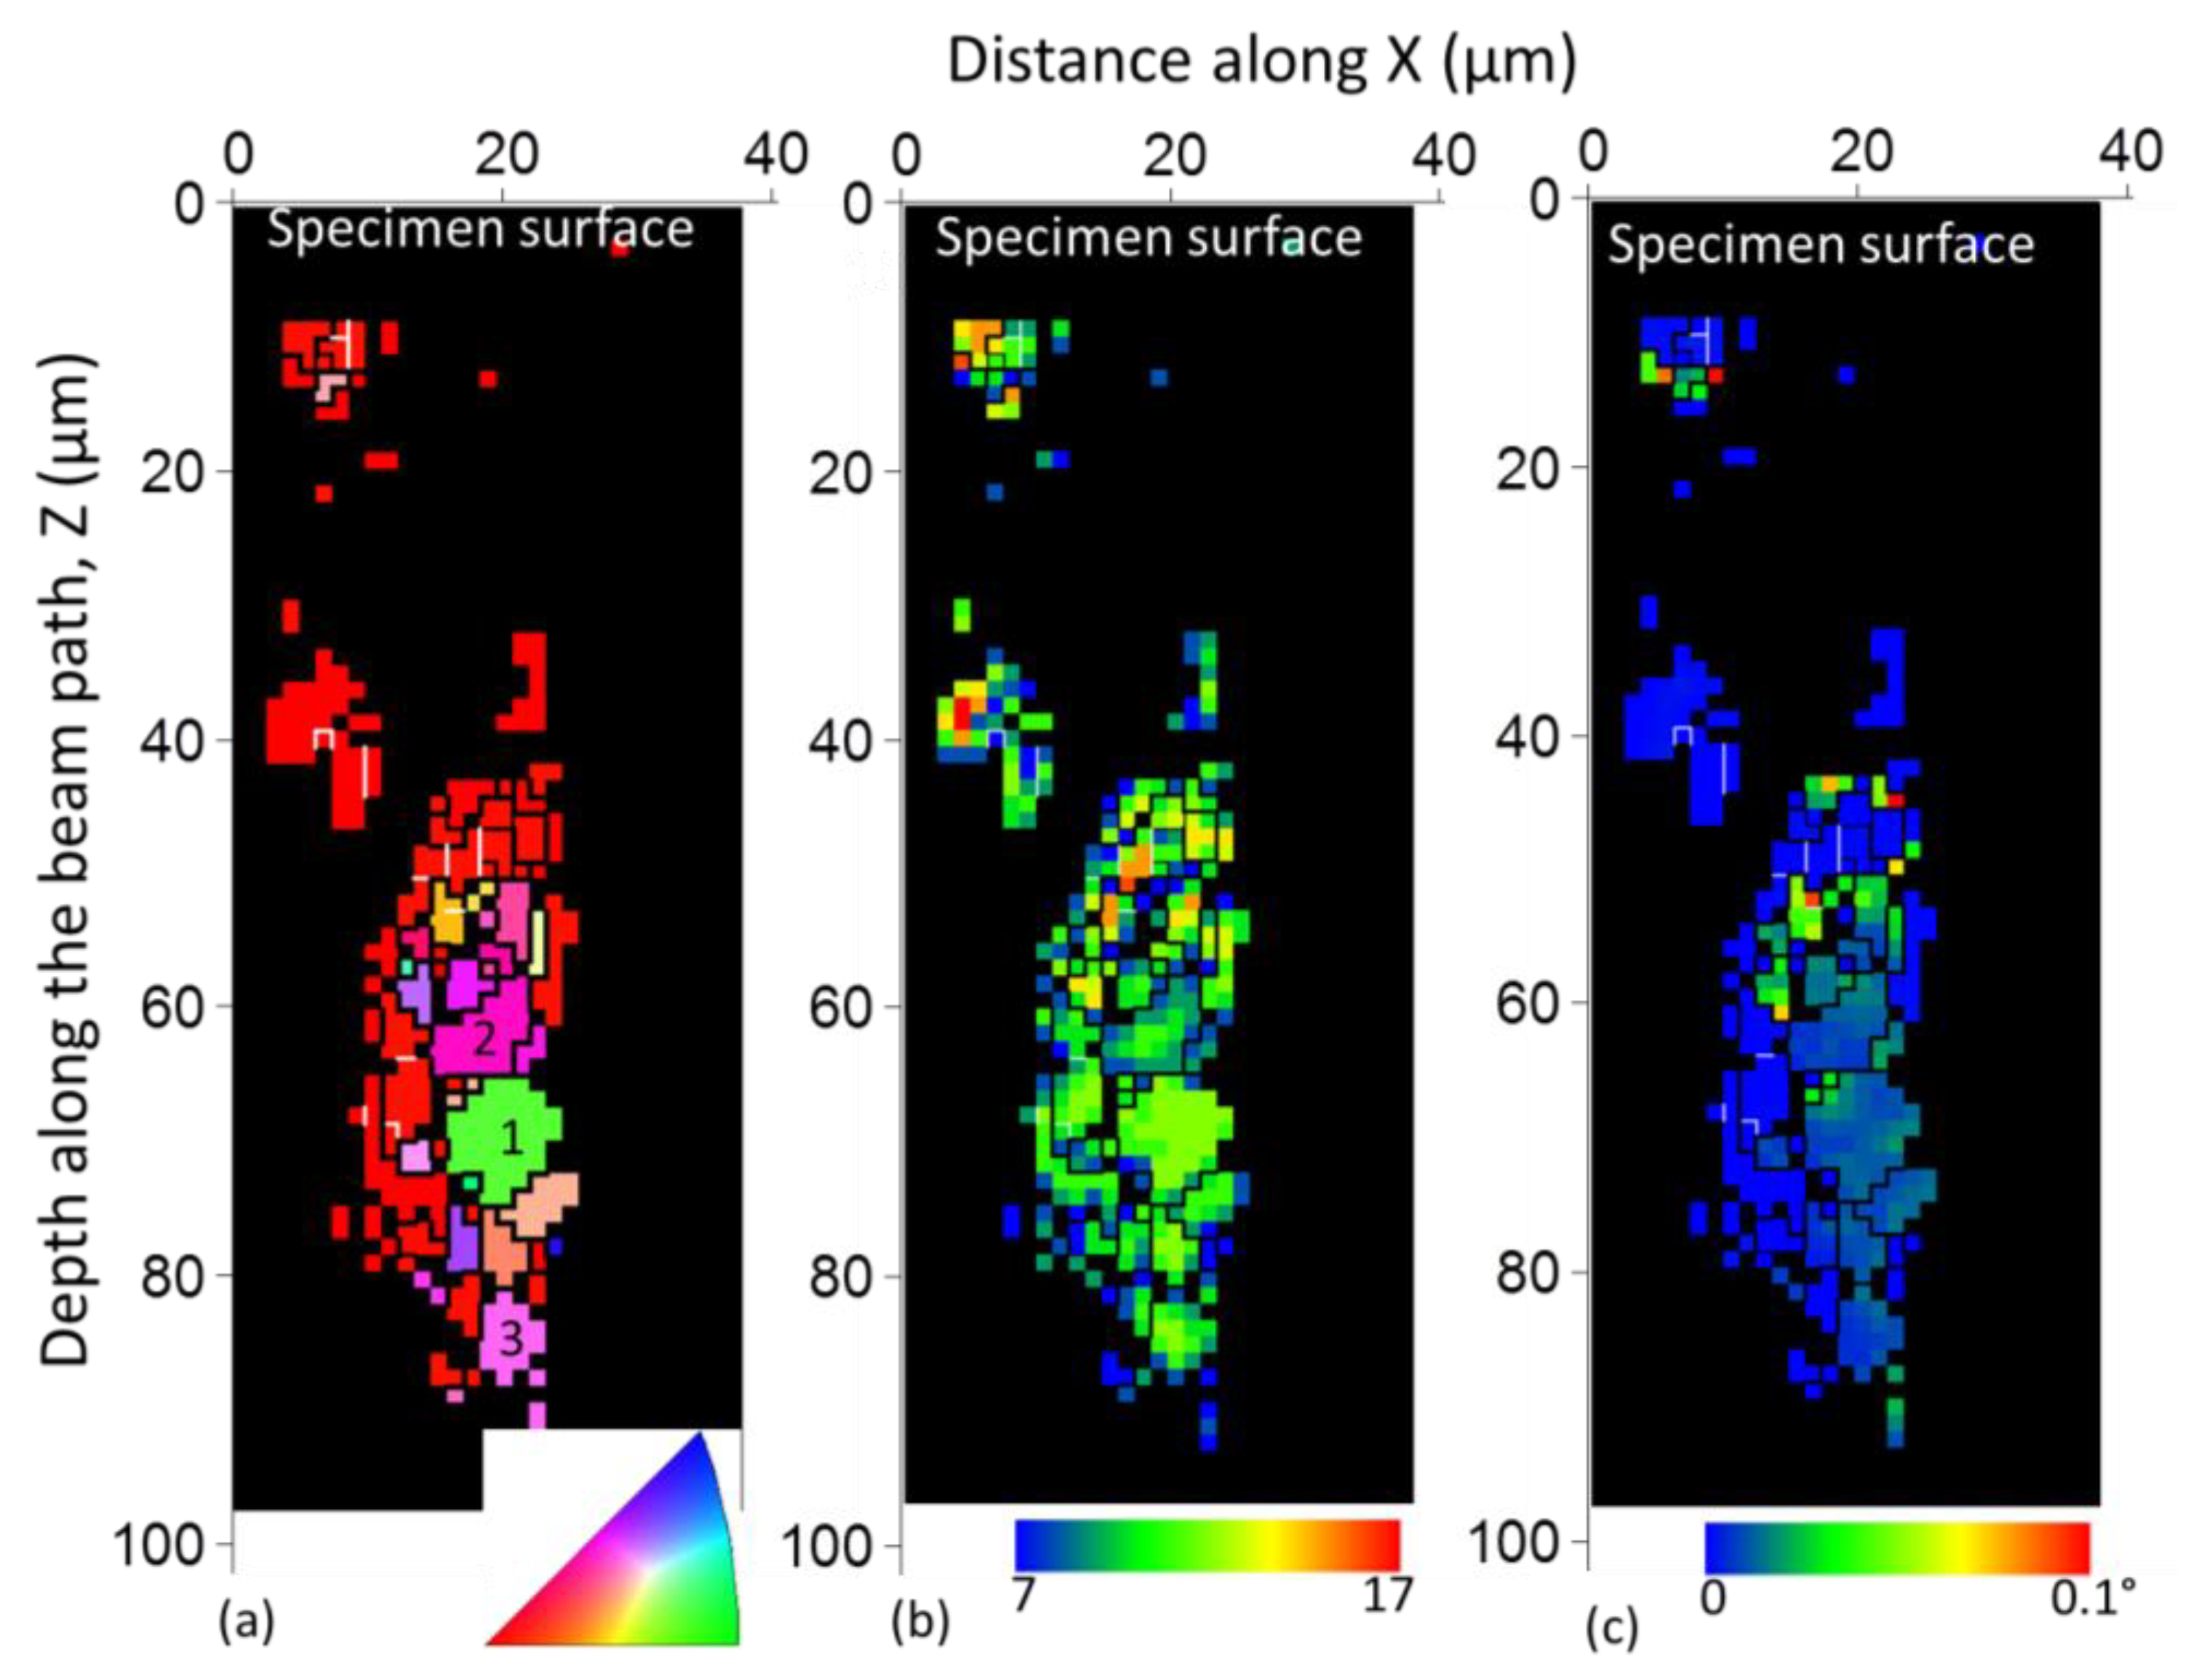
5.1. Microstrucure of Partially Recrystallized Ni Processed by Accumulative Roll Bonding
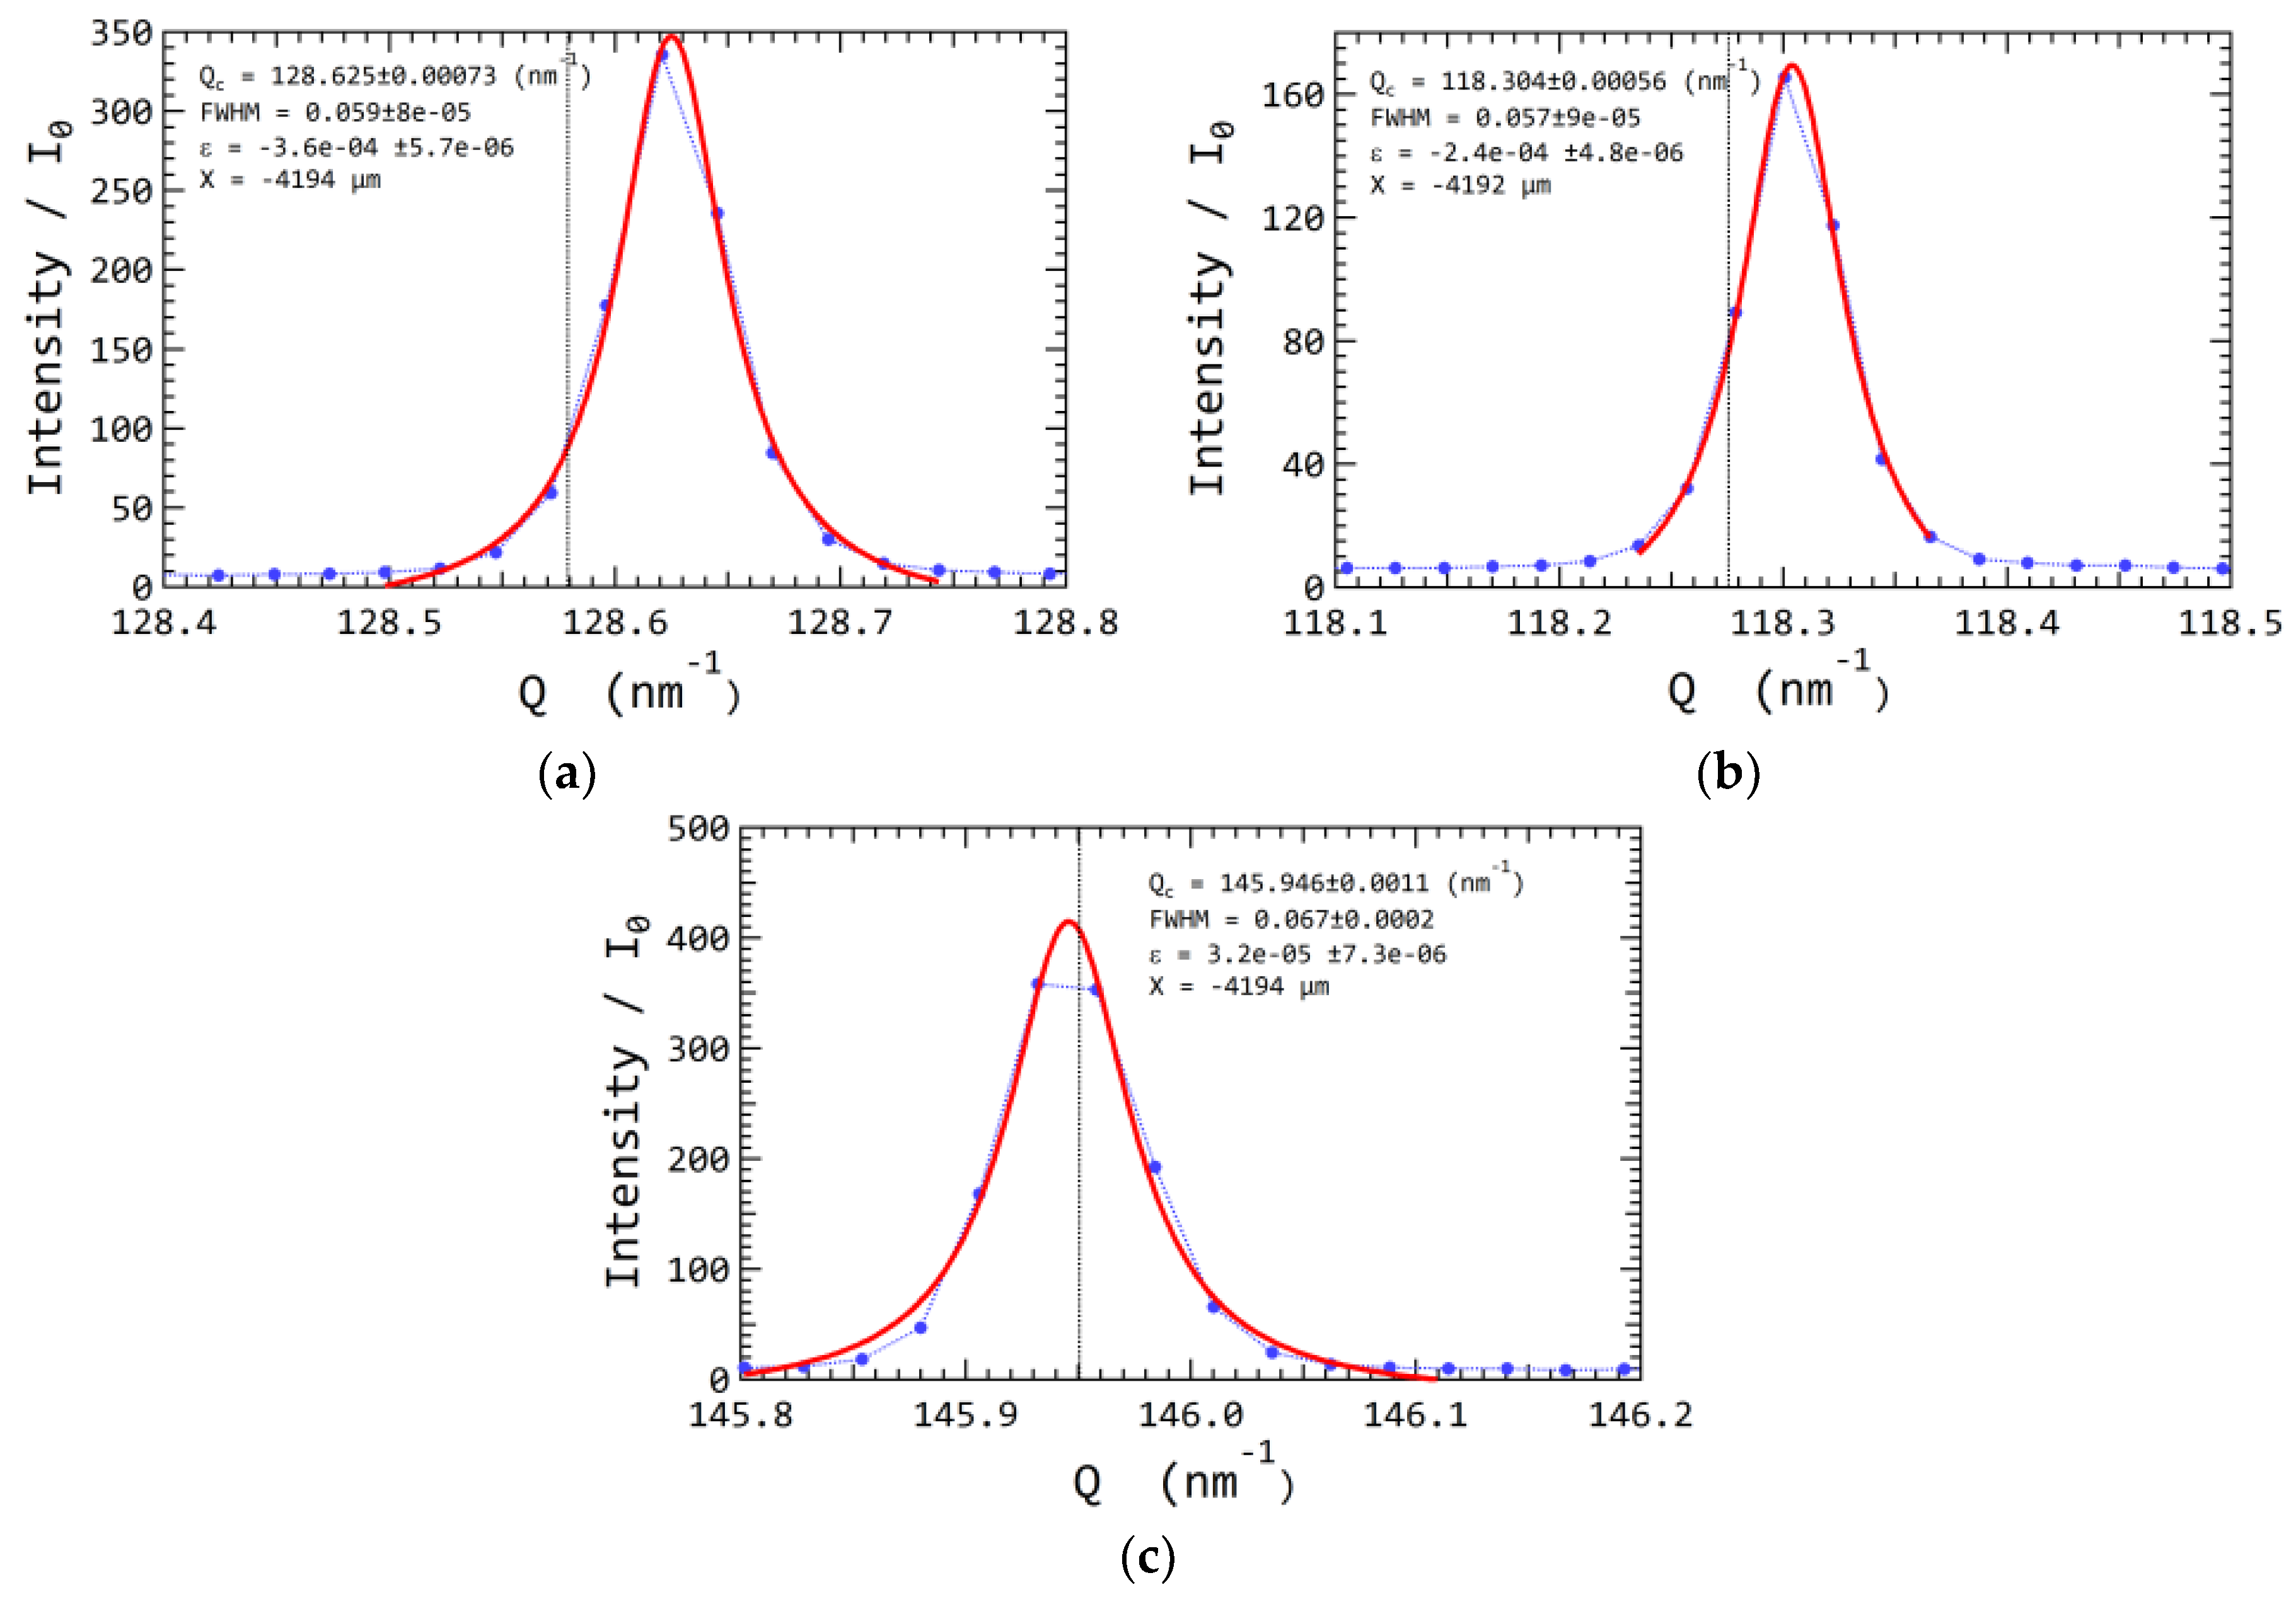
The microstructure of the sample characterized using DAXM is shown in Figure 7. Due to the high density of defects in the deformed grains after severe plastic deformation [61], it is difficult to index the deformed matrix by DAXM. Within the characterized region, most indexed grains are recrystallized grains, as the internal misorientations within these grains are relatively low. The KAM map (Figure 7b) shows that within recrystallized grains small orientation variations up to 0.03° are seen, which agrees to the previous results [63]. The lower bound of the GND density within recrystallized grains calculated using Equation (2) is about 1.5–2.5 × 10¹² m−2.

5.2. Elastic Strain

Three grains marked in Figure 7a were selected for monochromatic energy scan to determine the lattice elastic strains along the sample normal direction. Some examples of intensity distribution as a function of Q for the three selected grains are shown in Figure 8. With a reference lattice parameter of 0.35238 nm (JCPDS file #04-0850), the elastic strains are determined and given in the figures. It is seen that different recrystallized grains have different elastic strains and a strain difference of ~3.6 × 10⁻⁴ between grain 1 and 3 is observed. The lattice parameter for the present nickel may be different from the used value; however, the difference in elastic strain between different grains indicates evidently the existing of the residual stresses within the recrystallized grains.

5.3. Discussion

There are several possible reasons for the formation of residual stresses in the recrystallized grains. (i) The density of the recrystallized grains is slightly higher than that of the surrounding matrix, due to the decrease in defects density. As a result, the volumes of recrystallized grains are smaller compared to the consumed deformation matrix, which may lead to elastic strains in the recrystallized grains; (ii) The local stresses within the subgrain interiors of deformed grains are typically tensile, while the stresses within the cell-wall boundaries are typically compressive [25,27]. If recrystallized grains nucleate from subgrains and grow consuming their neighbors, the stresses within the subgrains will be rearranged and some may be stored within the recrystallized grains. More experimental characterization of residual strains within recrystallized grains for samples deformed to different strains, with different recrystallization fraction, and prepared with different cooling rates, are required to clarify the underlying mechanisms.

6. Conclusions and Outlook

With the current DAXM experimental set-up, 3D microstructure and local elastic strains within specific phase(s) of multiphase materials can be characterized with a spatial resolution of ~500 nm, an angular resolution of 0.01°, and a strain resolution of 1 × 10⁻⁴. Its non-destructive nature allows 3D and even 4D (3D + time) measurements within volumes fully embedded in the bulk, where the strain/stress state are more representative and not released by sample preparation. As demonstrated by the two case studies, these advantages make DAXM a very powerful tool providing unprecedented results for studying the formation of local residual stresses at grain/phase boundaries, and their interaction with local microstructure. Such results are essential for understanding the materials mechanical properties. For the two case studies, it is found that:
(i)
Local thermal stress has developed at graphite nodules during cooling of DCI and led to plastic deformation of the ferrite matrix, which in turn relaxes part of the stress. Compressive elastic strains along specimen normal direction are observed. Both plastic and elastic strains exhibit gradients, with maximum at or near the interface and decrease into the matrix.
(ii)
Local elastic strain variation of 3.6 × 10⁻⁴ was observed within recrystallized grains in partially recrystallized nickel. Similar to previous studies, the recrystallized grains contain dislocations of about 1012 m−2. The presence of dislocations and the variations of local elastic strains are important for understanding the recrystallization process.
With the current third generation synchrotron source, the scanning time for a reasonable sized 3D orientation mapping is still quite long, in the order of days [35,36]. Similarly, 3D strain mapping is also slow, as only one strain component of a selected grain is mapped a time by monochromatic energy scan (see Figure 2 and Figure 3). The situation becomes worse when the sample is further deformed, which leads to an increase in defect density, orientation spread, and strain gradient, which prolongs the exposure time and extends the scanning range of the X-ray energy [64]. Some characterization using electron microscopy and laboratory micro-CT prior to synchrotron experiments are thus usually useful for the site selection and to ensure the success of the beamtime [35,36,38]. Additionally, full stress tensor mapping, which requires strain mapping of at least three components along widely deviated directions, is currently possible [65,66,67], but is still not frequently used due to the technical complication.
Presently, the fourth-generation synchrotron source is already available at MAXIV in Lund, Sweden [68]. Several large synchrotron facilities, e.g., European Synchrotron Radiation Facility and APS are planning to upgrade to the next generation [69,70], with aim to increase the undulator source brightness by a factor of ~100. Since the K-B mirror optics form an image of the source, the brightness at the focus should also increase by the same factor. As a result, a spatial resolution of 50 nm and at least 10 times increased counts/sec will be achievable, implying that dynamic studies during deformation and/or annealing on ultrafine-grained or even nanocrystalline materials will be possible with DAXM in the near future.

Funding

This project was supported by the Danish Council for Independent Research Fund (8022-00340B).

Acknowledgments

The authors thank D. Juul Jensen for the useful comments during the preparation of the manuscript. The instrument center Danscatt is acknowledged for travel refund (7055-00005B). Lars Lorentzen at DTU Wind Energy is acknowledged for the help with sample preparation. Use of the Advanced Photon Source was supported by the U. S. Department of Energy, Office of Science, Office of Basic Energy Sciences, under Contract No. DE-AC02-06CH11357.

Conflicts of Interest

The authors declare no conflict of interest.

References

  1. Withers, P.J.; Bhadeshia, H.K.D.H. Residual stress. Part 2—Nature and origins. Mater. Sci. Technol. 2001, 17, 366–375. [Google Scholar] [CrossRef]
  2. Withers, P.J.; Bhadeshia, H.K.D.H. Residual stress Part 1—Measurement techniques. Mater. Sci. Technol. 2001, 17, 355–365. [Google Scholar]
  3. Ho, S.; Lavernia, E.J. Thermal residual stresses in metal matrix composites: A review. Appl. Compos. Mater. 1995, 2, 1–30. [Google Scholar] [CrossRef]
  4. Withers, P.J. Residual stress and its role in failure. Rep. Prog. Phys. 2007, 70, 2211–2264. [Google Scholar] [CrossRef]
  5. Poulsen, H.F. Three-Dimensional X-ray Microscopy: Mapping Polycrystals and Their Dynamics; Springer: New York, NY, USA, 2004; ISBN 9783540444831. [Google Scholar]
  6. Oddershede, J.; Schmidt, S.; Poulsen, H.F.; Sørensen, H.O.; Wright, J.; Reimers, W. Determining grain resolved stresses in polycrystalline materials using three-dimensional X-ray diffraction. J. Appl. Crystallogr. 2010, 43, 539–549. [Google Scholar] [CrossRef]
  7. Poulsen, H.F. An introduction to three-dimensional X-ray diffraction microscopy. J. Appl. Crystallogr. 2012, 45, 1084–1097. [Google Scholar] [CrossRef]
  8. Pantleon, W.; Wejdemann, C.; Jakobsen, B.; Lienert, U.; Poulsen, H.F. Advances in characterization of deformation structures by high resolution reciprocal space mapping. In Proceedings of the 31st Risø International Symposium on Materials Science, Roskilde, Denmark, 6–10 September 2010; pp. 79–100. [Google Scholar]
  9. Jakobsen, B.; Poulsen, H.F.; Lienert, U.; Almer, J.; Shastri, S.D.; Sørensen, H.O.; Gundlach, C.; Pantleon, W. Formation and subdivision of deformation structures during plastic deformation. Science 2006, 312, 889–892. [Google Scholar] [CrossRef] [PubMed]
  10. Lienert, U.; Li, S.F.; Hefferan, C.M.; Lind, J.; Suter, R.M.; Bernier, J.V.; Barton, N.R.; Brandes, M.C.; Mills, M.J.; Miller, M.P.; et al. High-energy diffraction microscopy at the advanced photon source. JOM 2011, 63, 70–77. [Google Scholar] [CrossRef]
  11. Li, S.F.; Suter, R.M. Adaptive reconstruction method for three-dimensional orientation imaging. J. Appl. Crystallogr. 2013, 46, 512–524. [Google Scholar]
  12. Ludwig, W.; Schmidt, S.; Lauridsen, E.M.; Poulsen, H.F. X-ray diffraction contrast tomography: A novel technique for three-dimensional grain mapping of polycrystals. I. Direct beam case. J. Appl. Crystallogr. 2008, 41, 302–309. [Google Scholar]
  13. Reischig, P.; King, A.; Nervo, L.; Viganó, N.; Guilhem, Y.; Palenstijn, W.J.; Batenburg, K.J.; Preuss, M.; Ludwig, W. Advances in X-ray diffraction contrast tomography: Flexibility in the setup geometry and application to multiphase materials. J. Appl. Crystallogr. 2013, 46, 297–311. [Google Scholar] [CrossRef]
  14. Simons, H.; King, A.; Ludwig, W.; Detlefs, C.; Pantleon, W.; Schmidt, S.; Snigireva, I.; Snigirev, A.; Poulsen, H.F. Dark-field X-ray microscopy for multiscale structural characterization. Nat. Commun. 2015, 6, 1–6. [Google Scholar] [CrossRef] [PubMed]
  15. Yau, A.; Cha, W.; Kanan, M.W.; Matthew, W.; Stephenson, G.B.; Ulvestad, A. Bragg coherent diffractive imaging of single-grain defect dynamics in polycrystalline films. Science 2017, 356, 739–742. [Google Scholar] [CrossRef] [PubMed]
  16. Robinson, I.; Harder, R. Coherent X-ray diffraction imaging of strain at the nanoscale. Nat. Mater. 2009, 8, 291. [Google Scholar] [CrossRef] [PubMed]
  17. Cornelius, T.; Thomas, O. Progress of in situ synchrotron X-ray diffraction studies on the mechanical behavior of materials at small scales. Prog. Mater. Sci. 2018, 94, 384–434. [Google Scholar] [CrossRef]
  18. Larson, B.; Yang, W.; Ice, G.; Budai, J.; Tischler, J. Three-dimensional X-ray structural microscopy with submicrometre resolution. Nature 2002, 415, 887–890. [Google Scholar] [CrossRef] [PubMed]
  19. Levine, L.E.; Larson, B.C.; Yang, W.; Kassner, M.E.; Tischler, J.Z.; Delos-Reyes, M.A.; Fields, R.J.; Liu, W. X-ray microbeam measurements of individual dislocation cell elastic strains in deformed single-crystal copper. Nat. Mater. 2006, 5, 619–622. [Google Scholar] [CrossRef] [PubMed]
  20. Ice, G.E.; Budai, J.D.; Pang, J.W.L. The race to X-ray microbeam and nanobeam science. Science 2011, 334, 1234–1239. [Google Scholar] [CrossRef] [PubMed]
  21. Larson, B.C.; Levine, L.E. Submicrometre-resolution polychromatic three-dimensional X-ray microscopy. J. Appl. Crystallogr. 2013, 46, 153–164. [Google Scholar] [CrossRef]
  22. Ice, G.E.; Pang, J.W.L.; Barabash, R.I.; Puzyrev, Y. Characterization of three-dimensional crystallographic distributions using polychromatic X-ray microdiffraction. Scr. Mater. 2006, 55, 57–62. [Google Scholar] [CrossRef]
  23. Ice, G.E.; Pang, J.W.L. Tutorial on X-ray microLaue diffraction. Mater. Charact. 2009, 60, 1191–1201. [Google Scholar] [CrossRef]
  24. Ohashi, T.; Barabash, R.I.; Pang, J.W.L.; Ice, G.E.; Barabash, O.M. X-ray microdiffraction and strain gradient crystal plasticity studies of geometrically necessary dislocations near a Ni bicrystal grain boundary. Int. J. Plast. 2009, 25, 920–941. [Google Scholar] [CrossRef]
  25. Levine, L.E.; Geantil, P.; Larson, B.C.; Tischler, J.Z.; Kassner, M.E.; Liu, W.; Stoudt, M.R.; Tavazza, F. Disordered long-range internal stresses in deformed copper and the mechanisms underlying plastic deformation. Acta Mater. 2011, 59, 5803–5811. [Google Scholar] [CrossRef]
  26. Levine, L.E.; Geantil, P.; Larson, B.C.; Tischler, J.Z.; Kassner, M.E.; Liu, W. Validating classical line profile analyses using microbeam diffraction from individual dislocation cell walls and cell interiors. J. Appl. Crystallogr. 2012, 45, 157–165. [Google Scholar] [CrossRef]
  27. Kassner, M.E.; Geantil, P.; Levine, L.E. Long range internal stresses in single-phase crystalline materials. Int. J. Plast. 2013, 45, 44–60. [Google Scholar] [CrossRef]
  28. Barabash, R.I.; Gao, Y.F.; Ice, G.E.; Barabash, O.M.; Chung, J.S.; Liu, W.; Kroger, R.; Lohmeyer, H.; Sebald, K.; Gutowski, J.; et al. Mapping strain gradients in the FIB-structured InGaN/GaN multilayered films with 3D X-ray microbeam. Mater. Sci. Eng. A 2010, 528, 52–57. [Google Scholar] [CrossRef]
  29. Barabash, R.I.; Liu, W.; Tischler, J.Z.; Bei, H.; Budai, J.D. Phase-specific elastic/plastic interface interactions in layered NiAl-Cr(Mo) structures. Acta Mater. 2012, 60, 3279–3286. [Google Scholar] [CrossRef]
  30. Barabash, R.I.; Barabash, O.M.; Ojima, M.; Yu, Z.; Inoue, J.; Nambu, S.; Koseki, T.; Xu, R.; Feng, Z. Interphase strain gradients in multilayered steel composite from microdiffraction. Metall. Mater. Trans. A 2014, 45, 98–108. [Google Scholar] [CrossRef]
  31. Barabash, R.I.; Ice, G.E.; Liu, W.; Einfeldt, S.; Hommel, D.; Roskowski, A.M.; Davis, R.F. White X-ray microbeam analysis of strain and crystallographic tilt in GaN layers grown by maskless pendeoepitaxy. Phys. Status Solidi Appl. Mater. Sci. 2005, 202, 732–738. [Google Scholar] [CrossRef]
  32. Barabash, R.I.; Roder, C.; Ice, G.E.; Einfeldt, S.; Budai, J.D.; Barabash, O.M.; Figge, S.; Hommel, D. Spatially resolved distribution of dislocations and crystallographic tilts in GaN layers grown on Si(111) substrates by maskless cantilever epitaxy. J. Appl. Phys. 2006, 100, 1–11. [Google Scholar] [CrossRef]
  33. Bei, H.; Barabash, R.I.; Ice, G.E.; Liu, W.; Tischler, J.; George, E.P. Spatially resolved strain measurements in Mo-alloy micropillars by differential aperture X-ray microscopy. Appl. Phys. Lett. 2008, 93, 3–5. [Google Scholar] [CrossRef]
  34. Barabash, R.I.; Bei, H.; Gao, Y.F.; Ice, G.E. Interface strength in NiAl-Mo composites from 3-D X-ray microdiffraction. Scr. Mater. 2011, 64, 900–903. [Google Scholar] [CrossRef]
  35. Zhang, Y.B.; Budai, J.D.; Tischler, J.Z.; Liu, W.; Xu, R.; Homer, E.R.; Godfrey, A.; Juul Jensen, D. Boundary migration in a 3D deformed microstructure inside an opaque sample. Sci. Rep. 2017, 7, 04087. [Google Scholar] [CrossRef] [PubMed]
  36. Xu, C.; Zhang, Y.; Godfrey, A.; Wu, G.; Liu, W.; Tischler, J.Z.; Juul Jensen, D. Direct observation of nucleation in the bulk of an opaque sample. Sci. Rep. 2017, 7, 42508. [Google Scholar] [CrossRef] [PubMed]
  37. Gao, Y.F.; Larson, B.C.; Lee, J.H.; Nicola, L.; Tischler, J.Z.; Pharr, G.M. Lattice Rotation Patterns and Strain Gradient Effects in Face-Centered-Cubic Single Crystals Under Spherical Indentation. J. Appl. Mech. 2015, 82, 061007. [Google Scholar] [CrossRef]
  38. Zhang, Y.B.; Andriollo, T.; Fæster, S.; Liu, W.; Hattel, J.; Barabash, R.I. Three-dimensional local residual stress and orientation gradients near graphite nodules in ductile cast iron. Acta Mater. 2016, 121, 173–180. [Google Scholar] [CrossRef]
  39. Zhang, Y.B.; Andriollo, T.; Fæster, S.; Liu, W.; Sturlason, A.; Barabash, R.I. Synchrotron measurements of local microstructure and residual strains in ductile cast iron. IOP Conf. Ser. Mater. Sci. Eng. 2017, 219, 012054. [Google Scholar] [CrossRef] [Green Version]
  40. Ice, G.E.; Larson, B.C.; Yang, W.; Budai, J.D.; Tischler, J.Z.; Pang, J.W.L.; Barabash, R.I.; Liu, W. Polychromatic X-ray microdiffraction studies of mesoscale structure and dynamics. J. Synchrotron Radiat. 2005, 12, 155–162. [Google Scholar] [CrossRef] [PubMed]
  41. Barabash, R.I.; Ice, G.E.; Larson, B.C.; Yang, W. Application of white X-ray microbeams for the analysis of dislocation structures. Rev. Sci. Instrum. 2002, 73, 1652–1654. [Google Scholar] [CrossRef]
  42. Ice, G.E.; Barabash, R.I. White Beam Microdiffraction and Dislocations Gradients. In Dislocations Solids; Hirth, J.P., Nabarro, F.R.N., Eds.; Elsevier: Amsterdam, Netherlands, 2007; Volume 13, pp. 499–601. [Google Scholar]
  43. Liu, W.; Zschack, P.; Tischler, J.; Ice, G.E.; Larson, B. X-ray laue diffraction microscopy in 3D at the advanced photon source. AIP Conf. Proc. 2010, 1365, 108–111. [Google Scholar]
  44. Tischler, J.Z. Reconstructing 2D and 3D X-ray Orientation Maps from White-Beam Laue. In Strain Dislocation Gradients from Diffraction; Barabash, R.I., Ice, G.E., Eds.; World Scientific: London, UK, 2014; pp. 358–375. [Google Scholar]
  45. Kubin, L.P.; Mortensen, A. Geometrically necessary dislocations and strain-gradient plasticity: A few critical issues. Scr. Mater. 2003, 48, 119–125. [Google Scholar] [CrossRef]
  46. Gao, H.; Hang, Y.; Nix, W.D.; Hutchinson, J.W. Mechanism-based strain gradient plasticity—I. Theory. J. Mech. Phys. Solids 1999, 47, 1239–1263. [Google Scholar] [CrossRef]
  47. Calcagnotto, M.; Ponge, D.; Demir, E.; Raabe, D. Orientation gradients and geometrically necessary dislocations in ultrafine grained dual-phase steels studied by 2D and 3D EBSD. Mater. Sci. Eng. A 2010, 527, 2738–2746. [Google Scholar] [CrossRef]
  48. Labrecque, C.; Gagne, M. Review ductile iron: Fifty years of continuous development. Can. Metall. Q. 1998, 37, 343–378. [Google Scholar] [CrossRef]
  49. Hütter, G.; Zybell, L.; Kuna, M. Micromechanisms of fracture in nodular cast iron: From experimental findings towards modeling strategies—A review. Eng. Fract. Mech. 2015, 144, 118–141. [Google Scholar] [CrossRef]
  50. Andriollo, T.; Thorborg, J.; Tiedje, N.; Hattel, J. A micro-mechanical analysis of thermo-elastic properties and local residual stresses in ductile iron based on a new anisotropic model for the graphite nodules. Model. Simul. Mater. Sci. Eng. 2016, 24, 055012. [Google Scholar] [CrossRef] [Green Version]
  51. Mukherjee, K.; Fæster, S.; Hansen, N.; Dahl, A.B.; Gundlach, C.; Frandsen, J.O.; Sturlason, A. Graphite nodules in fatigue-tested cast iron characterized in 2D and 3D. Mater. Charact. 2017, 129, 169–178. [Google Scholar] [CrossRef]
  52. Andriollo, T.; Hellström, K.; Sonne, M.R.; Thorborg, J.; Tiedje, N.; Hattel, J. Uncovering the local inelastic interactions during manufacture of ductile cast iron: How the substructure of the graphite particles can induce residual stress concentrations in the matrix. J. Mech. Phys. Solids 2018, 111, 333–357. [Google Scholar] [CrossRef]
  53. Hashin, Z.; Shtrikman, S.A. Variational approach to the theory of the elastic behaviour of polycrystals. J. Mech. Phys. Solids 1962, 10, 343–352. [Google Scholar] [CrossRef]
  54. Bonora, N.; Ruggiero, A. Micromechanical modeling of ductile cast iron incorporating damage. Part I: Ferritic ductile cast iron. Int. J. Solids Struct. 2005, 42, 1401–1424. [Google Scholar] [CrossRef]
  55. Górny, M.; Stefanescu, D.M. Thin-wall ductile iron castings. In ASM Handbook, Cast Iron Science and Technology; Stefanescu, D.M., Ed.; ASM International: Metals Park, OH, USA, 2017; pp. 617–628. [Google Scholar]
  56. Górny, M.; Tyrała, E. Effect of cooling rate on microstructure and mechanical properties of thin-walled ductile iron castings. J. Mater. Eng. Perform. 2013, 22, 300–305. [Google Scholar] [CrossRef]
  57. Humphreys, F.J.; Hatherly, M. Recrystallization and Related Annealing Phenomena; Elsevier: Amsterdam, The Netherlands, 2004. [Google Scholar]
  58. Lin, F.; Zhang, Y.; Tao, N.; Pantleon, W.; Juul Jensen, D. Effects of heterogeneity on recrystallization kinetics of nanocrystalline copper prepared by dynamic plastic deformation. Acta Mater. 2014, 72, 252–261. [Google Scholar] [CrossRef] [Green Version]
  59. Wu, X.; Yang, M.; Yuan, F.; Wu, G.; Wei, Y.; Huang, X.; Zhu, Y. Heterogeneous lamella structure unites ultrafine-grain strength with coarse-grain ductility. Proc. Natl. Acad. Sci. USA 2015, 112, 14501–14505. [Google Scholar] [CrossRef] [PubMed] [Green Version]
  60. Zhang, L.; Chen, Z.; Wang, Y.; Ma, G.; Huang, T.; Wu, G.; Huang, X.; Juul Jensen, D. Fabricating interstitial-free steel with simultaneous high strength and good ductility with homogeneous layer and lamella structure. Scr. Mater. 2017, 141, 111–114. [Google Scholar] [CrossRef]
  61. Zhang, Y.B.; Mishin, O.V.; Kamikawa, N.; Godfrey, A.; Liu, W.; Liu, Q. Microstructure and mechanical properties of nickel processed by accumulative roll bonding. Mater. Sci. Eng. A 2013, 576, 160–166. [Google Scholar] [CrossRef] [Green Version]
  62. Mishin, O.V.; Zhang, Y.B.; Godfrey, A. The influence of multiscale heterogeneity on recrystallization in nickel processed by accumulative roll bonding. J. Mater. Sci. 2017, 52, 2730–2745. [Google Scholar] [CrossRef]
  63. Ahl, S.R.; Simons, H.; Zhang, Y.B.; Detlefs, C.; Stöhr, F.; Jakobsen, A.C.; Juul Jensen, D.; Poulsen, H.F. Ultra-low-angle boundary networks within recrystallizing grains. Scr. Mater. 2017, 139, 87–91. [Google Scholar] [CrossRef]
  64. Dhar, S.; Zhang, Y.; Xu, R.; Danielsen, H.K.; Juul Jensen, D. Synchrotron X-ray measurement of residual strain within the nose of a worn manganese steel railway crossing. IOP Conf. Ser. Mater. Sci. Eng. 2017, 219, 012016. [Google Scholar] [CrossRef] [Green Version]
  65. Okoro, C.; Levine, L.E.; Xu, R.; Hummler, K.; Obeng, Y. Synchrotron-based measurement of the impact of thermal cycling on the evolution of stresses in Cu through-silicon vias. J. Appl. Phys. 2014, 115, 243509. [Google Scholar] [CrossRef]
  66. Phan, T.Q.; Levine, L.E.; Lee, I.F.; Xu, R.; Tischler, J.Z.; Huang, Y.; Langdon, T.G.; Kasssner, M.E. Synchrotron X-ray microbeam diffraction measurements of full elastic long range internal strain and stress tensors in commercial-purity aluminum processed by multiple passes of equal-channel angular pressing. Acta Mater. 2016, 112, 231–241. [Google Scholar] [CrossRef] [Green Version]
  67. Levine, L.E.; Okoro, C.; Xu, R. Full elastic strain and stress tensor measurements from individual dislocation cells in copper through-Si vias. IUCrJ 2015, 2, 635–642. [Google Scholar] [CrossRef] [PubMed] [Green Version]
  68. Castelvecchi, D. X-ray science gets an upgrade. Nature 2015, 525, 15–16. [Google Scholar] [CrossRef] [PubMed]
  69. ESRF Upgrade Programme Phase II (2015–2019) White Paper; ESRF: Grenoble, France, 2015.
  70. Haeffner, R. APS-U Beamline Update; APS: St. Paul, MN, USA, 2017. [Google Scholar]
Figure 1. A sketch showing the experimental set-up of the differential aperture X-ray microscopy (DAXM). The Pt wire is used as a differential aperture to resolve where different diffracted signal (represented as colored lines) recorded by the 2D panel detector is originating from within the sample volume illuminated by the focused microbeam.
Qubs 03 00006 g001
Figure 2. Example showing an indexed depth-resolved Laue diffraction pattern of a ferrite grain in ductile cast iron. The hkl indices, X-ray energies, peak positions, and fitting error of the indexing results are listed in the table to the right.
Qubs 03 00006 g002
Figure 3. (a) The diffraction vector, Q, as a function of depth for one energy wire scan for the 32-5 Laue spot in Figure 2; (b) Fitted intensity distribution for the Laue spot for the depth = 83 µm. The center of the fitted Q-distribution, QC, is used to determine the crystallographic plane spacing, d. The dashed line in (b) marks the Q value for d0 of the (3 2 -5) crystallographic plane. The red line is the fitted result using a Gaussian function.
Qubs 03 00006 g003
Figure 4. Crystallographic orientation (a), number of indexed spots (b) and kernel average misorientation (KAM) (c) maps showing the details of the microstructure around a graphite nodule (shown as black sphere-like blocks) characterized using polychromatic DAXM. The colors in (a) represent the crystallographic orientation along the specimen normal direction (see the inset in (a)). In the maps, dislocation boundaries with misorientation angles in the range of 0.1–1°, 1–3°, and >3° are shown in thin white, thin black, and thick black lines, respectively. The individual black pixels in the matrix away from the nodules are non-indexed pixels. To reveal in detail the sub-structure within cells, a cut-off angle of 0.1° is used here for the calculation of KAM values. The white box in (a) marks where the monochromatic energy scans were conducted. (a) is modified from Figure 4 in [38].
Qubs 03 00006 g004
Figure 5. Elastic strain as a function of distance from the nodule/matrix interface for the region marked by the white box in Figure 4. Black part is the graphite nodule. This figure is modified from Figure 6 in [38].
Qubs 03 00006 g005
Figure 6. (a) An example illustrating the subset selection for the calculation of average geometrically necessary dislocation (GND) density: the region within 0–5 µm from the nodule/matrix interface for the nodule shown in Figure 4a. The colors in (a) are the same as in Figure 4a; (b) Average GND density for the matrix grains located at different distances from the nodule/matrix interface.
Qubs 03 00006 g006
Figure 7. Microstructure of partially recrystallized Ni processed by accumulative roll bonding (ARB) characterized by DAXM: (a) Orientation map; (b) map of the number of indexed spots and (c) KAM map. The colors in (a) represent the crystallographic orientation along specimen normal direction (see the inset in (a)). In the maps, boundaries with misorientation angles in the range of 0.1–1°, 1–3°, and >3° are shown in thin white, thin black, and thick black lines, respectively. The black individual pixels/regions are non-indexed. For KAM calculation, a cut-off angle of 0.1° is used. Numbers 1–3 are used to mark grains for monochromatic energy scans.
Qubs 03 00006 g007
Figure 8. (ac) Intensity distribution as a function of diffraction vector Q for three Laue spots for the three grains 1–3 marked in Figure 7a, respectively. The red lines are the fitted results using a Gaussian function.
Qubs 03 00006 g008

