Review

3D Visualized Characterization of Fracture Behavior of Structural Metals Using Synchrotron Radiation Computed Microtomography

1
Center for Analysis and Measurement, Harbin Institute of Technology, Harbin 150001, China
2
School of Materials Science and Engineering, Harbin Institute of Technology, Harbin 150001, China
3
School of Materials Science and Engineering, University of Jinan, Jinan 250000, China
4
Shanghai Synchrotron Radiation Facility, Shanghai Institute of High Energy Applied Physics, Shanghai 200000, China
5
School of Materials Science and Engineering, Dalian University of Technology, Dalian 116000, China
*
Author to whom correspondence should be addressed.
Quantum Beam Sci. 2019, 3(1), 5; https://doi.org/10.3390/qubs3010005
Submission received: 10 December 2018 / Revised: 15 February 2019 / Accepted: 21 February 2019 / Published: 1 March 2019

Abstract

:
Synchrotron radiation computed micro-tomography (SR-μCT) is a non-destructive characterization method in materials science, which provides the quantitative reconstruction of a three-dimension (3D) volume image with spatial resolution of sub-micrometer level. The recent progress in brilliance and flux of synchrotron radiation source has enabled the fast investigation of the inner microstructure of metal matrix composites without complex sample preparation. The 3D reconstruction can quantitatively describe the phase distribution as well as voids/cracks formation and propagation in structural metals, which provides a powerful tool to investigate the deformation and fracture processes. Here, we present an overview of recent work using SR-μCT, on the applications in structural metals.

1. Introduction

Better understanding of the fracture behavior is required for the high-performance design and safe operation of metallic structural materials [1,2]. To reveal the crack nucleation and propagation processes as precisely as possible, scanning electron microscopy (SEM) and surface-based fractography are always utilized to establish the relationships between the fracture behavior and the mechanical properties of metallic structural materials [3,4]. Although these two-dimensional (2D) observations contribute to the achievements made in revealing the fracture behavior to some extent, the effect of the internal microstructure under the 2D surface of the samples on the crack regime was neglected. Actually, stress state of the crack on the surface differs greatly from that in the interior of the samples [5] and the cracking always occurs within the interior of the samples. Therefore, it is necessary to analyze the fracture behavior using three-dimensional (3D) characterization methods.
X-ray computed tomography (CT) as a 3D imaging technique provides an opportunity to solve the aforementioned problems. It is well known that the X-ray beam attenuates, which is caused by the absorption when penetrating an object [6]. For a given incident intensity (I0), the transmitted intensity I(x) of the X-rays is calculated by the equation [7]:
I ( x ) = I 0 e μ x
where μ is the local linear attenuation/absorption coefficient, which correlates with incoherent scattering, coherent scattering and photoelectric effect, etc., and x is the distance of the object transmitted by the X-rays. When the X-rays penetrate an object with multiple constituents, I(x) of the X-rays changes with the variable absorption coefficients of the constituents. Accordingly, absorption-contrast is obtained and the inner constituents of the object can be distinguished from each other, which is the imaging principle of CT [8,9,10]. Figure 1 shows the schematic diagram of the CT imaging principle in detail. Firstly, hundreds of 2D projection radiographs are taken from the object at various angles, and secondly, they are mathematically reconstructed to a series of quantitative 2D slices with absorption-contrast. Finally, 3D morphology of the object can be reconstructed using this series of 2D slices. Since the X-ray absorption coefficient is determined by the density and elemental composition of the object, the image absorption-contrast directly reflects the microstructure of the material. Therefore, CT should be a powerful tool to unveil the relationship between fracture behavior such as crack nucleation and propagation process, and the internal constituents of the metallic structural materials. Conventional X-ray CT using electron-impact X-ray source has been widely used for flaw detection of the industrial components, while its applications for scientific research are restricted due to the technical limitations such as low penetration depth and poor efficiency.
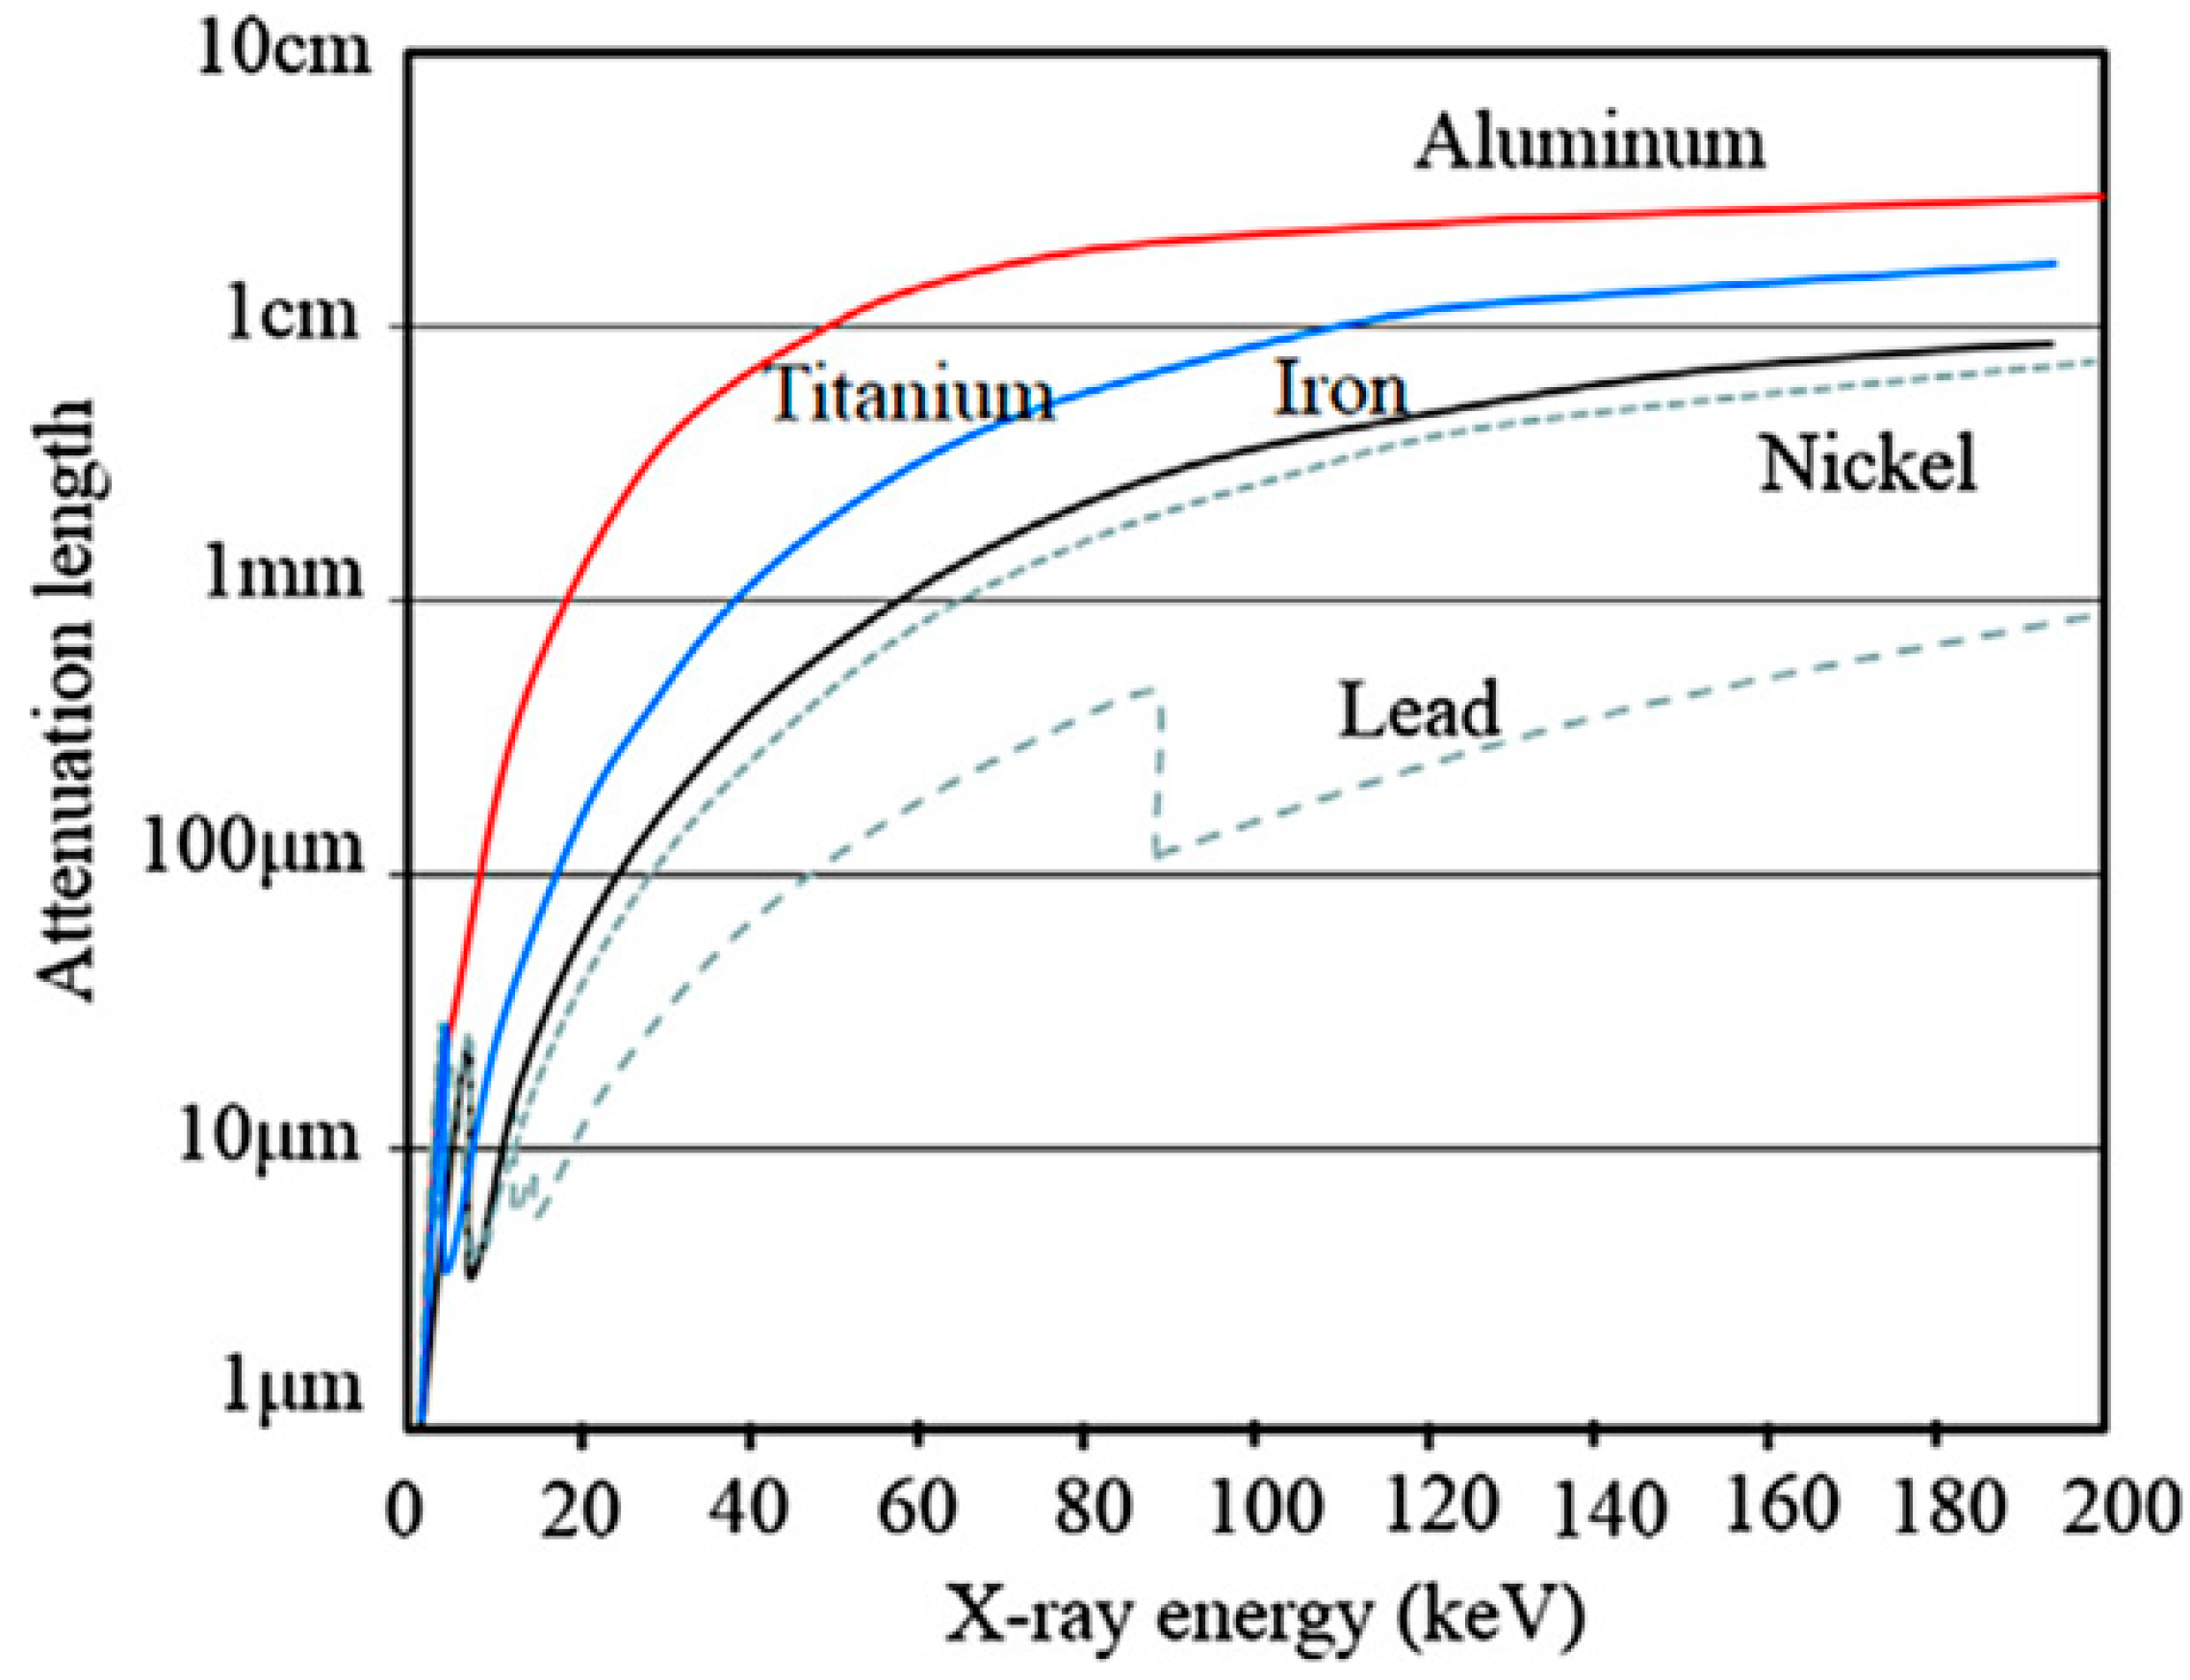
Synchrotron radiation (SR) is known for high-energy X-ray beam emitted by high-speed electrons when they travel along a circular trajectory under the action of an electromagnetic field [11]. The utilization of SR as the X-ray source for CT has revolutionized X-ray imaging technology, which promotes the development and applications of SR computed microtomography (SR-μCT). Firstly, the energy of X-ray source influences the attenuation capability of materials. Figure 2 shows a relationship between X-ray attenuation length and energy through various metals [7]. Here, the X-ray attenuation length is defined as the distance through which 37% of the X-ray intensity will penetrate. Generally, high energy of SR is more suitable for observation of large samples or high atomic number materials. If the X-ray energy is too high then insufficient absorption contrast is obtained, whereas if the energy is too low then enough image intensity cannot be obtained. Therefore, tuning energy of SR can maximize the absorption-contrast of materials to improve the contrast between different phases in the materials. For SR-μCT imaging of structural metals such as layered Ti/Al metal composites and Mg alloys, typical X-ray energies of 20–40 keV are always used [12,13]. Moreover, good monochromaticity and high spatial coherence of the synchrotron X-rays used for SR-μCT reduce the radiation hardening effect and benefit the phase contrast imaging. It should be emphasized that in addition to the intrinsic advantages of SR, image quality can be further improved only by adjusting the contrast-to-noise ratio (CNR) of the different phases in the materials when processing the SR-μCT images. Secondly, the imaging principle of SR-μCT is essentially same to the conventional CT systems. The optimum spatial resolution of the conventional CT for industrial application is approximately 100 μm, whereas that of the SR-μCT ranges from tens of nanometers to micron scales. Especially, the 3rd-generation synchrotron sources at Petra-III and ESRF enable nano-tomography with a resolution of <200 nm [14,15]. Although an advanced lab-μCT can also achieve similar spatial resolutions (~50 nm), much longer time is required for acquiring all the projections due to its low brilliance [14]. Accordingly, the SR-μCT has been increasingly applied to non-destructively characterize the crack nucleation and growth from 3D vision [16,17,18].
The high penetrating capability of the synchrotron X-rays enables the SR-μCT technique to inspect the constituents around the cracks in the samples, such as defects, precipitates, second phases and inclusions [19,20]. The constituents surrounding the cracks influence the crack path during the damage process, and play key roles in determining the fracture behavior of the samples [21] and, hence, a 3D characterization of the interactions between the constituents and cracks using μCT technique is required to reveal the fracture mechanisms [22]. Furthermore, the high brilliance of the X-ray beam used in the SR facilities means that SR-μCT has high efficiency and high temporal resolution, that is, the events occurred over short timescales can be captured. As a result, it permits the performance of high-speed X-ray radiography during loading and it is possible to capture a dynamic process of crack propagation inside the sample. Therefore, the imaging beamlines for SR-μCT at SR facilities have generally equipped with in-situ tensile and/or compressive rigs to trace internal crack growth during loading at ambient and elevated temperatures, which facilitates the investigations of the fracture behavior and some new fracture mechanisms have been proposed [23,24,25,26,27]. For example, the scan time for in-situ SR-μCT characterization of cracking in AA2124 matrix composites during tensile test is only 1 min [27]. In comparison with the SR-μCT, a lab-μCT using electron-impact X-ray source requires much longer time to acquire all the projections [7].
In this paper, we review the progress made in some research groups on the 3D characterization using SR-μCT, to study the fracture behavior of metal matrix composites (MMCs), such as the laminated metal composites, aluminum matrix composites and multimodal magnesium alloys. Finally, a new expanded technology, diffraction contrast tomography (DCT) for 3D grain mapping, is also briefly reviewed, which contributes to the understanding of fracture mechanisms of metallic structural materials.

2. 3D Characterization of Fracture Behavior for Metal Matrix Composites Using SR-μCT

The excellent mechanical properties of composites are attributed to their heterogeneities, which make it possible to achieve the advantages of each composite constituent. However, the research on the relationship between the microstructure and their fracture behavior is insufficient, which is to some extent due to the lack of effective characterization technology. High photon flux and high-speed camera utilized at third-generation synchrotron X-ray sources mean that SR-μCT should be a powerful tool and provides a promising way to clarify the fracture behavior of the composites. The past decade has seen the progress in our understanding of MMC damage process [28,29,30]. Advances achieved in SR-μCT characterization technologies of materials, such as X-ray energy, and high spatial and temporal resolutions, largely benefit the MMC research.

2.1. Particle-Reinforced Aluminum Matrix Composites

Hard particles have long been used to enhance the mechanical properties of aluminum matrix composites. However, materials scientists have found that, when the hard particles content increases to a certain level, the performance of aluminum matrix composites decreases sharply. It is difficult to determine the failure mechanism from the observation of 2D surface or fracture. However, 3D imaging technology based on SR presents an effective non-destructive characterization way which can in-situ reveal the interaction mechanism between internal hard particles and the matrix.
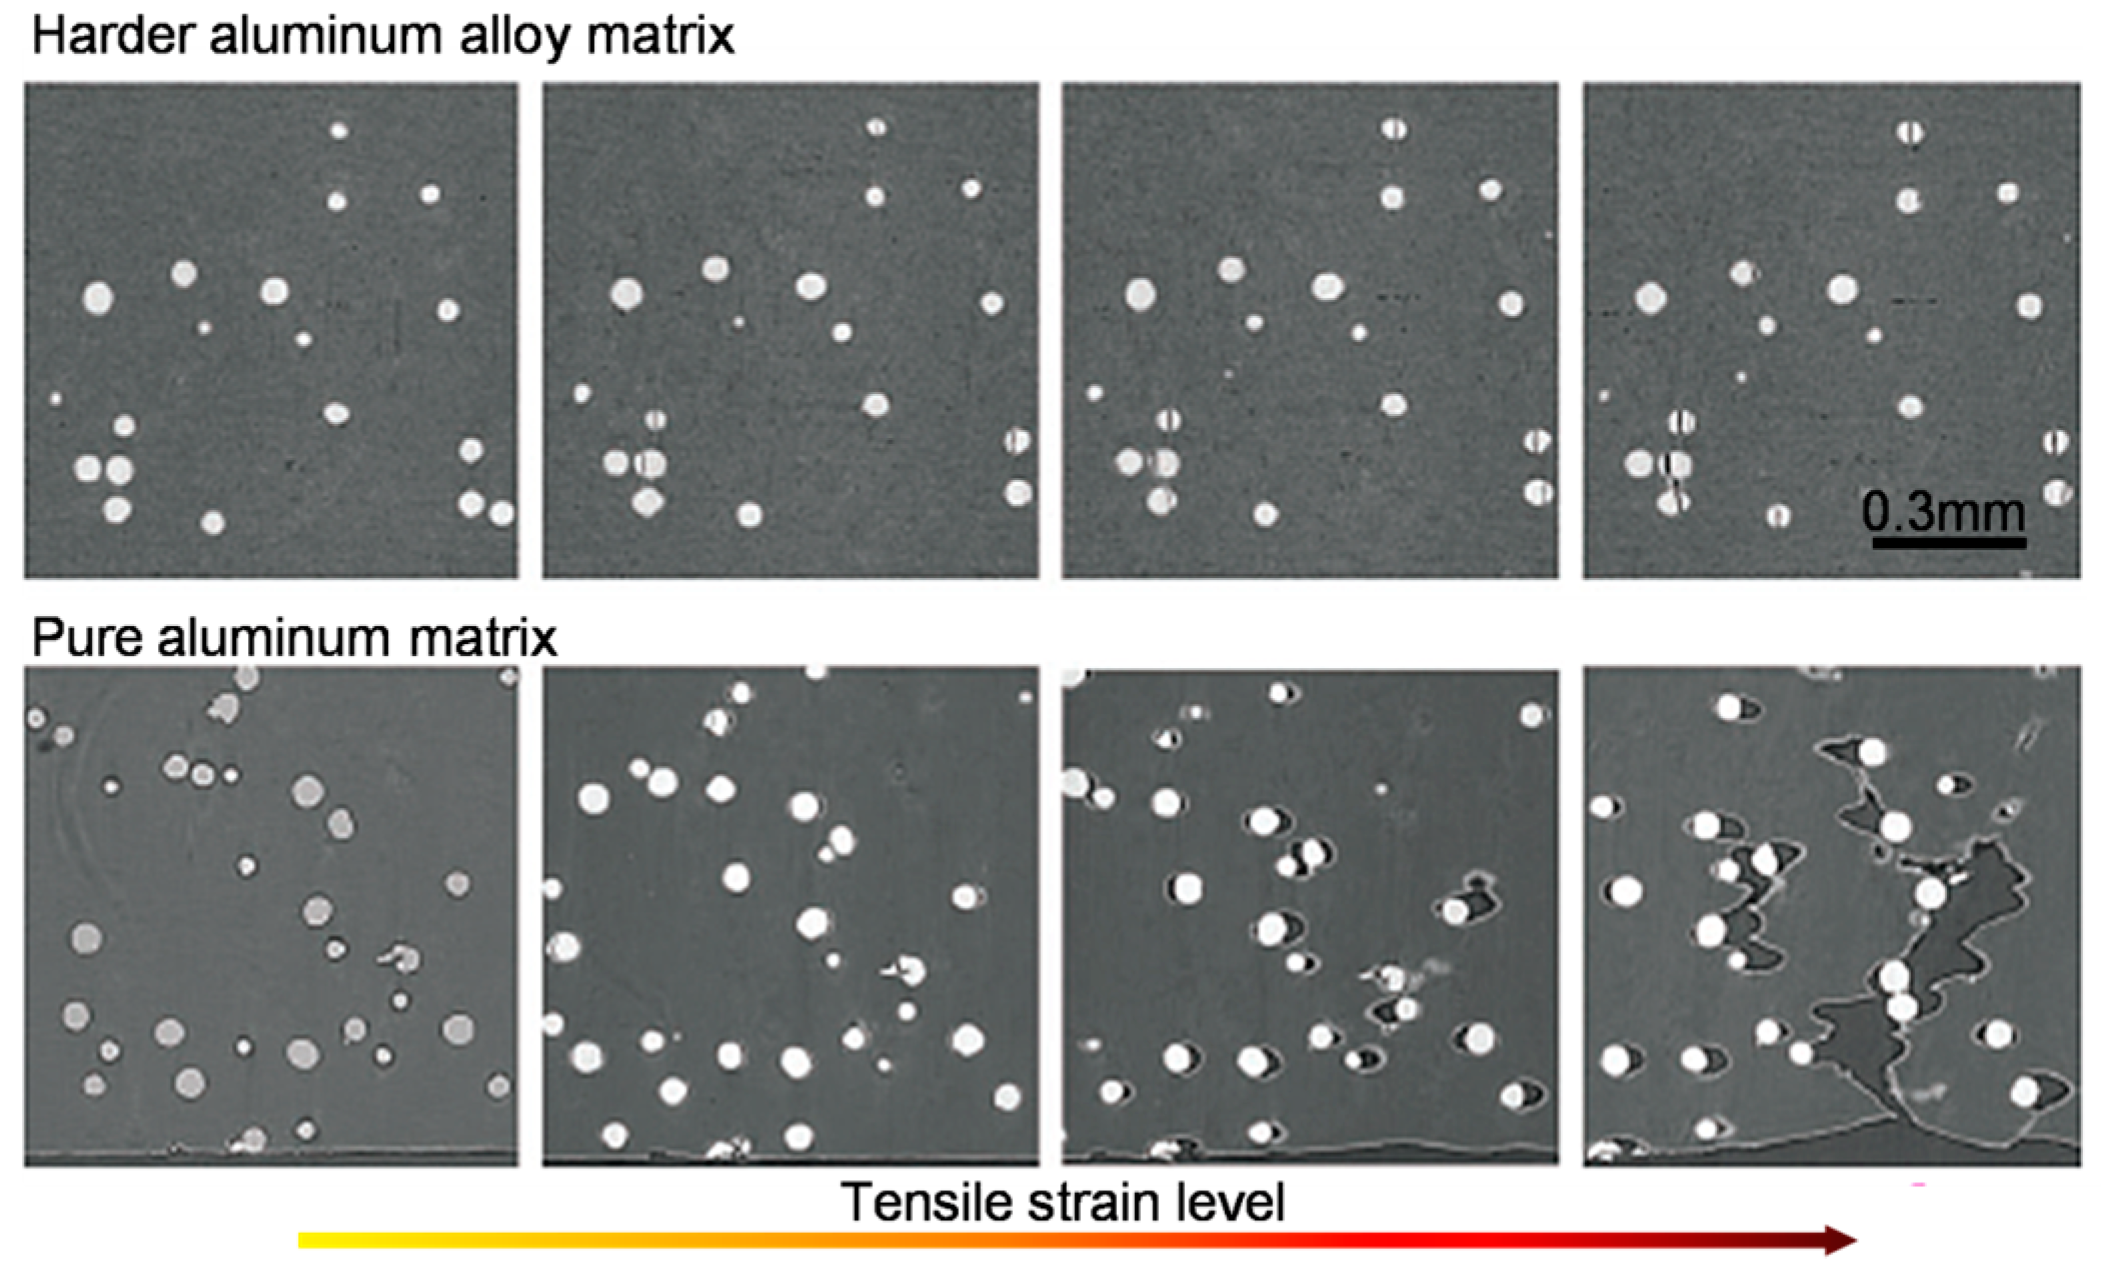
The researchers fabricated two aluminum matrix composites as model composites, which were reinforced by 4 vol.% of ZrO2/SiO2 particles [27]. Two kinds of matrix were used, namely hard aluminum alloy matrix (AA-2124) and soft pure aluminum matrix, respectively. The size of reinforced particles ranged from 40 μm to 60 μm. Then, the fracture behavior of two model composites with hard and soft matrix was investigated using time-lapse SR-μCT. Time-lapse SR-μCT can provide 3D insights to reveal the tendency of cracks nucleation, crack morphologies and crack paths as they propagate. Moreover, the high spatial resolution with micron scales is needed due to the small size of the cracks. Figure 3 shows reconstructed tomographic slices of same region at different tensile strain levels in two model composites observed by in-situ SR-μCT [27]. It is evident that, for the composite with soft aluminum matrix, the failure of the composite mainly derives from decohesion between the soft matrix and the hard particles. On the other hand, for the composite with harder aluminum alloy matrix, the failure of the composite originates from cracking of the particles. Generally, cracks preferentially nucleate at the site of stress concentration. The dispersion of the hard ceramic particles or fibers within the ductile metal matrix results in an increase in the flow stress of the metal, through load-transfer across the interface from the matrix to the reinforcement. When the aluminum matrix starts to deform plastically, the ceramic reinforcements can constrain the plastic deformation of the matrix, causing a large local compressive stress in the matrix. However, the soft aluminum matrix enhances the load-transfer by the reinforcement, and the harder aluminum alloy matrix reduces the flow stress, thus leading to a stress concentration, which may cause premature damages, such as the internal particle breakage and interfacial debonding.

2.2. Layered α2-Ti3Al/α-Ti Composite

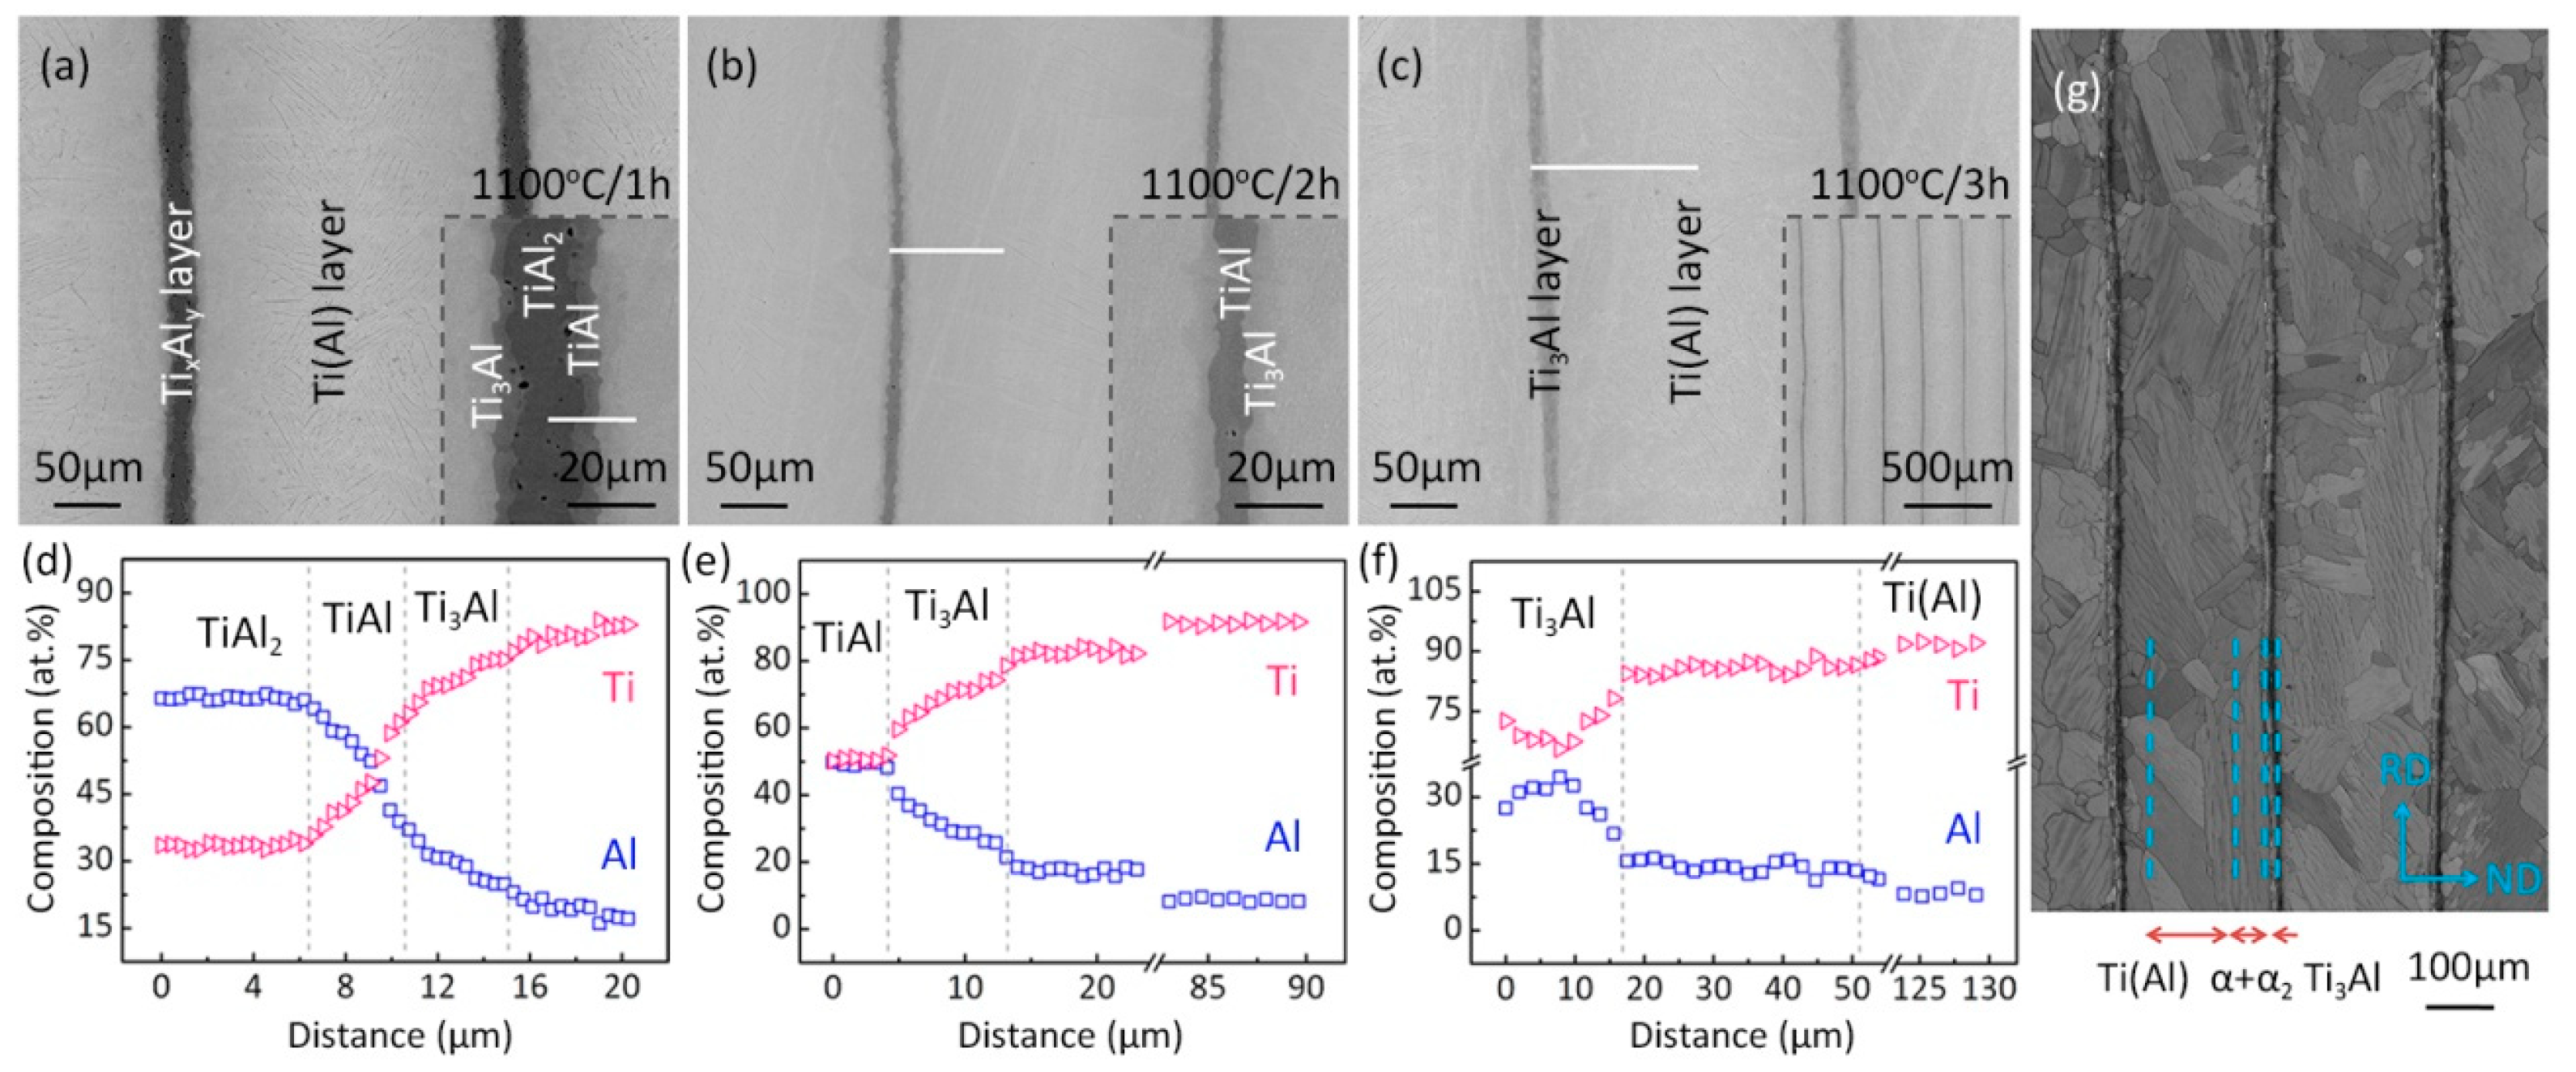
For brittle MMCs, once micro-cracks occur, the cracks easily propagate and develop into unstable main cracks, eventually leading to fracture of the composites. Generally, the crack opening distance (COD) in brittle composites is small so that higher resolution (submicron scales) SR-μCT observation is required. We designed a brittle/ductile multilayered composite composed of brittle α2-Ti3Al constituents rendering high strength and soft α-Ti phase imparting the ductility [31]. Such a composite was prepared by diffusion reaction of alternatively stacked Ti foils and Al foils (Figure 4), and the detailed synthesis process was described in our previous work [32,33]. Compositional linear profile analysis shows the diffusion-induced composition gradient, progressively changes from the α-Ti side across the interface to the oppositeα2-Ti3Al side, which may effectively stabilize the plastic straining and provide extraordinary mechanical responses [34,35,36]. Besides, a dual-phase layer consisting of α-Ti(Al) and fine α2-Ti3Al precipitates should exist between α-Ti(Al) layers and α2-Ti3Al layers based on Ti-Al binary phase diagram. These three layers, namely the α-Ti(Al) layer, the α2-Ti3Al layer and the α + α2 dual-phase layer, can be distinguished depending on their Al contents and are 130 μm, 15 μm, and 35 μm, respectively, in thickness.
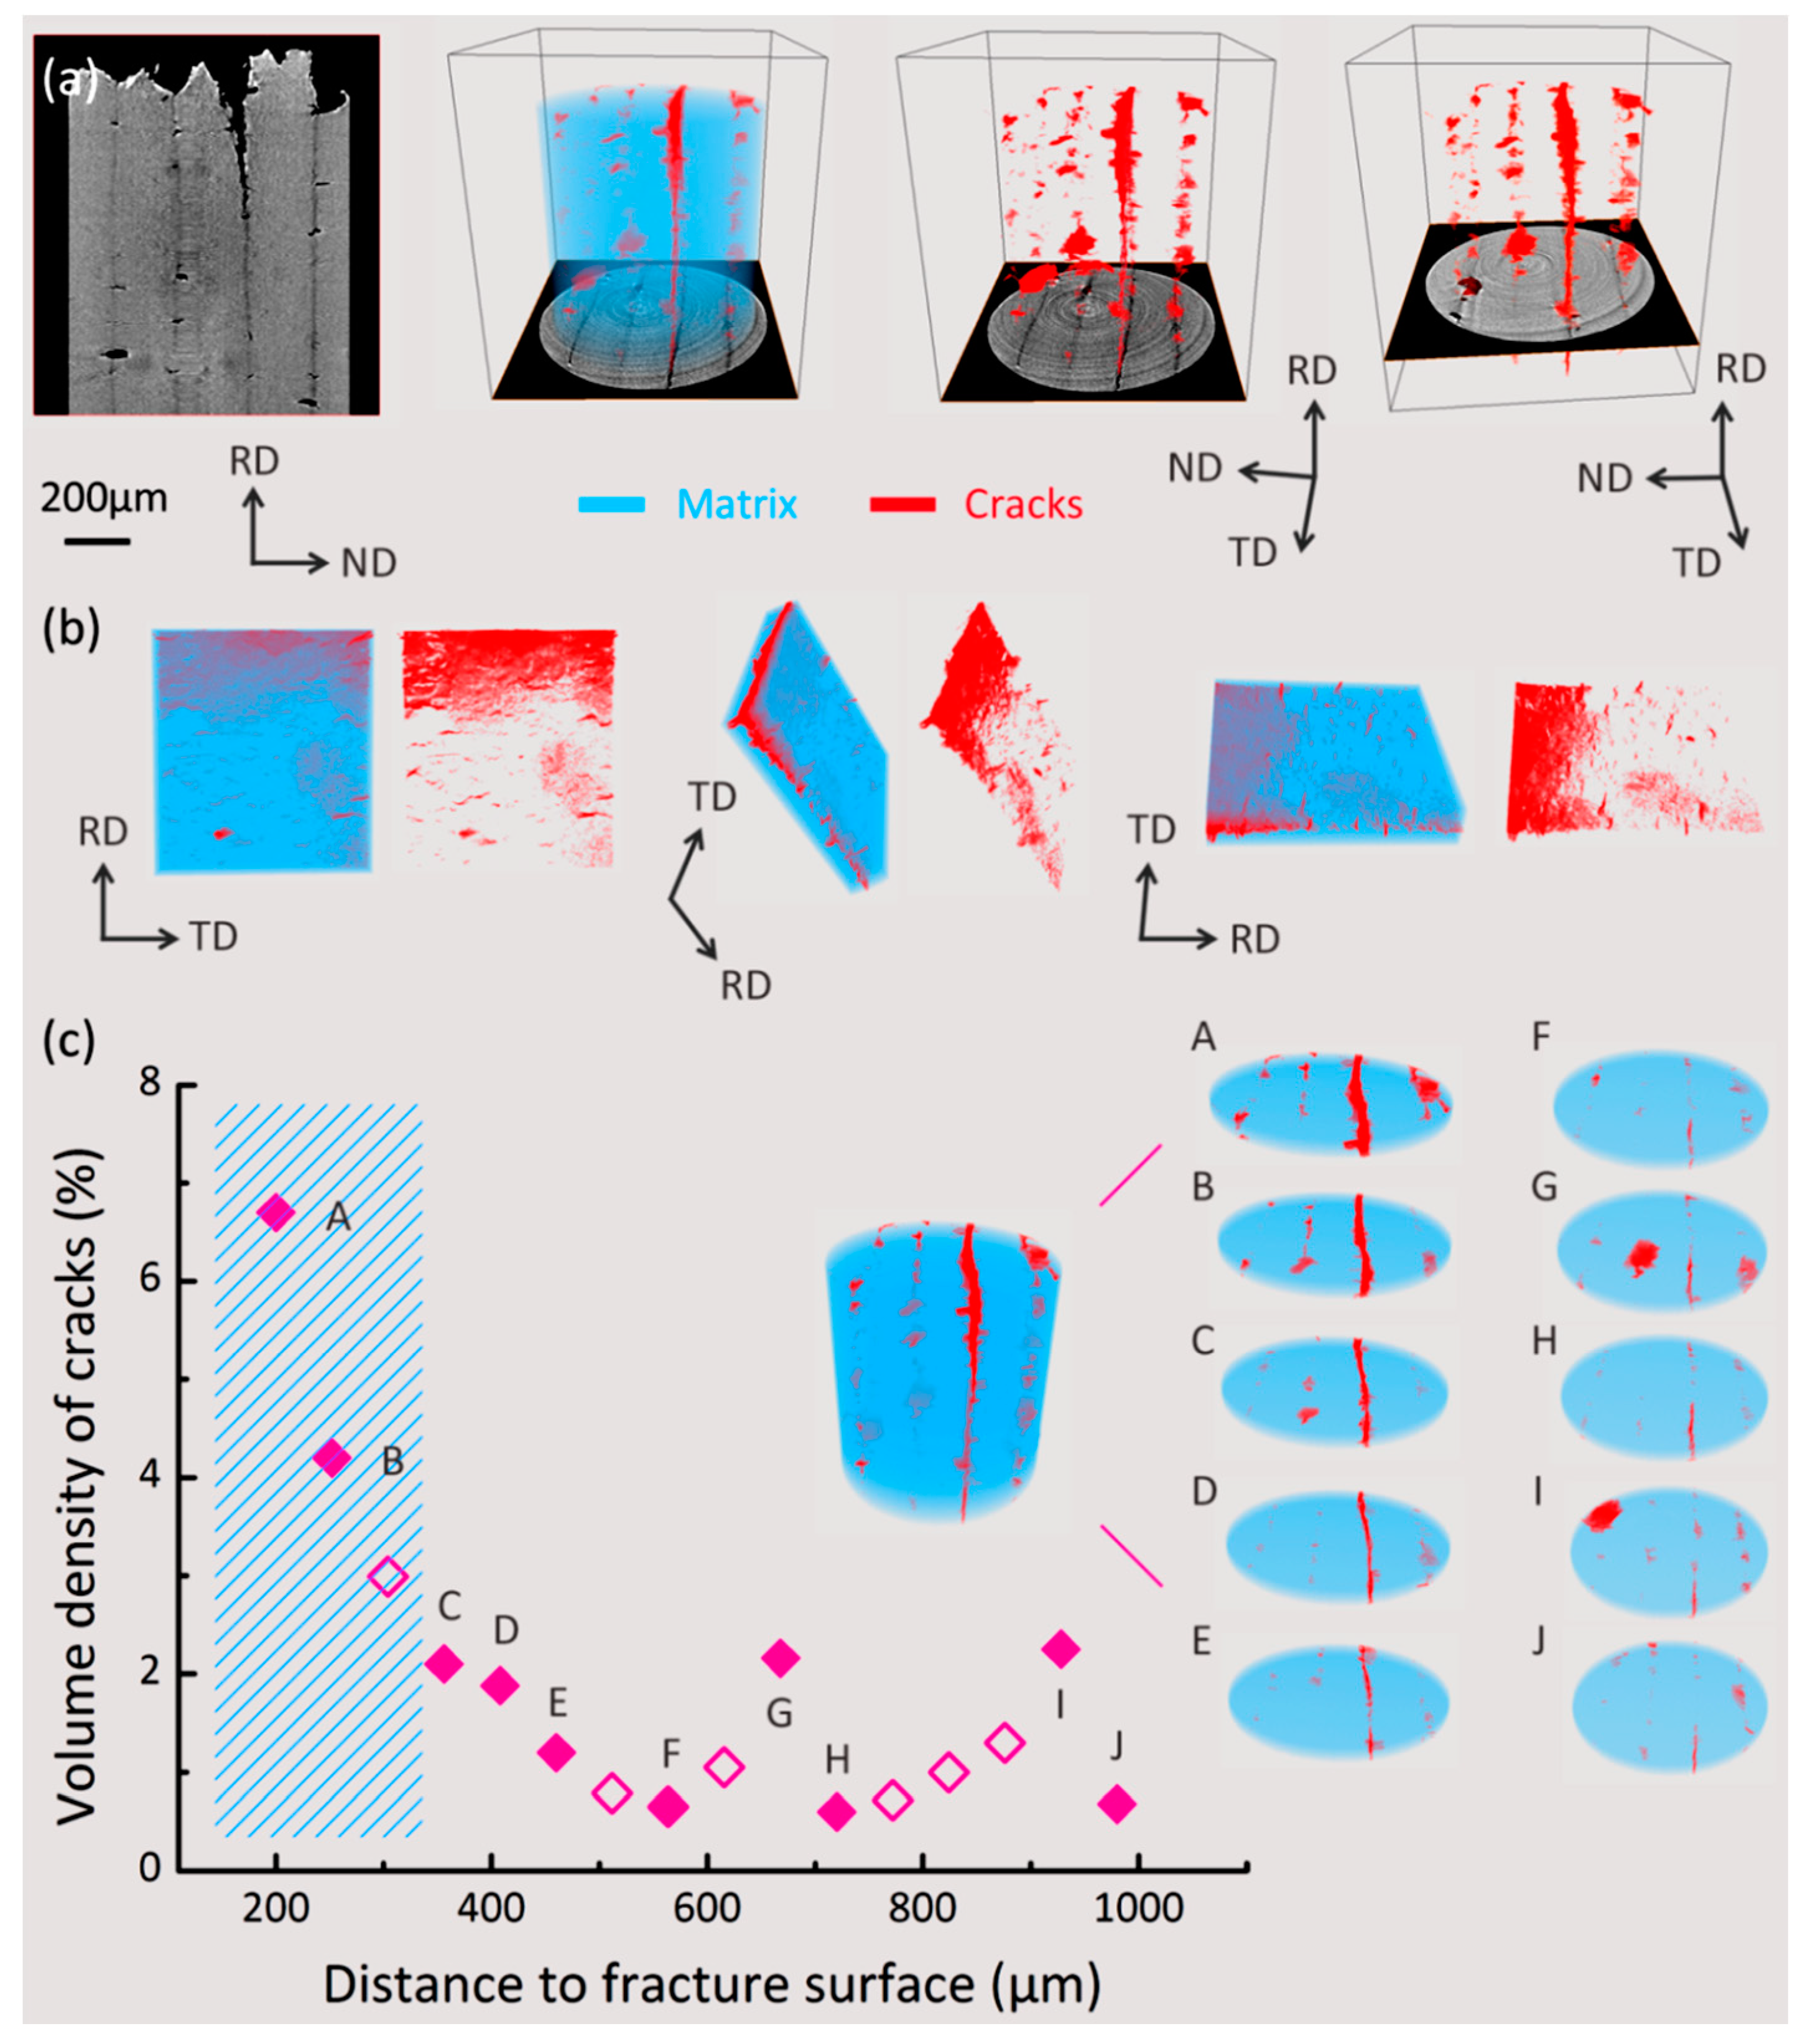
The composition gradient in the laminated composites changes the fracture behaviors of those three layers, in such a way that the yield strength of α + α2 dual-phase layers should lie between hard α2-Ti3Al layers and soft α-Ti(Al) layers. The spatial distribution of cracks and underlying microstructures of fractured samples were characterized using 3D SR-μCT, where the beam energy (36 keV), pixel size (0.65 μm/pixel) and exposure time per projection (550 ms) were used in this experiment. It should be noted that the pixel size was selected according to the magnification of the charge coupled device (CCD) at the BL13W imaging station of SSRF; for example, the CCD with 10× zoom corresponds to the pixel size of 0.65 μm/pixel Besides, two projections of the background were captured after collection of every 30 sample projections so that 1600 projections were collected from 0° to 180° with a step size of 0.12°. We found that: (i) the cracking of brittle α2-Ti3Al layer and shear fracture of ductile α-Ti(Al) layer were clearly observed on the RD-ND plane of the fractured sample, as shown in Figure 5a; (ii) most micro-cracks seemed to nucleate in the brittle α2-Ti3Al layers, but their tips were immediately blunted via plastic deformation of neighboring α+α2 dual-phase components (Figure 5b), implying an elevated damage tolerance of laminated composites; and (iii) quantitative measurements of the volume density of cracks indicated plenty of small arrested cracks (Figure 5c). The crack growth was effectively restricted and these cracks had no potential to cause the unstable cracking for the current applied stress state. Furthermore, these cracks significantly relived the stress accumulated in the brittle α2-Ti3Al layers and accommodated the strain to some extent.

2.3. Layered Ti/Al Metal Composites

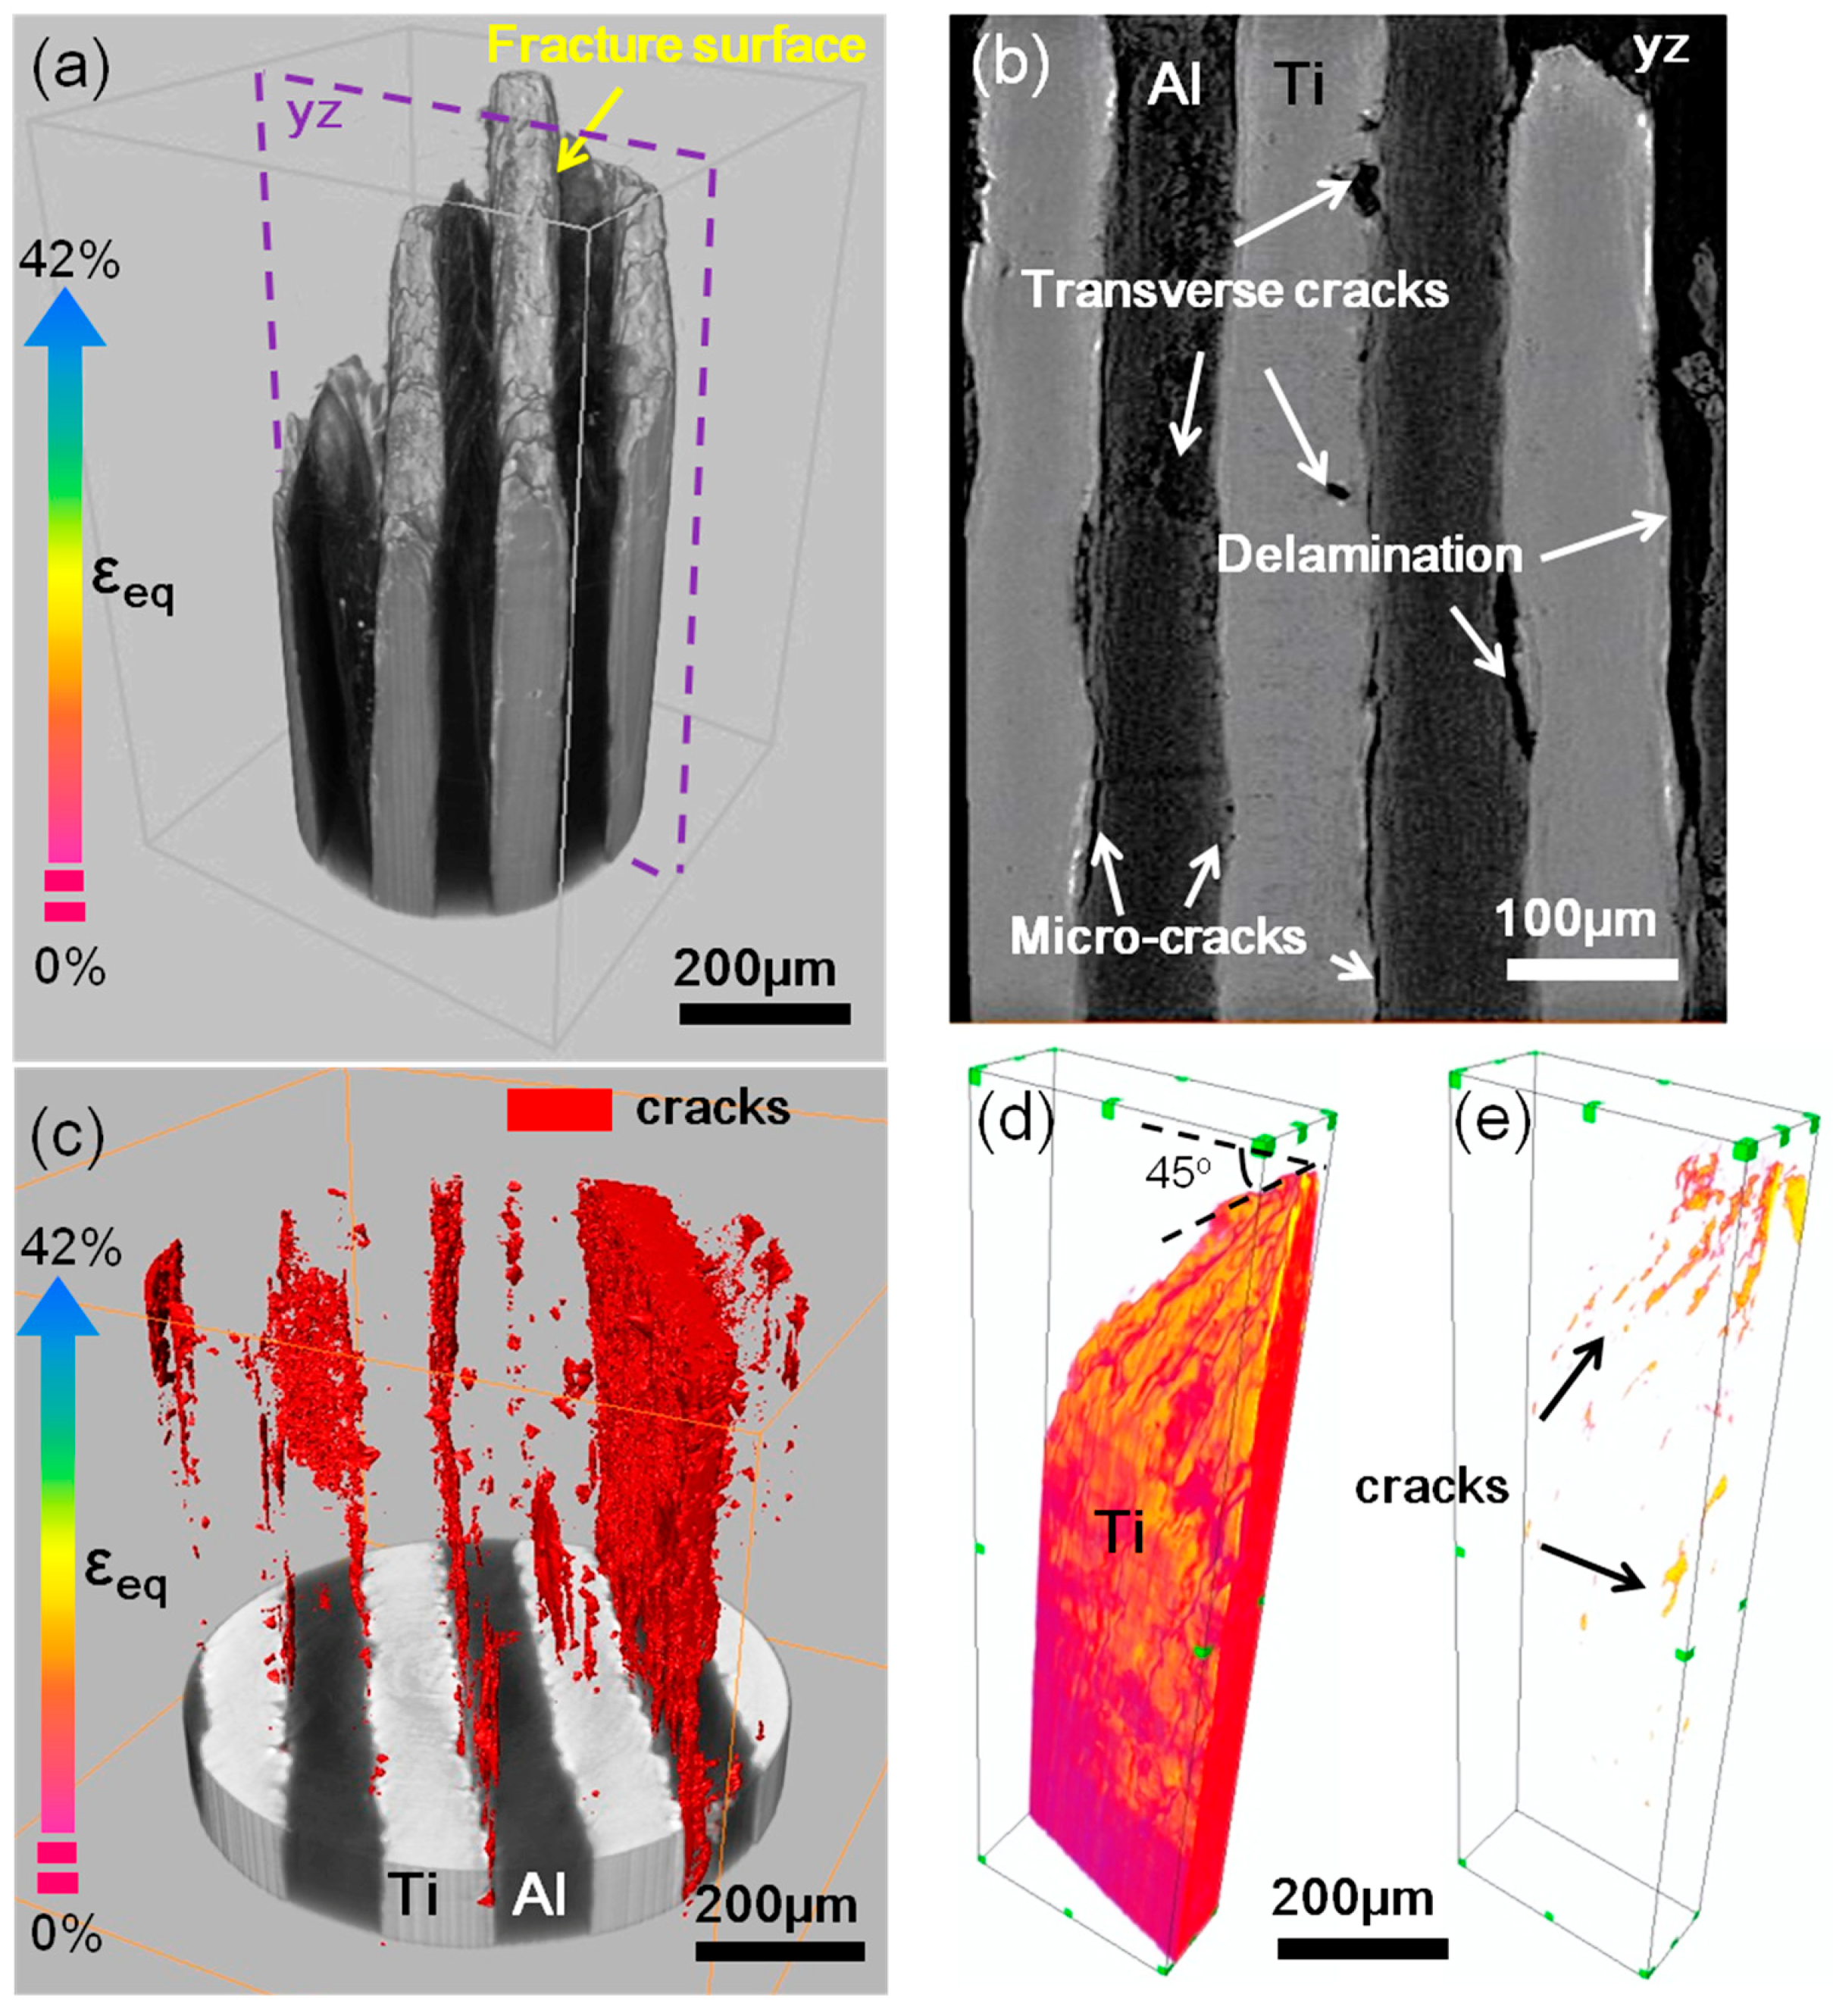
For ductile MMCs, the initial nucleation sites and propagation paths of cracks are concerned. The in-situ observation of the crack propagation is conducive to investigate its fracture behavior. This requires rapid imaging capability of SR during the experiment, but which cannot be performed using lab-μCT. In our research works, layered Ti-Al metal composite (LMC) as a model material was prepared by hot-pressing and hot-rolling of pure Ti and Al foils, exhibiting an extraordinarily high ductility without sacrificing the strength [37]. Digital image correlation (DIC) was performed to investigate the deformation behaviors, and strain delocalization was found to be responsible for extraordinary tensile ductility [12]. The initiation and evolution of crack were also inspected using SR-μCT, which is critical to understanding the damage mechanisms of LMC. In this experiment, the beam energy (32 keV), pixel size (0.65 μm/pixel) and exposure time per projection (1.5 s) were used, and 920 projections were recorded from 0° to 180° with a step size of 0.2°. Figure 6 shows the 3D morphologies of the cracks near the fracture surfaces of the LMC and abstracted Ti. Equivalent strain εeq was introduced by evaluating the change of gauge section area to characterize the accumulation of damage. It was found that to some extent the crack propagation can be constrained by layered structure, which is important for retaining high ductility. Once the constraint effect of layered structure is locally weakened due to the delamination of Ti/Al interface, rapid necking of the LMC occurs, which leads to the sudden local fracture.
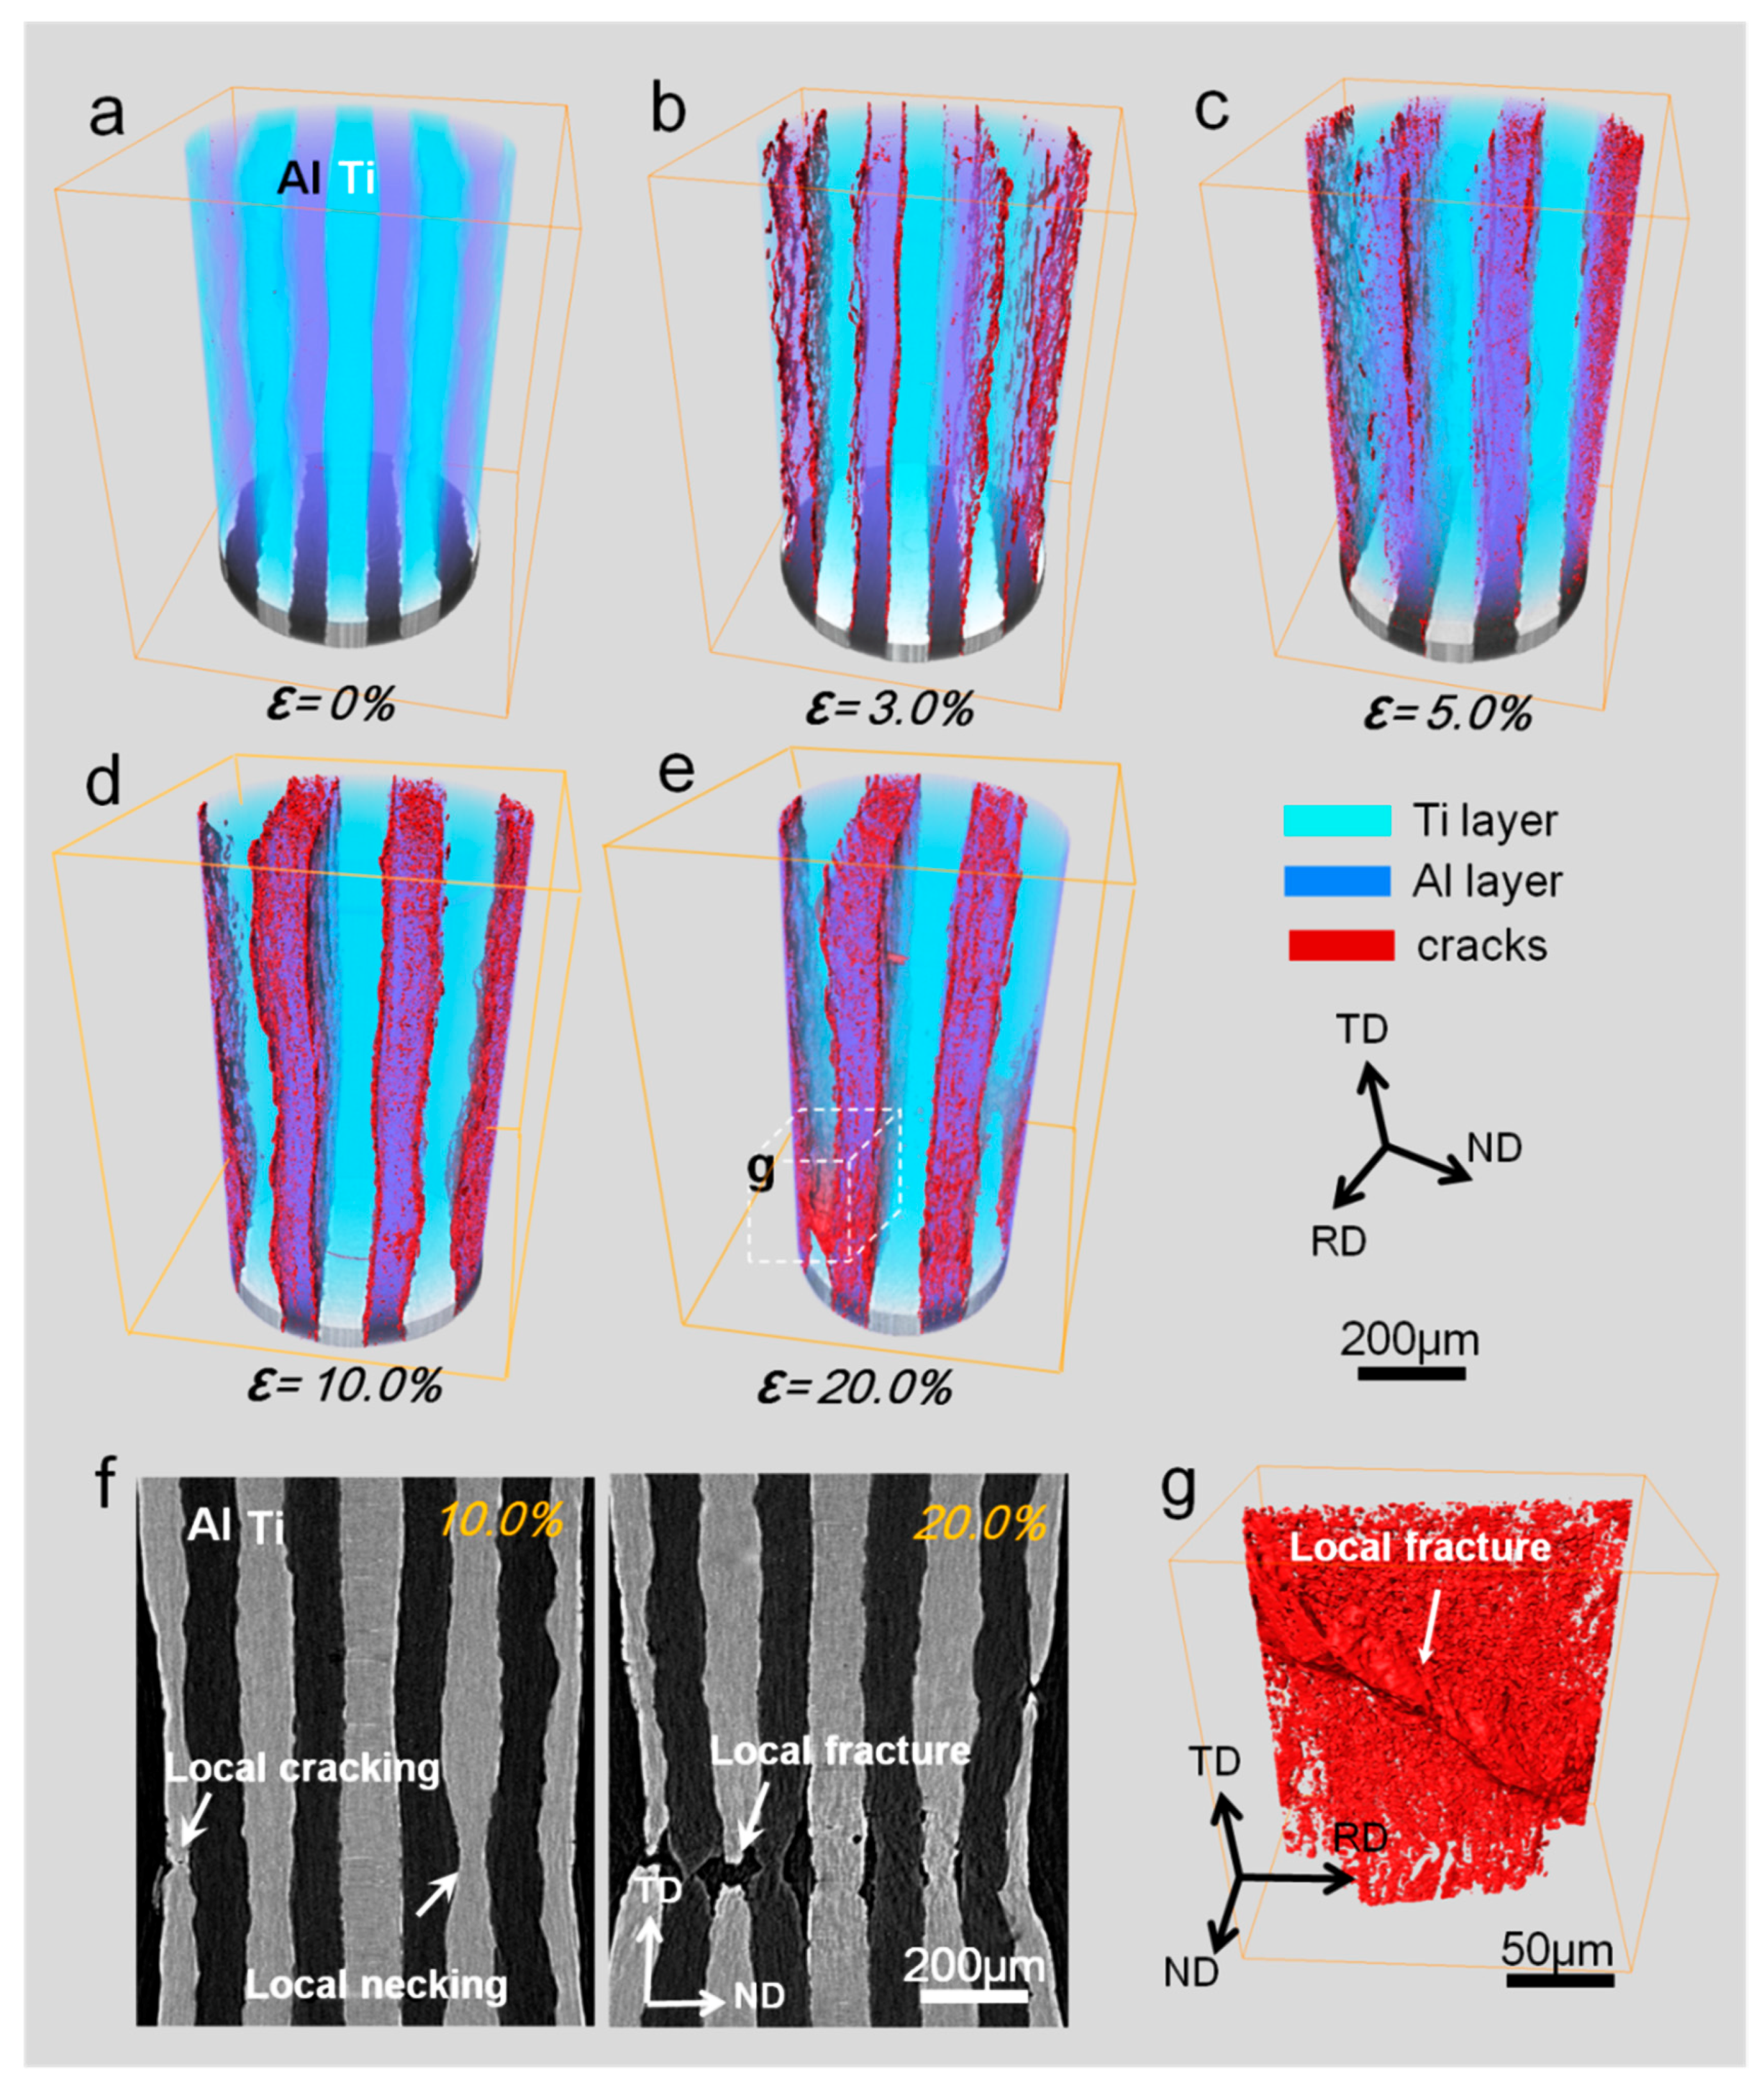
To reveal the fracture behavior of LMC, SR-μCT experiment was carried out during the in-situ tensile test [38]. Figure 7 shows the 3D renderings of the cracks in the LMC when tensioned to macro strains of 0%, 3%, 5%, 10% and 20%, which clearly reveals the nucleation and accumulation of the cracks in the LMC during the tensile deformation. Because of the strong interface bonding, there is no visible initial void or crack in the LMC before the tensile test (~0%). Then, most micro cracks were found to preferentially nucleate at the Ti/Al interfaces (before ~3%), but their propagation are constrained by layered structure (3–10%). Moreover, many micro-cracks were observed in the Al layers, which offset the tensile strain to some extent to improve the deformation compatibility between Ti and Al layers. Meanwhile, the stress of Al layer is relieved, which further enhances the ductility of Al layers in LMC. The reconstructed 2D slices of the LMC sample tensioned to 10% and 20% clearly reveal that local fracture of Ti layer results in the fracture of the LMC.

2.4. Al/Al18B4O33 Composites

Aluminum metal matrix composites (AMCs) are promising structural materials for weight reductions due to their high strength and low density [39,40]. Some efforts have been made to get thorough understanding of the relationship between microstructure and mechanical properties, only then can we design the AMCs with desirable properties. In general, the reinforcement addition deteriorates the ductility of AMCs. Moreover, the agglomeration of reinforcements results in the drastic drop of ductility and even a sharp decline of strength due to the premature fracture [41,42,43]. Enlightened by structural architecture such as layered structure mentioned in Section 2.1 and Section 2.2 [12,31,37,44,45], the band-like aluminum matrix composites (BAMCs) were prepared and the high elongation was achieved [46].
The BAMCs were fabricated by hot-pressing sintering, extrusion and annealing of the mixture of pure aluminum powder with diameter of 48 μm and the Al18B4O33 whisker (ABO) with diameter of 1.7 μm [46]. The volume fractions (Vw) of the ABOs used in this study are 3 vol.%, 5 vol.% and 10 vol.% and the corresponding BAMCs samples donated as 3ABO, 5ABO and 10ABO, respectively. The SEM micrographs of the BAMCs samples are shown in Figure 8a–c. It can be seen that the majority of ABO (white contrast) agglomerate to form the ABO-rich bands. Moreover, the ABO-rich bands distribute in the ABO-poor region and spread along the extrusion direction (ED). The width of ABO-rich bands and the distance between each ABO-rich bands decreases with the increasing Vw.
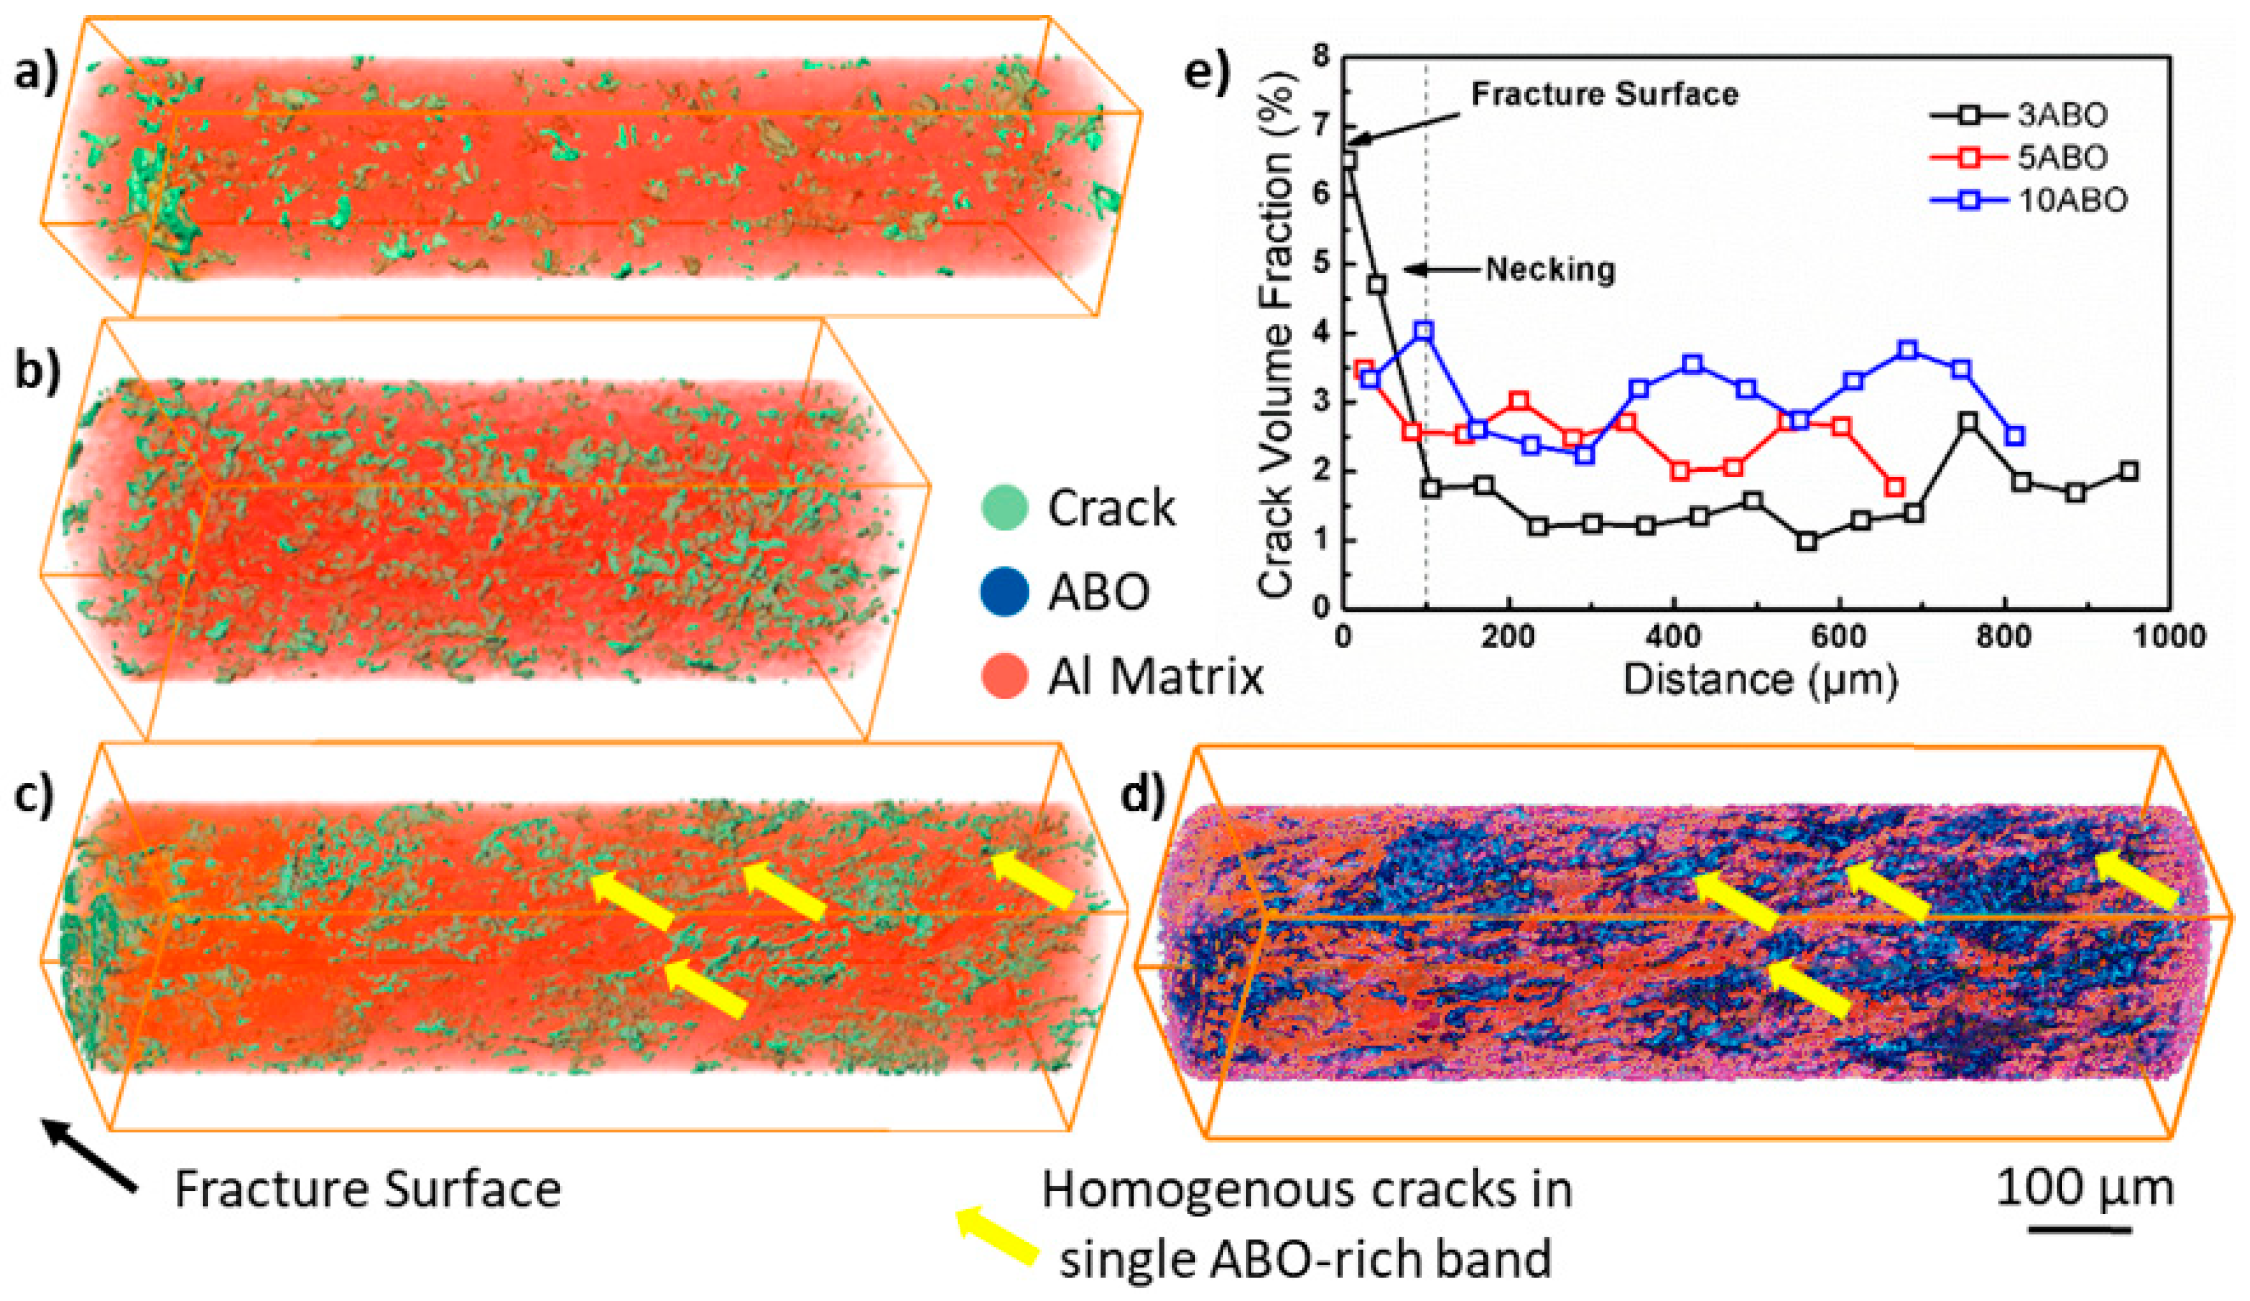
3D crack distribution in the fractured BAMCs tensile samples was characterized using SR-μCT on the beamline BL13W1 at Shanghai Synchrotron Radiation Facility (SSRF). The beam energy (18 keV), pixel size (0.65 μm/pixel) and exposure time per projection (2 s) were used for this experiment, and 1600 projections were collected from 0° to 180° with a step size of 0.12°. Figure 9a–c shows the morphologies and distributions of the cracks inside the fractured samples, revealing the negative correlation between crack size and Vw. It is reported that the conventional ABO reinforced AMCs prefer to generate a major crack in the ABO-rich band, and then the crack penetrates the whole sample quickly when possessing high ABO content. Accordingly, the damage zone should be confined to the limited volume near the fracture surface [47]. In contrast, the ABO-rich bands in the BAMCs fabricated in our work facilitate the nucleation of a quantity of small cracks and they distribute homogenously inside the ABO-rich bands. Accordingly, the band-like structure is supposed to restrict the propagation of cracks. Figure 9e shows the relationships between the crack volume fraction and the distance away from the fracture surface in the samples. The results quantitatively confirm the homogenous distribution of cracks along the loading direction and the slight increment of crack volume fraction increases with the increasing Vw. The constrained crack propagation and smaller crack size alleviate the strain localization and contribute to the superior ductility of the BAMCs than those AMCs reported previously.

2.5. Long Period Stacking Ordered (LPSO) Phase Containing Mg Alloy

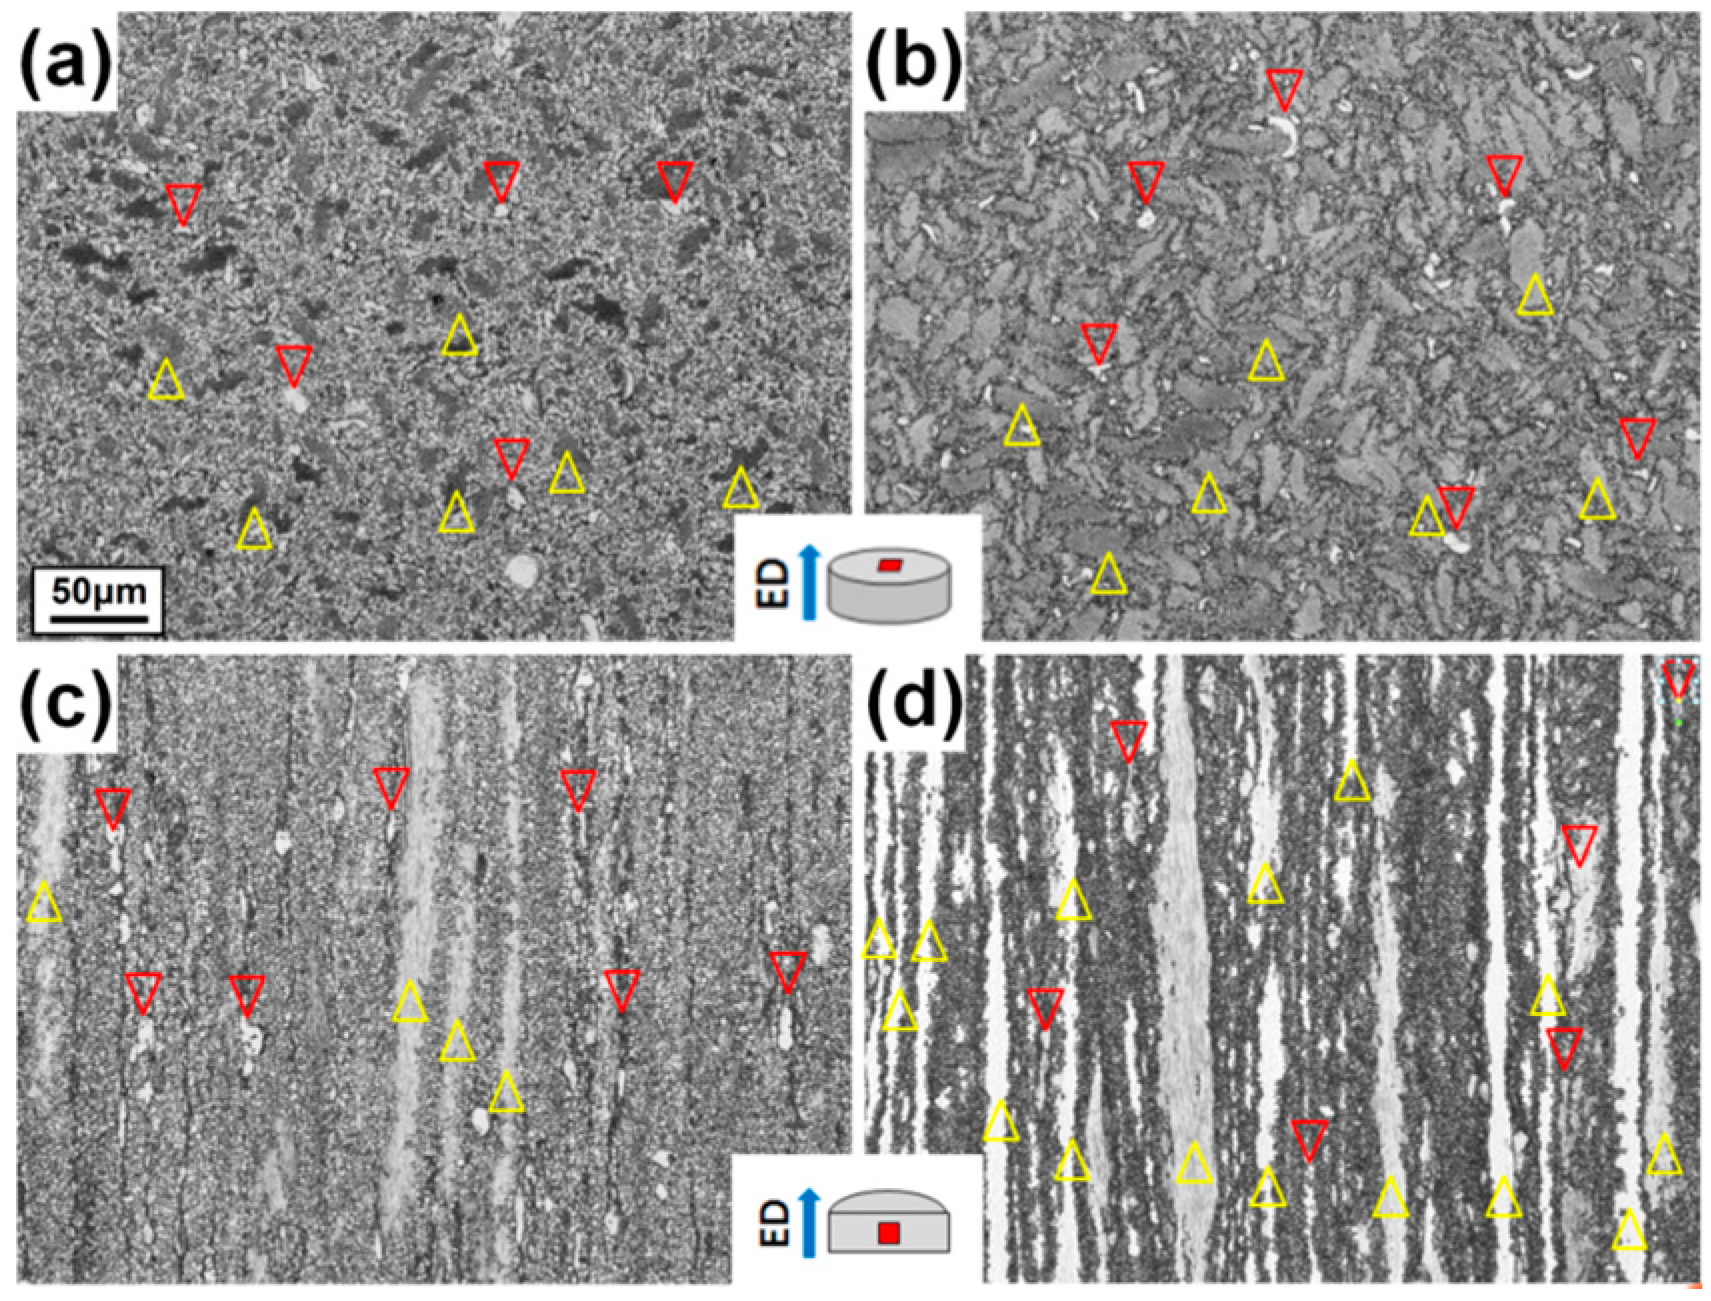
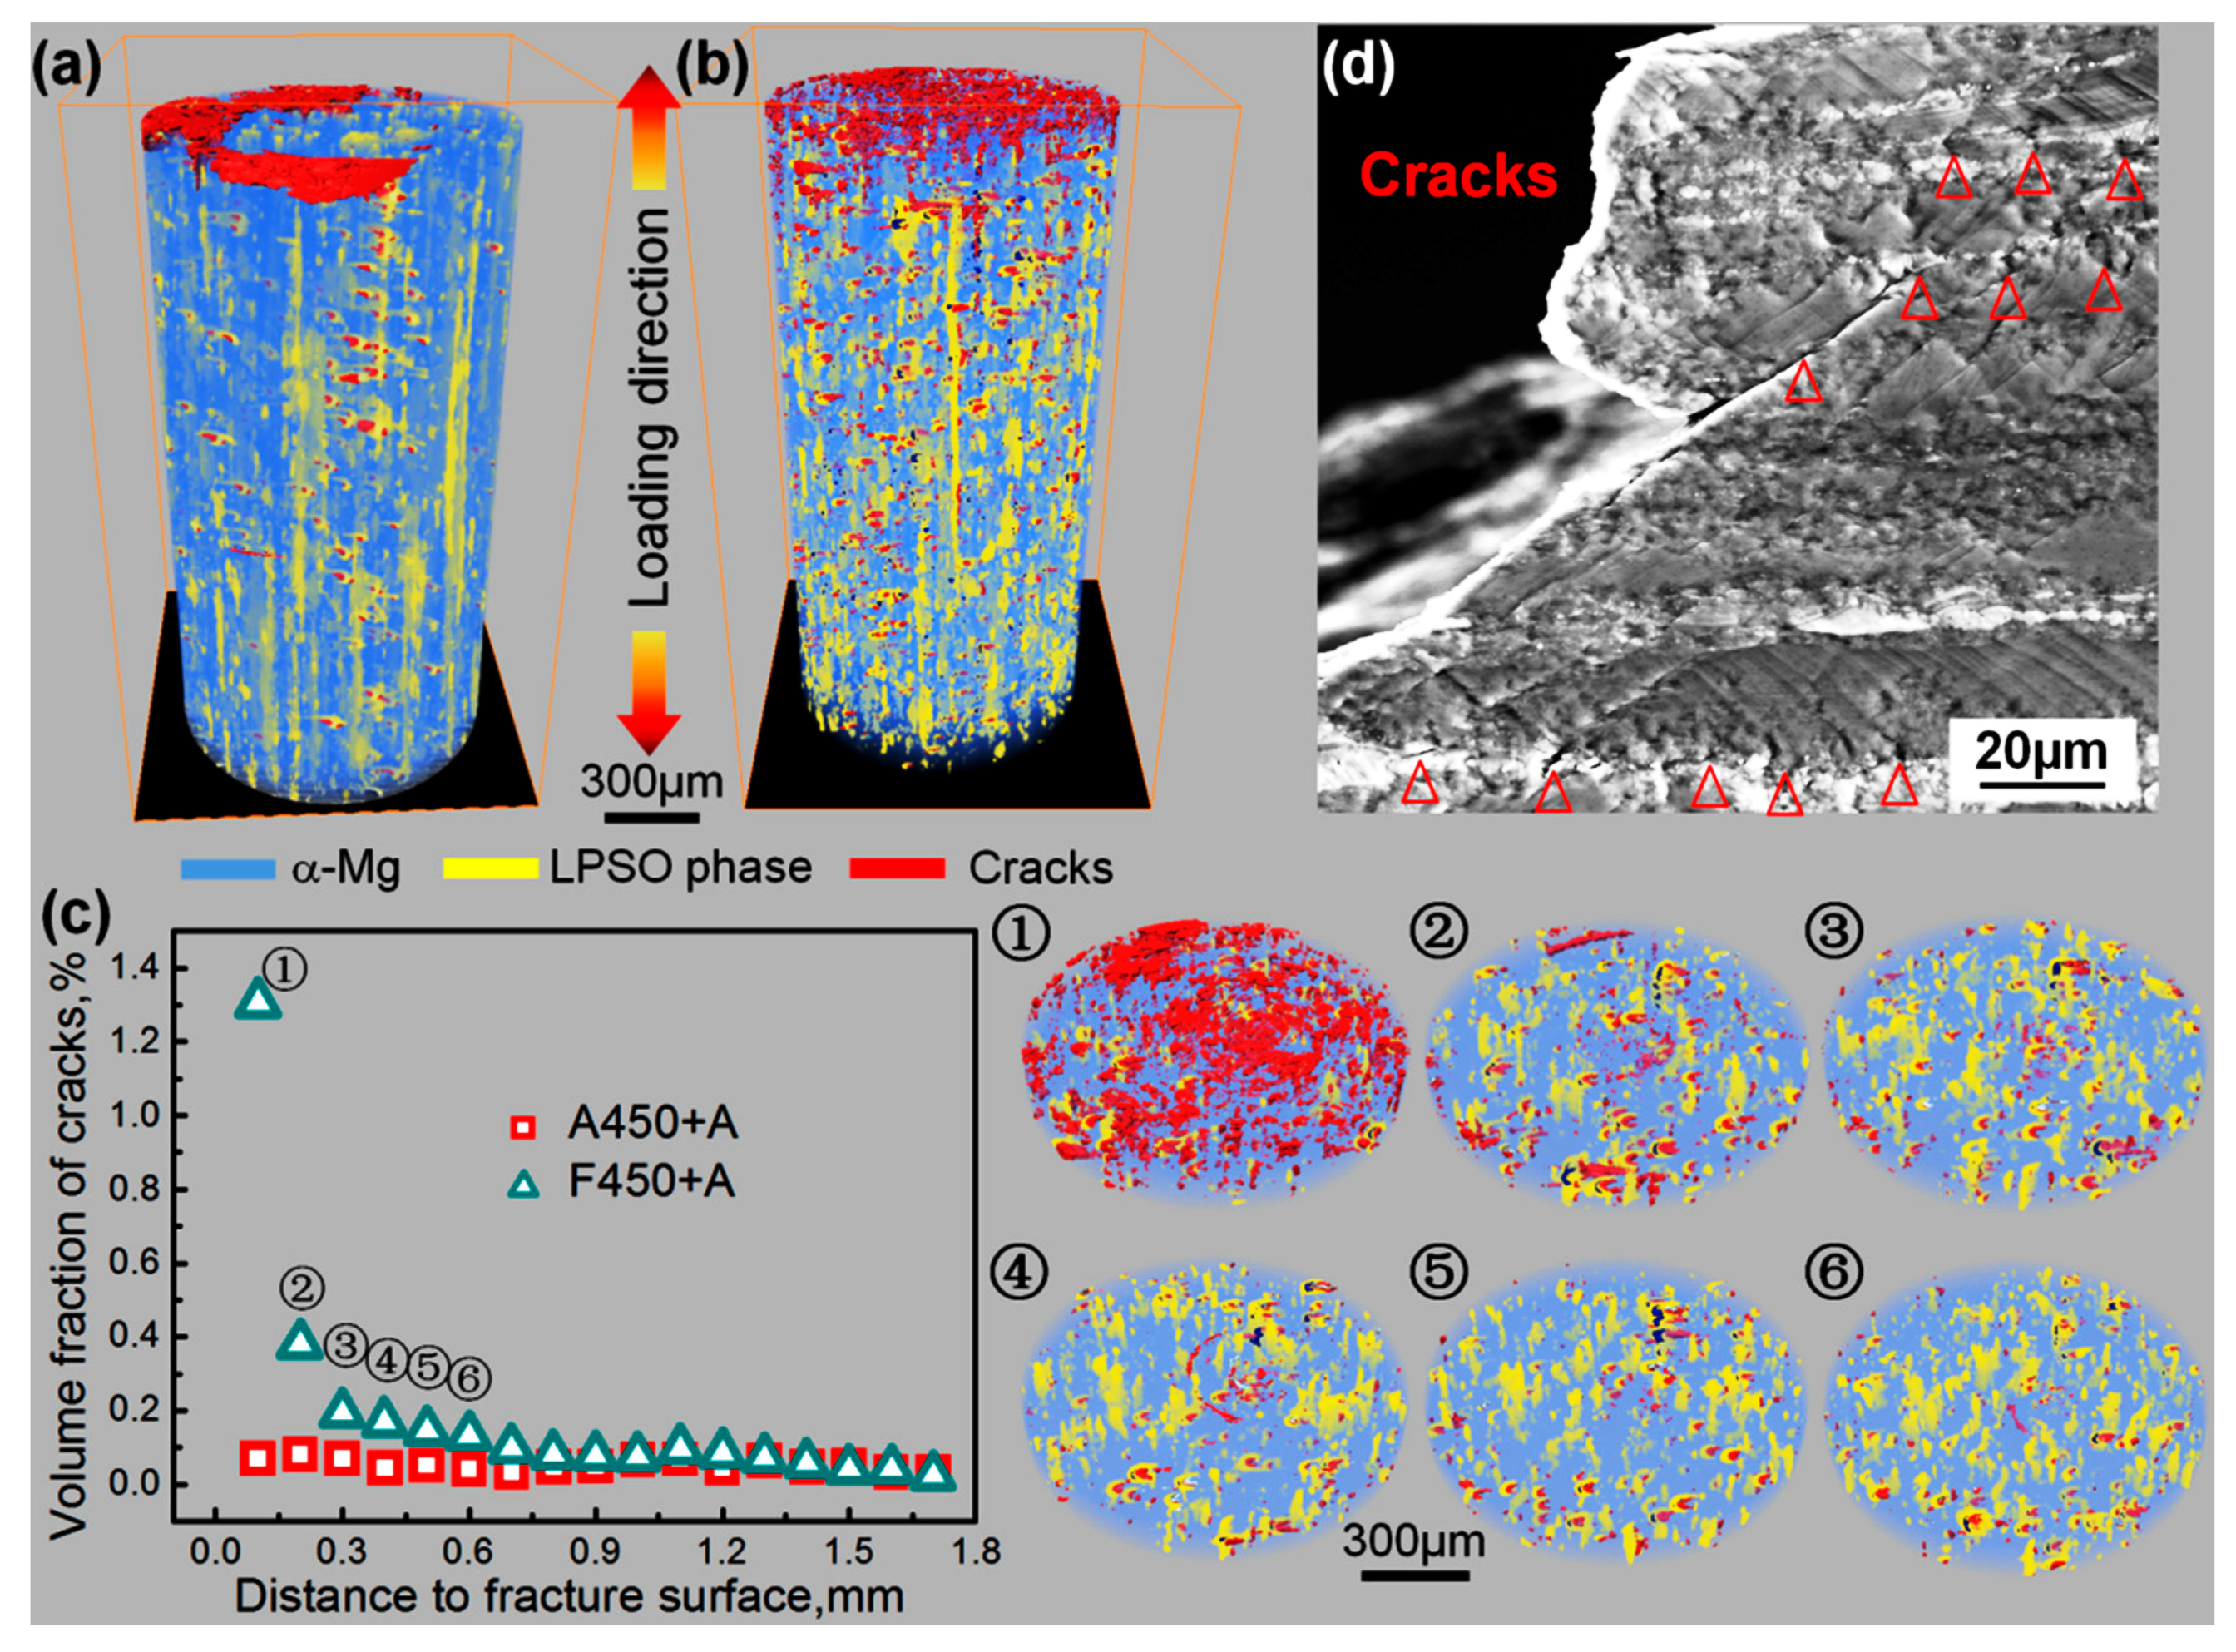
The requirement for the weight reduction of the vehicles to reduce the CO2 emissions promotes the development of high strength Mg alloys, especially wrought Mg-Zn-rare earth (RE) alloys containing long period stacking ordered (LPSO) phases due to their comparable mechanical performance and lower density compared with Al alloys [13,48,49,50,51]. The as-extruded LPSO phase-containing Mg alloys always exhibit multimodal microstructure consist of block-shaped LPSO phases stretched along the ED, fine dynamically recrystallized (DRXed) grains and coarse worked grains, as shown in Figure 10 [13]. Since the (0001)<11 2 - 0> basal slip dominates plastic deformation of LPSO phases, the block-shaped LPSO phases exhibit strong anisotropy and act as reinforcements of the as-extruded LPSO phase-containing alloys, and, accordingly, they deform as laminated metal composites aforementioned [13]. For example, a high-performance Mg-8.2Gd-3.8Y-1Zn-0.4Zr (wt.%) alloy containing LPSO phase was fabricated by hot extrusion, the microstructure was modified via slow cooling and fast forced-air cooling processes, and then an artificial aging treatment was performed [13]. The slow and fast cooled samples are denoted as A450+A and F450+A, respectively. Both have typical multimodal microstructure, as shown in Figure 10, and the significant difference between them is that F450+A sample has higher volume fraction of coarse worked grains.
SR-μCT was used to characterize the crack distributions inside the fractured tensile samples and the 3D morphologies of cracks and block-shaped LPSO phases in the fractured A450+A and F450+A samples are illustrated in Figure 11a–c. In this experiment, the beam energy (24 keV) and pixel size (0.65 μm/pixel) were used, and 920 projections were collected from 0° to 180° with a step size of 0.2°. The F450+A sample has higher density of cracks, while the two samples have similar crack sizes. Besides, the crack volume fraction almost keeps constant for the A450+A sample, but increases rapidly with decreasing distance to the fracture surface of F450+A sample, suggesting that the fracture behavior is different for the two samples having different volume fractions of coarse worked grains. The slices adjacent to the fracture surface of the tensile fractured F450+A sample indicates that the bended LPSO phases facilitates the crack nucleation, and then the propagation and emergence of the cracks result in the fracture of the sample, which agrees well with the SEM observation shown in Figure 11d. In contrast, it seems that the cracks distribute homogeneously in the A450+A sample, while the cracks propagate rapidly and throughout the sample at the position of necking, which leads to a sudden fracture of the sample. Therefore, the A450+A sample with higher volume fraction of coarse worked grains has higher tolerance for cracking than A450+A sample.

2.6. Grain Mapping with Diffraction Contrast Tomography (DCT)

The SR-μCT with the absorption-contrast imaging is not sensitive to the grain boundaries or the orientations of the grains. This means that it is impossible to correlate the microstructure of the materials with the crystallographic orientations using SR-μCT. EBSD has been widely used to reveal the crystallographic microstructure of the materials with great spatial resolutions, but which only gives 2D surface information of the samples and so that only four of five parameters required for describing a full grain boundary are provided [52], which limits the investigation on the effect of the grain boundaries and crystallographic orientations on the fracture behavior of polycrystalline structural materials. In combination of EBSD and focused ion beam (FIB), EBSD can be extended into 3D-EBSD, while which has to serially section the sample by FIB for 3D reconstruction. Since 3D-EBSD is a destructive way and thus time-dependent observations, such as in-situ observation of the sample becomes impossible. In recent years, a wonderful technique called diffraction contrast tomography (DCT) was developed at SR beamlines to non-destructively characterize the 3D grain structures, which is carried out just by detection and analysis of the diffraction signals rather than the absorption signals [53]. Therefore, by using DCT, it is possible to unveil the fracture behavior of the structural materials by considering the crack nucleation and propagation influenced by grain boundaries and crystallographic orientations in 3D.
Intergranular stress corrosion cracking (IGSCC) is the nucleation and propagation of cracks by local corrosion along the grain boundaries, which is a critical fracture mechanism for structural metals. The IGSCC is influenced by some factors, such as susceptible materials, critical environment, and sufficient driving force. Generally, sensitization increases the local corrosion of grain boundaries, and the sensitization resistance is influenced by its grain boundary structure, but the relationship between local corrosion and grain boundary structure is still not clear. How to characterize the grain boundaries in 3D is critical to investigate this relationship between them. DCT provides an opportunity to resolve this issue in terms of 3D grain shapes and crystallographic orientations, and simultaneously absorption contrast image of the cracks can be obtained by collection of the absorption intensity signals. King et al. prepared a sample of austenitic stainless steel with a fully recrystallized microstructure (mean grain size of ~50 μm), and analyzed the effect of grain boundary structure on the IGSCC using DCT [54]. Figure 12 shows a 3D map of the grain size, shapes and their crystal orientations. The grain boundaries can be described by the relative crystal lattice misorientation between the adjacent grains. As a result, several sensitization-resistant crack-bridging boundaries are identified. In combination with in-situ SR-μCT characterization in corrosive environment, it is found that a specific range of grain boundaries have special properties and which directly correlate with the crack bridging development.
For metastable β titanium alloy Tiβ21S, its fatigue life is of special interest. Since the short crack stage can take over more than 90% of fatigue life, short fatigue cracks (SFCs) are the focus of research in fatigue performance. Generally, the growth of SFC shows a large scatter, which is associated with the orientation and shape of the local grains surrounding the SFC. In other words, these local grains influence the direction and growth rate of SFC by changing their local stress state. Therefore, a detailed analysis of SFC requires the information on shape, size and orientation of these grains. Herbig et al. performed heat treatment on the metastable β titanium alloy Tiβ21S to decorate grain boundaries with alpha precipitates [55]. Time-lapse DCT combined with phase contrast tomography were used to correlate crystallographic orientations of the grains and the grain boundaries with local crack propagation during fatigue test. Figure 13 shows the distribution of SFC and grain boundaries, and the relationship between them [55]. It is apparent that the shape and orientation of grains around the SFC changes the growth rate of fatigue crack. This approach has been developed to analyze the growth rate of fatigue crack and crystallographic orientation of the fracture surface from a view of 3D visualization.

3. Summary and Future Prospects

The high flux, temporal and spatial resolutions of the synchrotron X-ray sources enable the 4D, namely the time-resolved in-situ 3D, non-destructive characterization of fracture behavior using the SR-μCT. By setting up various environmental or mechanical loading stages, it is possible to characterize the crack nucleation and growth in the materials under extreme environmental and/or loading conditions, to investigate the fracture behavior of the materials under the service conditions. Furthermore, it is a trend to utilize the X-ray CT coupling with other technologies, such as diffraction contrast tomography (DCT), diffraction, fluorescence and small angle scattering, to build up the 3D multifaceted information of materials (microstructure, orientation, precipitated phase, etc.), which definitely attracts much more academic attention to promote the understanding of the fracture behavior of the materials.

Author Contributions

Conceptualization, G.F. and L.G.; Methodology, C.X.; Data acquisition and analysis, M.H., H.W., G.T. and K.M.; Discussion, H.K. and T.W.; Resources, H.X. and T.X.; Writing—Original Draft Preparation, C.X.; Project Administration, G.F. and C.X.; and Funding Acquisition, G.F.

Funding

This work was financially supported by the National Key research & development Plan (Grant Nos. 2017YFA0403803 and 2017YFB0703100) and the National Natural Science Foundation of China (Grant Nos. 51801042, 51571070, and 51571071).

Conflicts of Interest

The authors declare no conflict of interest.

References

  1. Wu, S.C.; Hu, Y.N.; Duan, H.; Yu, C.; Jiao, H.S. On the fatigue performance of laser hybrid welded high Zn 7000 alloys for next generation railway components. Int. J. Fatigue 2016, 91, 1–10. [Google Scholar] [CrossRef]
  2. Gao, Y.K.; Li, X.B.; Yang, Q.X.; Yao, M. Influence of surface integrity on fatigue strength of 40CrNi2Si2MoVA steel. Mater. Lett. 2007, 61, 466–469. [Google Scholar] [CrossRef]
  3. Withers, P.J. Fracture mechanics by three-dimensional crack-tip synchrotron X-ray microscopy. Philos. Trans. R. Soc. A 2015, 373, 20130157. [Google Scholar] [CrossRef] [PubMed]
  4. Stock, S.R. Recent advances in X-ray microtomography applied to materials. Int. Mater. Rev. 2013, 53, 129–181. [Google Scholar] [CrossRef]
  5. Wu, S.C.; Yu, C.; Zhang, W.H.; Fu, Y.N.; Helfen, L. Porosity induced fatigue damage of laser welded 7075-T6 joints investigated via synchrotron X-ray microtomography. Sci. Technol. Weld. Join. 2015, 20, 11–19. [Google Scholar] [CrossRef]
  6. Hounsfield, G.N. Computerized transverse axial scanning (tomography): Part I. Description of system. Br. J. Radiol. 1973, 46, 1016–1022. [Google Scholar] [CrossRef] [PubMed]
  7. Wu, S.C.; Xiao, T.Q.; Withers, P.J. The imaging of failure in structural materials by synchrotron radiation X-ray microtomography. Eng. Fract. Mech. 2017, 182, 127–156. [Google Scholar] [CrossRef]
  8. Stock, S.R. X-ray microtomography of materials. Int. Mater. Rev. 2013, 44, 141–164. [Google Scholar] [CrossRef]
  9. Wang, T.; Xu, J.; Xiao, T.; Xie, H.; Li, J.; Li, T.; Cao, Z. Evolution of dendrite morphology of a binary alloy under an applied electric current: An in situ observation. Phys. Rev. E 2010, 81, 042601. [Google Scholar] [CrossRef] [PubMed]
  10. Wang, T.; Cao, F.; Zhou, P.; Kang, H.; Chen, Z.; Fu, Y.; Xiao, T.; Huang, W.; Yuan, Q. Study on diffusion behavior and microstructural evolution of Al/Cu bimetal interface by synchrotron X-ray radiography. J. Alloys Compd. 2014, 616, 550–555. [Google Scholar] [CrossRef]
  11. Kamitsubo, H. Spring 8 program. J. Synchrotron Radiat. 1997, 5, 162–167. [Google Scholar] [CrossRef] [PubMed]
  12. Huang, M.; Fan, G.H.; Geng, L.; Cao, G.J.; Du, Y.; Wu, H.; Zhang, T.T.; Kang, H.J.; Wang, T.M.; Du, G.H.; et al. Revealing extraordinary tensile plasticity in layered Ti-Al metal composite. Sci. Rep. 2016, 6, 38461. [Google Scholar] [CrossRef] [PubMed] [Green Version]
  13. Xu, C.; Fan, G.H.; Nakata, T.; Liang, X.; Chi, Y.Q.; Qiao, X.G.; Cao, G.J.; Zhang, T.T.; Huang, M.; Miao, K.S.; et al. Deformation behavior of ultra-strong and ductile Mg-Gd-Y-Zn-Zr alloy with bimodal structure. Metall. Mater. Trans. A 2018, 49, 1931–1947. [Google Scholar] [CrossRef]
  14. Sasov, A.; Pauwels, B.; Bruyndonckx, P.; Liu, X.; McNulty, I.; Eyberger, C.; Lai, B. New lens-free X-ray source for laboratory nano-CT with 50-nm spatial resolution. AIP Conf. Proc. 2011, 1365, 140–143. [Google Scholar]
  15. Cloetens, P.; Barrett, R.; Baruchel, J.; Guigay, J.P.; Schlenker, M. Phase objects in synchrotron radiation hard X-ray imaging. J. Phys. D Appl. Phys. 1996, 29, 133–146. [Google Scholar] [CrossRef]
  16. Marrow, T. High resolution X-ray tomography of short fatigue crack nucleation in austempered ductile cast iron. Int. J. Fatigue 2004, 26, 717–725. [Google Scholar] [CrossRef]
  17. Garces, G.; Morris, D.G.; Muñoz-Morris, M.A.; Perez, P.; Tolnai, D.; Mendis, C.; Stark, A.; Lim, H.K.; Kim, S.; Shell, N.; et al. Plasticity analysis by synchrotron radiation in a Mg97Y2Zn1 alloy with bimodal grain structure and containing LPSO phase. Acta Mater. 2015, 94, 78–86. [Google Scholar] [CrossRef]
  18. Fu, H.; Ge, B.; Xin, Y.; Wu, R.; Fernandez, C.; Huang, J.; Peng, Q. Achieving high strength and ductility in magnesium alloys via densely hierarchical double contraction nanotwins. Nano Lett. 2017, 17, 6117–6124. [Google Scholar] [CrossRef] [PubMed]
  19. Zhang, H.; Toda, H.; Hara, H.; Kobayashi, M.; Kobayashi, T.; Sugiyama, D.; Kuroda, N.; Uesugi, K. Three-dimensional visualization of the interaction between fatigue crack and micropores in an aluminum alloy using synchrotron X-ray microtomography. Metall. Mater. Trans. A 2007, 38, 1774–1785. [Google Scholar] [CrossRef]
  20. Kabir, M.; Bulpett, R. A study of fatigue failure initiation in high cycle high-pressure automotive applications and conventional rotating bending fatigue testing. Int. J. Fatigue 2007, 29, 1966–1970. [Google Scholar] [CrossRef]
  21. Wu, S.C.; Yu, C.; Yu, P.S.; Buffière, J.Y.; Helfen, L.; Fu, Y.N. Corner fatigue cracking behavior of hybrid laser AA7020 welds by synchrotron X-ray computed microtomography. Mater. Sci. Eng. A 2016, 651, 604–614. [Google Scholar] [CrossRef]
  22. Pannemaecker, A.; Fouvry, S.; Brochu, M.; Buffiere, J.Y. Identification of the fatigue stress intensity factor threshold for different load ratios R: From fretting fatigue to C(T) fatigue experiments. Int. J. Fatigue 2016, 82, 211–225. [Google Scholar] [CrossRef]
  23. Landis, E.N.; Nagy, E.N.; Keane, D.T. Microstructure and fracture in three dimensions. Eng. Fract. Mech. 2003, 70, 911–925. [Google Scholar] [CrossRef]
  24. Zhu, M.L.; Xuan, F.Z.; Tu, S.T. Observation and modeling of physically short fatigue crack closure in terms of in-situ SEM fatigue test. Mater. Sci. Eng. A 2014, 618, 86–95. [Google Scholar] [CrossRef]
  25. Dezecot, S.; Maurel, V.; Buffiere, J.; Szmytka, F.; Koster, A. 3D characterization and modeling of low cycle fatigue damage mechanisms at high temperature in a cast aluminum alloy. Acta Mater. 2017, 123, 24–34. [Google Scholar] [CrossRef]
  26. Dezecot, S.; Buffiere, J.Y.; Koster, A.; Maurel, V.; Szmytka, F.; Charkaluk, E.; Dahdah, N.; El Bartali, A.; Limodin, N.; Witz, J.F. In situ 3D characterization of high temperature fatigue damage mechanisms in a cast aluminum alloy using synchrotron X-ray tomography. Scr. Mater. 2016, 113, 254–258. [Google Scholar] [CrossRef]
  27. Maire, E.; Carmona, V.; Courbon, J.; Ludwig, W. Fast X-ray tomography and acoustic emission study of damage in metals during continuous tensile tests. Acta Mater. 2007, 55, 6806–6815. [Google Scholar] [CrossRef]
  28. Baaklini, G.Y.; Bhatt, R.T.; Eckel, A.J.; Engler, P.; Rauser, R.W.; Castelli, M.G. X-ray microtomography of ceramic and metal matrix composites. Mater Eval. 1995, 53, 1040–1044. [Google Scholar]
  29. Sinclair, R.; Preuss, M.; Maire, E.; Buffiere, J.Y.; Bowen, P.; Withers, P.J. The effect of fibre fractures in the bridging zone of fatigue cracked Ti–6Al–4V/SiC fibre composites. Acta Mater. 2004, 52, 1423–1438. [Google Scholar] [CrossRef]
  30. Silva, C.M.; Snead, L.L.; Hunn, J.D.; Specht, E.D.; Terrani, K.A.; Katoh, Y. Application of X-ray microcomputed tomography in the characterization of irradiated nuclear fuel and material specimens. J. Microsc. 2015, 260, 163–174. [Google Scholar] [CrossRef] [PubMed]
  31. Wu, H.; Fan, G.; Huang, M.; Geng, L.; Cui, X.; Xie, H. Deformation behavior of brittle/ductile multilayered composites under interface constraint effect. Int. J. Plast. 2017, 89, 96–109. [Google Scholar] [CrossRef]
  32. Wu, H.; Fan, G.; Jin, B.C.; Geng, L.; Cui, X.; Huang, M. Fabrication and mechanical properties of TiBw/Ti-Ti(Al) laminated composites. Mater. Des. 2016, 89, 697–702. [Google Scholar] [CrossRef]
  33. Wu, H.; Jin, B.C.; Geng, L.; Fan, G.; Cui, X.; Huang, M. Ductile-phase toughening in TiBw/Ti-Ti3Al metallic-intermetallic laminate composites. Metall. Mater. Trans. A 2015, 46, 3803–3807. [Google Scholar] [CrossRef]
  34. Fang, T.H.; Li, W.L.; Tao, N.R.; Lu, K. Revealing extraordinary intrinsic tensile plasticity in gradient nano-grained copper. Science 2011, 331, 1587–1590. [Google Scholar] [CrossRef] [PubMed]
  35. Wu, X.L.; Jiang, P.; Chen, L.; Yuan, F.P.; Zhu, Y.T. Extraordinary strain hardening by gradient structure. Proc. Natl. Acad. Sci. USA 2014, 111, 7197–7201. [Google Scholar] [CrossRef] [PubMed] [Green Version]
  36. Lu, K. Making strong nanomaterials ductile with gradients. Science 2014, 345, 1455–1456. [Google Scholar] [CrossRef] [PubMed]
  37. Du, Y.; Fan, G.; Yu, T.; Hansen, N.; Geng, L.; Huang, X. Laminated Ti-Al composites: Processing, structure and strength. Mater. Sci. Eng. A 2016, 673, 572–580. [Google Scholar] [CrossRef]
  38. Huang, M.; Xu, C.; Fan, G.; Maawad, E.; Gan, W.; Geng, L.; Lin, F.; Tang, G.; Wu, H.; Du, Y.; et al. Role of layered structure in ductility improvement of layered Ti-Al metal composite. Acta Mater. 2018, 153, 235–249. [Google Scholar] [CrossRef]
  39. Akatsu, T.; Suzuki, M.; Tanabe, Y.; Yasuda, E. Effects of whisker content and dimensions on the R-curve behavior of an alumina matrix composite reinforced with silicon carbide whiskers. J. Mater. Res. 2001, 16, 1919–1927. [Google Scholar] [CrossRef]
  40. Papazian, J.M.; Adler, P.N. Tensile properties of short fiber-reinforced SiC/Al composites: Part I. Effects of matrix precipitates. Metall. Trans. A 1990, 21, 401–410. [Google Scholar] [CrossRef]
  41. Selvakumar, S.; Dinaharan, I.; Palanivel, R.; Ganesh Babu, B. Characterization of molybdenum particles reinforced Al6082 aluminum matrix composites with improved ductility produced using friction stir processing. Mater. Charact. 2017, 125, 13–22. [Google Scholar] [CrossRef]
  42. Tzamtzis, S.; Barekar, N.S.; Hari Babu, N.; Patel, J.; Dhindaw, B.K.; Fan, Z. Processing of advanced Al/SiC particulate metal matrix composites under intensive shearing-A novel Rheo-process. Compos. Part A Appl. Sci. Manuf. 2009, 40, 144–151. [Google Scholar] [CrossRef]
  43. Nie, C.Z.; Gu, J.J.; Liu, J.L.; Zhang, D. Production of boron carbide reinforced 2024 aluminum matrix composites by mechanical alloying. Mater. Trans. 2007, 48, 990–995. [Google Scholar] [CrossRef]
  44. Wu, H.; Fan, G.; Huang, M.; Geng, L.; Cui, X.; Chen, R.; Peng, G. Fracture behavior and strain evolution of laminated composites. Compos. Struct. 2017, 163, 123–128. [Google Scholar] [CrossRef]
  45. Fan, G.; Geng, L.; Wu, H.; Miao, K.; Cui, X.; Kang, H.; Wang, T.; Xie, H.; Xiao, T. Improving the tensile ductility of metal matrix composites by laminated structure: A coupled X-ray tomography and digital image correlation study. Scr. Mater. 2017, 135, 63–67. [Google Scholar] [CrossRef]
  46. Miao, K.; Li, D.; Tang, G.; Xu, C.; Geng, L.; Zhang, J.; Leng, X.; Kang, H.; Wang, T.; Yan, S.; et al. High elongation achieved by band-like distribution of reinforcements in aluminum matrix composites. Mater. Charact. 2018, 144, 42–47. [Google Scholar] [CrossRef]
  47. Williams, J.J.; Flom, Z.; Amell, A.A.; Chawla, N.; Xiao, X.; De Carlo, F. Damage evolution in SiC particle reinforced Al alloy matrix composites by X-ray synchrotron tomography. Acta Mater. 2010, 58, 6194–6205. [Google Scholar] [CrossRef]
  48. Xu, C.; Nakata, T.; Qiao, X.G.; Zheng, M.Y.; Wu, K.; Kamado, S. Ageing behavior of extruded Mg–8.2 Gd–3.8 Y–1.0 Zn–0.4 Zr (wt.%) alloy containing LPSO phase and γ′ precipitates. Sci. Rep. 2017, 7, 43391. [Google Scholar] [CrossRef] [PubMed]
  49. Shao, X.H.; Yang, Z.Q.; Ma, X.L. Strengthening and toughening mechanisms in Mg–Zn–Y alloy with a long period stacking ordered structure. Acta Mater. 2010, 58, 4760–4771. [Google Scholar] [CrossRef]
  50. Chen, T.; Chen, Z.; Shao, J.; Wang, R.; Mao, L.; Liu, C. Evolution of LPSO phases in a Mg-Zn-Y-Gd-Zr alloy during semi-continuous casting, homogenization and hot extrusion. Mater. Des. 2018, 152, 1–9. [Google Scholar] [CrossRef]
  51. Garces, G.; Munoz-Morris, M.A.; Morris, D.G.; Jimenez, J.A.; Perez, P.; Adeva, P. The role of extrusion texture on strength and its anisotropy in a Mg-base alloy composed of the Long-Period-Structural-Order phase. Intermetallics 2014, 55, 167–176. [Google Scholar] [CrossRef] [Green Version]
  52. Randle, V. Overview no. 127 the role of the grain boundary plane in cubic polycrystals. Acta Mater. 1998, 46, 1459–1480. [Google Scholar] [CrossRef]
  53. Johnson, G.; King, A.; Honnicke, M.G.; Marrow, J.; Ludwig, W. X-ray diffraction contrast tomography: A novel technique for three-dimensional grain mapping of polycrystals. II. The combined case. J. Appl. Crystallogr. 2010, 41, 310–318. [Google Scholar] [CrossRef]
  54. King, A.; Johnson, G.; Engelberg, D.; Ludwig, W.; Marrow, J. Observations of intergranular stress corrosion cracking in a grain-mapped polycrystal. Science 2008, 321, 382–385. [Google Scholar] [CrossRef] [PubMed]
  55. Herbig, M.; King, A.; Reischig, P.; Proudhon, H.; Lauridsen, E.M.; Marrow, J. 3-D growth of a short fatigue crack within a polycrystalline microstructure studied using combined diffraction and phase-contrast X-ray tomography. Acta Mater. 2011, 59, 590–601. [Google Scholar] [CrossRef] [Green Version]
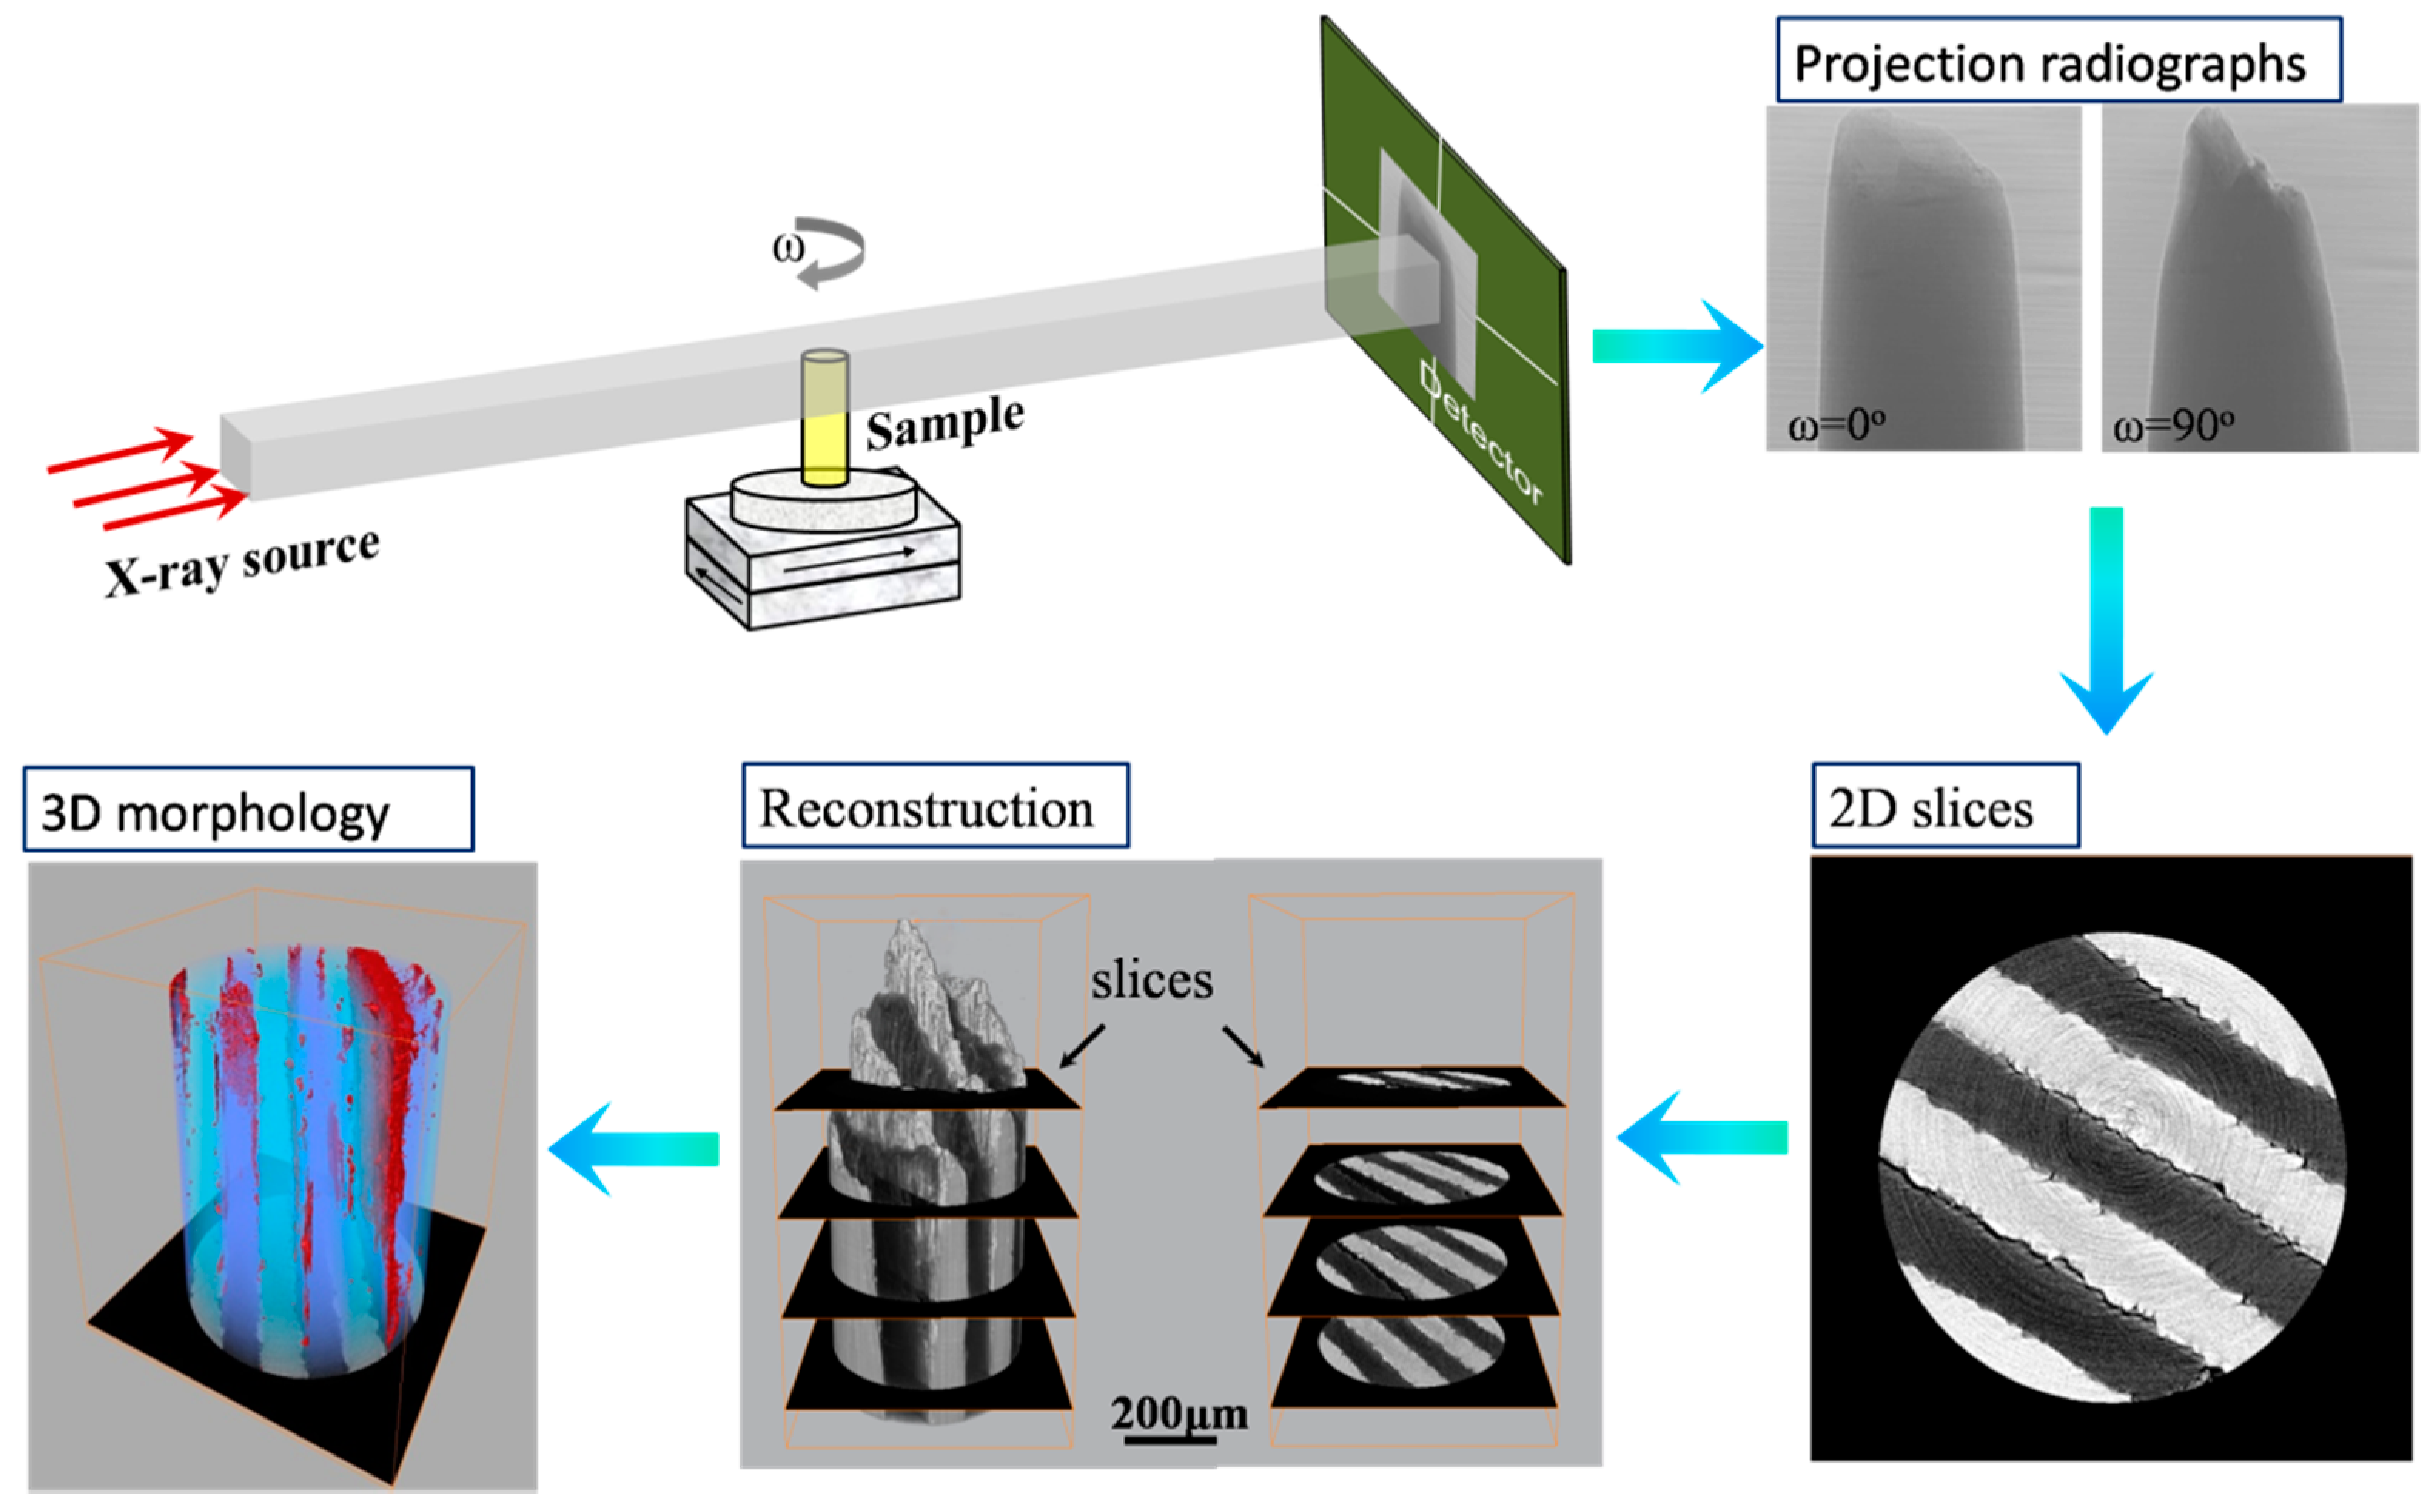
Figure 1. Schematic diagram of imaging principle of X-ray computed tomography.
Qubs 03 00005 g001
Figure 2. The X-ray attenuation length (which is the distance through which 37% of the X-ray intensity will penetrate) through various metals as a function of X-ray energy [7].
Qubs 03 00005 g002
Figure 3. Reconstructed tomographic slices of same region at different strain levels in two model composites (aluminum matrix composites reinforced by 4 vol.% of ZrO2/SiO2) observed by in-situ SR-μCT. The tensile direction is parallel to the horizontal direction. Fracture behavior of composite made of soft pure-aluminum matrix is mainly derived from decohesion along the particle/matrix interface. When hard aluminum alloy matrix is used, the damage of the composite initiate from particle fracture [27].
Qubs 03 00005 g003
Figure 4. Microstructure evolution of Ti-Al layered composites during fabrication process [31]. (af) SEM micrographs and energy dispersive X-ray spectroscopy (EDX) line scan (along white lines in (ac), from left to right) of the samples annealed at 1100 °C for: (a,d) 1 h; (b,e) 2 h; and (c,f) 3 h. The samples were initially heated treated at 700 °C for 1 h before high temperature annealing. (g) Kikuchi band contrast map retrieved from the electron backscattered diffraction (EBSD) results. The spatial coordinate system is represented by rolling (RD), normal (ND), and transverse (TD) directions.
Qubs 03 00005 g004
Figure 5. 3D characterizations of the fracture behavior in layered α2-Ti3Al /α-Ti composite [31]: (a) reconstructed slices and crack distribution observed along TD; (b) morphologies of the cracks abstracted from (a); and (c) quantitative results of the volume density of cracks plotted as a function of distance to fracture surface. Ten reconstructed volume for calculation (containing 80 slices, i.e., 52 μm in thickness along RD) are also given in the right side.
Qubs 03 00005 g005
Figure 6. Reconstructed crack morphology of the fractured LMC sample [12]: (a) 3D morphology of fractured LMC; (b) 2D tomographic slice in the fracture of LMC; (c) crack distribution under increased equivalent strain; and (d,e) the rapid crack nucleation and propagation near the fracture of abstracted Ti layer.
Qubs 03 00005 g006
Figure 7. 3D rendering of LMC based on the in-situ μCT [38]: (ae) distribution of cracks in the LMC tensile sample at various macro strains; (f) 2D projections of TD-ND plane of the sample tensioned to 10.0% and 20.0%; and (g) magnified morphology of the local fracture in the Ti layer of LMC in white dotted-line box in (e).
Qubs 03 00005 g007
Figure 8. SEM micrographs of the as-annealed: (a) 3ABO composite; (b) 5ABO composite; and (c) 10ABO composite [46].
Qubs 03 00005 g008
Figure 9. (ac) 3D renderings of the crack distributions in the fractured specimens of aluminum metal composites with 3 vol. %, 5 vol. %and 10 vol. % aluminum borate content, respectively. (d) The aluminum borate (ABO) distribution in the fractured aluminum metal composites with 10 vol.% aluminum borate content. The ABO-rich bands facilitate the nucleation of small cracks as marked by arrows. (e) The quantitative relationship of the crack volume fraction versus the distance away from the fracture surface [46].
Qubs 03 00005 g009
Figure 10. Optical micrographs of the as-extruded Mg-8.2Gd-3.8Y-1Zn-0.4Zr alloy taken from: (a,b) the transverse sections; and (c,d) longitudinal sections (a,c) A450; and (b,d) F450). The block-shaped phases and hot-worked grains are marked by red and yellow arrowheads, respectively [13].
Qubs 03 00005 g010
Figure 11. Microstructure of the fractured tensile samples [13]. 3D distributions of the cracks and LPSO phases in the fractured (a) A450+A and (b) F450+A samples using SR-μCT. (c) Curves of crack volume fractions plotted as a function of distance to the fracture surface of two fractured samples. The slices obtained from the F450+A sample for calculation are numbered 1–6 and shown on the right side. (d) SEM image taken from the F450+A sample adjacent to the fracture surface and the cracks are indicated by red arrowheads.
Qubs 03 00005 g011
Figure 12. The 3D grain map of austenitic stainless steel obtained by DCT, including 169 grains (a total of 362 grains were measured) [54]: (a) grain crystallographic orientation using an RBG scale; and (b) grain boundaries using colors. Different colors represent the different coincident site lattice (CSL).
Qubs 03 00005 g012
Figure 13. Fatigue crack from a 150 × 40 × 2 μm3 notch in Tiβ21S [55]: (a) the inclination of the crack to the z-axis using the stereographic projection from a standard μCT image; and (b) the crystallographic orientation of the crack from DCT. The black and white lines in (a,b), respectively, indicate intersections of the crack with the grain boundaries.
Qubs 03 00005 g013