
Seismic Performance Analysis of the Elevated RC Tanks under Strong Far- and Near-Fault Ground Motions Considering Fluid–Structure Interaction


Abstract
1. Introduction
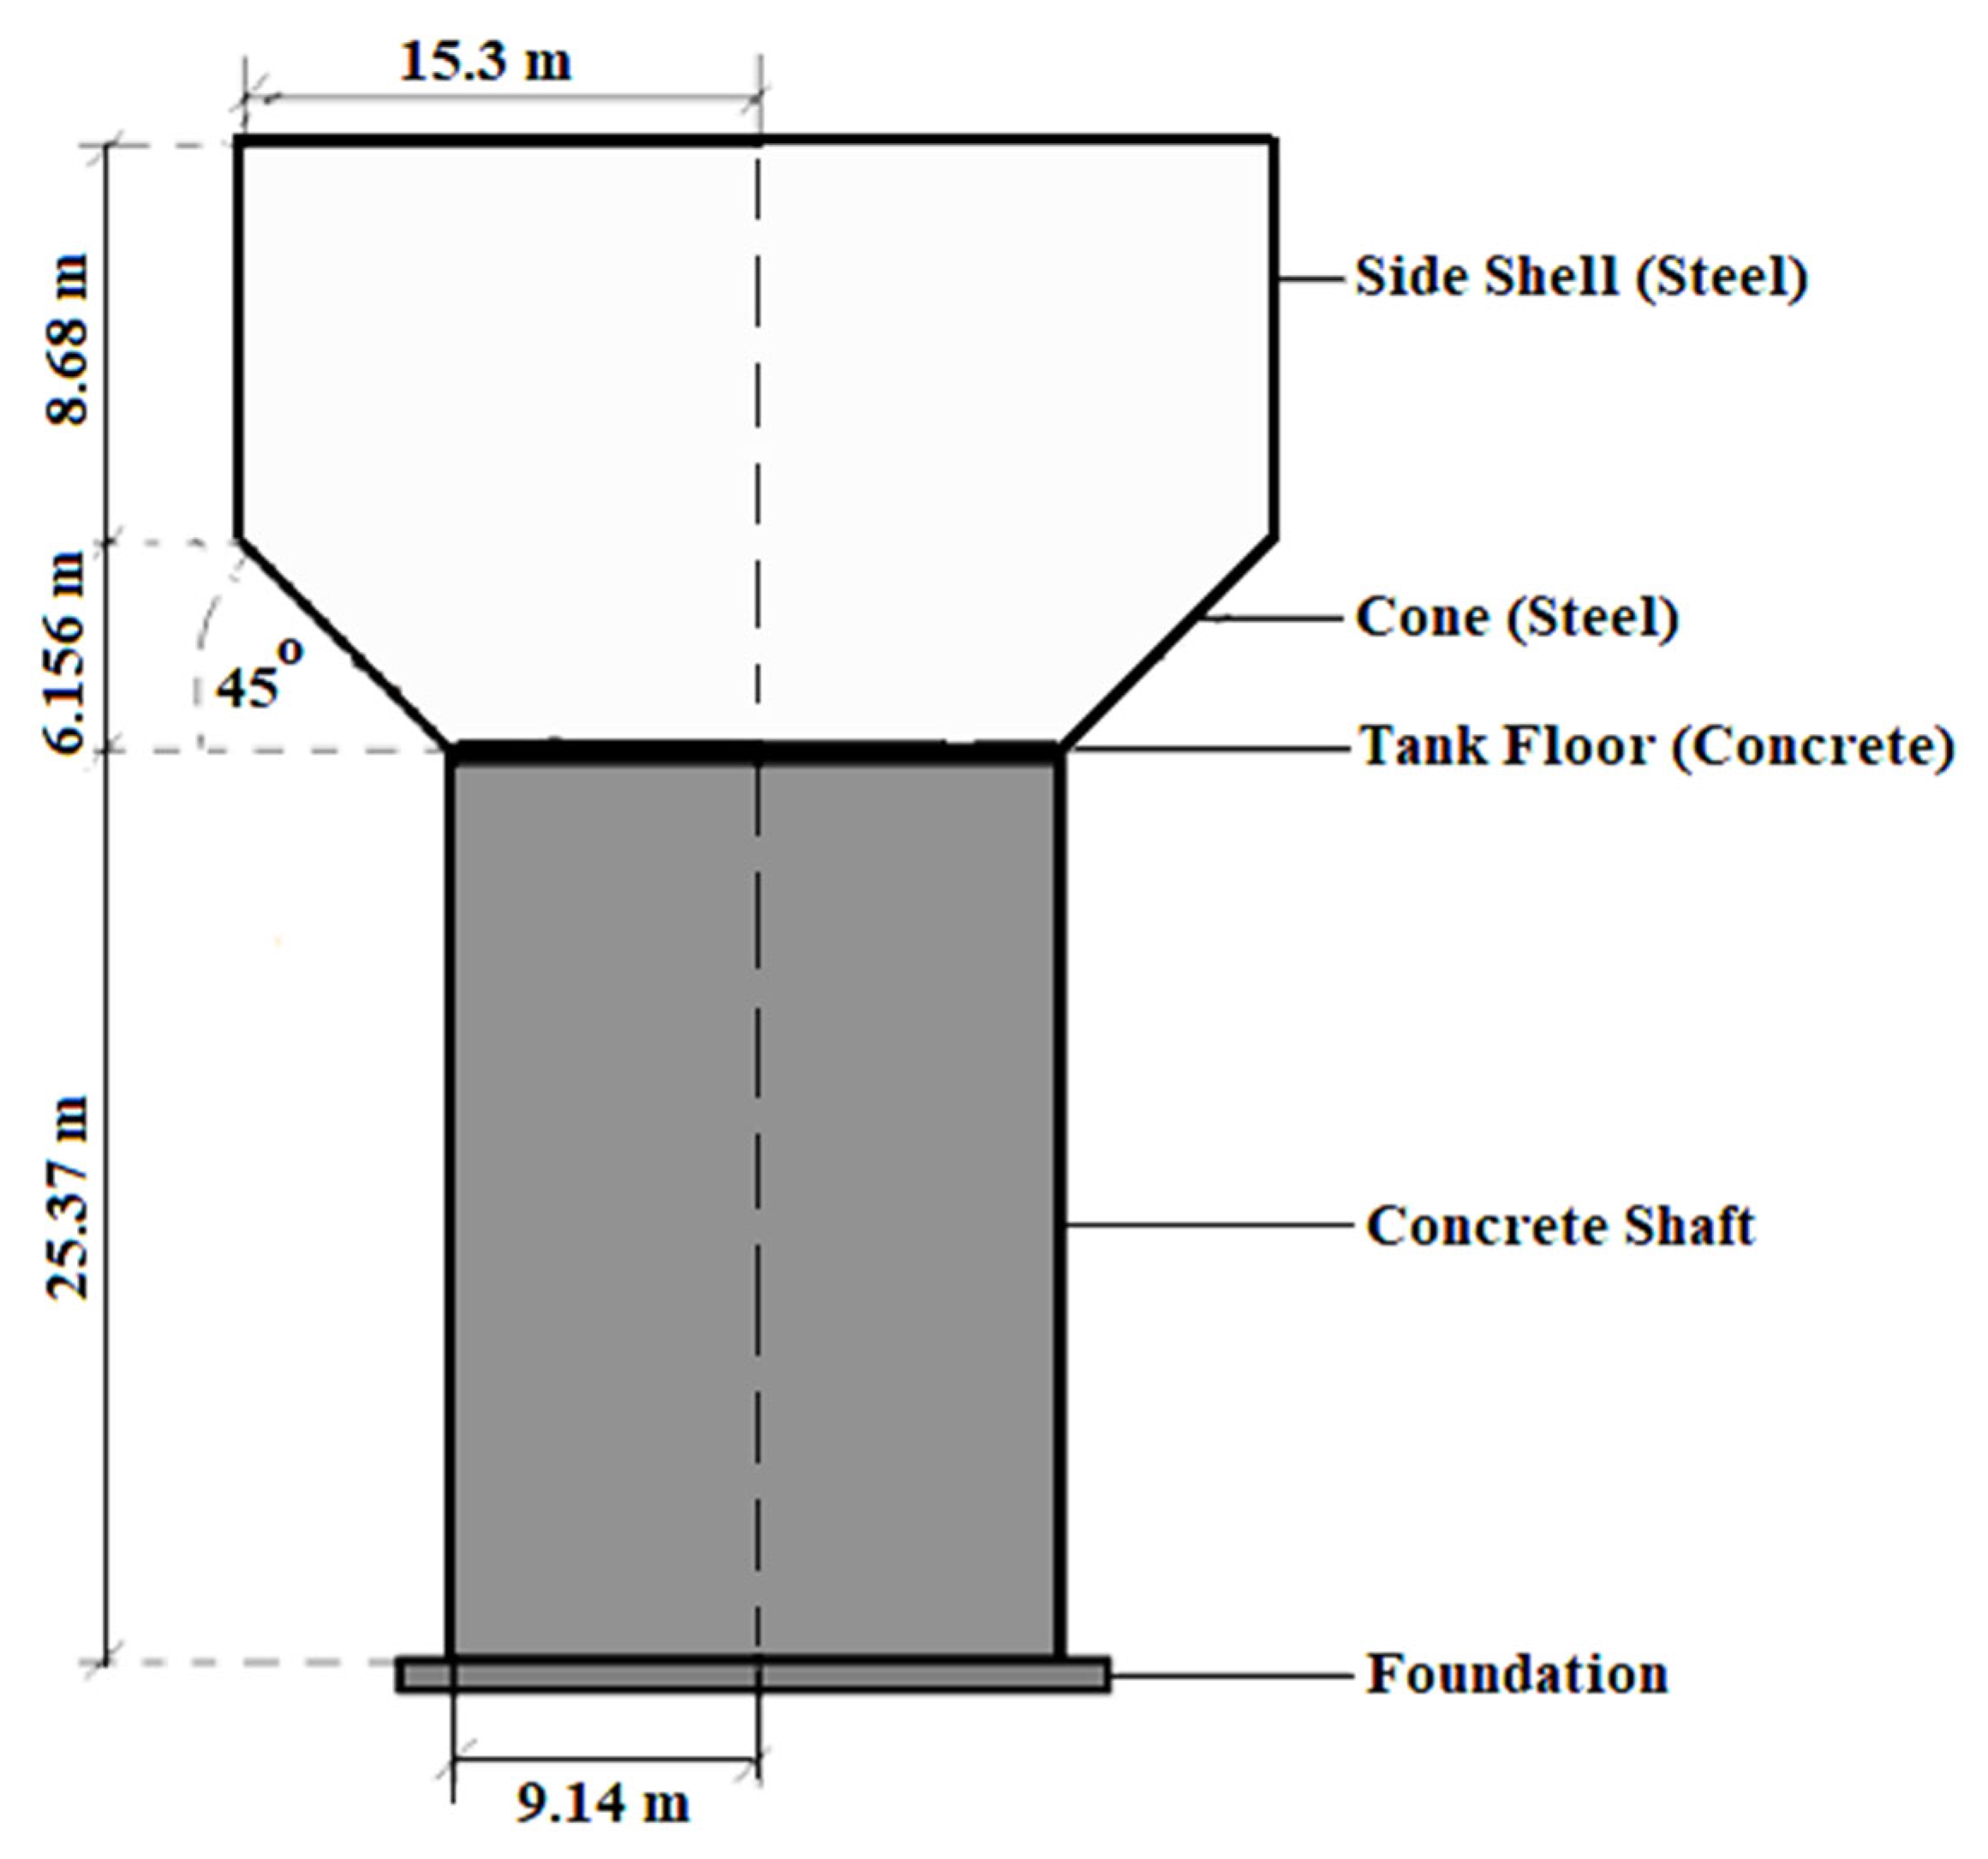
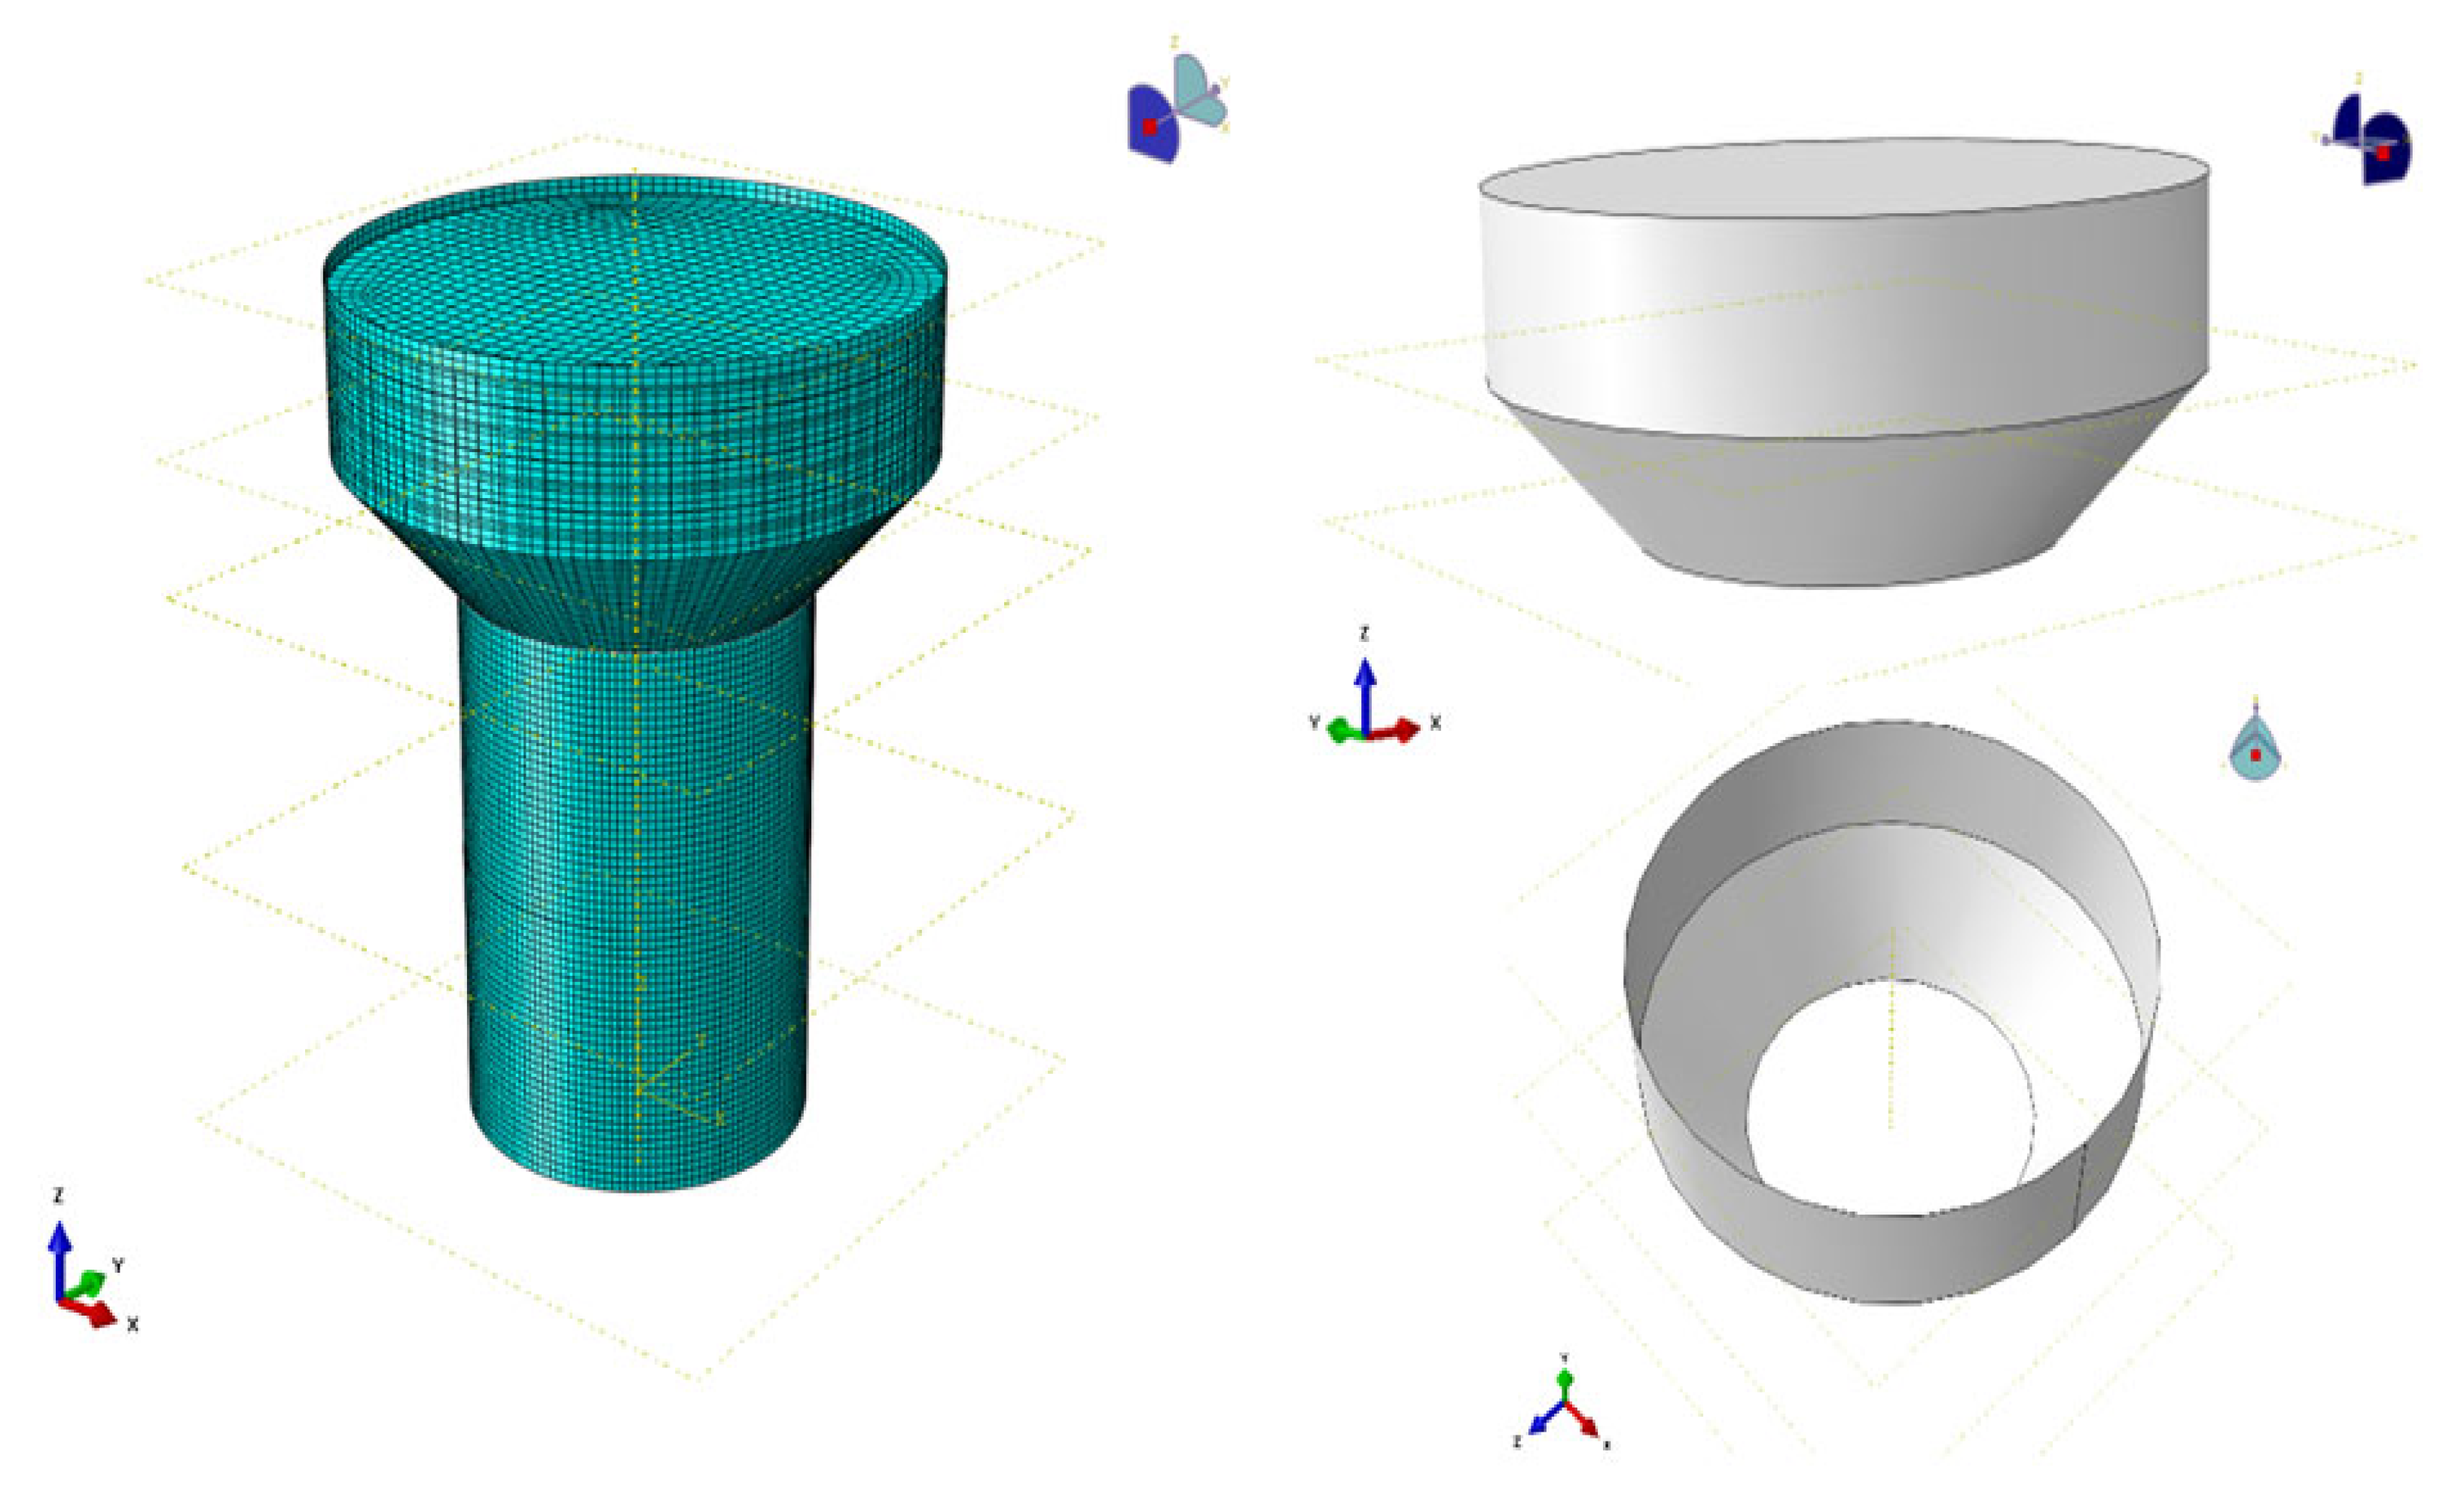
2. Model Characteristics


3. Nonlinear Dynamic Analysis
- ➢
- The thickness of the side shell: 8.8 mm;
- ➢
- The thickness of the shaft: 380 mm;
- ➢
- The thickness of the floor: 330 mm.

4. Verification
5. Results and Discussion
6. Conclusions
- The effect of the fluid sloshing on the overall reaction could be either increasing or reducing because the impulsive and sloshing components of the response did not reach their highest values at the same time. As a result, for design and implementation purposes, elevated concrete tanks should be analyzed and designed according to the environmental conditions and the construction region.
- Depending on the features of the ground motion records, the critical response of elevated tanks may occur even when there is only a small amount of fluid in the (almost) empty tank. As a result, it is always necessary to check all situations for the fluid content.
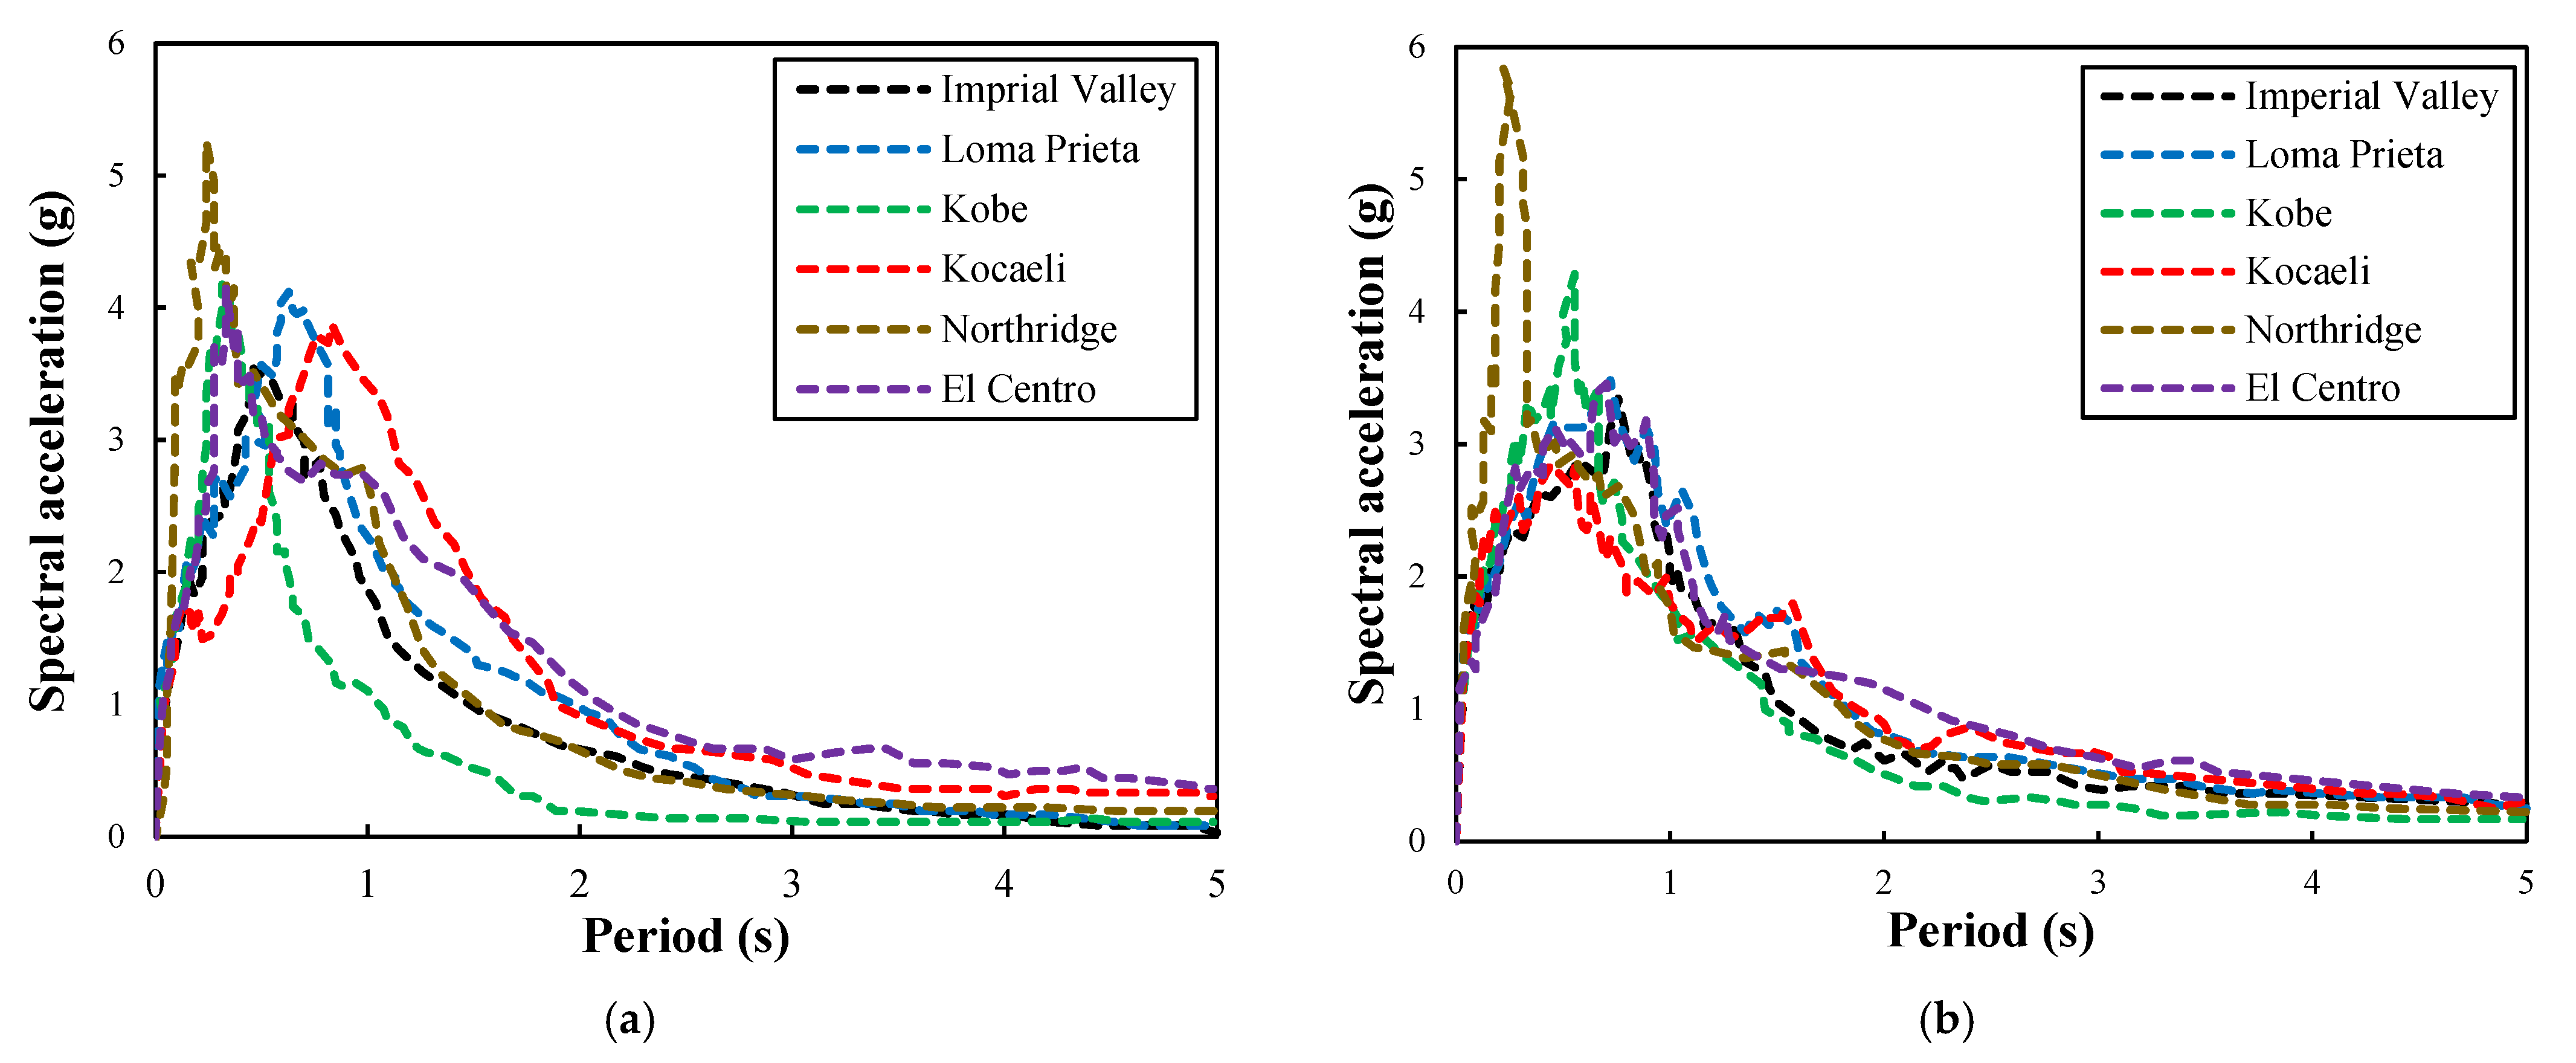
- The most crucial variables affecting the severity of or reduction in a tank’s responses are the earthquake’s frequency content and the physical characteristics of the natural frequency ranges.
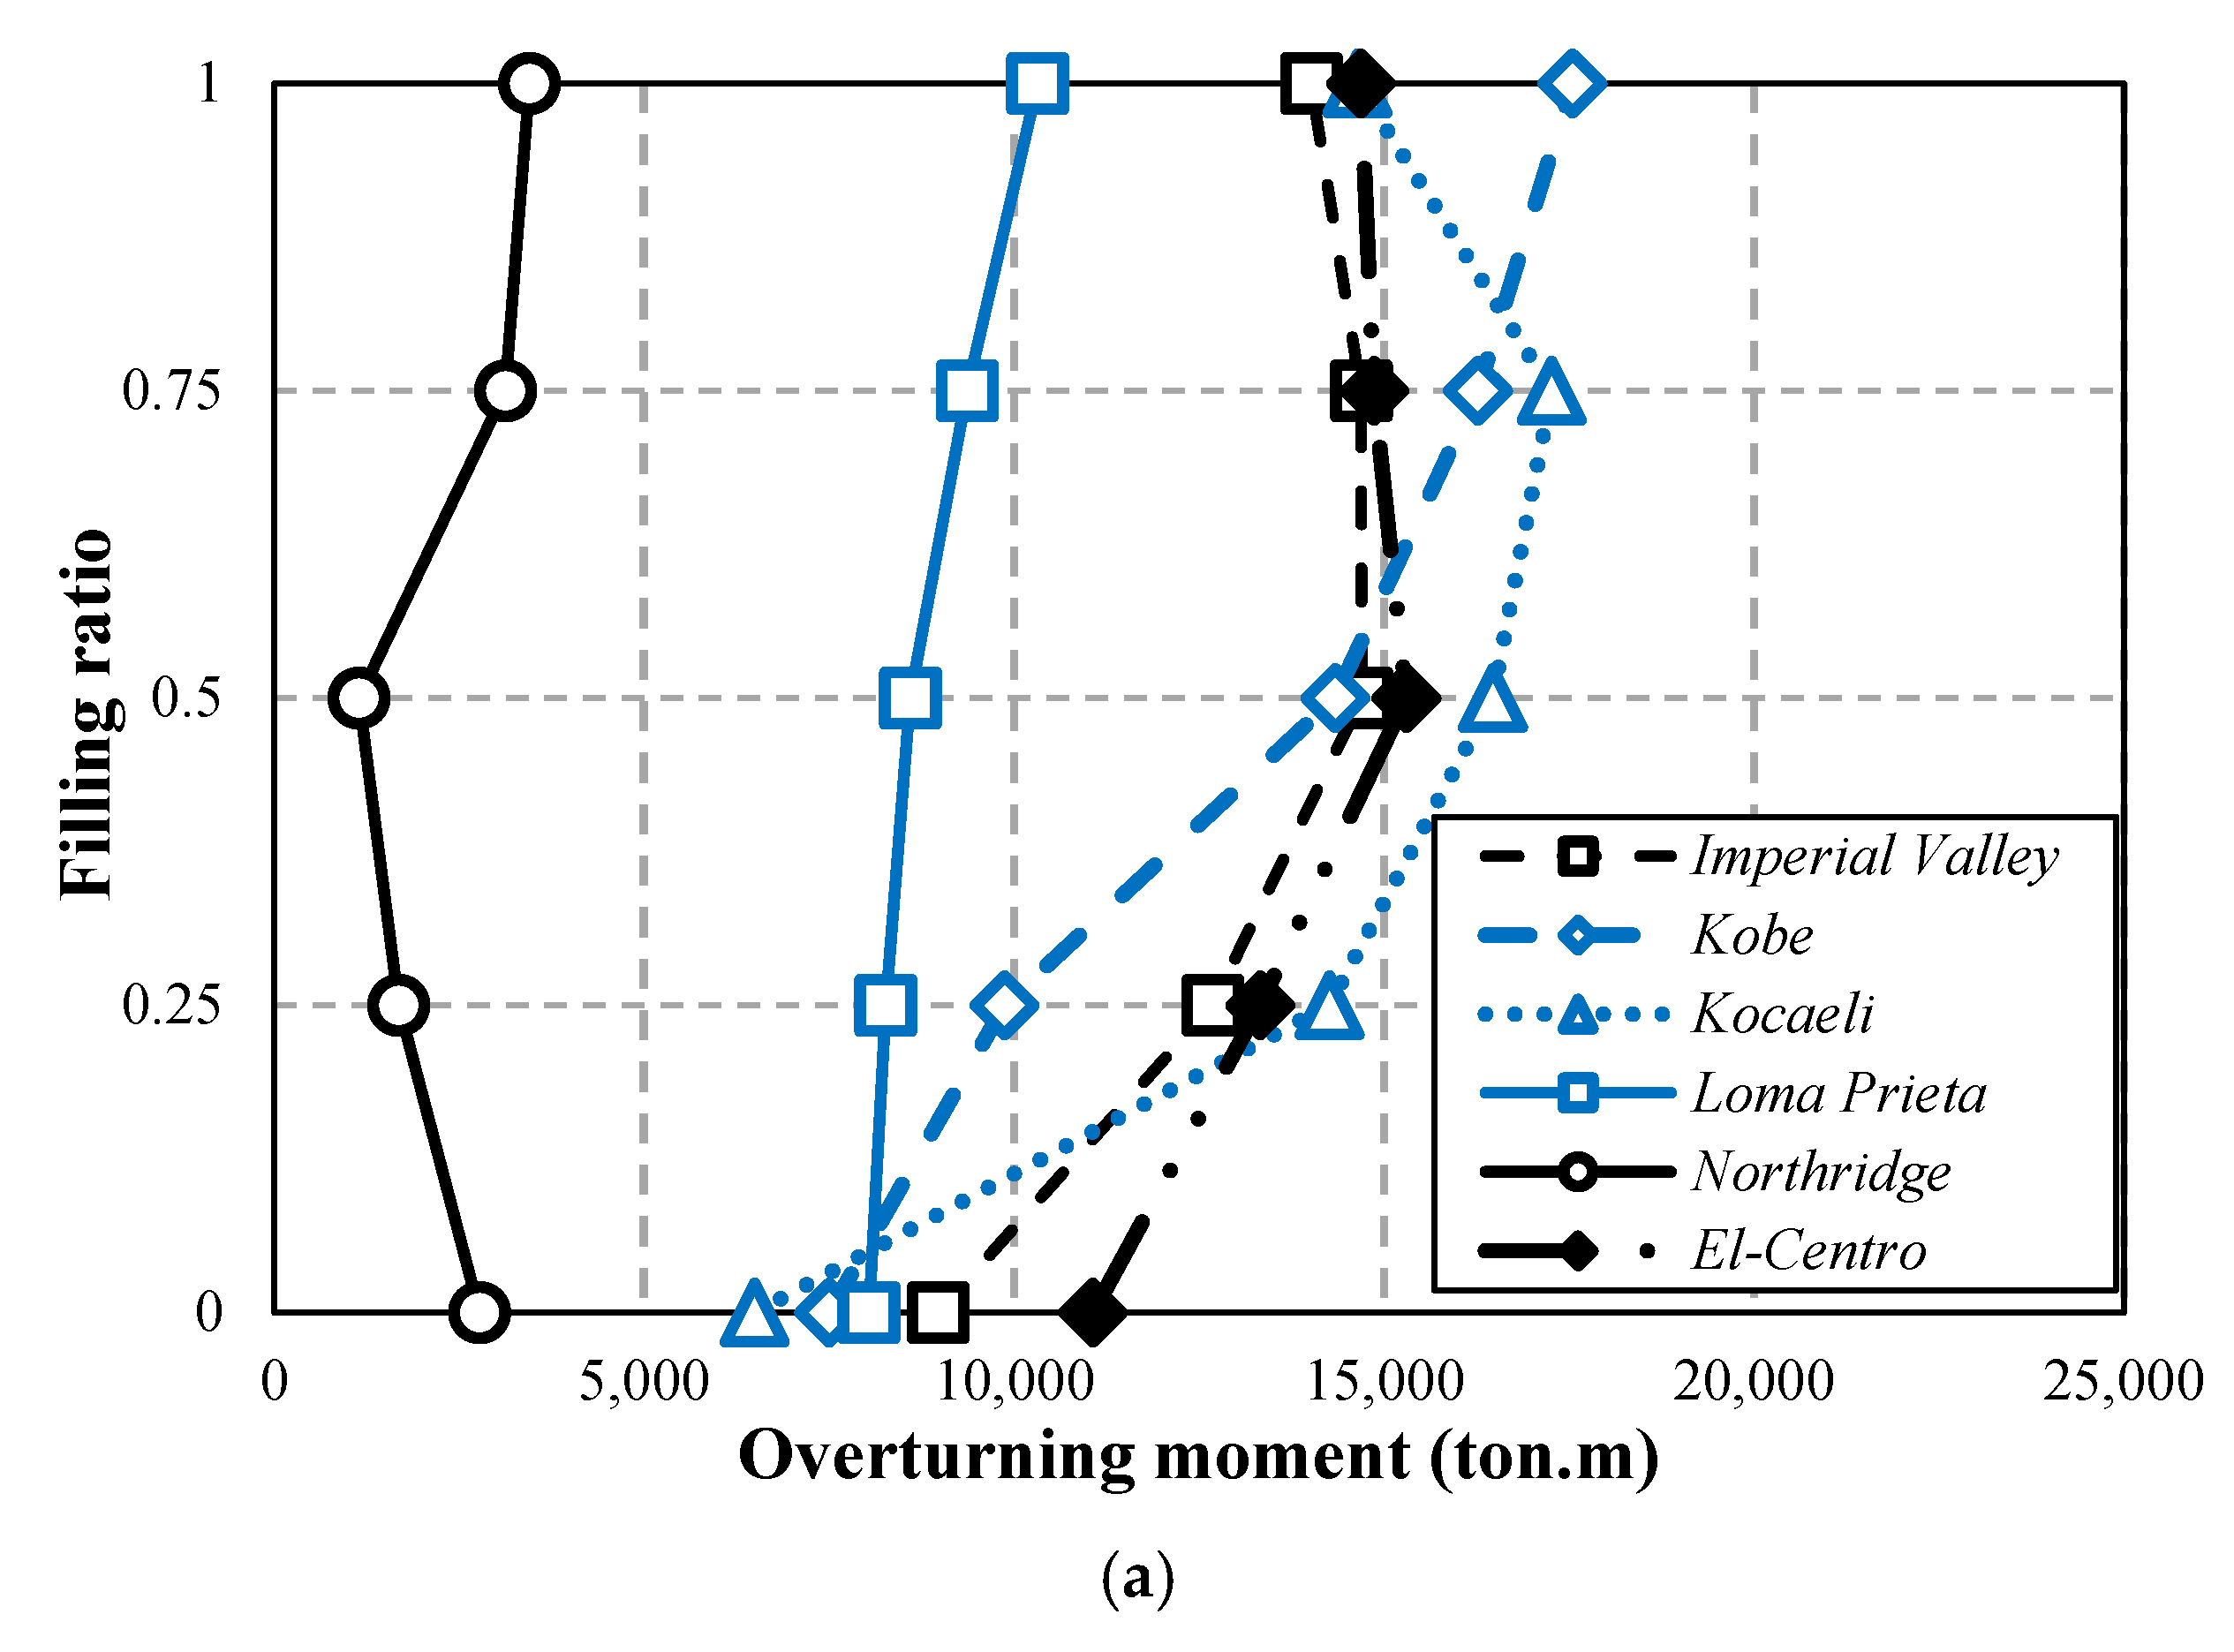
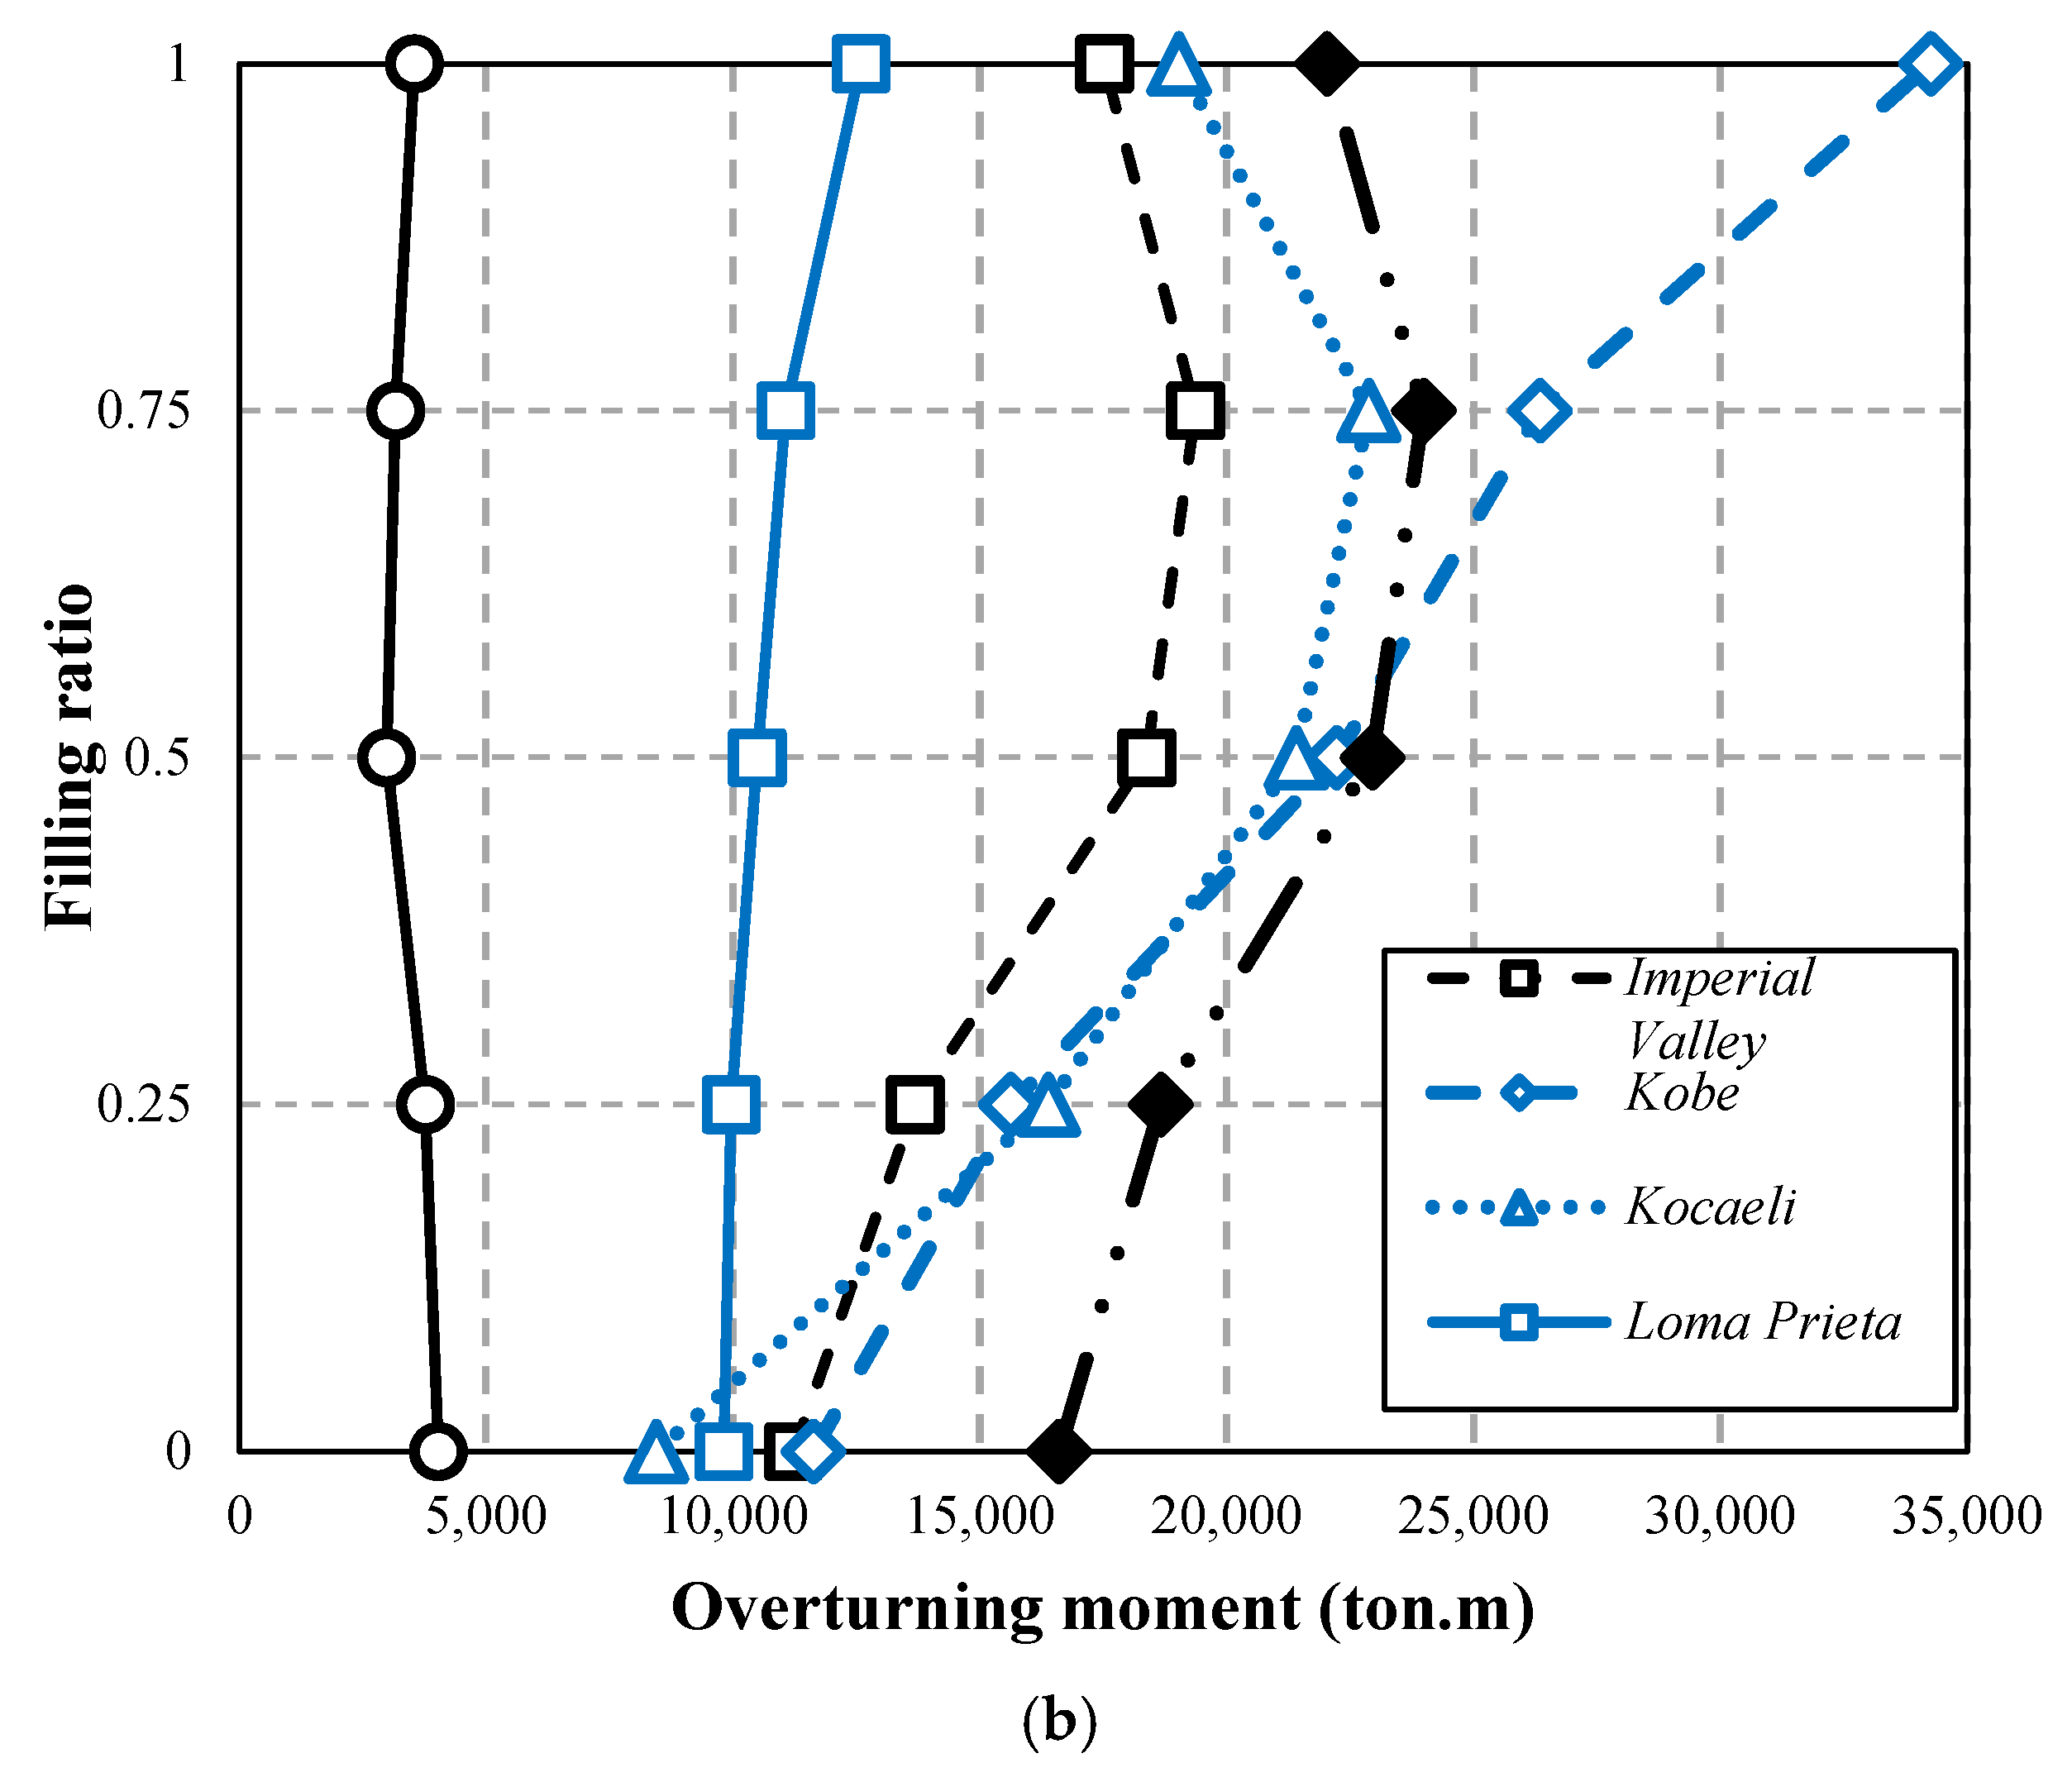
- The maximum seismic responses, displacement, base shear, and overturning moment do not occur at the same time and depend on the aforementioned factors due to differences in the impulsive and convective mass periods, the frequency content, and other attributes used to monitor earthquakes. Additionally, the maximum responses of a tank under the effect of near-fault ground motions were greater than those for far-fault earthquakes.
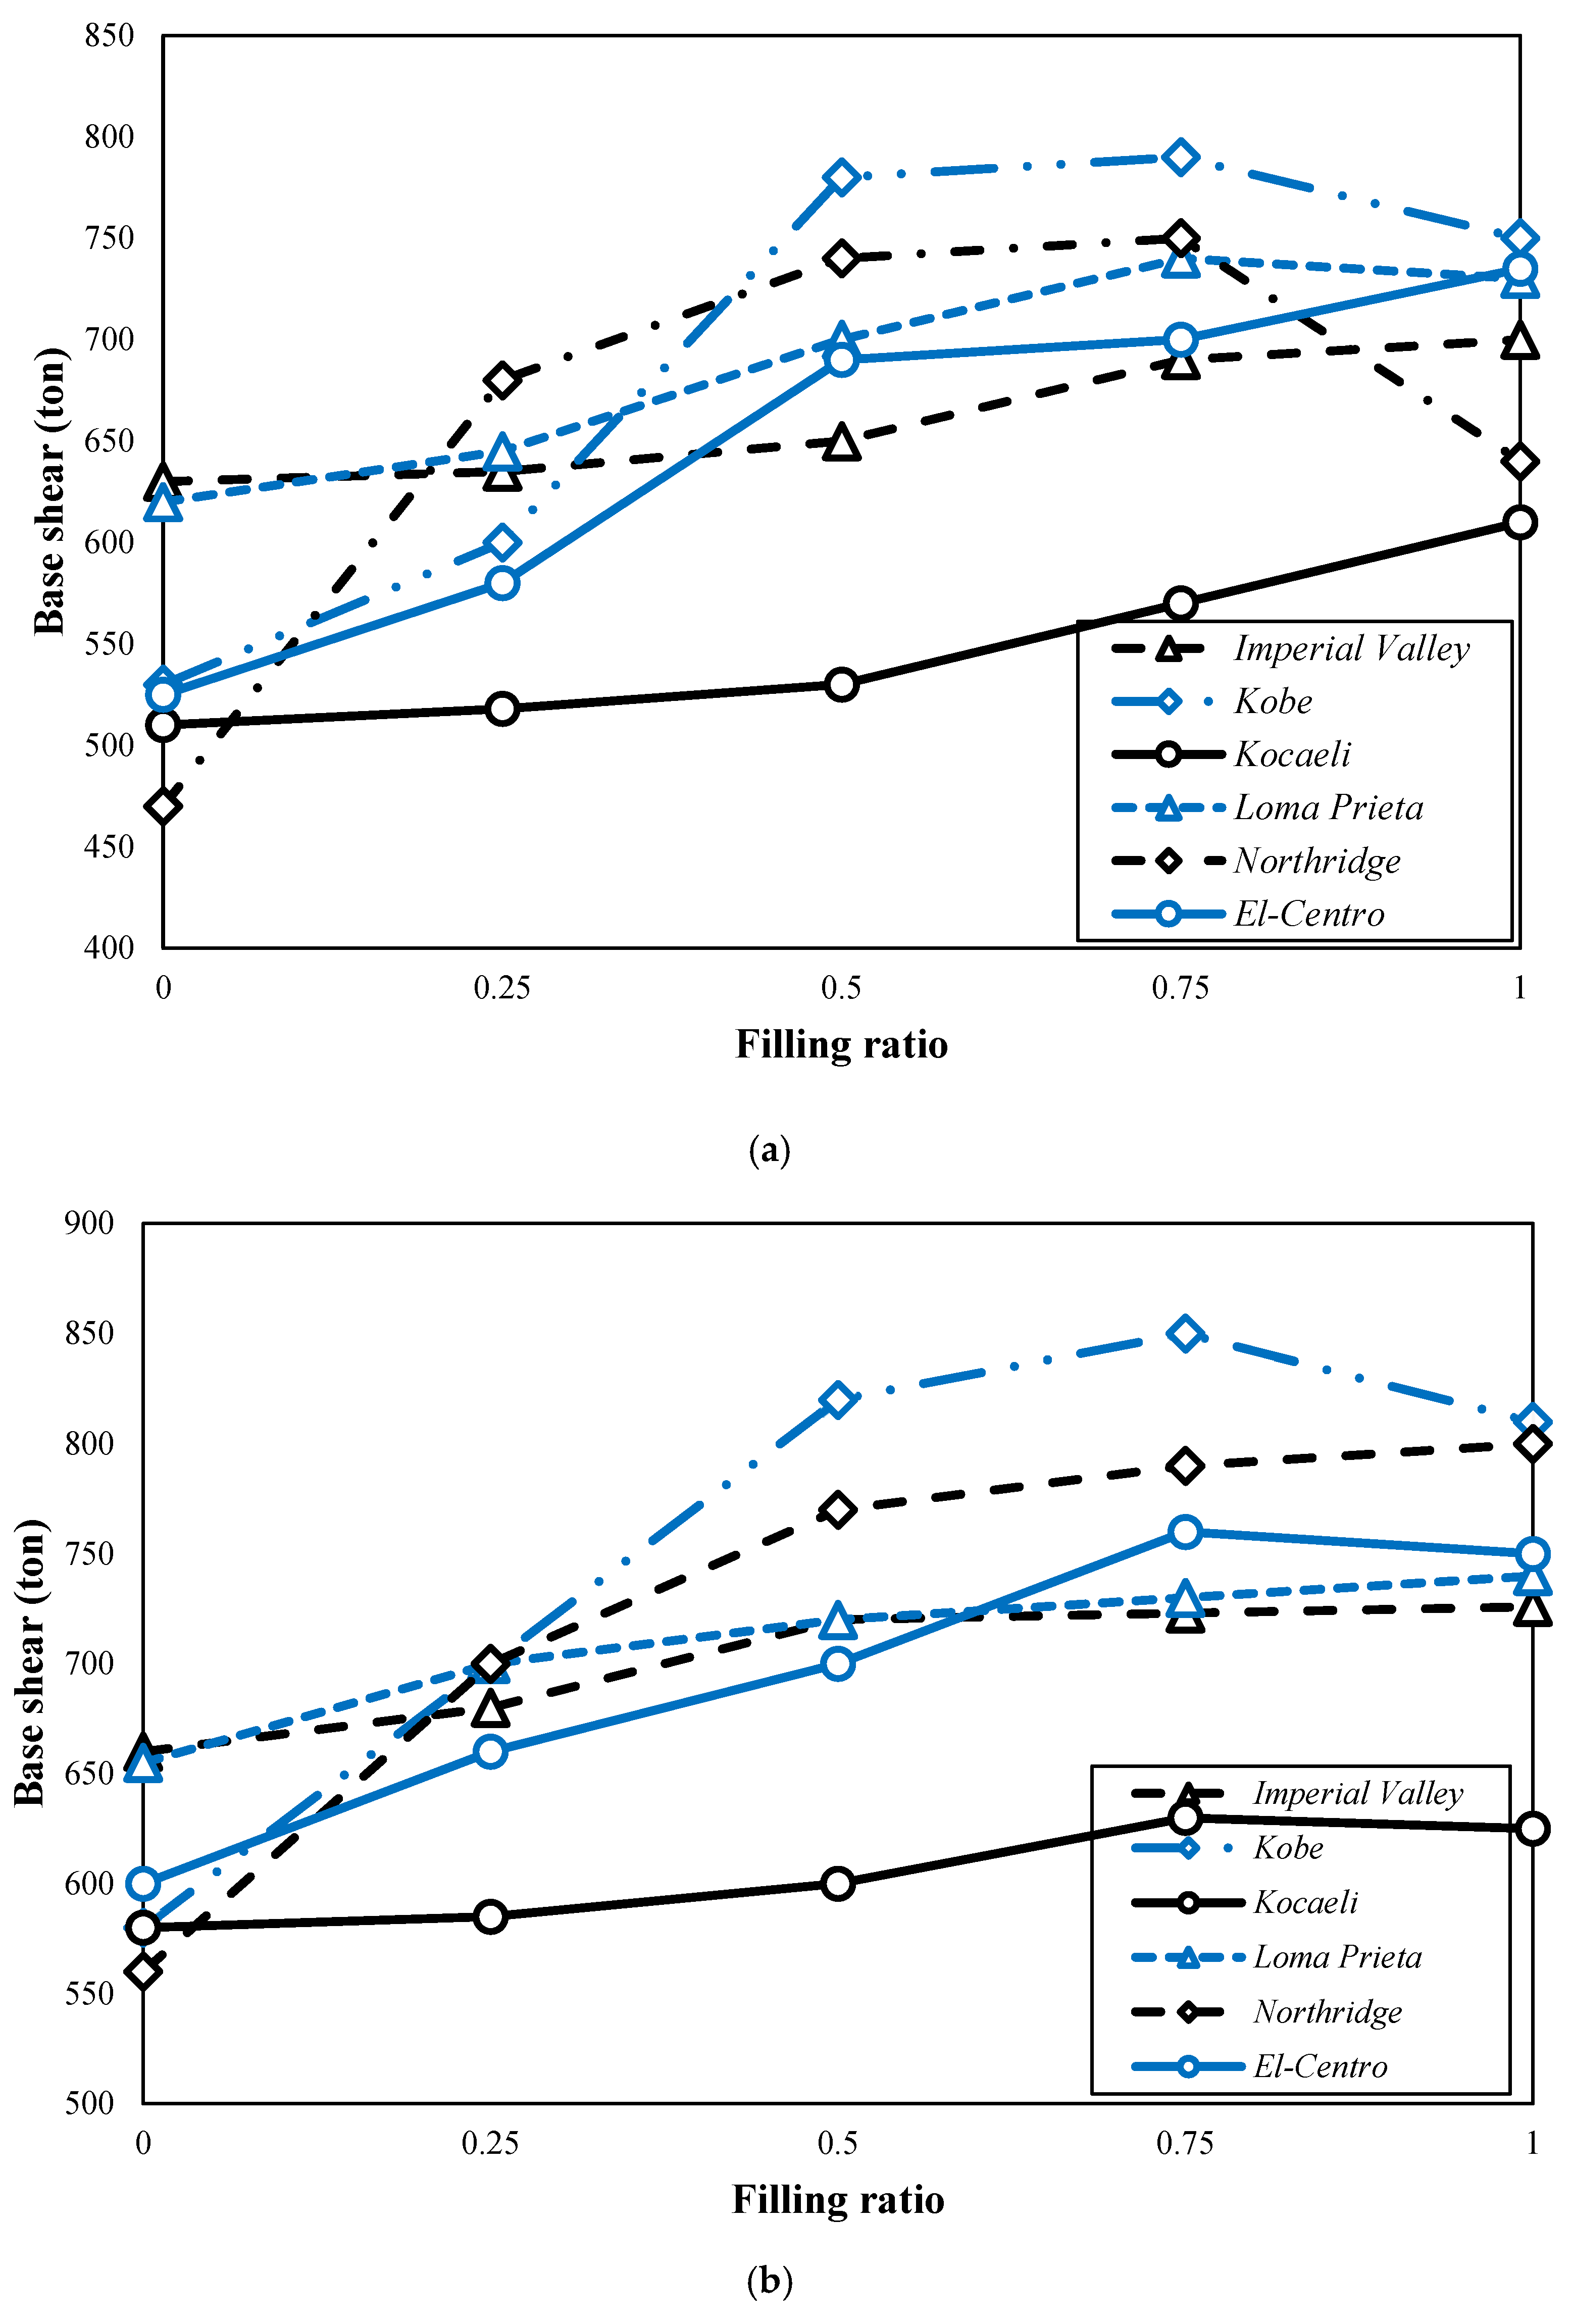
- Among the earthquakes considered in this study, for the Kobe and Northridge records, the maximum base shear force occurred in the half-full container; however, the maximum base shear occurred when the container was completely filled with water. Therefore, the base shear increased by 47% and 62% when a half-filled container was subjected to the far-fault Kobe and Northridge motion records, respectively, while the base shear was increased by 45.7% and 68% when a half-filled container was subjected to the near-fault Kobe and Northridge motion records, respectively.
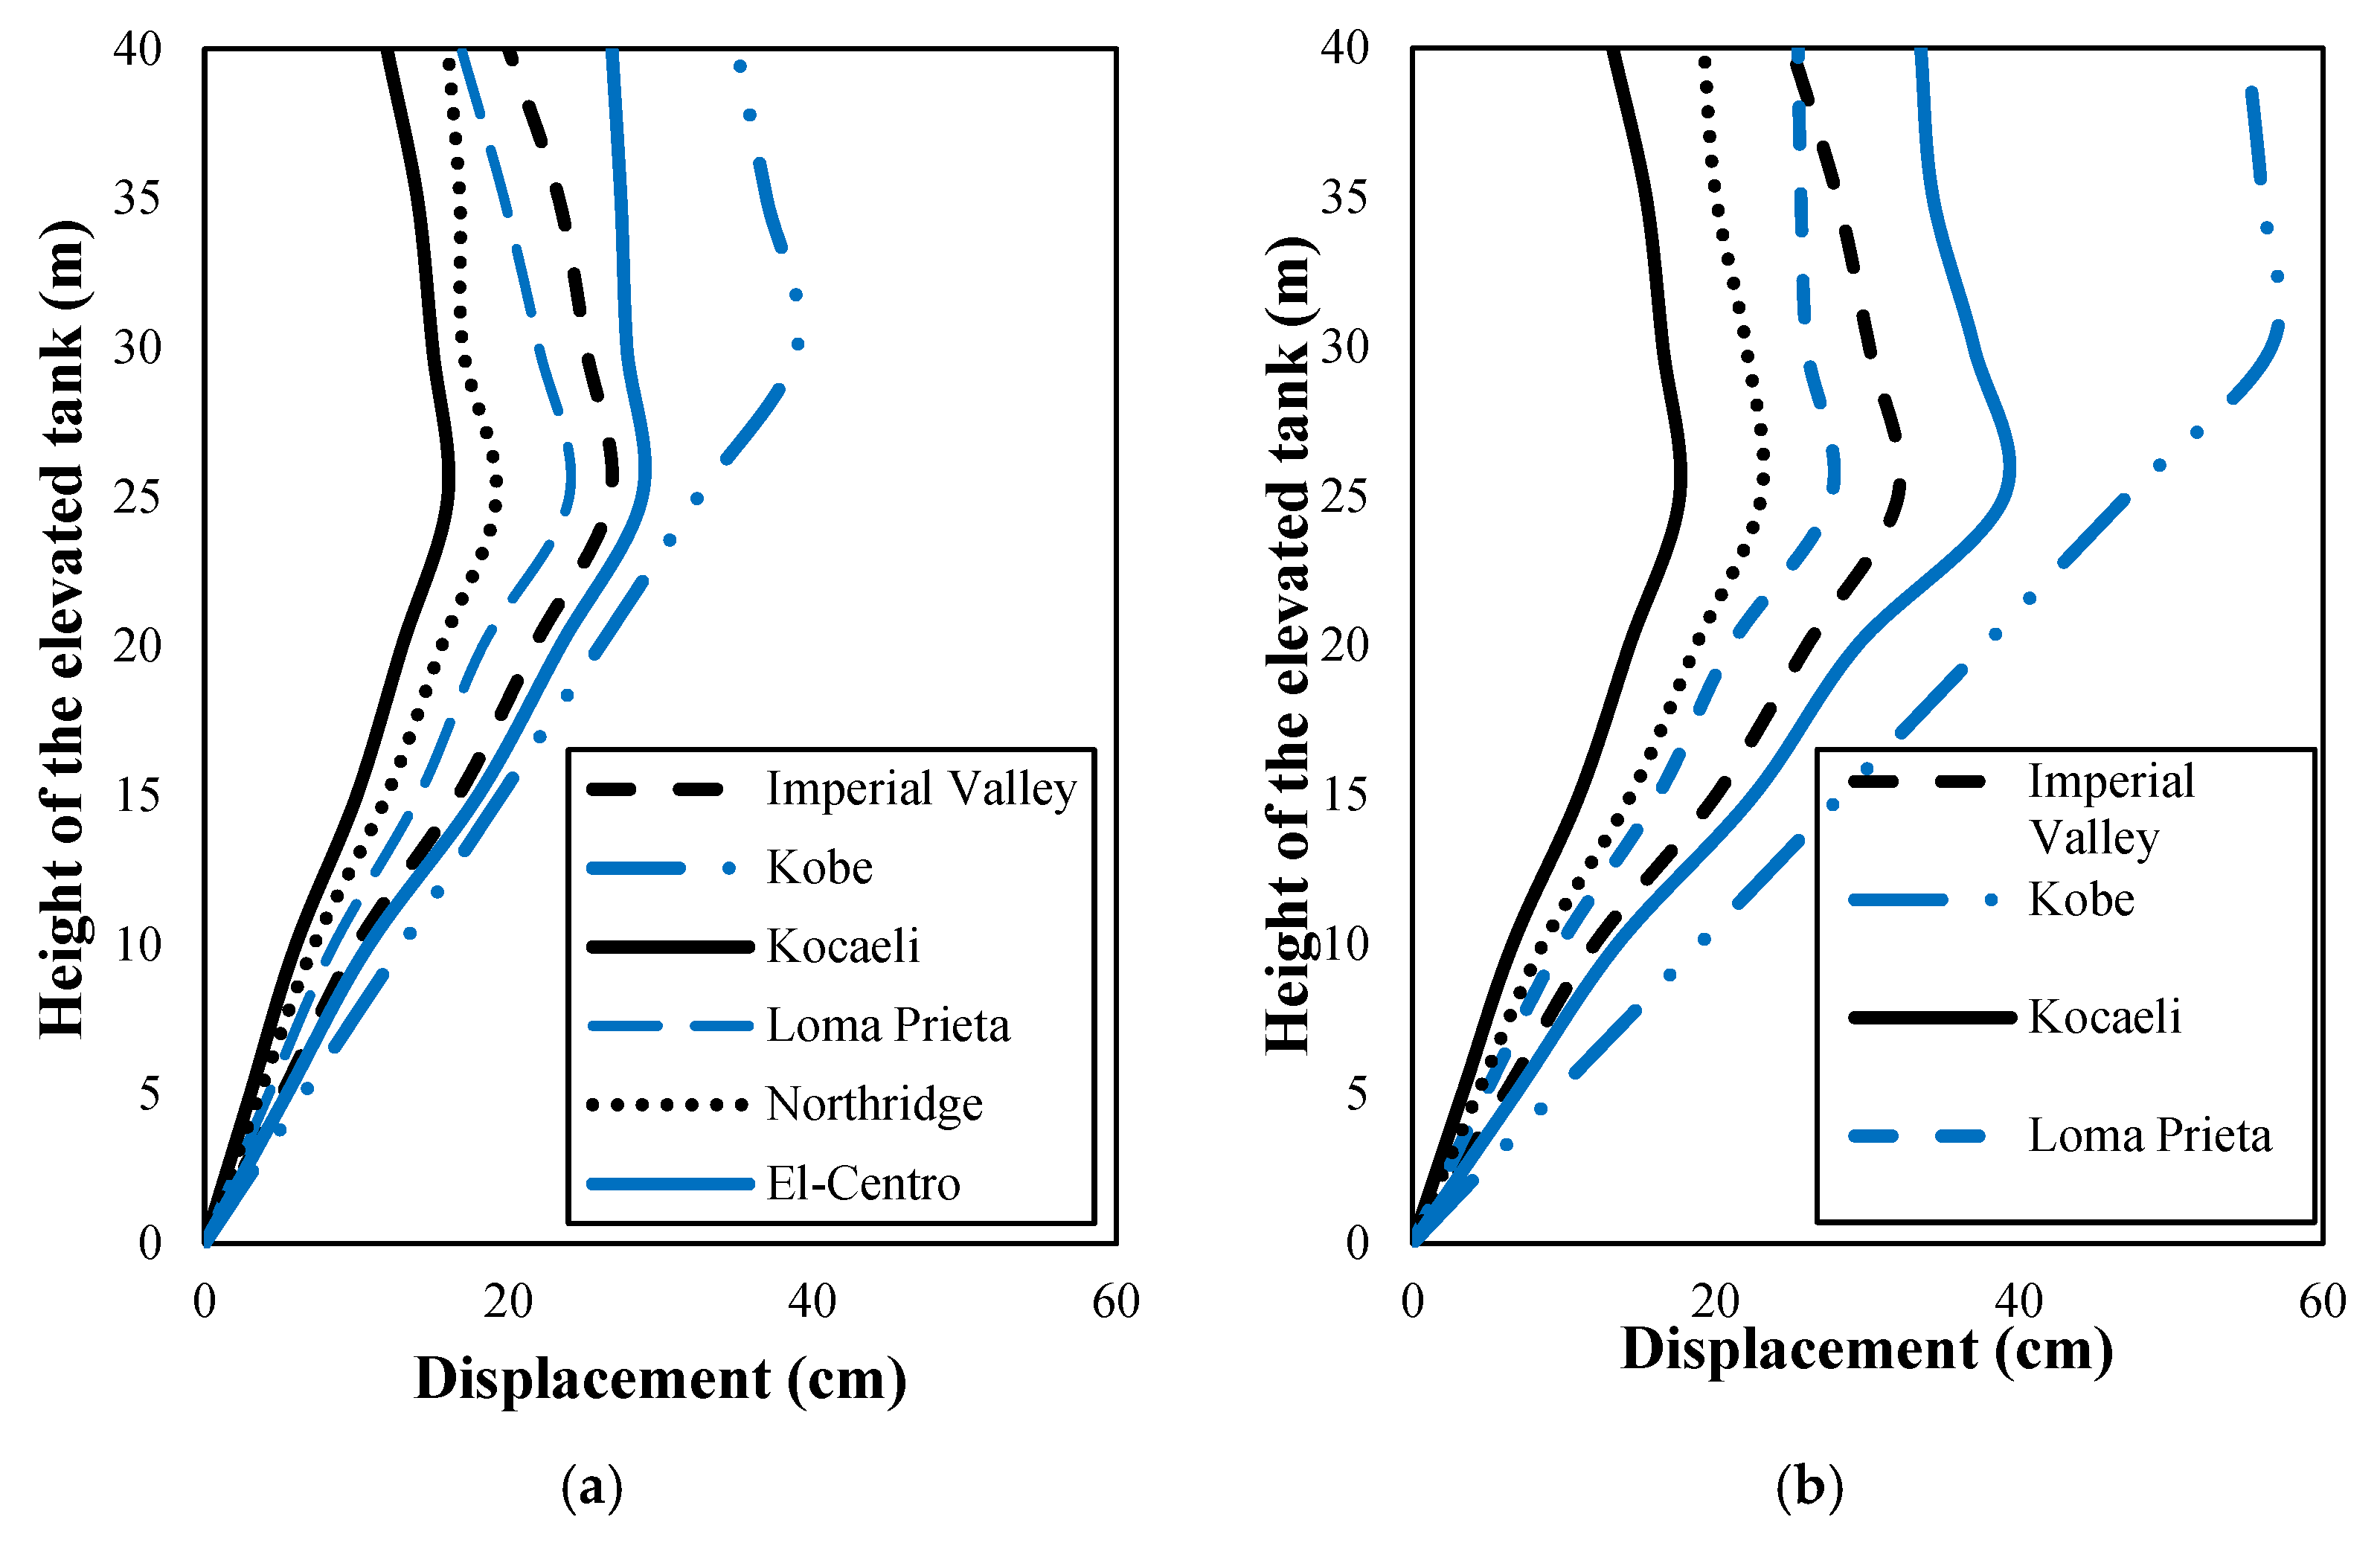
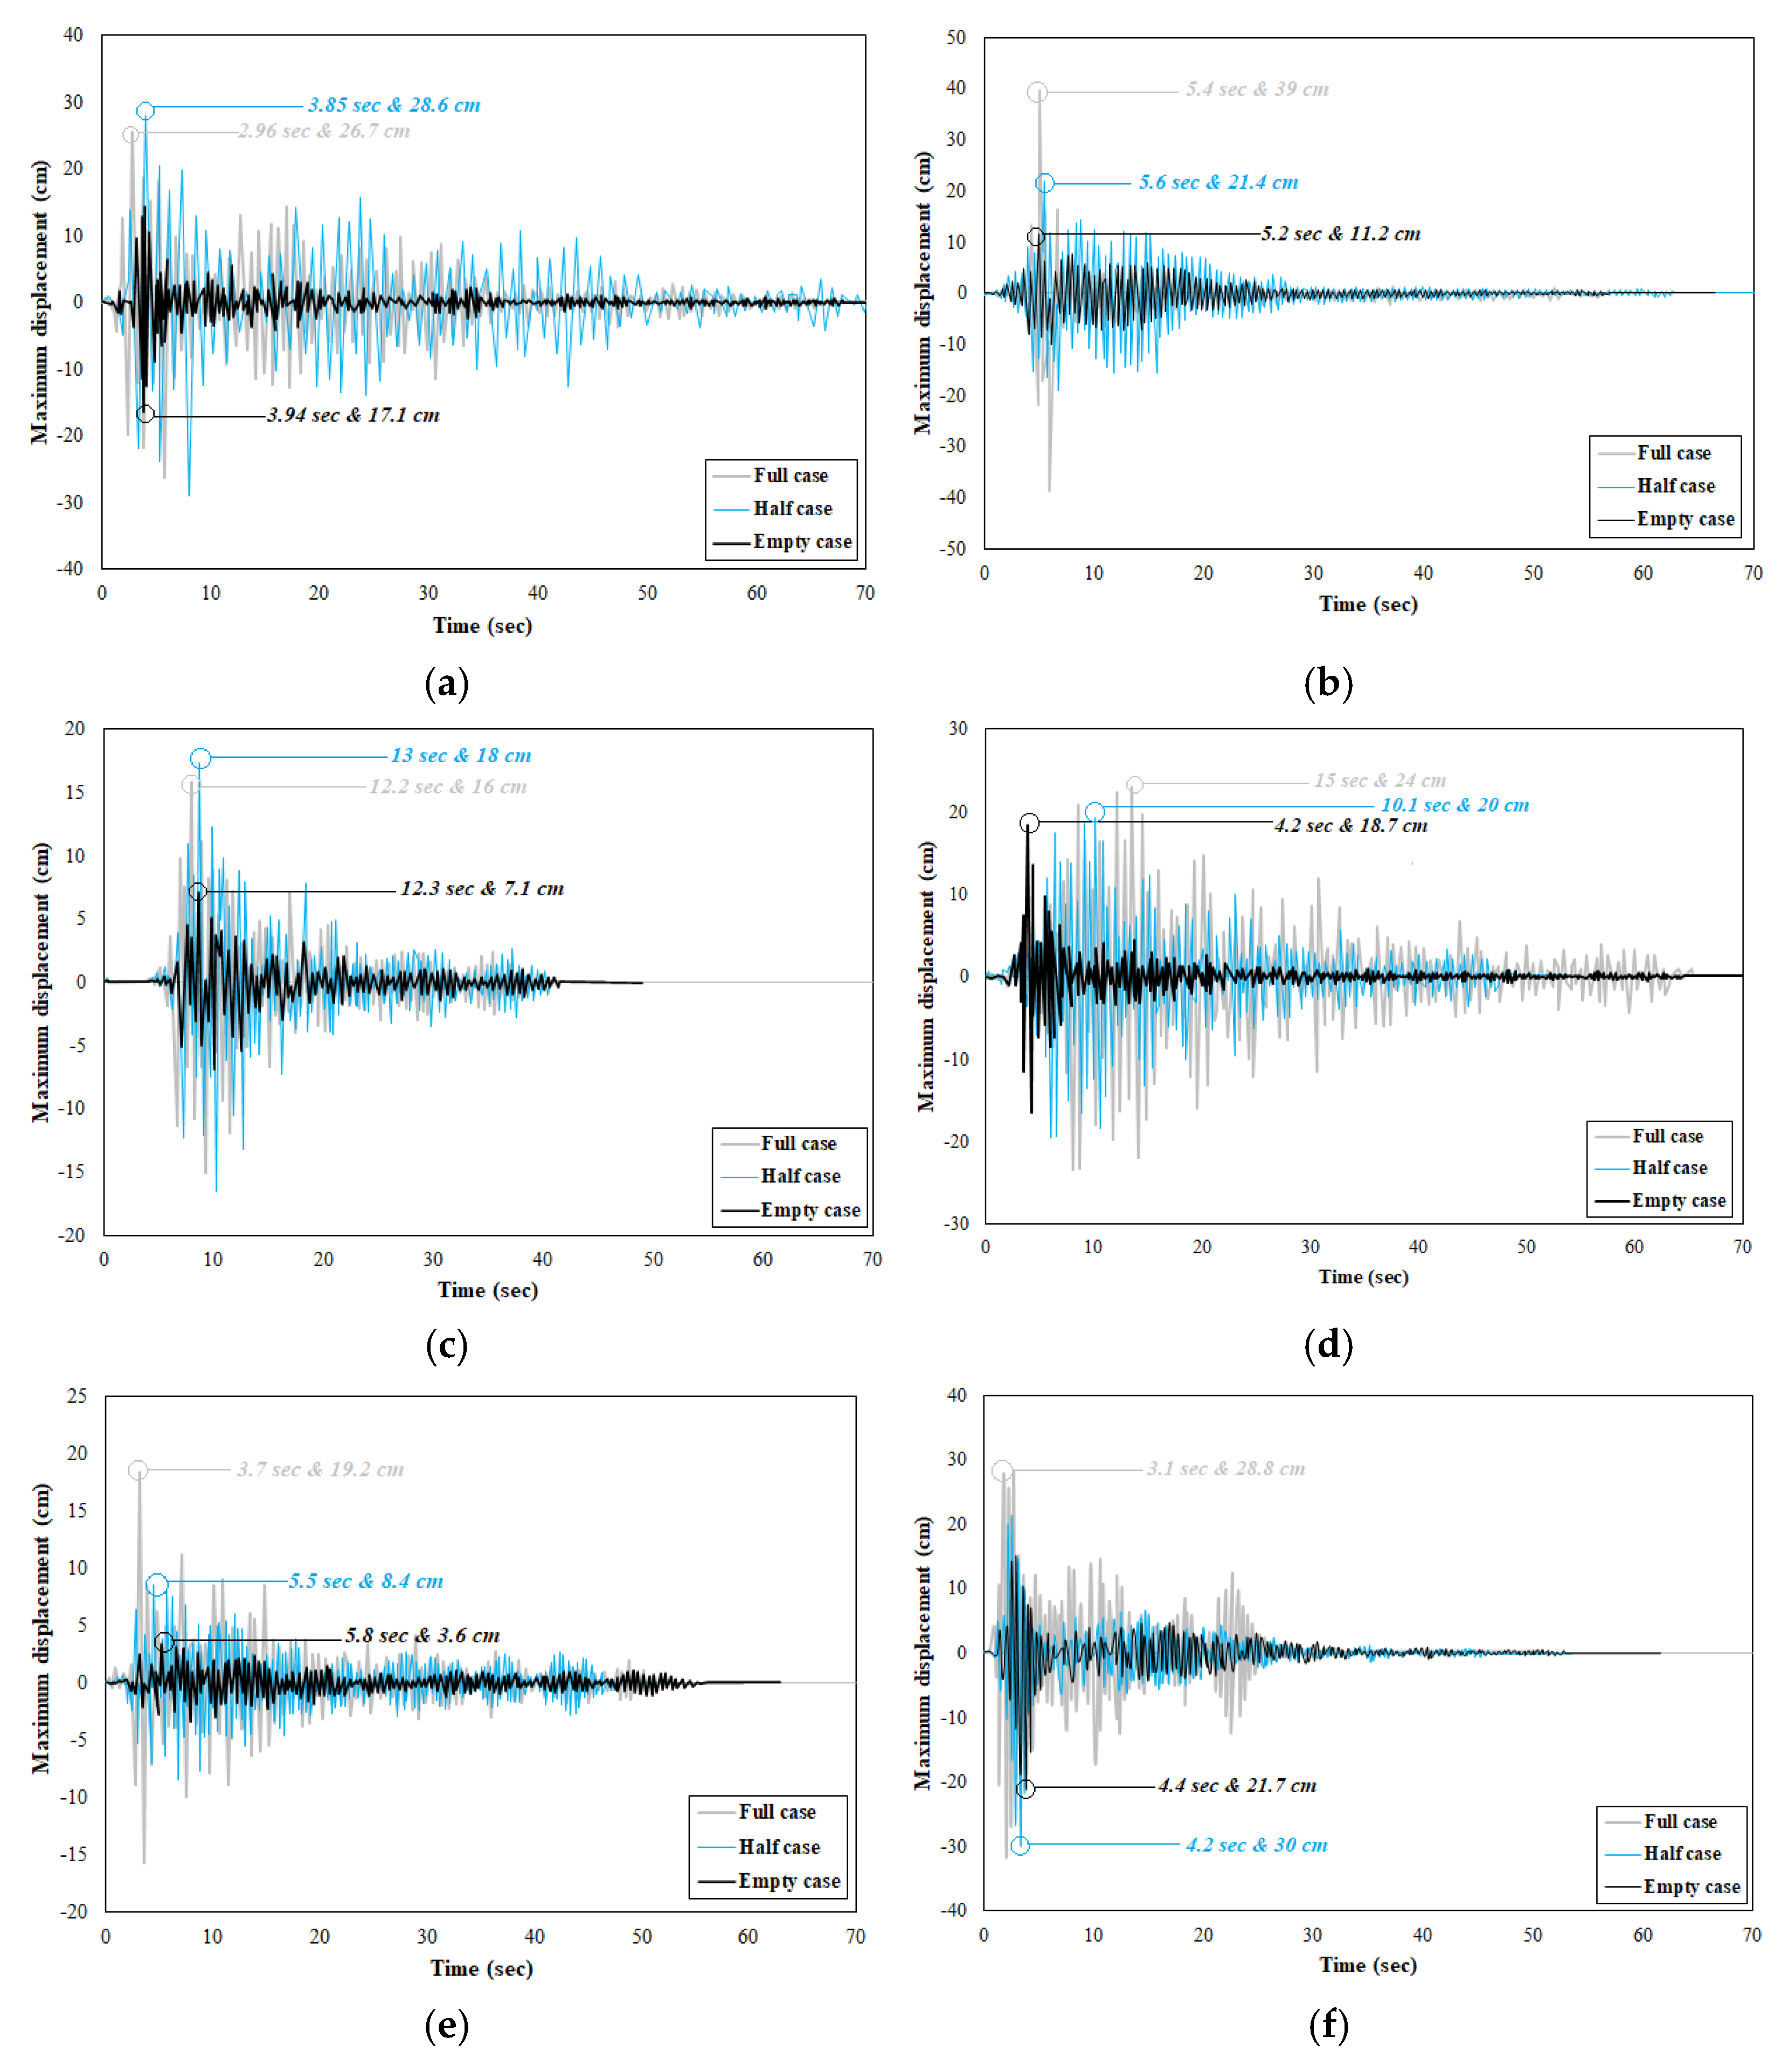
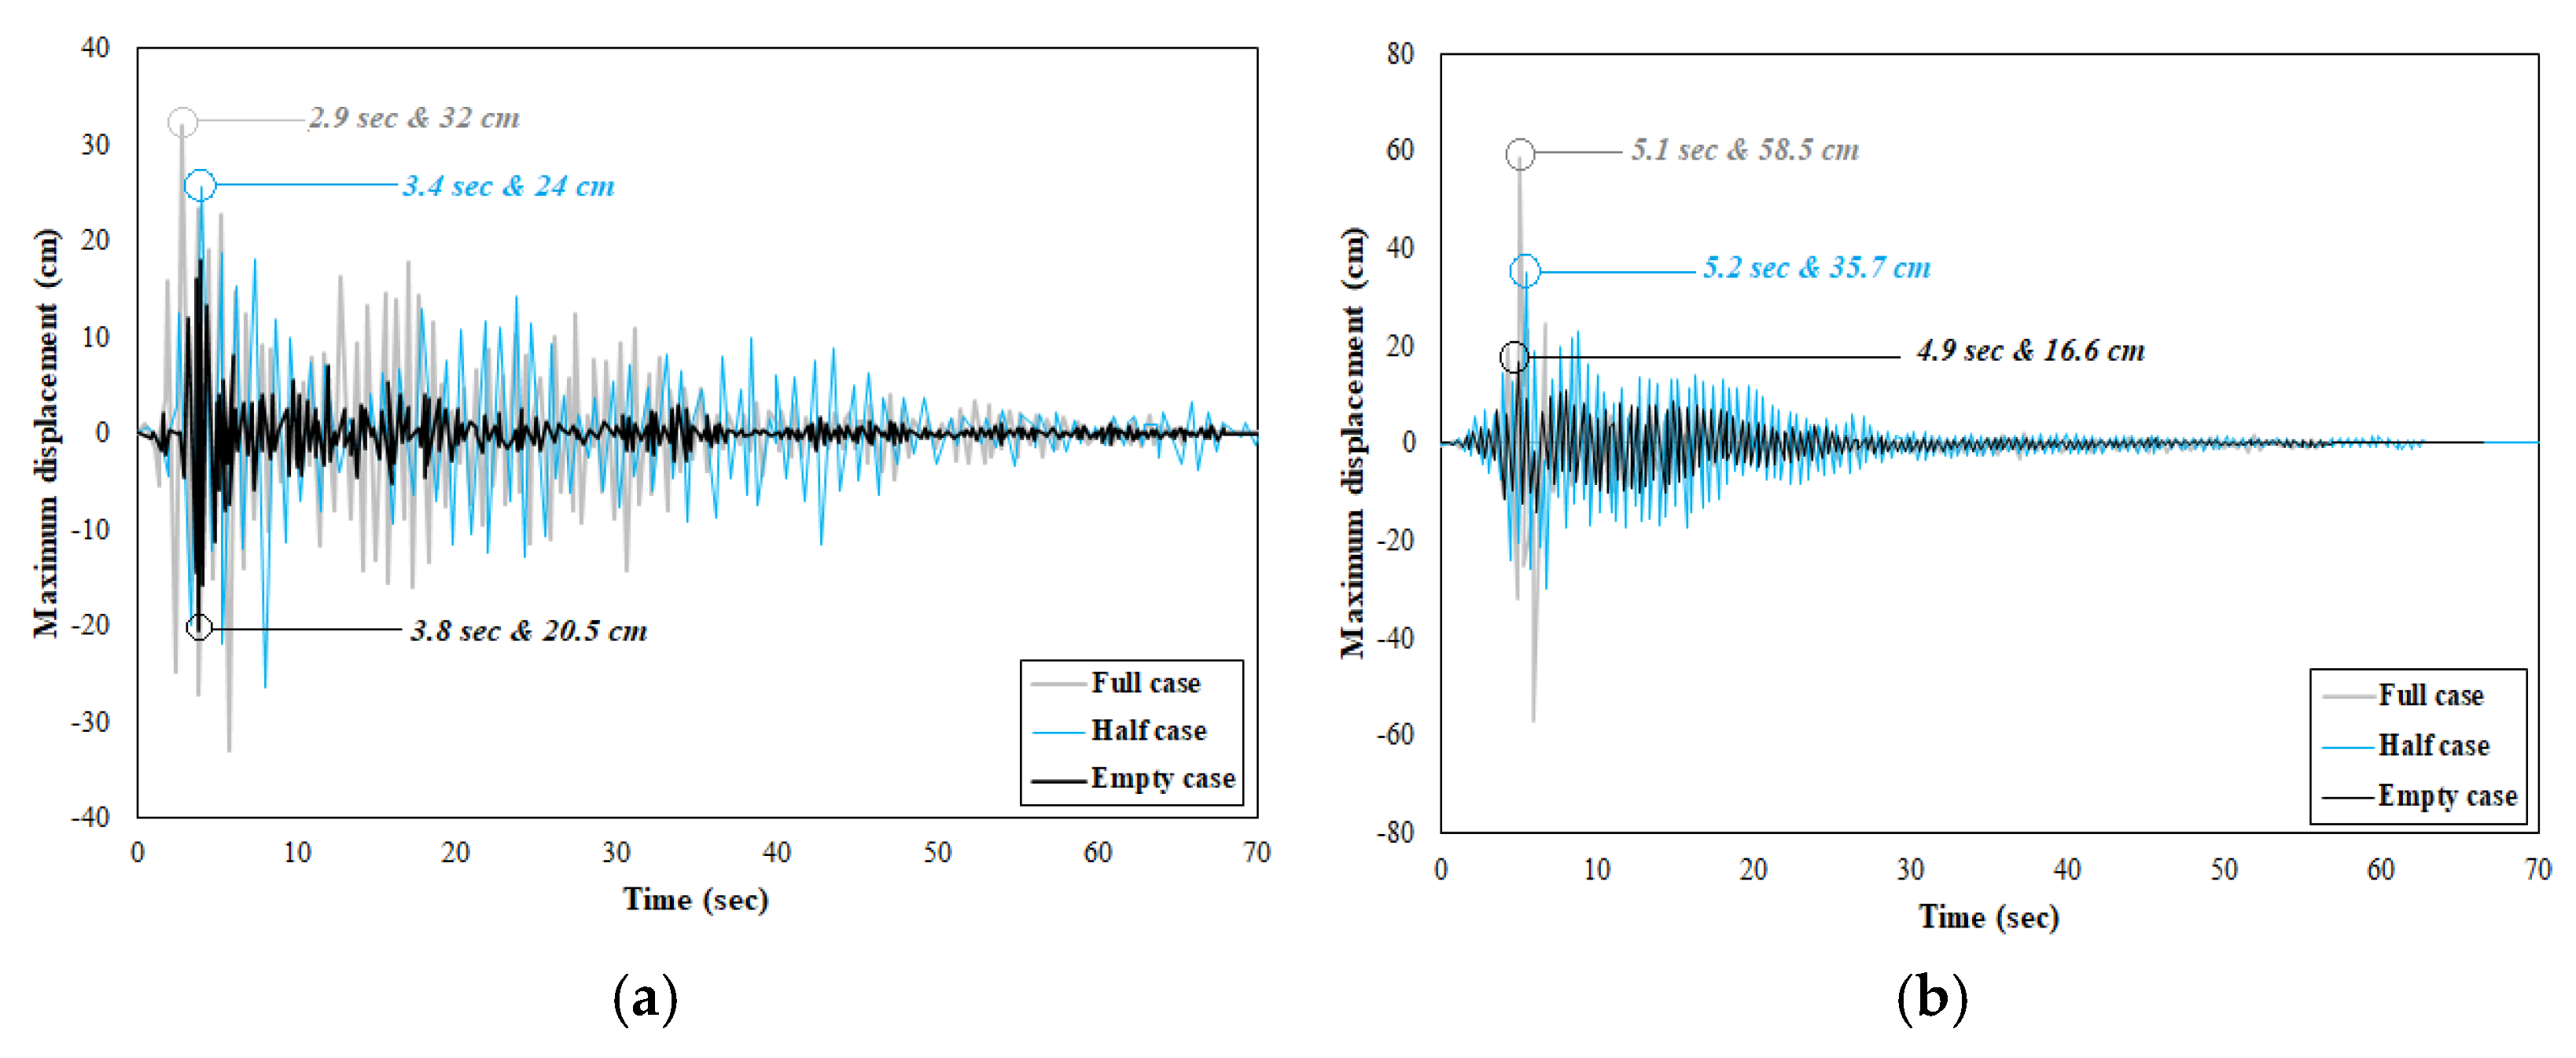
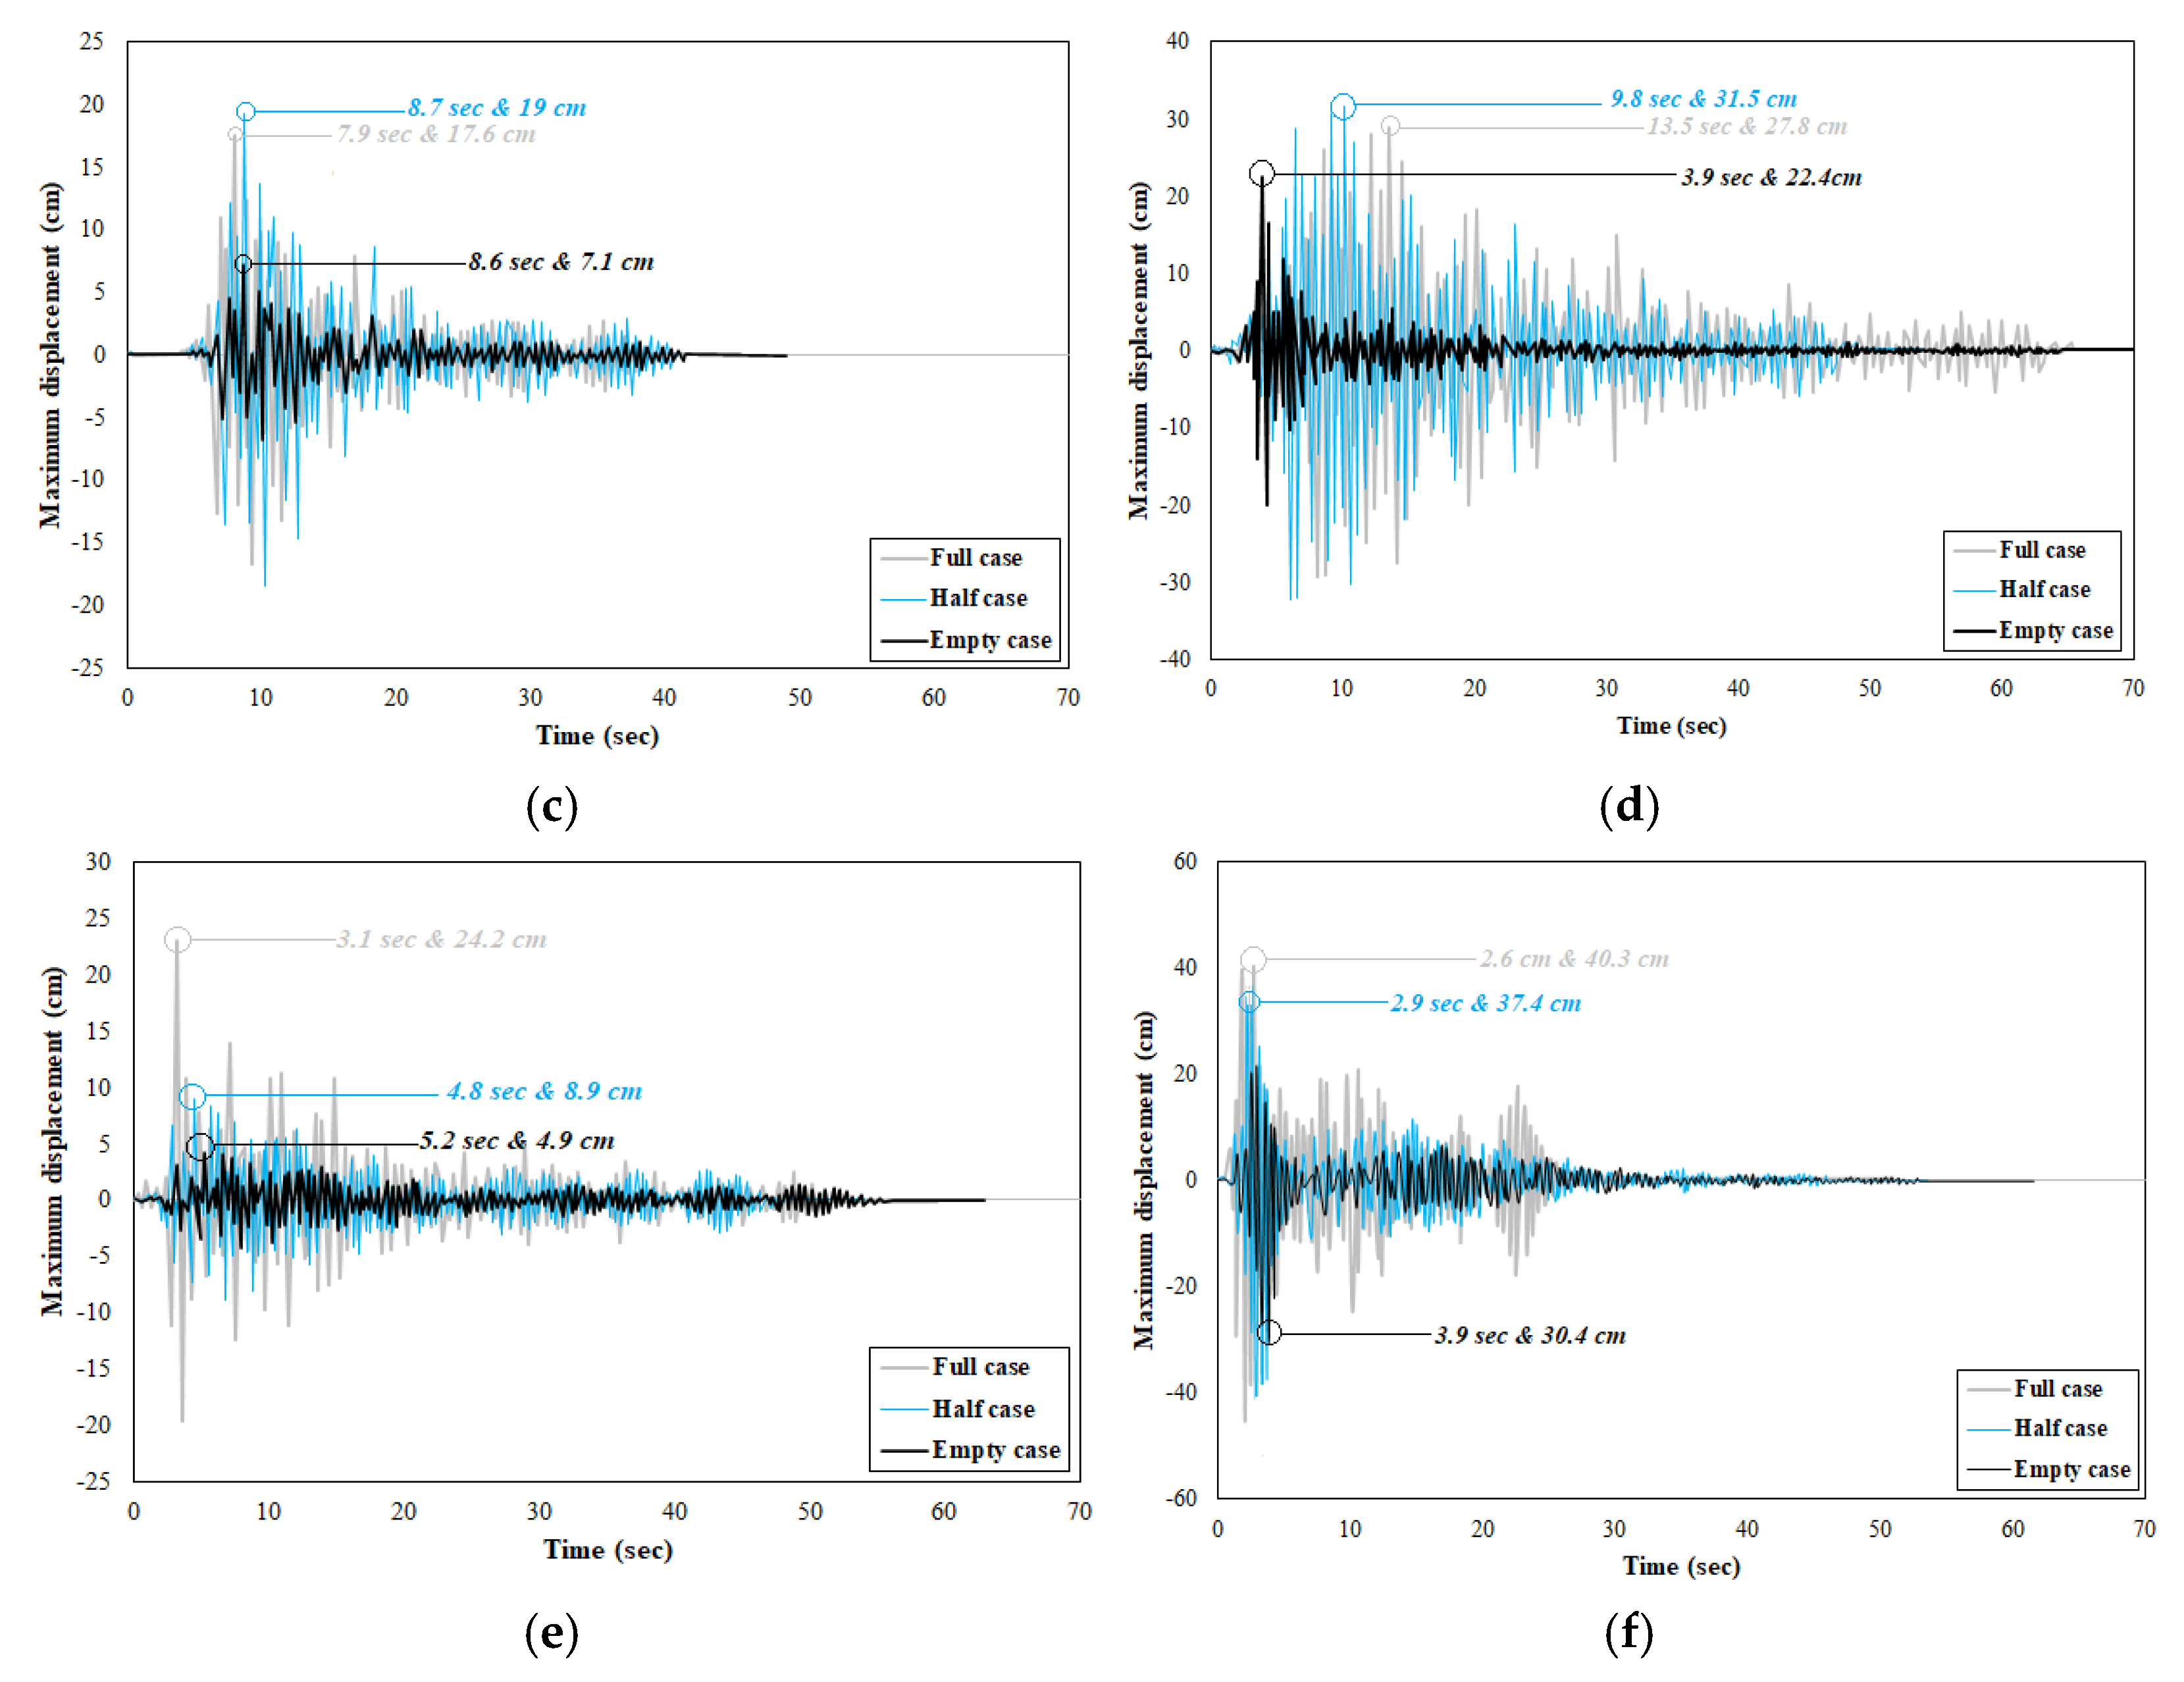
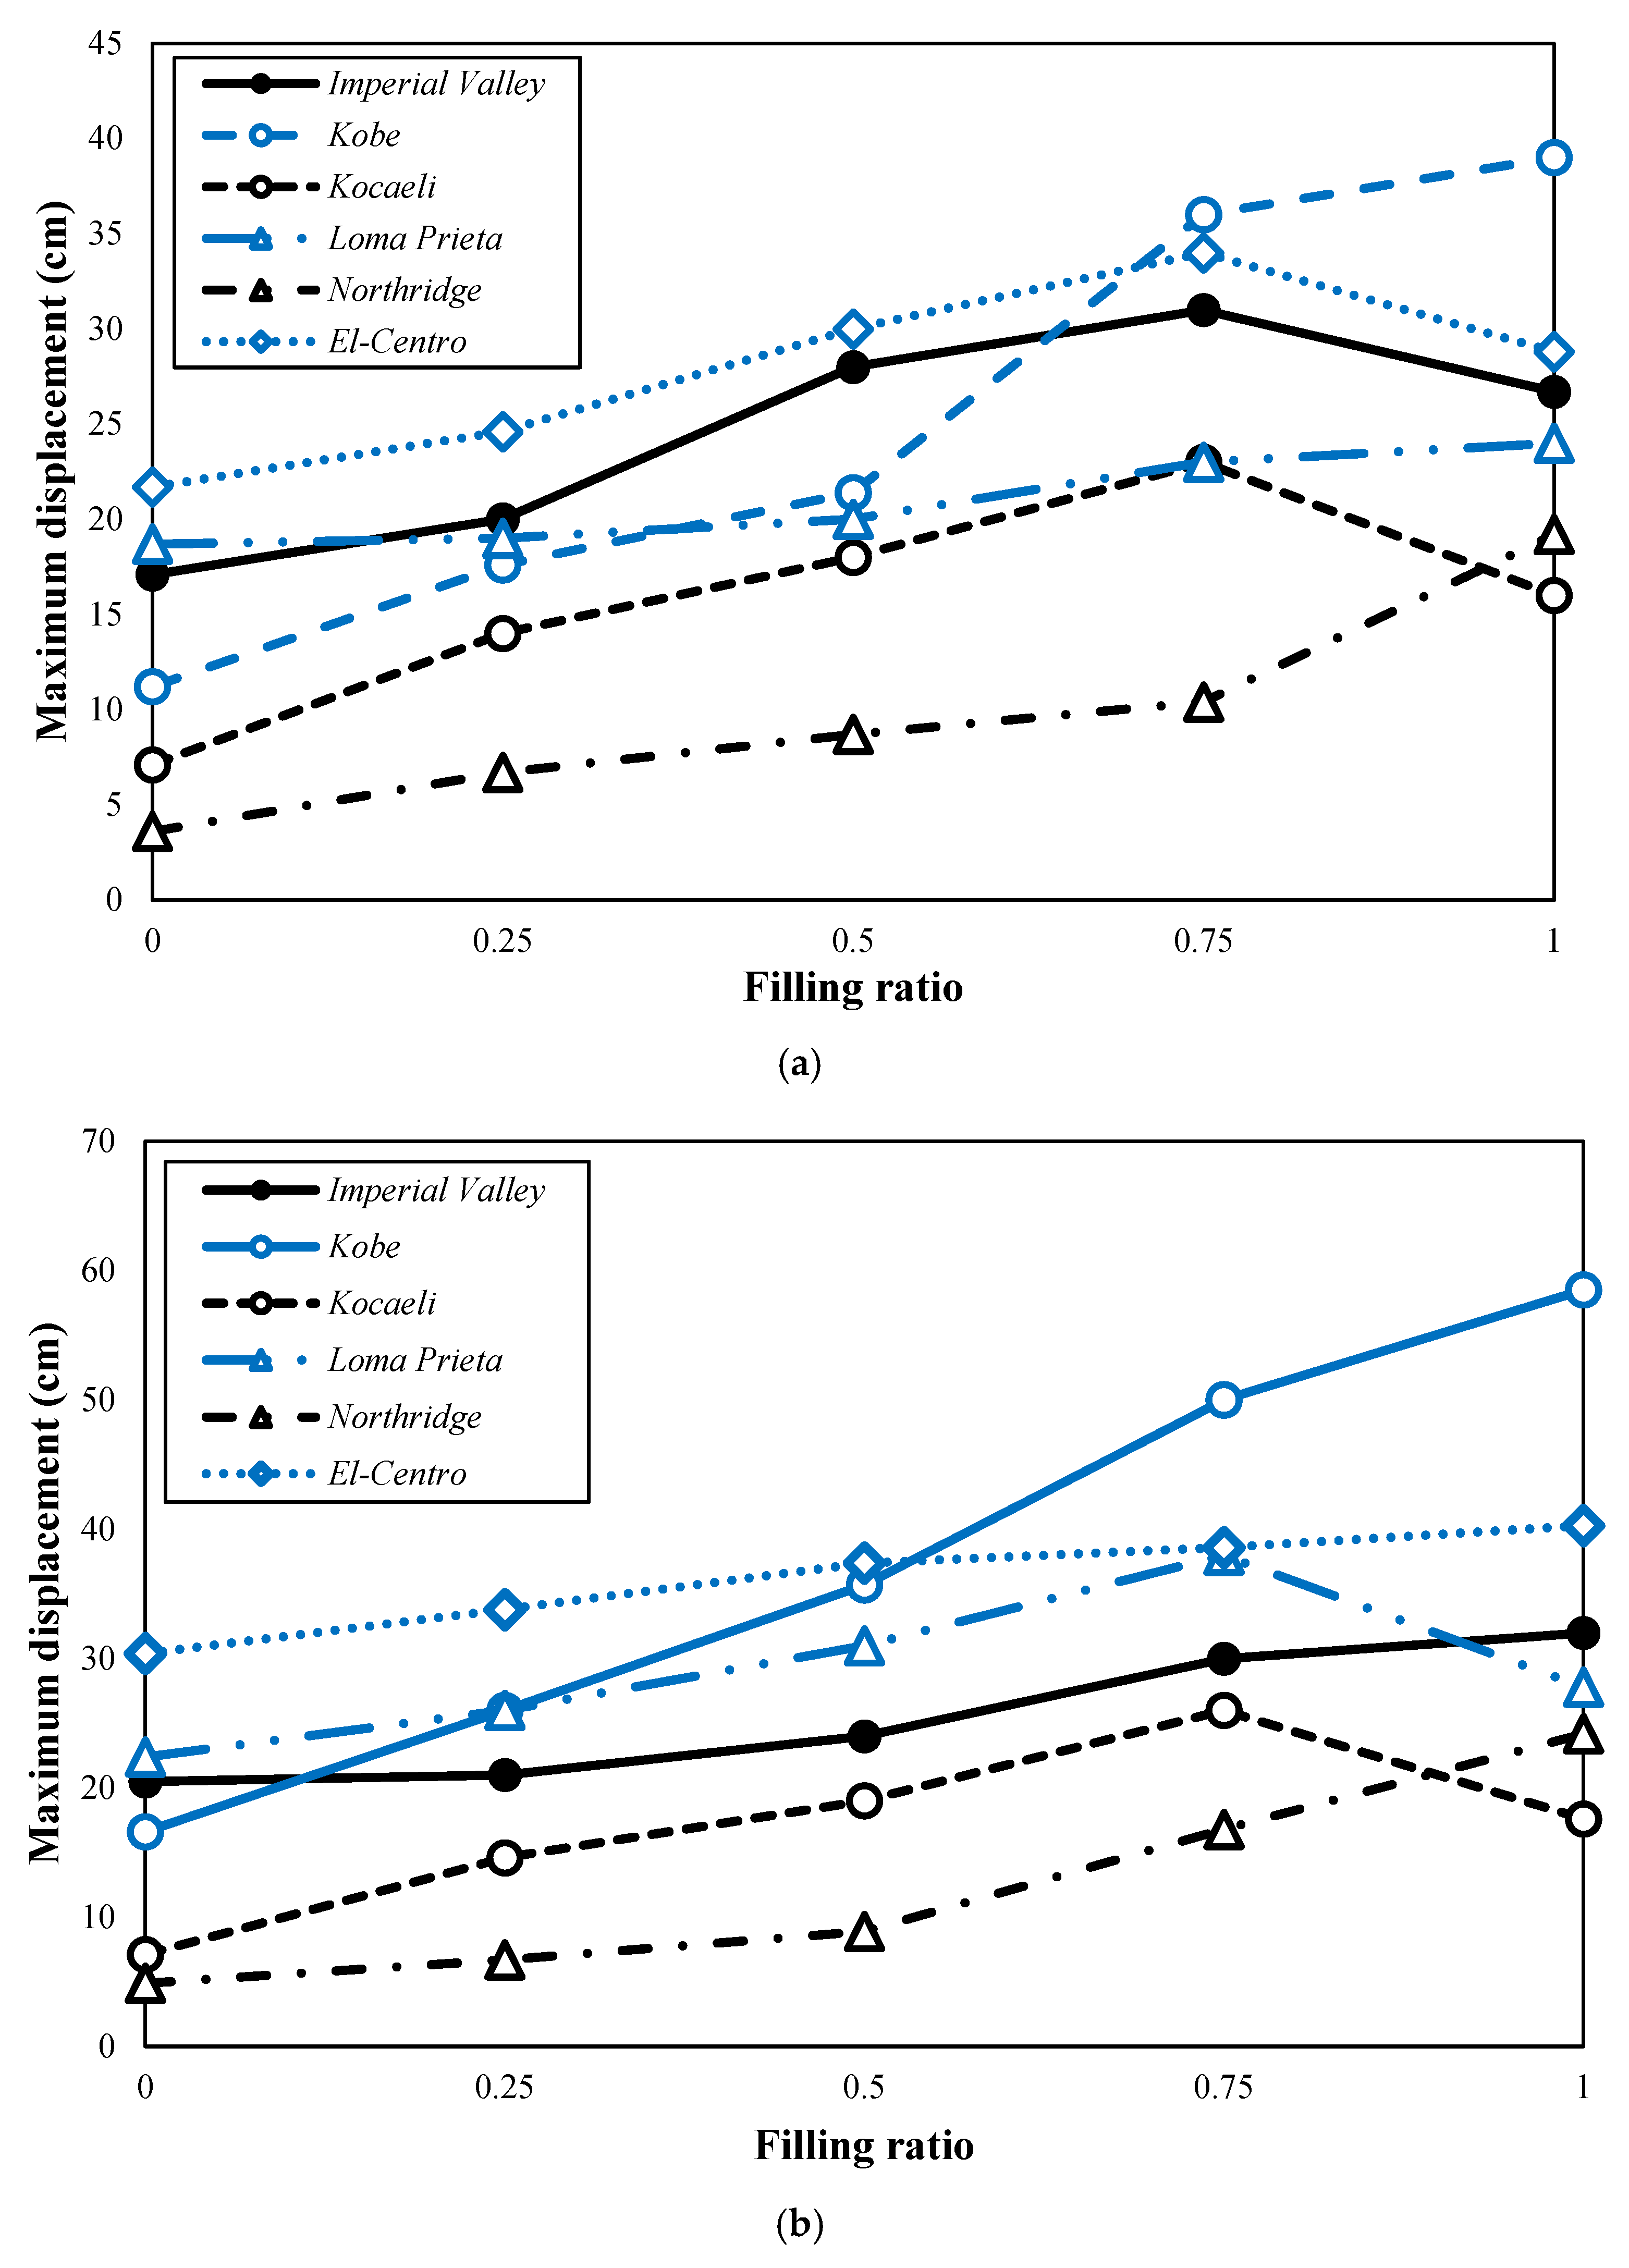
- In terms of maximum displacement, considering the earthquake records in the current investigation, for the Imperial Valley, El Centro, and Kocaeli Valley records, the maximum displacement was observed when the container was half-filled with fluid. However, the maximum displacement was obtained for the full tank, which showed the important role of the characteristics of the ground motion records. Additionally, the maximum displacement happened in full elevated concrete tanks under the influence of the Kobe records, which resulted in increasing the displacement by about 263% and 82% in comparison with the empty and half-filled cases, respectively.
Author Contributions
Funding
Data Availability Statement
Conflicts of Interest
Abbreviations
| Notation | |
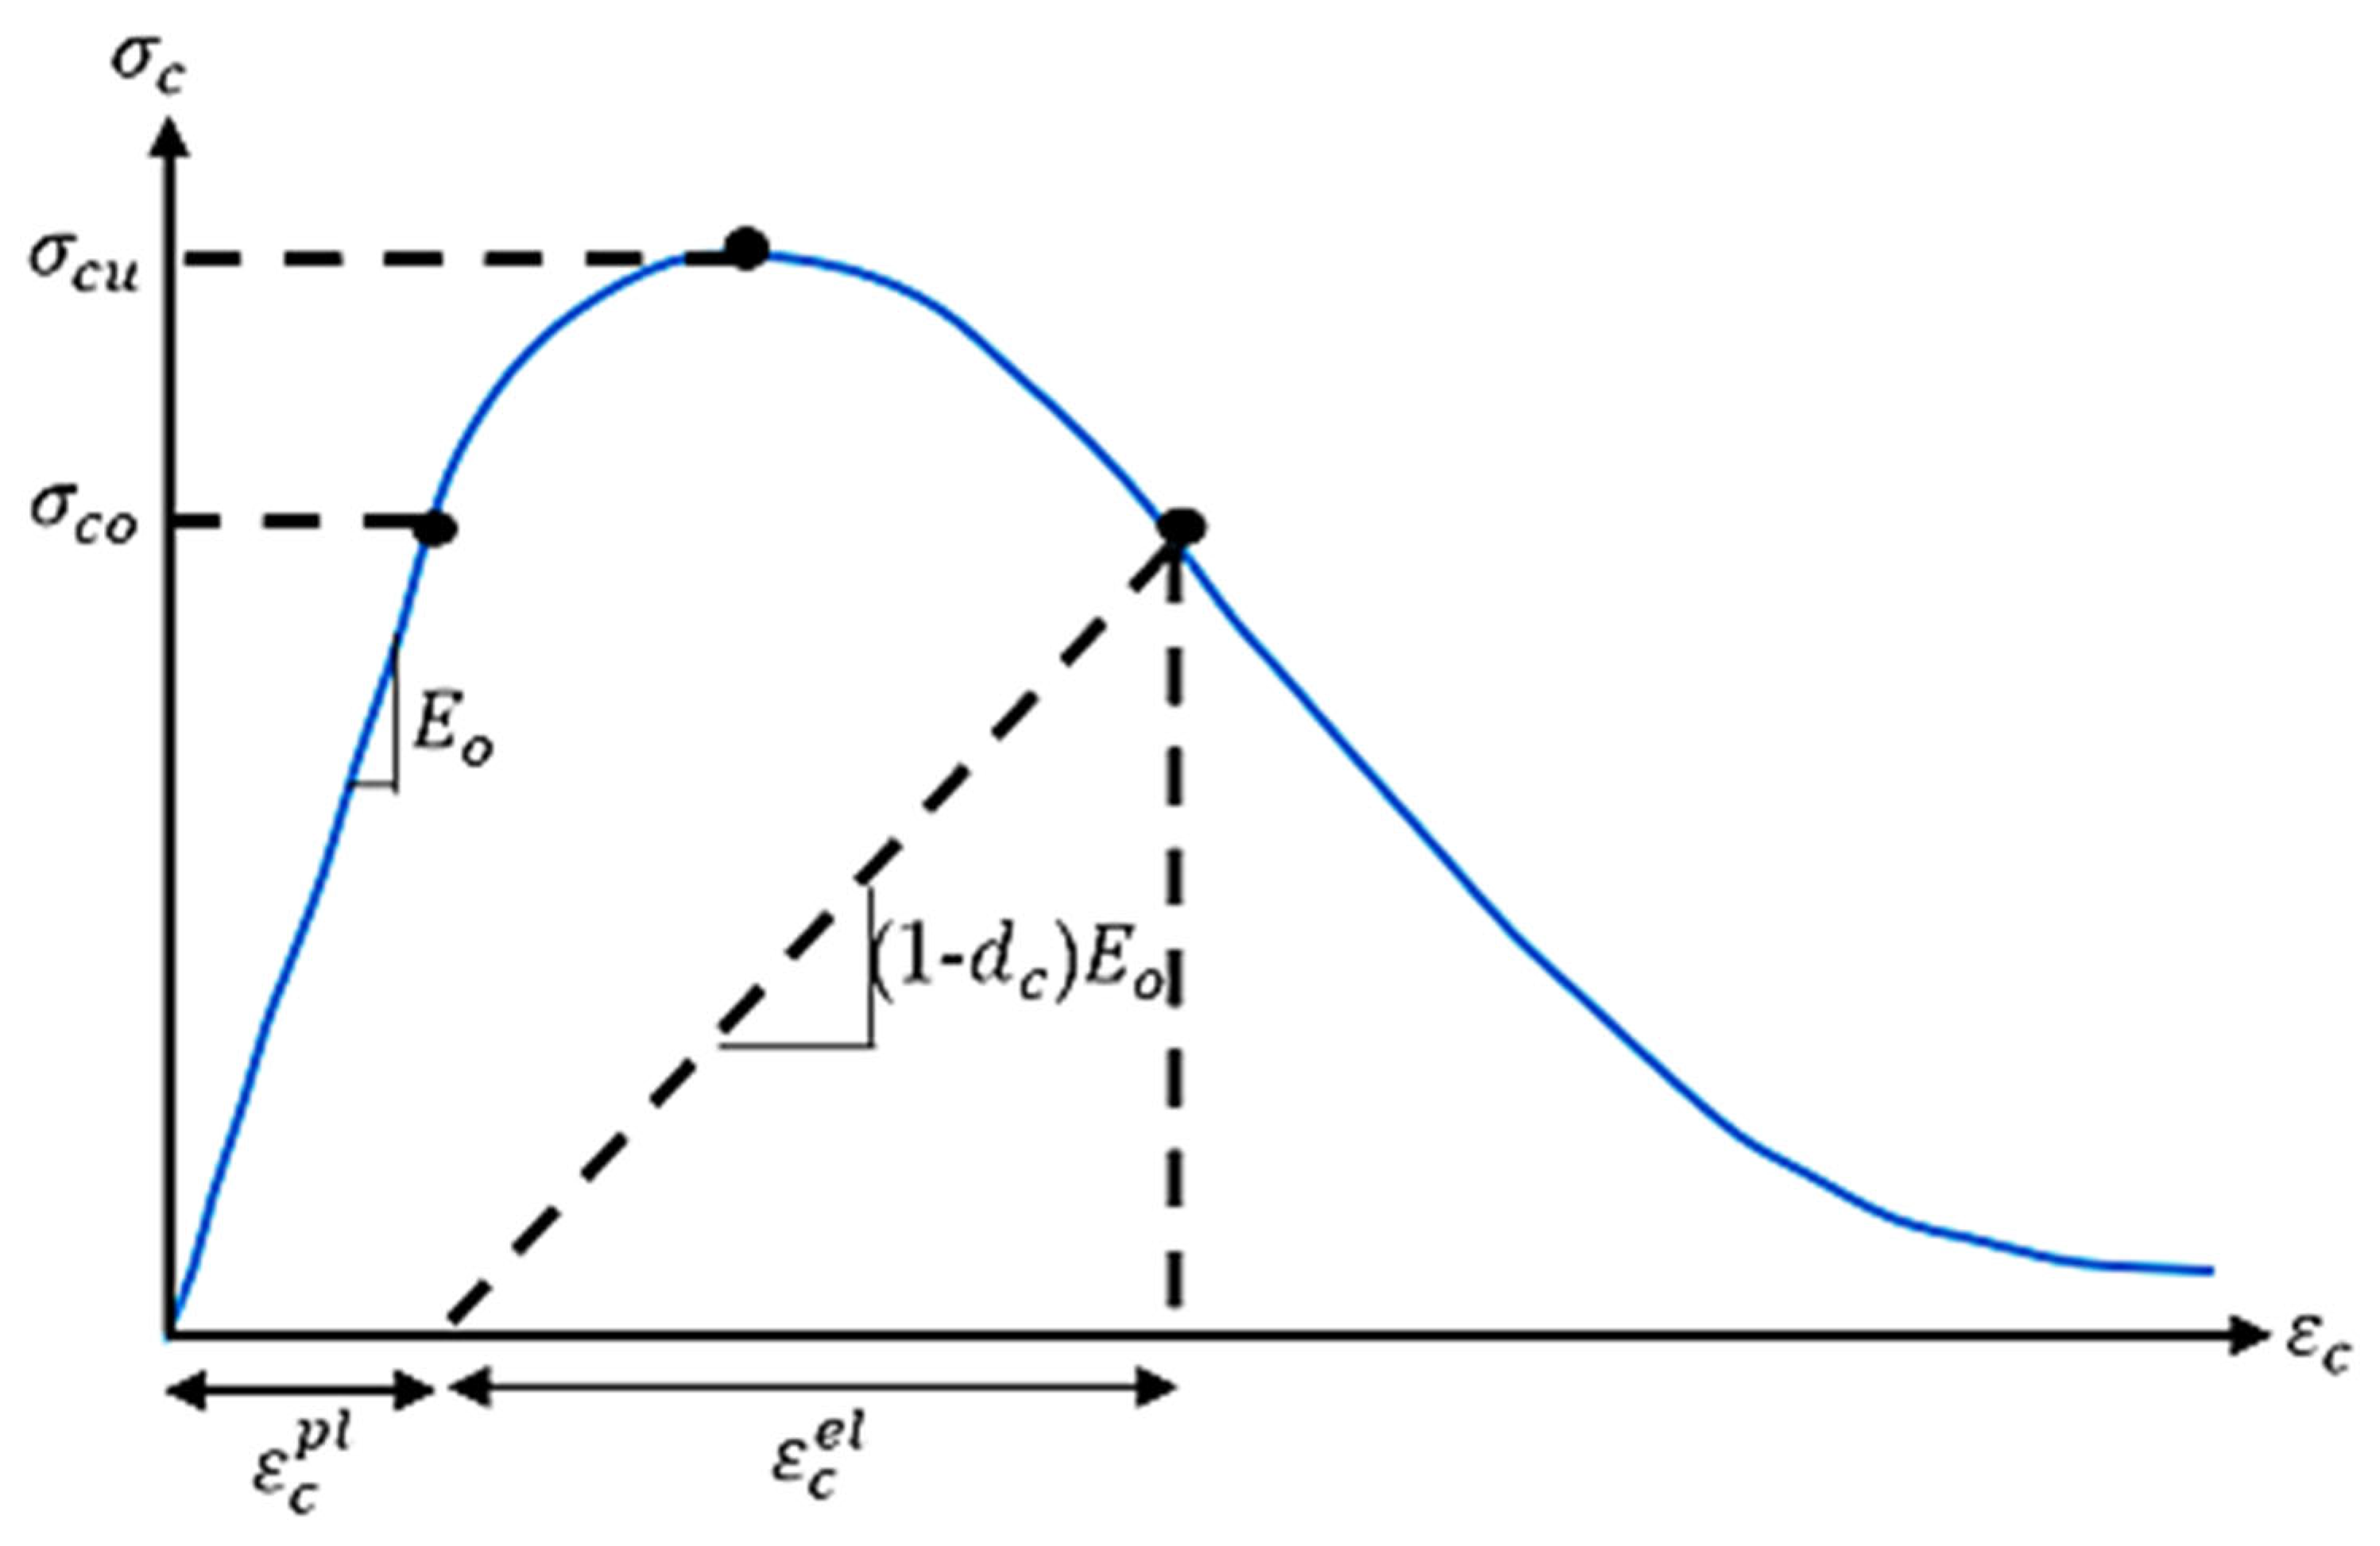
| nonlinear strain compression damage | |
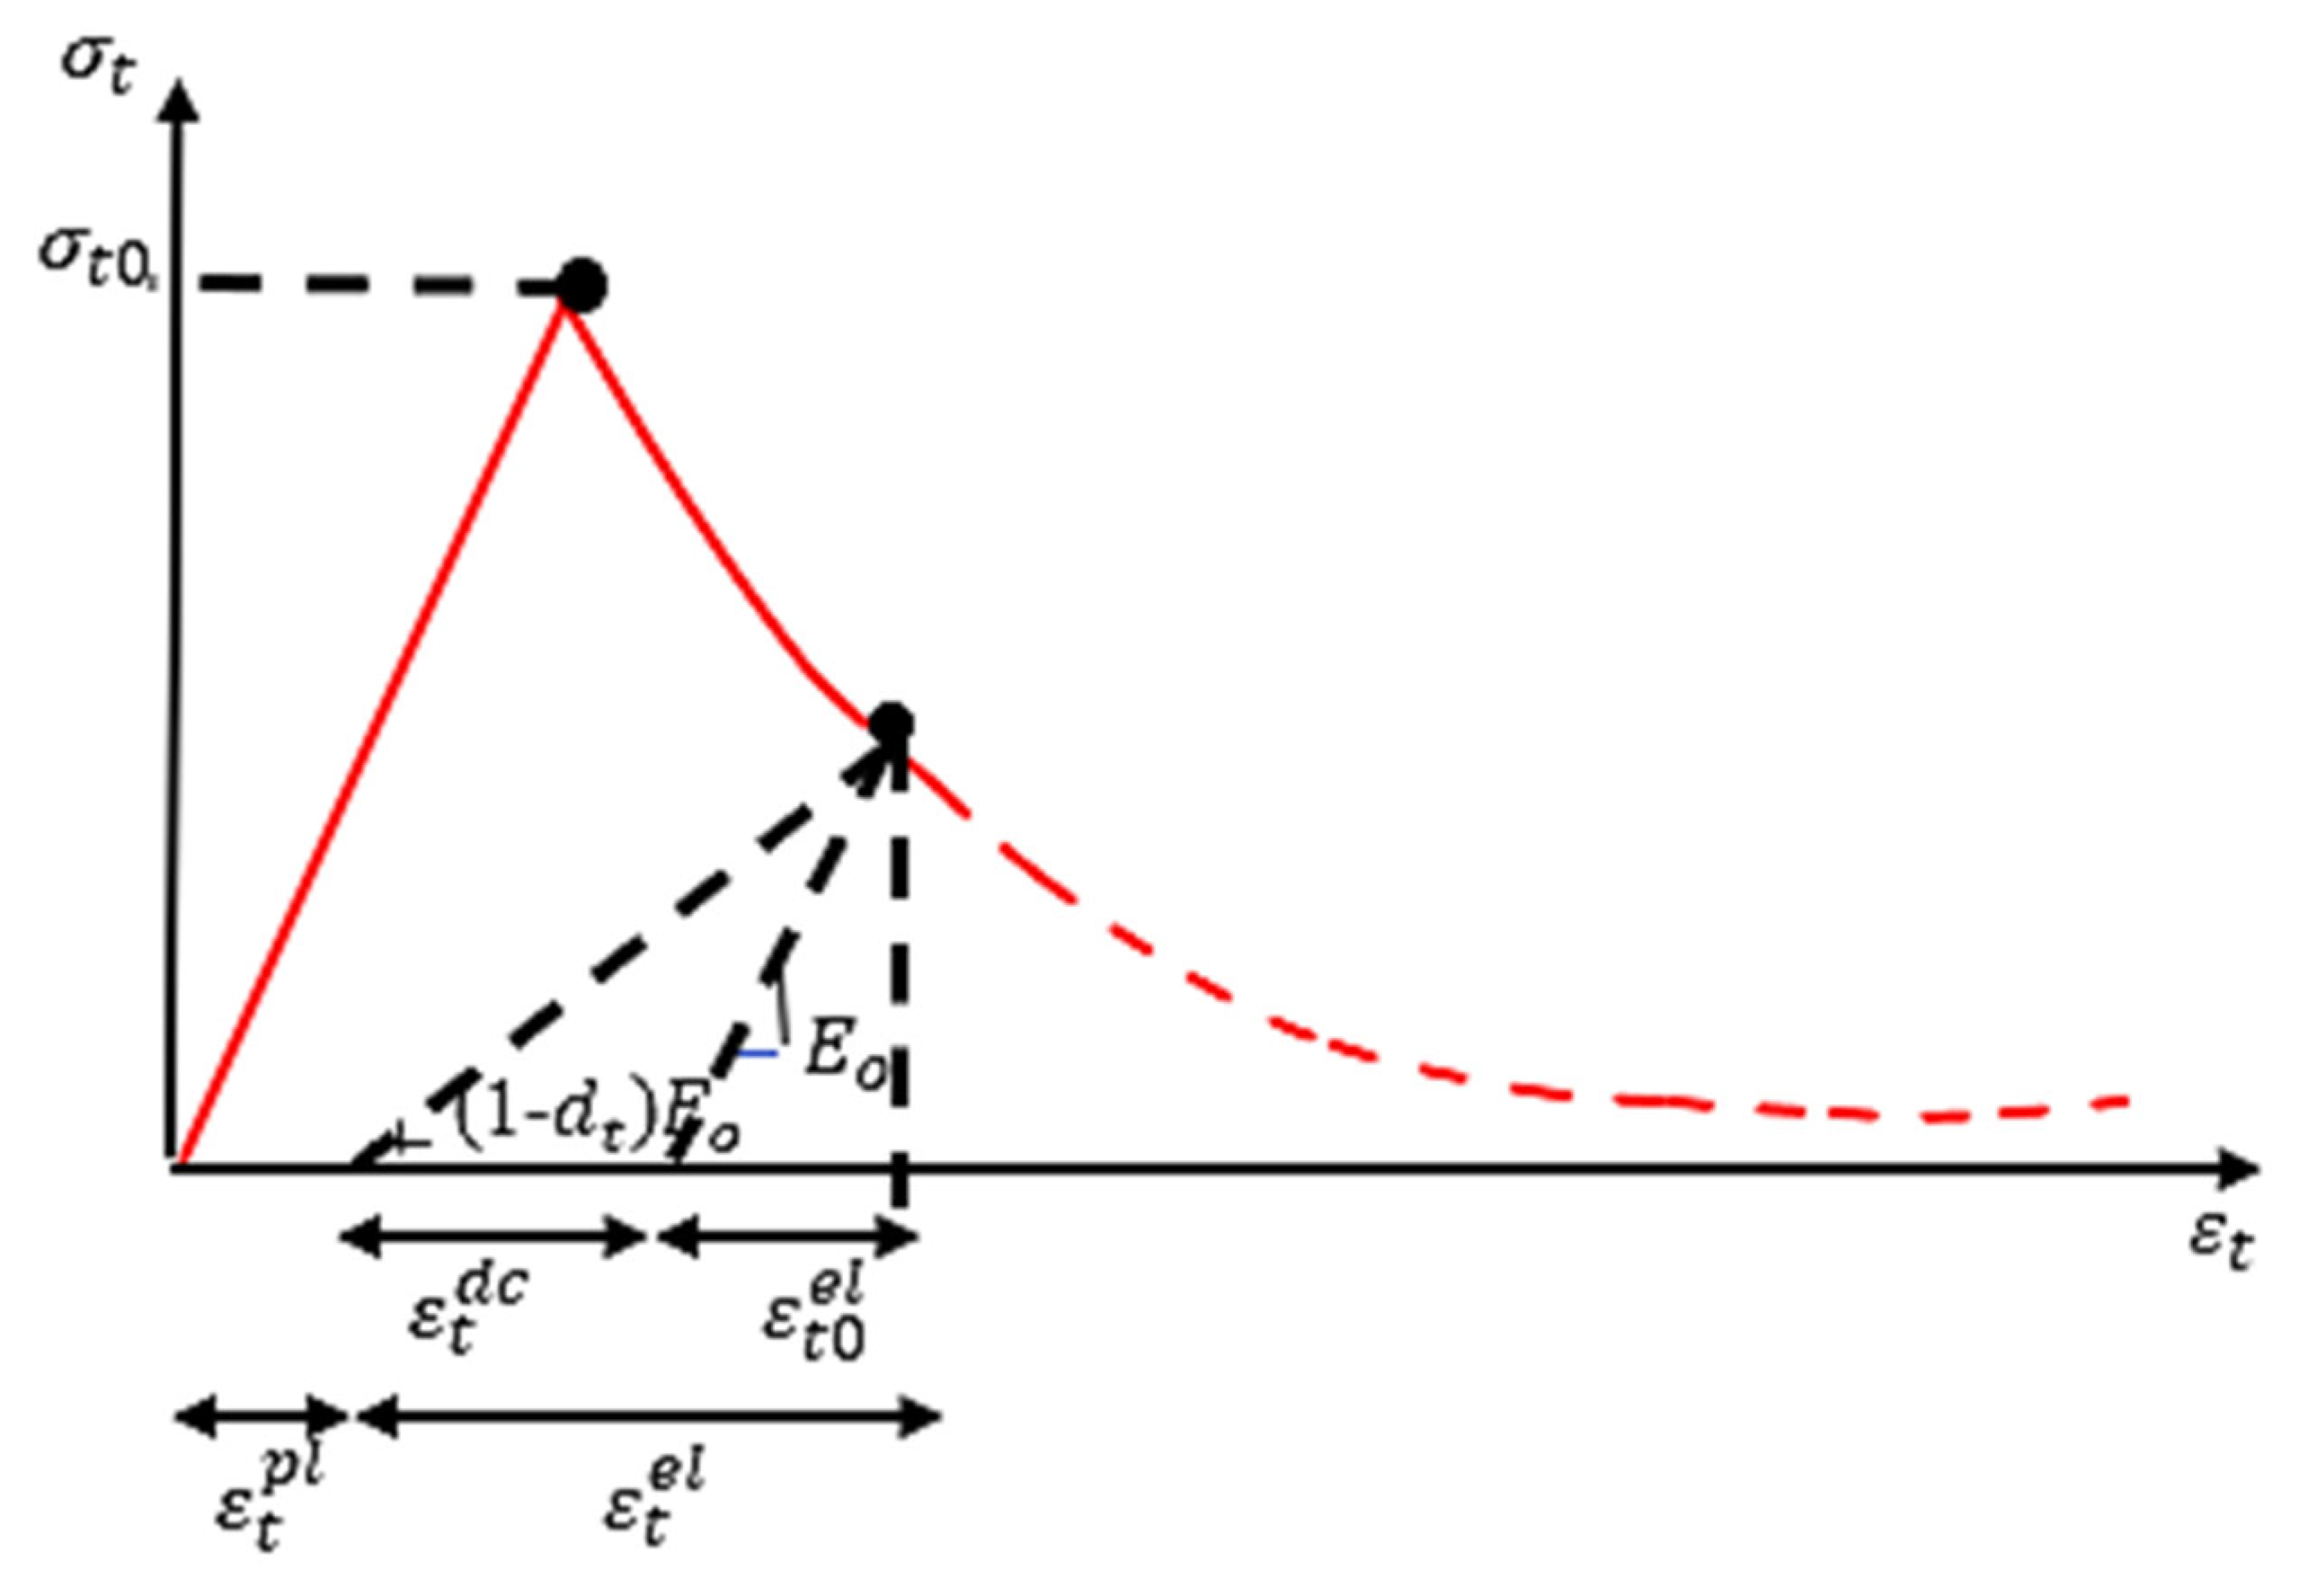
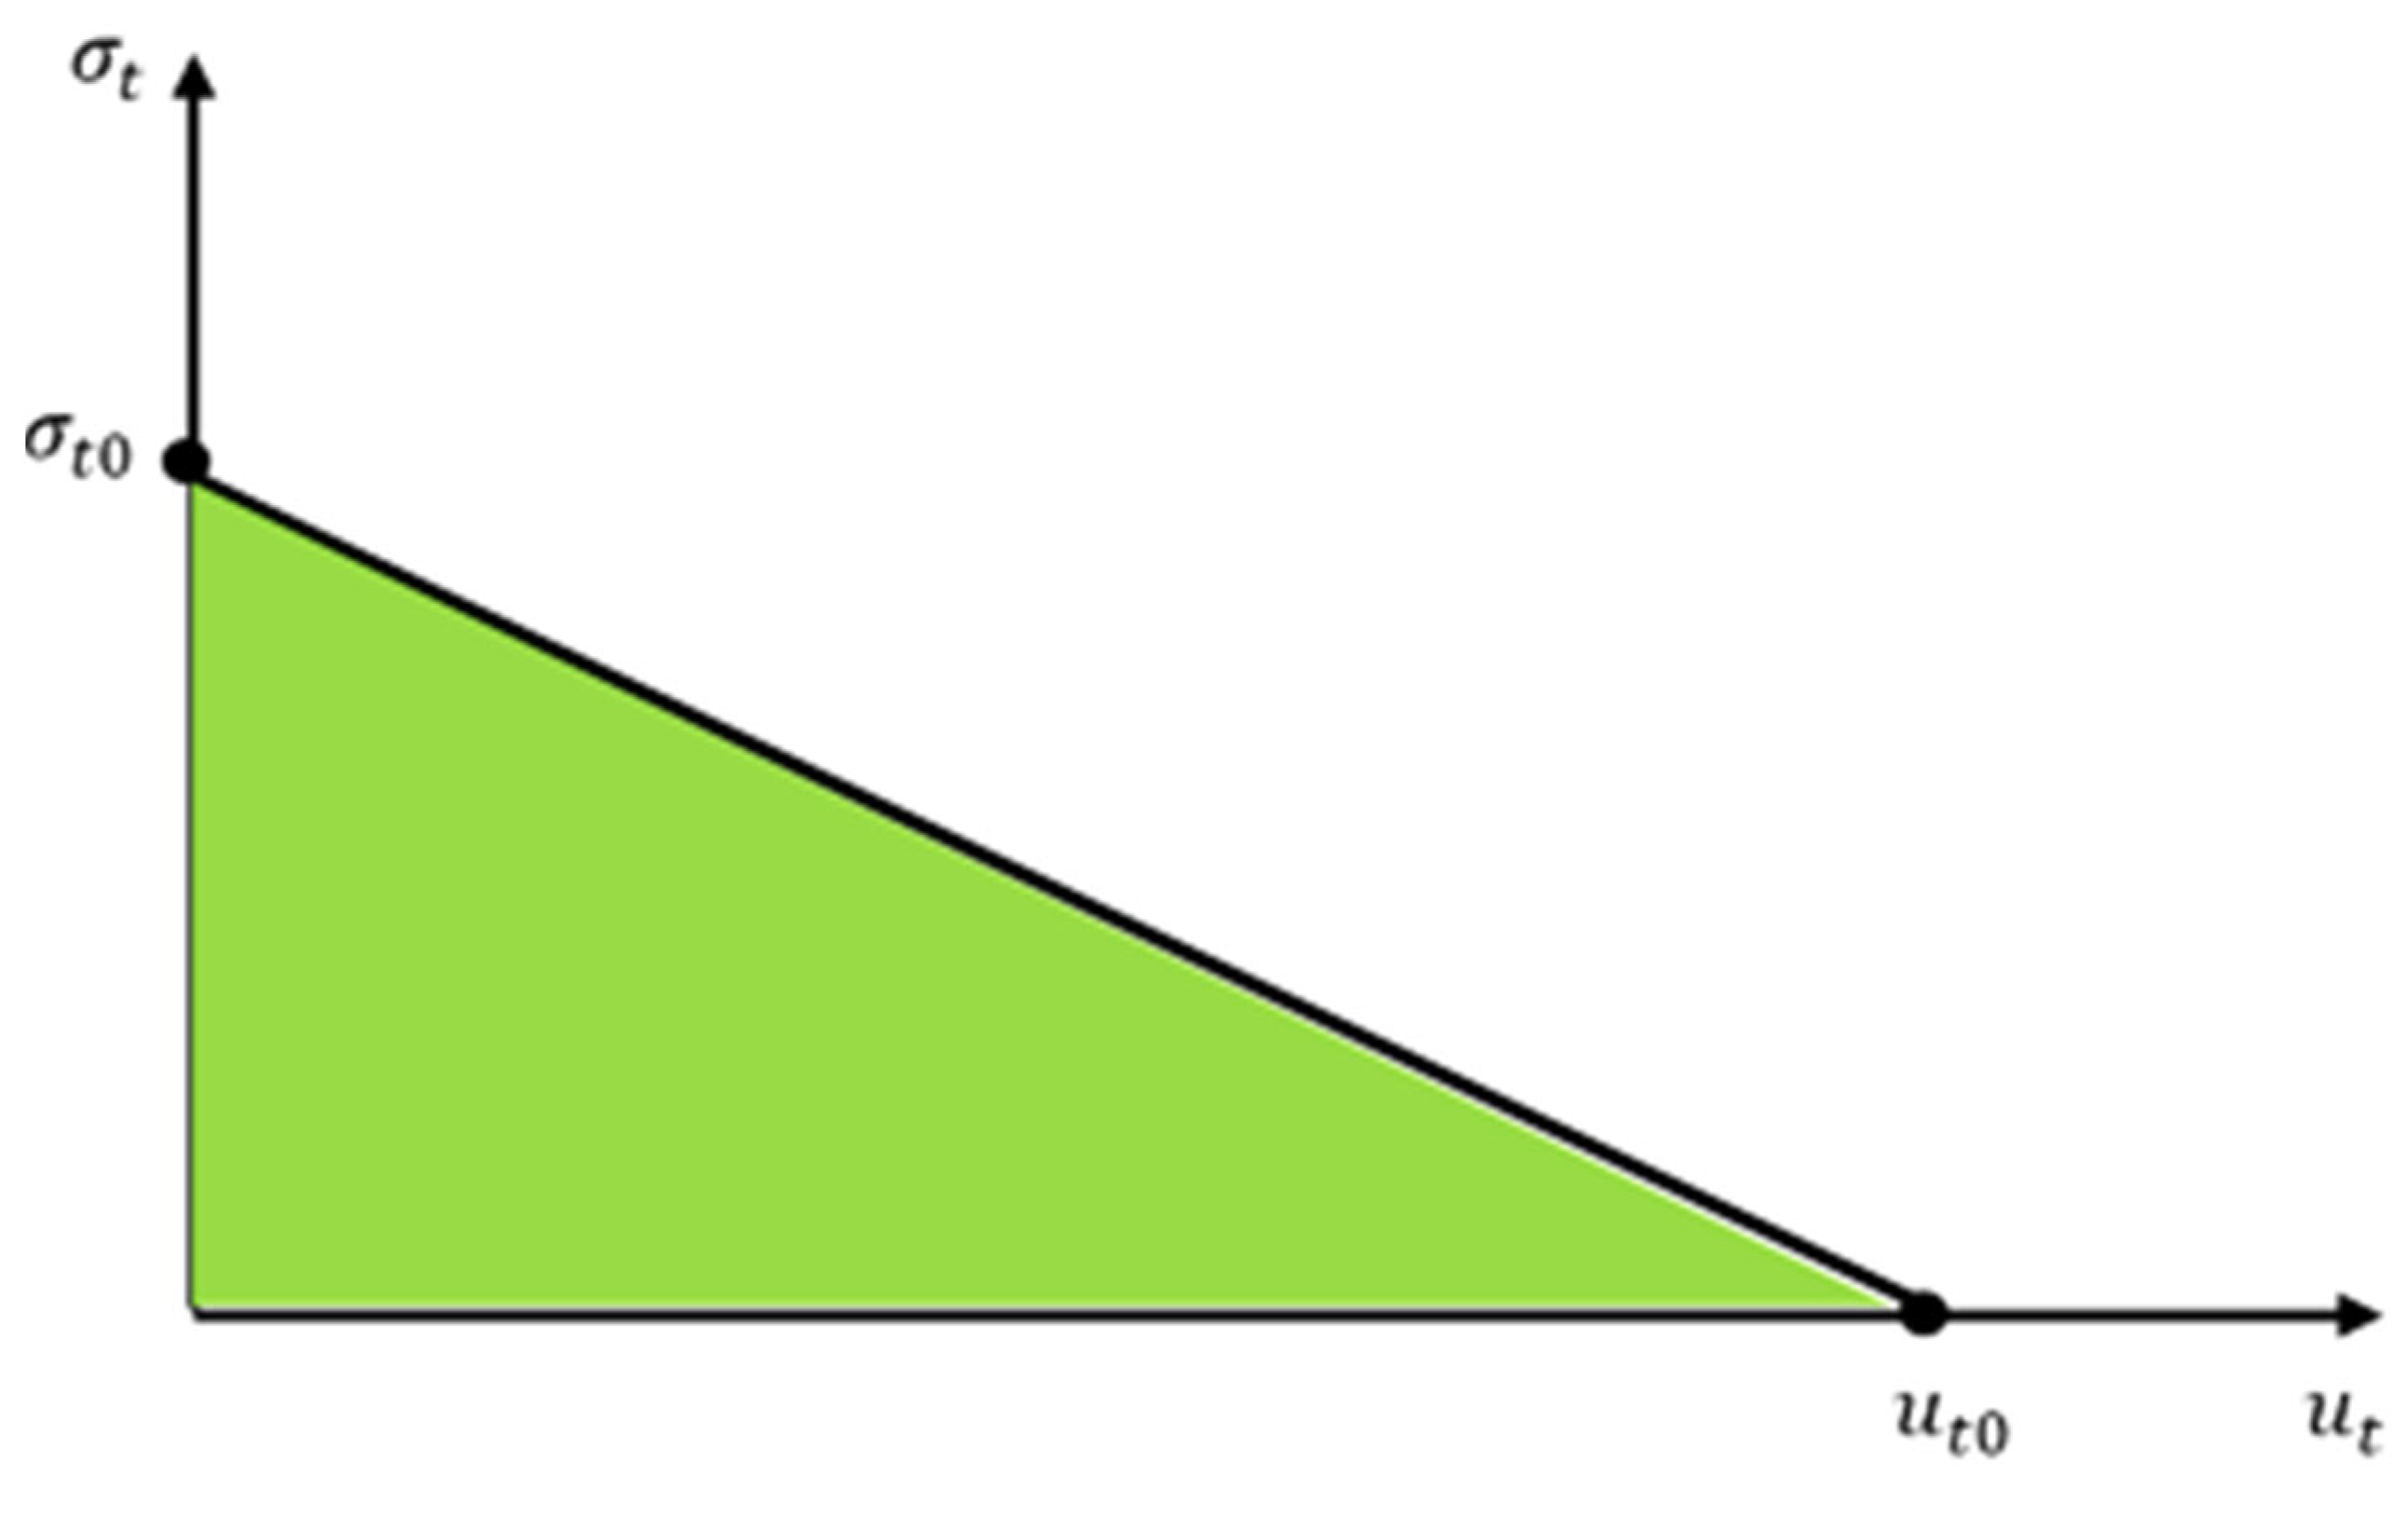
| failure cracking factor in elasticity | |
| modulus of elasticity | |
| area under the curve | |
| K | fluid bulk modulus |
| MCER | risk-targeted maximum considered earthquake |
| Ri | effective modal mass ratio |
| β | maximum participation factors |
| inelastic strains | |
| elastic strain | |
| plastic strain corresponding to the instantaneous compressive strength of the concrete | |
| plastic strain | |
| compression stress | |
References
- Vern, S.; Shrimali, M.K.; Bharti, S.D.; Datta, T.K.; Noroozinejad Farsangi, E. Seismic Control of Base-Isolated Liquid Storage Tanks Subjected to Bi-directional Strong Ground Motions. Arab. J. Sci. Eng. 2022, 47, 4511–4530. [Google Scholar] [CrossRef]
- Kangda, M.Z.; Bakre, S.; Kancharla, H.; Noroozinejad Farsangi, E. Seismic Performance Upgrade of Elevated Water Tanks Utilizing Friction Dampers. Pract. Period. Struct. Des. Constr. 2022, 27, 04022045. [Google Scholar] [CrossRef]
- Kumbhar, O.G.; Kumar, R.; Noroozinejad Farsangi, E. Direct displacement-based design of reinforced concrete elevated water tanks frame staging. Int. J. Eng. 2019, 32, 1395–1406. [Google Scholar]
- Sadeghi Movahhed, A.; Shirkhani, A.; Zardari, S.; Noroozinejad Farsangi, E.; Karimi Pour, A. Effective Range of Base Isolation Design Parameters to Improve Structural Performance under Far and Near-Fault Earthquakes. Adv. Strut. Eng. 2022, 15, 158–169. [Google Scholar] [CrossRef]
- Ebrahimi, A.; Edalati, M.; Valizadeh, M.; Karimi Pour, A. Increase the effectiveness of AMTMDs and PMTMDs on the seismic behaviour of structures case study: Ten-stories short period concrete building. Eng. Strut. 2021, 237, 112122. [Google Scholar] [CrossRef]
- Ghalehnovi, M.; Karimipour, A.; Edalati, M.; Barani, M. Investigation Responses of the Diagrid Structural System of High-rise Buildings Equipped with Tuned Mass Damper Using New Dynamic Method. J. Build. Mater. Sci. 2021, 1, 15–38. [Google Scholar]
- Mansour, A.M.; Kassem, M.M.; Nazri, F.M. Seismic vulnerability assessment of elevated water tanks with variable staging pattern incorporating the fluid-structure interaction. Structures 2021, 34, 61–77. [Google Scholar] [CrossRef]
- Edalati, E.; Veisizadeh, A.; Karimi Pour, A. Study and evaluation of low steel frames (LSF). In Proceedings of the 1st National Conference on Development of Civil Engineering, Architecture, Electricity and Mecanical in Iran, Gorgan, Iran, 18 December 2014. [Google Scholar]
- Rodd, J.; Castel, A. Structural considerations to minimise the risk of horizontal cracks in the wall of circular concrete tanks. Structures 2020, 40, 1091–1106. [Google Scholar] [CrossRef]
- Edalati, M.; Karimi Pour, A. Investigate the spectral response diagrams and suggest the correction of seismic parameters for 2800 Iranian code. In Proceedings of the First National Conference on Soil Mechanics and Foundation Engineering, Tehran, Iran, 3 December 2014. [Google Scholar]
- Phan, H.N.; Paolacci, F.; Bursi, O.S.; Tondini, N. Seismic fragility analysis of elevated steel storage tanks supported by reinforced concrete columns. J. Loss Prev. Process Ind. 2017, 47, 57–65. [Google Scholar] [CrossRef]
- Ghateh, R.; Kianoush, M.R.; Pogorzelski, W. Seismic response factors of reinforced concrete pedestal in elevated water tanks. Eng. Struct. 2015, 87, 32–46. [Google Scholar] [CrossRef]
- Housner, G.W. The dynamic behavior of water tanks. Bull. Seismol. Soc. Am. 1963, 53, 381–389. [Google Scholar] [CrossRef]
- Chen, W.; Haroun, M.A.; Liu, F. Large amplitude liquid sloshing in seismically excited tanks. Earthq. Eng. Struct. Dyn. 1996, 25, 653–669. [Google Scholar] [CrossRef]
- Solaas, F.; Faltinsen, O.M. Combined numerical and analytical solution for sloshing in two-dimensional tanks of general shape. J. Ship Res. 1997, 41, 118–129. [Google Scholar]
- Wu, G.X.; Ma, Q.W.; Eatock, T.R. Numerical simulation of sloshing waves in a 3D tank based on a finite element method. Appl. Ocean Res. 1998, 20, 337–355. [Google Scholar] [CrossRef]
- Chern, M.J.; Borthwick, A.G.L.; Taylor, R.E. A pseudospectral σ-transformation model of 2-D nonlinear waves. J. Fluids Struct. 1999, 13, 607–630. [Google Scholar] [CrossRef]
- Celebi, M.S.; Akyildiz, H. Nonlinear modeling of liquid sloshing in a moving rectangular tank. Ocean Eng. 2002, 29, 1527–1553. [Google Scholar] [CrossRef]
- Turnbull, M.S.; Borthwick, A.G.L.; Eatock, T.R. Numerical wave tank based on a sigma-transformed finite element inviscid flow solver. Int. J. Numer. Meth. Fluids 2003, 42, 641–663. [Google Scholar] [CrossRef]
- Hill, D.F. Transient, and steady-state amplitudes of forced waves in rectangular basins. Phys. Fluids 2003, 15, 1576–1587. [Google Scholar] [CrossRef]
- Frandsen, J.B. Sloshing motions in excited tanks. J. Comput. Phys. 2004, 196, 53–87. [Google Scholar] [CrossRef]
- Akyildiz, H. Experimental investigation of pressure distribution on a rectangular tank due to the liquid sloshing. Ocean Eng. 2005, 32, 1503–1516. [Google Scholar] [CrossRef]
- Akyildiz, H.; Erdem Ünal, N. Sloshing in a three-dimensional rectangular tank: Numerical simulation and experimental validation. Ocean Eng. 2006, 33, 2135–2149. [Google Scholar] [CrossRef]
- Virella, J.C.; Prato, C.A.; Godoy, L.A. Linear and nonlinear 2D finite element analysis of sloshing modes and pressures in rectangular tanks subject to horizontal harmonic motions. J. Sound Vib. 2008, 312, 442–460. [Google Scholar] [CrossRef]
- Pal, P.; Bhattacharyya, S.K. Sloshing in a partially filled liquid containers-Numerical and experimental study for 2-D problems. J. Sound Vib. 2010, 329, 4466–4485. [Google Scholar] [CrossRef]
- Goudarzi, M.; Sabbagh-Yazdi, S. Investigation of nonlinear sloshing effects in seismically excited tanks. Soil Dyn. Earthq. Eng. 2012, 43, 355–365. [Google Scholar] [CrossRef]
- Nithiarasu, P. An Arbitrary Lagrangian Eulerian (ALE) formulation for free surface flows using the Characteristic Based Split (CBS) scheme. Int. J. Numer. Meth. Fluids 2006, 50, 1119–1120. [Google Scholar] [CrossRef]
- Kaw, A.K. Mechanics of Composite Materials, 2nd ed.; Taylor & Francis Group: Boca Raton, FL, USA, 2006. [Google Scholar]
- Karimi Pour, A. Investigation of Lap-Spliced Reinforcing Bars in Steel Fibres Concrete (SFC) under Static and Cyclic Loading. Master’s Thesis, Department of Civil Engineering, Ferdowsi University of Mashhad, Mashhad, Iran, 2017. [Google Scholar]
- Algreane, G.A.I.; Osman, S.A.; Karim, O.A.; Kasa, A. Behavior of elevated concrete water tank subjected to artificial ground motion. Electron. J. Geo Eng. 2011, 9, 25–38. [Google Scholar]
- Akram, S.; Ann., Q.U. Newton Raphson Method. Int. J. Sci. Eng. Res. 2015, 6, 7. [Google Scholar]
- Karimi Pour, A. Experimental and numerical evaluation of steel fibres RC patterns influence on the seismic behaviour of the exterior concrete beam-column connections. Eng. Strut. 2022, 263, 114358. [Google Scholar] [CrossRef]
- Karimi Pour, A.; Ghalehnovi, M.; de Brito, J. New Model for the Lap-Splice Length of Tensile Reinforcement in Concrete Elements. J. Strut. Eng. 2021, 147, 12. [Google Scholar]
- Ghalehnovi, M.; Karimi Pour, A.; Azad Darmian, J. Studying on the effect of friction rotational damper, viscoelastic and TADAS on the structures seismic behavior. Mod. Civ. Eng. J. 2020, 18, 57. [Google Scholar]
- Edalati, M.; Alidadi, F.; Karimi Pour, A. Studying the effect of length and material properties of knee element on behavior factor of knee bracing system using nonlinear static analysis. In Proceedings of the 10th International Congress in Civil Engineering, Tabriz, Iran, 5 May 2015; pp. 5–9. [Google Scholar]
- Abaszadeh, A.R.; Feizolahi, S.; Karimi Pour, A. Investigation maximum displacement, base shear and overturning moment of concrete elevated tanks filled with variable mount of fluid. In Proceedings of the International Conference in New Research Civil Engineering Achievements Urban Development, Iran, 2015. [Google Scholar]
- Moslemi, M.; Kianoush, M.R.; Pogorzelski, W. Seismic response of liquid-filled elevated tanks. Eng. Struct. 2011, 33, 2074–2084. [Google Scholar] [CrossRef]
- ACI 350.3-06; Seismic Design of Liquid-Containing Concrete Structures and Commentary. American Concrete Institute: Farmington Hills, MI, USA, 2006.
- ASCE/SEI 7-16; Minimum Design loads and Associated Criteria for Buildings and Other Structures. American Society of Civil Engineers: Reston, VA, USA, 2005.
- Livaoglu, R.; Dogangun, A. Effect of foundation embedment on seismic behavior of elevated tanks considering fluid–structure-soil interaction. Soil Dyn. Earthq. Eng. 2007, 27, 855–863. [Google Scholar] [CrossRef]


| Convective | Impulsive | Total | ||
|---|---|---|---|---|
| Moslemi et al. [29] | Base shear | Max value (kN) 2487 | Max value (kN) 35,548 | Max value (kN) 34,842 |
| Base moment | Max value (kN-m) 94,023 | Max value (kN-m) 1,320,592 | Max value (kN-m) 1,293,880 | |
| This study | Base shear | Max value (kN) 2435 | Max value (kN) 35,025 | Max value (kN) 34,135 |
| Base moment | Max value (kN-m) 93,158 | Max value (kN-m) 13,005,879 | Max value (kN-m) 1,288,975 |
| Record | Station | Year | Fault Distance (km) | (m/s) | Comp. | (g) | (m/s) | ||
|---|---|---|---|---|---|---|---|---|---|
| Far-fault records | |||||||||
| Northridge | Ferndale City Hall | 1954 | 6.50 | 27.02 | 219.31 | 44 | 0.160 | 0.30 | 0.53 |
| 314 | 0.200 | 0.26 | 0.77 | ||||||
| Kocaeli, Turkey | Duzce | 1999 | 7.51 | 15.37 | 281.86 | 180 | 0.312 | 0.58 | 0.53 |
| 270 | 0.364 | 0.55 | 0.65 | ||||||
| Loma Prieta | Hollister—South and Pine | 1989 | 6.93 | 27.93 | 282.14 | 0 | 0.370 | 0.63 | 0.58 |
| 90 | 0.178 | 0.31 | 0.57 | ||||||
| El Centro | El Centro Imp. Co. Cent | 1987 | 6.54 | 18.2 | 192.05 | 0 | 0.357 | 0.48 | 0.74 |
| 90 | 0.260 | 0.42 | 0.62 | ||||||
| Imperial Valley-06 | Delta | 1979 | 6.53 | 22.03 | 242.05 | 262 | 0.235 | 0.26 | 0.89 |
| 352 | 0.350 | 0.33 | 1.05 | ||||||
| Kobe | TAZ090 | 1995 | 7.14 | 31.62 | 269.26 | 0 | 0.294 | 0.35 | 0.84 |
| 90 | 0.293 | 0.38 | 0.78 | ||||||
| Near-fault records | |||||||||
| Northridge | Newhall—W Pico Canyon Rd | 1994 | 6.69 | 5.48 | 285.93 | Normal | 0.425 | 0.87 | 0.48 |
| Parallel | 0.280 | 0.74 | 0.37 | ||||||
| Kocaeli, Turkey | YPT | 1999 | 7.40 | 4.80 | 297.00 | Normal | 0.235 | 0.89 | 0.26 |
| Parallel | 0.327 | 0.88 | 0.36 | ||||||
| Loma Prieta | Hollister City Hall | 1989 | 7.10 | 5.80 | 333.85 | Normal | 0.529 | 0.502 | 1.05 |
| Parallel | 0.443 | 0.423 | 1.04 | ||||||
| El Centro | LA-SFA | 1987 | 6.90 | 6.20 | 315.06 | Normal | 0.452 | 0.398 | 1.13 |
| Parallel | 0.436 | 0.412 | 1.02 | ||||||
| Imperial Valley-06 | EC County Center FF | 1979 | 6.53 | 7.31 | 192.05 | Normal | 0.179 | 0.540 | 0.33 |
| Parallel | 0.222 | 0.430 | 0.51 | ||||||
| Kobe | TCU052 | 1995 | 7.60 | 3.70 | 479 | Normal | 0.694 | 0.590 | 1.17 |
| Parallel | 0.693 | 0.630 | 1.10 | ||||||
| Mode | Frequency (Hz) | Effective Mass kg | (%) | (Normalized) | |||
|---|---|---|---|---|---|---|---|
| Number | Type | This Study | Code | This Study | Code | ||
| 1 * | Convective | 0.163 | 0.160 | 4302.55 | 58.9 | 56.0 | 1.00 |
| 2 | 0.164 | 235.42 | 0.24 | ||||
| 3 | 0.298 | 141.66 | 0.19 | ||||
| 1 | Impulsive | 1958 | 2.980 | 918.39 | 41.4 | 40.4 | 0.48 |
| 2 * | 1960 | 3367.54 | 0.89 | ||||
| 3 | 7472 | 228.16 | 0.24 | ||||
Publisher’s Note: MDPI stays neutral with regard to jurisdictional claims in published maps and institutional affiliations. |
© 2022 by the authors. Licensee MDPI, Basel, Switzerland. This article is an open access article distributed under the terms and conditions of the Creative Commons Attribution (CC BY) license (https://creativecommons.org/licenses/by/4.0/).
Share and Cite
Karimi Pour, A.; Farsangi, E.N. Seismic Performance Analysis of the Elevated RC Tanks under Strong Far- and Near-Fault Ground Motions Considering Fluid–Structure Interaction. Infrastructures 2022, 7, 138. https://doi.org/10.3390/infrastructures7100138
Karimi Pour A, Farsangi EN. Seismic Performance Analysis of the Elevated RC Tanks under Strong Far- and Near-Fault Ground Motions Considering Fluid–Structure Interaction. Infrastructures. 2022; 7(10):138. https://doi.org/10.3390/infrastructures7100138
Chicago/Turabian StyleKarimi Pour, Arash, and Ehsan Noroozinejad Farsangi. 2022. "Seismic Performance Analysis of the Elevated RC Tanks under Strong Far- and Near-Fault Ground Motions Considering Fluid–Structure Interaction" Infrastructures 7, no. 10: 138. https://doi.org/10.3390/infrastructures7100138
APA StyleKarimi Pour, A., & Farsangi, E. N. (2022). Seismic Performance Analysis of the Elevated RC Tanks under Strong Far- and Near-Fault Ground Motions Considering Fluid–Structure Interaction. Infrastructures, 7(10), 138. https://doi.org/10.3390/infrastructures7100138