Analytical Model for Air Flow into Cracked Concrete Structures for Super-Speed Tube Transport Systems


Abstract
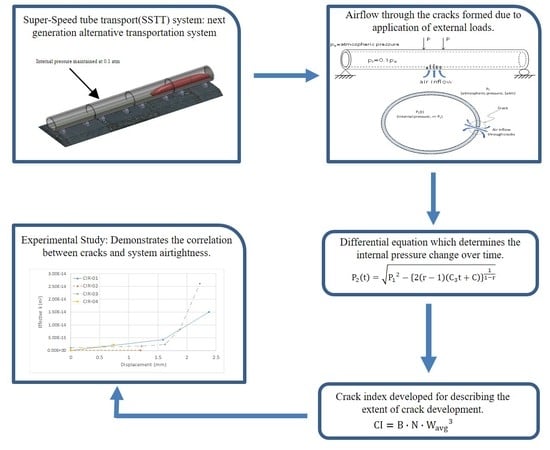
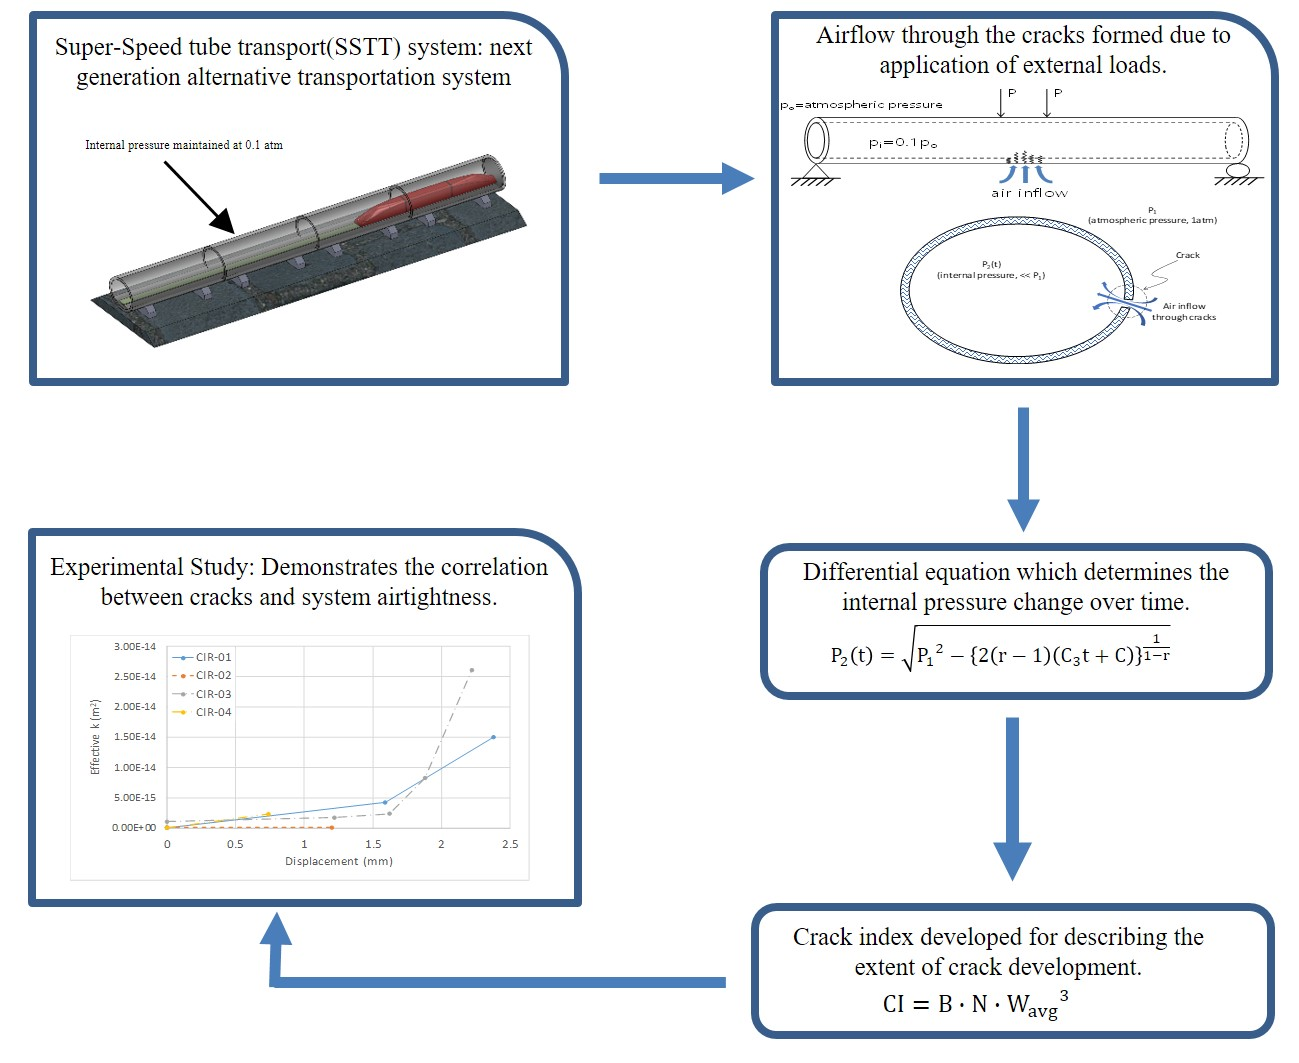
1. Introduction
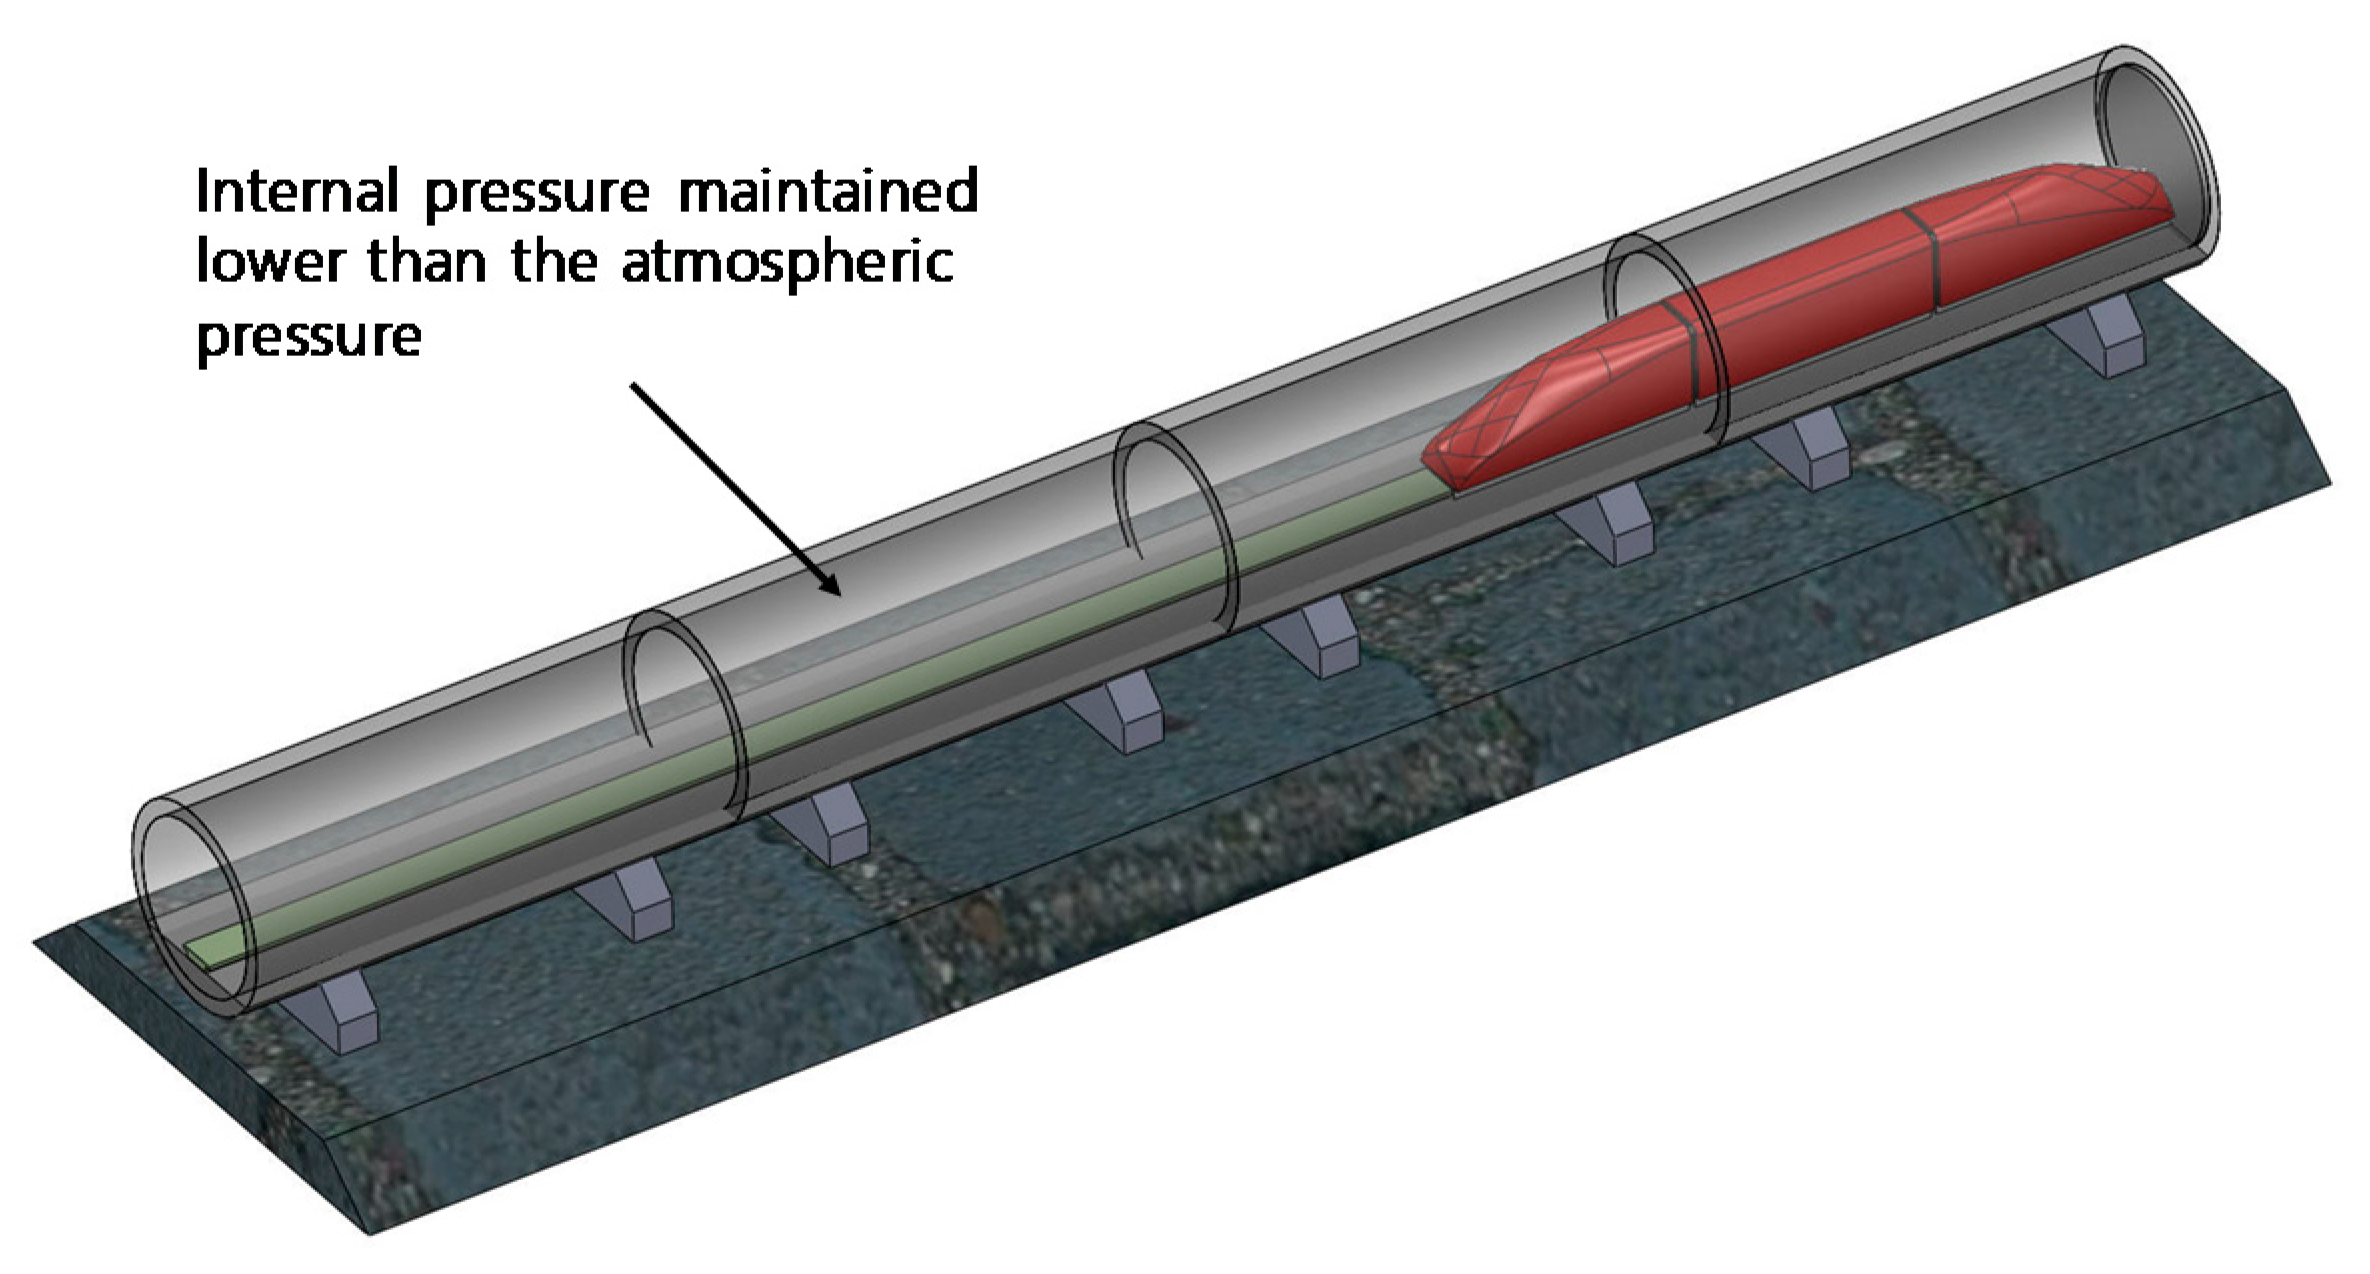
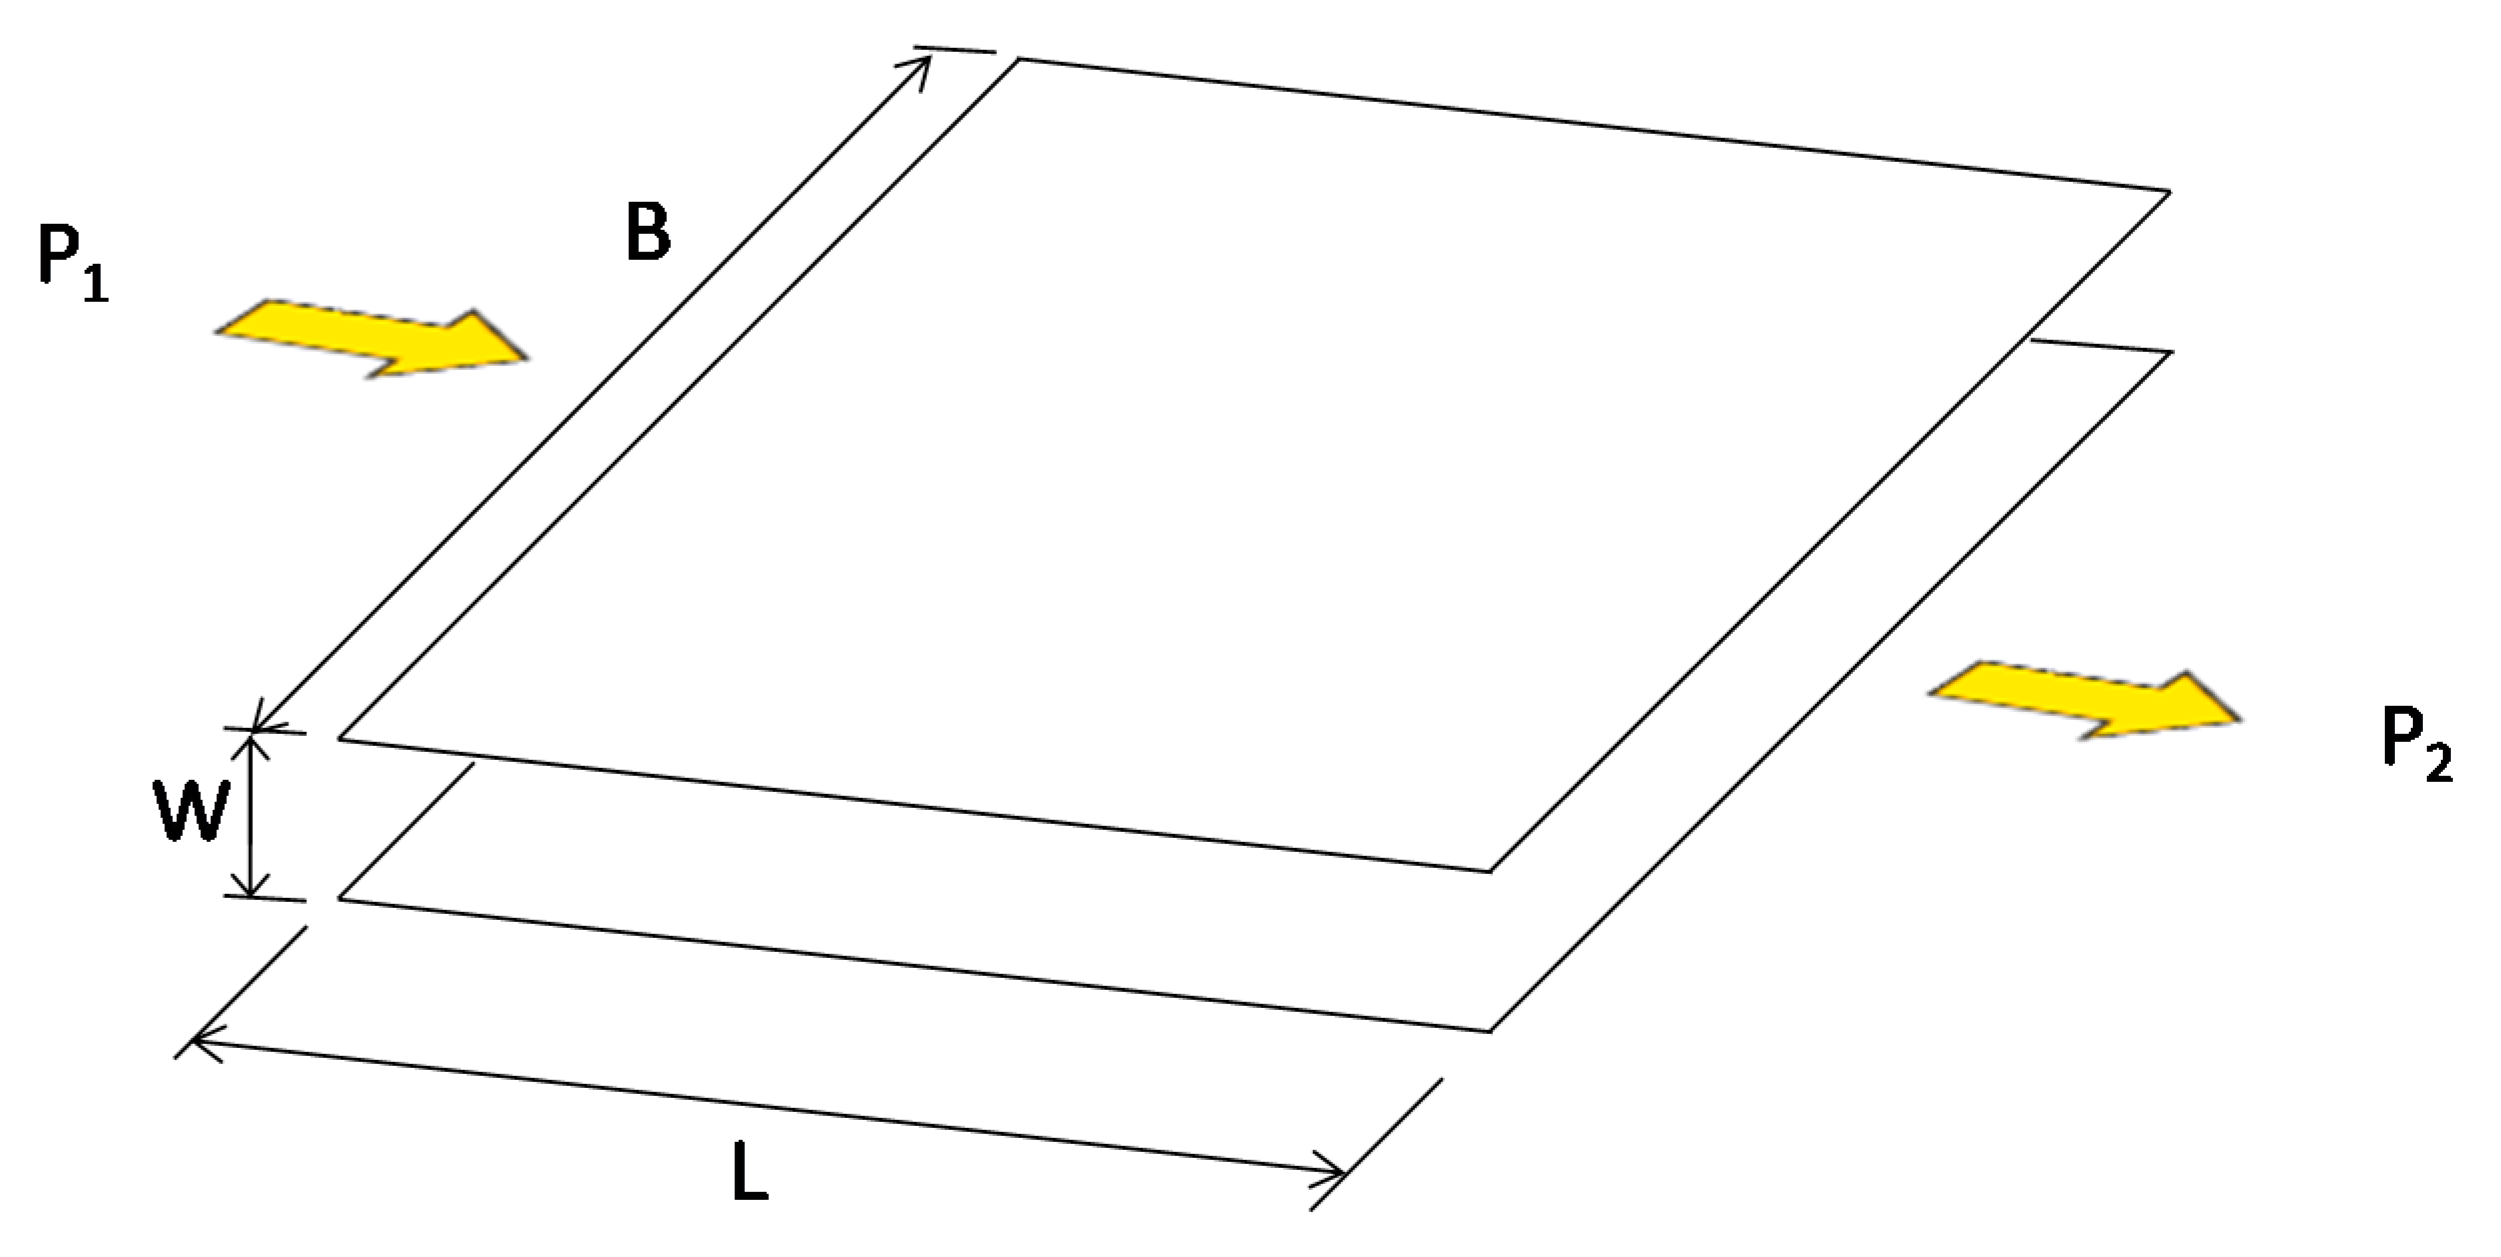
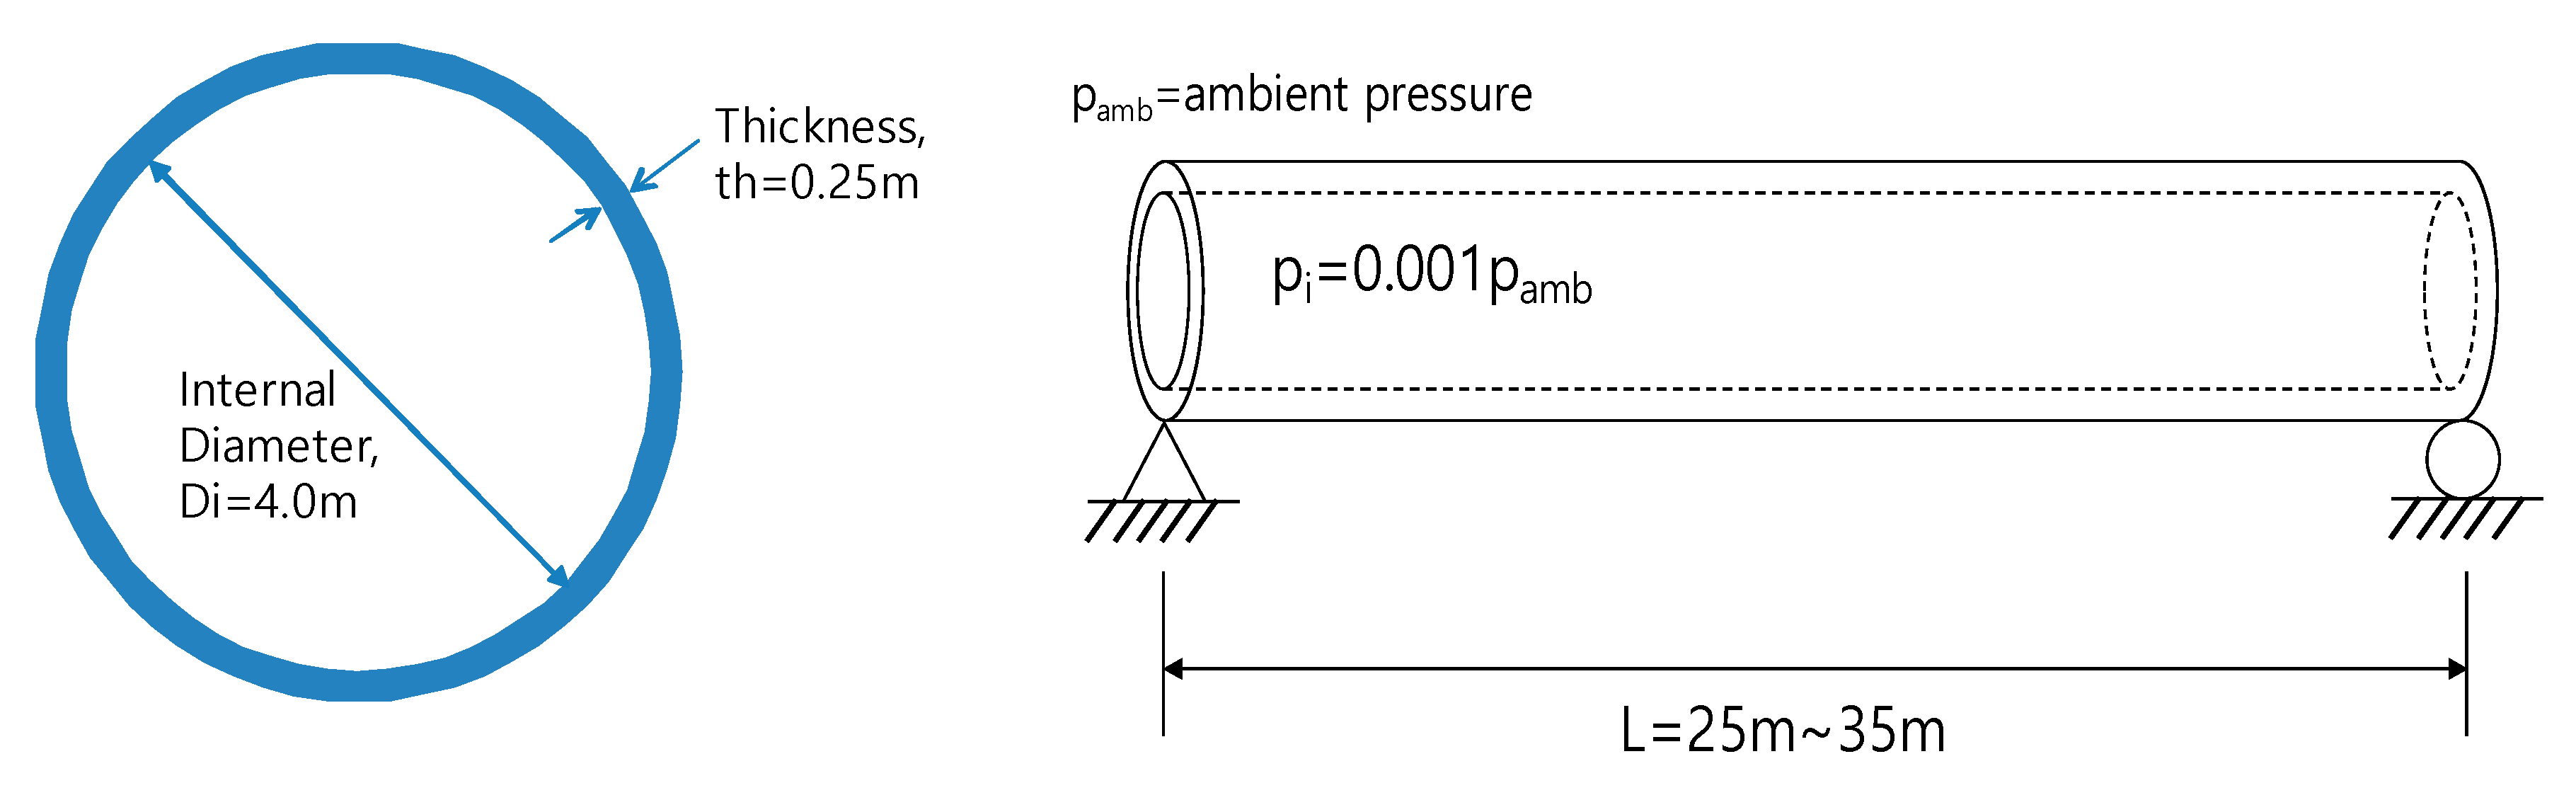
2. Development of Analytical Model for Air Inflow through Cracks
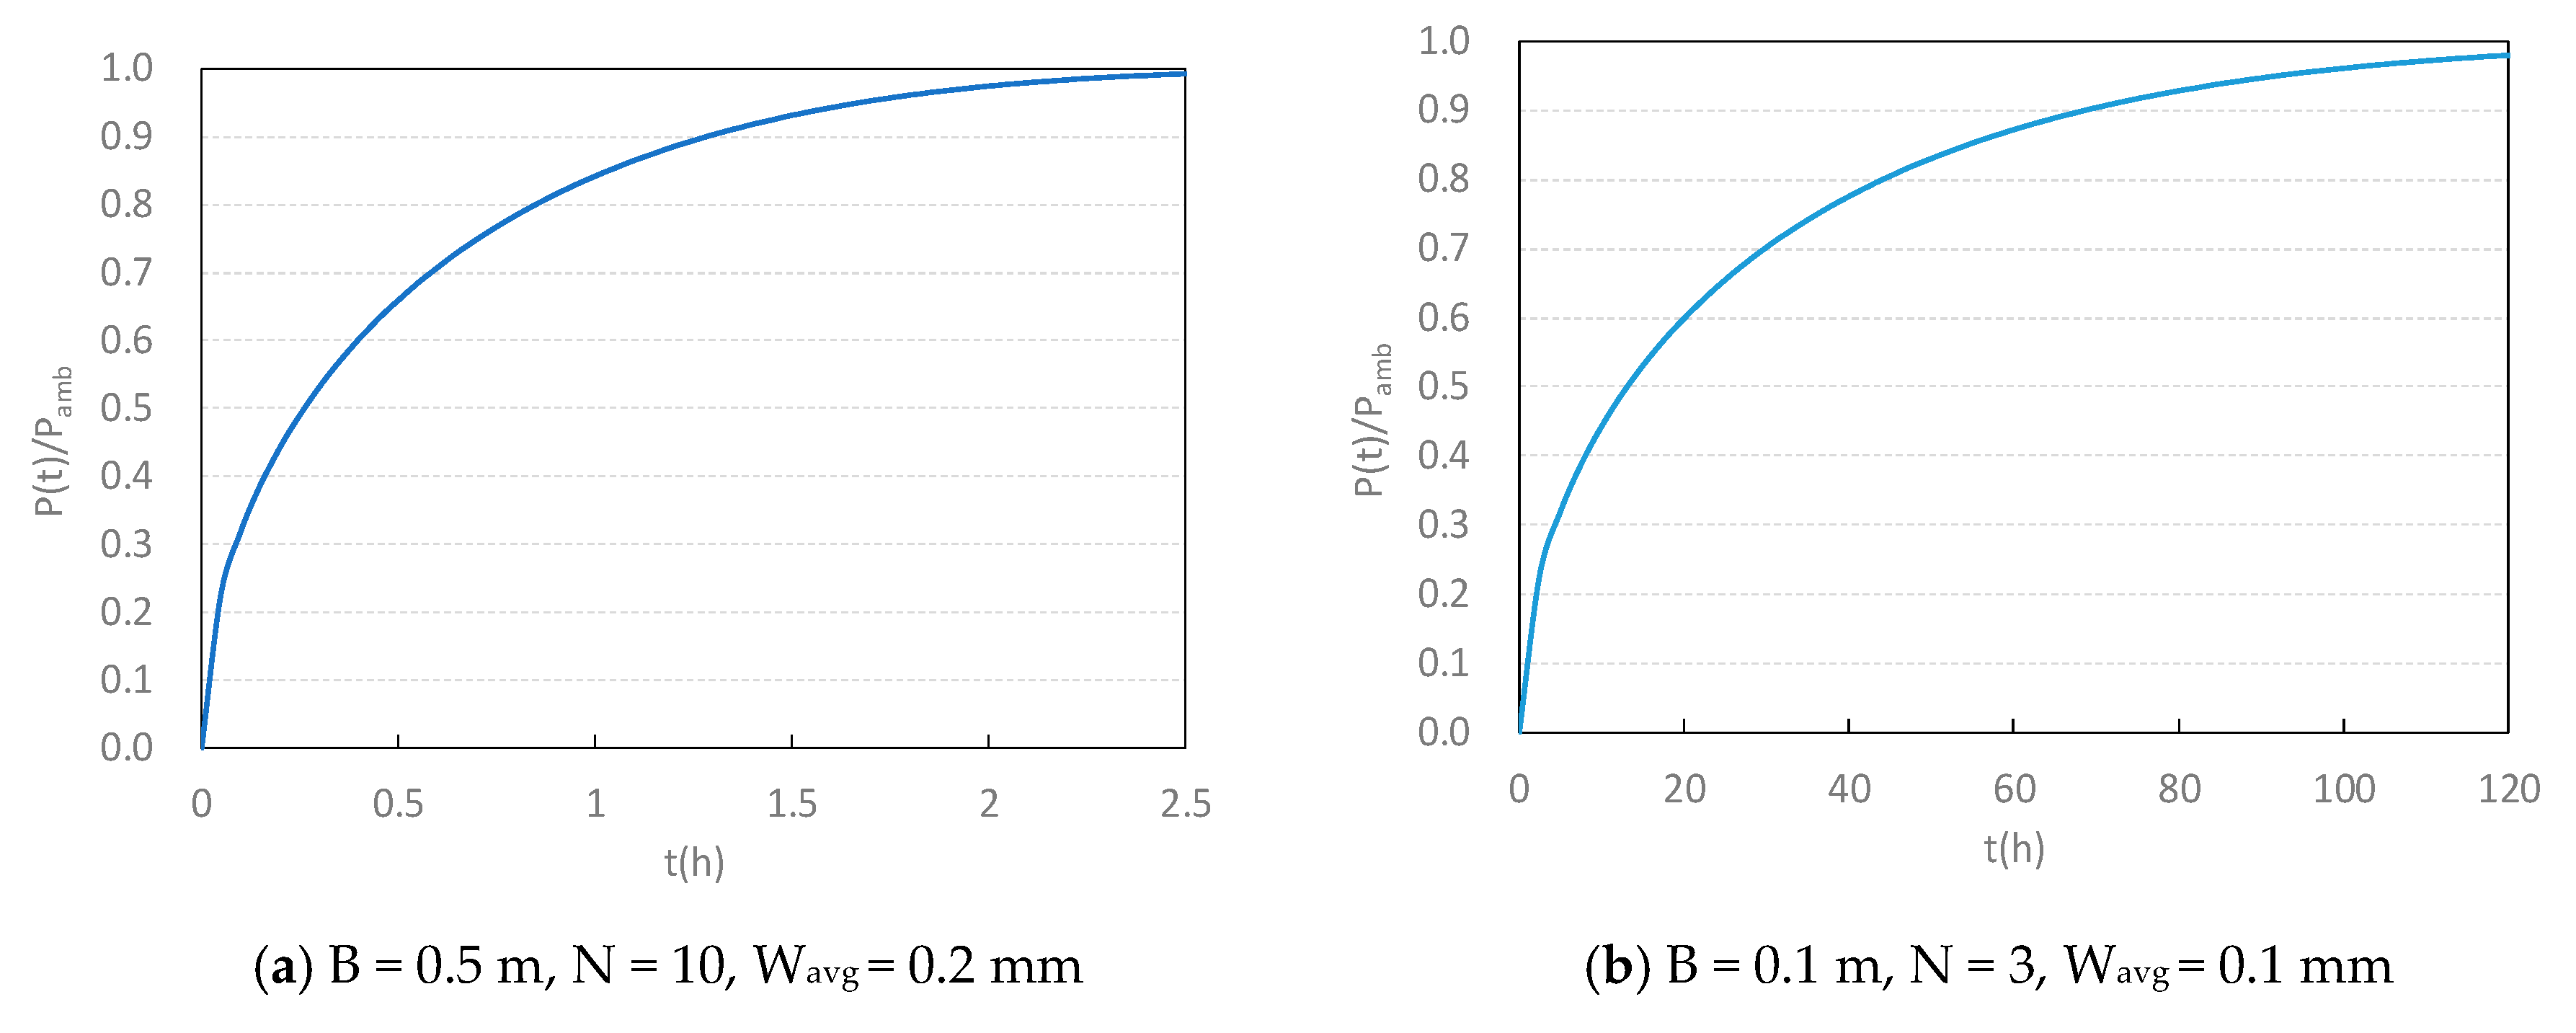
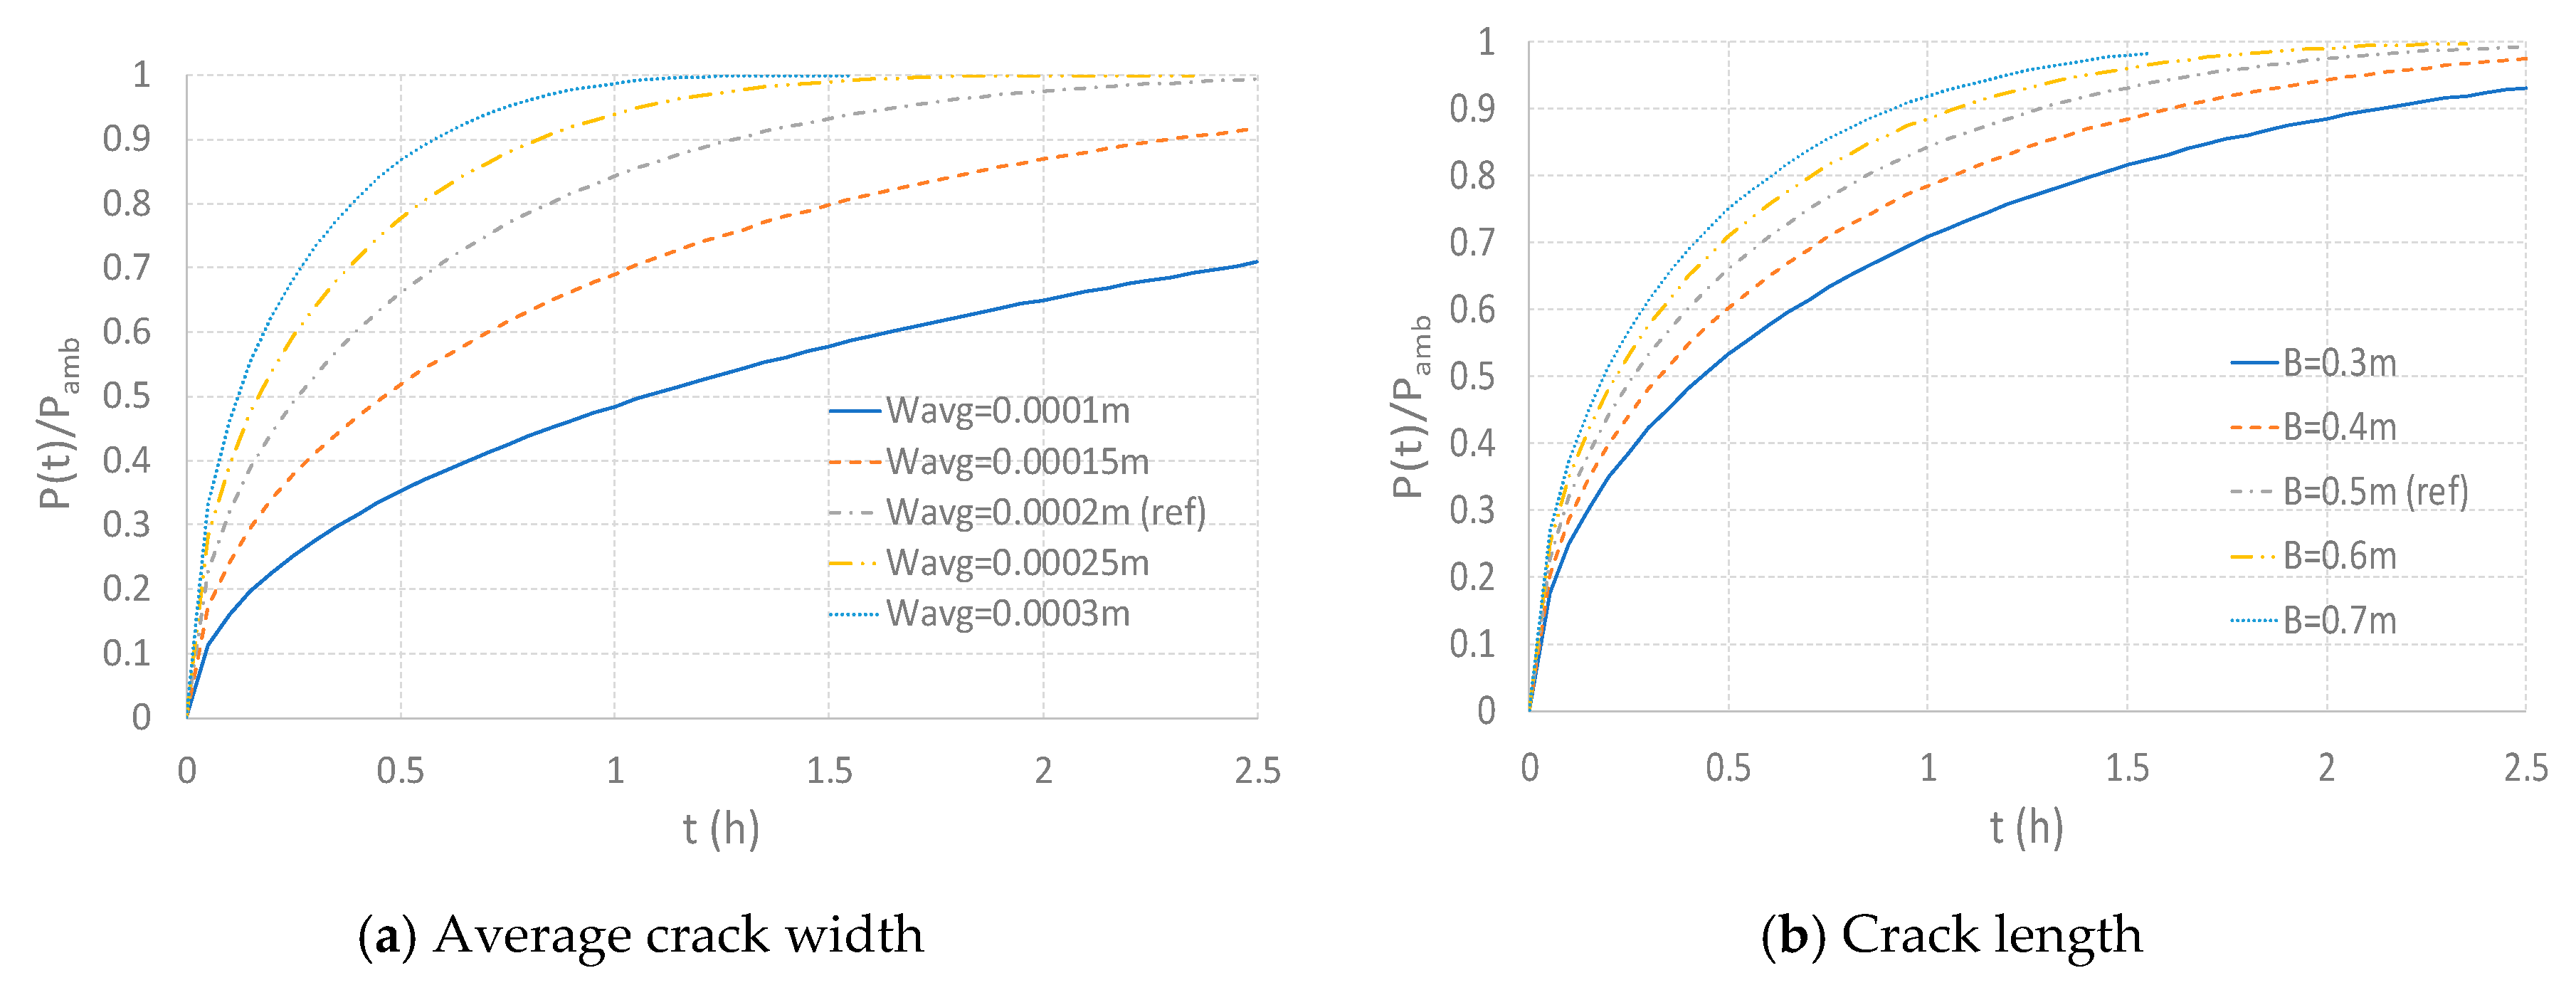
3. Investigation of Crack Effect on the Air Inflow
4. Definition of Crack Index for Air-Tightness of Tube Structures
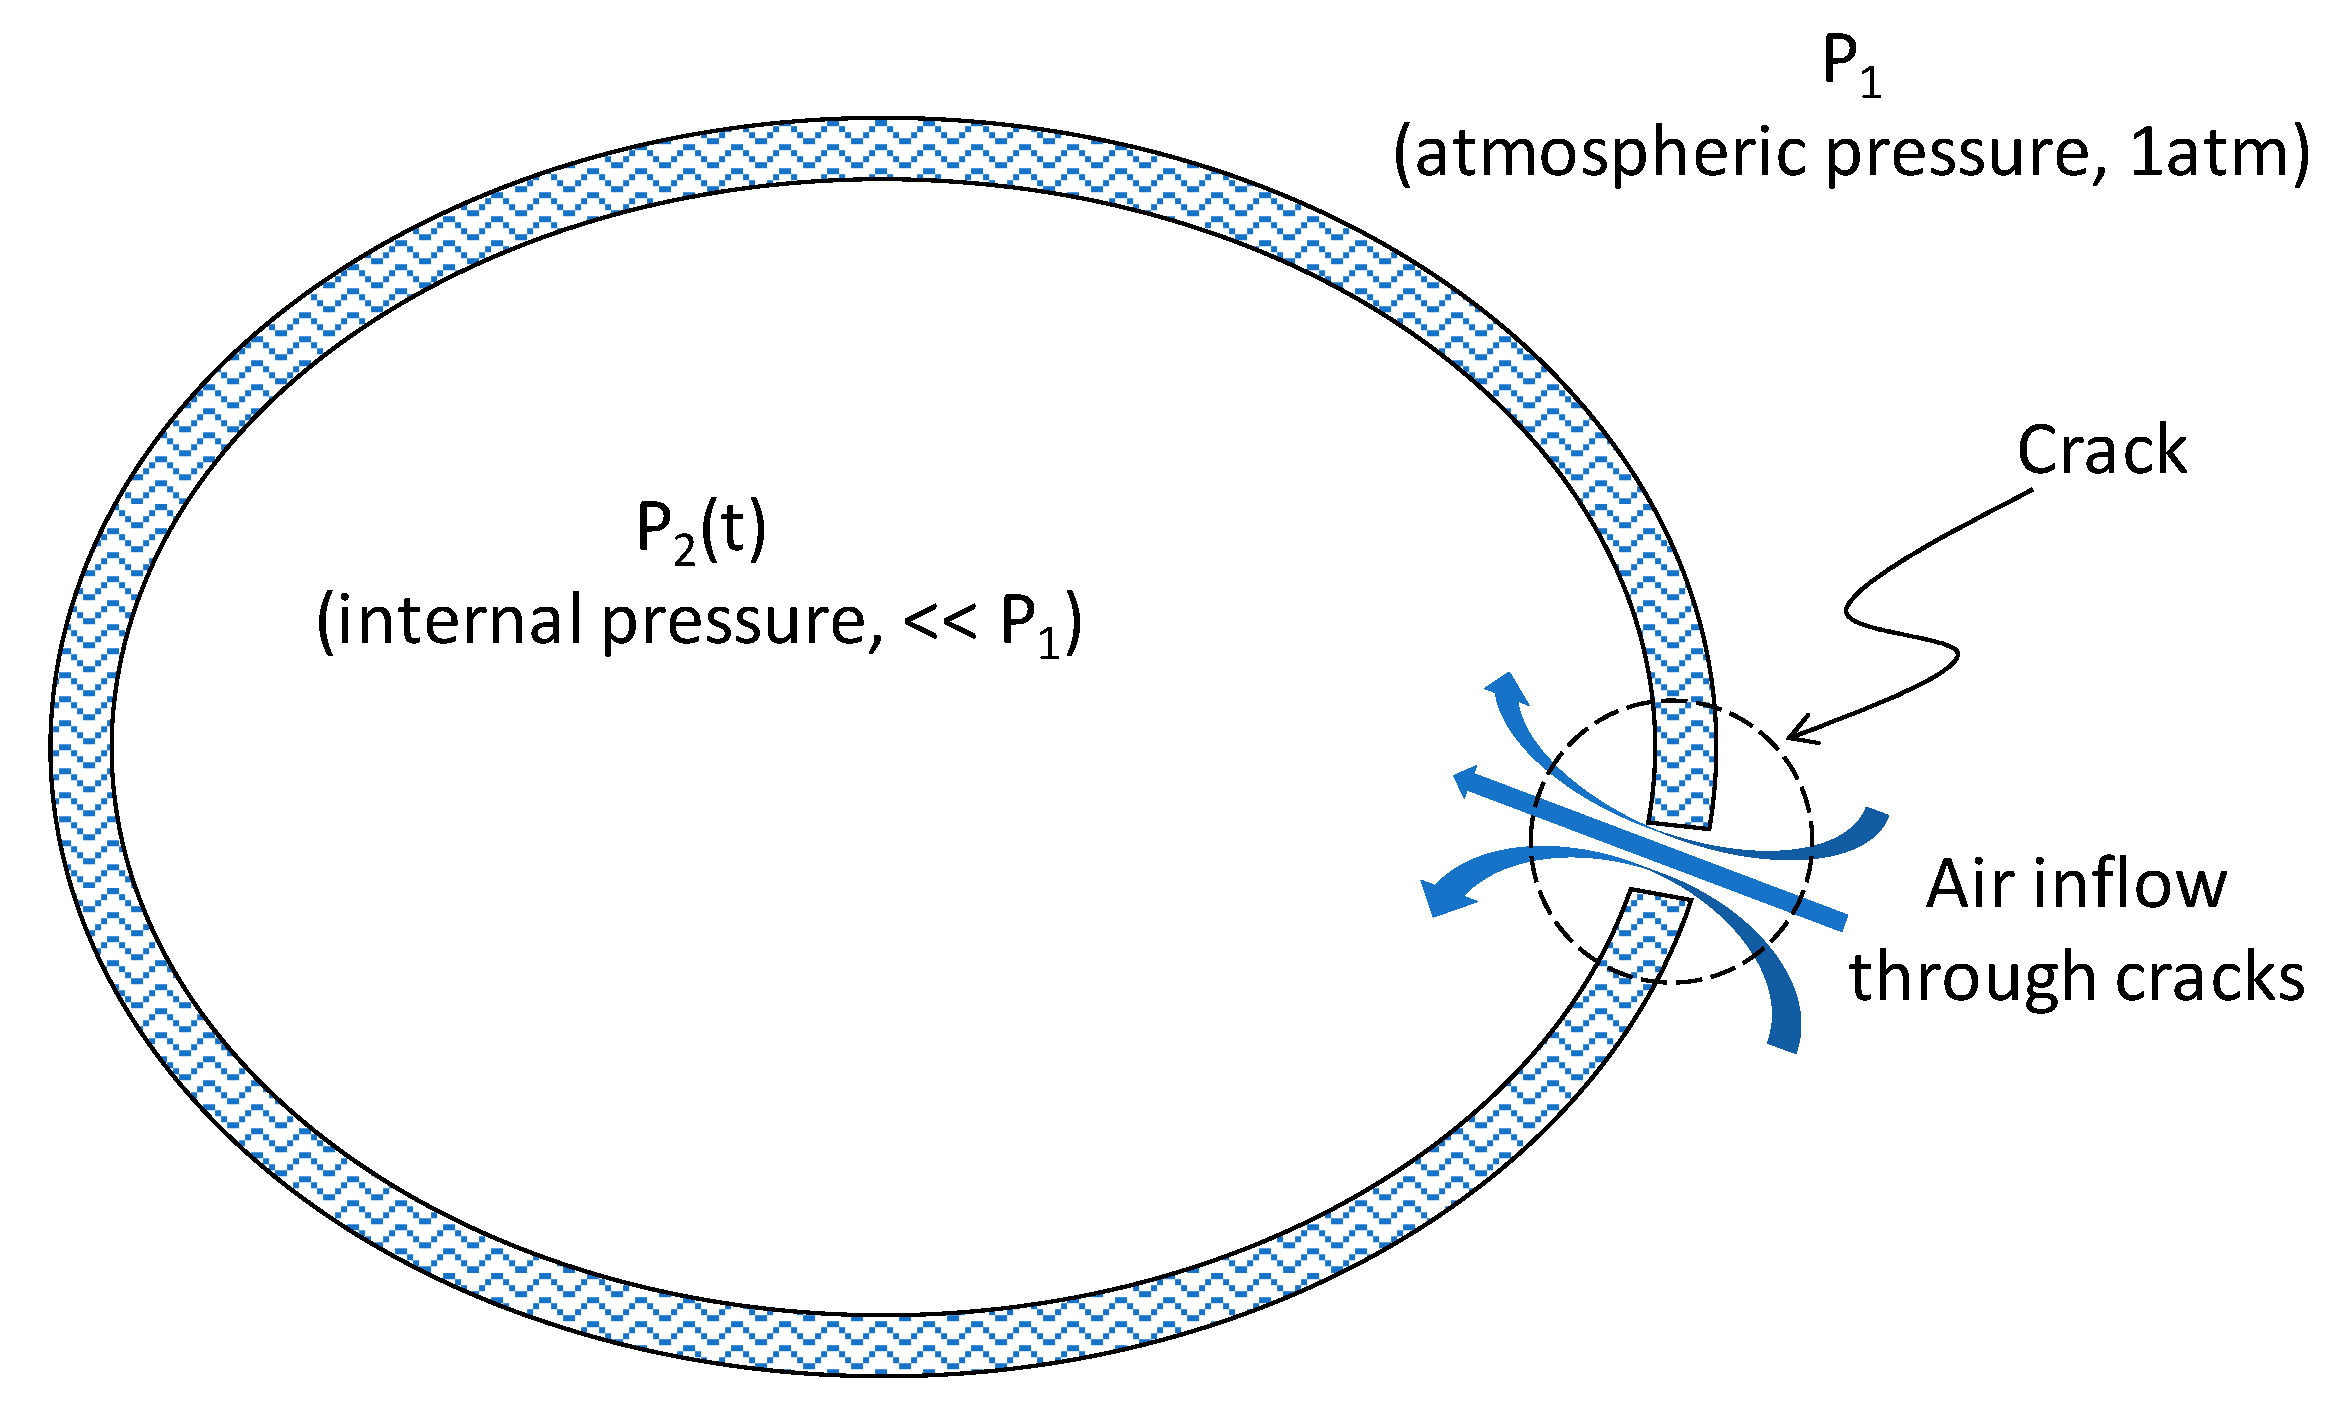
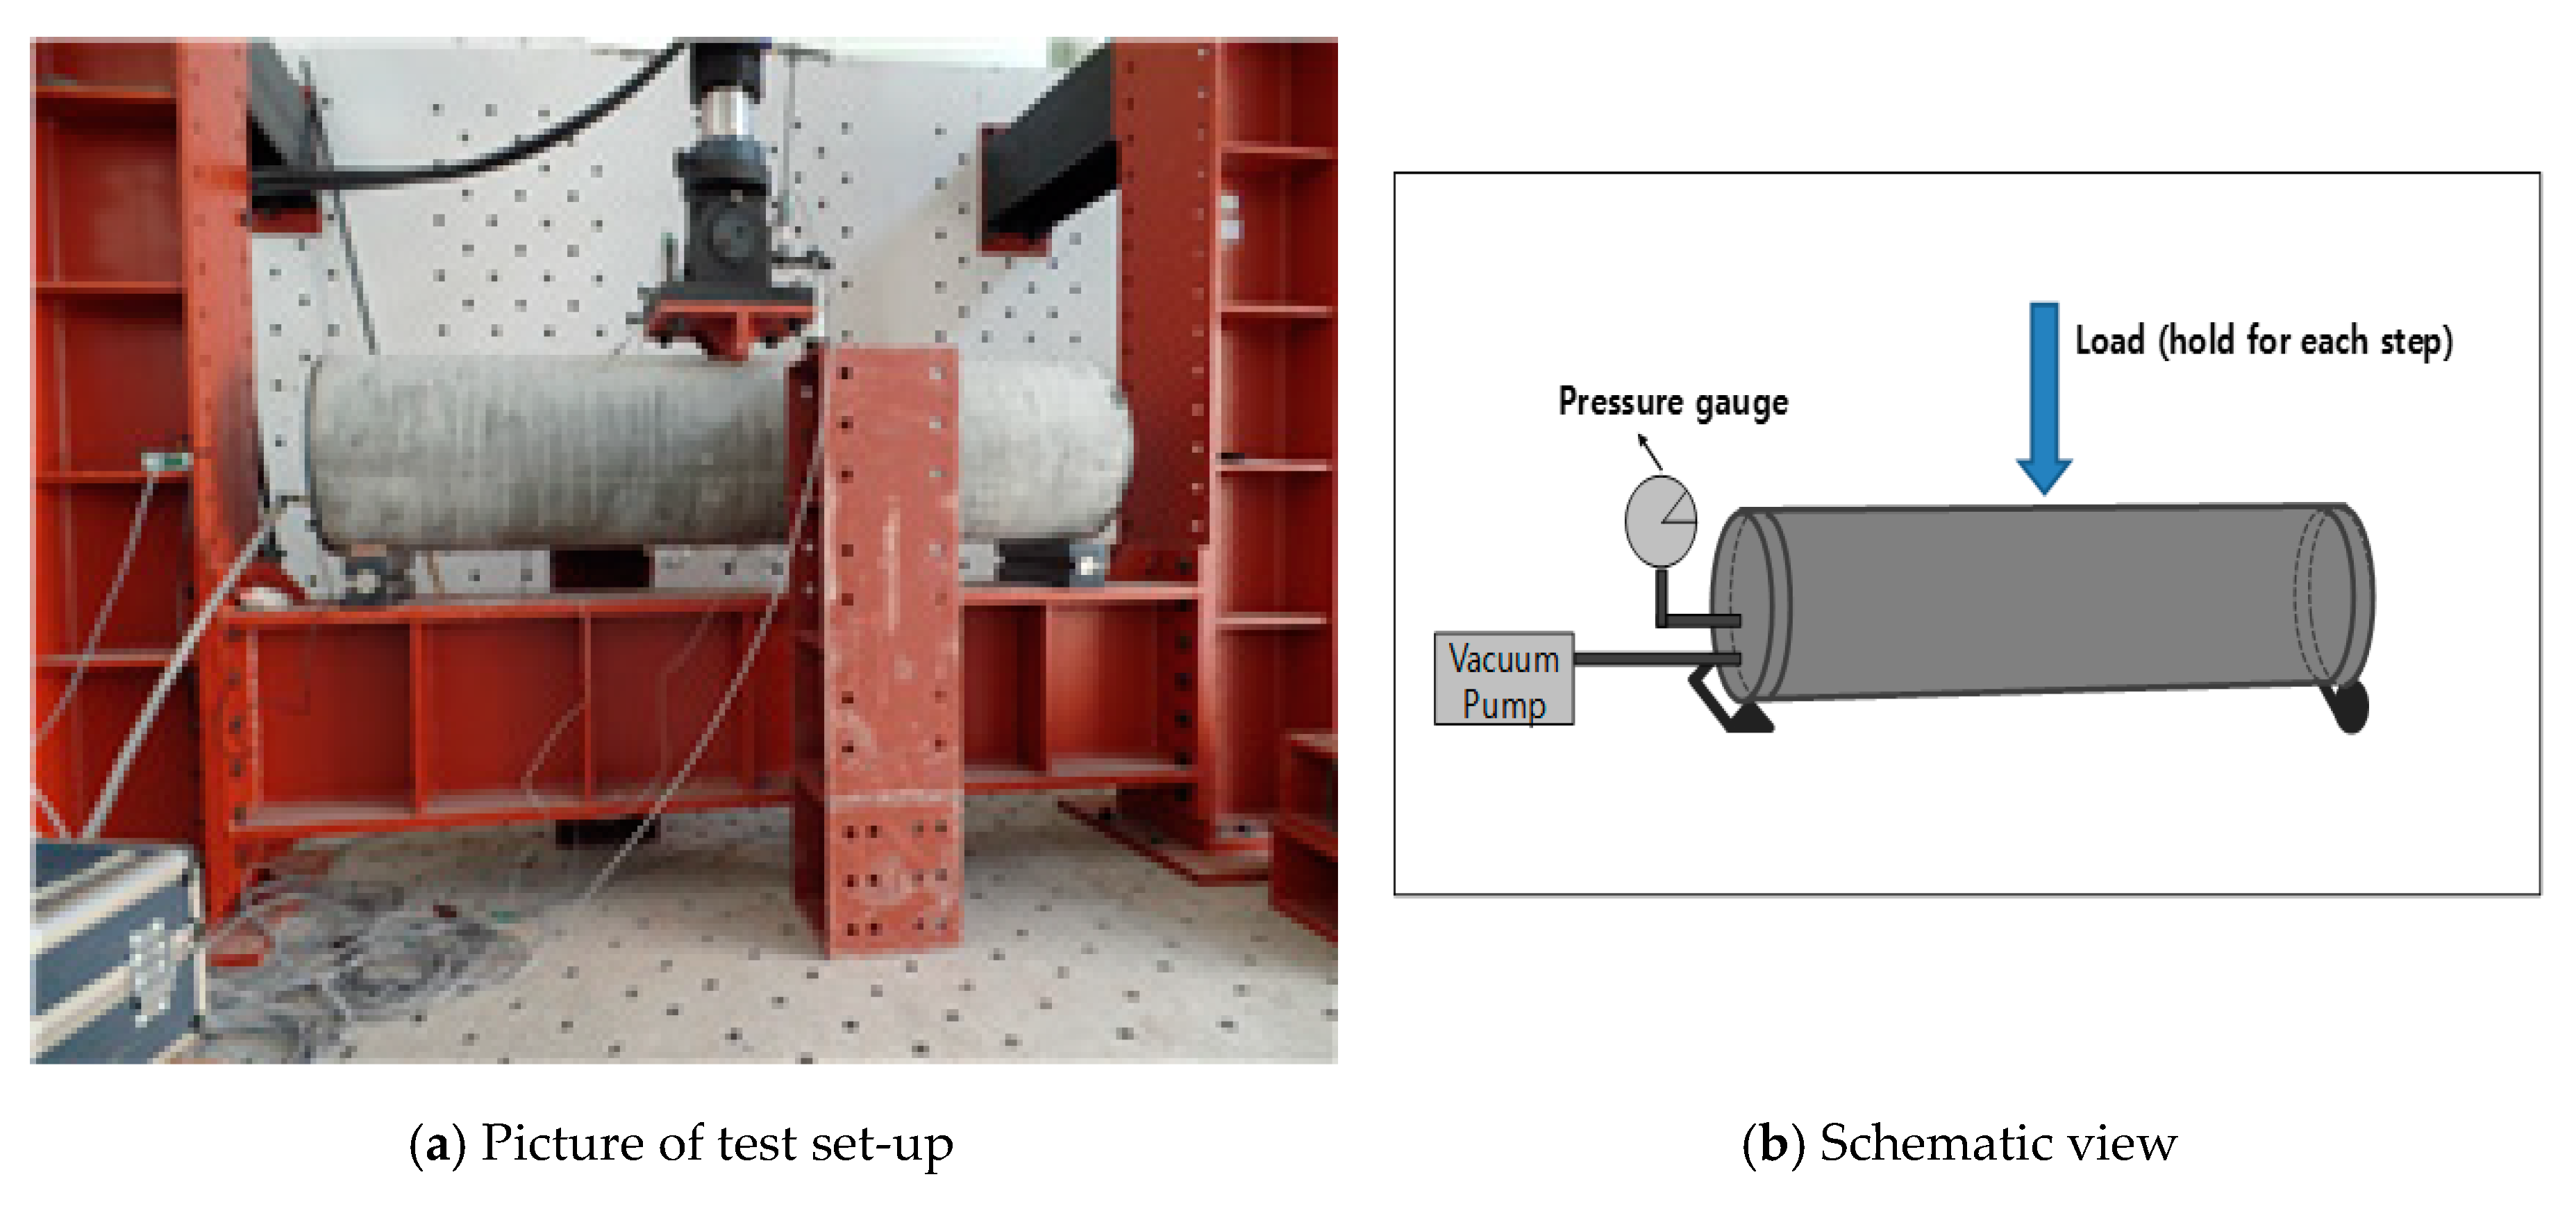
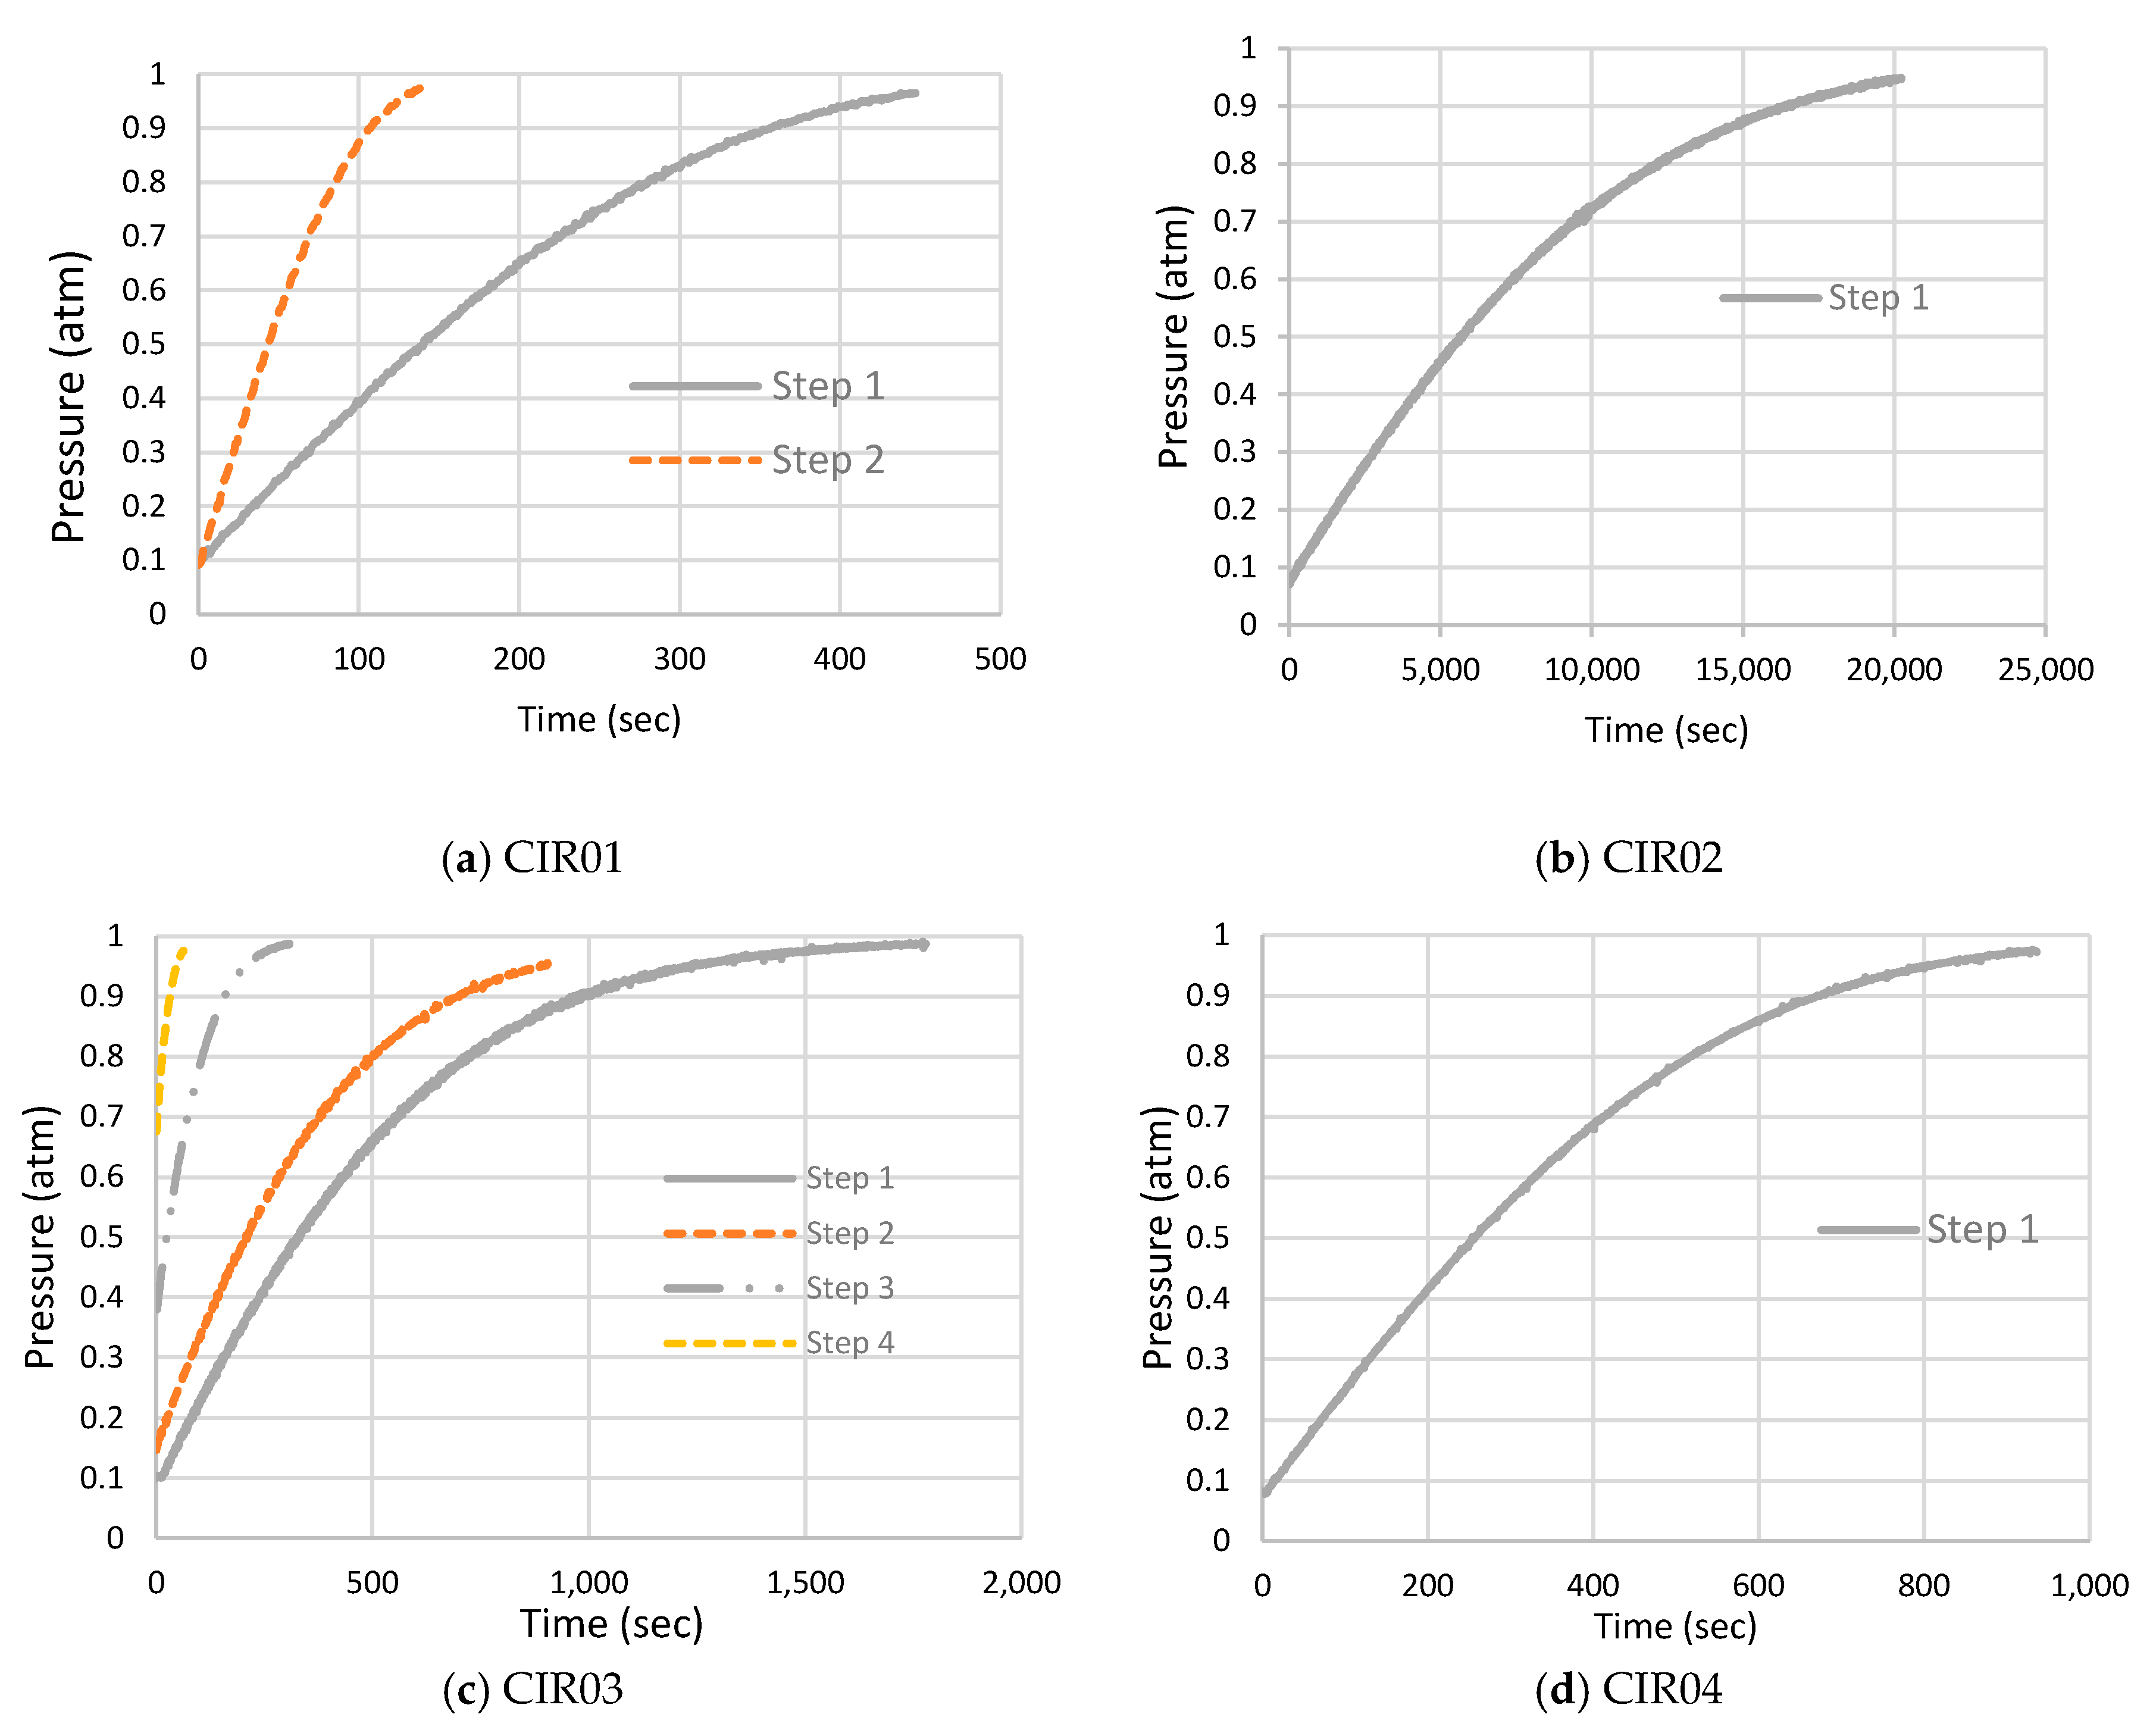
5. Correlation between Cracks and Airtightness: Experimental Demonstration
6. Conclusions
Author Contributions
Funding
Conflicts of Interest
References
- Cassat, A.; Bourquin, V.; Mossi, M.; Badoux, M.; Vernez, D.; Jufer, M.; Macabrey, N.; Rossel, P. SWISSMETRO—0Project Development Status. In Proceedings of the International Symposium on Speed-up Service Technology for Railway and Maglev Systems (STECH’03), Tokyo, Japan, 19–22 August 2003; pp. 453–460. [Google Scholar]
- Park, J.; Kim, L.H.; Nam, S.W.; Yeo, I. Performance evaluation of airtightness in concrete tube structures for super-speed train systems. Mag. Concr. Res. 2013, 65, 535–545. [Google Scholar] [CrossRef]
- Park, C.H.; Cheon, D.S.; Park, J. Analytical model of fluid flow through closed structures for vacuum tube systems. Math. Probl. Eng. 2015, 2015, 210727. [Google Scholar] [CrossRef]
- Park, C.H.; Synn, J.H.; Park, J. Probabilistic performance assessment of airtightness in concrete tube structures. KSCE J. Civ. Eng. 2016, 20, 1443–1451. [Google Scholar] [CrossRef]
- Mehta, P.; Monteiro, P. Concrete: Microstructure, Properties, and Materials; McGraw-Hill: New York, NY, USA, 2005. [Google Scholar]
- KCI. Concrete Structure Standard; Ministry of Land, Transport and Maritime Affairs: Gyeonggi-do, Seoul, Korea, 2012.
- Park, J.; Cho, J.; Park, H.J. Probabilistic estimation of air-tightness of performance of concrete vacuum tube structures. In Proceedings of the 10th International Symposium on High Performance Concrete—Innovation & Utilization, Beijing, China, 16–18 September 2014. [Google Scholar]
- Soppe, T.E.; Hutchinson, T.C. Assessment of Gas Leakage Rates through Damaged Reinforced-Concrete Walls. J. Mater. Civ. Eng. 2012, 24, 560–567. [Google Scholar] [CrossRef]
- Rizkalla, S.H.; Lau, B.L.; Simmonds, S.H. Air leakage characteristics in reinforced concrete. J. Struct. Eng. 1984, 110, 1149–1162. [Google Scholar] [CrossRef]
- Suzuki, T.; Takiguchi, K.; Hotta, H. Leakage of gas through cracked concrete cracks. Nucl. Eng. Des. 1992, 133, 121–130. [Google Scholar] [CrossRef]
- Nagano, T.; Kowada, A.; Matumura, T.; Inada, Y.; Yajima, K. Experimental study of leakage through residual shear cracks on R/C walls. In Proceedings of the Structural Mechanics in Reactor Technology, Raleigh, NC, USA, 14–18 August 1989; pp. 139–144. [Google Scholar]
- Greiner, U.; Ramm, W. Air leakage characteristics in cracked concrete. Nucl. Eng. Des. 1995, 156, 167–172. [Google Scholar] [CrossRef]
- RPS Structure. Structural Requirements and Basic Design of Next Generation of Ultra-High Speed Transportation Tube System; Project Report; KICT: Ilsan, Korea, 2016. [Google Scholar]
- Ziari, A.; Kianoush, M.R. Investigation of flexural cracking and leakage in RC liquid containing structures. Eng. Struct. 2009, 31, 1056–1067. [Google Scholar] [CrossRef]
- Frosch, R.J. Another look at cracking and crack control in reinforced concrete. ACI Struct. J. 1999, 96, 437–442. [Google Scholar]


| Control Variable | Minimum Value | Maximum Value |
|---|---|---|
| B (m) | 0.1 | 0.7 |
| N | 1 | 10 |
| Wavg (m) | 0.0001 | 0.001 |
| Test Structure | Load Step | Displacement (mm) (Measured at Top of Tube Center) | Effective k (m2) |
|---|---|---|---|
| CIR-01 | Step 1 | 1.59 | 4.20 × |
| Step 2 | 2.38 | 1.50 × | |
| CIR-02 | Step 1 | 1.20 | 1.05 × |
| CIR-03 | Step 1 | 1.22 | 1.70 × |
| Step 2 | 1.62 | 2.34 × | |
| Step 3 | 1.88 | 8.20 × | |
| Step 4 | 2.22 | 2.60 × | |
| CIR-04 | Step 1 | 0.74 | 2.30 × |
© 2019 by the authors. Licensee MDPI, Basel, Switzerland. This article is an open access article distributed under the terms and conditions of the Creative Commons Attribution (CC BY) license (http://creativecommons.org/licenses/by/4.0/).
Share and Cite
Devkota, P.; Park, J. Analytical Model for Air Flow into Cracked Concrete Structures for Super-Speed Tube Transport Systems. Infrastructures 2019, 4, 76. https://doi.org/10.3390/infrastructures4040076
Devkota P, Park J. Analytical Model for Air Flow into Cracked Concrete Structures for Super-Speed Tube Transport Systems. Infrastructures. 2019; 4(4):76. https://doi.org/10.3390/infrastructures4040076
Chicago/Turabian StyleDevkota, Prakash, and Joonam Park. 2019. "Analytical Model for Air Flow into Cracked Concrete Structures for Super-Speed Tube Transport Systems" Infrastructures 4, no. 4: 76. https://doi.org/10.3390/infrastructures4040076
APA StyleDevkota, P., & Park, J. (2019). Analytical Model for Air Flow into Cracked Concrete Structures for Super-Speed Tube Transport Systems. Infrastructures, 4(4), 76. https://doi.org/10.3390/infrastructures4040076