Article

Machine Learning-Assisted Multi-Objective Optimization of Surface Pretreated Coal Gangue Lightweight Shotcrete

1
Hunan Construction Engineering Group Co., Ltd., Changsha 410000, China
2
School of Information Engineering, Shenzhen Open University, Shenzhen 518000, China
3
China Construction Fifth Engineering Bureau Co., Ltd., Changsha 410000, China
4
School of Design and Built Environment, Curtin University, Perth, WA 6102, Australia
5
College of Aerospace and Civil Engineering, Harbin Engineering University, No. 145, South Tongda Street, Nangang District, Harbin 150001, China
6
Hunan Construction Investment Group Co., Ltd., Changsha 410004, China
*
Author to whom correspondence should be addressed.
Infrastructures 2026, 11(6), 184; https://doi.org/10.3390/infrastructures11060184
Submission received: 22 March 2026 / Revised: 9 May 2026 / Accepted: 15 May 2026 / Published: 25 May 2026

Abstract

The large-scale accumulation of coal gangue has created increasing environmental pressure, while its use as aggregate in cementitious materials remains limited by its high water absorption, porous structure and unstable mechanical performance. This study develops a machine learning-assisted multi-objective optimization framework for lightweight shotcrete incorporating surface-pretreated coal gangue aggregates and polyvinyl alcohol fibres. Two pretreatment methods—namely, silica-fume slurry coating (CGACM) and dry adsorption activation (CGACD)—were applied to improve the aggregate surface characteristics. Experimental data on compressive strength, splitting strength and density were used to train backpropagation neural networks and support vector machine and random forest models, with hyperparameters optimized by the Beetle Antennae Search algorithm. The trained models were then coupled with a multi-objective optimization procedure to balance mechanical performance, density, material cost and CO2 emissions. The results show that surface pretreatment can improve the performance of coal gangue lightweight shotcrete, while the proposed optimization framework can identify mixture designs with balanced strength, reduced density and improved economic and environmental performance. Compared with untreated or non-optimized mixtures, the optimized surface-pretreated mixtures achieved a more favorable trade-off among mechanical, cost and carbon-emission objectives. This study provides a data-driven approach for the sustainable design and practical utilization of coal gangue in lightweight shotcrete.

1. Introduction

The coal gangue (CG) deposition, which has already accumulated over 5 billion tonnes in China, deteriorates the environment, obstructs waste disposal and limits resource depletion [1,2,3]. Therefore, the substitution of CG for coarse aggregate in concrete formulation has been considered an effective method; studies about this have attracted great attention [4,5,6,7]. Recent studies have further extended coal gangue-related materials to broader underground resource and energy applications, including mine-derived geothermal energy systems and sustainable cemented rockfill/backfill materials [8,9]. Substantial research has shown positive results demonstrating that CG provides an effective alternative in shotcrete production with no compromise in mechanical properties [10,11,12]. From an environmental perspective, this substitution may reduce the demand for natural aggregate extraction and support low-carbon solid-waste utilization. Nevertheless, the total CO2 emissions of CG-based shotcrete are influenced not only by aggregate replacement but also by cement dosage, mixture proportion and surface pretreatment. This provides the motivation for incorporating CO2 emissions into the multi-objective mixture optimization in this study. However, the incorporation of lightweight CG shotcrete (LCGS) with CG aggregates (CGA) presents several limitations and challenges, despite increased simplicity, affordability and feasibility benefits. CG porous structures and inferior mechanical properties result in the inefficiencies of CGA concrete such as high-water absorption, easy weathering and organic residues [13]. Thereby, intensive explorations into various process techniques and mix design optimisation are necessary to enhance CG-based shotcrete performance and application.
Meanwhile, transportation infrastructure is increasingly built in extreme environments—high-altitude permafrost zones, seasonally frozen regions, and cold climates—where materials must withstand persistent low temperatures and cyclic freeze–thaw actions. Conventional concrete often deteriorates under these conditions, requiring costly maintenance. Recent studies on chloride-induced corrosion and advanced cementitious composite systems have further highlighted the importance of performance-based material design for infrastructure exposed to complex environmental actions [14,15]. Therefore, utilizing industrial wastes like CG to develop durable, frost-resistant concrete offers both environmental and economic benefits for such infrastructure [16]. The inherent high water absorption of untreated CGA poses an exacerbated risk under freeze–thaw cycles, as increased saturation accelerates internal cracking and surface spalling [17,18]. Moreover, the long-term environmental behavior of CG-based composites in extreme climates remains poorly understood; freeze–thaw alternation may potentially enhance the release of trace elements, raising concerns for ecological safety in sensitive regions [19,20,21]. Therefore, tailoring CG-based shotcrete to resist freeze–thaw deterioration and maintain environmental compatibility is imperative for its viable deployment in transportation infrastructure subjected to harsh climatic conditions.
Among the literature [22,23,24], enhanced granularity and augmented pozzolanic reactivity facilitate the restoration and optimisation of CG concrete’s mechanical properties. Cheng et al. [25] demonstrated that SiO2 activated the Al2O3 present in coal gangue to generate a gel-like substance, optimising the compressive strength up to 50.06 Mpa. Han et al. [26] verified that the alkali-activated CG cementitious material with a sodium silicate activator achieved a compressive strength superior to 40 MPa when the CG content threshold fell below 30%. Li et al. [27] employed an 800 °C integrated thermal–chemical activation treatment that yielded 35.9 MPa compressive strength for eco-cement containing 56% CG. Besides, the fines-infilled methodology to improve weak layers has been widely applied to enhance recycled aggregates with reinforced interfacial transition zones (ITZ) [28,29]. This strategy is also supported by international studies on recycled aggregate concrete, where aggregate surface quality and ITZ densification are regarded as key factors controlling mechanical and durability performance. Surface treatment methods such as mechanical treatment, slurry coating and silica-fume modification have been shown to improve aggregate–matrix bonding. However, coal gangue aggregates differ from conventional recycled aggregates in mineral composition and pore characteristics, which requires specific validation for lightweight shotcrete [30,31,32]. Chen et al. [33] found that CGA encapsulated with fly ash produces aggregates with elastic modulus above 60 GPa, which implies that the slurry around the CGA presents considerably superior mechanical strength to the natural aggregate ITZ. Silica fume (SF) and metakaolin in particular have been regarded as highly active supplementary materials, surpassing fly ash and coal gangue [34,35,36]. SF and SiO2 form a large number of dense C-S-H in the cement hydration process, resulting in porosity decline and ITZ improvement [37]. Similar ITZ enhancement by silica fume has also been reported in CGA concrete, further supporting the use of silica-fume-based surface activation in this study [38]. Additionally, Qiu et al. [39] verified that PP fibre with the optimum content of 0.6 kg/m3 effectively reduced the most probable pore diameter and transformed harmful pores into harmless ones. In the previous study [40], the concrete compressive strength of CGA coated with SF manually (CGACM) and dryer (CGACD) increased by 49% and 44% over the inactivated series and by 43% and 36% for split strength, respectively. However, such studies failed to analyse and optimise the mix-ratio design in depth, hence the necessity for further research in these directions.
With the increasing complexity of cementitious composites, machine learning has been widely used to predict concrete properties and support mixture design [41,42]. Among commonly used models, support vector regression (SVR) has been applied to strength and durability prediction because of its robustness in small-sample and nonlinear regression problems [43,44,45,46,47]. Backpropagation neural networks (BPNN) are capable of capturing complex nonlinear relationships between mixture parameters and mechanical properties, and have been used for various fibre-reinforced and recycled aggregate concretes [48]. Random forest (RF), as an ensemble learning method, can reduce prediction variance and improve robustness when input variables are heterogeneous [49,50]. These models provide useful tools for predicting the performance of coal gangue-based shotcrete, where mixture proportions, aggregate characteristics and pretreatment methods jointly affect mechanical behaviour. Model performance is strongly affected by hyperparameter selection, especially for SVR and neural network-based models. Metaheuristic algorithms such as Genetic Algorithms (GA) [51], Particle Swarm Optimization (PSO) [52,53,54] and Firefly Algorithms (FA) [55] have been used to tune model parameters in concrete property prediction. Compared with these algorithms, BAS has a relatively simple search mechanism, fewer control parameters and lower computational cost, making it suitable for repeated hyperparameter optimization on limited experimental datasets. Therefore, BAS was adopted in this study to optimize the hyperparameters of BP, SVM and RF models.
Although the above models have been successfully applied to conventional concrete, recycled aggregate concrete and fibre-reinforced cementitious composites, their application to coal gangue lightweight shotcrete remains limited [56]. In particular, few studies have considered the combined influence of surface pretreatment, aggregate particle size, coal gangue replacement level and PVA fibre content on compressive strength, splitting strength and density. This limitation motivates the development of a BAS-optimized multi-model prediction framework in this study. Recent studies have further integrated machine learning with metaheuristic algorithms for concrete mixture optimization, enabling the simultaneous consideration of conflicting objectives such as strength, cost and environmental impact. However, the combined optimization of surface-pretreated coal gangue lightweight shotcrete with mechanical, economic and environmental objectives remains insufficiently investigated [57].
In addition to property prediction, multi-objective optimization has become an important tool for concrete mixture design, where strength, workability, density, cost and environmental impact often conflict with each other [58,59,60]. Previous studies have combined machine-learning surrogate models with metaheuristic algorithms, such as PSO, GA and NSGA-II, to obtain Pareto-optimal concrete mixtures [61]. NSGA-II has been widely used because of its non-dominated sorting and diversity-preserving mechanisms, while BAS-based multi-objective optimization has attracted attention due to its simpler parameter setting and relatively low computational cost [62,63]. For a limited experimental dataset such as that used in this study, MOBAS provides a practical way to search for balanced mixture designs without excessive computational burden. Since Pareto optimization usually produces multiple non-dominated solutions, TOPSIS was further introduced as a decision-making method to select the mixture proportion closest to the ideal solution and farthest from the negative ideal solution.
Based on the above review, three research gaps can be identified. First, although CG has been investigated in concrete and shotcrete, the performance optimization of surface-pretreated CGA in lightweight shotcrete remains limited. Second, mechanical properties, density, cost and CO2 emissions are often considered separately, while their coupled optimization is less addressed. Third, the integration of aggregate surface pretreatment, fibre reinforcement, machine learning prediction and multi-objective decision-making has not been sufficiently explored for CG lightweight shotcrete. To address these gaps, this study investigated lightweight shotcrete incorporating surface-pretreated CGA and PVA fibres. Experimental results for compressive strength, splitting strength and density were used to train BAS-optimized BP, SVM and RF models. Based on the prediction models, MOBAS and TOPSIS were employed to obtain balanced mixture designs considering mechanical performance, density, cost and CO2 emissions.

2. Dataset Construction for Model Training

This study developed a specialized dataset for machine learning model training and the multi-objective optimization of lightweight shotcrete performance in coal gangue through systematic experiments. The dataset provided a structured, high-quality foundation for subsequent algorithm modeling and decision optimization. Data were obtained from a well-designed full-factor experiment, with model inputs (features) covering three key process parameters [40,64]. The first category includes material proportion parameters: specific quantities of cement, standard sand, coal gangue aggregate, and PVA fibres per cubic meter. The second category involves aggregate characteristics: three particle sizes (100 μm, 200 μm, 500 μm) and their corresponding bulk replacement ratios (0.88, 1.32, 1.76) for natural sand. The third category covers surface pretreatment methods: a control group without treatment, CGACM using silica fume slurry for encapsulation activation, and CGACD with dry adsorption activation.
The model outputs comprised three key mechanical and physical properties: compressive strength (CS), splitting strength (SS) and density. The complete experimental program generated 756 raw test data from 28 mixtures, including one reference mixture and 27 LCGS mixtures. For each mixture, curing age and property, three replicate specimens were tested, and the average value was used as the reported result. Therefore, Appendix A presents only the averaged values, while the individual replicate data are not listed. The 81 values reported for the 27 LCGS formulations represent age-dependent averaged observations at 7, 14 and 28 days, rather than independent samples. These properties were measured at 7, 14 and 28 days for 27 independent LCGS mixture formulations. Thus, the 81 reported measurements should be regarded as age-dependent observations from 27 formulations, rather than as independent samples. For model development, only the 28-day CS, SS and density were used as prediction targets, because 28-day properties are standard reference indicators for concrete mixture evaluation and engineering design. The 7-day and 14-day results were retained for early-age performance analysis but were not used as independent training samples. To improve reproducibility, the workflow was clarified by specifying the pretreatment categories, fixed PVA fibre content, 28-day model targets, categorical encoding of pretreatment methods, training/testing split, cross-validation-based hyperparameter tuning and final model selection criteria based on testing R and RMSE.
This structured dataset serves a dual core function in the study. Firstly, it provides the foundation for training various machine learning models—including support vector regression, backpropagation neural networks, and random forest models—to establish surrogate prediction nonlinear mapping predictive models that correlate complex process parameters with final concrete performance. Secondly, the dataset explicitly defines the decision space and objective function space for multi-objective optimization, serving as the fundamental basis for applying the multi-objective BAS algorithm to balance material economic costs, carbon dioxide emissions, and multiple mechanical properties while identifying Pareto-optimized solutions. The dataset comprehensively and systematically captures key controllable factors affecting the performance of lightweight coal gangue concrete. Its scale and scientifically designed structure effectively support subsequent complex computational analyses, ensuring logical coherence from experimental validation to data-driven modeling and optimization.

3. Multi-Objective Optimisation Methodology

3.1. Objective Function: BAS Based Machine Learning Models

3.1.1. Candidate Machine Learning Surrogate Models

BP, SVR and RF were selected as representative predictive tools rather than as newly developed algorithms. BP was adopted to describe nonlinear interactions among mixture variables, SVR was used because of its suitability for small-sample regression, and RF was included for its ensemble-based stability when handling heterogeneous inputs. These methods do not represent physical constitutive models. Instead, they provide empirical mappings between material-related variables, such as cement dosage, CGA content, particle size and pretreatment category, and the measured LCGS properties. Therefore, their role in this study is to support performance estimation for subsequent mixture optimization, not to claim algorithmic novelty or replace material-level interpretation.
SVR has been a commonly implemented machine learning method for solving nonlinear regression problems. The core principle is to utilize kernel functions to establish a regression model on data projected into a high-dimensional feature space [56]. The training dataset is represented as ( x i ,   y i ) where x i is the input vector and y i is the correspondent objective value. The regression function of SVR is described as Equation (1).
f x = w · φ x + β
where w is the weight vector, φ x is the nonlinear mapping function and β is the bias term.
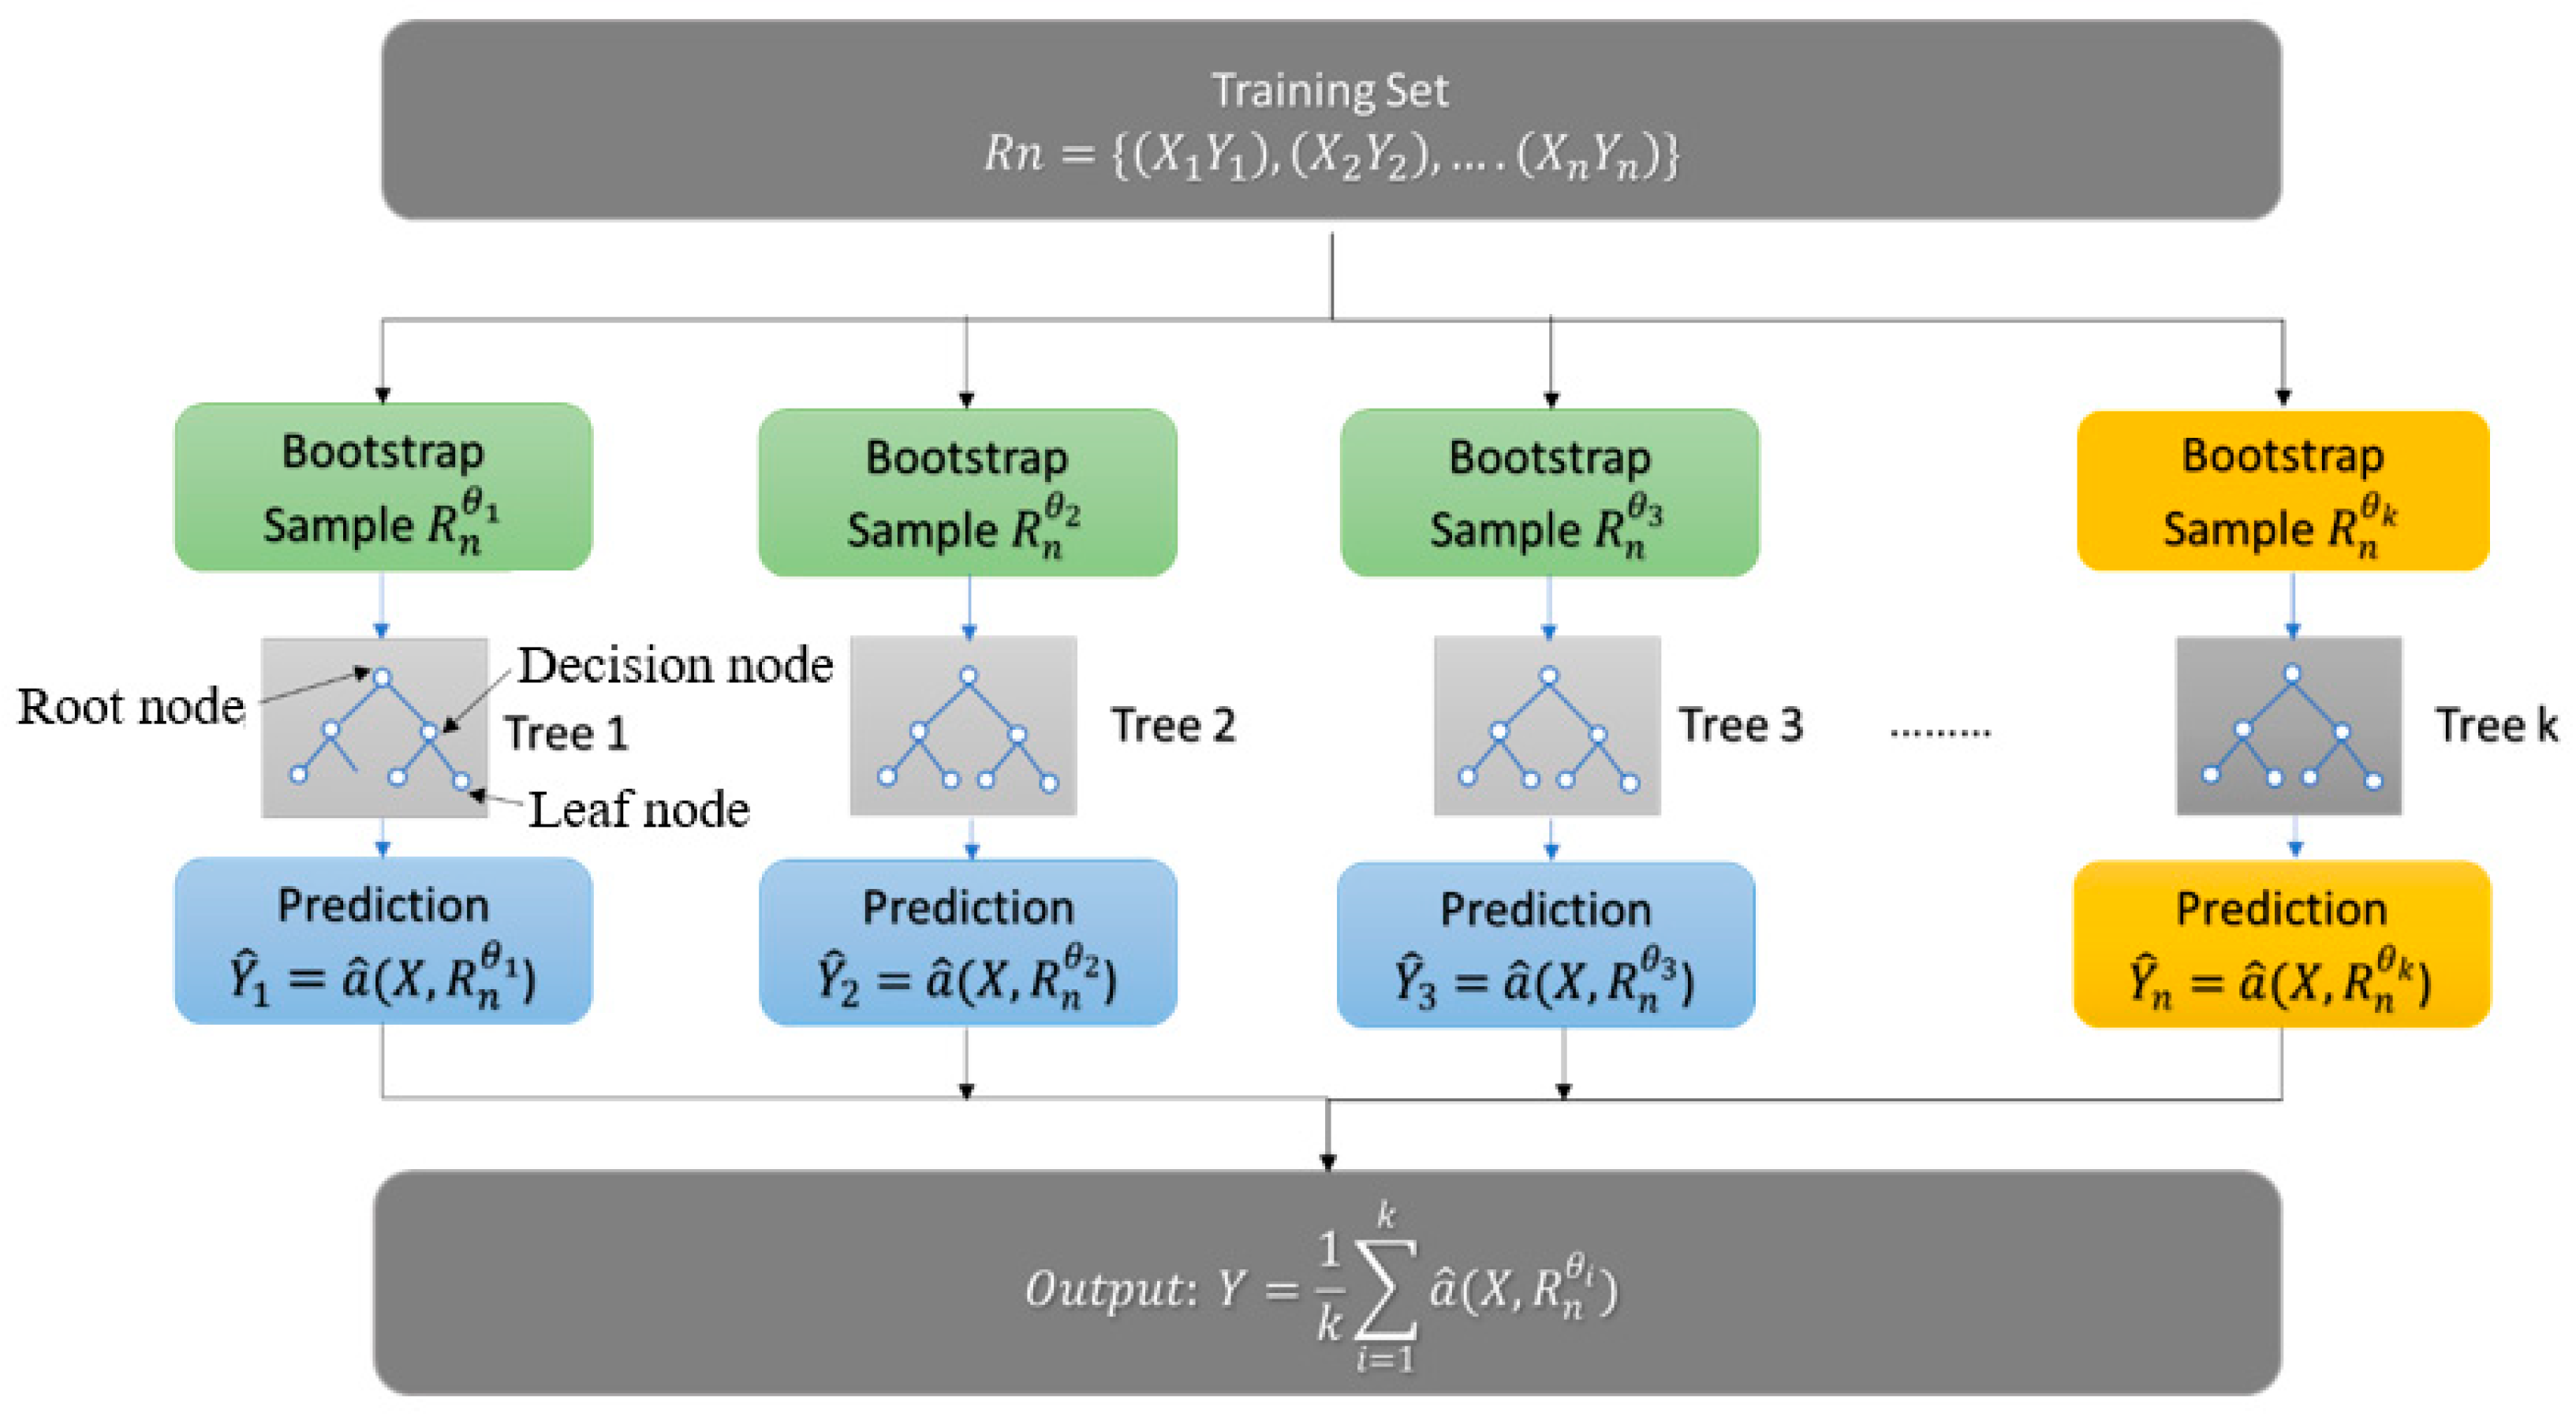
The RF algorithm constructs a massive number of decision trees (RTs) and synthesizes the prediction results of each tree with the mechanisms of “bagging” and “voting” to arrive at the final prediction [49]. The bagging method aims to significantly reduce the prediction error while simultaneously enhancing the overall prediction performance and accuracy [50]. Figure 1 visually illustrates the structure of the RF algorithm.
BP was used as a neural network-based regression model to capture nonlinear relationships between mixture parameters and LCGS properties. In the model development, the input variables included cement content, sand content, water content, CGA content, CGA particle size, PVA fibre content and pretreatment category, while the output variables were 28-day compressive strength, splitting strength and apparent density. BP, SVR and RF were trained using the same data partition and evaluation procedure to ensure a consistent comparison. Their prediction performance was evaluated using R and RMSE, and the best-performing model for each target property was selected as the surrogate model for subsequent multi-objective optimization.

3.1.2. Beetle Antennae Search

BAS is a metaheuristic algorithm proposed to automatically seek the optimal hyperparameters of the ML models. It is derived from the behaviour of the longhorn beetle [65]. The beetle can perceive the concentration of odour via its two antennae and move towards the orientation where the concentration is dominant. In the BAS algorithm, x l and x r indicate the position of left and right antennae, respectively. The superscript i means the i t h time instant. Therefore, the position of the antennae at the i t h time instant can be defined as Equation (2):
x l i = x i + d i b x r i = x i d i b
where b is a random vector demonstrating the random direction of the beetle. The vector b can be written as Equation (3) by introducing the r a n d and k functions, illustrating a random function and the dimension, respectively.
b = r a n d ( k , 1 ) r a n d ( k , 1 )
Equation (4) shows the position vector of the beetle where δ represents the step size and f x represents the fitness function. Besides, the antennae length and the step size can be updated as follows:
x i = x i 1 + δ i b s i g n ( f ( x r i ) f ( x l i ) )
d i = 0.95 d i 1 + 0.01
δ i = 0.95 δ i 1
BAS was selected because it has a simple search mechanism, fewer control parameters and relatively low computational cost, which is suitable for the repeated hyperparameter tuning of BP, SVM and RF models under limited-data conditions. MOBAS was further adopted because mixture design involves conflicting objectives, including strength, density, cost and CO2 emissions. Compared with established population-based algorithms such as NSGA-II, MOBAS requires fewer algorithm-specific parameters and introduces less additional tuning uncertainty in the present small-sample and low-dimensional design space. It should be noted that this study does not aim to demonstrate the general superiority of MOBAS over NSGA-II; rather, MOBAS was used as a practical lightweight optimizer to generate feasible Pareto solutions within the investigated mixture-design range. TOPSIS was then adopted to select a balanced solution from the Pareto front.

3.2. Hyperparameter Tuning

3.2.1. Cross Fold Validation

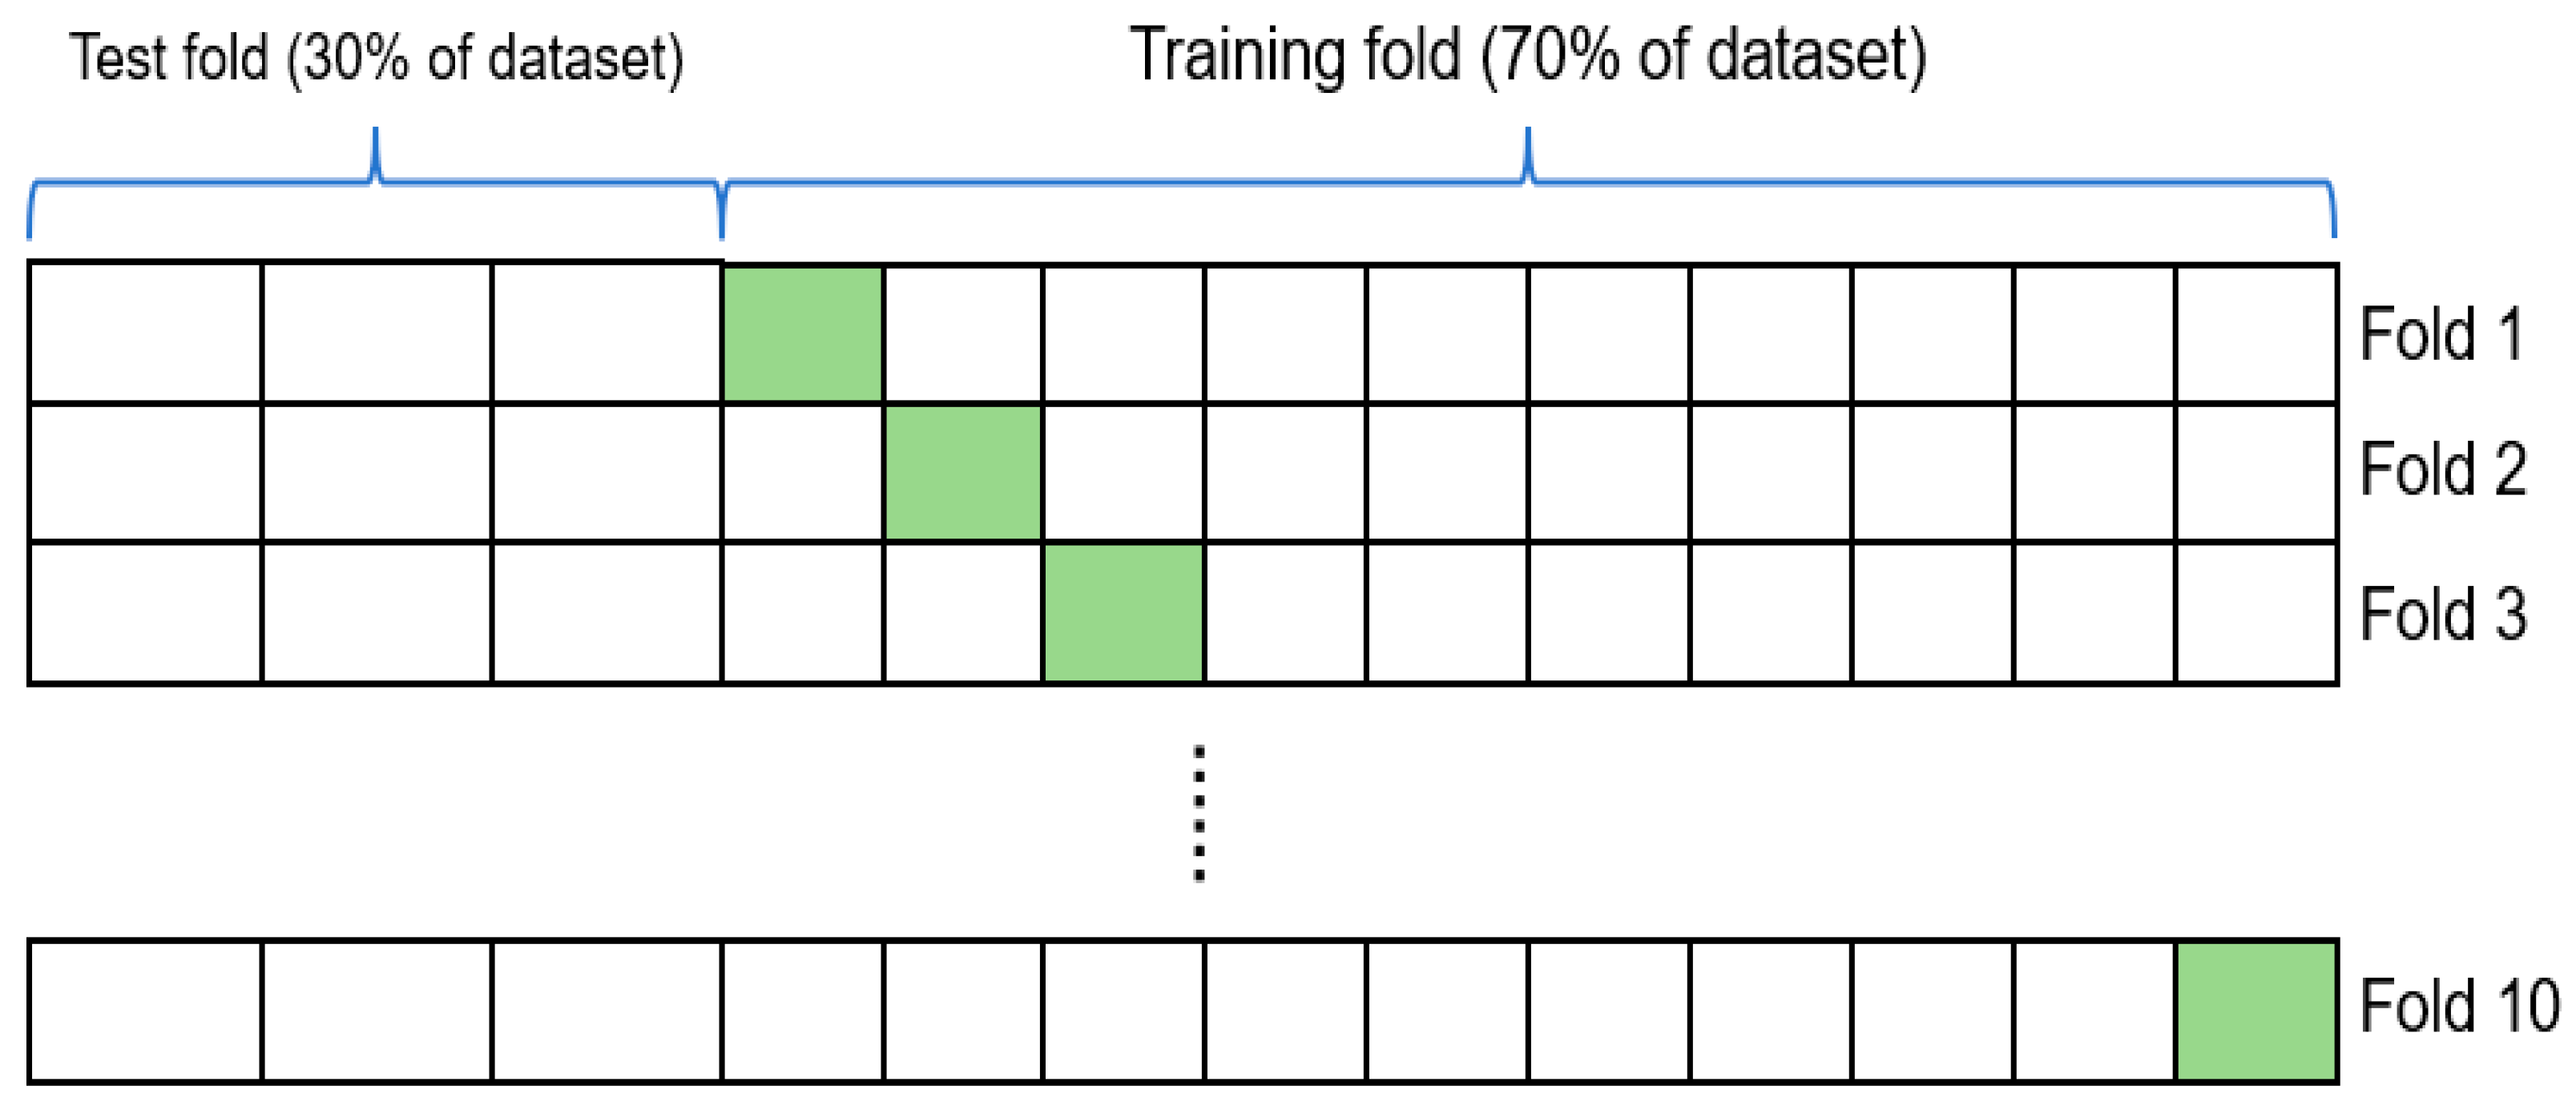
For the mechanical learning models, two basic hyperparameters needed to be adjusted: Gaussian kernel parameter gamma and penalty coefficient c . To overcome the overfitting problems, a 10-fold CV was applied. The dataset was randomly split into 30% for the test set and 70% for the training set [66]. Afterwards, the training set (70% of the total dataset) was further partitioned into 10 mutually exclusive folds, as illustrated in Figure 2. For each fold, nine of these subsets were used to train the model, while the remaining one subset served as the validation set for hyperparameter tuning using the BAS algorithm over 50 iterations. The remaining subset served as the validation fold to check the reliability of the trained model. The root means square error (RMSE) was acquired after validation. The cross-fold validation was repeated 10 times. Finally, the model with the minimum RMSE and optimal hyperparameters was applied to forecast the CS, SS and density of LCGS in this study.
Considering the limited number of independent mixture formulations, the machine-learning models were used as constrained surrogate models within the investigated experimental domain rather than as universal prediction models. BP, SVM and RF were adopted to capture possible nonlinear relationships among mixture proportion, aggregate particle size, surface pretreatment and LCGS properties. To reduce overfitting risk, 10-fold cross-validation was used during hyperparameter tuning, the testing subset was kept independent from model training and BAS-based optimization, and the final models were evaluated using both training and testing results. Therefore, the developed models are intended for prediction within the investigated mixture-design range rather than for unrestricted extrapolation.

3.2.2. Performance Evaluation

In this study, four accompanying evaluating indicators aimed to evaluate the precision of the SVR model: correlation coefficient (R), mean absolute percentage error (MAPE), mean absolute error (MAE), and root mean square error (RMSE). These indicators were calculated as follows [38]:
R = i = 1 n ( y i * y * ¯ ) ( y i y ¯ ) i = 1 n y i * y * ¯ 2 i = 1 n y i * y ¯ 2
M A P E = 1 n i = 1 n y i * y i y i
M A E = 1 n i = 1 n y i * y i
R S M E = 1 n i = 1 n ( y i * y i ) 2
where n is the n groups of data samples; y i * and y i are the predicted and actual results; and y * ¯ and y ¯ illustrate the mean values of the predicted and actual results.

3.3. Multi-Objective Optimization

3.3.1. Objective Function Establishment

The third objective function (cost) is computed by polynomials as follows:
C o s t $ / m 3 = C c Q c + C S Q S + C W Q W + C C G Q C G + C F Q F
In Equation (11), Q c , Q S , Q W , Q C G and Q F mean the quantity (kg/m3) of cement, sand, water, CGA and PVA fibre, respectively. Additionally, C means the unit price (kg/m3) of each raw material in LCGS, which have been presented in Table 1.
CO2 emissions were calculated using a simplified material-based cradle-to-gate method. The system boundary included the production-stage emissions of cement, standard sand, water, CGA and PVA fibre, while transportation, construction equipment, curing and end-of-life stages were excluded. The total CO2 emission of each mixture was calculated by multiplying the mass of each constituent by its corresponding emission factor and summing the contributions. Coal gangue was regarded as an industrial solid waste; therefore, the upstream burden of coal mining was not allocated to coal gangue aggregate. The additional carbon impact of the pretreatment process was not separately measured, except for the material contribution of silica fume when included in the mixture proportion. Thus, the CO2 results should be interpreted as comparative material-stage estimates rather than complete life-cycle carbon footprints.

3.3.2. Constraints

The MOO problem requires setting up the following constraints: range constraints of materials, concrete volume constraints, and ratio constraints.
  • Range constraints
The data range can be set according to the datasets of CS, SS and density for LCGS, as shown in Equation (12):
d i m i n d i d i m a x
where d i m i n and d i m a x represent the lowest and highest value of the variables.
  • Volume constraints
The amount of the solid should amount to one cubic meter, as follows:
V m = Q c U c + Q s U s + Q w U w + Q C G U C G + Q F U F
where U c , U S , U W , U C G , and U F are the unit weight of cement, sand, water, CGA, and fibre, individually.
  • Ratio constraints
To seek LCGS mixture optimisation, the ratio constraints need to be determined to establish the correlation between different raw materials. Table 2 lists the input factors which depend on the datasets framed.

3.3.3. Decision-Making for Multi-Objective Optimisation Designs

The MOO problem can generate a set of Pareto-optimal solutions; however, it does not directly provide a single final mixture proportion for practical decision-making. Therefore, TOPSIS was adopted to select the solution closest to the positive ideal point and farthest from the negative ideal point. In this study, equal weights were assigned to all objectives to avoid introducing subjective preference among mechanical, physical, economic and environmental indicators. Thus, the selected TOPSIS solution represents a balanced compromise under the equal-priority assumption rather than a project-specific optimum. Finally, a solution with the highest C i was considered to be the best one under the following formulations:
d i + = j = 1 n ( F i j F j i d e a l ) 2
d i = j = 1 n ( F i j F j n o n i d e a l ) 2
C i = d i d i + + d i
where d i + and d i are the positive and negative solutions; n and i are the numbers of objectives and the i t h Pareto point; F j i d e a l represents the ideal value of the j t h objective; and F j n o n i d e a l is the non-ideal value.

4. Results and Discussion

4.1. Machine Learning-Based Prediction Results

4.1.1. Results of Compressive Strength

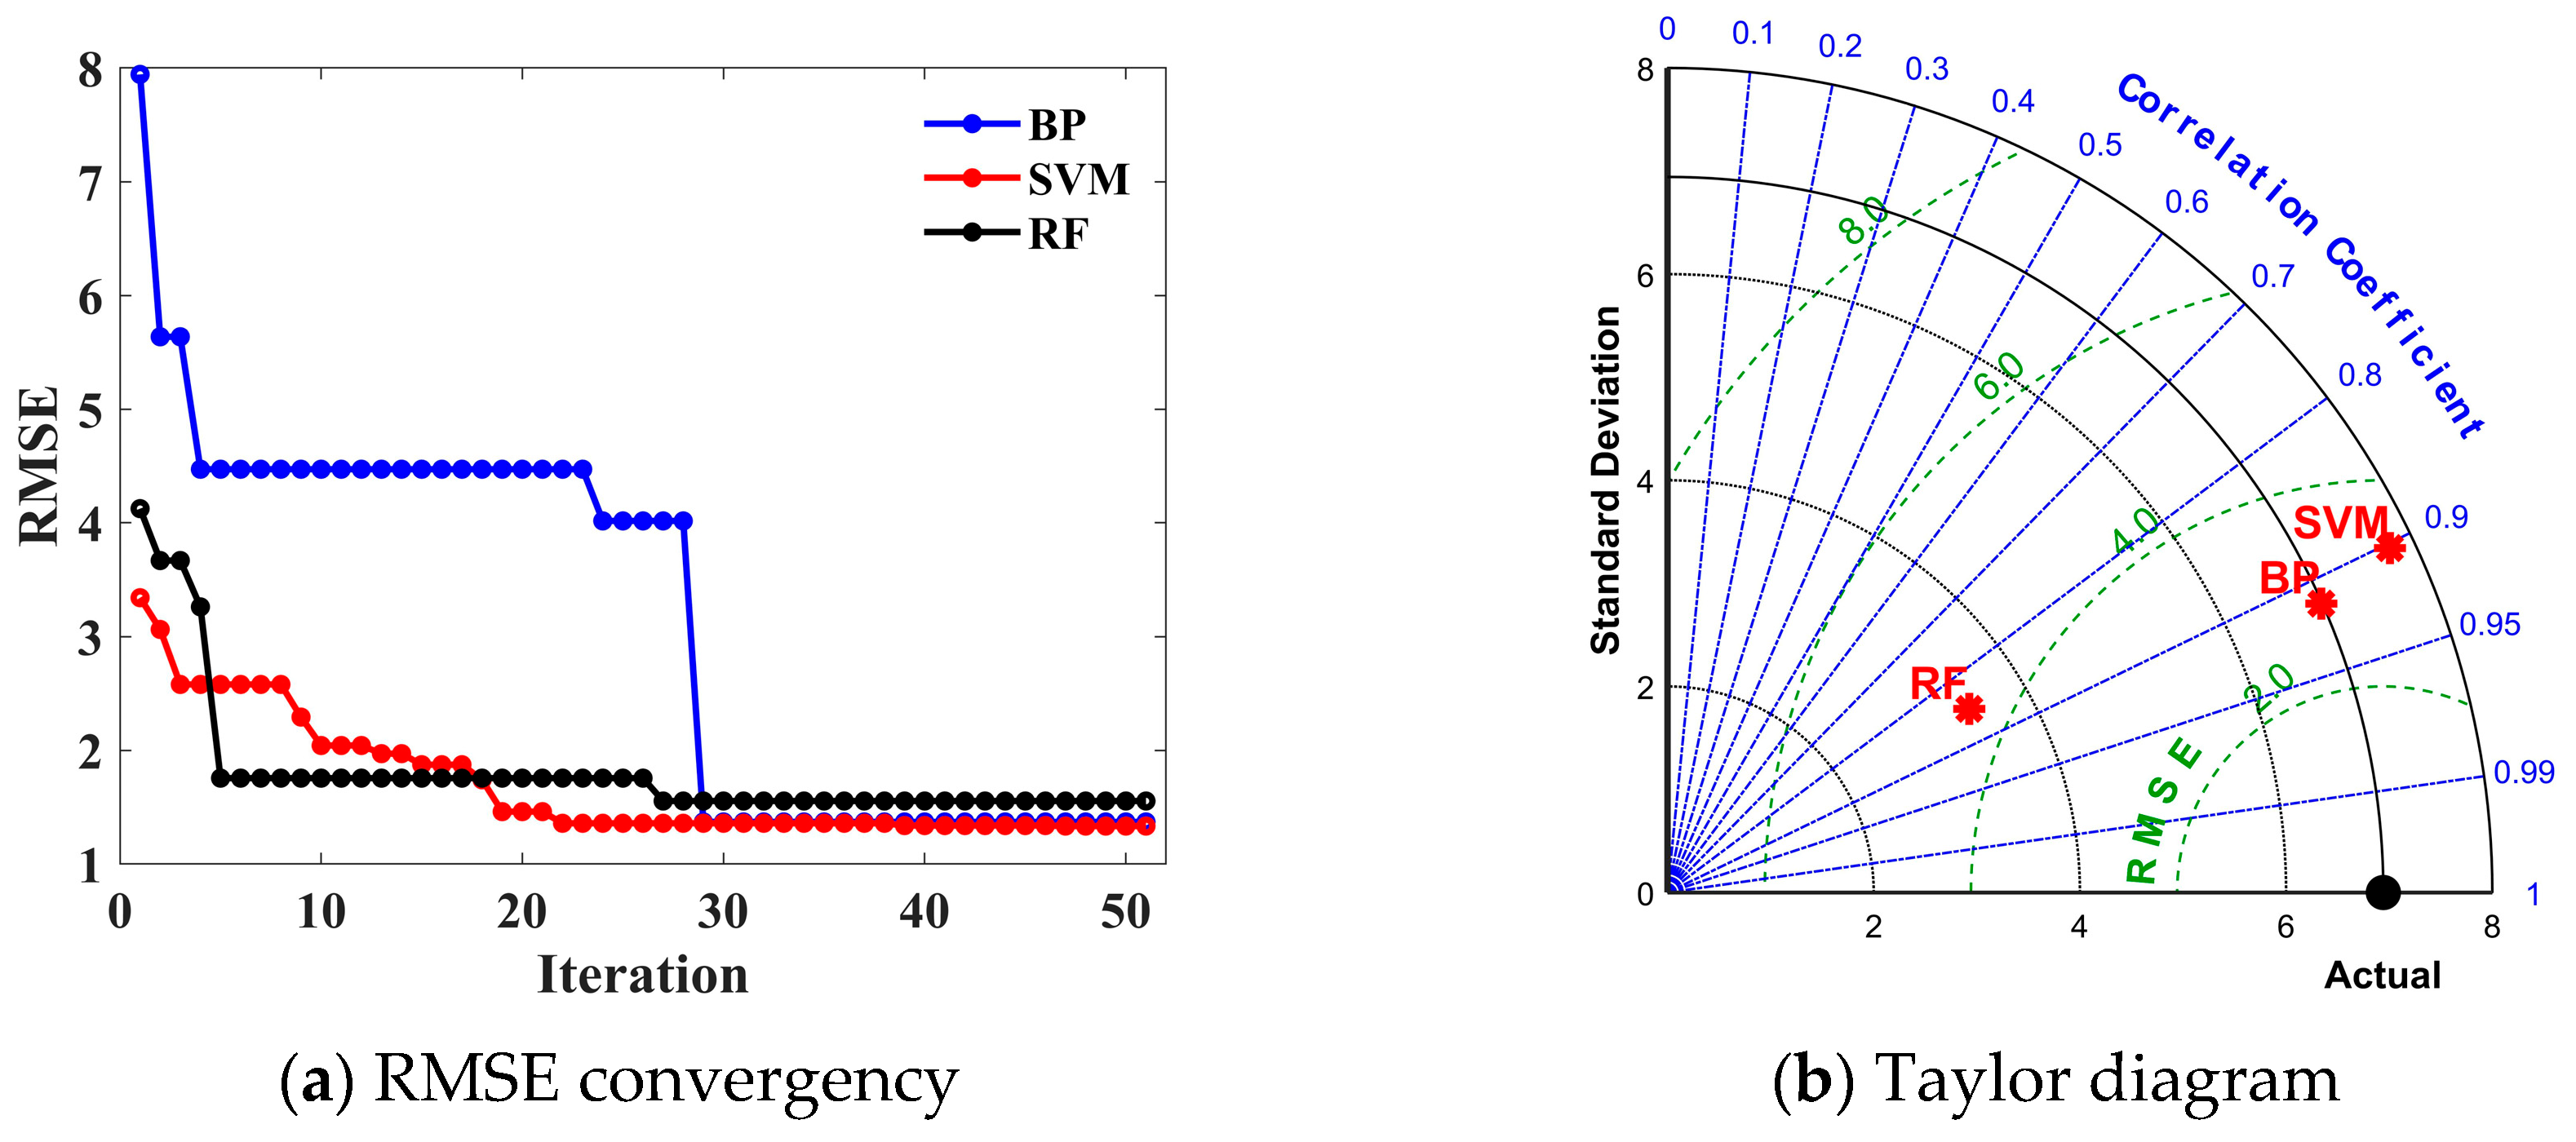
Figure 3 presents the error level of the model predictions, showing the prediction performance of the BP, SVM, and RF models. The BP model, shown in Figure 3a, exhibited the optimum performance and the swiftest convergence rate, with a rapidly decreasing RMSE value in the initial phase that stabilized after about 29 iterations, with a final RMSE of 2.812. With the BAS algorithm optimization, the recommended BP model employed 2 hidden layers with 24 and 5 neurons, and the learning rate was tuned to 3.5 × 10⁻⁵. The SVM model had 47 iterations, and the minimum error for the validation set of the SVM model was 1.779, with a final RMSE of 3.641 for the test set, which is slightly inferior to that of the BP model. After BAS optimization, the C value stood at 21,025.8266 and the gamma value stayed at 0.37484, which significantly improved the performance. The RF model with BAS optimization employed 21 trees (with an initial value of 40), and the lower limit of leaf nodes was 3 for each tree. Although the RF model achieved a validation set minimum error of 2.416 after 27 iterations, the final test set of RMSE was 4.305, which performed the worst. Figure 3b shows a Taylor diagram for the comprehensive assessment of the prediction performance of different models. The horizontal axis represents the standard deviation of the actual values, the vertical axis represents the standard deviation of the predicted values, the curved blue scale represents the correlation coefficient, and the green dashed line represents the RMSE. As shown in the diagram, the BP model has the highest correlation coefficient (above 0.9), with the standard deviation closest to the actual value, and the smallest RMSE, which indicates the optimal prediction performance.
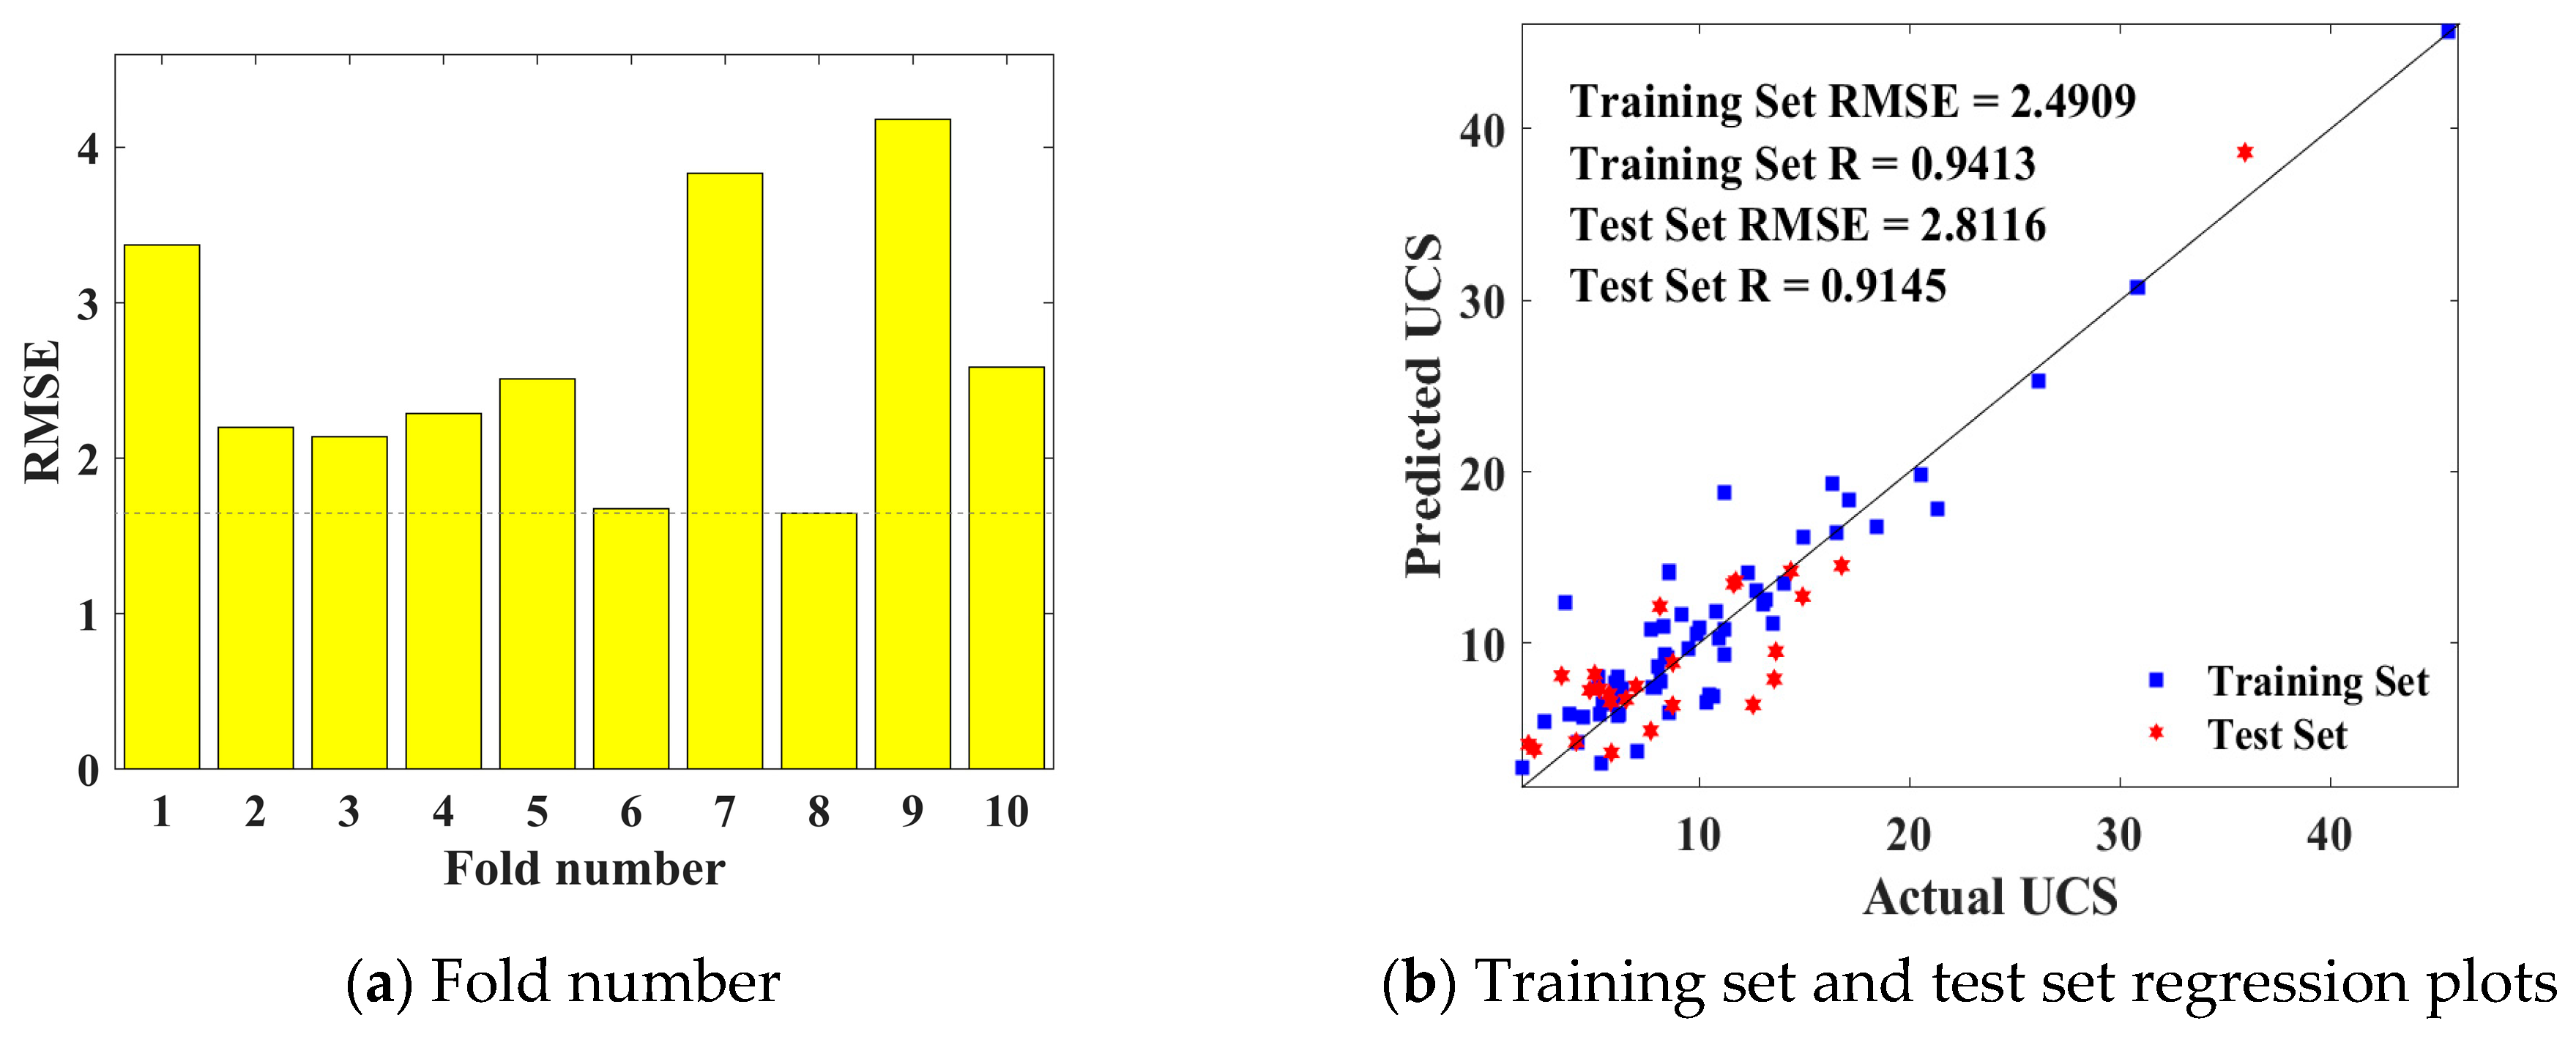
Figure 4a reveals the specific effect on BP model prediction with 10-fold cross-validation and BAS algorithm optimization. In the CS dataset, the 8th denotes the minimum RMSE. In Figure 4b, most of the points are close to the perfect fit curve (diagonal lines), illustrating the robustness of the model predictions. The correlation coefficients R of the training and test sets were up to 0.9413 and 0.9145, respectively, which demonstrates the BAS–BP model’s predictive ability with superior suitability.

4.1.2. Results of Splitting Strength

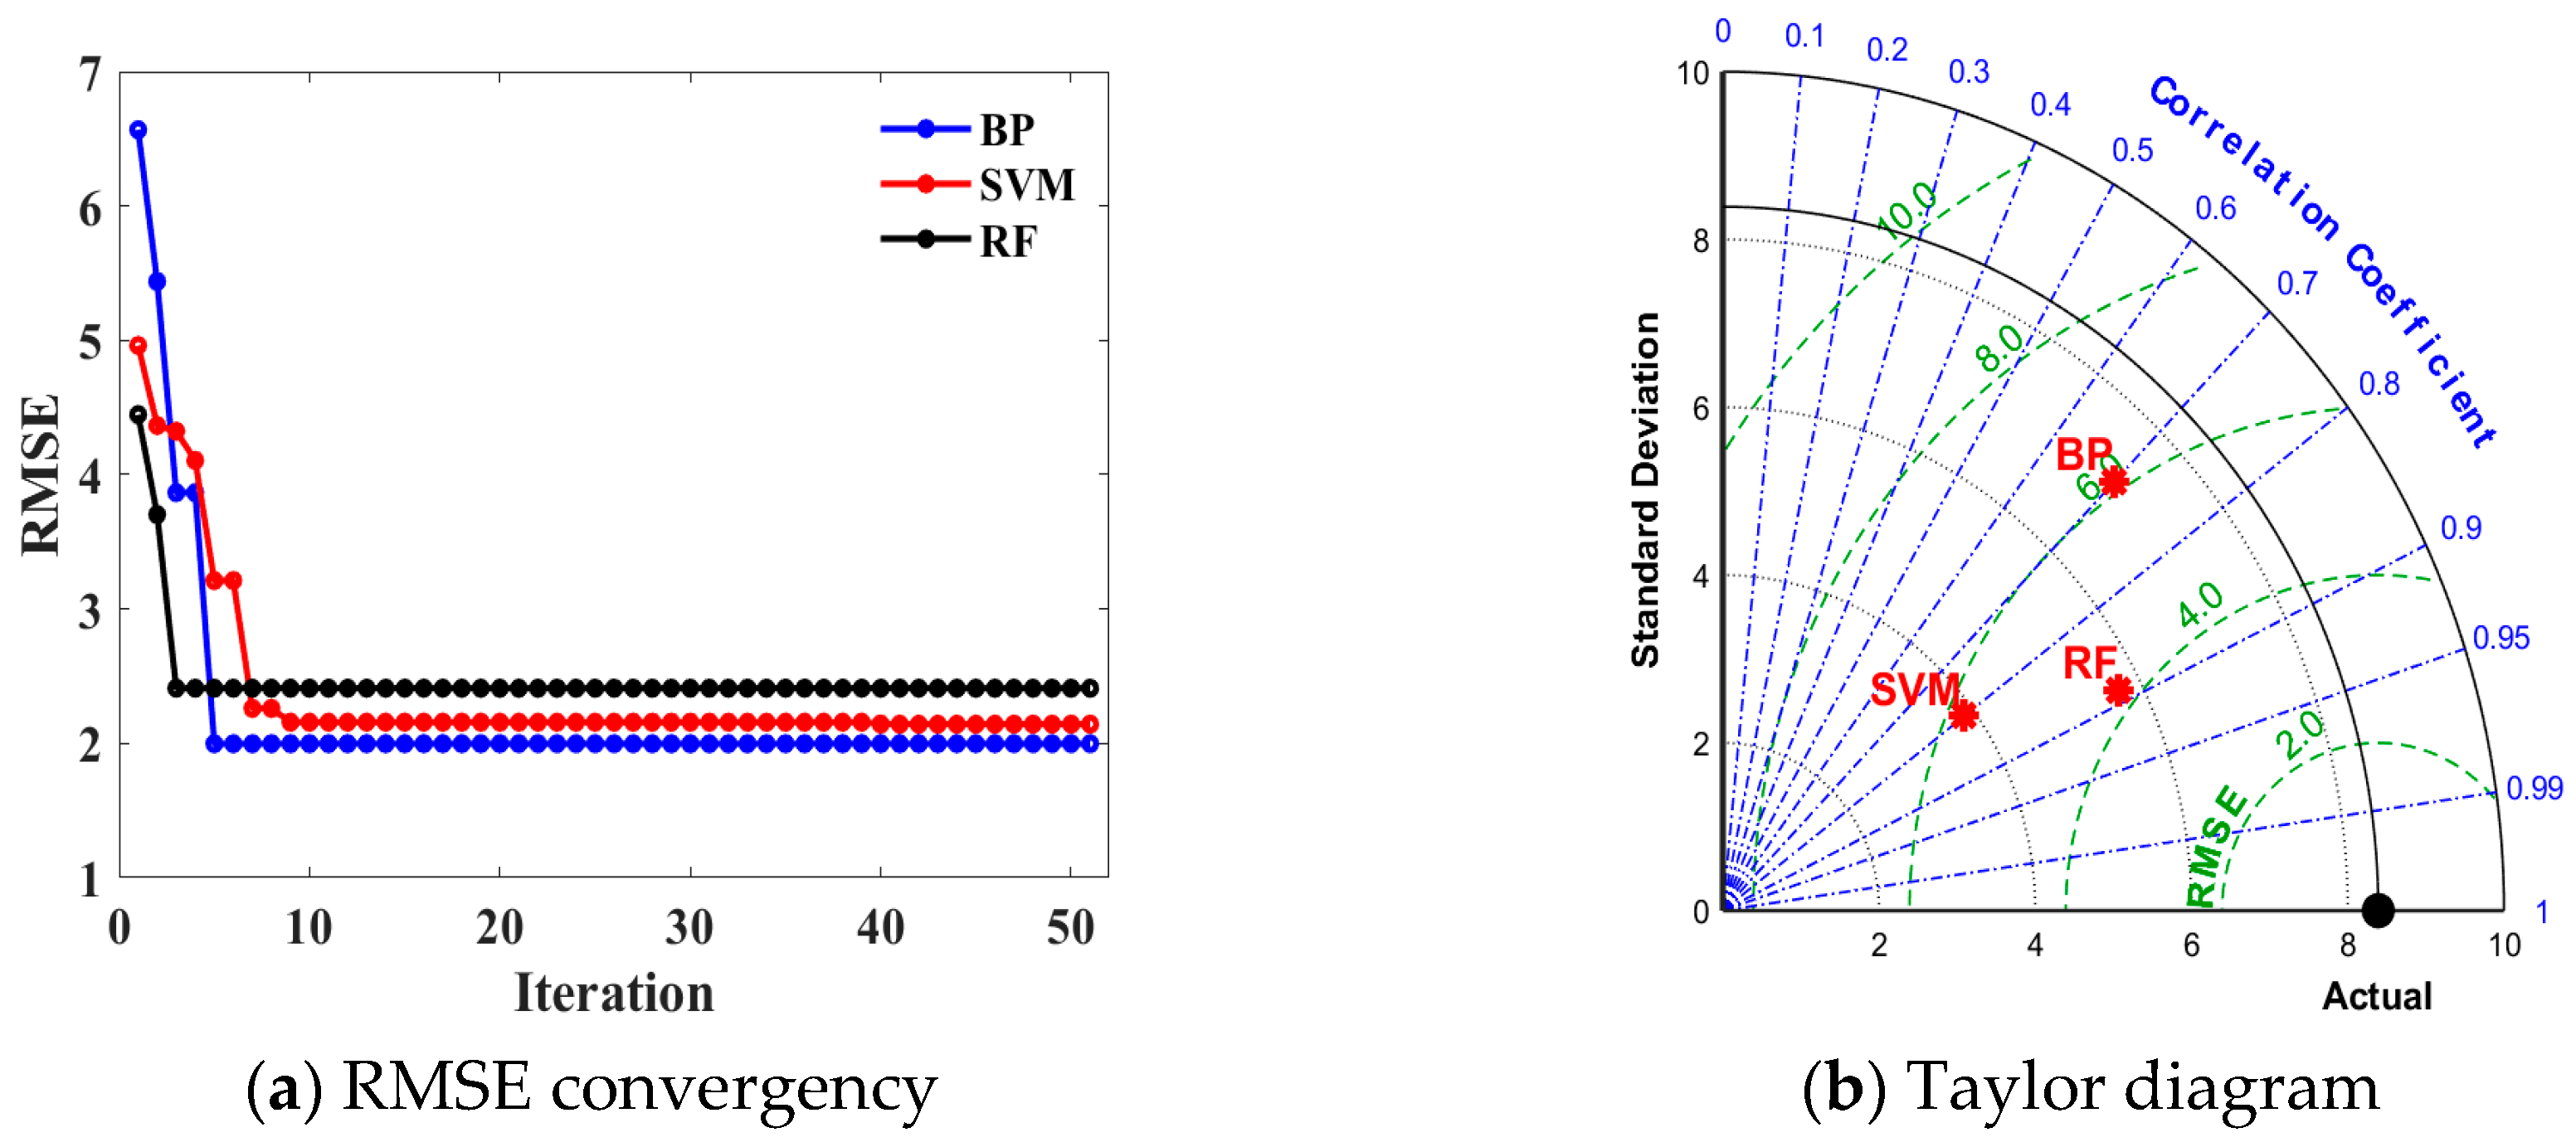
Similarly, Figure 5 exposes the performance of the BP, SVM and RF models in anticipating splitting strength. Figure 5a illustrates the iterative convergence iterations of the BAS algorithm for the synchronization of the optimization for each model parameter. The BP and SVM models had decreasing and stable RMSE, respectively, while the RF model converged after fewer iterations but with a higher error rate. The BP model employed three hidden layers (21, 22, 12 neurons), with an optimized learning rate of 3.9 × 10⁻⁵ and adjusted momentum factor of 0.0052, which reached the minimum MSE of 3.9909 and converged rapidly at the fifth iteration, indicating an optimal prediction ability. With BAS tuning C = 2.5674 and gamma = 0.71051, the RMSE of SVM decreased to 4.5934 in the 41st iteration, which resulted in a slightly slower convergence than BP, while the final error remained lower than that of RF. RF adopted 23 decision trees, and the minimum sample size of leaf nodes was optimized to 1. The RMSE dropped to 5.8113 in the third iteration, which led to faster convergence but the highest amount of errors. The predictive performance of the model is shown further in Figure 5b. It is observed from the figure that the RF model predicted values most closely to the actual values, possessing the maximum correlation coefficient (close to 0.9) and the minimum RMSE value. This suggests that the RF model is superior to the BP and SVM models overall in this operation.
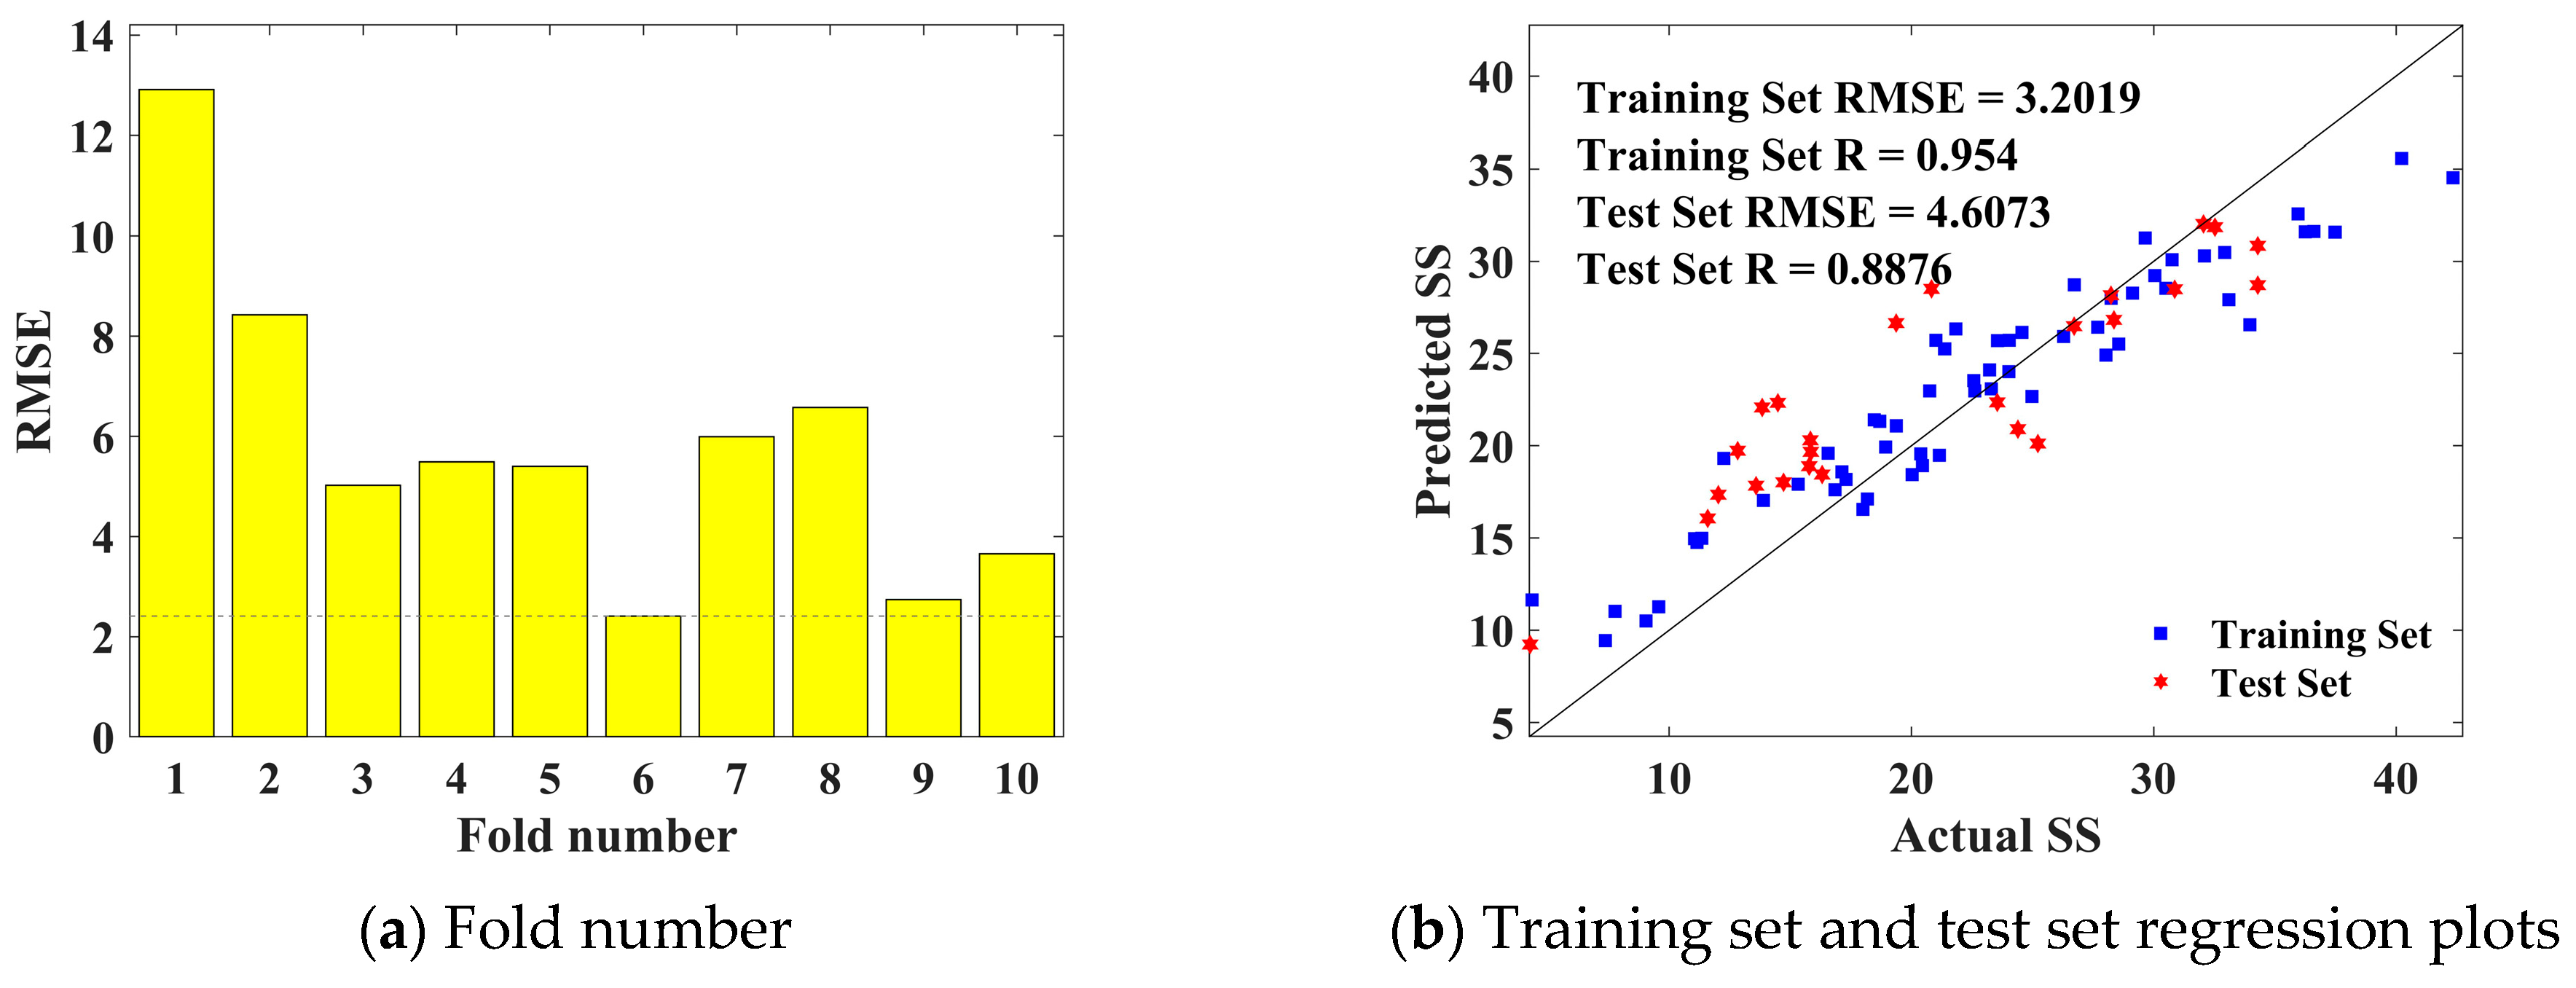
Figure 6a depicts the 10-fold cross-validation error of the RF model optimized with the BAS algorithm for splitting strength, with the minimum RMSE occurring at the sixth fold. In Figure 6b, the data points in the training set (blue) and test set (red) are mostly distributed around the diagonal line, indicating that the model is more accurate in its overall prediction. With RMSE = 3.2019, R = 0.954 for the training set and RMSE = 4.6073, R = 0.8876 for the test set, the model suggests having improved fit on the training set and a slight increase in error on the test set, with a decrease in the generalization ability and a larger prediction bias especially in the low SS value region.

4.1.3. Results of Density

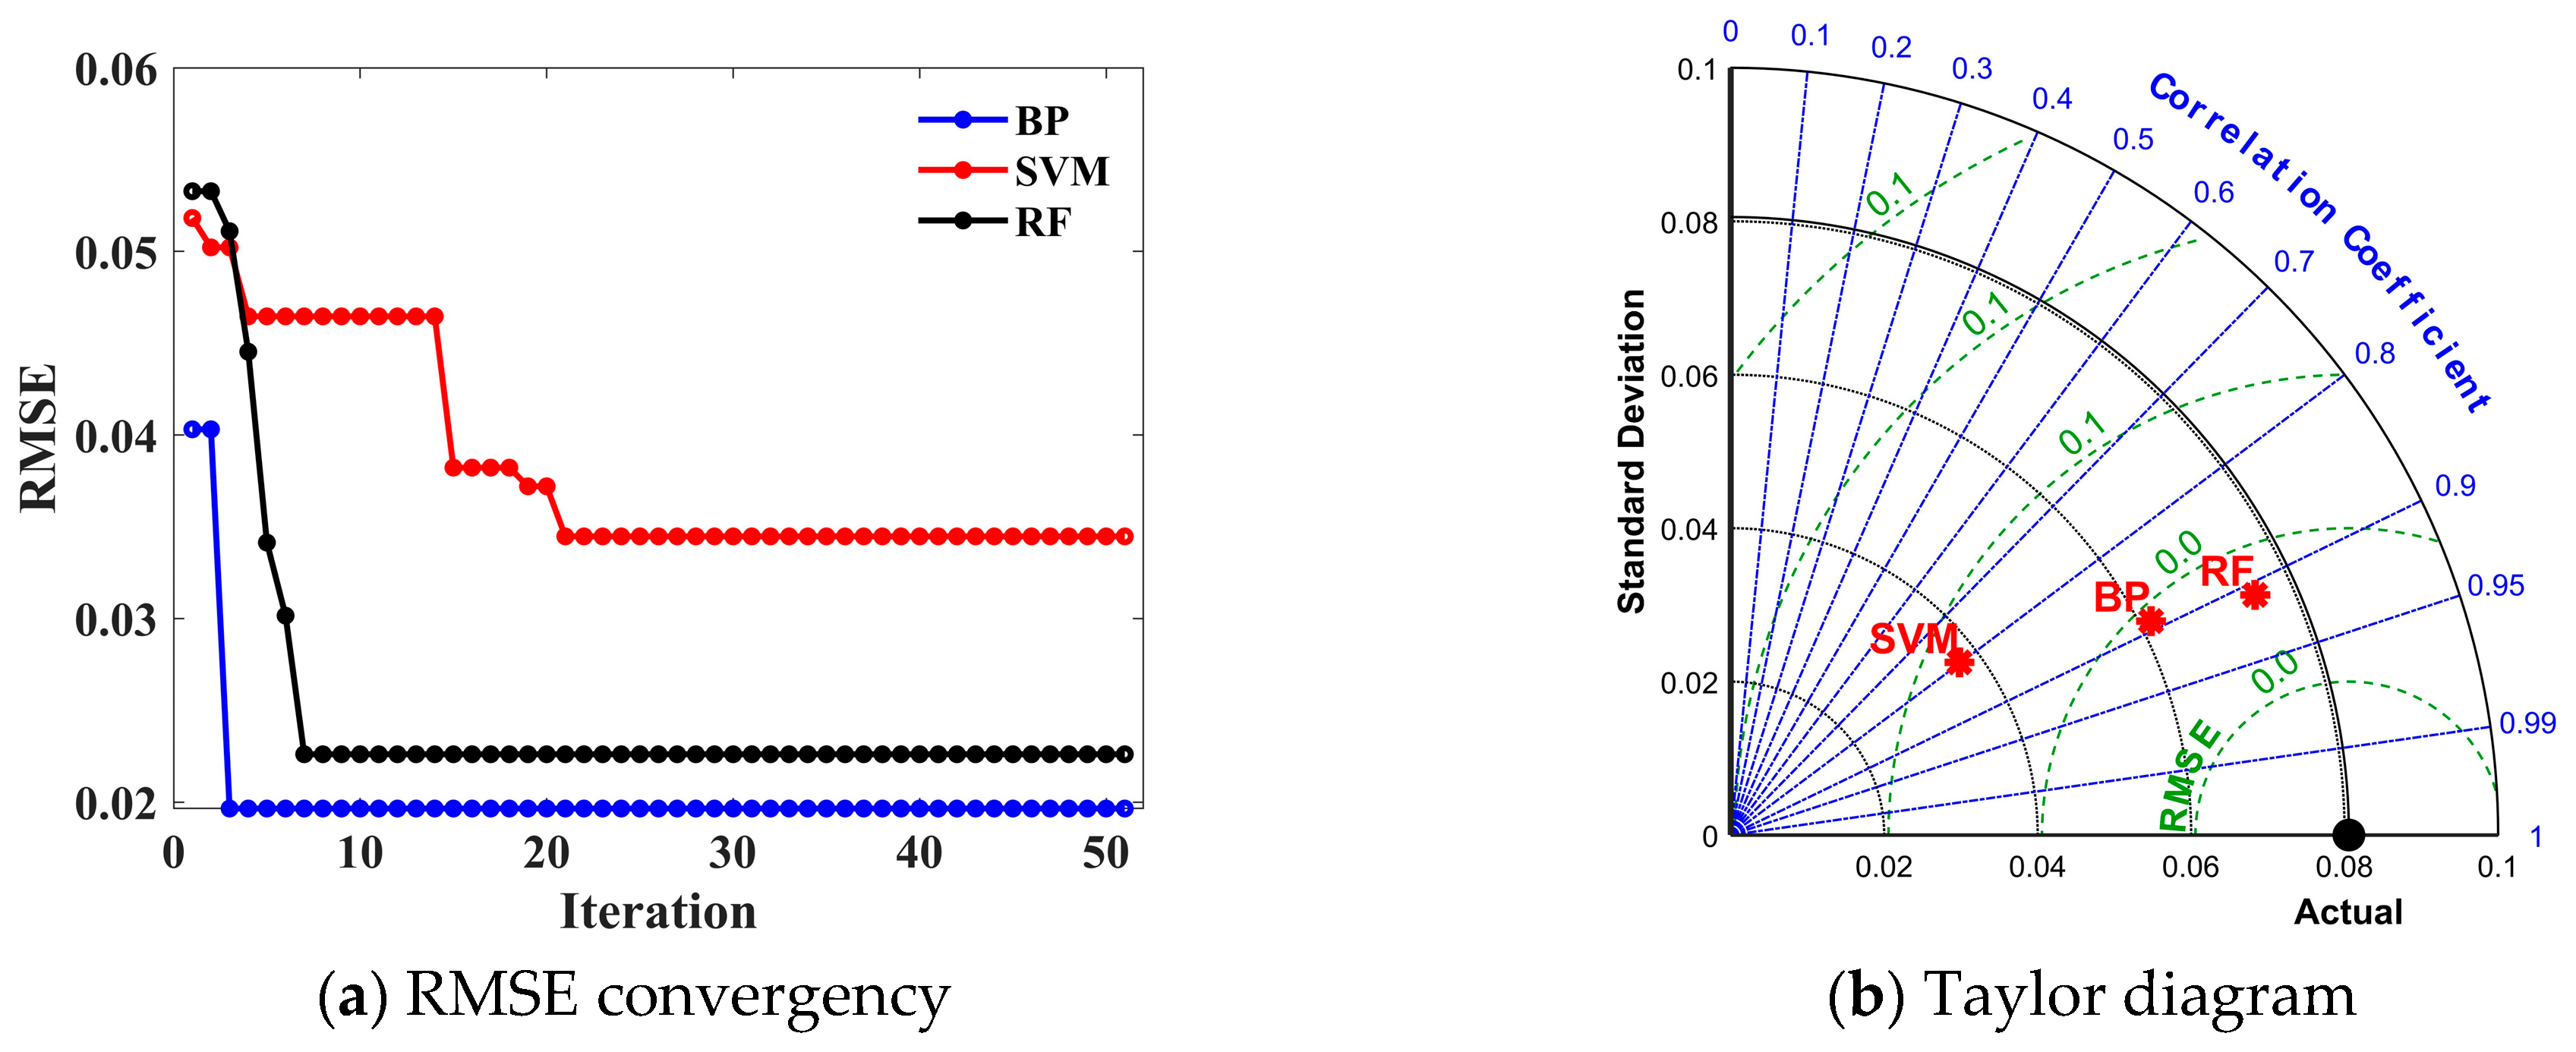
Equivalently, Figure 7a displays the RMSE tendency with the number of iterations for BP, SVM, and RF with BAS optimization. BP performed optimally with 1 hidden layer (1 neuron), with a learning rate up to 4.6 × 10⁻⁵ and a momentum factor equal to 0.006, yielding an RMSE of 0.00038621 at the third iteration. SVM improved to 0.0011887 at the 21st iteration with the optimization of C = 0.46228 and gamma = 1.8717. RF took 45 decision trees with a minimum sample size of 1 leaf node, whose RMSE reached 0.00051121 at the seventh iteration. Additionally, in Figure 7b, the RF model has the maximum correlation coefficient (exceeding 0.9), which resembles the actual value most closely. Therefore, RF deserves to be selected for the density prediction model in particular.
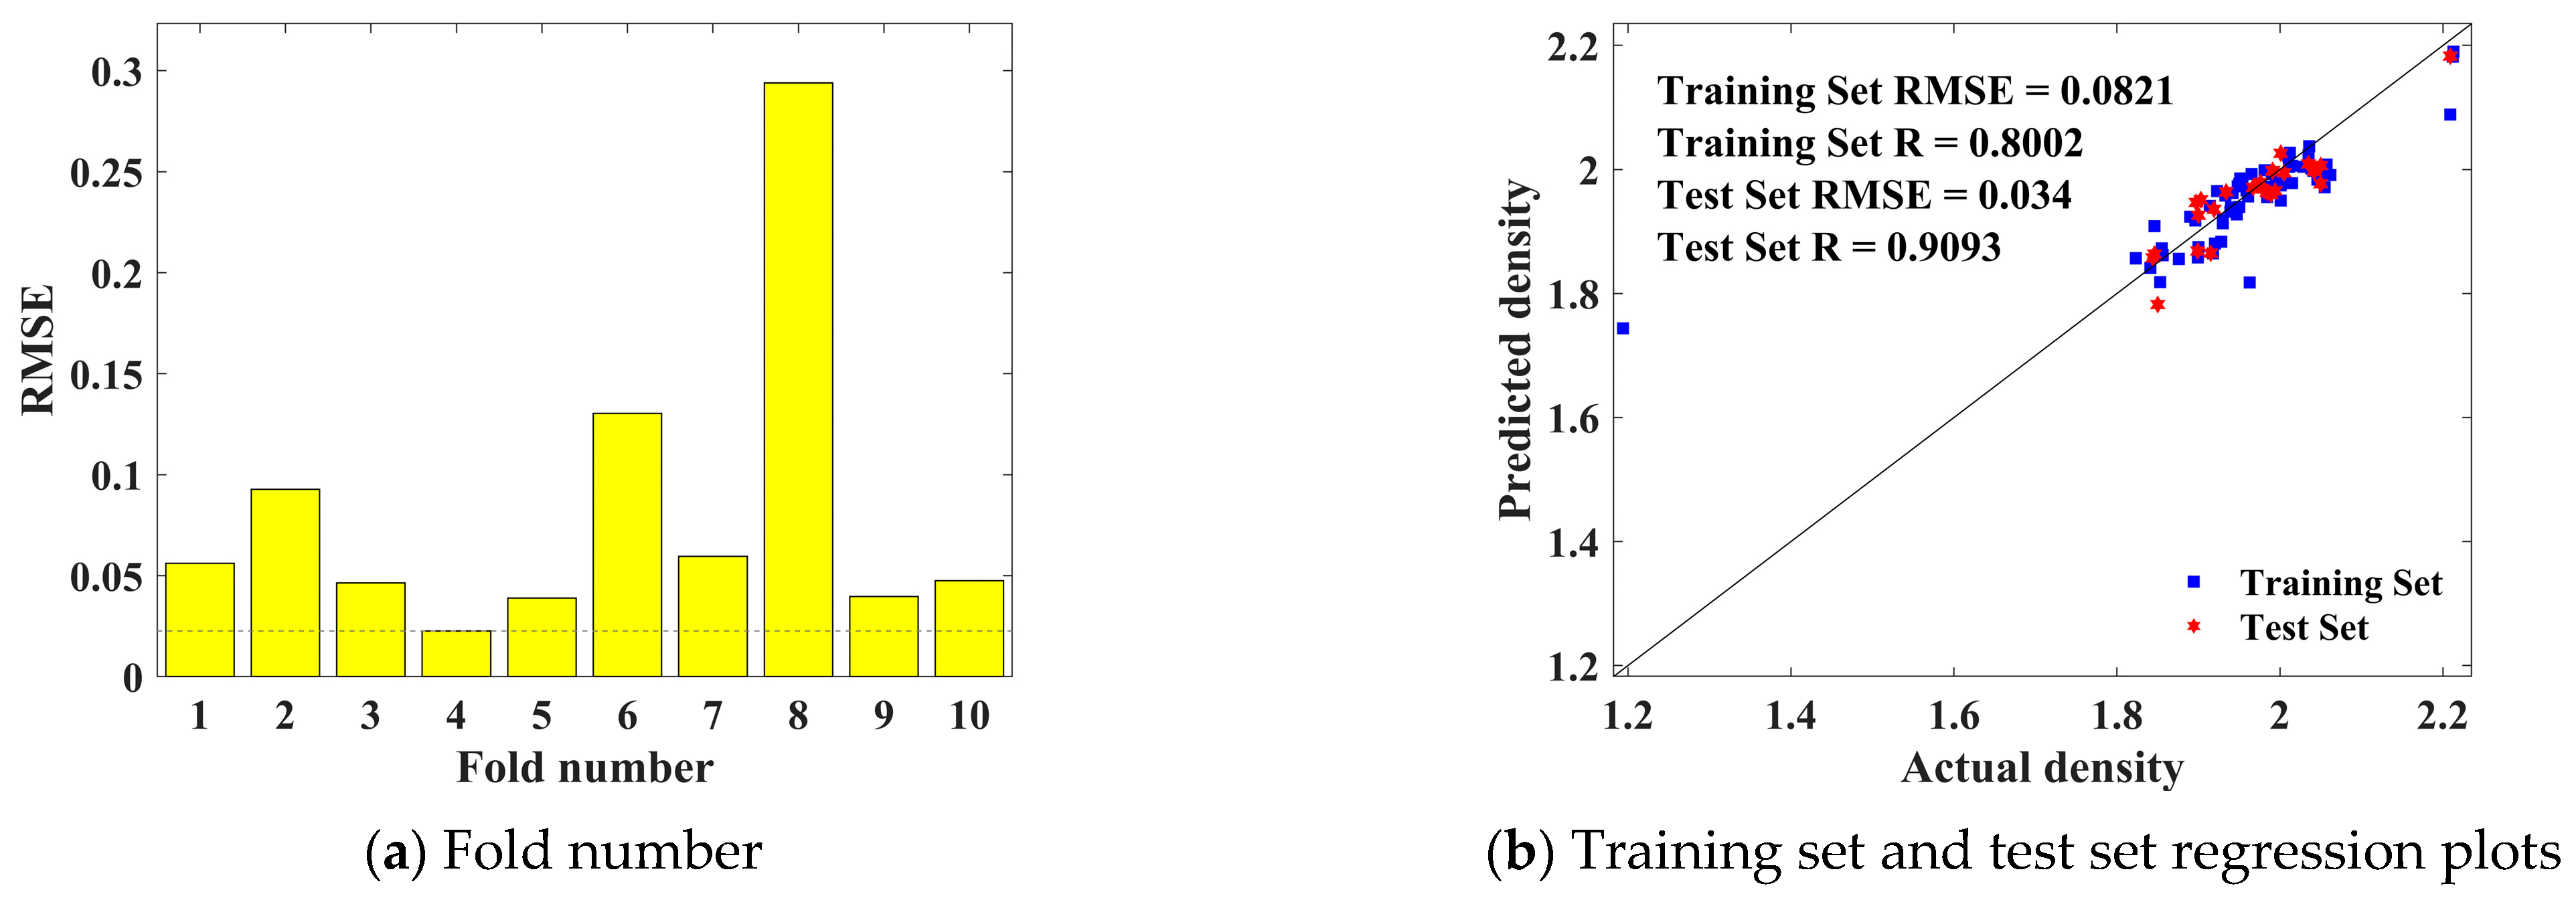
Figure 8a exhibits the RMSE of the 10-fold cross-validation, with the maximum error in the eighth fold and minor fluctuations in the rest of the folds with considerably lower errors. Figure 8b contains RMSE = 0.0821, R = 0.8002 for the training set and RMSE = 0.034, R = 0.9093 for the test set, emphasizing the superior predictive ability of the model.
Because the independent dataset was limited, the prediction results should be interpreted with caution. The testing subset contained a small number of samples, and the reported R, RMSE, MAE and MAPE values may vary with different data partitions. Therefore, these metrics were used mainly to compare candidate surrogate models under the same validation procedure, rather than to claim universal prediction accuracy. The selected models were subsequently used as interpolation-based surrogate models for multi-objective optimization within the experimental design space.
To further evaluate the effectiveness of the proposed models, empirical linear and polynomial regression models were used as benchmark models, and the same training and testing subsets were adopted for all models. This comparison provided a baseline for assessing whether the BAS-optimized machine-learning models offered improved predictive capability beyond conventional regression-based fitting. The selected surrogate models were then used for subsequent multi-objective mixture optimization.

4.2. LCGS Mixture Optimisation

Based on the model evaluation results, BAS–BP was used to predict compressive strength, while BAS–RF was used to predict splitting strength and density. These surrogate models were then coupled with MOBAS for multi-objective mixture optimization. The optimization objectives included maximizing 28-day compressive strength and splitting strength while minimizing density, material cost and CO2 emissions. For each optimization scenario, 100 non-dominated Pareto solutions were generated, and TOPSIS was used to select the most balanced mixture from the Pareto front.

4.2.1. CS, Density and Price Optimisation Design

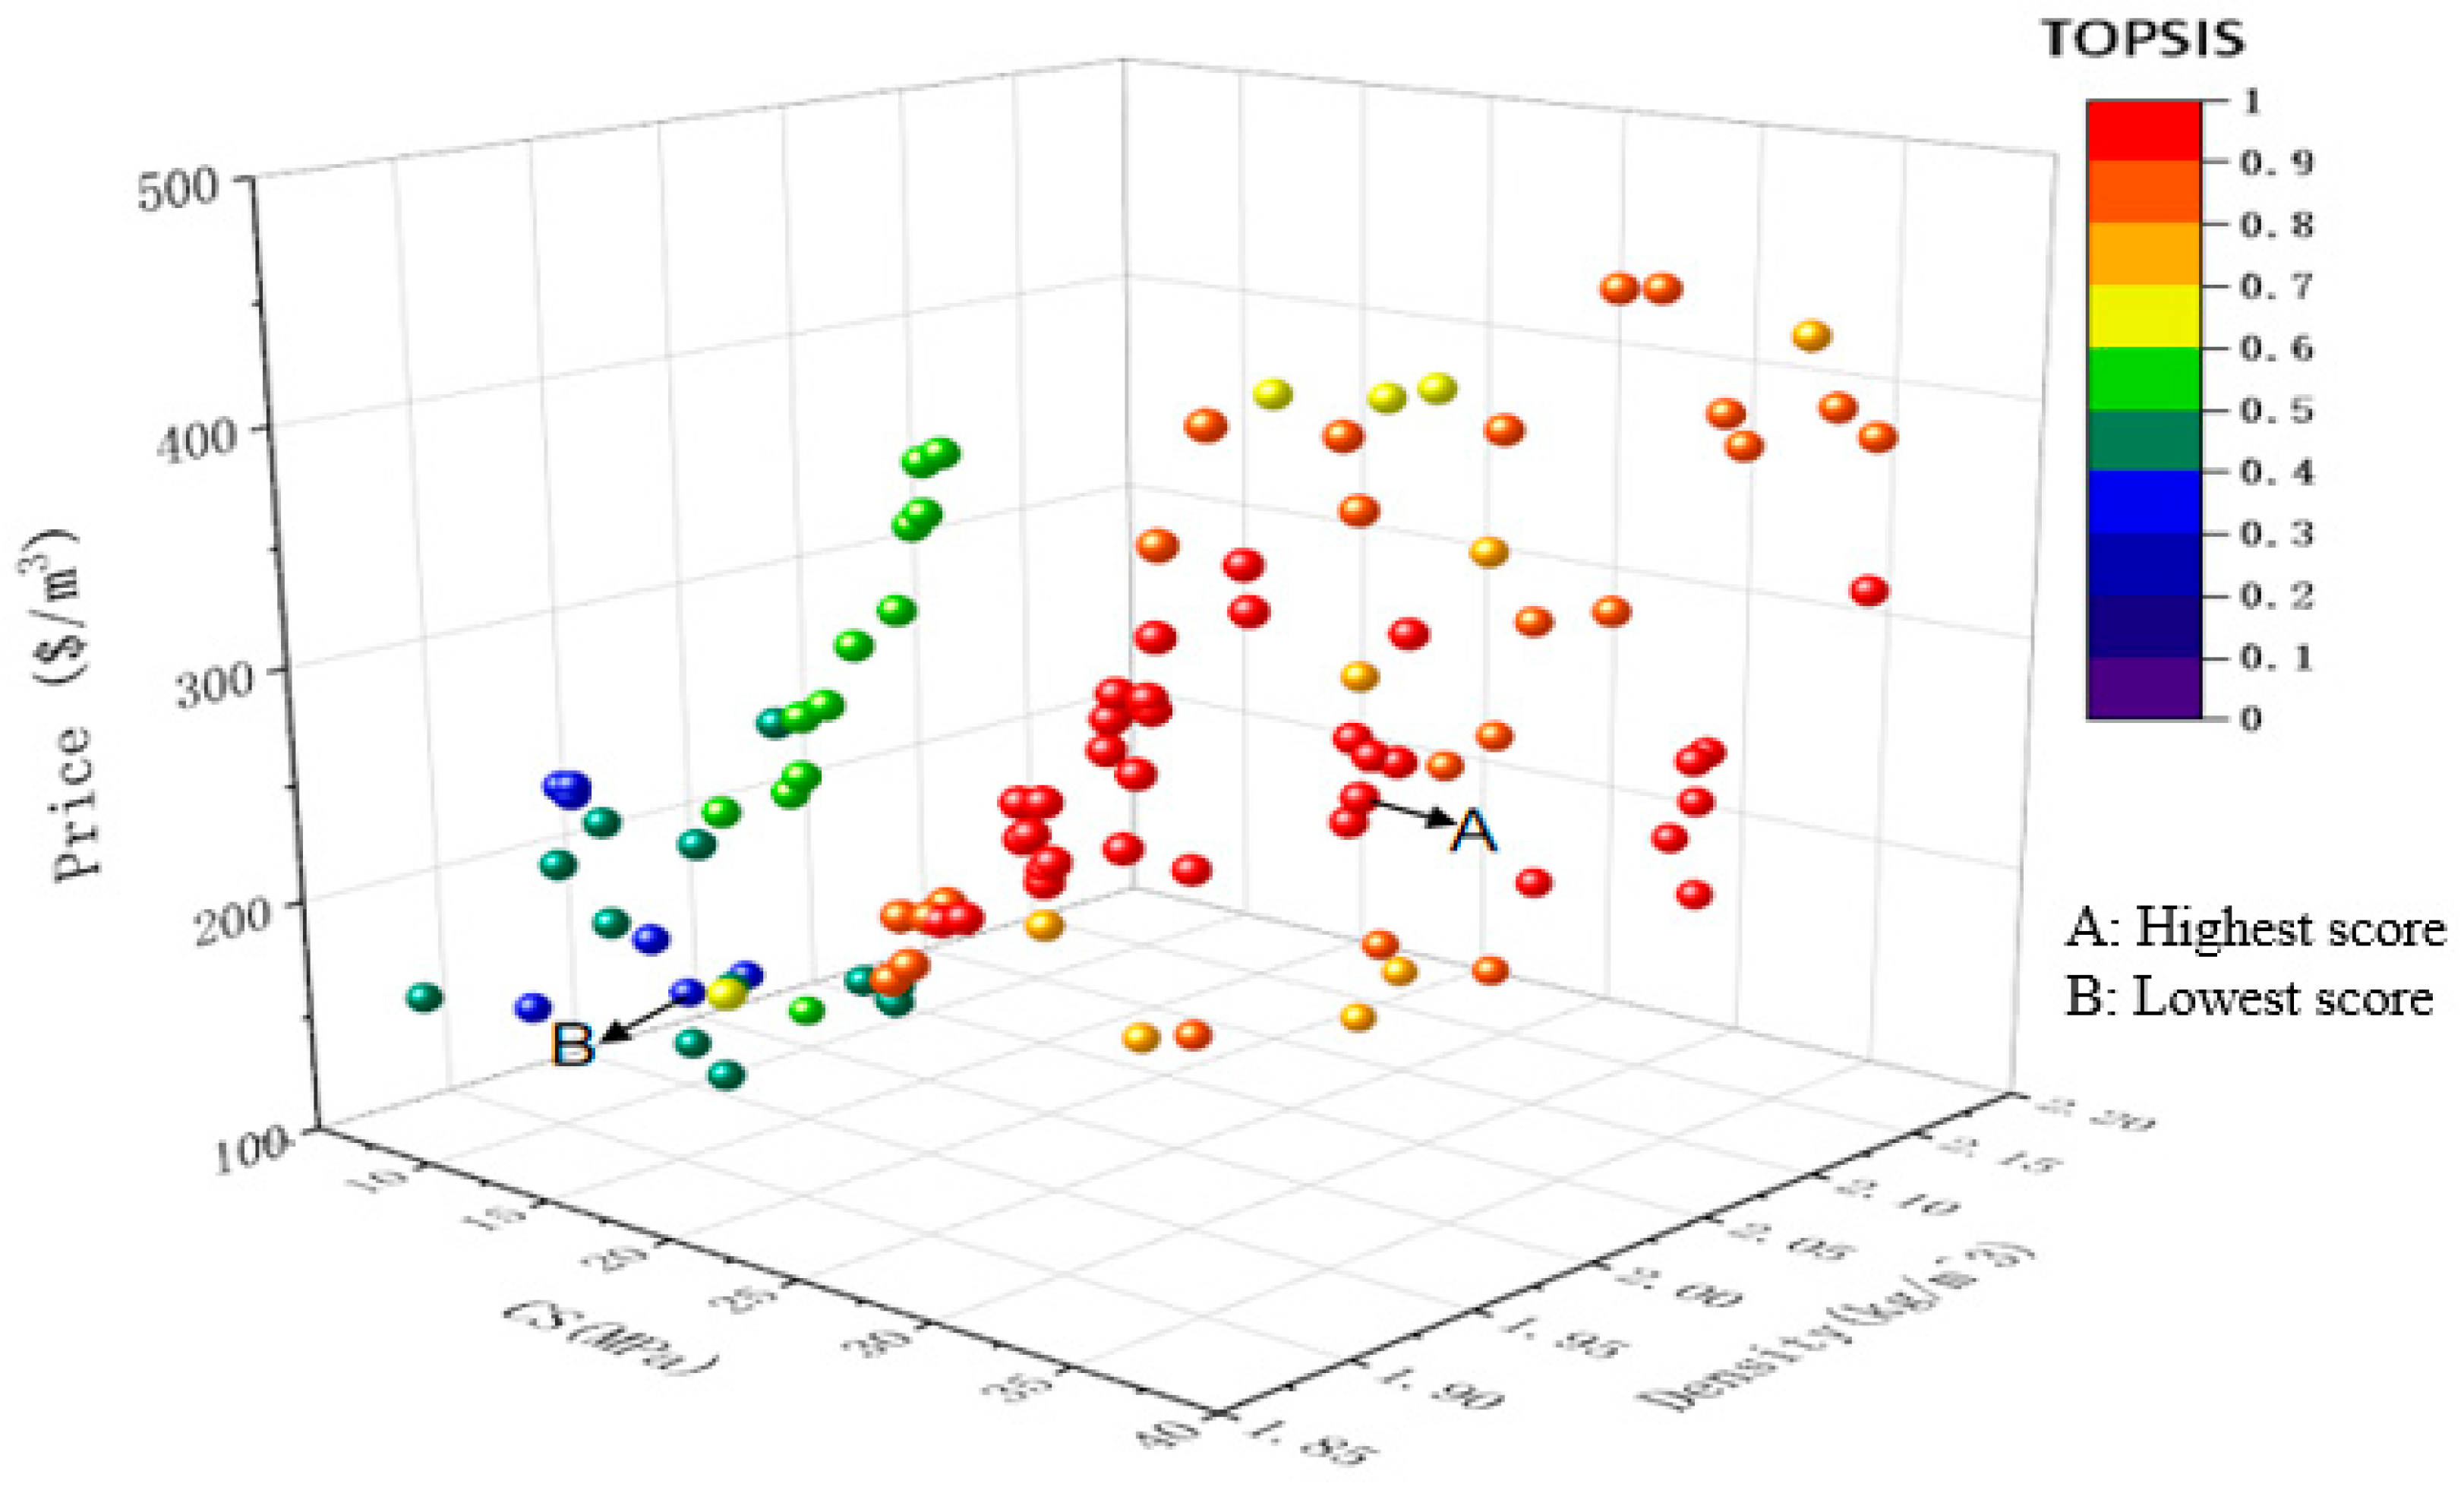
Based on the three parameters of CS, density and cost, two Pareto fronts were generated separately for the two surface pretreatment methods of CGACD and CGACM, with the results shown in Figure 9 and Figure 10, correspondingly. In addition, TOPSIS scores are highlighted with colours, indicating an increase in score from purple to red. Points A and B are marked in the graph to indicate the maximum and minimum TOPSIS values. For the LCGS with CGACD treatment, the most appropriate solution according to the TOPSIS method yielded 40.511 MPa CS, with 1985 kg/m3 density and 148.994 $/m3 cost. Similarly, for LCGS with CGACM, point A has been determined to be the optimal solution. It has the maximum TOPSIS score, with a corresponding CS of 35.804 MPa, density of 1953 kg/m3, and cost of 291.399 $/m3. Both the highest and lowest TOPSIS scored mixture optimisation options are specifically registered in Table 3.

4.2.2. SS, Density and Price Optimisation Design

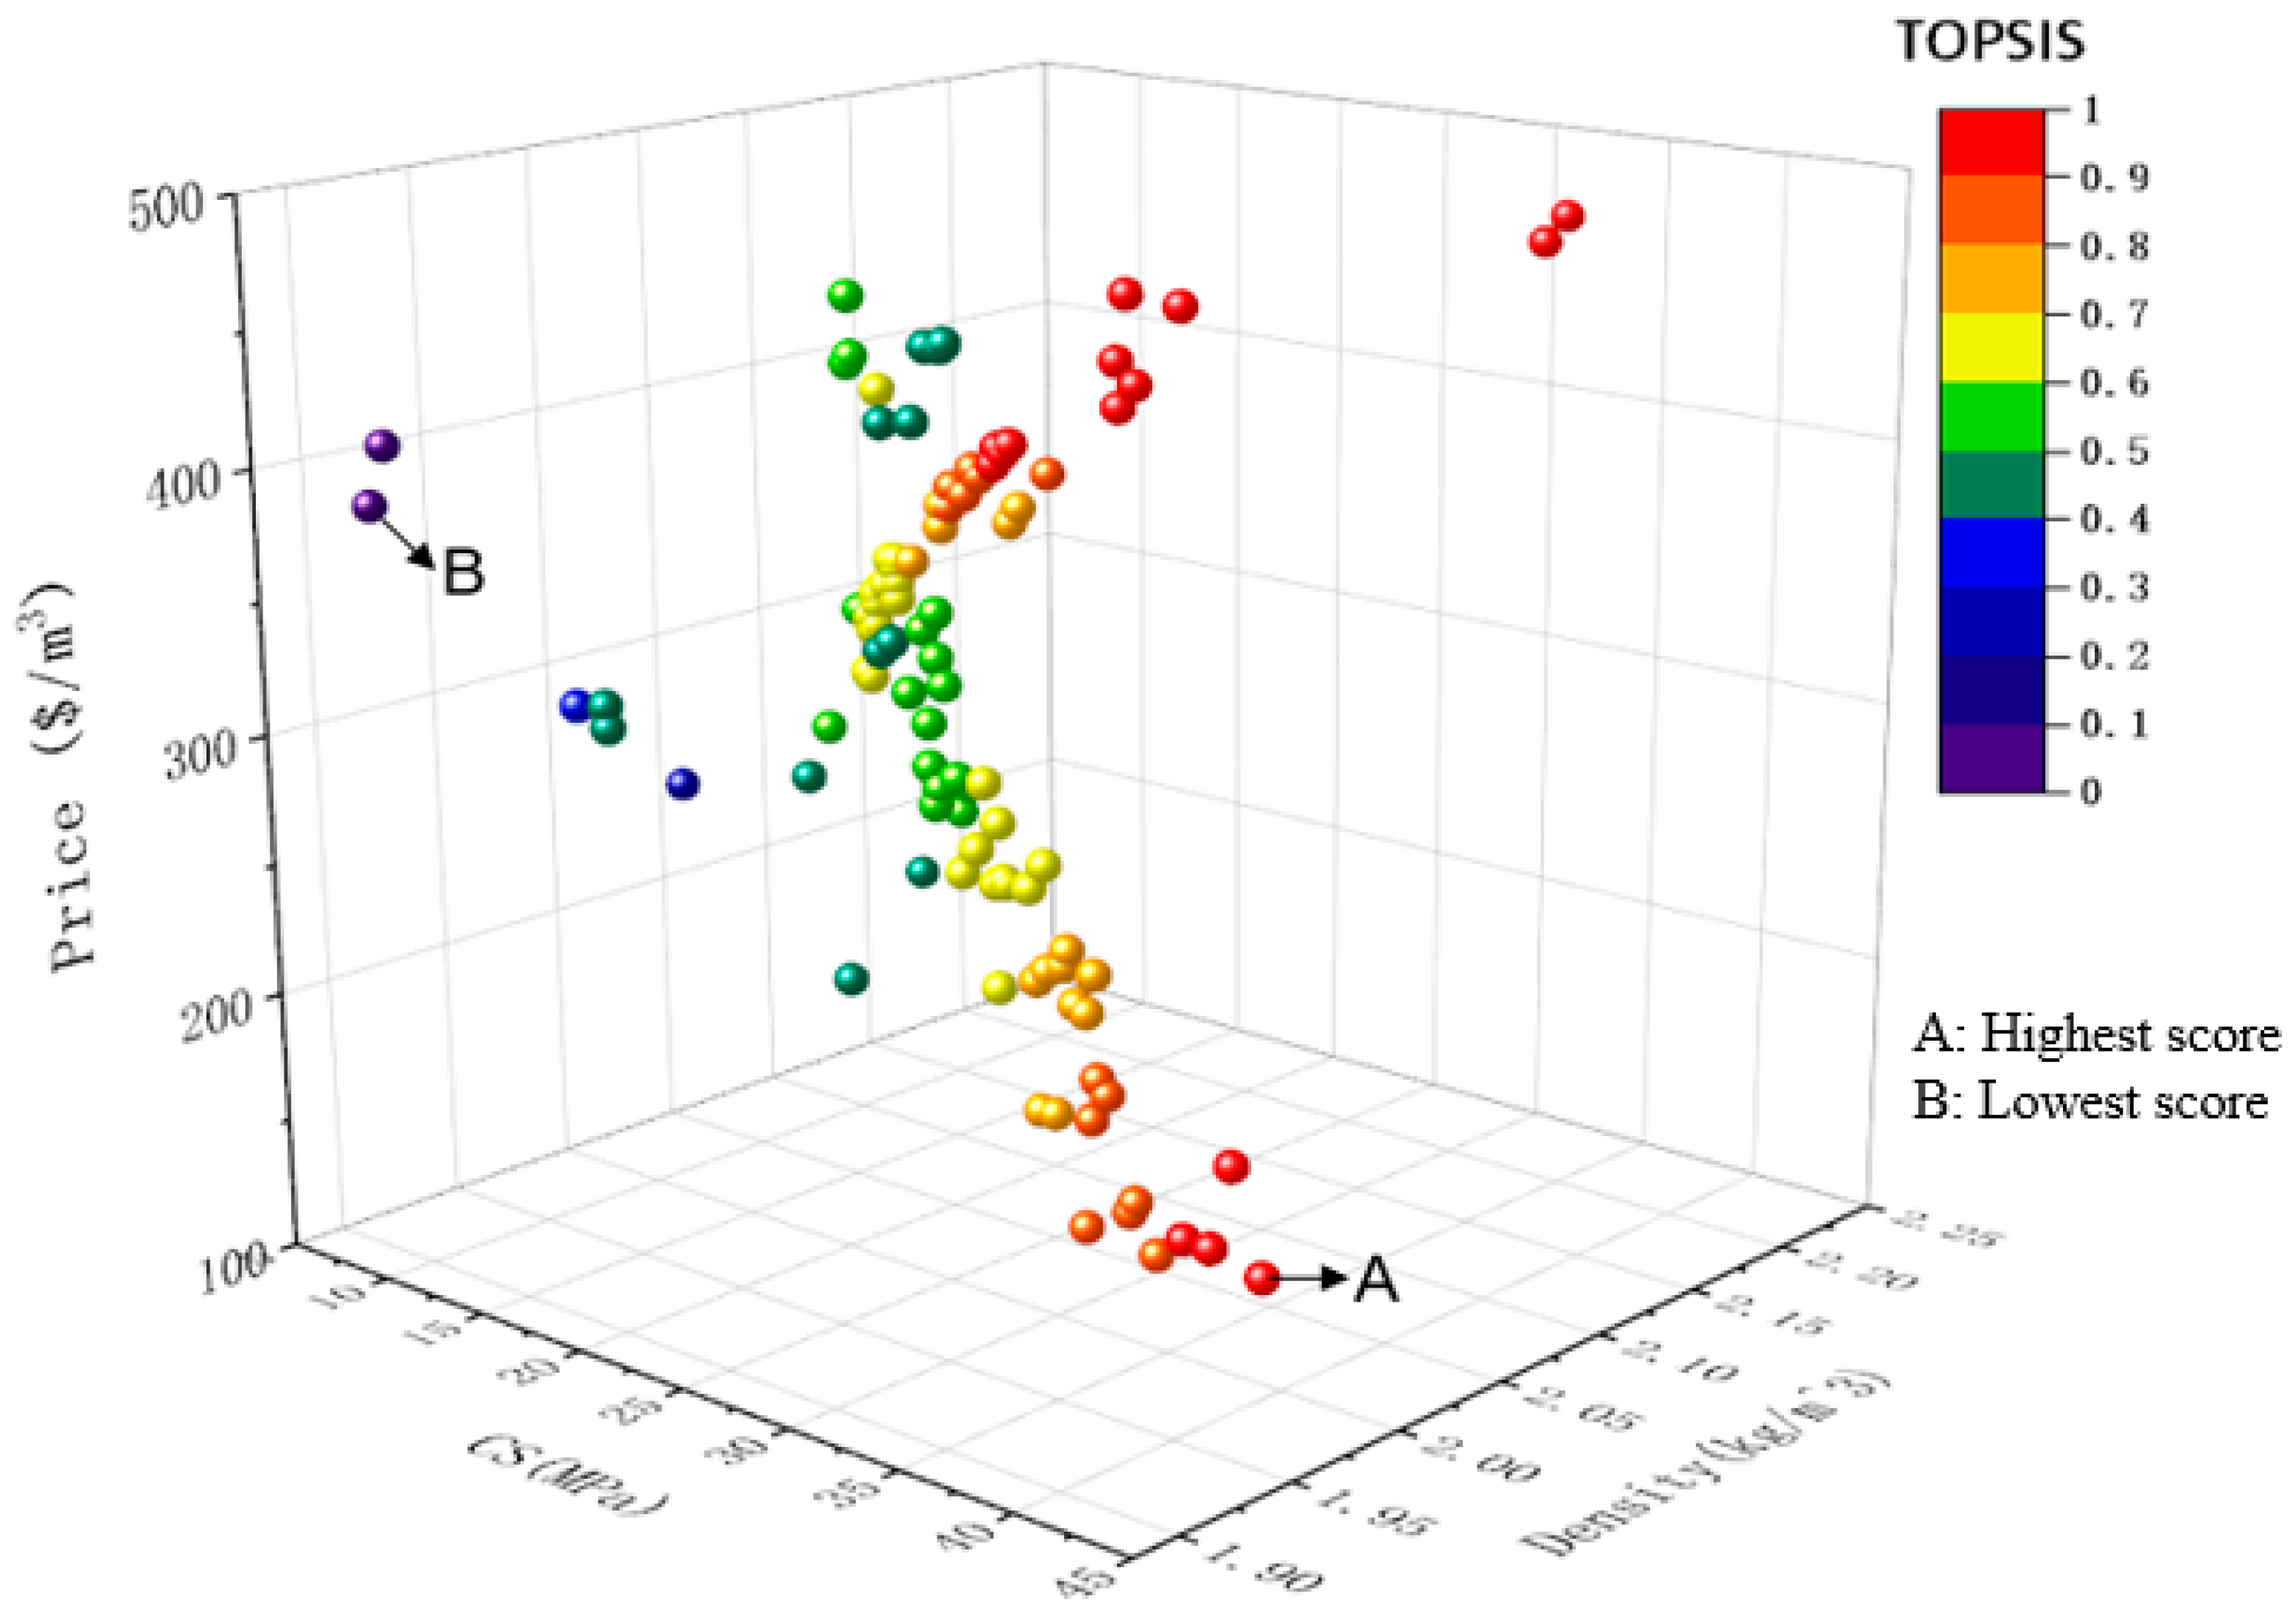
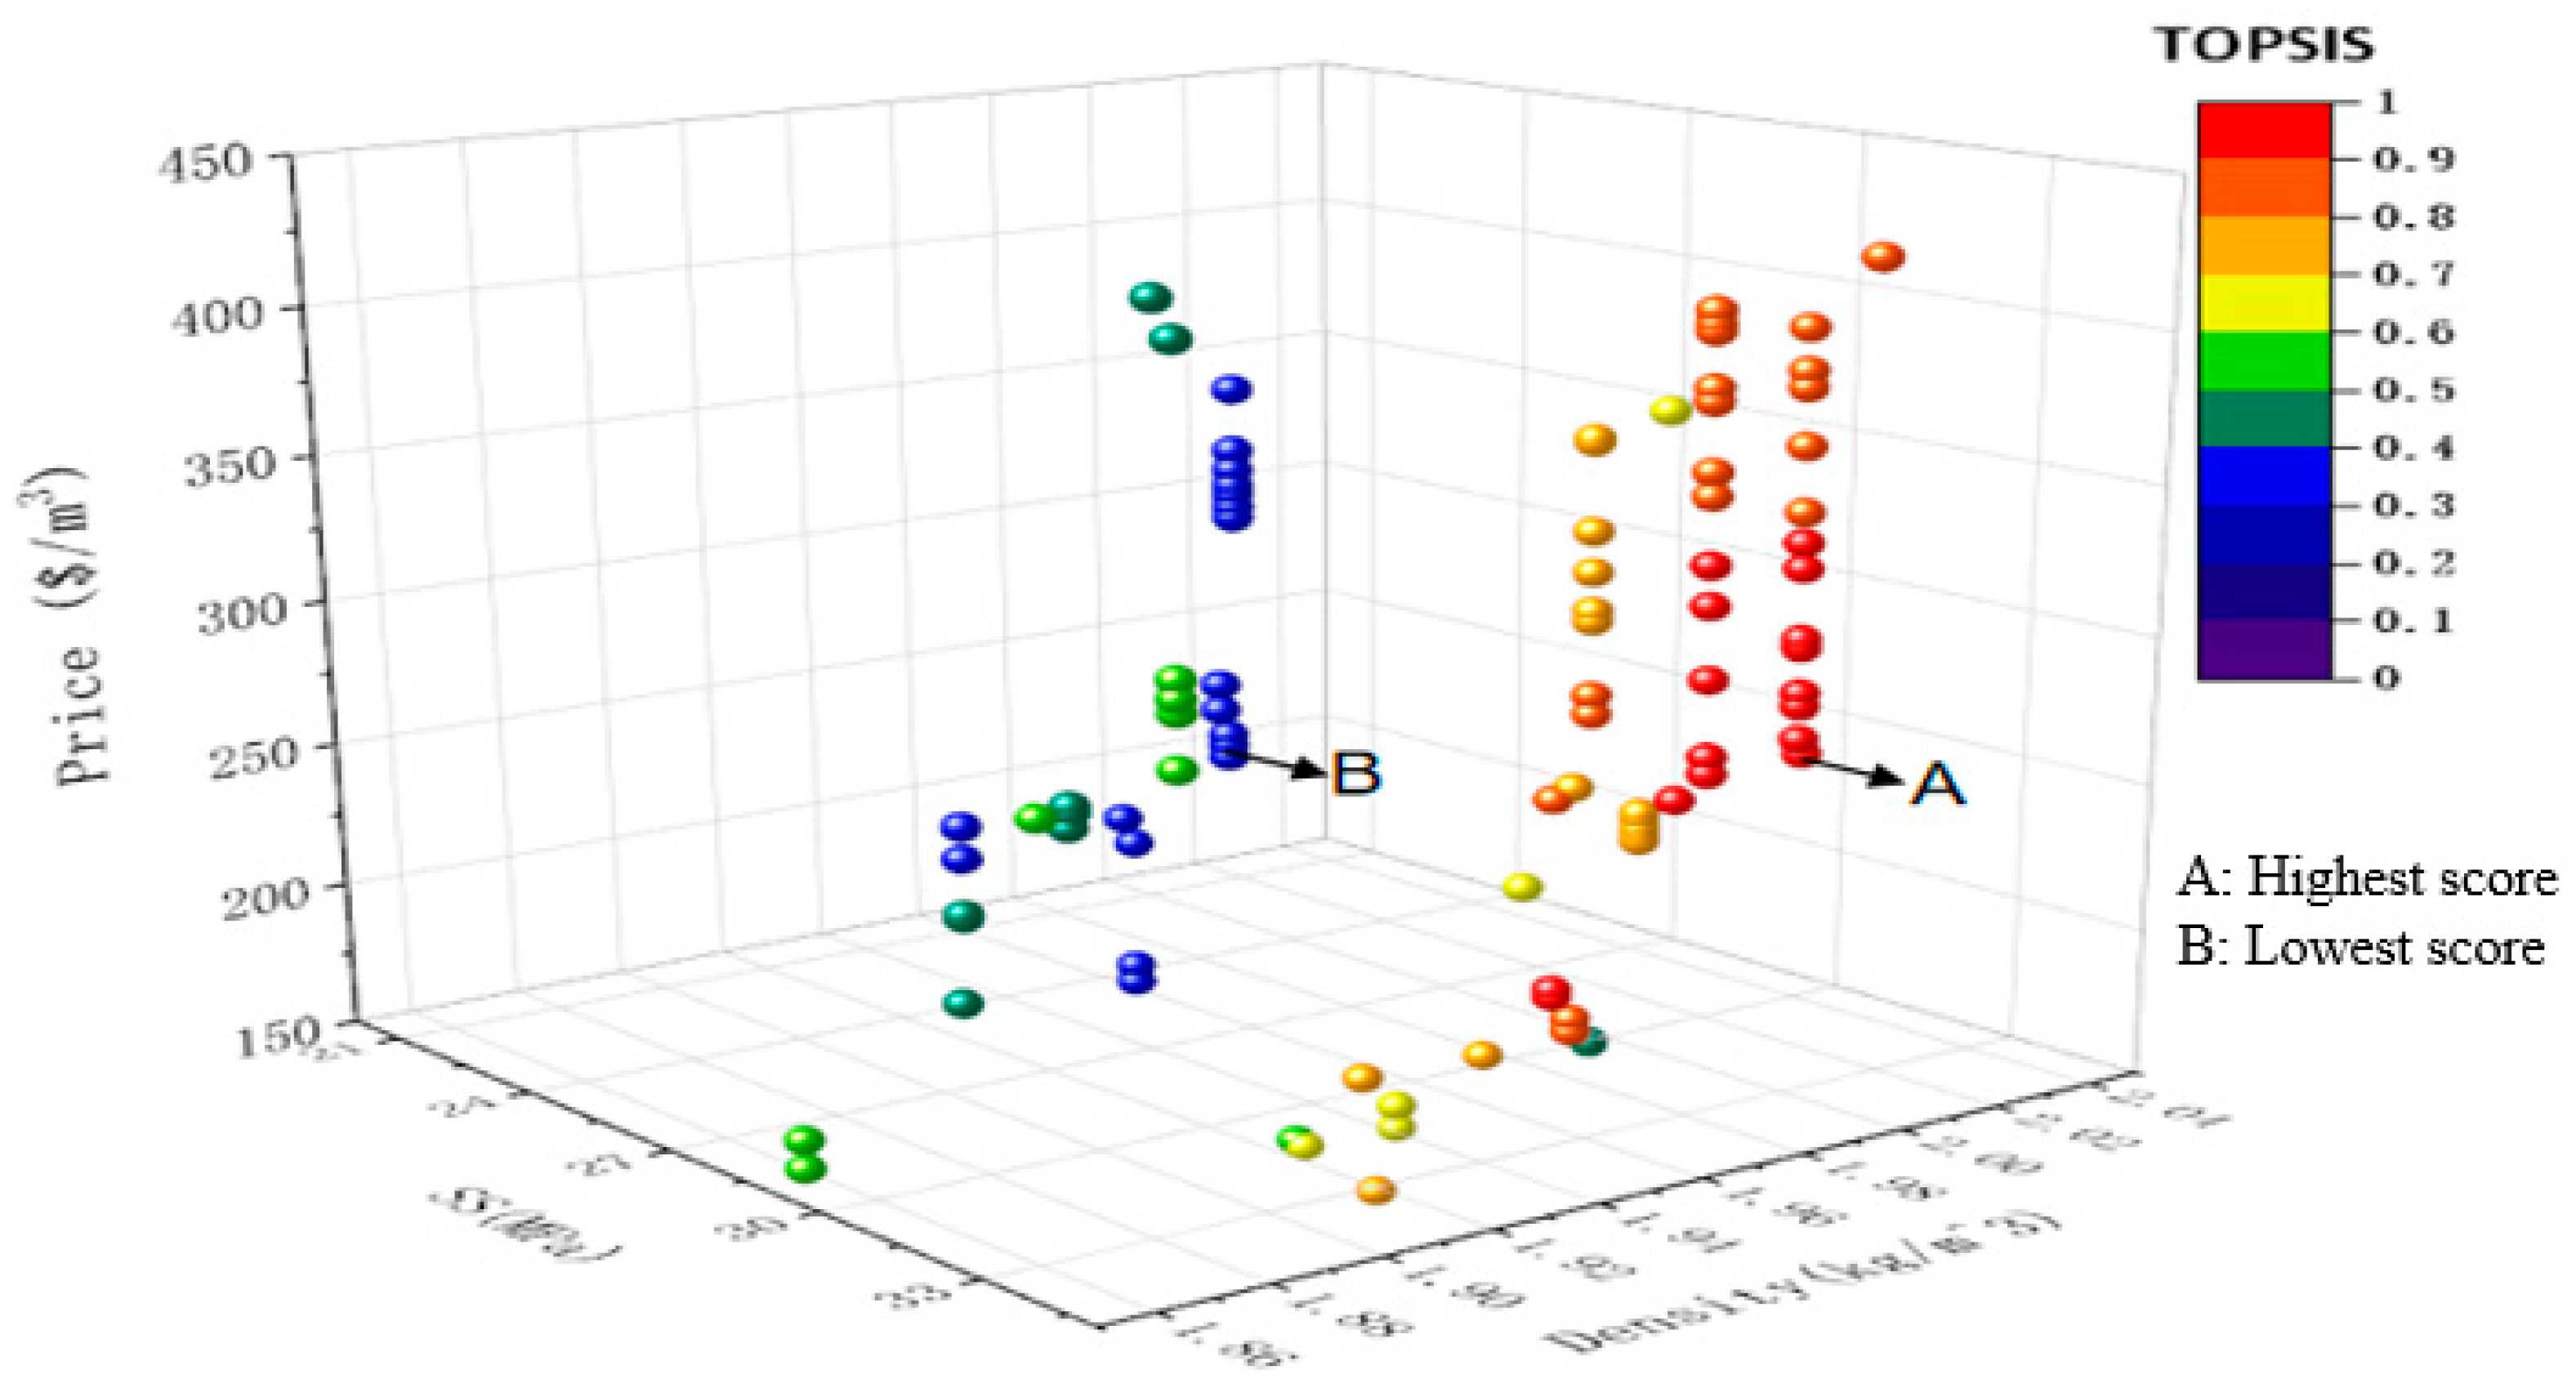
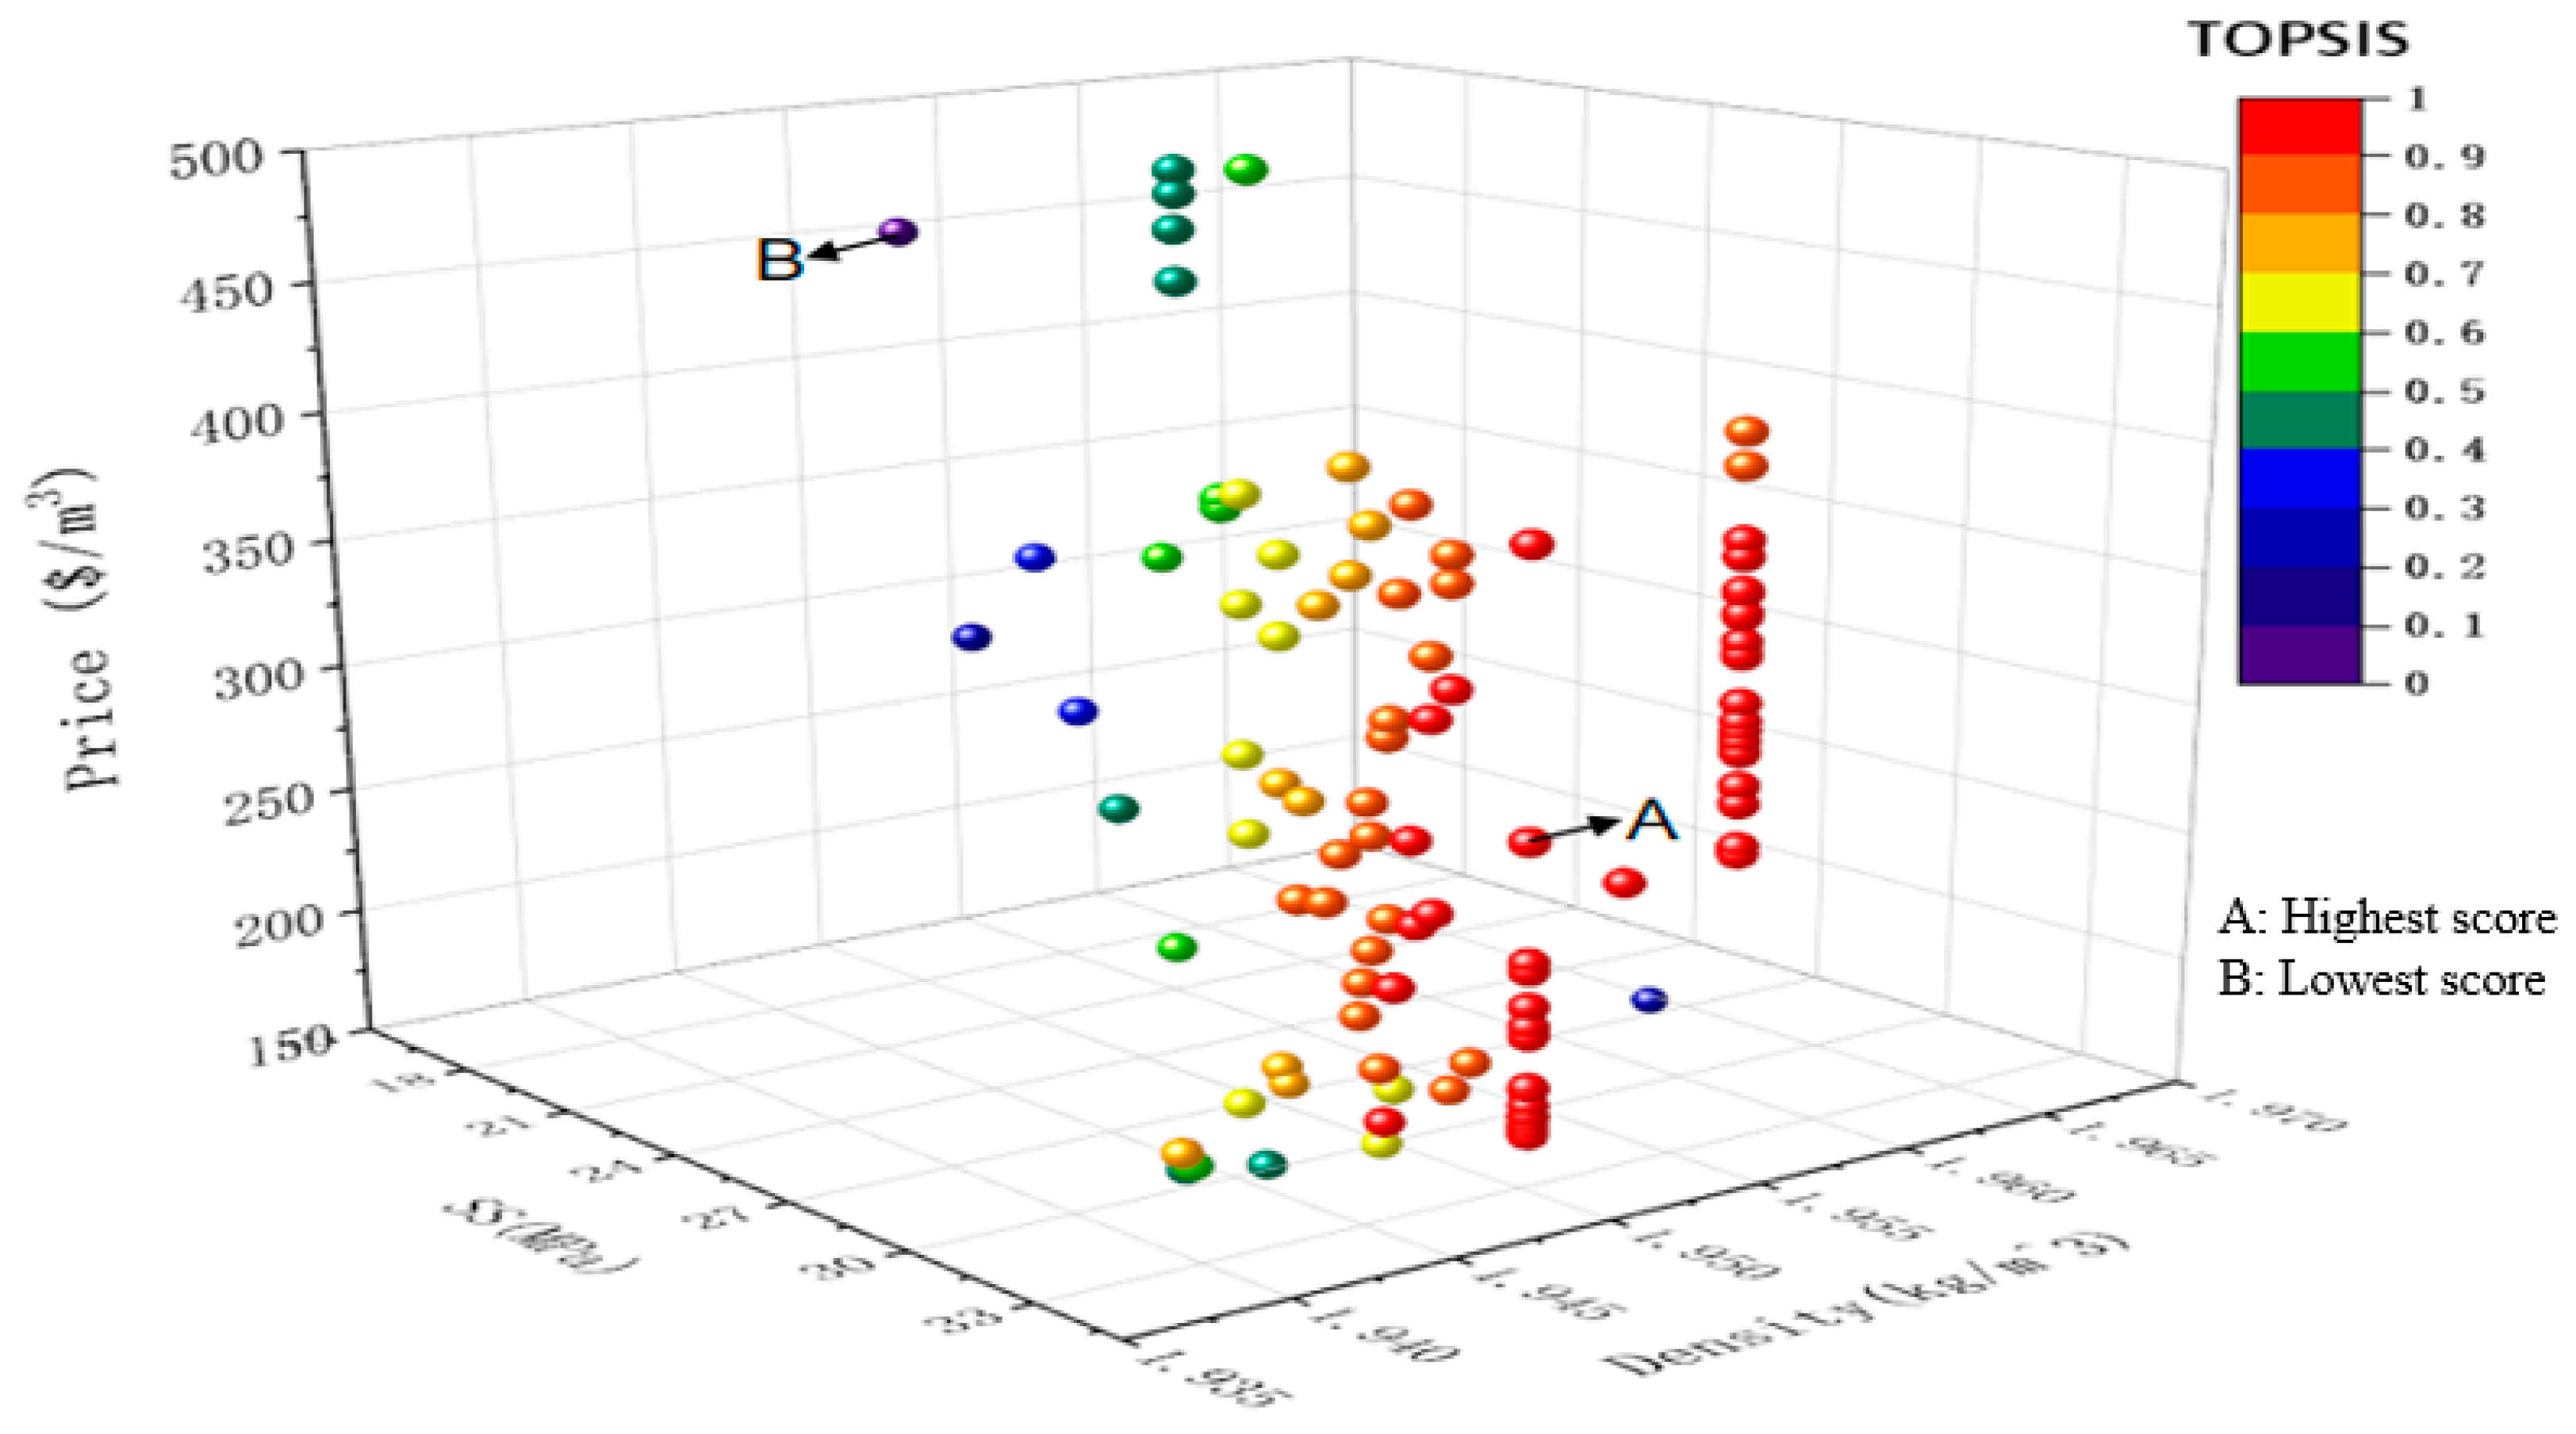
Similarly, Figure 11 and Figure 12 present the Pareto frontiers for three-objective optimization based on SS, density and price. The optimum and inferior mixture optimisation solutions in the Pareto front corresponding to the two LCGS activation methods have been labelled in the diagrams below. In the first figure, the data points are more discretely distributed in space, with prices fluctuating between 150 and 450 $/m3. Points with different TOPSIS values are distributed over a range of values of density and SS. Point A contains a TOPSIS of 1, with a SS of 34.401 MPa, a density of 1966 kg/m3, and a price of 277.413 $/m3. Meanwhile, the distribution of data points in the second figure is also scattered, with the price ranging from 150 to 500 $/m3, with relatively clustered data points in some areas, showing a distribution pattern similar to and different from that of the first figure. With point A being a TOPSIS of 1, the SS is 34.401 MPa, the density is 1966 kg/m3, and the price is 277.413 $/m3. Both Pareto frontiers in which the evaluation of the best and worst mixture optimisations were found by the TOPSIS method have been specified in Table 4.

4.2.3. CS, Density and CO2 Optimisation Design

The correlation coefficients in the CO2-based multi-objective optimization are 0.93908 for cement, 0.01266 for standard sand, 0.00123 for water and 0.03021 for fibre.
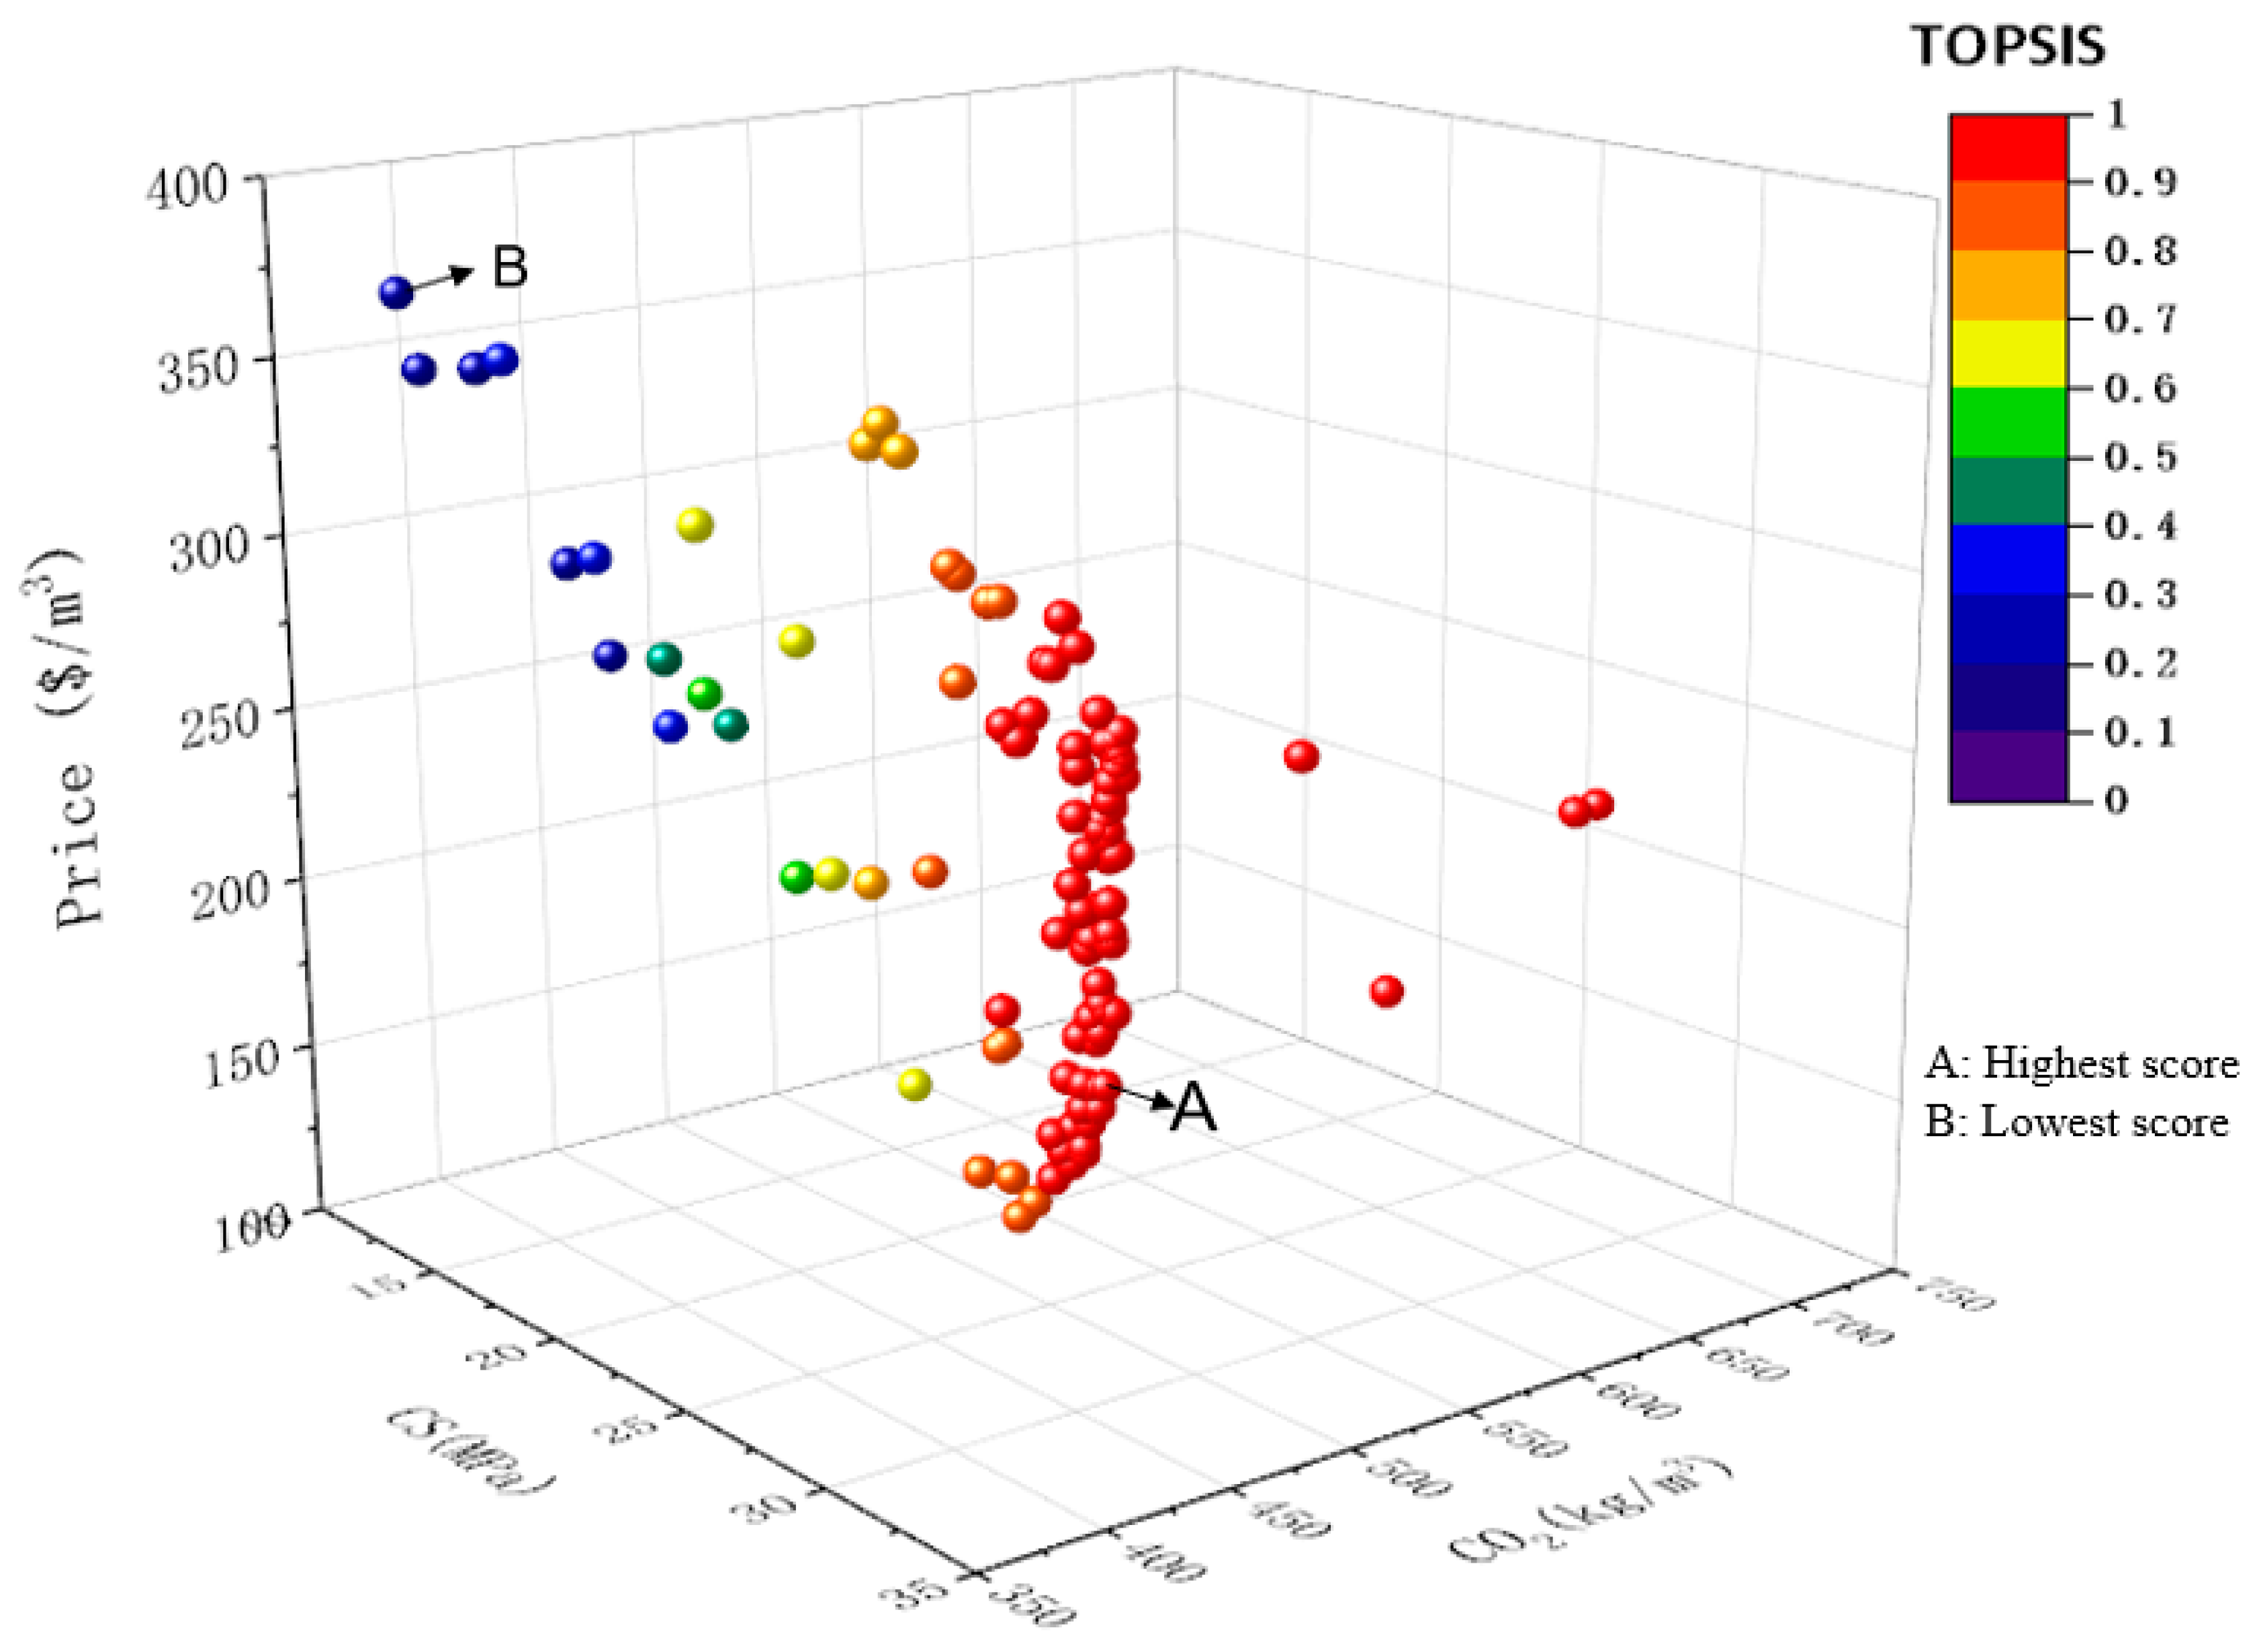
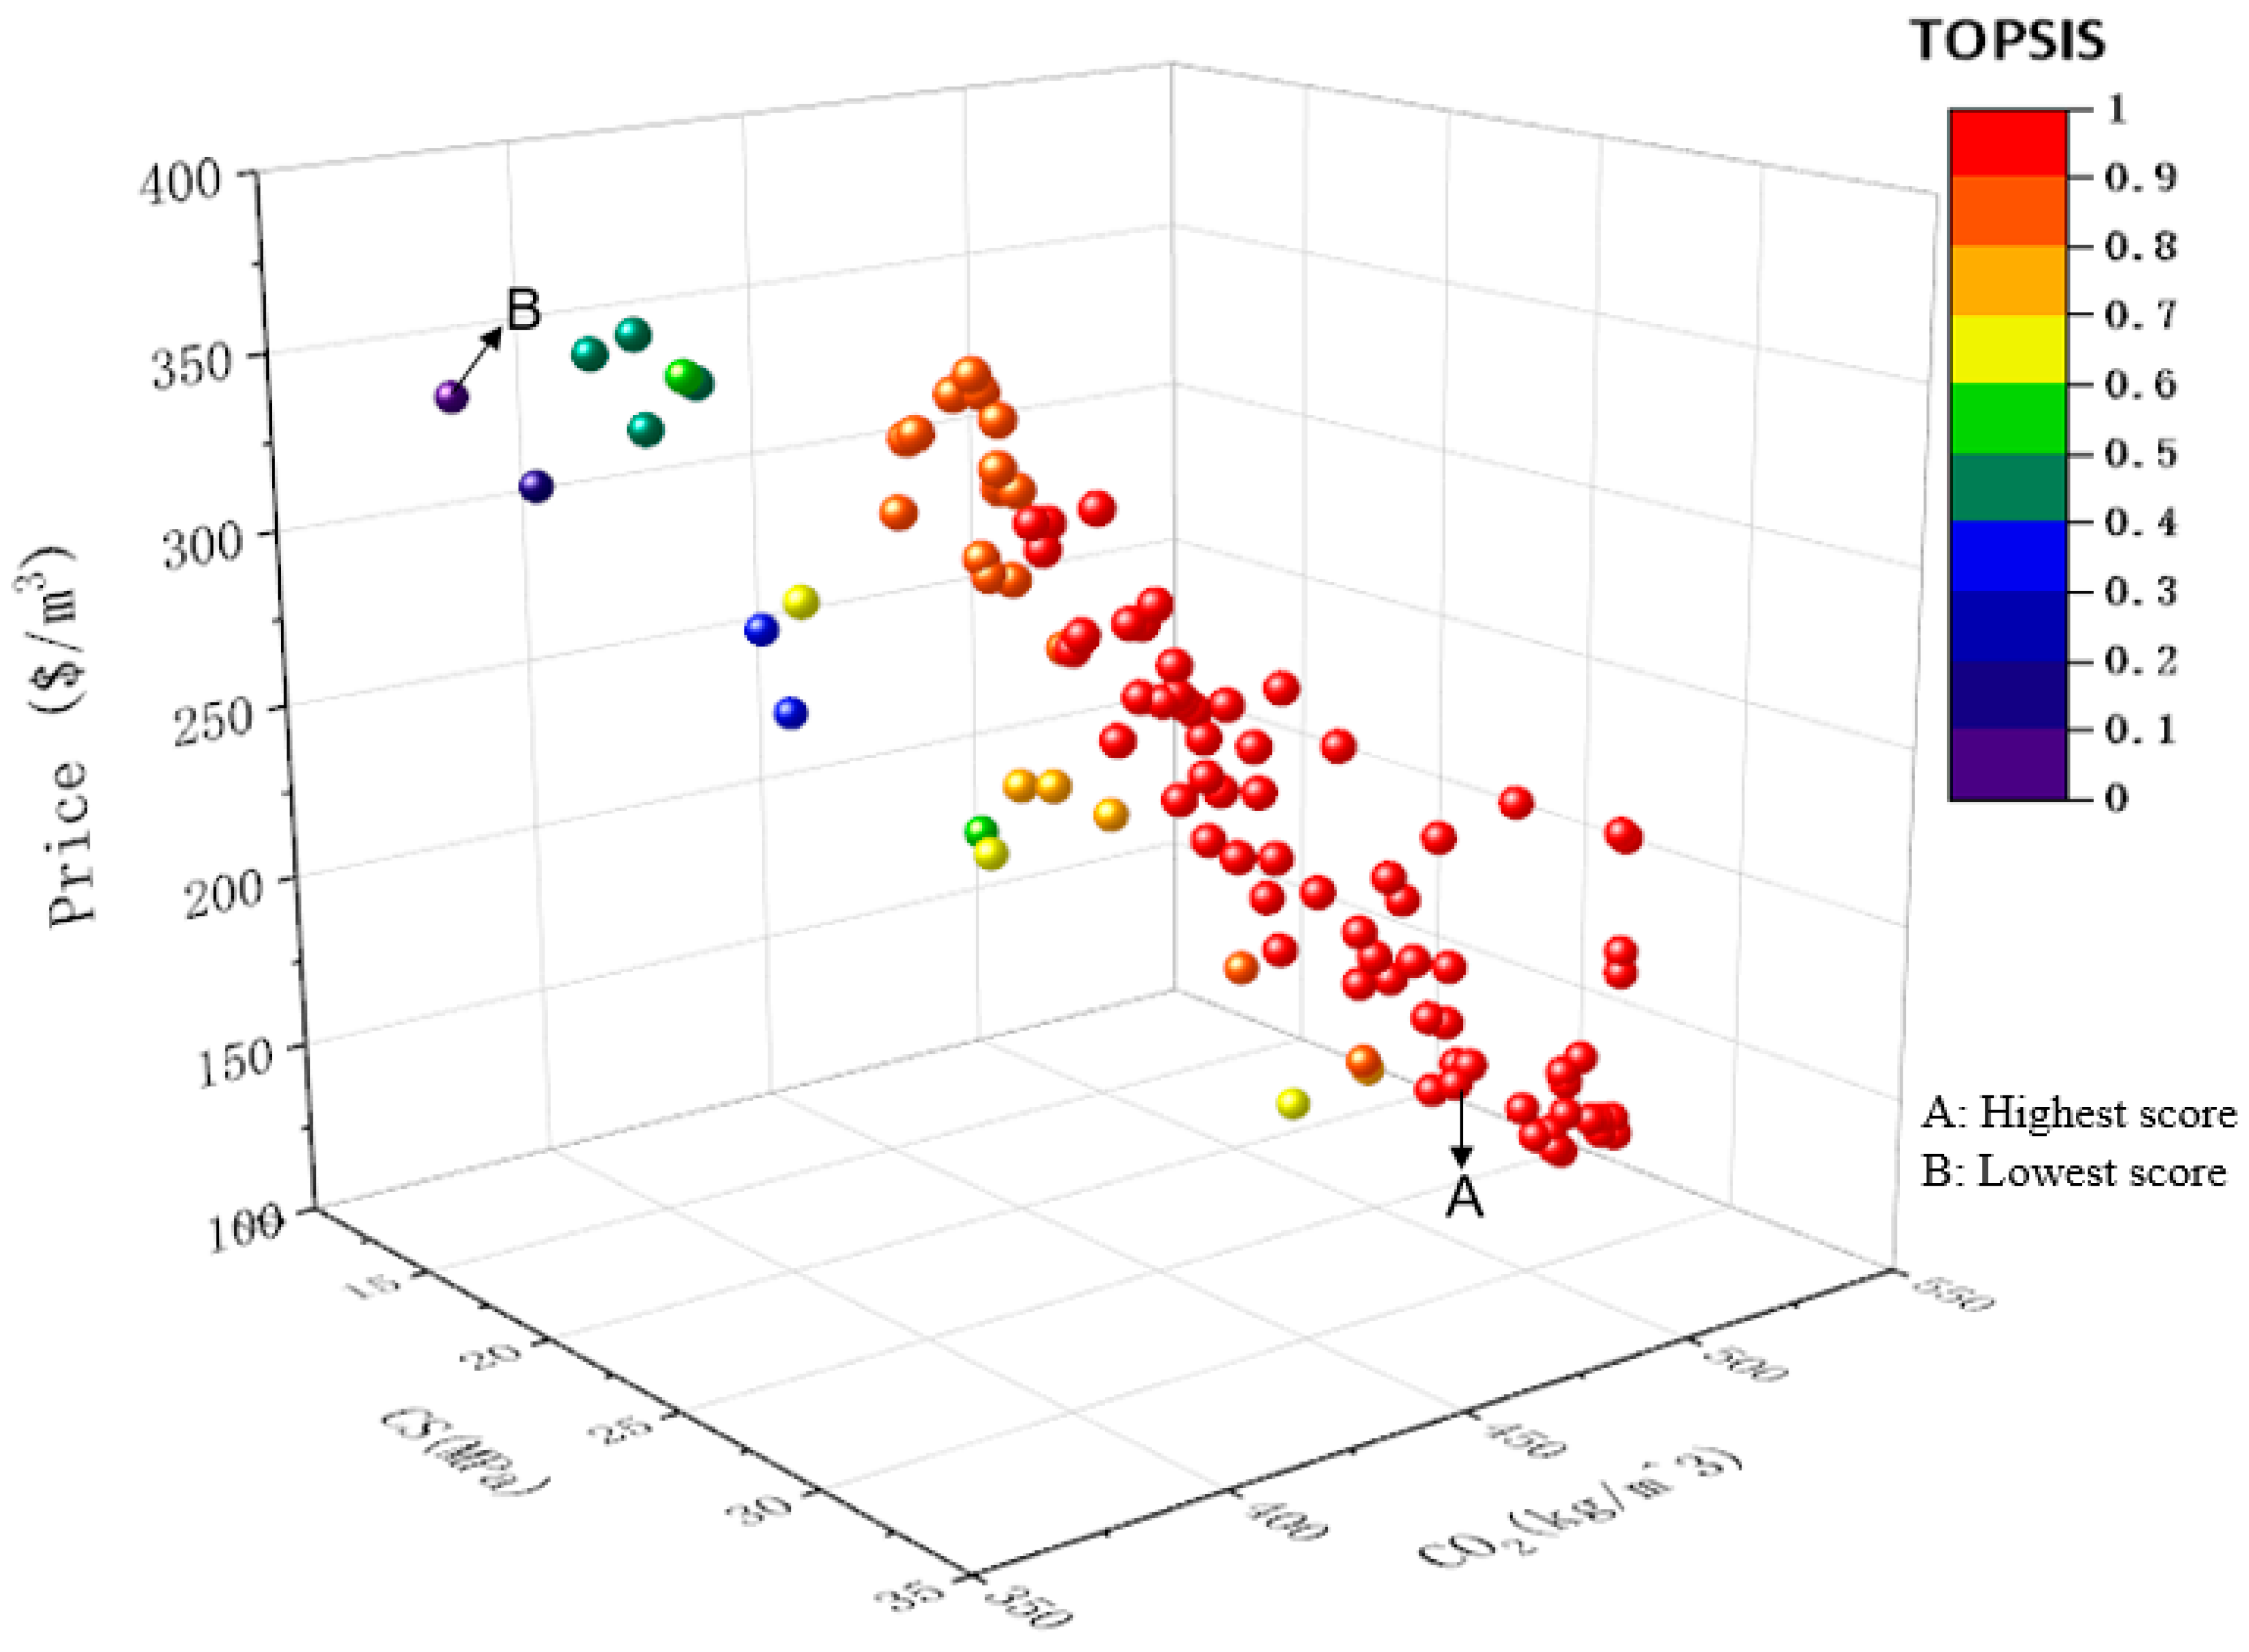
Figure 13 and Figure 14 present the Pareto fronts for the three-objective optimization of compressive strength, density and CO2 emissions. The Pareto solutions show that compressive strength, density and CO2 emissions cannot be optimized independently, and improvement in one objective may lead to compromise in another. For CGACD, the TOPSIS selected solution achieved a compressive strength of 30.867 MPa with a CO2 emission of 476.625 kg/m3. For CGACM, the selected solution achieved a compressive strength of 28.169 MPa with a CO2 emission of 489.785 kg/m3. These results indicate that the MOBAS–TOPSIS framework can identify balanced solutions from the Pareto front under mechanical and environmental constraints. The corresponding mixture proportions and TOPSIS scores are listed in Table 5.

4.3. Physical Interpretation of the Experimental and Optimization Results

The above results indicate that the performance of LCGS is controlled by the combined effects of coal gangue aggregate characteristics, surface pretreatment and mixture proportion. Untreated coal gangue aggregate generally has a porous structure, relatively high water absorption and weak bonding with the cement matrix, which may reduce the compactness of the interfacial transition zone and lead to unstable mechanical performance. After surface pretreatment, silica-fume particles can fill part of the surface pores of coal gangue aggregate and improve the contact condition between the aggregate and cement paste. Meanwhile, the pozzolanic reaction of silica fumes may promote the formation of additional hydration products, which contributes to a denser interfacial transition zone and improved mechanical performance.
The different optimal models and mixture designs for compressive strength, splitting strength and density suggest that these properties are governed by different mechanisms. Compressive strength is mainly related to matrix compactness, aggregate skeleton stability and the quality of the interfacial transition zone. Splitting strength is more sensitive to crack propagation, fibre bridging and aggregate–matrix bonding. Density is mainly affected by coal gangue replacement level, particle size and internal porosity. Therefore, the optimal solutions for different objectives are not identical, which confirms the necessity of multi-objective optimization rather than single-index mixture design.
The Pareto optimization results further reveal the trade-off among mechanical performance, density, cost and CO2 emissions. Increasing cement content can improve strength, but it may also increase cost and carbon emissions. Increasing coal gangue aggregate content can reduce density and promote solid-waste utilization, but excessive replacement may weaken the load-bearing skeleton and reduce strength. Therefore, the optimized mixtures obtained by MOBAS and TOPSIS should be understood as balanced solutions among competing objectives, rather than mixtures with the maximum value of a single performance index.4.1 Machine learning-based prediction results.
It should be noted that the physical interpretation discussed above is mainly inferred from the pretreatment procedures and the observed macroscopic performance of LCGS. Direct mechanistic validation, including water absorption before and after treatment, porosity analysis, ITZ observation and SEM/EDS characterization, was not included in the present algorithm-focused study. Therefore, the discussion on pore filling, surface modification and ITZ improvement should be regarded as a possible explanation rather than direct microstructural verification.

4.4. Technical Implications, Innovation and Limitations of the Proposed Framework

The technical significance of this study lies in integrating surface pretreatment, machine learning prediction and multi-objective optimization into a unified mixture design framework for CGLS. Previous studies have mainly focused on the mechanical properties of coal gangue concrete or the modification effect of coal gangue aggregate. In contrast, the present study further considers the simultaneous optimization of mechanical performance, density, material cost and CO2 emissions. This provides a more comprehensive decision-support method for the sustainable utilization of coal gangue in lightweight shotcrete.
Another important feature of the proposed framework is the use of target-specific surrogate models. Although the dataset contains only 27 independent mixture formulations, the selected machine learning models were used as constrained surrogate models within the investigated experimental domain rather than as universal prediction models. Their use was intended to capture possible nonlinear effects of mixture proportion, aggregate particle size, surface pretreatment and fibre incorporation on LCGS properties, which may not be fully described by simple empirical equations. The results show that BAS–BP performed better for compressive strength prediction, whereas BAS–RF was more suitable for splitting strength and density prediction, indicating that the relationships between mixture variables and different performance indicators are property-dependent. Therefore, selecting the best-performing model for each target property can improve the flexibility of mixture optimization when the predictions are interpreted within the tested material and parameter ranges.
Despite these advantages, several limitations should be acknowledged. First, the complete experimental program generated 756 raw test data values, and each reported value was averaged from three replicate specimens. However, only 27 independent LCGS mixture formulations were used for model development. The replicate measurements were averaged at the formulation level, while the 7-day and 14-day results were used only for early-age performance analysis. As a result, the limited number of independent formulations may still lead to overfitting risk and uncertainty in the reported prediction metrics. Although an internal testing subset, 10-fold cross-validation and empirical regression benchmark models were used to reduce arbitrary model selection and assess model reliability, the small sample size may still lead to overfitting risk and uncertainty in the reported prediction metrics. Therefore, the proposed models should be regarded as constrained surrogate models for interpolation within the investigated material and parameter ranges, rather than as broadly generalizable prediction models. In addition, a formal sensitivity or uncertainty analysis of the Pareto-optimal solutions was not conducted in the present study. Therefore, the Pareto solutions may still be affected by the limited dataset and surrogate-model errors, and the optimized mixtures should be interpreted as preliminary decision-support recommendations within the investigated design space rather than robust global optima. Second, no fully external dataset was available for validating surface-pretreated CGLS, because existing studies differ in aggregate source, pretreatment method, curing condition and mixture design range. Therefore, the proposed models are mainly applicable within the investigated ranges of material proportions, aggregate particle sizes and pretreatment methods. Third, the current optimization mainly considered compressive strength, splitting strength, density, cost and CO2 emissions, while durability-related properties such as rebound rate, shrinkage, permeability and freeze–thaw resistance were not included. Accordingly, the optimized mixtures should be regarded as decision-support recommendations rather than universal optimum mixtures, and further experimental validation is required before large-scale engineering application.

5. Conclusions

This study proposed a BAS-optimized, machine learning-based and multi-objective optimization framework for the mixture design of LCGS incorporating surface-pretreated coal gangue aggregates. The experimental data of compressive strength, splitting strength and density were used to train BP, SVM and RF models. The results showed that BAS–BP provided the best prediction performance for compressive strength, whereas BAS–RF was more suitable for splitting strength and density. This confirms that the relationships between mixture parameters and different performance indicators are property-dependent, and that target-specific surrogate models are beneficial for improving prediction reliability.
The selected surrogate models were further coupled with MOBAS and TOPSIS to optimize the mixture design by considering mechanical properties, density, cost and CO2 emissions. The generated Pareto fronts showed clear trade-offs among these objectives. The TOPSIS-selected mixtures achieved balanced performance rather than the maximum value of a single index, indicating that the proposed framework can support practical mixture selection for coal gangue lightweight shotcrete under mechanical, economic and environmental constraints.
Overall, the integration of surface pretreatment, machine-learning prediction and multi-objective decision-making provides a useful approach for the sustainable utilization of coal gangue in lightweight shotcrete. Nevertheless, the proposed models are mainly applicable within the investigated experimental range because the dataset was obtained from limited laboratory tests and lacked fully external validation. Further studies should expand the database and include durability-related indicators such as rebound rate, shrinkage, permeability and freeze–thaw resistance before large-scale engineering application.

Author Contributions

Conceptualization, W.H. (Wencan Huang) and C.M.; methodology, W.H. (Wencan Huang) and W.D.; software, L.Z.; validation, W.H. (Wei Huang) and Y.W.; formal analysis, L.Z.; investigation, W.H. (Wencan Huang), W.H. (Wenjia Huang) and Q.Z.; resources, Q.Z. and J.L.; data curation, W.H. (Wei Huang) and Y.W.; writing—original draft preparation, W.H. (Wencan Huang); writing—review and editing, W.H. (Wei Huang) and Q.D.; visualization, W.H. (Wenjia Huang) and Q.D.; supervision, W.D. and C.M.; project administration, J.L.; funding acquisition, C.M. All authors have read and agreed to the published version of the manuscript.

Funding

This research was supported by the Hunan Provincial Natural Science Foundation of China—China Construction Fifth Engineering Bureau Joint Fund (Grant No. 2024JJ9075), the Technology Program Project of Jiangsu Provincial Market Supervision Administration (Grant No. KJ2025069) and the Enterprise Joint Fund Project of the Hunan Provincial Natural Science Foundation (Research on Intelligent Recognition of High-Rise Building Construction Progress Based on 4D-BIM and Computer Vision Technology) (Grant No. S2023JJQYLH0355).

Data Availability Statement

All data generated or analyzed during this study are included in this published article.

Acknowledgments

The authors would like to thank the relevant funding organizations for their support.

Conflicts of Interest

Author Wencan Huang, Wei Huang, Wendi Deng and Cai Ming were employed by the company Hunan Construction Engineering Group Co., Ltd. Author Qingxiang Zhao and Lingyu Zhong was employed by the company China Construction Fifth Engineering Bureau Co., Ltd. Author Jianxiong Liao was employed by the company Hunan Construction Investment Group Co., Ltd. The remaining authors declare that the research was conducted in the absence of any commercial or financial relationships that could be construed as a potential conflict of interest.

Appendix A

Table A1. Concrete Mix Proportions and Resultant Mechanical Properties and Density.
IDC
kg/m3
S
kg/m3
W
kg/m3
CGA Size (μm)CGA
kg/m3
PVA Fibre
kg/m3
Pre-TreatmentCompressive Strength
CS (MPa)
Splitting Strength
SS (MPa)
Density (g/cm3)
7d14d28d7d14d28d7d14d28 d
15651243311/00/30.83135.93945.5994.2647.36211.5922.2132.2122.209
25447182991004794/6.3138.51810.8029.57816.31528.5591.9901.9911.991
35447182991004794CGACD8.56713.5708.5439.04417.13223.2902.0502.0461.951
45447182991004794CGACM6.2528.27814.3607.76715.83022.5731.9481.9542.038
55354712941007074/5.7238.74711.63315.32023.54329.1162.0122.0152.005
65354712941007074CGACD7.70110.67414.02712.02920.75028.2362.0362.0501.965
75354712941007074CGACM5.4248.18311.17520.03530.49837.4782.0292.0102.001
85272322901009274/6.5289.47312.33111.34318.69924.5621.9841.9611.959
95272322901009274CGACD7.03110.32613.16317.99724.01833.9752.0011.9762.049
105272322901009274CGACM8.74011.23318.4084.33713.84112.2522.0152.0552.041
115447182992004794/6.11212.73217.10621.15328.03334.2952.0292.0352.035
125447182992004794CGACD3.8605.21821.29615.78123.55835.4651.9421.9232.062
135447182992004794CGACM10.01511.74216.31725.21833.10232.5281.9791.9671.981
145354712942007074/10.48613.64616.77111.04514.48721.3711.9841.9892.001
155354712942007074CGACD1.8902.6633.65911.14319.37926.7151.9191.9391.846
165354712942007074CGACM6.1948.40514.96014.72228.35830.7541.9401.9301.930
175272322902009274/6.1577.8099.85620.38527.68836.2491.8991.9151.928
185272322902009274CGACD1.5812.1685.04024.39432.93235.9571.8231.8411.920
195272322902009274CGACM5.8557.0049.19113.58820.82928.2471.9631.9141.918
205447182995004794/13.05616.54926.15016.55723.23029.6502.0422.0112.057
215447182995004794CGACD4.4675.2687.73418.93024.03142.3471.9331.9341.950
225447182995004794CGACM5.79012.56314.92015.84921.83640.2391.9941.9881.995
235354712945007074/10.96213.48520.51318.18324.97930.0421.9031.8971.914
245354712945007074CGACD4.1585.8336.01816.84722.61236.6061.9501.9411.947
255354712945007074CGACM5.9317.92611.17920.45126.27432.0541.8901.9001.896
265272322905009274/3.4675.9848.54913.88618.46430.8661.8461.8561.855
275272322905009274CGACD4.2605.3418.20612.82819.37032.0871.8441.8991.900
285272322905009274CGACM4.8025.2558.03217.30321.00426.7251.8531.8501.876
Note: The values reported in the table represent the average results of three replicate measurements. Apparent density values are reported in g/cm3; optimization results are reported in kg/m3 after unit conversion.

References

  1. Hao, Y.; Guo, X.; Yao, X.; Han, R.; Li, L.; Zhang, M. Using Chinese Coal Gangue as an Ecological Aggregate and Its Modification: A Review. Materials 2022, 15, 4495. [Google Scholar] [CrossRef] [Scilit]
  2. Koshy, N.; Dondrob, K.; Hu, L.; Wen, Q.; Meegoda, J.N. Synthesis and characterization of geopolymers derived from coal gangue, fly ash and red mud. Constr. Build. Mater. 2019, 206, 287–296. [Google Scholar] [CrossRef] [Scilit]
  3. Li, J.; Wang, J. Comprehensive utilization and environmental risks of coal gangue: A review. J. Clean. Prod. 2019, 239, 117946. [Google Scholar] [CrossRef] [Scilit]
  4. Gao, S.; Zhao, G.; Guo, L.; Zhou, L.; Yuan, K. Utilization of coal gangue as coarse aggregates in structural concrete. Constr. Build. Mater. 2021, 268, 121212. [Google Scholar] [CrossRef] [Scilit]
  5. Hu, L.L. Coal Gangue and its Application Research in Building Materials. Mater. Sci. Forum 2016, 873, 96–104. [Google Scholar]
  6. Qiu, J.; Zhu, M.; Zhou, Y.; Guan, X. Effect and mechanism of coal gangue concrete modification by fly ash. Constr. Build. Mater. 2021, 294, 123563. [Google Scholar] [CrossRef] [Scilit]
  7. Xiao, M.; Ju, F.; He, Z.-Q. Research on shotcrete in mine using non-activated waste coal gangue aggregate. J. Clean. Prod. 2020, 259, 120810. [Google Scholar] [CrossRef] [Scilit]
  8. Ma, D.; Gao, X.; Zhang, J. Co-exploitation of mine-derived geothermal energy: Recent advances and emerging perspectives. GeoEnergy Commun. 2025, 1, 12. [Google Scholar] [CrossRef] [Scilit]
  9. Wu, J.; Sun, M.; Zhang, H.; Lu, Y.; Zhang, B.; Yin, Q.; Ma, D.; Wu, J.; Pu, H. Methylcellulose mediates dispersion of cellulose nanofibers for high-strength and sustainable cemented rockfill. J. Clean. Prod. 2025, 537, 147211. [Google Scholar] [CrossRef] [Scilit]
  10. Shi, T.; Liu, Y.; Zhao, X.; Wang, J.; Zhao, Z.; Corr, D.J.; Shah, S.P. Study on mechanical properties of the interfacial transition zone in carbon nanofiber-reinforced cement mortar based on the PeakForce tapping mode of atomic force microscope. J. Build. Eng. 2022, 61, 105248. [Google Scholar] [CrossRef] [Scilit]
  11. Evangelista, L.; de Brito, J. Durability performance of concrete made with fine recycled concrete aggregates. Cem. Concr. Compos. 2010, 32, 9–14. [Google Scholar] [CrossRef] [Scilit]
  12. Chen, L.; Chen, Z.; Xie, Z.; Wei, L.; Hua, J.; Huang, L.; Yap, P.-S. Recent developments on natural fiber concrete: A review of properties, sustainability, applications, barriers, and opportunities. Dev. Built Environ. 2023, 16, 100255. [Google Scholar] [CrossRef] [Scilit]
  13. Meng, Y.F.; Sun, Q.H.; Ma, R.T. Study of Properties of Concrete with Mineral Materials of Gangue. Appl. Mech. Mater. 2011, 99–100, 318–326. [Google Scholar]
  14. Liu, Q.; Wang, Y.; Wang, T.; Duan, K.; Zhang, F.; Chen, L.; Su, K.-L.R. Probabilistic distribution and temporal variation of non-uniform corrosion in reinforced concrete under chlorine environment. J. Build. Eng. 2025, 118, 115018. [Google Scholar] [CrossRef] [Scilit]
  15. Han, S.; Liu, Y.; Weng, K.; Xiao, G.; Li, Z.; Yu, J.; Ou, J. Efficient combination of steel-FRP composite bar and seawater sea-sand ECC permanent formwork for high-performance slabs: Experimental and analytical investigation. Constr. Build. Mater. 2026, 506, 144951. [Google Scholar] [CrossRef] [Scilit]
  16. Penttala, V.; Al-Neshawy, F. Stress and strain state of concrete during freezing and thawing cycles. Cem. Concr. Res. 2002, 32, 1407–1420. [Google Scholar] [CrossRef] [Scilit]
  17. Huang, M.; Duan, J.; Wang, J. Research on Basic Mechanical Properties and Fracture Damage of Coal Gangue Concrete Subjected to Freeze-Thaw Cycles. Adv. Mater. Sci. Eng. 2021, 2021, 6701628. [Google Scholar] [CrossRef] [Scilit]
  18. Bouzar, B.; Mamindy-Pajany, Y. Manufacture and characterization of carbonated lightweight aggregates from waste paper fly ash. Powder Technol. 2022, 406, 117583. [Google Scholar] [CrossRef] [Scilit]
  19. Qiu, J.; Liu, Y.; Li, L.; Lei, T.; Zhang, T.; Zhang, Z.; Bai, J. Study on frost resistance and deterioration law of manufactured sand coal gangue concrete. Constr. Build. Mater. 2025, 470, 140544. [Google Scholar] [CrossRef] [Scilit]
  20. Huang, J.; Yang, X.; Peng, L.; Zhang, L.; Xie, Y. Freeze–Thaw Damage Mechanism and Performance of Coal Gangue Concrete. J. Mater. Civ. Eng. 2025, 37, 04025003. [Google Scholar] [CrossRef] [Scilit]
  21. Qiu, J.; Zhou, Y.; Vatin, N.I.; Guan, X.; Sultanov, S.; Khemarak, K. Damage constitutive model of coal gangue concrete under freeze-thaw cycles. Constr. Build. Mater. 2020, 264, 120720. [Google Scholar] [CrossRef] [Scilit]
  22. Guo, W.; Li, D.; Chen, J.; Yang, N. Structure and pozzolanic activity of calcined coal gangue during the process of mechanical activation. J. Wuhan Univ. Technol.-Mater. Sci. Ed. 2009, 24, 326–329. [Google Scholar] [CrossRef] [Scilit]
  23. Zhou, M.; Dou, Y.; Zhang, Y.; Zhang, Y.; Zhang, B. Effects of the variety and content of coal gangue coarse aggregate on the mechanical properties of concrete. Constr. Build. Mater. 2019, 220, 386–395. [Google Scholar] [CrossRef] [Scilit]
  24. Guo, W.; Zhu, J.; Li, D.; Chen, J.; Yang, N. Early hydration of composite cement with thermal activated coal gangue. J. Wuhan Univ. Technol.-Mater. Sci. Ed. 2010, 25, 162–166. [Google Scholar] [CrossRef] [Scilit]
  25. Cheng, Y.; Hongqiang, M.; Hongyu, C.; Jiaxin, W.; Jing, S.; Zonghui, L.; Mingkai, Y. Preparation and characterization of coal gangue geopolymers. Constr. Build. Mater. 2018, 187, 318–326. [Google Scholar] [CrossRef] [Scilit]
  26. Han, J.Y.; Song, X.Y.; Gao, Z.H. Excitation Effect of Soluble Glass on Composite System with Calcined Coal Gangue and Slag. Appl. Mech. Mater. 2012, 174–177, 30–34. [Google Scholar]
  27. Li, Y.; Yao, Y.; Liu, X.; Sun, H.; Ni, W. Improvement on pozzolanic reactivity of coal gangue by integrated thermal and chemical activation. Fuel 2013, 109, 527–533. [Google Scholar] [CrossRef] [Scilit]
  28. Sasanipour, H.; Aslani, F. Durability assessment of concrete containing surface pretreated coarse recycled concrete aggregates. Constr. Build. Mater. 2020, 264, 120203. [Google Scholar] [CrossRef] [Scilit]
  29. Katz, A. Treatments for the Improvement of Recycled Aggregate. J. Mater. Civ. Eng. 2004, 16, 597–603. [Google Scholar] [CrossRef] [Scilit]
  30. Li, W.; Xiao, J.; Sun, Z.; Kawashima, S.; Shah, S.P. Interfacial transition zones in recycled aggregate concrete with different mixing approaches. Constr. Build. Mater. 2012, 35, 1045–1055. [Google Scholar] [CrossRef] [Scilit]
  31. Güneyisi, E.; Gesoğlu, M.; Algın, Z.; Yazıcı, H. Effect of surface treatment methods on the properties of self-compacting concrete with recycled aggregates. Constr. Build. Mater. 2014, 64, 172–183. [Google Scholar] [CrossRef] [Scilit]
  32. Dilbas, H.; Çakır, Ö. Physical and mechanical properties of treated recycled aggregate concretes: Combination of mechanical treatment and silica fume. J. Mater. Civ. Eng. 2021, 33, 04021096. [Google Scholar] [CrossRef] [Scilit]
  33. Chen, P.; Zhang, L.; Wang, Y.; Fang, Y.; Zhang, F.; Xu, Y. Environmentally friendly utilization of coal gangue as aggregates for shotcrete used in the construction of coal mine tunnel. Case Stud. Constr. Mater. 2021, 15, e00751. [Google Scholar] [CrossRef] [Scilit]
  34. Zhang, B.; Tan, H.; Shen, W.; Xu, G.; Ma, B.; Ji, X. Nano-silica and silica fume modified cement mortar used as Surface Protection Material to enhance the impermeability. Cem. Concr. Compos. 2018, 92, 7–17. [Google Scholar] [CrossRef] [Scilit]
  35. Yang, J.; Su, Y.; He, X.; Tan, H.; Jiang, Y.; Zeng, L.; Strnadel, B. Pore structure evaluation of cementing composites blended with coal by-products: Calcined coal gangue and coal fly ash. Fuel Process. Technol. 2018, 181, 75–90. [Google Scholar] [CrossRef] [Scilit]
  36. Wang, M.; Yang, X.; Wang, W. Establishing a 3D aggregates database from X-ray CT scans of bulk concrete. Constr. Build. Mater. 2022, 315, 125740. [Google Scholar] [CrossRef] [Scilit]
  37. Xiao, C.; Zheng, K.; Chen, S.; Li, N.; Shang, X.; Wang, F.; Liang, J.; Khan, S.B.; Shen, Y.; Lu, B.; et al. Additive manufacturing of high solid content lunar regolith simulant paste based on vat photopolymerization and the effect of water addition on paste retention properties. Addit. Manuf. 2023, 71, 103607. [Google Scholar] [CrossRef] [Scilit]
  38. Wang, X.; Li, X.; Zhong, Y.; Li, H.; Wang, J. Properties and microstructure of an interfacial transition zone enhanced by silica fume in concrete prepared with coal gangue as an aggregate. ACS Omega 2023, 9, 1870–1880. [Google Scholar] [CrossRef] [Scilit]
  39. Qiu, J.; Xing, M.; Yang, Z.; Zhang, C.; Guan, X. Micro-pore structure characteristics and macro-mechanical properties of PP fibre reinforced coal gangue ceramsite concrete. J. Eng. 2020, 2020, 1192–1197. [Google Scholar] [CrossRef] [Scilit]
  40. Sun, J.; Liu, S.; Ma, Z.; Wang, D.; Wang, Y.; Zhao, H.; Huang, B.; Saafi, M.; Wang, X. 3D printed lightweight concrete containing surface pretreated coal gangue. Case Stud. Constr. Mater. 2024, 20, e02906. [Google Scholar] [CrossRef] [Scilit]
  41. Açikgenç, M.; Ulaş, M.; Alyamaç, K.E. Using an artificial neural network to predict mix compositions of steel fiber-reinforced concrete. Arab. J. Sci. Eng. 2015, 40, 407–419. [Google Scholar] [CrossRef] [Scilit]
  42. Armaghani, D.J.; Mirzaei, F.; Shariati, M.; Trung, N.T.; Shariati, M.; Trnavac, D. Hybrid ANN-based techniques in predicting cohesion of sandy-soil combined with fiber. Geomech. Eng 2020, 20, 191–205. [Google Scholar]
  43. Sun, J.; Zhang, J.; Gu, Y.; Huang, Y.; Sun, Y.; Ma, G. Prediction of permeability and unconfined compressive strength of pervious concrete using evolved support vector regression. Constr. Build. Mater. 2019, 207, 440–449. [Google Scholar] [CrossRef] [Scilit]
  44. Burges, C.J. A tutorial on support vector machines for pattern recognition. Data Min. Knowl. Discov. 1998, 2, 121–167. [Google Scholar] [CrossRef] [Scilit]
  45. Li, H.; Xu, B.; Lu, G.; Du, C.; Huang, N. Multi-objective optimization of PEM fuel cell by coupled significant variables recognition, surrogate models and a multi-objective genetic algorithm. Energy Convers. Manag. 2021, 236, 114063. [Google Scholar] [CrossRef] [Scilit]
  46. Salehi, H.; Burgueño, R. Emerging artificial intelligence methods in structural engineering. Eng. Struct. 2018, 171, 170–189. [Google Scholar] [CrossRef] [Scilit]
  47. Chou, J.-S.; Tsai, C.-F. Concrete compressive strength analysis using a combined classification and regression technique. Autom. Constr. 2012, 24, 52–60. [Google Scholar] [CrossRef] [Scilit]
  48. Xu, D.-S.; Huang, M.; Zhou, Y. One-dimensional compression behavior of calcareous sand and marine clay mixtures. Int. J. Geomech. 2020, 20, 04020137. [Google Scholar] [CrossRef] [Scilit]
  49. Schapire, R.E. The boosting approach to machine learning: An overview. In Nonlinear Estimation and Classification; Springer: New York, NY, USA, 2003; pp. 149–171. [Google Scholar] [CrossRef] [Scilit]
  50. Liang, G.; Zhu, X.; Zhang, C. An empirical study of bagging predictors for different learning algorithms. In Proceedings of the AAAI Conference on Artificial Intelligence, San Francisco, CA, USA, 7–11 August 2011; pp. 1802–1803. [Google Scholar]
  51. Ju, Y.; Shen, T.; Wang, D. Bonding behavior between reactive powder concrete and normal strength concrete. Constr. Build. Mater. 2020, 242, 118024. [Google Scholar] [CrossRef] [Scilit]
  52. Chou, J.-S.; Ngo, N.-T.; Pham, A.-D. Shear strength prediction in reinforced concrete deep beams using nature-inspired metaheuristic support vector regression. J. Comput. Civ. Eng. 2016, 30, 04015002. [Google Scholar] [CrossRef] [Scilit]
  53. Yu, Y.; Zhang, C.; Gu, X.; Cui, Y. Expansion prediction of alkali aggregate reactivity-affected concrete structures using a hybrid soft computing method. Neural Comput. Appl. 2019, 31, 8641–8660. [Google Scholar] [CrossRef] [Scilit]
  54. Jiang, X.; Li, S. BAS: Beetle antennae search algorithm for optimization problems. arXiv 2017, arXiv:1710.10724. [Google Scholar] [CrossRef] [Scilit]
  55. Sun, J.; Lin, S.; Zhang, G.; Sun, Y.; Zhang, J.; Chen, C.; Morsy, A.M.; Wang, X. The effect of graphite and slag on electrical and mechanical properties of electrically conductive cementitious composites. Constr. Build. Mater. 2021, 281, 122606. [Google Scholar] [CrossRef] [Scilit]
  56. Smola, A.; Schölkopf, B. A tutorial on support vector regression. Stat. Comput. 2004, 14, 199–222. [Google Scholar] [CrossRef] [Scilit]
  57. Liu, K.; Zheng, J.; Dong, S.; Xie, W.; Zhang, X. Mixture optimization of mechanical, economical, and environmental objectives for sustainable recycled aggregate concrete based on machine learning and metaheuristic algorithms. J. Build. Eng. 2023, 63, 105570. [Google Scholar] [CrossRef] [Scilit]
  58. Yang, X.-S. Engineering Optimization: An Introduction with Metaheuristic Applications; John Wiley & Sons: Hoboken, NJ, USA, 2010. [Google Scholar]
  59. Zhang, J.; Huang, Y.; Ma, G.; Nener, B. Multi-objective beetle antennae search algorithm. arXiv 2020, arXiv:2002.10090. [Google Scholar] [CrossRef] [Scilit]
  60. Sun, Y.; Zhang, J.; Li, G.; Wang, Y.; Sun, J.; Jiang, C. Optimized neural network using beetle antennae search for predicting the unconfined compressive strength of jet grouting coalcretes. Int. J. Numer. Anal. Methods Geomech. 2019, 43, 801–813. [Google Scholar] [CrossRef] [Scilit]
  61. Zhang, J.; Huang, Y.; Wang, Y.; Ma, G. Multi-objective optimization of concrete mixture proportions using machine learning and metaheuristic algorithms. Constr. Build. Mater. 2020, 253, 119208. [Google Scholar] [CrossRef] [Scilit]
  62. Hu, Y.; Weng, Y.; Chi, H.; Hu, L.; Peng, H.; Liang, J.; Zhou, F.; Huang, W.; Xie, W. Multi-Objective Intelligent Optimization Design Method Based on NSGA-II High Performance Concrete Mix Proportion. Bull. Chin. Ceram. Soc. 2024, 43, 3645. [Google Scholar]
  63. Ahlawat, A.; Phogat, A.; Punia, U.; Chhikara, A.; Dhingra, A.K.; Garg, R.K.; Sahdev, R.K.; Chhabra, D. Innovative Optimization of Mechanical Performance in Carbon Fiber-Reinforced Nylon Composite Using Artificial Neural Networks and Multi-Objective Genetic Algorithms. J. Mater. Eng. Perform. 2025, 34, 23031–23044. [Google Scholar] [CrossRef] [Scilit]
  64. Sun, J.; Liu, S.; Ma, Z.; Qian, H.; Wang, Y.; Al-azzani, H.; Wang, X. Mechanical properties prediction of lightweight coal gangue shotcrete. J. Build. Eng. 2023, 80, 108088. [Google Scholar] [CrossRef] [Scilit]
  65. Wang, J.; Chen, H. BSAS: Beetle swarm antennae search algorithm for optimization problems. arXiv 2018, arXiv:1807.10470. [Google Scholar] [CrossRef] [Scilit]
  66. Hsu, C.-W.; Chang, C.-C.; Lin, C.-J. A Practical Guide to Support Vector Classification. 2003. Available online: http://www.csie.ntu.edu.tw/~cjlin/papers/guide/guide.pdf (accessed on 14 May 2026).
Figure 1. Construction of the RF model [64].
Infrastructures 11 00184 g001
Figure 2. 10-fold cross validation.
Infrastructures 11 00184 g002
Figure 3. Models’ prediction performance for compressive strength.
Infrastructures 11 00184 g003
Figure 4. Performance of BP model optimized with BAS algorithm for CS.
Infrastructures 11 00184 g004
Figure 5. Models’ prediction performance for splitting strength.
Infrastructures 11 00184 g005
Figure 6. Performance of RF model optimized with BAS algorithm for SS.
Infrastructures 11 00184 g006
Figure 7. Models’ prediction performance for density.
Infrastructures 11 00184 g007
Figure 8. Performance of RF model optimized with BAS algorithm for density.
Infrastructures 11 00184 g008
Figure 9. Pareto front based on CS, density and price of LCGS with CGACD.
Infrastructures 11 00184 g009
Figure 10. Pareto front based on CS, density and price of LCGS with CGACM.
Infrastructures 11 00184 g010
Figure 11. Pareto front based on SS, density and price of LCGS with CGACD.
Infrastructures 11 00184 g011
Figure 12. Pareto front based on SS, density and price of LCGS with CGACM.
Infrastructures 11 00184 g012
Figure 13. Pareto front based on CS, density and CO2 of LCGS with CGACD.
Infrastructures 11 00184 g013
Figure 14. Pareto front based on CS, density and CO2 of LCGS with CGACM.
Infrastructures 11 00184 g014
Table 1. The unit cost of each variable of LCGS.
VariablesNotationUnit Price ($/kg)Unit Weight (kg/m3)
Cement C c 0.04673100
Sand C s 0.40002450
Water C W 0.000241000
CGA C C G 0 *2100
PVA fibre C F 2.86001030
* The zero cost assigned to CGA refers only to the raw coal gangue waste material.
Table 2. The constraints of LCGS input variables.
VariablesExpressionsLower BoundUpper Bound
Cement C (kg/m3)527565
Sand S (kg/m3)2321243
Water W (kg/m3)290311
CGA C G (kg/m3)0927
Fibre F (kg/m3)44
Sand-to-cement ratio C S / C c 0.442.20
Water-to-cement ratio C W / C c 0.500.60
CGA-to-cement ratio C C G / C c 01.80
Table 3. Mixture proportions of Pareto solutions of LCGS.
CGACDCGACM
MixtureABAB
C564.814527.000556.023563.291
S277.7551019.614634.815278.533
W310.536290.000290.003311.000
CGA particles76.56999.261300.502499.775
CGA735.359409.996562.068818.268
Fibre4444
CS (MPa)40.5519.90335.80411.327
Density (kg/m3)1985189619531939
Price ($/m3)148.994412.881291.399149.244
TOPSIS score10.06510.343
Table 4. Mixture proportions of Pareto solutions of LCGS.
CGACDCGACM
MixtureABAB
C552.876527.000552.448554.408
S600.234899.194651.9361078.334
W304.118290.000304.404307.478
CGA particle500.000380.246491.19151.648
CGA735.359480.031519.429146.306
Fibre4444
SS (MPa)34.40129.51535.14720.561
Density (kg/m3)1966193019471947
Price ($/m3)277.413273.501298.105486.734
TOPSIS score10.35010.052
Table 5. Mixture proportions of Pareto solutions of LCGS.
CGACDCGACM
MixtureABAB
C561.721528.713538.045529.69
S351.2771019.764399.9881155.514
W310.507309.771292.950294.637
CGA particle57.529146.587261.309175.041
CGA915.018878.484775.109845.145
Fibre4444
CS (MPa)30.86712.39528.16913.184
CO2 (kg/m3)476.62493374.9781489.785370.6711
Price ($/m3)166.314273.501196.632371.768
TOPSIS score10.08710.201
Disclaimer/Publisher’s Note: The statements, opinions and data contained in all publications are solely those of the individual author(s) and contributor(s) and not of MDPI and/or the editor(s). MDPI and/or the editor(s) disclaim responsibility for any injury to people or property resulting from any ideas, methods, instructions or products referred to in the content.