Article

Explainable Hybrid Intelligence for Predicting Tunnel Water Inrush Quantity Under Small-Sample, High-Heterogeneity Conditions: GAN Augmentation and Swarm-Optimized CatBoost

1
School of Resources and Safety Engineering, Central South University, Changsha 410083, China
2
Hunan Zhantong Technology Group Co., Ltd., Changsha 410221, China
*
Author to whom correspondence should be addressed.
Infrastructures 2026, 11(6), 183; https://doi.org/10.3390/infrastructures11060183

Submission received: 16 February 2026 / Revised: 10 May 2026 / Accepted: 20 May 2026 / Published: 25 May 2026
(This article belongs to the Special Issue Advances in Artificial Intelligence for Geotechnical Engineering)

Abstract

This study aims to explore a leakage-aware and explainable machine learning framework for predicting tunnel water inrush quantity (WIQ) under small-sample and high-heterogeneity geological conditions. A project-level dataset was compiled at a fixed spatial granularity of 30 m per excavation segment by integrating forward prospecting outputs, construction-face observations, and geological reports, and six hydrogeological–structural indicators were used to predict the water inflow rate in cubic meters per hour. To overcome data scarcity and improve generalization, a tabular generative adversarial network (GAN) was introduced to augment the training distribution while preserving marginal statistics and inter-variable dependence, and a swarm-intelligence optimizer was employed to tune a Categorical Boosting (CatBoost) regressor for stable performance. In addition, six mainstream tree-based learners were benchmarked under a unified protocol, and model transparency was ensured through a multi-level interpretability suite combining SHapley Additive exPlanations (SHAP) attribution, partial dependence with individual conditional expectation (ICE) diagnostics, and interaction surfaces. Results show that, under the present fixed split, training-set augmentation was associated with improved performance for the evaluated baseline learners, and the proposed hybrid model achieved encouraging hold-out accuracy. However, because the dataset contains only 55 real samples and the test set contains only 11 real samples, the reported performance should be interpreted as an initial project-specific indication rather than robust evidence of generalizable reliability. Interpretability analyses further identify lithologic and reflector-related factors as dominant drivers, and reveal nonlinear response patterns and interaction-sensitive high-risk regions. Overall, the proposed framework shows potential to improve predictive performance and engineering interpretability for the studied project, and may provide a useful reference for drainage and reinforcement planning. Further confirmation through repeated data splitting, additional samples, and external validation is still needed before broader application.

1. Introduction

Tunnel water inrush remains one of the most disruptive hazards in underground construction because it can escalate within minutes from seepage to sudden flooding, triggering face instability, equipment loss, schedule interruption, and cascading safety–environmental consequences [1,2]. In practice, reliable forecasting is intrinsically difficult: WIQ is governed by tightly coupled hydrogeological, lithological, structural, and geometric controls, while field observations are often sparse, spatially clustered, and non-stationary along the excavation direction [3]. These characteristics create a “small-sample–high-heterogeneity” regime in which both the physical mechanism and the data distribution can shift abruptly as the face advances into new strata, fracture networks, or groundwater recharge conditions.
Conventional approaches to water inrush assessment have historically relied on a combination of geological investigation, advanced prospecting, and mechanism-informed judgment. Ahead-of-face detection technologies (e.g., seismic or radar-based prospecting and related hydrogeological interpretation) can provide direct evidence of unfavorable zones and enable timely countermeasures, yet their effectiveness is constrained by resolution limits, interpretation uncertainty, and the difficulty of translating qualitative signatures into quantitative WIQ forecasts under complex stratigraphy [4,5]. Empirical or semi-empirical formulas offer rapid estimates with low computational cost, but their parameters are typically calibrated for specific sites and assumptions; as a result, they can be sensitive to local geological differences and may underperform when the dominant inflow mechanism changes (e.g., from diffuse seepage to conduit-controlled flow) [1,2]. Numerical simulations can explicitly represent seepage–stress coupling and heterogeneous media, supporting mechanism exploration and scenario testing; however, their practical adoption for real-time construction decisions is limited by the need for detailed boundary/constitutive inputs, calibration burden, and computational expense, especially when uncertainty and spatial variability must be considered [5,6].
To improve decision support under multi-factor uncertainty, multi-criteria decision-making and knowledge-driven evaluation frameworks have also been widely explored. By organizing indicators into structured hierarchies and aggregating them through weighting and compromise rules, these methods can provide interpretable risk grades and engineering-friendly narratives. For example, recent work has combined methods such as VIKOR with integrated weighting strategies to assess karst tunnel water inrush risk, highlighting their interpretability and adaptability in multi-indicator settings. Nevertheless, knowledge-driven systems often depend strongly on subjective weights and fixed rule structures; they may struggle to capture nonlinear coupling and sudden response characteristics among indicators when conditions evolve rapidly during excavation, which can lead to delayed or less accurate assessments in complex settings. These limitations have motivated hybrid “knowledge–data” strategies, and the need to better model spatiotemporal evolution has been increasingly emphasized (e.g., by incorporating time-series and spatial features via dynamic Bayesian networks or spatiotemporal graph neural networks).
More recently, data-driven artificial intelligence (AI) approaches—particularly machine learning (ML)—have gained momentum for tunnel water inflow/inrush prediction because they can learn nonlinear mappings from monitoring indicators to inflow responses without prescribing explicit constitutive forms [1,4,5,6]. Prior studies (see Table 1) have demonstrated that ML models can outperform simple baselines when sufficient and diverse data are available; however, the literature also notes that AI-based prediction of tunnel water inflow is still in an early stage, with three interconnected and unsolved core limitations in practical application: (i) sample scarcity and sampling bias induce overfitting, and existing data augmentation methods (e.g., simple resampling, noise injection) either distort the hydrogeological physical correlation between variables or lack customization for tabular hydrogeological–structural data of tunnels, failing to fundamentally solve the generalization problem for high-heterogeneity excavation segments; (ii) hyperparameter tuning relies on empirical trial-and-error or generic optimizers without systematic benchmark testing for the rugged non-convex search space of tunnel engineering data, leading to unstable model performance on unseen segments; and (iii) interpretability is either absent or limited to a single method (e.g., only SHAP importance), and the data-driven interpretation results are decoupled from the geological and hydrogeological mechanisms of tunnel water inrush, making it impossible to translate model outputs into actionable engineering mitigation decisions. Notably, existing studies mostly focus on a single technical improvement (e.g., only GAN augmentation, only optimizer-based model tuning, or only simple interpretability analysis), and there is a lack of an end-to-end synergistic optimization framework tailored to the “small-sample, high-heterogeneity” core characteristics of tunnel water inrush prediction. However, a direct combination of existing techniques without sufficient scenario-oriented adaptation may limit reproducibility and engineering usability in tunnel WIQ prediction (Table 1). For example, most studies in Table 1 lack interpretability, and the few with interpretability only use a single method without combining engineering mechanisms; the studies with optimization algorithms select generic optimizers without systematic performance verification, and the sample size of most studies is small but without effective and customized data augmentation strategies.
To address the above fundamental limitations of fragmented technical integration and poor engineering adaptability in existing research, this study proposes an end-to-end hybrid intelligence framework for predicting tunnel WIQ under small-sample, high-heterogeneity field conditions. Rather than claiming a fundamentally new method, the framework emphasizes scenario-oriented integration and coordinated adaptation of existing techniques to the hydrogeological characteristics and engineering needs of drill-and-blast tunneling. The dataset is constructed at a fixed spatial granularity (30 m excavation segments) and synthesizes complementary sources including tunnel advanced prediction information, construction-plane observations, and geological reports; six inputs—the reflector distribution coefficient (RDC), groundwater development coefficient (GDC), attitude of rock (AR), fracture opening (FO), stratum lithologic coefficient (SLC), and tunnel depth (TD)—are used to predict WIQ (m3/h). The main contributions of the framework are reflected in four aspects: First, aiming at the tabular characteristics of tunnel hydrogeological data and the need to preserve physical correlation, we propose a distribution-fidelity-guided tabular GAN augmentation strategy trained on the joint feature–target space, which augments only the training set to reduce the risk of information leakage and aims to preserve the main hydrogeological characteristics of the studied tunnel, thereby alleviating sample scarcity while maintaining practical interpretability of the data. Second, for the rugged non-convex hyperparameter search space of tunnel engineering data, we adopt a benchmark-based and scenario-oriented procedure for the optimizer selection paradigm, systematically comparing three enhanced PSO variants and selecting the optimal AsyLnCPSO to tune the CatBoost regressor, which supports scenario-adapted hyperparameter tuning for tunnel water inrush prediction and improves model stability under heterogeneous conditions. Third, to better relate data-driven interpretation to engineering understanding, we incorporate a multi-level interpretability suite integrating SHAP, PDP/ICE, and 3D PDP interaction surfaces, which not only quantifies the feature importance and nonlinear response patterns but also links the interpretation results to the geological and hydrogeological mechanisms of tunnel water inrush, transforming the “black-box” model into an explainable decision-support component consistent with engineering practice. Fourth, this study designs a leakage-aware and structured experimental pipeline for the present dataset setting, including a fixed 80/20 train–test split, training-set-only augmentation, 5-fold cross-validation for hyperparameter tuning within the augmented training data, and multi-metric evaluation. This design improves procedural transparency and reduces the most direct risk of test set contamination. Nevertheless, because the main evaluation still relies on a single fixed split and a small real hold-out set, it should not be regarded as a full robustness validation.

2. Research Methodology

2.1. Optimize Algorithm

This study employs swarm-intelligence optimizers for CatBoost hyperparameter tuning under small-sample tunnel data conditions. Particle Swarm Optimization (PSO) is adopted as the core paradigm because it combines population-based global exploration with memory-guided exploitation, making it well-suited for black-box optimization problems where gradients are unavailable or unreliable [18]. In canonical PSO, each particle updates its velocity and position by learning from its own historical best position and the global best position of the swarm. For a particle i at iteration t , the basic update can be written as follows:
v i t + 1 = ω v i t + c 1 r 1 p i t x i t + c 2 r 2 g t x i t , x i t + 1 = x i t + v i t + 1
where ω is the inertia weight controlling momentum, c 1 and c 2 are acceleration coefficients, r 1 , r 2 U ( 0,1 ) are random scalars, p i is the personal best position, and g is the global best position. Despite its simplicity, standard PSO may suffer from premature convergence when the objective surface is strongly multimodal, which is common in hyperparameter tuning. Therefore, three enhanced PSO variants—AsyLnCPSO, BreedPSO, and CLSPSO—are introduced and compared as candidate optimizers in this work.

2.1.1. AsyLnCPSO (Asymmetric Linearly Varying Acceleration PSO)

AsyLnCPSO balances exploration and exploitation by varying the cognitive and social acceleration coefficients over iterations [19]. It emphasizes exploration in the early stage and stronger convergence in the later stage. In practice, this is achieved by letting the acceleration coefficients vary with iteration index t (out of T total iterations), e.g.,
c 1 ( t ) = c 1 , max c 1 , max c 1 , min t T , c 2 ( t ) = c 2 , max c 2 , max c 2 , min t T ,
so that the relative contributions of self-memory and social learning evolve systematically during the search. Compared with fixed-parameter PSO, this asymmetric linear strategy is designed to (i) maintain swarm diversity early on, (ii) prevent overly aggressive contraction around suboptimal attractors, and (iii) accelerate late-stage convergence once high-quality regions have been identified. These properties are particularly advantageous for engineering datasets, where the response surface induced by cross-validated errors can be noisy and highly non-smooth.

2.1.2. BreedPSO (PSO with Breeding Operator)

BreedPSO extends standard PSO by introducing a breeding operator. Elite particles are recombined to generate new candidates, which helps maintain diversity. This mechanism is useful for multimodal search spaces in hyperparameter tuning [20].

2.1.3. CLSPSO (Chaotic Local Search PSO)

CLSPSO combines PSO with chaotic local search [21]. After promising regions are found, chaotic perturbations are used for local refinement. This strategy can improve exploitation near narrow optima.

2.2. Interpretability Techniques

Accurate prediction alone is insufficient for tunnel water inrush management because engineering actions (e.g., advance drainage, pre-grouting, and excavation scheduling) require transparent evidence of why the model outputs change under varying hydrogeological and structural conditions. Accordingly, this study adopts a multi-level interpretability strategy tailored to the final tree-ensemble predictor (AsyLnCPSO–CatBoost), integrating (i) robust global attribution, (ii) response-curve diagnostics for nonlinear effects and heterogeneity, and (iii) interaction exploration for key feature pairs. Together, these techniques transform the model from a purely predictive tool into an explainable decision-support component.

2.2.1. SHAP-Based Global Attribution and Directional Effects

To quantify the contribution of each input variable to the predicted WIQ, this study employs SHAP, which is grounded in cooperative game theory and provides a theoretically consistent feature-attribution framework [22,23]. SHAP decomposes a model prediction into an additive sum of feature contributions, enabling both ranking (importance) and directionality (whether a feature increases or decreases the prediction in a given sample). For an instance x , the explanation can be written in the following additive form:
f ( x ) = ϕ 0 + j = 1 p ϕ j ,
where f ( x ) is the model output (predicted WIQ), ϕ 0 is the expected prediction over the background dataset, and ϕ j is the SHAP value representing the marginal contribution of feature j . In this work, SHAP values are computed for the trained CatBoost ensemble using an efficient tree-based implementation (TreeSHAP), which is particularly suitable for gradient-boosted decision trees due to its exactness (under standard assumptions) and computational efficiency.
Practically, SHAP is used in two complementary ways. First, the mean absolute SHAP values are aggregated across the dataset to obtain a stable global importance ranking, highlighting the dominant physical and geological controls (e.g., lithologic and structural proxies) learned by the model. Second, SHAP summary visualizations are used to interpret directional effects: the sign and magnitude of ϕ j indicate whether a given feature value drives the WIQ upward or downward for each excavation segment, and the color mapping of the feature values reveals monotonic or non-monotonic patterns. This global-to-local linkage makes it possible to reconcile model behavior with engineering intuition and to identify variables that may act as risk amplifiers under specific ranges.

2.2.2. PDP and ICE for Nonlinear Response Diagnostics

While SHAP provides attribution at the instance and dataset levels, engineering interpretation also requires an explicit view of how WIQ responds across the feasible domain of each predictor and whether that response is stable among segments. Therefore, this study further adopts PDP and ICE curves as response-based interpretability tools [24].
For a feature (or feature subset) S , the PDP estimates the average marginal effect on the prediction by integrating out the remaining features C :
f ^ S ( x S ) = E X C f ( x S , X C ) ,
which can be approximated empirically by averaging model outputs over the observed distribution of X C . In parallel, ICE curves plot the same functional relationship for each sample, i.e., they reveal how predictions change when x S is varied while keeping the other features fixed at the sample’s observed values. This pairing is crucial for tunnel datasets because heterogeneity is expected: different excavation segments may share similar values of one indicator while differing in others (e.g., lithology–fracture coupling), leading to varied local sensitivities.
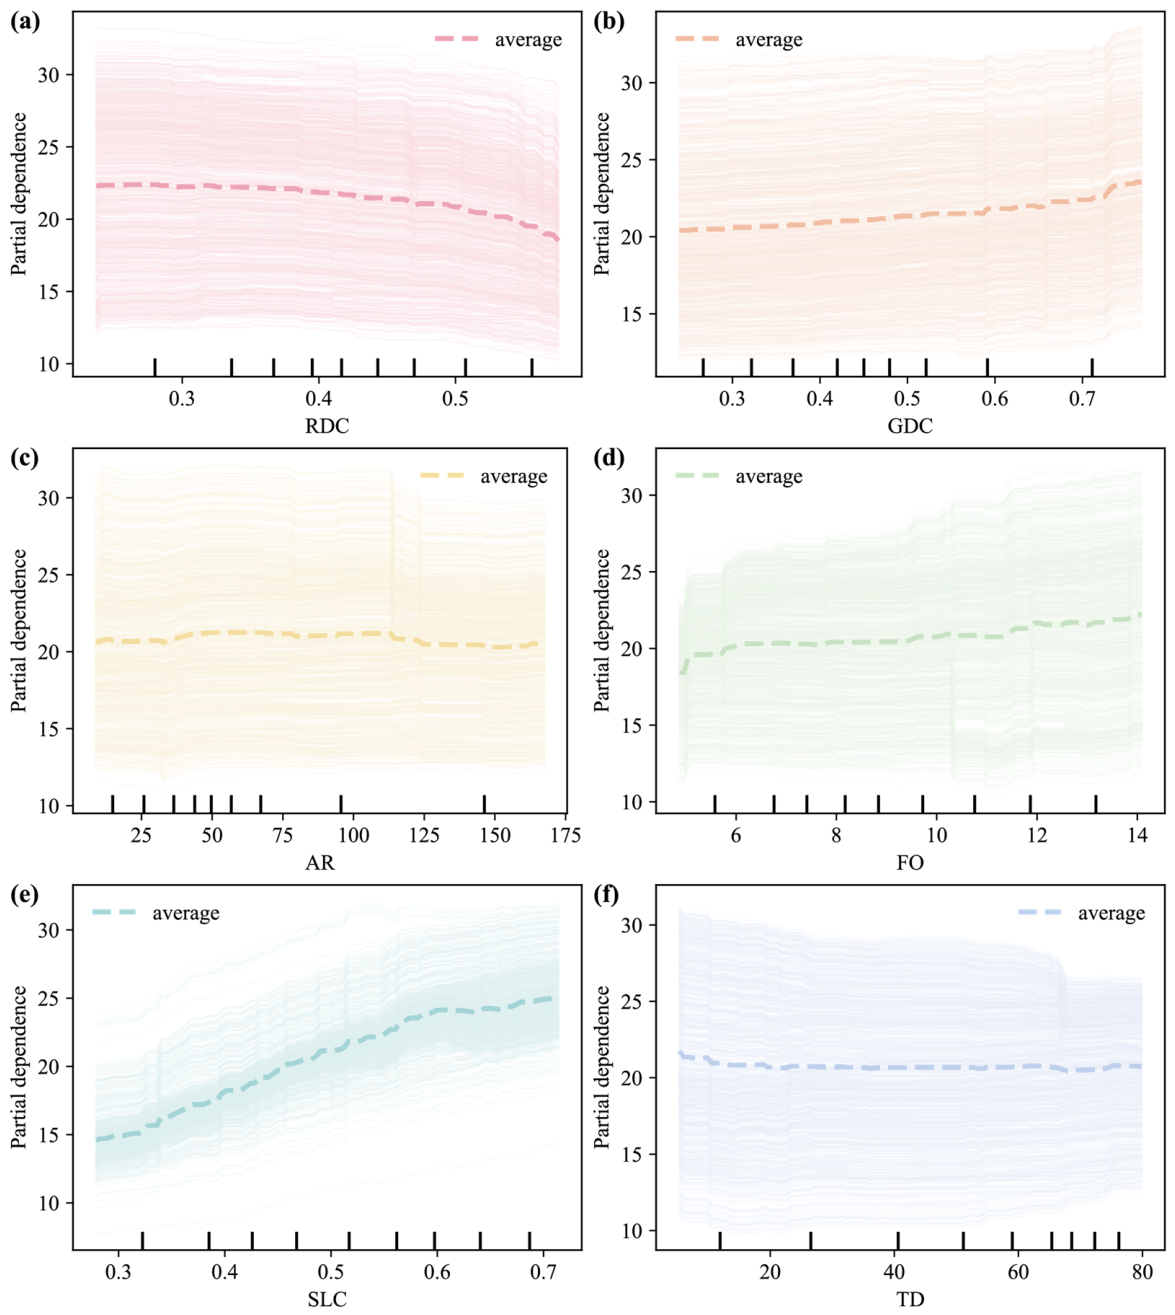
In this study, PDPs provide the primary trend (e.g., monotonic increase/decrease, saturation, threshold-like changes) for each predictor, whereas ICE curves expose dispersion around the mean effect—evidence of interaction effects or subgroup behavior. This combination strengthens interpretability by distinguishing “globally consistent” drivers from those whose influence depends strongly on contextual feature configurations.

2.2.3. Interaction Exploration via Two-Variable (3D) PDP Surfaces

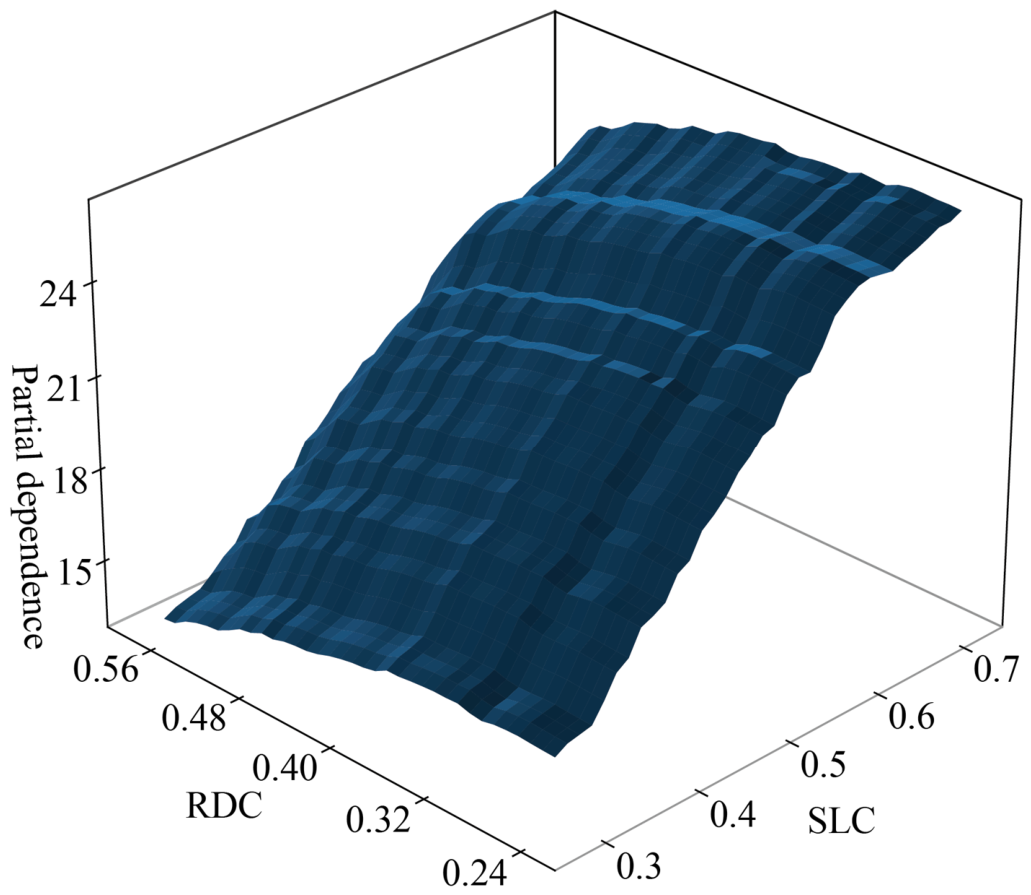
Tunnel water inrush is controlled by multiple coupled factors. Therefore, single-variable explanations may miss important interaction effects. To address this, this study extends PDP analysis to feature pairs and constructs two-dimensional PDP surfaces (visualized in 3D) for the most influential variables identified by SHAP. These interaction surfaces reveal whether the model’s response to one variable changes systematically with the level of another variable—for example, whether the impact of a lithologic coefficient is amplified or mitigated under different reflector or groundwater development conditions [25].
Methodologically, the two-variable PDP follows the same expectation principle as the univariate PDP but is evaluated over a grid in x j x k . The resulting surface provides an interpretable map of the predicted WIQ under joint variations in two drivers, allowing engineers to identify “high-risk corners” in the feature space (regions where the WIQ increases sharply) and to interpret whether risk can be reduced by improving one factor when another remains unfavorable. By integrating these interaction diagnostics with SHAP’s global ranking and PDP/ICE’s marginal trends, the proposed interpretability suite offers a coherent, multi-resolution explanation of the AsyLnCPSO–CatBoost predictions and supports risk-informed tunneling decisions.

2.3. GAN Data Augmentation Technology

Field-monitoring datasets for tunnel water inrush prediction are often characterized by limited sample size, strong site dependence, and heterogeneous hydrogeological conditions. In such settings, directly training machine learning regressors on the raw data may lead to unstable fitting behavior, strong sensitivity to sample partitioning, and insufficient representation of infrequent but engineering-relevant patterns. To alleviate these constraints, this study introduces a generative adversarial network (GAN)-based augmentation strategy for tabular data. The purpose of this module is not to replace real observations, but to enrich the training distribution in a statistically guided manner so that downstream learners can be trained on a broader yet still structured sample space. Because the reliability of augmentation depends critically on protocol design, the GAN module is embedded in a training-only workflow and evaluated together with distributional consistency diagnostics and downstream predictive performance.
(1) Design objective and rationale.
Conventional small-sample remedies such as direct duplication, random perturbation, or independent marginal sampling may increase the apparent data volume, but they often fail to preserve multivariate dependence and may introduce unrealistic combinations of geological and hydrogeological descriptors. This issue is especially important for tunnel water inrush regression, where the target variable WIQ is jointly influenced by reflector conditions, groundwater development, lithology, structural opening, and burial depth. To better preserve these coupled relationships, the present study adopts a tabular GAN framework trained in the joint feature–target space X y , where X denotes the six input variables and y denotes the WIQ. The rationale is that learning the joint distribution can help the generator reproduce not only the marginal ranges of each variable, but also the statistical dependence between predictors and target values. This design is intended to reduce the chance of generating synthetic records that appear numerically plausible in the feature space but are inconsistent with the corresponding WIQ response.
At the same time, the use of joint X y generation requires careful protocol control. For this reason, all augmentation operations in this study are restricted to the training subset only, and the test subset remains untouched throughout model development. Thus, the GAN is used as a training-set enrichment tool rather than as a data reconstruction mechanism for the entire dataset [26,27].
(2) Tabular preprocessing and reversible transformation.
To make heterogeneous field data learnable by a neural generator, all variables are first transformed into a consistent tabular representation. Continuous variables are normalized to a numerically stable range so that variables with different engineering units do not dominate the adversarial learning process. When necessary, inverse transformation is applied after sample generation to restore synthetic records to their original engineering scale. This reversible preprocessing ensures that the generated samples can be compared directly with raw observations in terms of physical magnitude, variable distribution, and predictor–target coupling. Because the present dataset contains only continuous predictors and a continuous response, the preprocessing pipeline remains relatively simple and avoids unnecessary encoding complexity.
(3) Adversarial learning mechanism for synthetic sample generation.
The GAN consists of a generator and a discriminator trained through an adversarial optimization process. The generator maps random noise vectors to candidate synthetic tabular records, while the discriminator attempts to distinguish generated samples from real training observations. Through iterative competition, the generator gradually improves its ability to reproduce the statistical structure of the real training data. In the context of this study, the goal is not to claim that the GAN recovers the true physical data-generating mechanism of tunnel water inrush, but rather that it provides a data-driven approximation of the empirical training distribution under the current project setting.
Because small engineering datasets are particularly vulnerable to overfitting, the generated samples are not accepted solely on the basis of adversarial loss convergence. Instead, their usefulness is evaluated through a combination of distributional similarity checks and downstream model behavior. In other words, the quality of augmentation is judged not only by whether the synthetic records resemble the training data statistically, but also by whether they help improve learning stability without causing obvious distortion of the original data structure.
(4) Distribution-fidelity-oriented quality control.
To reduce the risk of introducing implausible or distribution-shifted synthetic samples, augmentation quality is assessed from multiple statistical perspectives. First, the marginal distributions of input variables and WIQ are compared between the real training data and the generated data to examine whether the synthetic samples remain within the principal range and shape of the observed dataset. Second, the correlation structure among variables is examined to determine whether the generator preserves the main inter-variable coupling patterns that are important for engineering interpretation. Third, the downstream prediction performance of augmented models is compared with that of non-augmented models under the same train–test split, so that augmentation is evaluated in terms of both statistical fidelity and practical modeling utility.
This fidelity-oriented perspective is important because a larger synthetic dataset is not automatically a better dataset. If the generated records deviate excessively from the real hydrogeological structure of the training data, they may increase nominal sample size while weakening the validity of model learning. Therefore, the augmentation strategy in this study is treated as acceptable only when the synthetic data show reasonable agreement with the main statistical characteristics of the original training subset and when the downstream models exhibit improved or at least non-degraded hold-out performance.
(5) Augmentation scale and empirical setting.
After GAN training, synthetic samples are generated and concatenated with the original training observations to form an augmented training set. In this study, a 20-fold expansion setting is adopted; specifically, for an original training subset containing N samples, 19 N synthetic records are generated and then combined with the N real samples to form a 20 N -sized training pool. Under the present 80/20 split of the 55-sample dataset, the training subset contains 44 real samples, and augmentation yields an 880-sample training set for downstream model construction.
It should be emphasized that this 20-fold ratio is an empirical configuration selected for the present dataset rather than a theoretically optimal universal rule. The purpose of using this setting is to provide sufficient training-density expansion under severe sample scarcity while still allowing fidelity checks against the original observations. To avoid overstating the generality of this choice, the influence of the augmentation ratio should be interpreted as dataset-specific and is further discussed in relation to downstream model behavior rather than being presented as a universally best augmentation scale.
(6) Leakage control and protocol consistency.
Because data augmentation can easily introduce overly optimistic evaluation if the protocol is not strictly controlled, special attention is paid to leakage prevention in this study. The full dataset of 55 samples is first divided into a training subset and a test subset using a fixed 80/20 split. All subsequent GAN-related operations—including model fitting, synthetic sample generation, and preparation of the augmented dataset—are conducted using the training subset only. The test subset is never used during GAN fitting, GAN-based sample generation, baseline model training, optimizer-based hyperparameter tuning, or model selection. It is retained as an untouched hold-out set for final evaluation only.
This protocol is designed to minimize the risk that information from the test data influences the training distribution through augmentation. Accordingly, the reported test set results should be interpreted as hold-out performance under the current split, not as external validation across independent tunnel projects. This distinction is important because internal hold-out evaluation, repeated resampling, and true external validation serve different methodological purposes and provide different levels of evidence regarding generalization.
(7) Role of augmentation in the overall modeling framework.
Within the overall methodology of this study, GAN augmentation serves as a preparatory module that expands the effective learning pool before benchmark model comparison and hybrid model construction. The augmented training set is subsequently used for baseline learner evaluation, optimizer selection, and CatBoost-based hybrid modeling. Hyperparameter tuning is conducted by 5-fold cross-validation on the augmented training data, whereas final model assessment is performed only on the untouched real test subset. Therefore, the GAN module should be understood as part of a leakage-aware and structured modeling pipeline tailored to the current small-sample tunnel WIQ dataset.
Overall, the purpose of this augmentation strategy is to provide a broader and more informative training distribution while preserving the principal statistical characteristics of the real observations as much as possible. Under the present project-specific dataset setting, this design offers a practical way to mitigate sample scarcity and improve the stability of subsequent learning. However, the augmentation results should still be interpreted with caution, and stronger confirmation through repeated train–test splitting, fold-wise generator re-fitting, and external validation on additional tunnel datasets remains necessary. It should also be noted that the GAN-based augmentation used in this study has methodological limitations. The generator was trained from only 44 real training samples under the current split, and therefore it can only approximate the empirical training distribution rather than recover the true hydrogeological data-generating process. Although the test set was not used during GAN fitting or downstream model training, the present protocol does not include fold-wise generator re-fitting under repeated resampling. Therefore, the possibility of optimistic performance estimation caused by synthetic sample dependence, limited real-sample diversity, or split-specific generator behavior cannot be fully excluded. For this reason, GAN augmentation in this study is regarded as a project-specific training-enrichment strategy, and its effectiveness should be further validated using repeated train–test splitting, fold-wise augmentation within each resampling loop, and external tunnel datasets.

2.4. System Framework

An end-to-end hybrid framework was designed for tunnel WIQ prediction. It integrates data processing, model selection, optimization, and interpretability analysis. The framework follows a structured, sequential workflow to ensure robustness, statistical rigor, and engineering applicability, with detailed steps as follows.

2.4.1. Train/Test Split

The original dataset of 55 samples is first partitioned into a training set and an independent test set using a fixed 80/20 split ratio. Specifically, 44 samples are allocated to the training set for model training and hyperparameter tuning, while the remaining 11 samples form the test set. This split is implemented with a fixed random seed to ensure reproducibility, and the test set is strictly isolated throughout the entire workflow to serve as an independent hold-out set for evaluating model performance under the present data split. Because only 11 real samples were available in the hold-out test set, this split was mainly used to provide a transparent and reproducible internal evaluation. It should not be interpreted as a sufficiently powered independent validation. The potential sensitivity of the reported metrics to the particular random split remains a limitation of the current study.

2.4.2. Statistical Diagnosis on Original Data

Prior to formal modeling, a comprehensive statistical diagnosis is performed on the original dataset to quantify its inherent characteristics. Before modeling, the dataset was examined for completeness, variable distributions, correlations, and potential outliers. No missing values were found, and statistically extreme but engineering-reasonable samples were retained. The statistical diagnosis includes checks on data completeness, variable distributions, inter-variable correlations, and potential outlier presence. For the final modeling table, no missing values were found in either the six input indicators or the WIQ target. Potential outliers were first screened statistically and then verified against the engineering records in the source dataset. Statistically extreme but engineering-reasonable samples were retained, so that the real heterogeneity of tunnel hydrogeological responses could be preserved.

2.4.3. Baseline Modeling on Original Training Set

To highlight the necessity of data augmentation, six mainstream tree-based baseline models (RandomForest, GradientBoosting, AdaBoost, XGBoost, LightGBM, and CatBoost) are trained on the original training set with default hyperparameters. The performance of these baseline models is visualized using observed–predicted scatter density plots for both the training and test sets. Results consistently show severe overfitting: all models achieve excellent fitting accuracy on the training set but suffer a sharp drop in predictive performance on the test set. This significant discrepancy between training and test performance directly verifies that the original sample size is insufficient to support robust model construction, underscoring the urgent need for data augmentation to improve generalization.

2.4.4. Training-Set-Only Augmentation

Data augmentation was applied exclusively to the training set after the fixed 80/20 split. Specifically, the GAN was fitted using the 44 training samples only, and the test set remained fully isolated during GAN fitting, GAN hyperparameter selection, synthetic sample generation, downstream model training, and optimizer-based tuning. This design was intended to minimize the risk of information leakage from the test set.
A 20-fold expansion ratio was adopted in the present study, generating 19 times the number of synthetic samples relative to the original training set and concatenating them with the 44 real training samples to form an augmented training set of 880 samples. This ratio was chosen empirically as a practical setting for the current dataset, rather than as a theoretically optimal value. Comparative analyses before and after augmentation focused on sample size expansion, consistency of variable distributions, and preservation of inter-variable correlation structures.

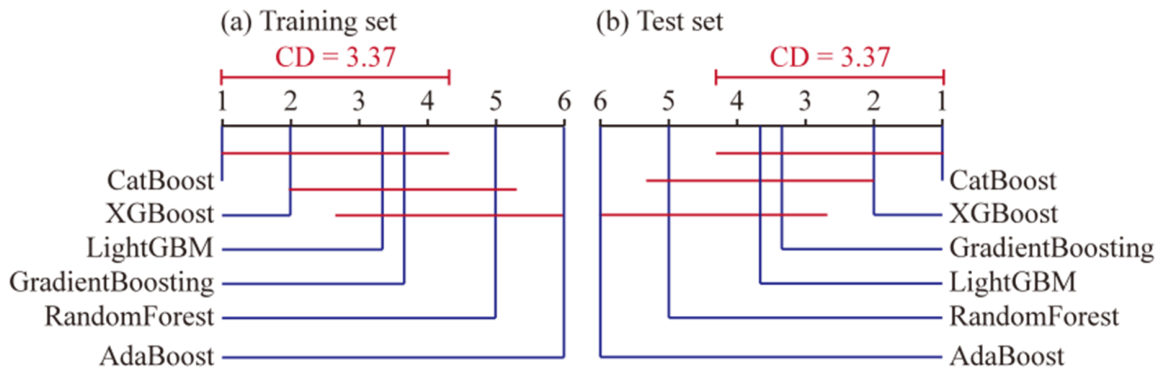
2.4.5. Critical Distance-Based Model Ranking

To identify the most robust baseline learner for subsequent hybrid model construction, a statistical comparison of the six baseline models is performed using the Critical Distance (CD) method. This method provides a statistically rigorous ranking by accounting for the variability of model performance across multiple metrics, avoiding subjective judgments based solely on numerical values. The CD analysis confirms that CatBoost achieves the best overall statistical ranking among the six baseline models, demonstrating superior stability and predictive ability on both the original and augmented datasets. This statistically robust selection process enhances the rigor of the research.

2.4.6. Benchmark Evaluation of Optimizers

To select the optimal swarm-intelligence optimizer for tuning the CatBoost model, three enhanced PSO variants (AsyLnCPSO, BreedPSO, and CLSPSO) are evaluated using six benchmark functions with diverse characteristics (e.g., unimodal, multimodal, and hybrid landscapes). The evaluation is conducted under consistent experimental settings: a population size of 100 and a problem dimension of 6. Results show that AsyLnCPSO outperforms the other two optimizers in terms of convergence speed, stability, and ability to escape local optima. This benchmark validation ensures that the selected optimizer is not arbitrarily chosen but is proven effective for handling the rugged, non-convex search spaces typical of hyperparameter tuning.

2.4.7. Construction of AsyLnCPSO–CatBoost Hybrid Model

The hybrid intelligent model is constructed by integrating the selected optimal optimizer (AsyLnCPSO) with the best baseline learner (CatBoost). The optimization objective is to minimize the mean squared error (MSE), which effectively penalizes large prediction deviations critical for engineering safety. A 5-fold cross-validation strategy is implemented on the augmented training set to avoid overfitting to a single data split during hyperparameter tuning. The hyperparameters targeted for optimization include tree depth (search range: 1–10), L2 leaf regularization term (search range: 1–20), and learning rate (search range: 0.01–0.30). The fitness function is defined as the average MSE from the 5-fold cross-validation, and the optimization process terminates after a maximum of 500 iterations to balance search thoroughness and computational efficiency. It should be noted that this 5-fold cross-validation procedure was used only for hyperparameter tuning within the augmented training set. It does not substitute for repeated train–test splitting, nested resampling, or true external validation on independent tunnel projects. Therefore, the final test performance should be interpreted as hold-out performance under the current split rather than as definitive evidence of model robustness.

2.4.8. Explainability Analysis

To avoid the hybrid model becoming an unexplainable “black box” and to ensure engineering usability, a multi-level interpretability suite is integrated into the framework. SHAP is used for global and local feature contribution analysis, quantifying the importance and directional impact of each input indicator on WIQ predictions. PDP and ICE curves are employed to reveal the nonlinear response patterns of WIQ to individual indicators and the heterogeneity across different excavation segments. Notably, the interpretability analysis is not merely for visualization purposes but serves to verify whether the model has learned physically meaningful and engineering-consistent relationships between hydrogeological–structural factors and WIQ, providing actionable insights for practical construction decisions.
This systematic framework sequentially addresses data scarcity, model selection, hyperparameter optimization, and interpretability, forming a coherent pipeline intended to improve the reliability and practical usability of tunnel WIQ prediction under small-sample, high-heterogeneity conditions.

3. Project Overview

The dataset was derived from the tunnel group in the YA15 section of the Puyan Expressway, Fujian Province, China, based on the publicly available dataset reported by Zheng et al. [1]. This study focuses on quantitative WIQ prediction for drill-and-blast tunneling.
A total of 55 valid samples were compiled for the WIQ prediction model, with each sample corresponding to a 30 m fixed spatial granularity of the tunnel excavation segment. A segment was retained for modeling only when all six predictor variables and the corresponding measured WIQ value were available and could be consistently matched to the same spatial unit. Consequently, the final modeling table contained 55 valid samples, and no missing values were present in either the input variables or the output variable. Potential outliers were identified through statistical inspection of the variable distributions and then cross-checked against the engineering records in the source dataset. Because statistically extreme observations may reflect genuine hydrogeological heterogeneity rather than data errors, physically plausible samples were retained. Therefore, no sample was removed solely on the basis of statistical extremeness.
The dataset integrates three types of engineering data, including tunnel advanced geological prospecting outputs, on-site construction-face observation statistics, and detailed geological exploration reports, to form a project-level WIQ prediction dataset with unified spatial scale and consistent data sources. Six hydrogeological–structural indicators were selected as the input variables for WIQ prediction, and the actual measured WIQ (in cubic meters per hour) of each excavation segment was set as the sole output variable. The specific categories, abbreviations, measurement units and average values of all input and output variables are summarized in Table 2, covering the key geological and hydrogeological factors that dominate the occurrence and intensity of tunnel water inrush, such as structural plane distribution, groundwater development, rock mass structure and tunnel geometric characteristics.
The 55-sample dataset in this study represents a typical small-sample problem in engineering machine learning research, which is the core challenge addressed in this study. Conventional machine learning modeling for geotechnical and tunnel engineering requires a minimum of hundreds of samples for basic model training, while complex hybrid intelligent models even demand thousands or tens of thousands of diverse samples to ensure stable learning and generalization [28]. In contrast, the 55 samples in this research are far below such standard requirements, and this small-sample characteristic is prone to cause severe overfitting in predictive models. Specifically, the model tends to memorize the limited training data rather than learning the intrinsic and general correlation between hydrogeological–structural indicators and WIQ, leading to an obvious gap between excellent fitting performance on the training set and poor generalization ability on the unseen test set. This inherent defect of the small-sample dataset is the fundamental reason for introducing the GAN-based data augmentation strategy in the subsequent research.
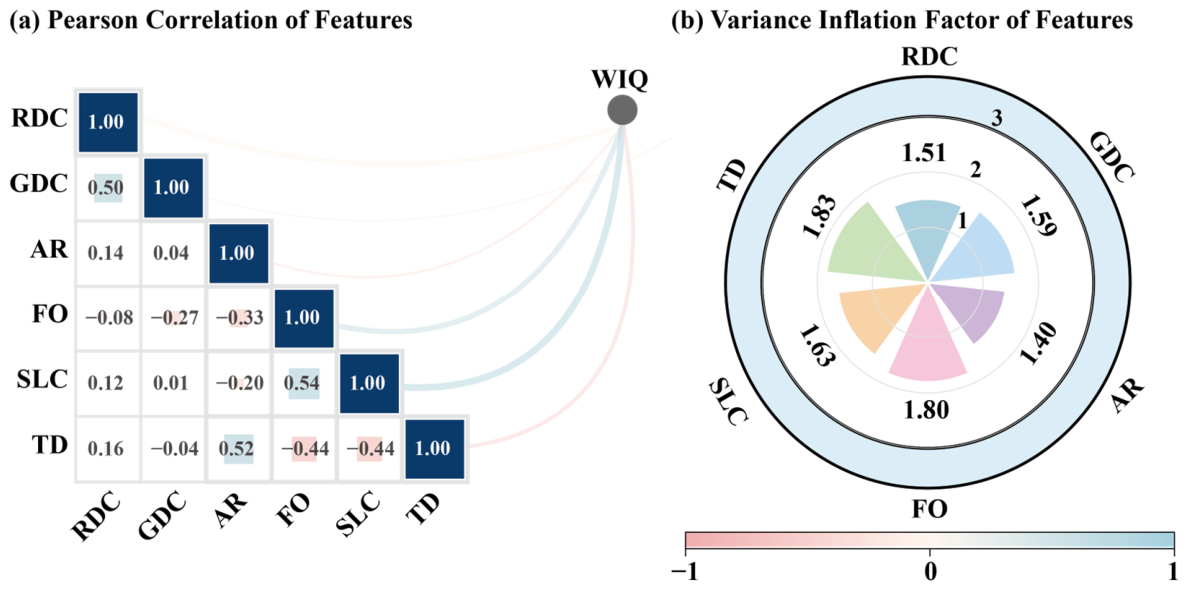
To verify the structural rationality of the input variables and eliminate the potential impact of multicollinearity on model performance, Pearson correlation analysis and variance inflation factor (VIF) analysis were conducted for all six hydrogeological–structural input indicators, with the results presented in Figure 1. The Pearson correlation matrix shows that the absolute values of correlation coefficients between any two input variables are at a low level, indicating the absence of a strong linear correlation among the selected indicators. Meanwhile, the VIF values of all input variables are significantly lower than the critical value of 10, which is the standard for judging serious multicollinearity in regression modeling. The results of the two analyses confirm that the input variable set of the dataset has a reasonable statistical structure, without obvious multicollinearity problems. This not only ensures the validity of the subsequent model training and hyperparameter optimization but also provides a reliable data structural basis for GAN-based tabular data augmentation to preserve the original variable dependence.

4. Performance Evaluation Indicators

Tunnel water inrush remains one of the most disruptive hazards in underground construction because it can rapidly trigger face instability, equipment damage, and cascading delays, while also amplifying safety and environmental risks. In practice, a predictive model is only actionable if it not only captures the overall trend of WIQ but also controls point-wise errors that matter for decision-making (e.g., advance support, drainage design, and risk-informed excavation planning). Therefore, to quantify the agreement between the predicted and observed WIQ values, we adopted four widely used indicators for regression assessment: the coefficient of determination (R2), root mean square error (RMSE), mean absolute error (MAE), and mean absolute percentage error (MAPE). Together, these metrics provide a complementary evaluation of goodness-of-fit (R2), absolute deviation magnitude (RMSE/MAE), and relative error level (MAPE), enabling a robust comparison among baseline and hybrid models under the same data and splitting strategy [1,2,5,6].
To ensure a balanced interpretation, we report both scale-dependent and scale-independent measures. R2 evaluates how much variance in WIQ can be explained by the model, whereas RMSE and MAE directly reflect prediction error in the original unit (m3/h), which is essential for engineering relevance. The MAPE further contextualizes the error magnitude relative to observed WIQ, facilitating comparisons across segments with different inflow intensities.
Formally, for a test set of size n , with an observed WIQ of y i , predicted WIQ of y ^ i , and mean observed WIQ of y ¯ , the indicators are defined as follows:
R 2 = 1 i = 1 n y i y ^ i 2 i = 1 n y i y ¯ 2 , R M S E = 1 n i = 1 n y i y ^ i 2 M A E = 1 n i = 1 n y i y ^ i , M A P E = 100 n i = 1 n y i y ^ i y i
In this study, a higher R2 indicates stronger explanatory power, while lower RMSE and MAE values indicate smaller absolute deviations from the monitored WIQ. The RMSE penalizes large errors more strongly due to squaring, which is particularly relevant when occasional high-inflow segments occur and must not be underestimated. The MAE is more robust to isolated large deviations and provides a straightforward “average error” in engineering units. The MAPE expresses the average relative error (in %), supporting interpretability across different inflow levels; when the WIQ is small, the MAPE can be sensitive, so it is interpreted together with the RMSE/MAE to avoid misleading conclusions.

5. Results and Analysis

5.1. Performance of Baseline Models on the Original Dataset

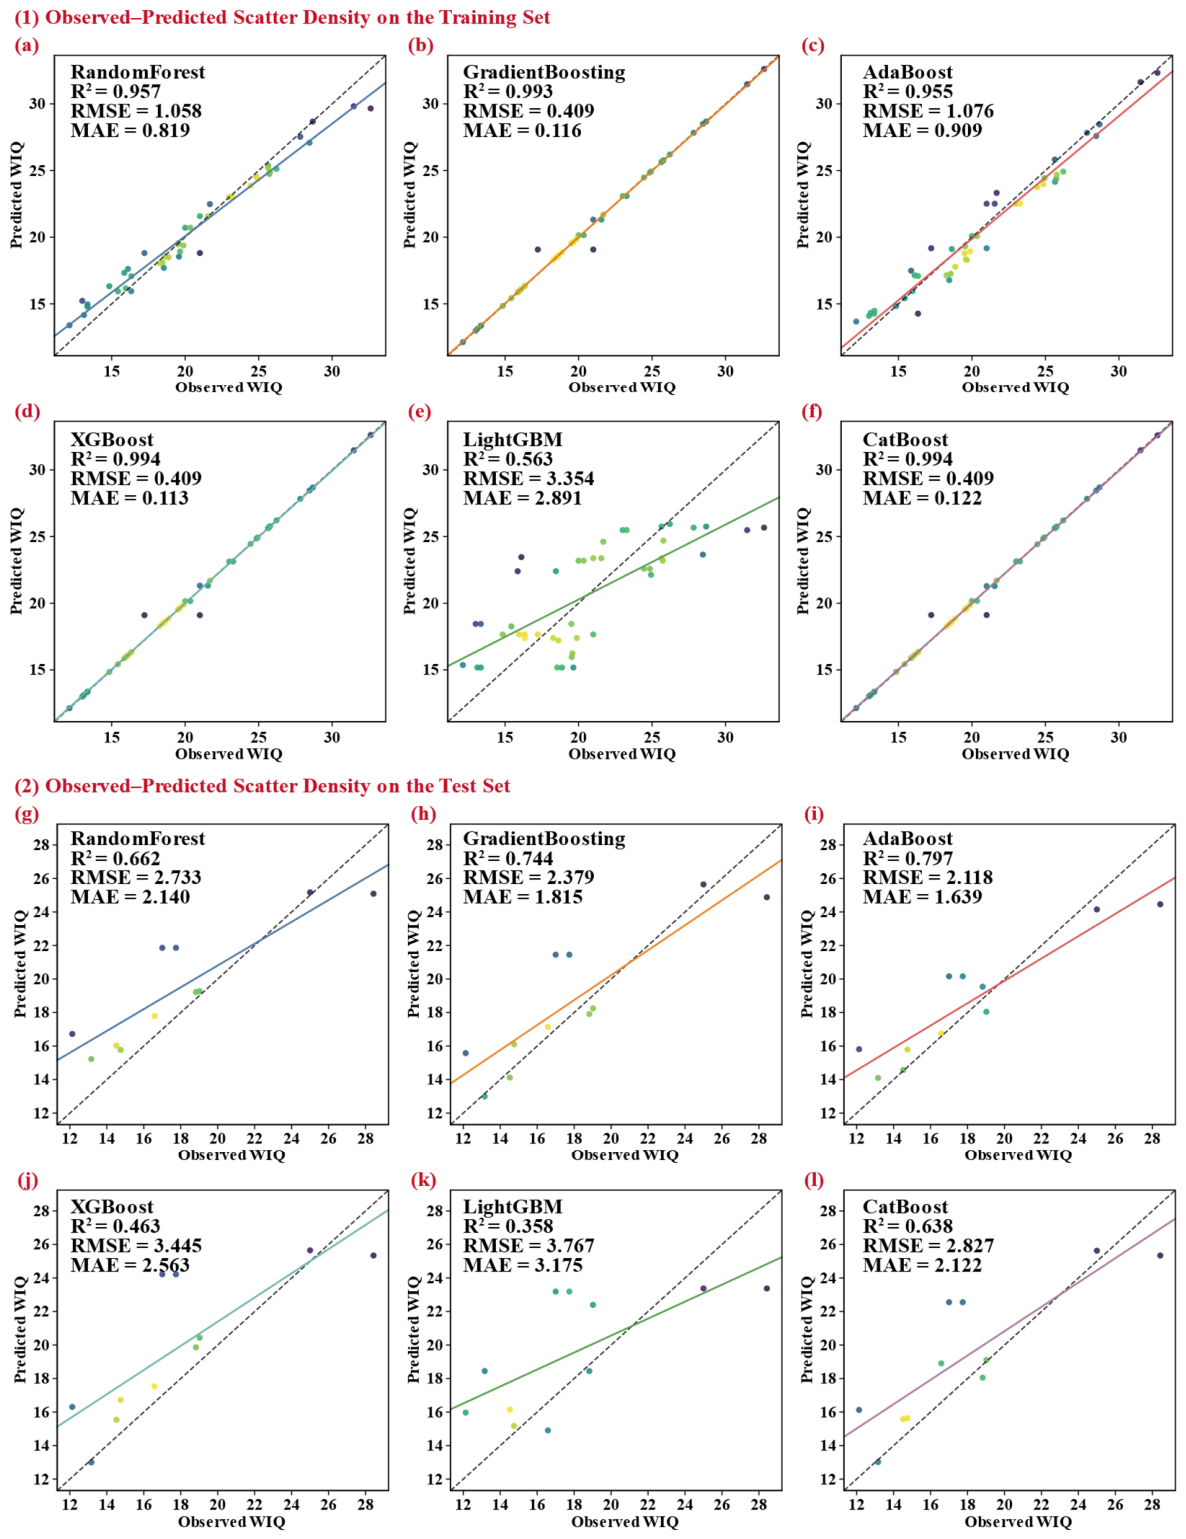
This subsection evaluates the predictive performance of six mainstream tree-based baseline learners on the original unaugmented dataset for tunnel WIQ prediction. The selected baseline models include RandomForest, GradientBoosting, AdaBoost, XGBoost, LightGBM and CatBoost, all of which are configured with default hyperparameters to ensure a fair and consistent comparison across different models. The model performance is quantified by three key regression metrics, namely the R2, RMSE, and MAE, and the results are visually presented as observed–predicted scatter density plots in Figure 2.
On the original training set, all six baseline models exhibit extremely high fitting accuracy, as shown in Figure 2a. The R2 values of most models are close to one, among which RandomForest, XGBoost and CatBoost achieve an R2 of 0.90 or even higher, accompanied by remarkably low RMSE and MAE. GradientBoosting and AdaBoost also show good fitting performance on the training set, with the R2 values reaching 0.993 and 0.955, respectively, and their error metrics remain at a low level as well. LightGBM is the only model with relatively poor fitting performance on the training set, with an R2 of 0.563, which is the lowest among all the baseline models. In general, all baseline models demonstrate strong immediate fitting capability on the original training set, with significantly low error magnitudes for WIQ prediction.
Despite the excellent fitting performance on the training set, the predictive performance of all baseline models drops drastically on the test set, revealing a severe overfitting problem. This phenomenon is clearly illustrated in the observed–predicted scatter density plots of the test set in Figure 2b, where a sharp decline in all evaluation metrics can be observed for every baseline model. On the test set, AdaBoost performs relatively the best among all models, with an R2 of 0.797, an RMSE of 2.118 cubic meters per hour and a MAE of 1.639 cubic meters per hour. The R2 values of RandomForest and CatBoost on the test set decrease to 0.662 and 0.638, respectively, with their error metrics rising further compared with AdaBoost and GradientBoosting. XGBoost and LightGBM show the worst generalization performance on the test set, with the R2 only at 0.463 and 0.358. Their RMSE values surge to 3.445 and 3.767 cubic meters per hour, and the MAE values also increase to 2.563 and 3.175 cubic meters per hour, making them the two models with the weakest generalization ability among all baselines.
The above results fully confirm that all tree-based baseline models with default hyperparameters suffer from severe overfitting when trained on the original small-sample tunnel WIQ dataset. The high fitting accuracy on the training set only reflects the memorization effect of the models on the limited training samples, rather than the effective learning of the inherent underlying relationships between tunnel WIQ and the hydrogeological–structural indicators. This memorization instead of learning leads to a sharp attenuation in the generalization ability of all baseline models on the unseen test samples. In addition, these results also directly verify that the small-sample characteristic of the original 55 samples is insufficient to support the construction of robust machine learning models for WIQ prediction, which highlights the necessity and urgency of conducting data augmentation on the training set to alleviate overfitting and improve the generalization ability of subsequent predictive models.

5.2. Effect of Training-Only Data Augmentation

To mitigate the severe overfitting issue of baseline models caused by the small-sample characteristic of the original dataset, a GAN was used to perform data augmentation only on the training set with a 20-fold expansion ratio, while the untouched test set remained unchanged for independent hold-out evaluation under the current split. This design was intended to minimize the risk of information leakage from the test set and to make the effect of augmentation more transparently assessable. The augmentation effect was evaluated from three aspects: sample size expansion, the distribution consistency of input and target variables, and the preservation of the intrinsic statistical structure of the original data.
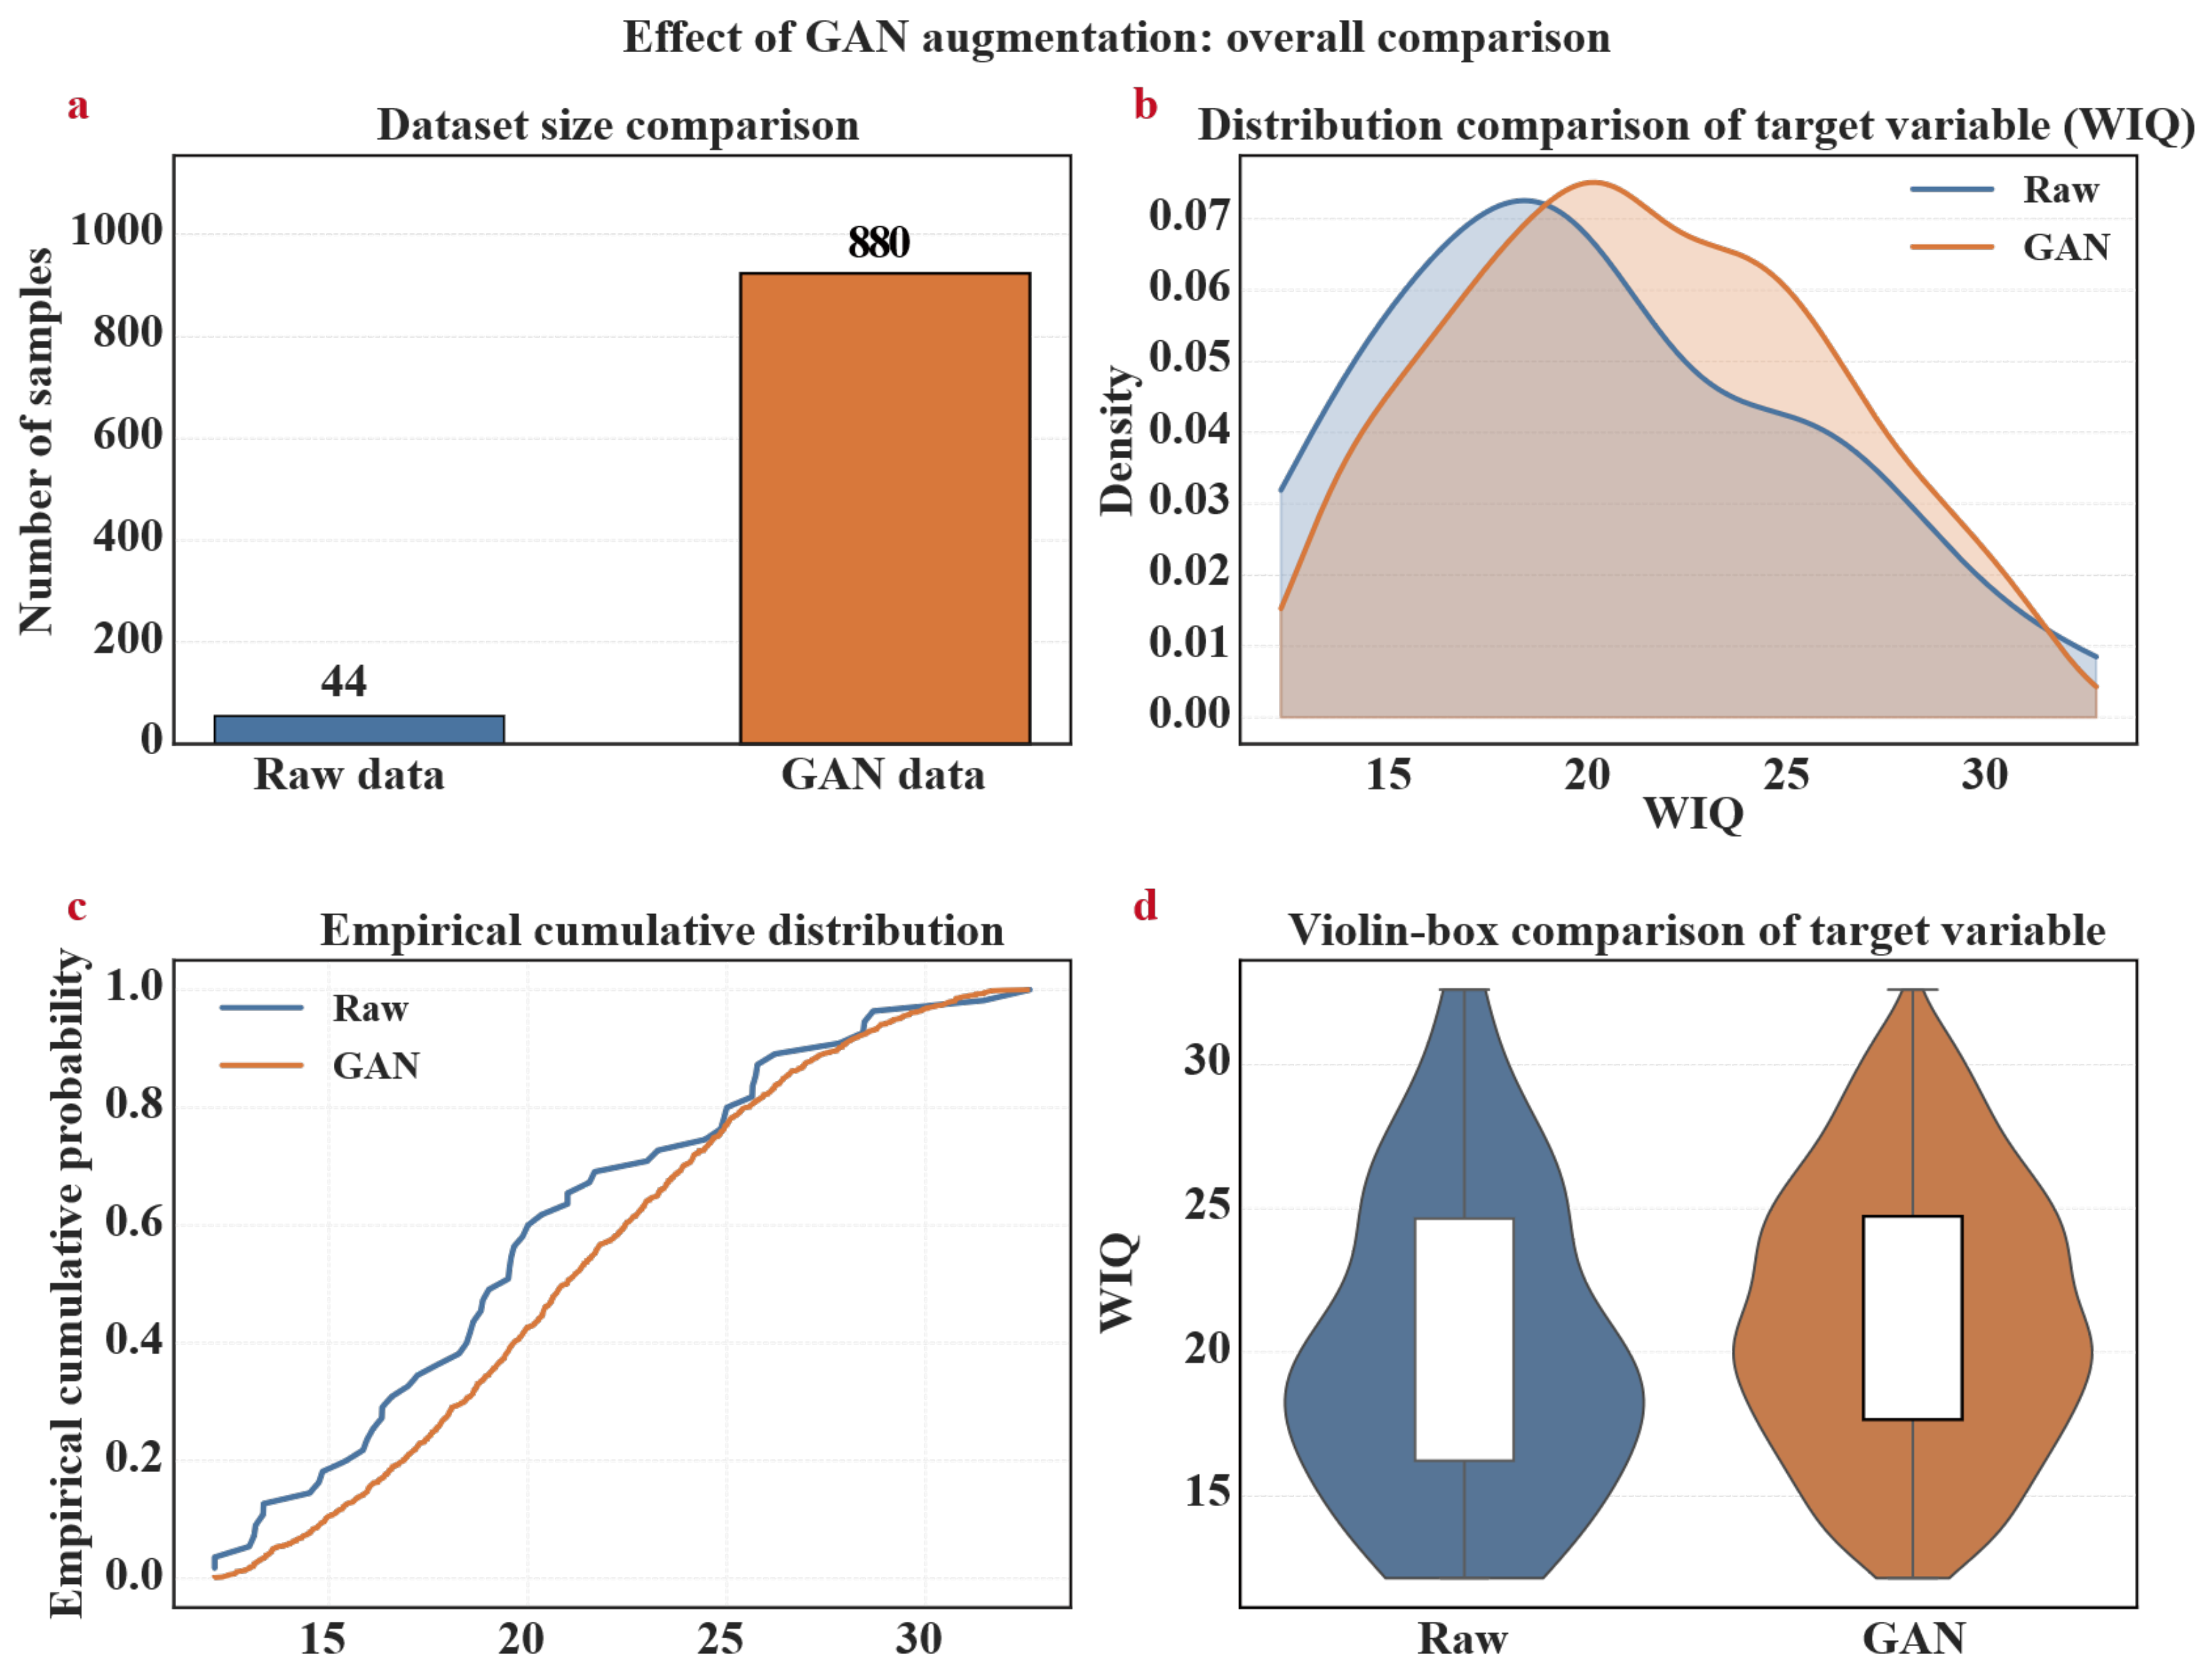
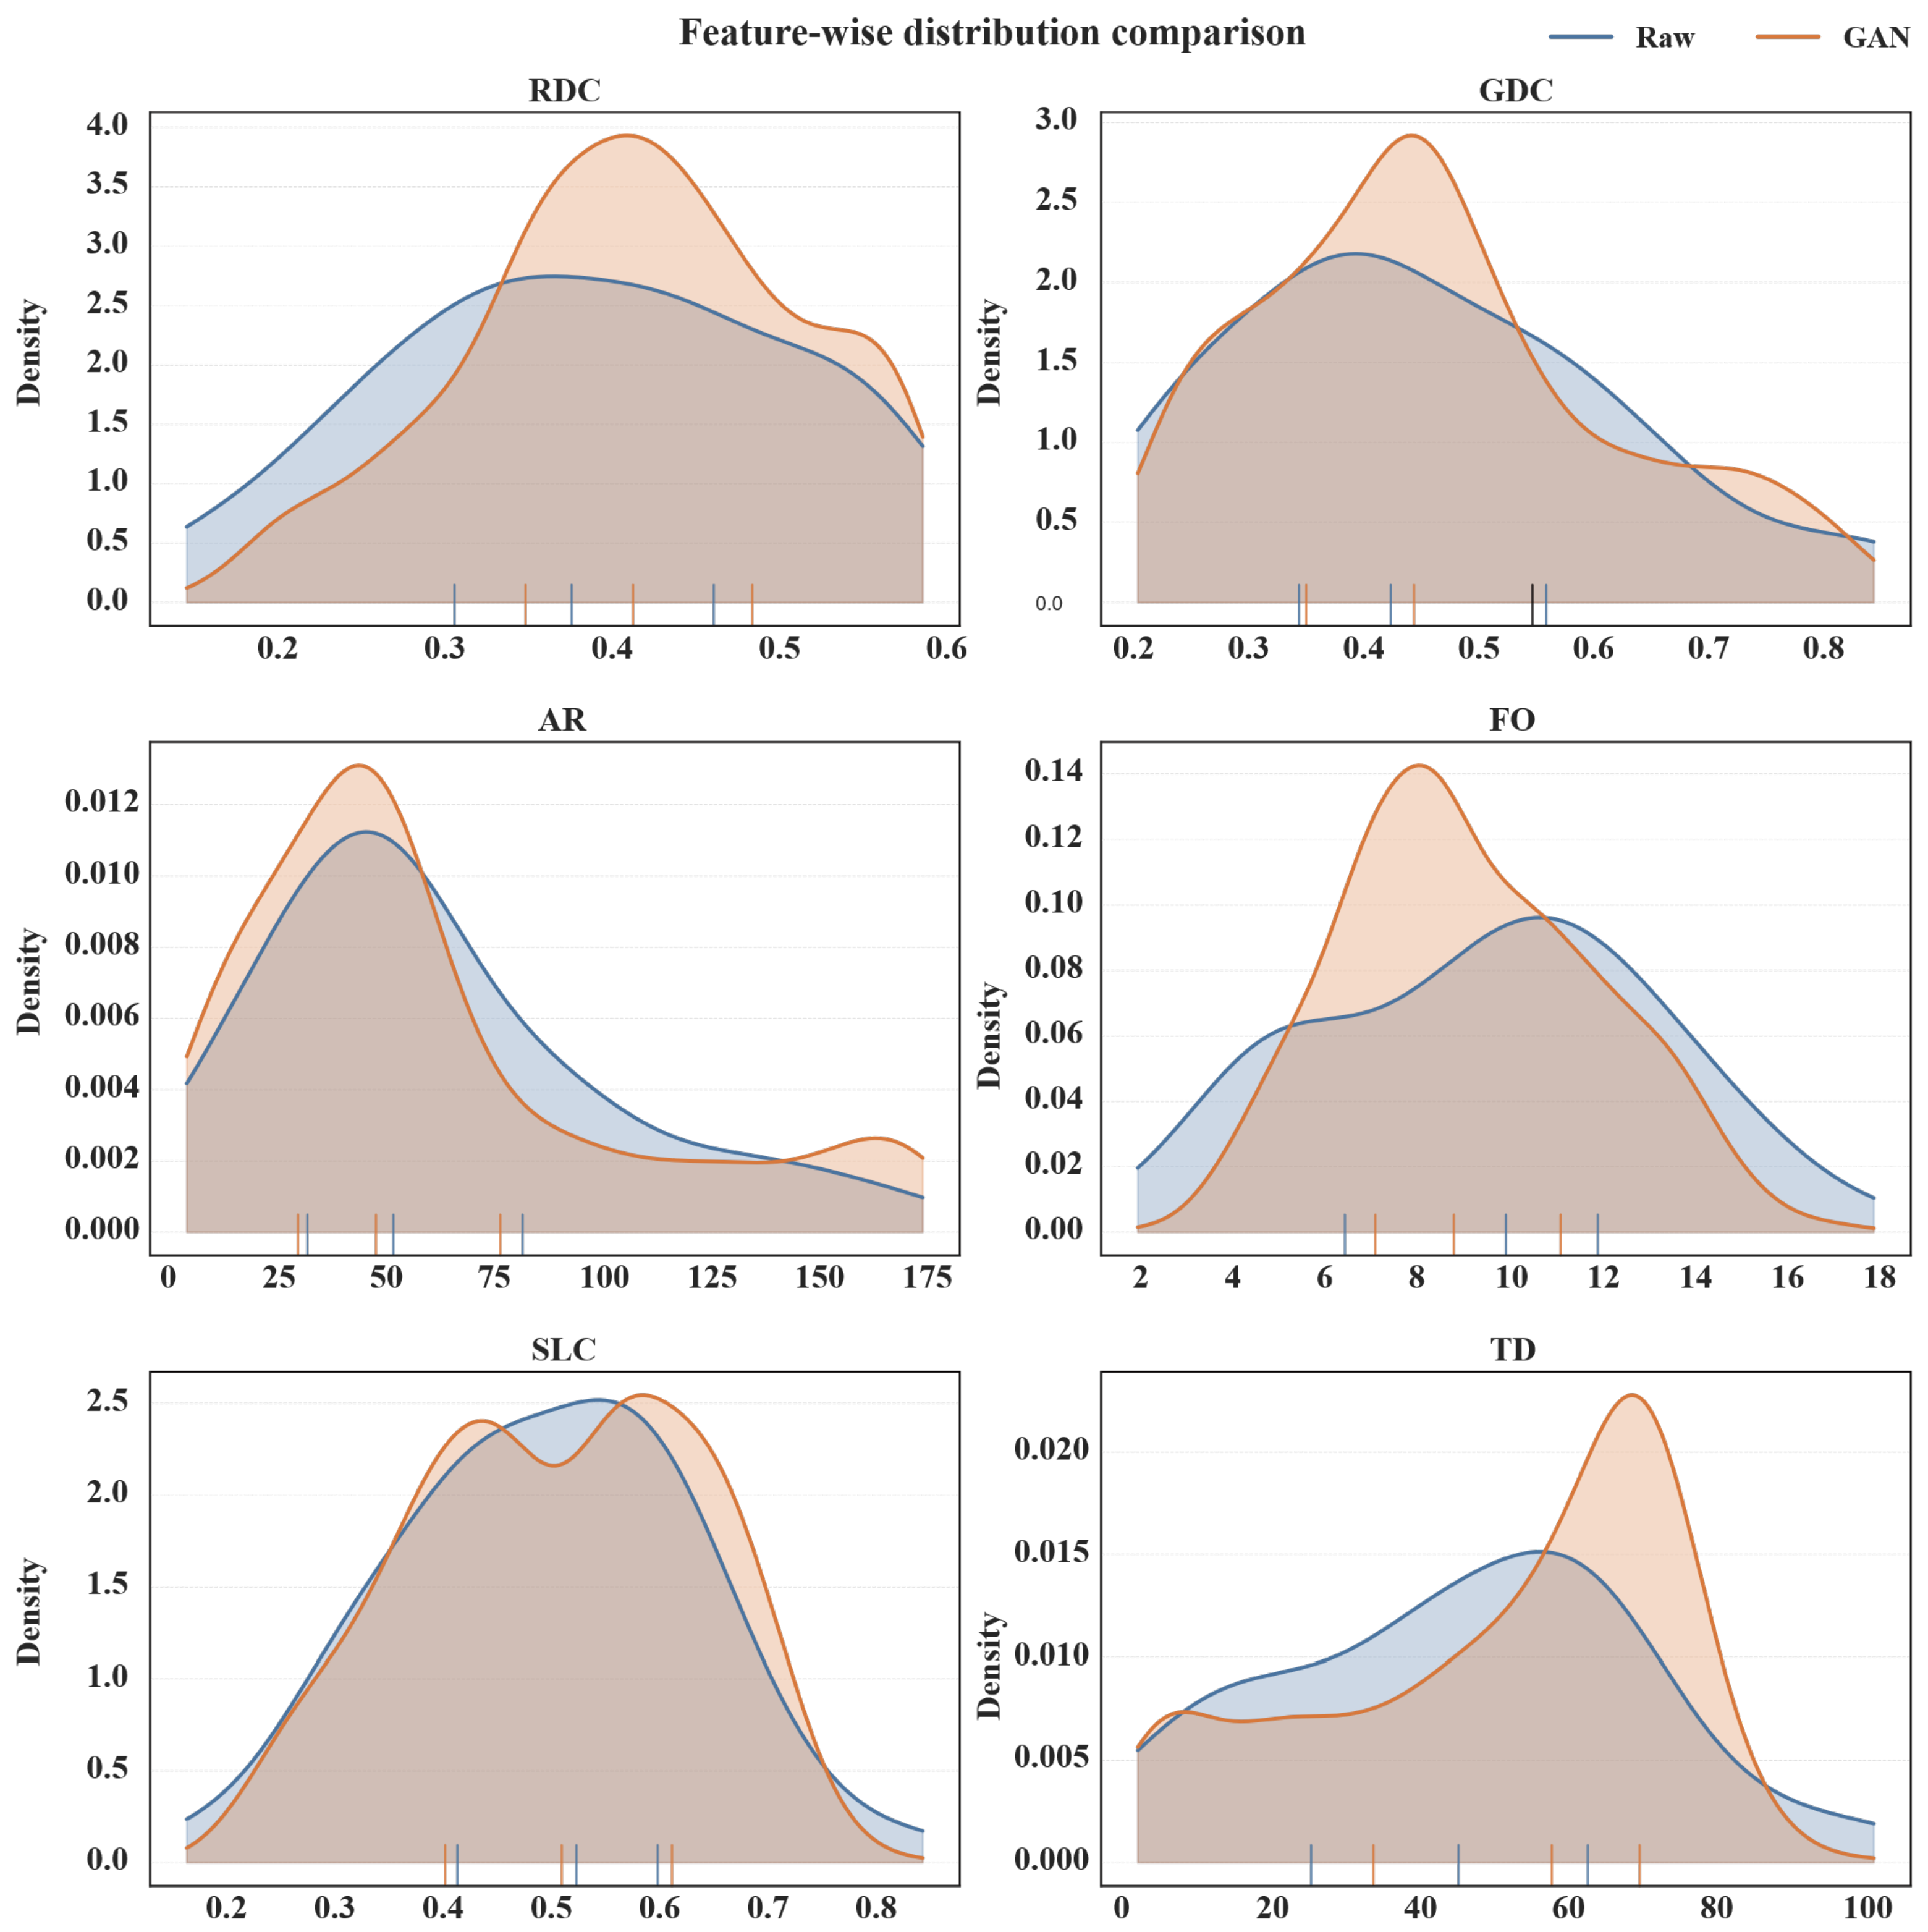
The most direct effect of GAN-based augmentation is the significant expansion of the training sample size, which effectively makes up for the scarcity of the original tunnel water inrush quantity dataset and enriches the learning space of the predictive model. As shown in Figure 3a, the original training set contained only 44 samples, which was far from meeting the basic sample requirements for machine learning modeling of tunnel hydrogeological data. After 20-fold augmentation, the training set size was expanded to 880 samples, which realized a substantial increase in the number of samples on the premise of maintaining the original data characteristics. Meanwhile, Figure 4 shows that the GAN augmentation effectively supplemented the scarce value intervals of all six hydrogeological–structural input indicators in the original training set. The sample distribution of each indicator became more continuous and uniform after augmentation, which helped the model learn the complete response relationship between the input indicators and the water inrush quantity across the full feature space, instead of only memorizing the limited sample information in the original dataset.
Beyond the sample size expansion, the GAN augmentation strategy used in this study maintained high consistency between the generated synthetic samples and the original data in the distribution characteristics of the target variable, which is the core prerequisite for the augmented data to be effectively used for model training. Figure 3b presents the distribution comparison of the WIQ before and after augmentation, and the curve trend of the synthetic sample distribution is highly consistent with that of the original data, without obvious distortion or deviation in the peak and range of the distribution. The empirical cumulative distribution function curve in Figure 3c almost overlaps for the original and augmented data, which quantitatively verifies the good distribution alignment of the target variable. The violin-box plot in Figure 3d further shows that the median, quartile range and extreme value distribution of the water inrush quantity in the augmented dataset are basically the same as those in the original dataset. These results confirm that the GAN model trained on the joint feature–target space can generate synthetic samples with statistical authenticity for the target variable, and the generated water inrush quantity values are in line with the actual engineering distribution characteristics of the studied tunnel project.
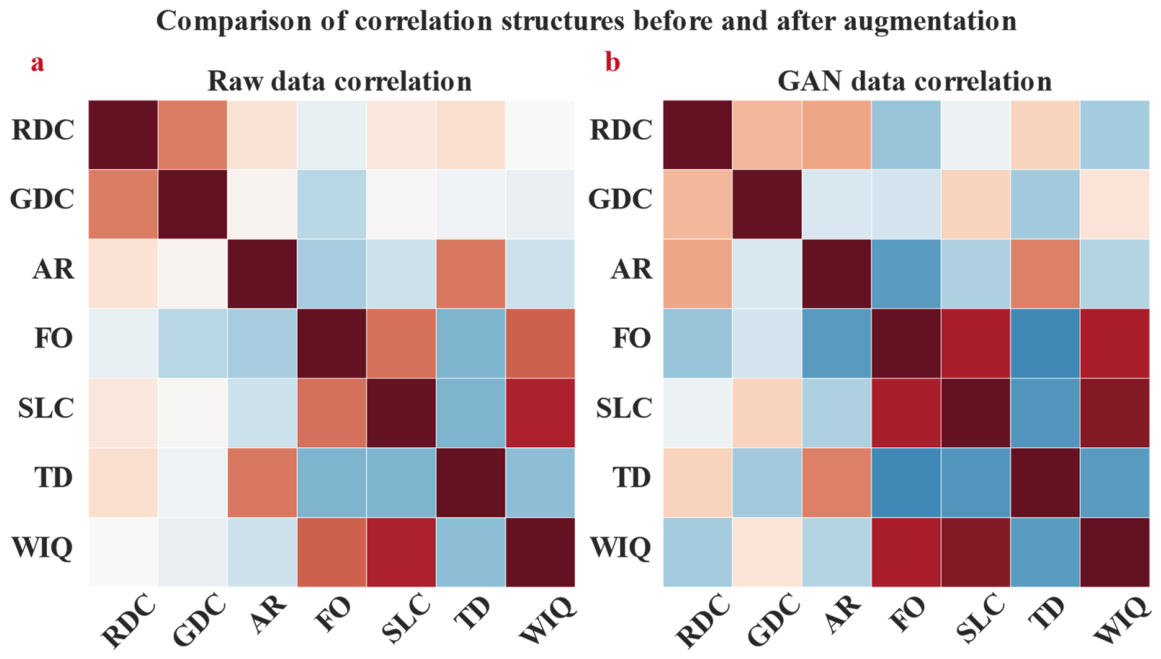
In addition to the target variable, the augmented dataset also well preserved the statistical distribution of all input indicators and the intrinsic physical structure of the original data, including the correlation and dependence between variables, which is crucial for the physical interpretability of tunnel water inrush quantity prediction. As shown in Figure 3, each input indicator (RDC, GDC, AR, FO, SLC, TD) maintained consistent statistical characteristics before and after augmentation, with no significant changes in the mean, variance and overall distribution trend. The scarce value intervals that were underrepresented in the original data were effectively filled with reasonable synthetic samples, without generating abnormal values that violate hydrogeological engineering rules. More importantly, Figure 5 shows that the physical structure of the original data, represented by the correlation between variables, was well preserved after augmentation. The Pearson correlation coefficient matrix of the input indicators and the target variable in the augmented dataset was highly consistent with that of the original data, and the positive and negative correlation and correlation intensity between variables remained basically unchanged. This means that the GAN augmentation not only retained the marginal distribution of a single variable but also preserved the inter-variable coupling relationship that reflects the actual hydrogeological mechanism, ensuring that the augmented data has both statistical rationality and engineering physical meaning.
Overall, the training-only GAN augmentation expanded the empirical learning space of the small-sample WIQ dataset and preserved the main marginal distributions and correlation patterns observed in the original training subset. These results suggest that the synthetic samples were broadly consistent with the available real training data and may provide additional learning signals for downstream models under the present split. However, such consistency checks cannot prove that the generated samples fully represent the true hydrogeological distribution, especially for rare high-inflow conditions. Therefore, the augmented dataset should be regarded as a statistically guided training-enrichment set rather than a substitute for additional field observations.
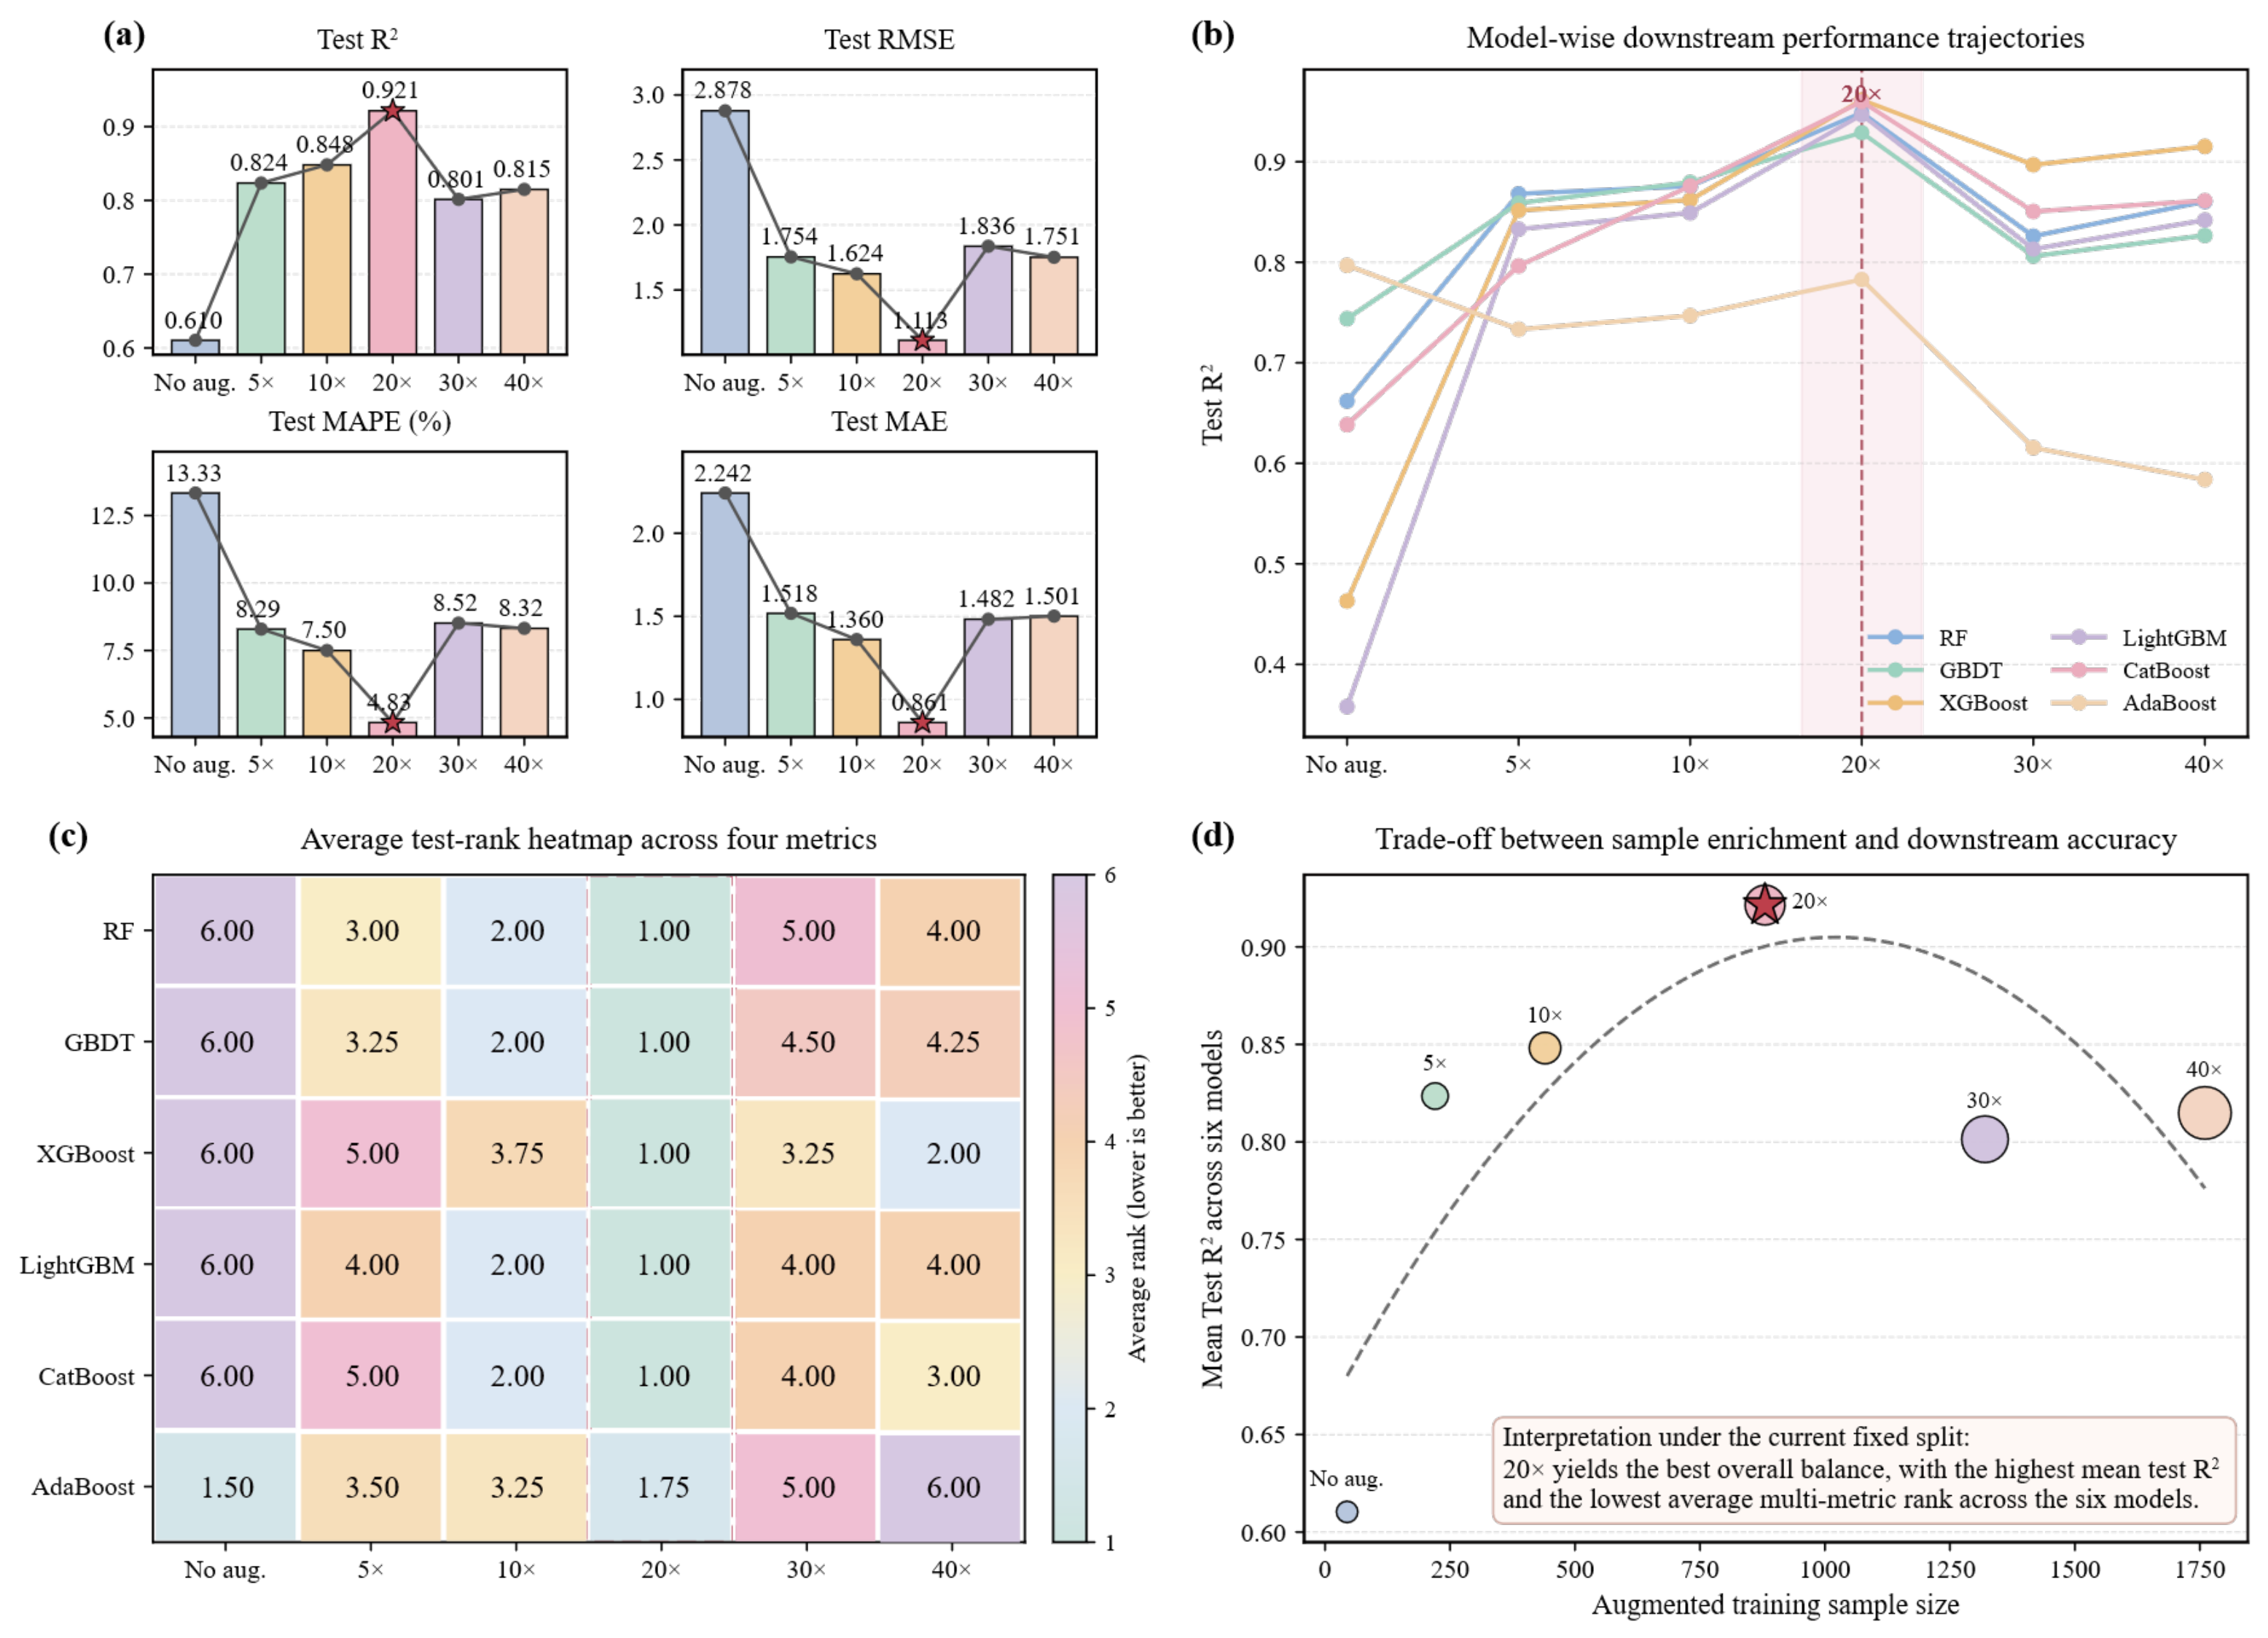
To further assess whether the observed gains from GAN-based augmentation depend on the expansion ratio, we evaluated the downstream sensitivity of six baseline learners under six settings: no augmentation, 5×, 10×, 20×, 30×, and 40×. In all cases, augmentation was applied only to the training subset after the fixed 80/20 split, while the real test subset remained unchanged for hold-out evaluation. This design follows the leakage-aware protocol established in the methodology and allows the influence of the augmentation scale to be examined without contaminating the test distribution. The purpose of this analysis was not to search for a universally ideal ratio, but to determine whether there exists a practically reasonable range in which sample enrichment improves test performance without causing an obvious loss of statistical fidelity or excessive reliance on synthetic data.
Figure 6a shows that test performance changed systematically with the augmentation ratio rather than improving monotonically as more synthetic samples were added. Relative to the non-augmented case, moderate augmentation produced clear gains in overall predictive accuracy. The mean test R 2 across the six models increased from 0.610 under no augmentation to 0.824 at 5× and 0.848 at 10×, and then reached 0.921 at 20×. At the same time, the average error metrics decreased markedly, with the test RMSE falling from 2.878 to 1.113, test MAPE from 13.334% to 4.829%, and test MAE from 2.242 to 0.861. However, this improvement did not continue indefinitely. When the augmentation ratio was further increased to 30× and 40×, the average test performance declined, with a lower mean R 2 and higher error values than those observed at 20×. This pattern suggests that, under the present split, augmentation was beneficial up to an intermediate scale, whereas more aggressive expansion did not yield further gains and may have weakened the balance between training enrichment and hold-out generalization. This overall tendency is further supported by the model-wise trajectories in Figure 6b. Although the six baseline learners responded somewhat differently to increasing synthetic sample density, most models exhibited their strongest or near-strongest test R 2 values around the intermediate augmentation range rather than at the largest ratios. In other words, the observed trend was not driven by a single model alone, but was shared by most learners to varying degrees. Figure 6c provides an additional multi-metric view by summarizing average ranks across R 2 , RMSE, MAPE, and MAE. The heatmap shows that the 20× setting consistently occupied the most favorable rank position for most models, whereas the no-augmentation case generally remained among the weakest. Taken together, these results indicate that the advantage of training-only augmentation is not limited to one evaluation metric or one specific learner, but appears as a broader pattern across the benchmarked models under the current experimental protocol. The result can be interpreted in light of the dual role of augmentation in small-sample learning. When the original training set is too small, moderate synthetic expansion can densify the empirical training distribution, fill underrepresented regions of the feature space, and provide more stable learning signals for downstream regressors. This is consistent with the earlier distributional analyses, which showed that the augmented data largely preserved the marginal characteristics and inter-variable coupling structure of the original samples. At the same time, a larger synthetic dataset is not automatically a better one. Once the augmentation ratio becomes too high, the effective training distribution may become increasingly dominated by generated rather than observed samples. In that situation, even if the synthetic data remain broadly plausible, subtle deviations from the original data structure may accumulate and reduce the benefit of further expansion on the real hold-out set. This interpretation is consistent with the methodological principle stated earlier in the manuscript: augmentation should be judged not only by sample-size growth, but also by its compatibility with statistical fidelity and downstream predictive utility. A more direct summary is provided by Figure 6d, which relates augmented training sample size to the mean downstream test performance across the six models. The curve shows a clear rise from no augmentation to moderate expansion, followed by a decline at higher ratios. Under the present split, the 20× setting provided a favorable compromise between sample enrichment, statistical fidelity, and downstream test performance. However, this choice should be regarded as empirical and dataset-specific rather than universally optimal. In particular, the current evidence comes from a single fixed split and a small real test set, so the preferred augmentation ratio may shift under repeated resampling, alternative generator settings, or different tunnel datasets. Therefore, the present analysis should be interpreted as practical support for the adopted 20× configuration in this study, rather than as proof that 20× is the best augmentation scale in general.
Overall, the sensitivity analysis adds an important qualification to the earlier augmentation results. Training-only GAN augmentation appears beneficial for this small-sample WIQ dataset, but its effect is ratio-dependent. Moderate expansion improved downstream test behavior more effectively than either no augmentation or overly aggressive augmentation. This finding strengthens the rationale for using an empirically selected augmentation level within a leakage-aware pipeline, while also underscoring that the augmentation scale should be validated for each dataset rather than assumed a priori.

5.3. Optimization Algorithm and Baseline Model Selection

Reliable prediction of tunnel water inrush requires not only expressive learning models but also robust hyperparameter optimization under small-to-moderate sample sizes and highly heterogeneous hydrogeological conditions. In such settings, conventional trial-and-error tuning can easily overfit to a particular split and may fail to locate stable configurations in a rugged objective landscape. Therefore, before constructing the proposed hybrid intelligence framework, we first identify (i) an optimization algorithm that exhibits strong convergence and generalization across complex search spaces, and (ii) a baseline regression model that provides consistently high predictive accuracy and competitive statistical ranking on both training and test sets [5,23,29].
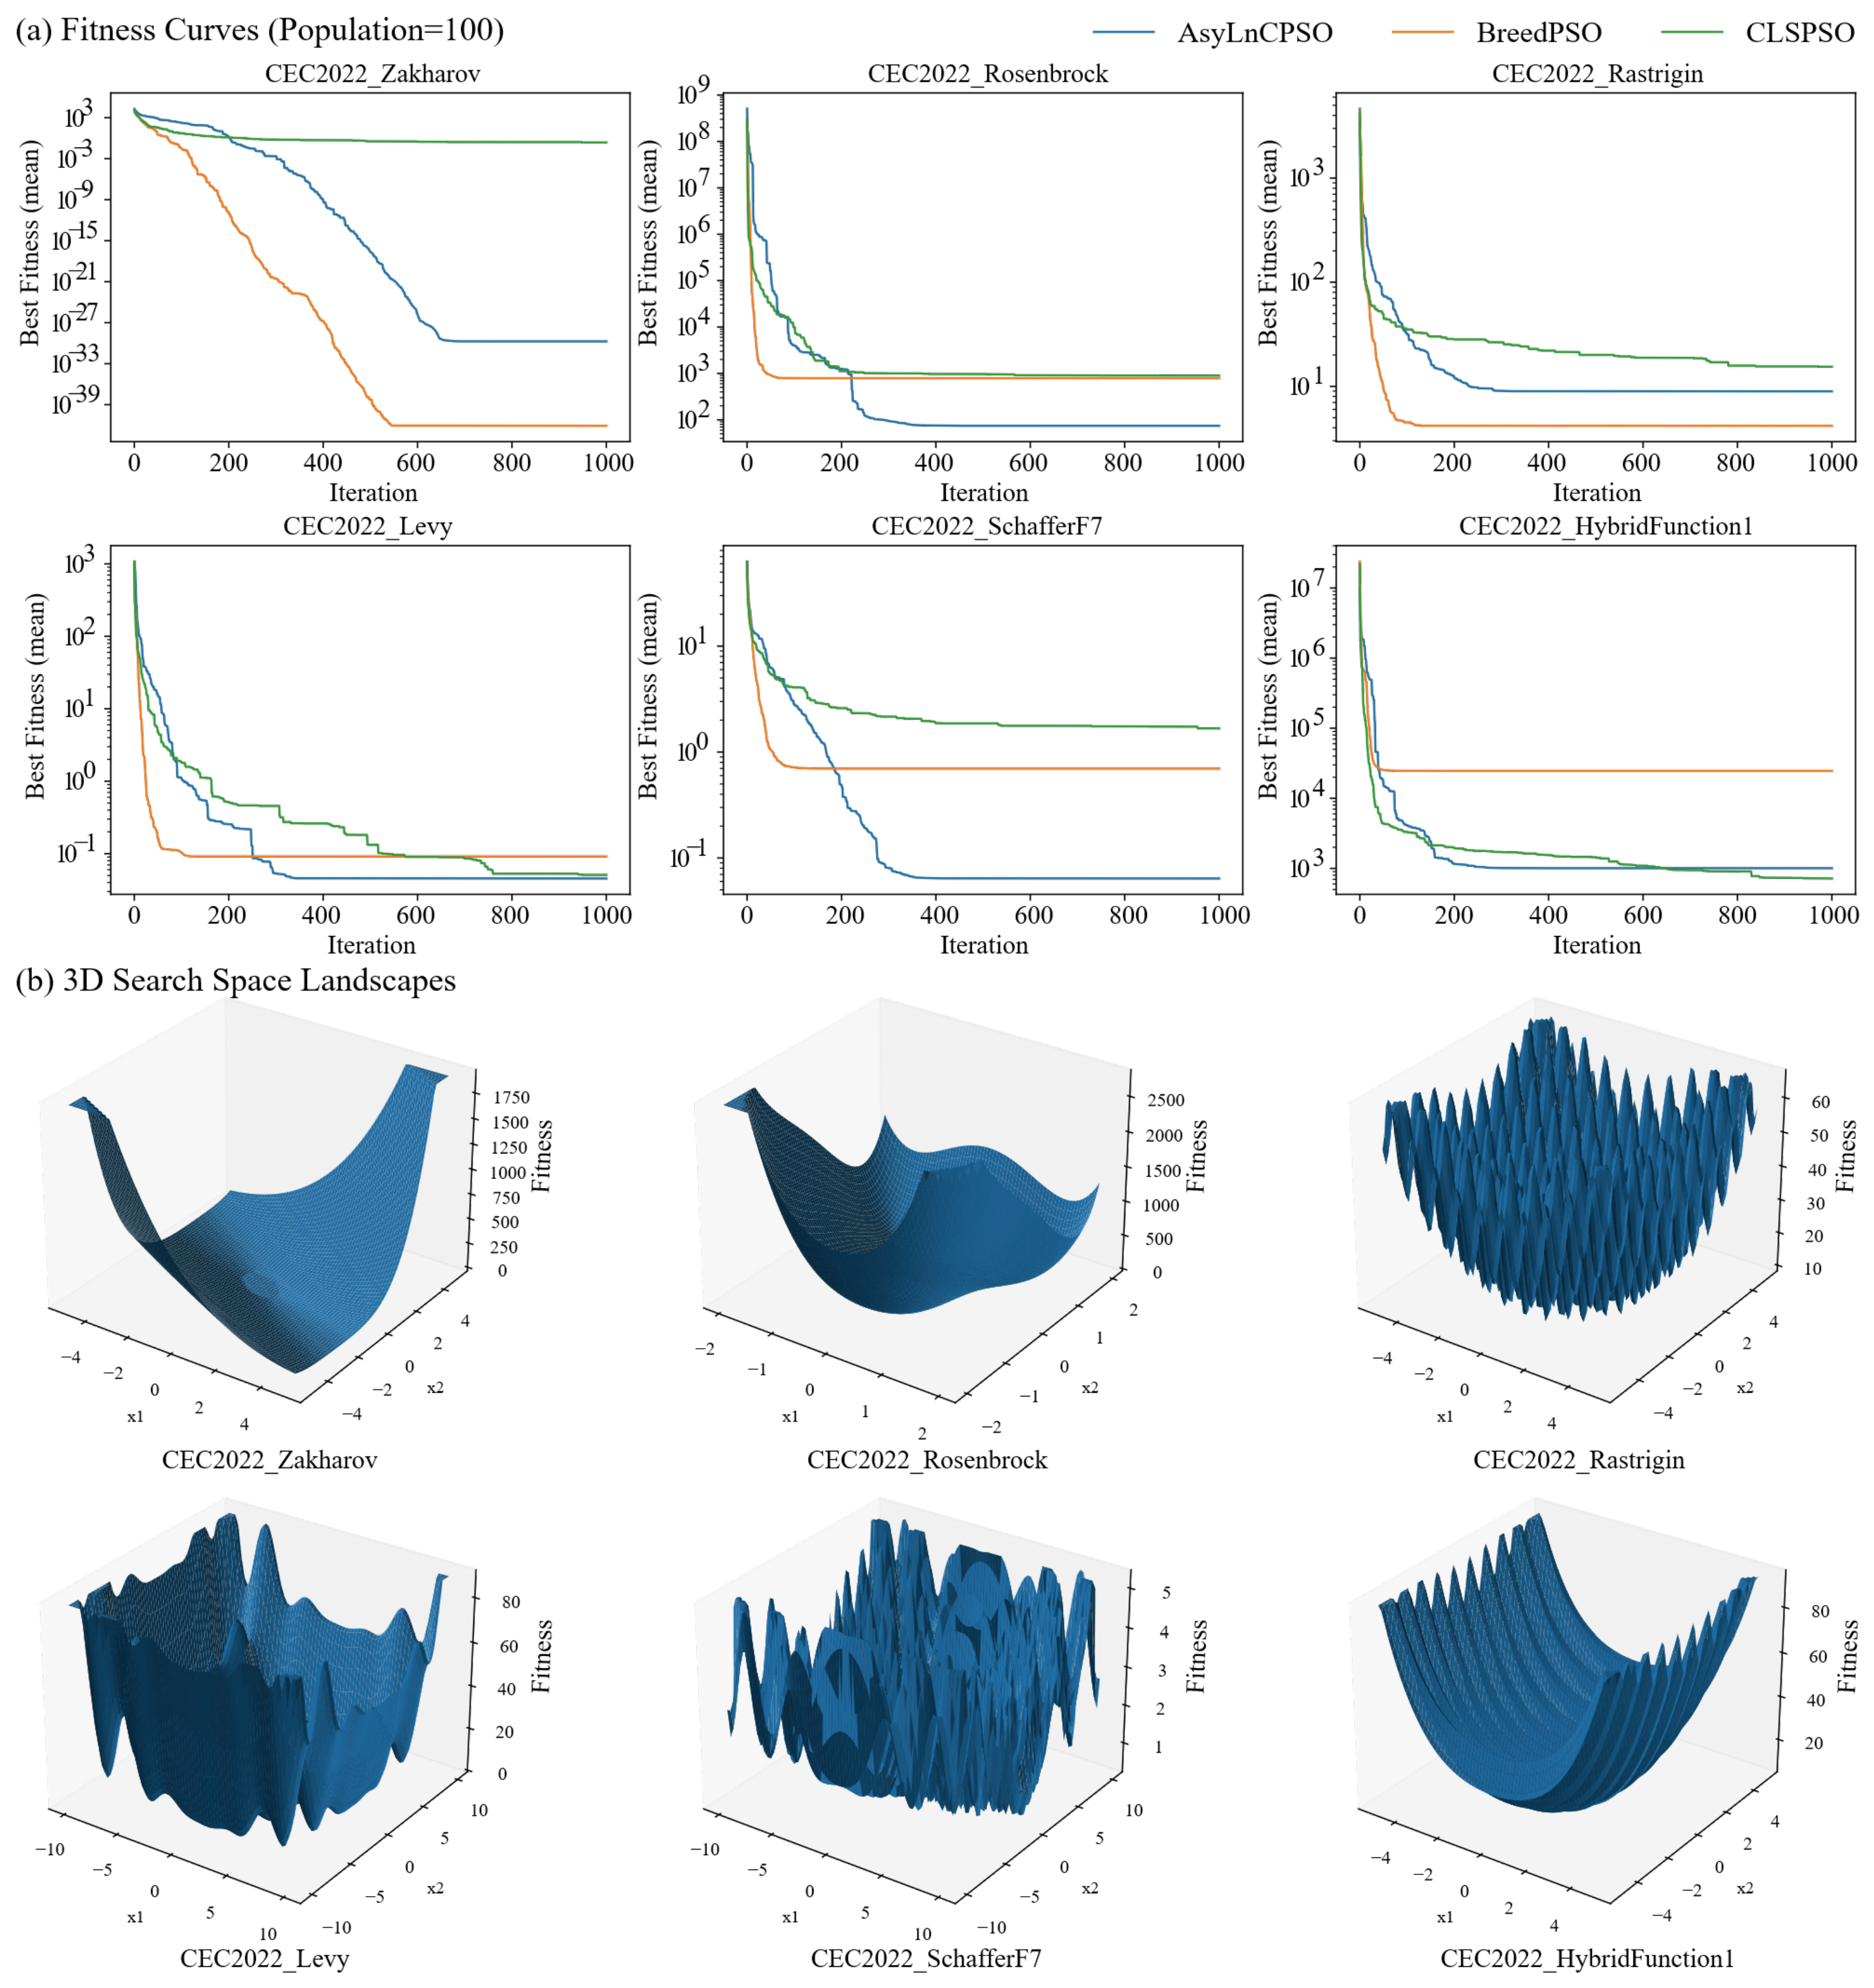
Figure 7 evaluates candidate optimizers via benchmark function testing and intuitive search space visualization. The benchmark suite includes landscapes with markedly different characteristics—from smooth unimodal basins to highly multimodal surfaces with dense local minima—mirroring the diversity of difficulty encountered in hyperparameter tuning. The convergence curves (upper panels) show that the algorithms behave similarly on simpler functions at early iterations, but their trajectories diverge as the landscape becomes more deceptive: a robust optimizer should reduce the objective rapidly while avoiding premature stagnation. The 3D surfaces (lower panels) further contextualize this behavior by illustrating how quickly local traps proliferate in multimodal settings, where insufficient exploration can lock the search into suboptimal regions. Overall, Figure 7 supports the need for an optimizer that balances exploration and exploitation adaptively, rather than relying on a fixed search pattern.
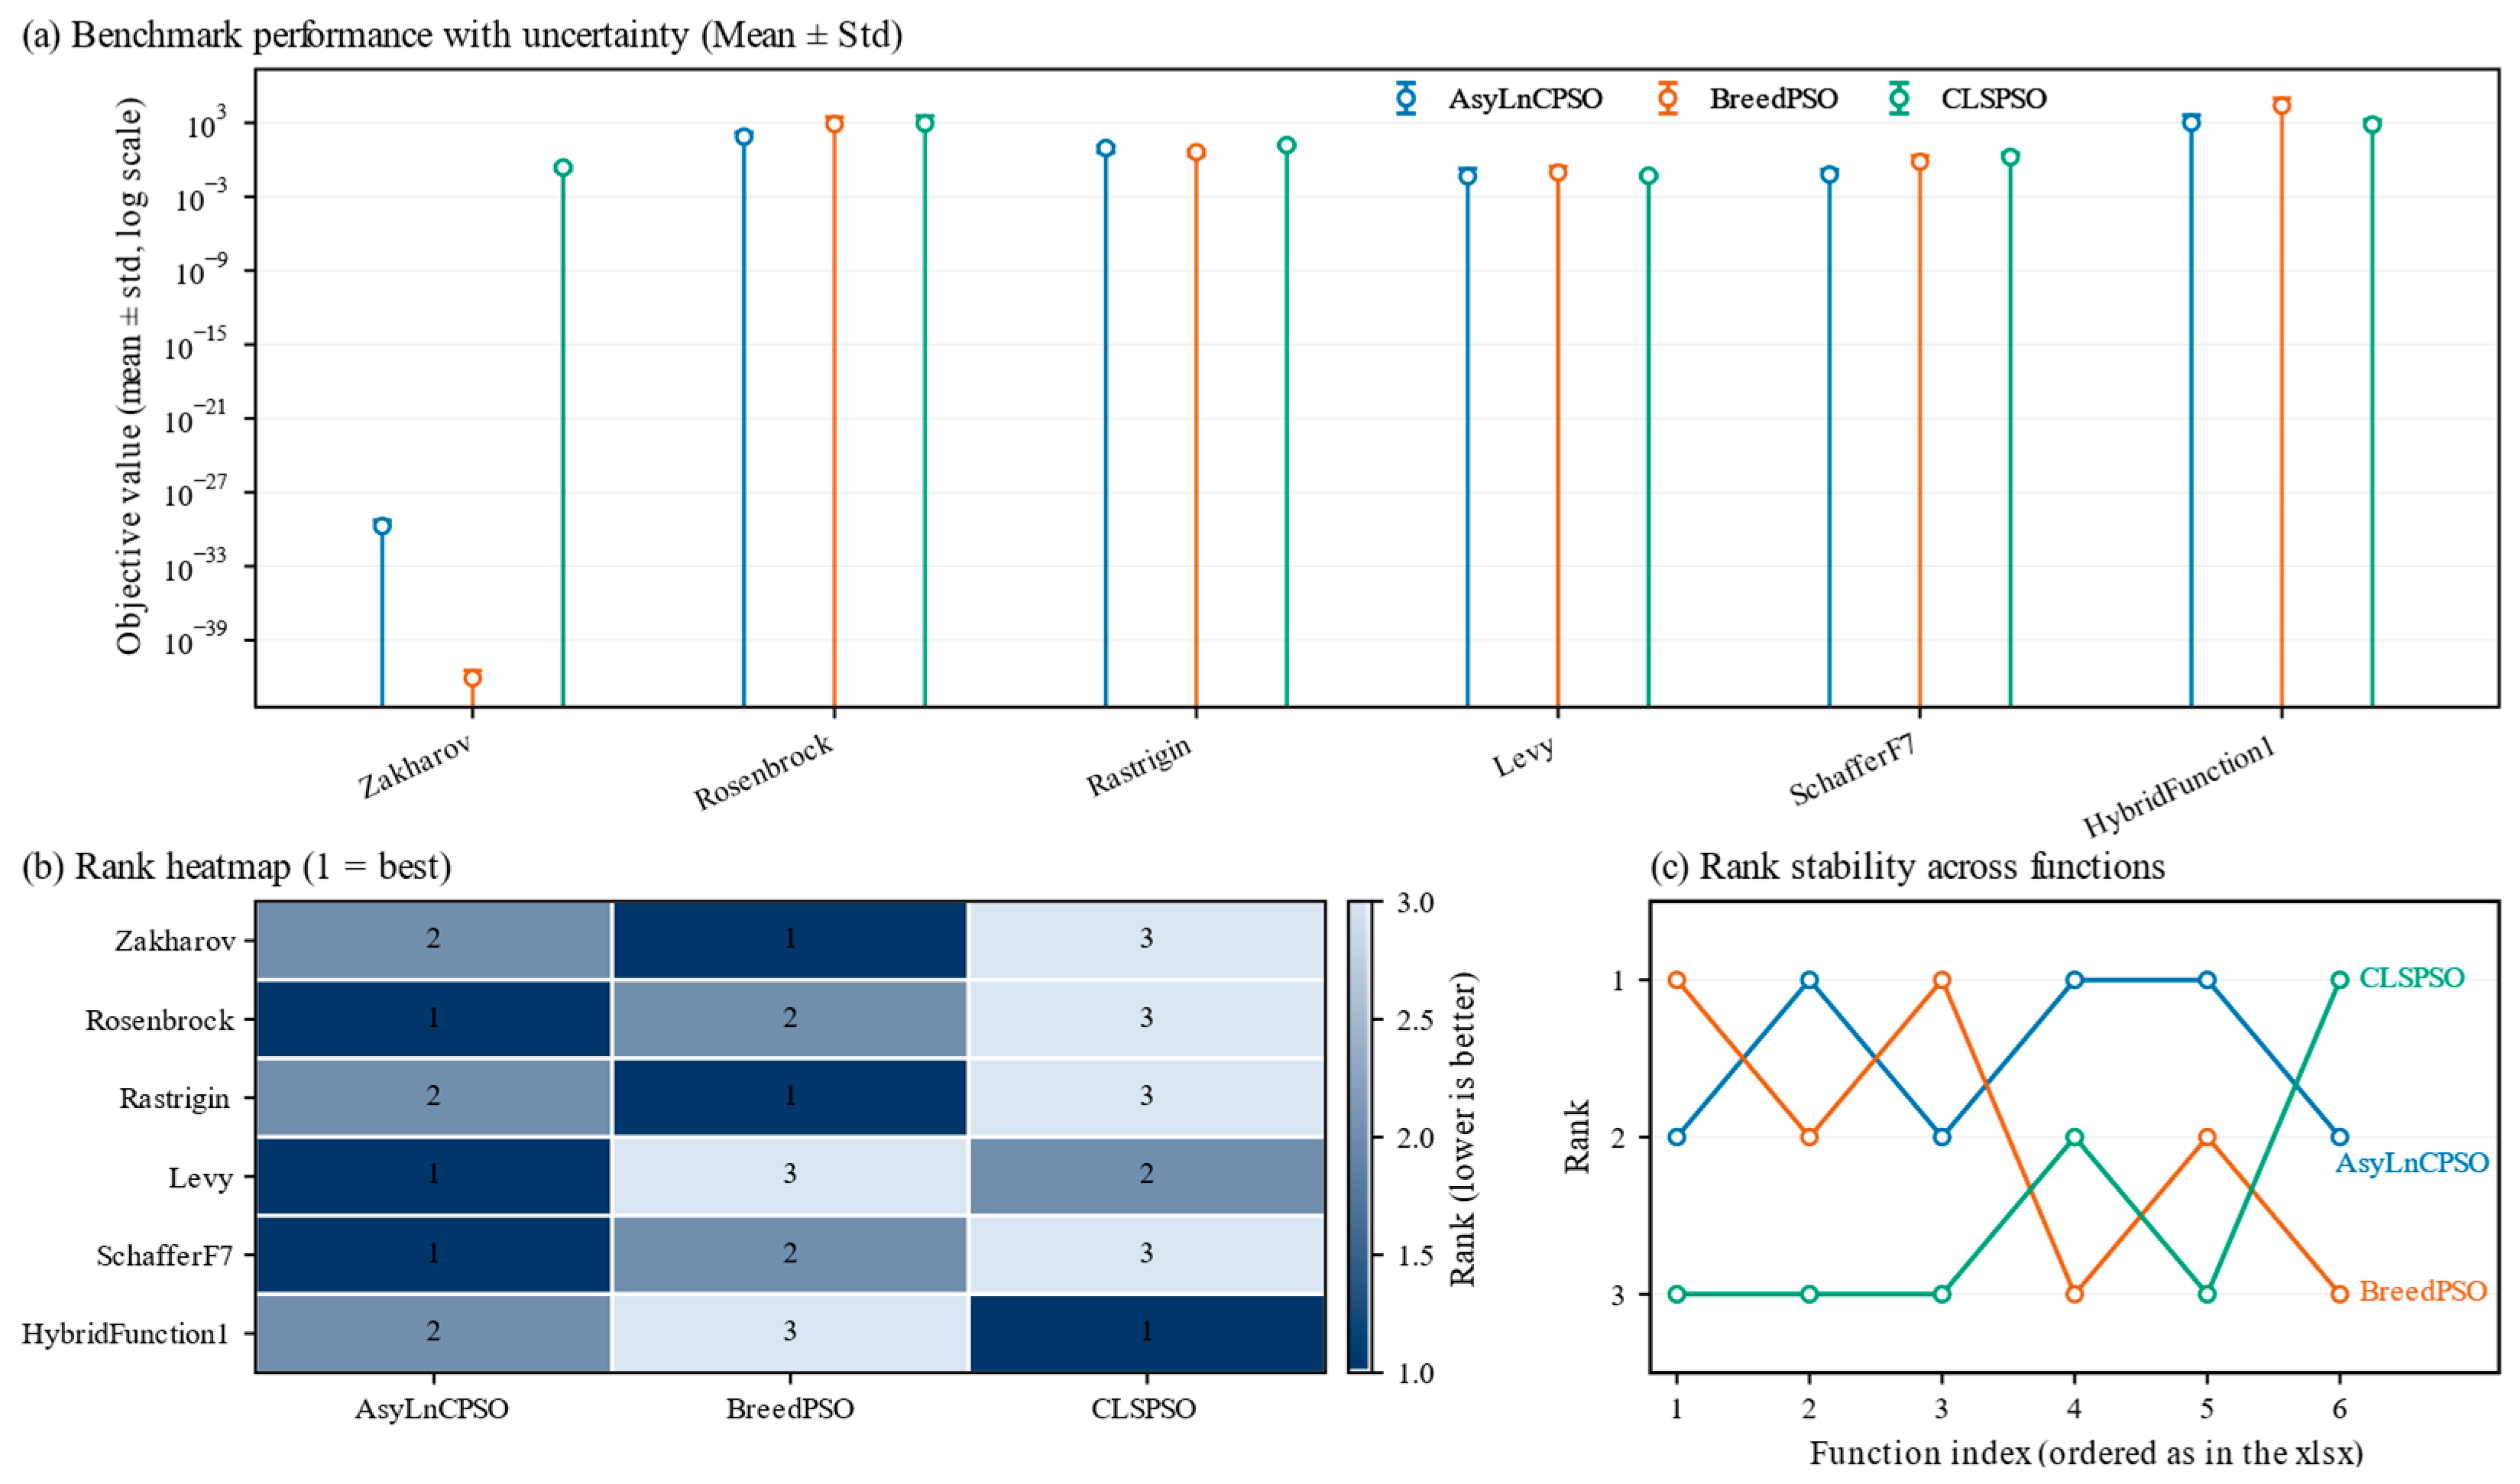
Building on this motivation, Figure 8 provides a direct performance comparison among optimizers under identical experimental settings. The summary views (including the rank-style matrix and the trajectory-style comparison) indicate that the selected optimizer attains more stable improvements across repeated trials and maintains competitive performance across functions of varying complexity, rather than excelling only in a narrow subset. In particular, its optimization path shows fewer oscillations and less sensitivity to local ruggedness, implying a stronger ability to escape local minima and converge toward high-quality solutions. Taken together, the evidence in Figure 7 and Figure 8 justifies adopting the best-performing optimizer as the search engine for subsequent CatBoost hyperparameter tuning, ensuring that the final hybrid model is not an artifact of a fragile or landscape-specific optimization strategy.
After selecting the optimizer, we determine a strong baseline learner to anchor the hybrid design. Figure 9 summarizes baseline model selection using a critical difference (CD) diagram based on average ranks, reported separately for the training and test sets (CD = 3.37). Across both subsets, CatBoost appears among the top-ranked methods and shows the most consistent dominance pattern relative to other tree-based baselines. Importantly, the separation between CatBoost and several competitors spans the CD threshold in key comparisons, indicating that the observed advantage is not merely numerical but also statistically meaningful under the adopted multiple-comparison procedure. Consequently, CatBoost is selected as the baseline regressor, and—combined with the chosen optimizer—forms the foundation of the subsequent AsyLnCPSO–CatBoost hybrid intelligence model developed in the next section.

5.4. Developing Hybrid Intelligence

Building on the prior screening results—where AsyLnCPSO was identified as the optimal optimizer and CatBoost as the most robust baseline learner—a hybrid predictor (AsyLnCPSO–CatBoost) was constructed to improve WIQ prediction under the present dataset setting. This section focuses on the detailed training process, hyperparameter optimization, and final predictive performance of the proposed hybrid model.
To ensure the robustness and generalization of the hybrid model, a strict training protocol was adopted. The GAN-augmented dataset (880 training samples) was used as the learning foundation, while the independent test set (11 samples) was reserved for unbiased independent hold-out evaluation under the current split. During hyperparameter tuning, 5-fold cross-validation was implemented on the training set to avoid overfitting to a single data split. The optimization objective was to minimize the MSE, which effectively penalizes large prediction deviations critical for engineering safety. Three performance-critical hyperparameters of CatBoost were targeted for optimization: tree depth, learning rate, and L2 regularization term. Their search ranges were predefined based on domain knowledge and model characteristics, as shown in Table 3: tree depth ranged from 1 to 10, learning rate from 0.01 to 0.30, and L2 regularization term from 1 to 20. The maximum number of iterations for the AsyLnCPSO optimizer was set to 500 to balance search thoroughness and computational efficiency.
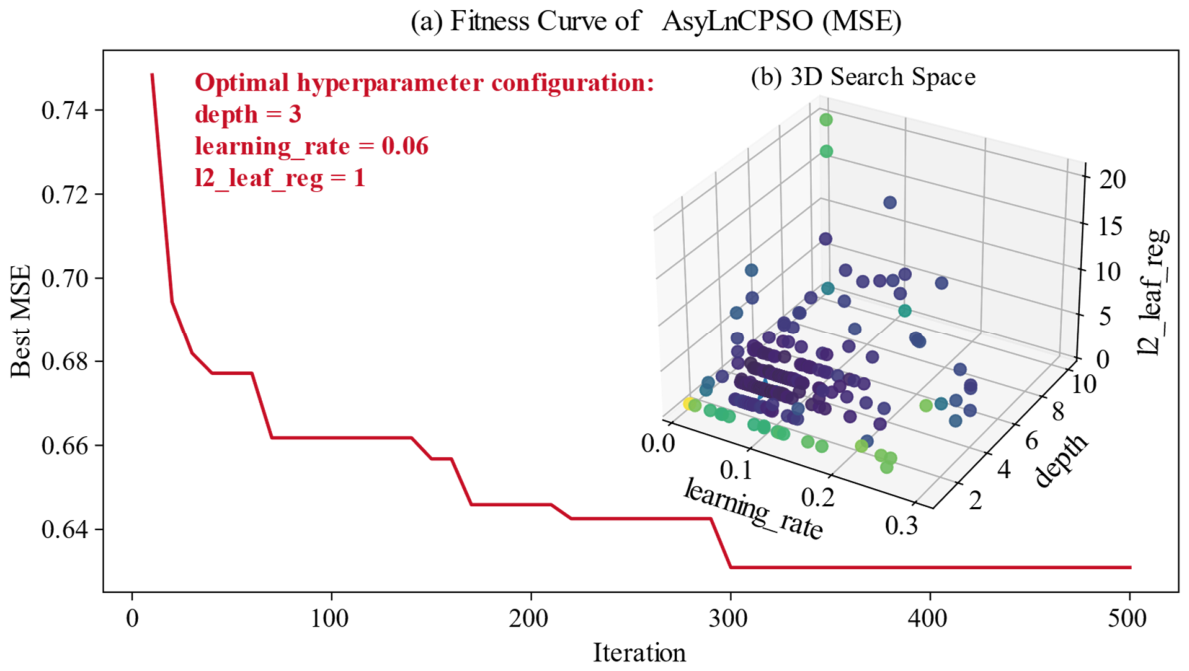
The iterative optimization process and search behavior of AsyLnCPSO are visualized in Figure 10. The fitness curve (Figure 10a) shows a clear downward trend throughout the 500 iterations, indicating that the optimizer continuously refines the hyperparameter combination and effectively avoids premature stagnation. This performance is attributed to the asymmetric linearly varying acceleration mechanism of AsyLnCPSO, which balances global exploration in the early stages and local exploitation in the later stages. The 3D search space visualization (Figure 10b) further illustrates that the swarm initially explores a broad region and gradually concentrates around the low-error basin, confirming a well-coordinated exploration–exploitation trade-off. This behavior is particularly suitable for the rugged response surface of tunnel hydrogeological data, where small parameter changes can lead to significant performance differences.
Through the iterative optimization process, AsyLnCPSO identified the optimal hyperparameter configuration for CatBoost: tree depth = 3, learning rate = 0.06, and L2 regularization term = 1. This configuration achieved the best cross-validated MSE of 0.6309 on the training set, indicating a stable and effective parameter combination that balances model complexity and fitting ability.
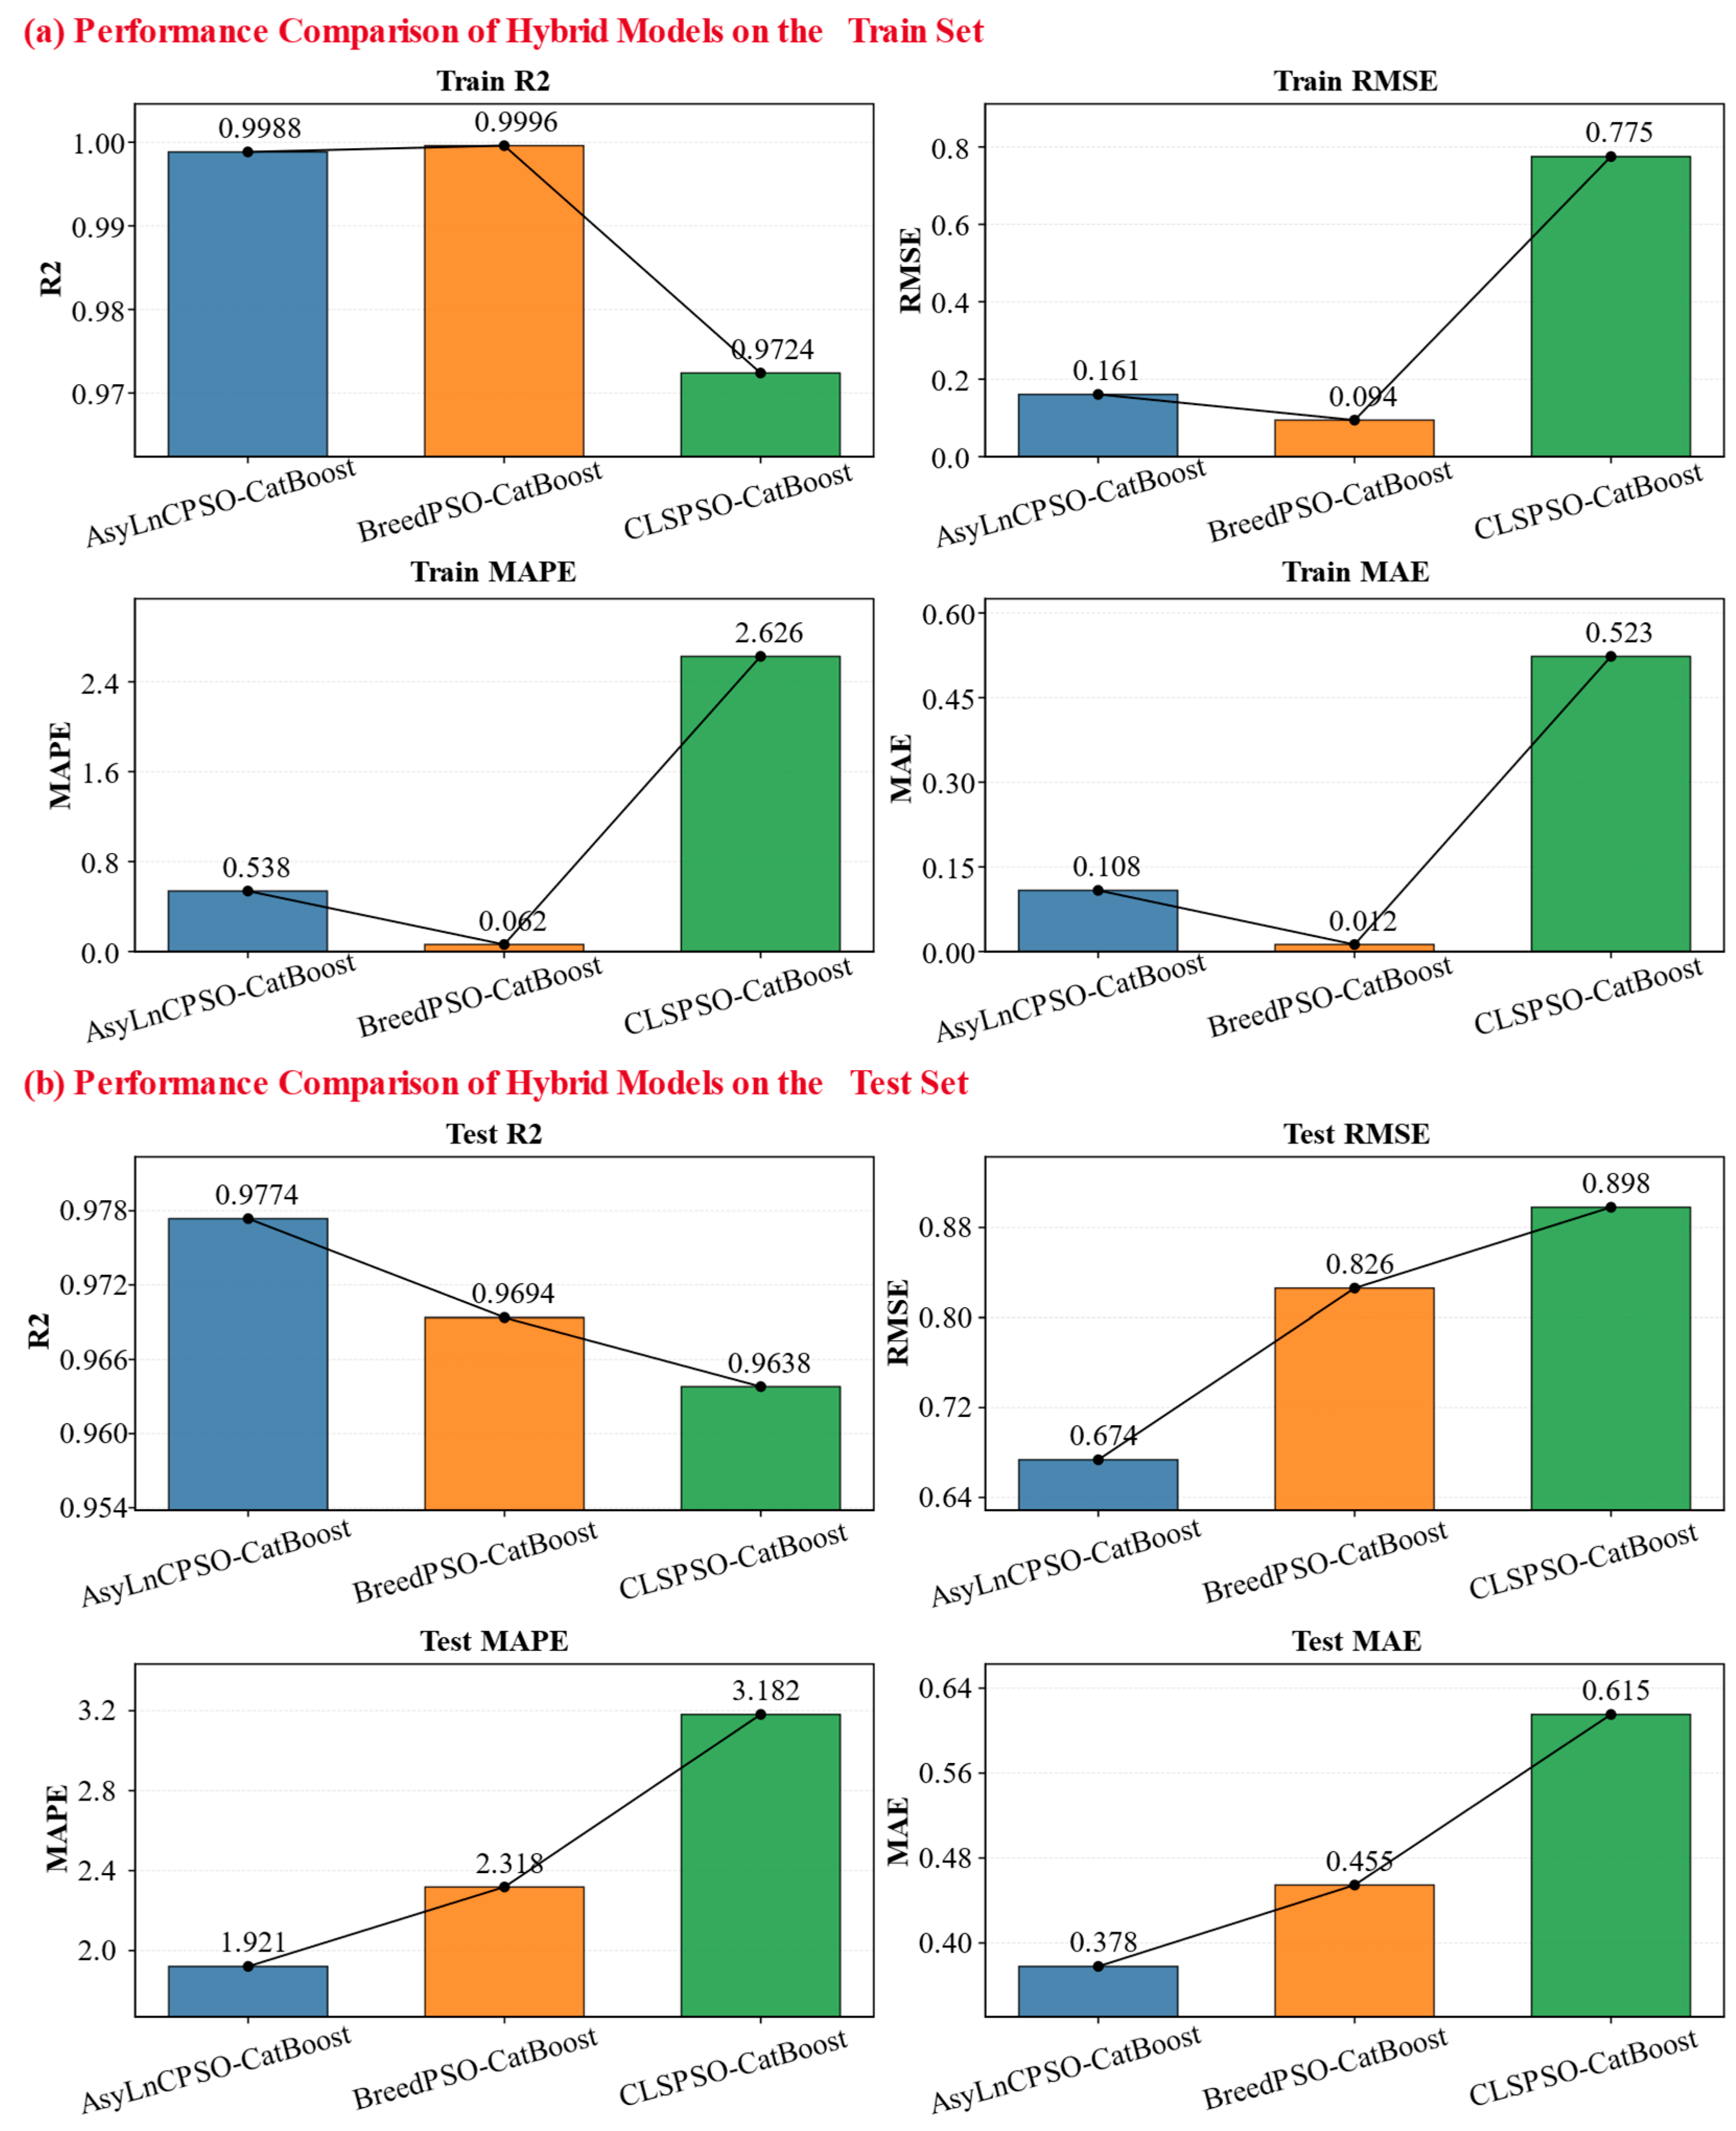
The final AsyLnCPSO–CatBoost hybrid model was retrained on the full augmented training set with the optimal hyperparameters, and its performance was evaluated on both the training and test sets (Table 4). On the training set (880 samples), the model achieved very high fitting performance: the R2 reached 0.9988, the MAPE was only 0.5381%, the MAE was 0.1083 cubic meters per hour, and the RMSE was 0.1608 cubic meters per hour. On the independent test set (11 samples), the model also showed favorable predictive performance: R2 remained as high as 0.9774, MAPE was 1.9207%, MAE was 0.3779 cubic meters per hour, and RMSE was 0.6736 cubic meters per hour. These results suggest that the hybrid model can fit the augmented training data well and achieve encouraging performance on the held-out test samples under the present split. However, the test set contains only 11 real observations, and the augmented samples are derived from the 44 real training samples. Therefore, the high R2 value should not be overinterpreted as definitive evidence of robust generalization. Rather, it indicates that the proposed pipeline is promising within the current project-specific dataset and requires further confirmation through repeated splitting, fold-wise augmentation, and external validation.
Overall, the AsyLnCPSO–CatBoost hybrid model integrates the advantages of swarm-intelligence optimization and gradient-boosted tree learning. The systematic hyperparameter tuning via AsyLnCPSO ensures stable and optimal model configuration, while the GAN-augmented dataset provides sufficient learning signals. The resulting model delivers high predictive accuracy under the current experimental setting and shows preliminary potential for generalization within the studied project.

5.5. Comprehensive Comparison of Model Performance

To further evaluate the comparative performance of the proposed framework, this section conducts a comprehensive performance comparison from two dimensions: baseline models trained on the GAN-augmented dataset (Figure 11) and hybrid models integrating different swarm-intelligence optimizers with CatBoost (Figure 12). The comparison focuses on four key metrics (R2, RMSE, MAE, and MAPE) to ensure a holistic evaluation of goodness-of-fit, error magnitude, and relative accuracy.
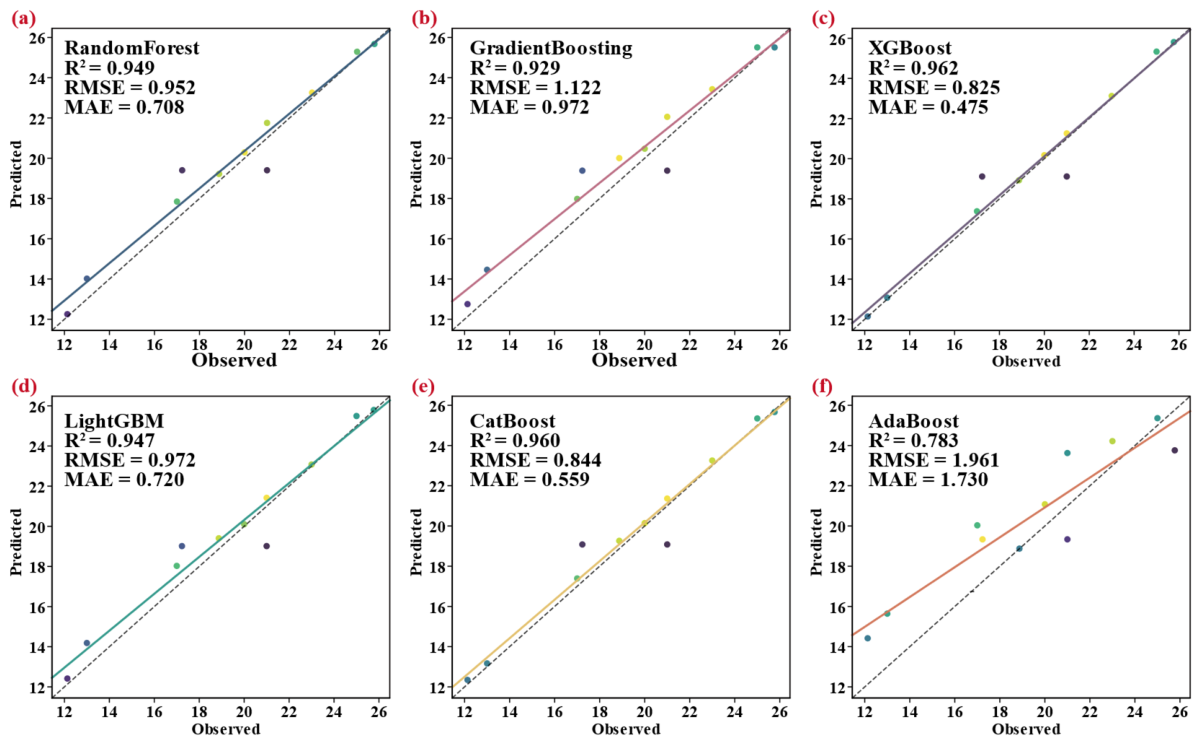
First, the performance of six baseline models after data augmentation is analyzed using Figure 11. Compared with their performance on the original small-sample dataset (Section 5.1), all baseline models show improved test performance under the current split, suggesting that GAN-based augmentation may be beneficial in this dataset setting. Among these augmented baseline models, XGBoost achieves the highest R2 of 0.962, accompanied by an RMSE of 0.825 cubic meters per hour and an MAE of 0.475 cubic meters per hour. CatBoost follows closely with an R2 of 0.960, an RMSE of 0.844 cubic meters per hour, and an MAE of 0.559 cubic meters per hour. RandomForest and LightGBM also demonstrate strong performance, with R2 values of 0.949 and 0.947, respectively. GradientBoosting shows a moderate improvement with an R2 of 0.929, while AdaBoost remains the weakest among the augmented baselines, with an R2 of 0.783, an RMSE of 1.961 cubic meters per hour, and an MAE of 1.730 cubic meters per hour. The observed–predicted scatter density plots in Figure 11 further illustrate that the augmented baseline models produce predictions more closely aligned with observed values, though some dispersion is still visible for high WIQ values.
Building on the augmented baselines, three hybrid models are constructed by combining CatBoost with AsyLnCPSO, BreedPSO, and CLSPSO optimizers, respectively. Their performance is visualized in Figure 12, and the results show that hybrid models showed better numerical performance than the augmented baseline models across the evaluated metrics under the current split, highlighting the value of swarm-intelligence-driven hyperparameter tuning. Among the three hybrid models, AsyLnCPSO–CatBoost showed the best overall performance under the present experimental setting. On the training set, it achieves an R2 of 0.9988, an MAPE of 0.5381%, an MAE of 0.1083 cubic meters per hour, and an RMSE of 0.1608 cubic meters per hour—indicating near-perfect fitting to the augmented training data. More importantly, it achieves promising test set performance under the current split, although the limited size of the test set does not yet allow a firm conclusion regarding broad generalization.
In contrast, the other two hybrid models show slightly inferior performance. BreedPSO–CatBoost achieves a test set R2 of 0.9694, an RMSE of 0.826 cubic meters per hour, and an MAE of 0.455 cubic meters per hour. CLSPSO–CatBoost performs the least well among the hybrid models, with a test set R2 of 0.9638, an RMSE of 0.898 cubic meters per hour, and an MAE of 0.615 cubic meters per hour. The performance differences among the hybrid models suggest that AsyLnCPSO provides a more favorable balance between global exploration and local exploitation for this tuning task, leading to more optimal hyperparameter configurations for CatBoost in tunnel WIQ prediction.
A cross-group comparison further indicates the numerical advantage of AsyLnCPSO–CatBoost in the present experiment. Compared with the best-performing augmented baseline model (XGBoost), AsyLnCPSO–CatBoost improves the test set R2 by 1.54 percentage points, reduces the RMSE by 0.151 cubic meters per hour, and lowers the MAE by 0.097 cubic meters per hour. Additionally, AsyLnCPSO–CatBoost exhibits the smallest performance gap between the training and test sets, suggesting a smaller train–test performance gap than the competing models under this dataset split. However, whether this pattern remains stable for other splits or other projects requires further verification.
Overall, the comprehensive comparison suggests three main observations: (1) GAN-based data augmentation is associated with improved performance of baseline models under the present dataset setting; (2) hybrid models integrating swarm-intelligence optimizers with CatBoost outperform the augmented baseline models in this study, indicating the value of systematic hyperparameter tuning; and (3) among all compared models, AsyLnCPSO–CatBoost achieved the best numerical performance among the tested models under the current split. Nevertheless, because the comparison was based on one fixed real test set, this ranking should be considered preliminary and may change under alternative data partitions or external datasets.

5.6. Interpretability Evaluation

Interpretability is an indispensable prerequisite for the practical application of data-driven tunnel water inrush quantity (WIQ) prediction models, as engineering decisions for tunnel construction safety—such as advance drainage design, pre-grouting reinforcement, and excavation sequence planning—rely on physically meaningful insights rather than pure numerical predictions. In this section, a multi-level interpretability analysis integrating SHAP, PDP, ICE curves, and 3D PDP interaction surfaces is conducted for the AsyLnCPSO–CatBoost hybrid model [23,29]. Beyond quantifying the global feature importance, nonlinear response patterns, and feature interaction effects of WIQ with respect to hydrogeological–structural indicators, the analysis explicitly links all data-driven findings to the inherent geological and hydrogeological mechanisms of the studied tunnel project. This linkage verifies the physical rationality of the relationships learned by the model and translates abstract model outputs into actionable engineering guidance consistent with field geological conditions.
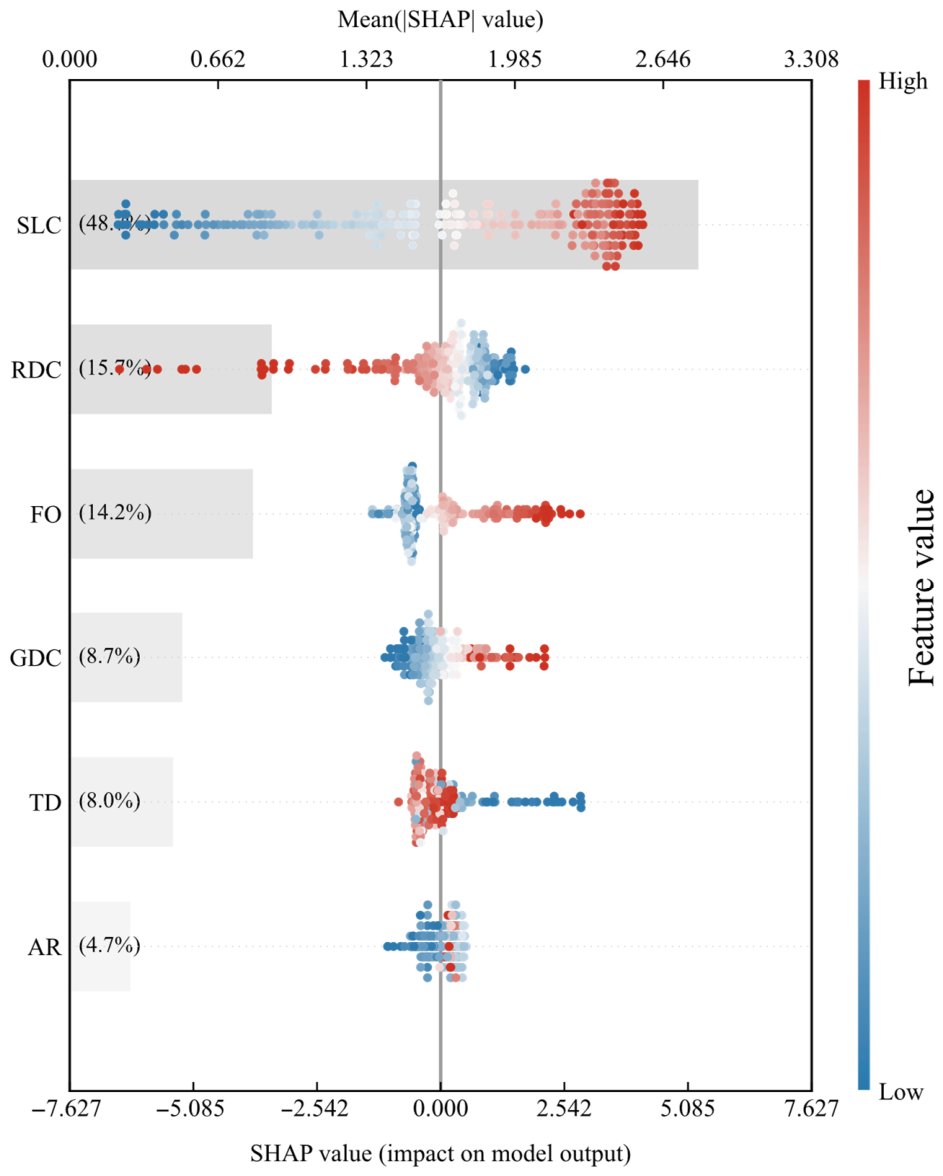
SHAP-based global attribution results quantify the relative contribution of each input indicator to WIQ prediction and reveal the directional effect of each feature on the model output, with the findings aligning closely with the basic geological and hydrogeological controls of tunnel water inrush (Figure 13). The SLC is identified as the dominant driver, contributing 48.2% of the total feature importance, which is a direct reflection of the core role of rock mass lithology in governing tunnel water inrush. Lithology determines the intrinsic integrity and hydraulic conductivity of the rock mass: a higher SLC value indicates a more fragmented and weak stratum with a well-developed pore–fracture network, which acts as the primary migration channel for groundwater and directly enhances the capacity of groundwater inflow into the tunnel: this is the fundamental geological mechanism controlling the occurrence and intensity of water inrush in drill-and-blast tunneling. The RDC is the second most important feature (15.7%) and exhibits a negative directional effect on WIQ. RDC characterizes the distribution pattern of reflective interfaces in the geological structure, and a higher RDC value represents a more uniform distribution of reflectors and weaker tectonic disturbance in the rock mass. Reduced tectonic disturbance means fewer discrete and connected structural fractures, which restricts groundwater migration paths and thus mitigates WIQ, consistent with the structural control mechanism of groundwater seepage in fractured rock masses. FO contributes 14.2% to the model output with a positive directional effect, which conforms to the basic law of fractured water seepage: FO is a direct geometric parameter of seepage paths, and an increase in FO significantly improves the seepage rate and flow of groundwater in fractures by reducing seepage resistance. For the secondary features (GDC: 8.7%, TD: 8.0%, AR: 4.7%), their relatively low contribution can be explained by the specific hydrogeological conditions of the studied tunnel: the GDC is limited by the regional groundwater recharge capacity, the TD shows a weak negative effect because the rock mass becomes more intact at greater depths, offsetting the potential increase in groundwater pressure, and the AR has a negligible effect as the stratum occurrence does not form a dominant seepage surface in this tunnel section. All these SHAP findings are consistent with the field geological survey and hydrogeological monitoring results of the project, confirming the physical rationality of the model’s global feature attribution.
In addition to global feature importance, PDP and ICE curves further reveal the nonlinear response patterns of WIQ to individual hydrogeological–structural indicators, and these patterns can be well interpreted by the inherent hydrogeological mechanisms of groundwater seepage in the tunnel (Figure 14). For the dominant feature of the SLC, the PDP shows a strong monotonic positive correlation with WIQ and a diminishing marginal effect at higher SLC values. This nonlinear pattern is driven by the evolution of rock mass hydraulic conductivity: when the SLC is low, the rock mass is relatively intact, and a small increase in the SLC leads to a rapid development of the fracture network, resulting in a sharp rise in the WIQ; when the SLC exceeds a critical value, the rock mass is highly fragmented, the pore–fracture network tends to be fully developed, and the hydraulic conductivity of the rock mass no longer increases significantly, leading to a slowdown in the growth rate of the WIQ. FO exhibits a positive but nonlinear response to WIQ, with step-like variations in the PDP curve and obvious dispersion in the ICE curves. The step-like variation in FO is due to the critical state of fracture seepage: below a certain FO threshold, groundwater seepage in fractures is dominated by capillary action with a low flow rate, while above the threshold, seepage transitions to gravity-dominated flow with a significant increase in groundwater inflow. The dispersion of ICE curves for FO reflects the high heterogeneity of the fractured rock mass in different excavation segments—even with the same FO value, the actual groundwater inflow varies due to differences in fracture connectivity (an unquantified geological characteristic in the dataset), which is a typical hydrogeological feature of the high-heterogeneity study area. For the RDC, the PDP shows a mild and continuous negative trend, as the change in reflector distribution has a gradual effect on the integrity of the geological structure without an obvious critical value, leading to a slow and steady decrease in the WIQ with an increasing RDC. The nearly flat PDP curves and minimal dispersion in the ICE curves for AR and TD further verify that these two indicators do not form key controls on groundwater seepage in the studied tunnel section, which is consistent with the field hydrogeological conditions where stratum occurrence and tunnel depth have little influence on the groundwater migration process.
Finally, the 3D PDP interaction surface of the SLC and RDC uncovers the synergistic coupling effect between lithologic and structural controls on the WIQ, and this interaction pattern directly reflects the coupled hydrogeological mechanism of tunnel water inrush in fractured rock masses (Figure 15). The interaction surface shows a pronounced ridge-like increase in WIQ with the rise in the SLC, and a gentle downward trend with the increase in the RDC across most SLC ranges; more importantly, the effect of the RDC on WIQ is highly dependent on the value of the SLC, which reveals the hierarchical control relationship between lithology and structure on tunnel water inrush. When the SLC is high (representing a highly fragmented stratum), WIQ remains at a high level even with the increase in the RDC (weaker tectonic disturbance). This is because lithologic control becomes the absolute dominant factor in this case: the fully developed pore–fracture network in the fragmented stratum provides sufficient groundwater migration channels, and the reduction in tectonic disturbance can only slightly mitigate the groundwater inflow, but cannot offset the high permeability of the rock mass caused by lithologic fragmentation. In contrast, when the SLC is low (representing an intact stratum), the increase in the RDC leads to a significant decrease in WIQ, as structural control becomes the main factor governing groundwater seepage in the case of a well-integrated rock mass with limited inherent seepage channels. This coupling effect conforms to the basic hydrogeological principle of tunnel water inrush in fractured rock masses; lithology is the fundamental control factor that determines the potential of groundwater inflow, while structure is the regulatory factor that modulates the actual inflow intensity by changing the connectivity of seepage paths. The identification of this hierarchical coupling mechanism provides a clear physical basis for the zoning prevention and control of tunnel water inrush in the study area.
Overall, the multi-level interpretability analysis for the AsyLnCPSO–CatBoost model not only quantifies the feature importance, nonlinear response patterns, and interaction effects of WIQ to hydrogeological–structural indicators at the data level but also explicitly links all these findings to the geological and hydrogeological mechanisms of the studied tunnel project. This linkage verifies that the relationships learned by the hybrid model are physically meaningful statistical associations rather than spurious correlations, which transforms the model from a “black-box” predictive tool into an explainable decision-support system for engineering practice. By clarifying the dominant geological–hydrogeological controls and their coupling effects on WIQ, the interpretability analysis provides targeted engineering insights for the studied tunnel: high-risk excavation segments with a high SLC and low RDC should be prioritized for advance geophysical prospecting, pre-grouting to reinforce the fractured rock mass, and the installation of enhanced drainage systems to reduce groundwater inflow. For segments with a low SLC, engineering measures can focus on structural fracture detection and local reinforcement, which improves the efficiency and pertinence of tunnel water inrush prevention and control under small-sample and high-heterogeneity conditions [10].

6. Discussion

6.1. Limitations

Although the proposed GAN-assisted AsyLnCPSO–CatBoost framework showed encouraging performance in the studied tunnel project, the reliability of the results remains subject to several important limitations. These limitations are directly related to the small real-sample size, the augmentation protocol, the single-split validation design, and the lack of external verification.
First, the dataset contains only 55 real samples from one project-level tunnel dataset, and the independent hold-out test set contains only 11 real samples. Although the fixed 80/20 split provides a transparent and reproducible evaluation setting, it cannot fully characterize the sensitivity of model performance to data partitioning. In small-sample engineering datasets, a few influential samples can substantially affect the R2, RMSE, MAE, and MAPE. Therefore, the reported test performance should be interpreted as encouraging hold-out evidence under the current split, rather than as statistically sufficient proof of robust generalization.
Second, the GAN-based augmentation strategy was applied only to the training subset, and the real test set was kept isolated during GAN fitting, synthetic sample generation, hyperparameter tuning, model selection, and final training. This design reduces the most direct form of test set leakage. However, the augmentation process was still learned from only 44 real training samples, and the main experimental protocol did not include repeated split-wise or fold-wise re-fitting of the generator. As a result, possible optimism related to split-specific synthetic distributions, dependence among generated samples, or incomplete representation of rare high-inflow conditions cannot be fully excluded. The synthetic samples should therefore be regarded as a training-enrichment tool rather than equivalent substitutes for additional field measurements.
Third, the validation strategy remains limited. The 5-fold cross-validation used in this study was conducted within the augmented training set for hyperparameter tuning, but it does not replace repeated train–test splitting, nested resampling, or external validation. Consequently, the robustness of the selected augmentation ratio, optimizer, hyperparameters, and final model ranking remains uncertain. In particular, the empirically selected 20-fold augmentation ratio may be favorable for the present split, but it should not be interpreted as a universally optimal configuration for other tunnel datasets.
Fourth, the present framework provides deterministic point predictions of WIQ and evaluates them using the R2, RMSE, MAE, and MAPE. These metrics are useful for assessing average predictive accuracy, but they do not quantify predictive uncertainty. For tunnel water inrush management, uncertainty-aware outputs such as prediction intervals or upper quantile estimates are important because engineering decisions often require conservative drainage and reinforcement designs. Therefore, the current point prediction framework may be insufficient for risk-sensitive decision-making in segments with high epistemic uncertainty.
Finally, the interpretability results obtained from the SHAP, PDP/ICE, and 3D PDP analyses should be interpreted as model-conditioned associations rather than verified causal mechanisms. The identified importance of the SLC and RDC is consistent with engineering understanding of lithologic and structural controls, but these explanations do not prove causality without additional field validation, controlled numerical simulation, or independent monitoring evidence. Therefore, the proposed framework should be viewed as a project-specific exploratory and decision-support tool. Its broader reliability requires repeated resampling, fold-wise augmentation, larger real datasets, and external validation using independent tunnel projects with different lithological, structural, and hydrogeological conditions.

6.2. Future Research Directions

In response to the above limitations, future work should prioritize validation strength over further methodological complexity. A first priority is to strengthen cross-site generalization through multi-project datasets that span different lithologies, groundwater regimes, and construction methods. Incorporating multiple tunnels and regions would enable systematic external validation and facilitate domain adaptation strategies (e.g., transfer learning or covariate shift correction) so that the model can retain accuracy when deployed beyond the original geological setting. In parallel, standardized data schemas for TSP indices, structural descriptors, and geological report variables would improve reproducibility and reduce site-specific feature engineering.
A second direction is to develop uncertainty-aware water inrush prediction. This can be achieved by extending the current point-estimation framework toward probabilistic modeling, such as quantile regression boosting, conformal prediction, or Bayesian/ensemble approximations that provide calibrated prediction intervals for WIQ. Such outputs would allow engineers to define conservative operational triggers based on upper confidence bounds and to allocate mitigation resources based on quantified risk rather than on single values. Importantly, uncertainty estimates can also act as a data-quality diagnostic, indicating when additional probing or monitoring is needed before critical excavation steps.
Third, GAN augmentation can be advanced toward risk-sensitive synthetic data generation. Future work could incorporate constraints or reweighting mechanisms that explicitly preserve tail behavior and rare-event patterns (e.g., conditional GANs conditioned on hydrogeological states or hybrid augmentation that combines GAN synthesis with physics-inspired perturbations). More rigorous evaluation protocols—such as training the generator within each cross-validation fold and testing on strictly unseen segments—would further ensure that performance gains arise from genuine generalization improvements. Additionally, synthetic sample auditing methods (e.g., nearest-neighbor distance screening and constraint-based plausibility checks in engineering units) could provide stronger safeguards against implausible combinations of structural and hydrogeological indicators.
Finally, interpretability can be pushed beyond post hoc analysis toward mechanism-consistent explainability and causal inquiry. Combining model explanations with hydrogeological process knowledge—such as coupling with seepage simulations, fracture network models, or rule-based safety criteria—would help test whether the learned patterns align with known mechanisms under controlled scenarios [30]. Moreover, interaction findings (e.g., the joint influence of the SLC and RDC) can guide targeted field campaigns to validate hypotheses, refine monitoring strategies, and ultimately support explainable, safety-oriented decision-making that is both data-driven and physically defensible. Given the small overall dataset and the 11-sample test set, the reported test performance should be interpreted as encouraging but still preliminary. The broader robustness and transferability of the proposed framework need to be further examined through repeated splitting, larger datasets, and external validation from other tunnel projects [31].

7. Conclusions

This study aimed to develop a reliable and explainable hybrid intelligence framework for predicting tunnel WIQ under the challenging conditions of small sample sizes and high geological heterogeneity, integrating tabular GAN-based data augmentation, swarm-intelligence optimization, and multi-level machine learning interpretability techniques into a unified pipeline. The research was conducted on a project-specific dataset of 55 samples from drill-and-blast tunnel construction, and systematic analyses including baseline model testing, data augmentation validation, optimizer benchmarking, hybrid model construction, and interpretability evaluation were carried out to address the key limitations of existing water inrush quantity prediction methods. Through rigorous experimental design and comparative analysis, the framework demonstrated promising predictive performance and practical interpretability within the studied project setting, and the specific key conclusions drawn from this research are as follows:
  • The original dataset with 55 samples exhibited distinct small-sample characteristics for tunnel water inrush quantity prediction, which directly resulted in severe overfitting of all selected tree-based baseline models. All baseline models showed excellent fitting accuracy on the original training set but experienced a sharp drop in predictive performance on the independent test set, reflecting that the models only memorized the limited sample patterns rather than effectively learning the intrinsic correlation between hydrogeological–structural indicators and water inrush quantity.
  • The GAN-based data augmentation strategy applied exclusively to the training set expanded the model’s learning space and mitigated sample scarcity under the present dataset setting. The augmentation appeared to preserve the main statistical distributions and inter-variable coupling patterns of the raw dataset, while being designed to minimize the risk of information leakage by keeping the test set untouched throughout model development.
  • CD analysis was adopted for the statistically rigorous comparison of six mainstream tree-based baseline models, and the results confirmed that CatBoost achieved the best overall statistical ranking. It exhibited more stable and competitive predictive performance than the other baseline models on both the original small-sample dataset and the GAN-augmented dataset, and was therefore selected as the baseline learner for subsequent hybrid model construction.
  • Among the three enhanced PSO variants investigated, AsyLnCPSO showed the best benchmark performance among the tested optimizers and was therefore adopted for CatBoost hyperparameter tuning in this study.
  • The proposed AsyLnCPSO–CatBoost hybrid model achieved the best numerical performance among the tested models under the current data split and project-specific dataset. However, because the real test set contained only 11 samples and the validation was not repeated across multiple splits or external tunnel projects, this result should be regarded as preliminary evidence of potential usefulness rather than conclusive proof of robust generalization.
  • The multi-level interpretability suite integrating SHAP, PDP, and ICE curves provided transparent post hoc evidence for the feature–response relationships learned by the hybrid model. This analysis helped identify dominant driving factors, nonlinear response patterns, and key interaction effects, thereby improving model interpretability and offering project-specific decision-support insights for tunnel engineering.

Author Contributions

R.H.: Conceptualization, Methodology, Validation, Investigation, Visualization, Writing—Review and Editing, Supervision, and Funding Acquisition. Y.C.: Methodology, Formal Analysis, Validation, Resources, Visualization, Software, and Writing—Original Draft. L.W.: Validation and Investigation. J.Z.: Validation and Investigation. Y.J.: Validation and Resources. T.H.: Validation. Y.Y.: Investigation. All authors have read and agreed to the published version of the manuscript.

Funding

This research is partially supported by Department of Information Technology Development, Ministry of Industry and Information Technology, PRC grant number ZTZB-23-990-021.

Data Availability Statement

The data used in this study were obtained from the publicly available dataset reported by Zheng et al. [1]. The variable definitions, spatial granularity, and data-construction procedure are described in this manuscript to support reproducibility.

Conflicts of Interest

Jing Zhan was employed by the company Hunan Zhantong Technology Group Co., Ltd. The remaining authors declare that the research was conducted in the absence of any commercial or financial relationships that could be construed as a potential conflict of interest.

References

  1. Zheng, S.; Zhang, Q.; Yang, Y.; Liu, X. Research and application of reliability evaluation model for water inrush risk during tunnel construction. Tunn. Undergr. Space Technol. 2026, 168, 107121. [Google Scholar] [CrossRef]
  2. Li, X.; Li, S.; Wang, B.; Qu, J.; Zhao, J.; Zhao, S. Water inrush risk assessment during karst tunnel construction based on knowledge decision and data-driven methods. Tunn. Undergr. Space Technol. 2026, 168, 19. [Google Scholar] [CrossRef]
  3. Mahmoodzadeh, A.; Mohammadi, M.; Noori, K.M.G.; Khishe, M.; Ibrahim, H.H.; Ali, H.F.H.; Abdulhamid, S.N. Presenting the best prediction model of water inflow into drill and blast tunnels among several machine learning techniques. Autom. Constr. 2021, 127, 103719. [Google Scholar] [CrossRef]
  4. Feng, X.; Lu, Y.; He, J.; Lu, B.; Wang, K. Bayesian-network-based predictions of water inrush incidents in soft rock tunnels. KSCE J. Civ. Eng. 2024, 28, 5934–5945. [Google Scholar] [CrossRef]
  5. Zhou, J.; Zhang, Y.; Li, C.; Yong, W.; Qiu, Y.; Du, K.; Wang, S. Enhancing the performance of tunnel water inflow prediction using random forest optimized by grey wolf optimizer. Earth Sci. Inform. 2023, 16, 2405–2420. [Google Scholar] [CrossRef]
  6. Zhang, N.; Niu, M.; Wan, F.; Lu, J.; Wang, Y.; Yan, X.; Zhou, C. Hazard prediction of water inrush in water—Rich tunnels based on random forest algorithm. Appl. Sci. 2024, 14, 867. [Google Scholar] [CrossRef]
  7. Zhuo, Y.; Chao, M. Risk prediction of water inrush of karst tunnels based on BP neural network. In Proceedings of the 2016 4th International Conference on Mechanical Materials and Manufacturing Engineering; Atlantis Press: Dordrecht, The Netherlands, 2016; Volume 36, pp. 1337–1342. [Google Scholar]
  8. Li, S.; He, P.; Li, L.; Shi, S.; Zhang, Q.; Zhang, J.; Hu, J. Gaussian process model of water inflow prediction in tunnel construction and its engineering applications. Tunn. Undergr. Space Technol. 2017, 69, 155–161. [Google Scholar] [CrossRef]
  9. Ma, D.; Duan, H.; Cai, X.; Li, Z.; Li, Q.; Zhang, Q. A global optimization-based method for the prediction of water inrush hazard from mining floor. Water 2018, 10, 1618. [Google Scholar] [CrossRef]
  10. Li, Z.; Wang, Y.; Olgun, C.G.; Yang, S.; Jiao, Q.; Wang, M. Risk assessment of water inrush caused by karst cave in tunnels based on reliability and GA-BP neural network. Geomat. Nat. Hazards Risk 2020, 11, 1212–1232. [Google Scholar] [CrossRef]
  11. Liu, D.; Xu, Q.; Tang, Y.; Jian, Y. Prediction of water inrush in long-lasting shutdown karst tunnels based on the HGWO-SVR model. IEEE Access 2021, 9, 6368–6378. [Google Scholar] [CrossRef]
  12. Zhang, Y.; Yang, L. A novel dynamic predictive method of water inrush from coal floor based on gated recurrent unit model. Nat. Hazards 2021, 105, 2027–2043. [Google Scholar] [CrossRef]
  13. Yin, H.; Wu, Q.; Yin, S.; Dong, S.; Dai, Z.; Soltanian, M.R. Predicting mine water inrush accidents based on water level anomalies of borehole groups using long short-term memory and isolation forest. J. Hydrol. 2023, 616, 17. [Google Scholar] [CrossRef]
  14. Pi, Y.; Sun, Z.; Lu, Y.; Xu, J. A novel model for risk prediction of water inrush and its application in a tunnel in Xinjiang, China. Front. Earth Sci. 2024, 12, 14. [Google Scholar] [CrossRef]
  15. Xu, Z.; Kong, F.; Cao, C.; Zhang, Z. Prediction and analysis of tunnel water inrush disasters in chinese karst area based on variable weight-weighted bayesian network model. Carbonates Evaporites 2024, 40, 19. [Google Scholar] [CrossRef]
  16. Shen, Q.; Yang, H.; Zhou, Z.; Chen, Z.; Zhang, Y. Simulation and parameter identification of water inrush in tunnel construction using physics-informed neural networks. Bull. Eng. Geol. Environ. 2025, 84, 370. [Google Scholar] [CrossRef]
  17. Huo, G.; Wang, H.; Zhang, J.; Xue, Y.; Fu, B.; Kong, F.; Yan, Z. Research on risk evaluation of tunnel water inrush based on multi-source geophysical exploration data fusion of MLP-transformer model. Appl. Geophys. 2025, 23, 1–14. [Google Scholar] [CrossRef]
  18. Kennedy, J.; Eberhart, R. Particle swarm optimization. In Proceedings of the ICNN’95—International Conference on Neural Networks, Perth, WA, Australia, 27 November–1 December 1995; p. 488968. [Google Scholar]
  19. Bao, G.Q.; Mao, K.F. Particle swarm optimization algorithm with asymmetric time varying acceleration coefficients. In 2009 IEEE International Conference on Robotics and Biomimetics, ROBIO 2009, Guilin, China, 19–13 December 2009; IEEE Computer Society: Washington, DC, USA, 2009; pp. 2134–2139. [Google Scholar]
  20. Løvbjerg, M.; Rasmussen, T.K.; Krink, T. Hybrid particle swarm optimiser with breeding and subpopulations. In Proceedings of the 3rd Annual Conference on Genetic and Evolutionary Computation; Morgan Kaufmann Publishers Inc.: San Francisco, CA, USA, 2001; pp. 469–476. [Google Scholar]
  21. Gao, S.; Yu, Y.; Wang, Y.; Wang, J.; Cheng, J.; Zhou, M. Chaotic local search-based differential evolution algorithms for optimization. IEEE Trans. Syst. Man. Cybern. Syst. 2021, 51, 3954–3967. [Google Scholar] [CrossRef]
  22. Mosca, E.; Szigeti, F.; Tragianni, S.; Gallagher, D.; Groh, G. SHAP-based explanation methods: A review for NLP interpretability. In Proceedings of the 29th International Conference on Computational Linguistics; Association for Computational Linguistics (ACL): Gyeongju, Republic of Korea, 2022; pp. 4593–4603. [Google Scholar]
  23. Zhang, Y.; Qiu, Y.; Du, K.; Nguyen, H.; Armaghani, D.J.; Zhou, J. Optimizing flyrock forecasting in open-pit blasting using hybrid machine learning models. Rock. Mech. Rock. Eng. 2025, 58, 12523–12550. [Google Scholar] [CrossRef]
  24. Qi, H.; Zhou, J.; Khandelwal, M.; Onifade, M.; Lawal, A.I.; Li, C.; Bada, S.O.; Genc, B. An optimized machine learning framework for prediction of coal abrasive index: Leveraging supervised learning, metaheuristic optimization, and interpretability analysis. Fuel 2026, 403, 136065. [Google Scholar] [CrossRef]
  25. Zhou, J.; Zhang, Y.; Qiu, Y.; Peng, K.; Khandelwal, M. Enhancing tunnel safety with machine learning models for ground behavior prediction. Tunn. Undergr. Space Technol. 2025, 165, 106888. [Google Scholar] [CrossRef]
  26. Creswell, A.; White, T.; Dumoulin, V.; Arulkumaran, K.; Sengupta, B.; Bharath, A.A. Generative adversarial networks: An overview. IEEE Signal Process. Mag. 2018, 35, 53–65. [Google Scholar] [CrossRef]
  27. Goodfellow, I.; Pouget-Abadie, J.; Mirza, M.; Xu, B.; Warde-Farley, D.; Ozair, S.; Courville, A.; Bengio, Y. Generative adversarial networks. Commun. ACM 2020, 63, 139–144. [Google Scholar] [CrossRef]
  28. Cai, X.; Chen, L.; Zhou, Z.; Cheng, R.; Yuan, J. A feature fusion-based framework for robust prediction of underground pillar stability under small-sample conditions. Rock Mech. Rock Eng. 2025, 58, 13565–13586. [Google Scholar] [CrossRef]
  29. Zhang, Y.; Zhou, J.; Li, J.; He, B.; Armaghani, D.J.; Huang, S. Advancing overbreak prediction in drilling and blasting tunnel using MVO, SSA and HHO-based SVM models with interpretability analysis. Geomech. Geophys. Geo-Energ. Geo-Resour. 2025, 11, 53. [Google Scholar] [CrossRef]
  30. Cai, X.; Wang, C.; Zhou, Z.; Cheng, R.; Gao, J.; Liu, B. Dynamic optimization of powder factor in extreme-cold region bench blasting considering temperature effects on single-hole blasting. Rock Mech. Rock Eng. 2025, 1–26, Correction in Rock Mech. Rock Eng. 2026, 1. https://doi.org/10.1007/s00603-026-05347-9. [Google Scholar] [CrossRef]
  31. Zhang, Y.; Li, E.; Gu, J.; Du, K.; Zhou, J. Residential building cooling load prediction with optimized KELM models and interpretability insights. Appl. Therm. Eng. 2025, 272, 126421. [Google Scholar] [CrossRef]
Figure 1. Correlation of features and VIF analysis.
Infrastructures 11 00183 g001
Figure 2. Performance results of the baseline models before data augmentation: (a) RandomForest on the training set; (b) GradientBoosting on the training set; (c) AdaBoost on the training set; (d) XGBoost on the training set; (e) LightGBM on the training set; (f) CatBoost on the training set; (g) RandomForest on the test set; (h) GradientBoosting on the test set; (i) AdaBoost on the test set; (j) XGBoost on the test set; (k) LightGBM on the test set; and (l) CatBoost on the test set. The color gradient of the scatter points represents the local point density, ranging from lower density in purple/blue to higher density in yellow. The solid lines represent the fitted regression lines, while the dashed diagonal lines indicate the ideal 1:1 agreement between the observed and predicted WIQ values.
Infrastructures 11 00183 g002
Figure 3. Analysis of the data augmentation effect of the target variable in the training set: (a) comparison of the sample sizes of the original and GAN-augmented training sets; (b) probability density distribution comparison of water inrush quantity (WIQ) before and after augmentation; (c) empirical cumulative distribution comparison of WIQ before and after augmentation; and (d) violin-box comparison of WIQ before and after augmentation.
Infrastructures 11 00183 g003
Figure 4. Analysis of the data augmentation effects of each input indicator in the training set.
Infrastructures 11 00183 g004
Figure 5. Comparison of the physical structure before and after data augmentation: (a) Pearson correlation matrix of the raw training data; (b) Pearson correlation matrix of the GAN-augmented training data.
Infrastructures 11 00183 g005
Figure 6. Sensitivity of downstream performance to augmentation ratio: (a) average test-set performance of the six baseline models evaluated using R2, RMSE, MAPE, and MAE under different augmentation ratios; (b) model-wise trajectories of test-set R2 under different augmentation ratios; (c) average test-set ranks of individual models across four evaluation metrics under different augmentation ratios; and (d) relationship between augmented training sample size and average test-set R2, illustrating the trade-off between sample enrichment and downstream prediction accuracy.
Infrastructures 11 00183 g006
Figure 7. Benchmark function testing and visualization of the search space. (a) Fitness convergence curves: Fitness evolution of three PSO variants across six CEC2022 benchmark functions; (b) 3D search space landscapes: Three-dimensional visualizations of the six CEC2022 benchmark functions.
Infrastructures 11 00183 g007
Figure 8. Comparison of algorithm performance optimization.
Infrastructures 11 00183 g008
Figure 9. Selection of the baseline model.
Infrastructures 11 00183 g009
Figure 10. Iterative results and optimization process of the AsyLnCPSO–CatBoost intelligent model.
Infrastructures 11 00183 g010
Figure 11. Performance results of each baseline model after data augmentation: (a) RandomForest; (b) GradientBoosting; (c) XGBoost; (d) LightGBM; (e) CatBoost; and (f) AdaBoost.
Infrastructures 11 00183 g011
Figure 12. Performance results of each hybrid model.
Infrastructures 11 00183 g012
Figure 13. Feature importance analysis based on SHAP technology.
Infrastructures 11 00183 g013
Figure 14. Partial dependency and ICE analysis of each feature: (a) reflector distribution coefficient (RDC); (b) groundwater development coefficient (GDC); (c) attitude of rock (AR); (d) fracture opening (FO); (e) stratum lithologic coefficient (SLC); and (f) tunnel depth (TD). The dashed lines represent the average partial dependence trends, while the light-colored lines represent the ICE curves for individual samples.
Infrastructures 11 00183 g014
Figure 15. Three-dimensional partial dependency analysis of important features.
Infrastructures 11 00183 g015
Table 1. Application of artificial intelligence technologies in tunnel water inrush.
StudiesData QuantityAI MethodsInterpretability
Zhuo and Chao, [7] (2016)16BPNo
Li et al., [8] (2017)36GP-SVM-ANNNo
Ma et al., [9] (2018)18GA-SVMNo
Li et al., [10] (2020)100GA-BPNo
Liu et al., [11] (2021)181HGWO-SVRNo
Zhang et al., [12] (2021)180GRUNo
Yin et al., [13] (2023)36LSTM, iForestYes
Zhou et al., [5] (2023)600GWO-RFNo
Pi et al., [14] (2024)70SMFNo
Zhang et al., [6] (2024)185RFNo
Feng et al., [4] (2024)70BNNo
Xu et al., [15] (2024)91VW-WBNNo
Shen et al., [16] (2025)26PINNNo
Huo et al., [17] (2025)7MLP-TransformerNo
Li et al., [2] (2026)52DE-GWO-ELMNo
Zheng et al., [1] (2026)55RFNo
Notes: BP (Back Propagation); GP (Gaussian process); SVM (support vector machine); ANN (artificial neural network); GA (Genetic Algorithm); HGWO (hybrid grey wolf optimization); SVR (support vector regression); GRU (gated recurrent unit); LSTM (long short-time memory); iForest (isolation forest); GWO (grey wolf optimizer); RF (RandomForest); SMF (Spectral Matrix Factorization); BN (Bayesian network); VW (variable weight theory); WBN (Weighted Bayesian Network); PINN (physics-informed neural network); MLP-Transformer (Multi-Layer Perceptron Integrated Transformer); DE (Differential Evolution); ELM (Extreme Learning Machine).
Table 2. Description of the project dataset.
CategoryVariable NameAbbreviationUnitAverage
InputReflector distribution coefficientRDC-0.39
InputGroundwater development coefficientGDC-0.46
InputAttitude of rockAR°62.49
InputFracture openingFOmm9.6
InputStratum lithologic coefficientSLC-0.50
InputDepth of tunnelTDm46.41
OutputWater inrush quantityWIQm3/h20.10
Table 3. Parameter configuration of AsyLnCPSO–CatBoost hybrid intelligent model.
ParametersConfiguration
Lower bound for depth1
Upper bound for depth10
Lower bound for l2_leaf_reg1
Upper bound for l2_leaf_reg20
Lower bound for learning_rate0.01
Lower bound for learning_rate0.30
The maximum number of iterations500
Table 4. Performance results of the AsyLnCPSO–CatBoost hybrid intelligent model.
Population SizeTraining (880 Samples)
R2MAPE (%)MAERMSE
1000.998840.53810.10830.16081
Population sizeTesting (11 samples)
R2MAPE (%)MAERMSE
1000.977361.92070.37790.67357
Disclaimer/Publisher’s Note: The statements, opinions and data contained in all publications are solely those of the individual author(s) and contributor(s) and not of MDPI and/or the editor(s). MDPI and/or the editor(s) disclaim responsibility for any injury to people or property resulting from any ideas, methods, instructions or products referred to in the content.