Article

Deep Learning-Based Prediction of the Axial Capacity of CFRP-Strengthened Concrete Columns

by
Nasim Shakouri Mahmoudabadi
1,
Charles V. Camp
1 and
Afaq Ahmad
2,*
1
Department of Civil Engineering, University of Memphis, Memphis, TN 38125, USA
2
Department of Built Environment, Oslo Metropolitan University, 0176 Oslo, Norway
*
Author to whom correspondence should be addressed.
Infrastructures 2026, 11(5), 151; https://doi.org/10.3390/infrastructures11050151
Submission received: 18 March 2026 / Revised: 15 April 2026 / Accepted: 23 April 2026 / Published: 28 April 2026

Abstract

Fiber-reinforced polymer (FRP) composites are widely used to strengthen reinforced concrete (RC) columns due to their high strength, durability, and ease of installation. Accurate prediction of the axial capacity of CFRP-strengthened concrete columns is essential for reliable structural design. Yet conventional empirical models often exhibit limited accuracy due to the complex interactions among structural parameters. This study develops a deep learning-based model to predict the axial capacity of CFRP-wrapped RC columns using a database of 469 experimental tests collected from published studies. A deep neural network (DNN) was optimized using the Optuna hyperparameter tuning framework and k-fold cross-validation to enhance model accuracy and robustness. Model performance was evaluated using statistical indicators, including R2, RMSE, MAE, MAPE, and the a20-index. The results show excellent predictive performance with R2 values approaching 0.99 and an a20-index of 0.98, demonstrating strong agreement between predicted and experimental results. Comparisons with the ACI 440.2R-17 and CSA S806-12 design codes indicate that the proposed DNN model provides significantly improved prediction accuracy, with lower errors. The developed approach offers a reliable and efficient tool for estimating the axial capacity of CFRP-strengthened concrete columns.

1. Introduction

Strengthening or rehabilitation of reinforced concrete (RC) structures is frequently required due to aging, deterioration, structural damage, or to meet increased loading requirements and updated design codes. Conventional repair and strengthening techniques generally include adding concrete overlays, concrete or steel jacketing, and bonding steel plates to existing members. Although these methods can be effective, they are often expensive, time-consuming, and may cause significant interruptions to the structure’s serviceability. Since the early 1990s, the construction industry has increasingly adopted modern retrofit methods based on externally bonded advanced composite materials, commonly known as fiber-reinforced polymers (FRPs). The widespread use of these materials is mainly due to their excellent mechanical and durability properties, including high tensile strength, strong corrosion resistance, low maintenance requirements, long-term durability, good resistance to chemical attack, and very low thermal and electrical conductivity. Furthermore, FRP composites are lightweight and easy to install, making them an efficient alternative to traditional strengthening methods. One important advantage of FRP strengthening is that it does not significantly increase the dimensions of structural members, which is especially valuable in situations where space limitations exist, such as in existing buildings. Since their introduction, externally bonded FRP systems have been widely applied to improve the axial capacity of reinforced concrete columns and enhance their performance under various loading conditions, demonstrating reliability and efficiency in structural engineering practice. Experimental investigations have indicated that externally bonded carbon fiber-reinforced polymer (CFRP) sheets can significantly enhance the axial load-carrying capacity of reinforced concrete columns by providing confinement, delaying concrete crushing, and improving the overall stiffness and ductility of the member. In practical applications, CFRP sheets are typically installed as full wraps or partial confinement layers around columns, depending on the member geometry and construction limitations that may restrict complete wrapping of the cross-section [1]. In partially wrapped CFRP configurations, confinement is provided by discrete FRP strips rather than a continuous jacket. Under axial compression, the concrete core tends to expand laterally due to Poisson’s effect, and the FRP strips act to restrain this dilation locally. Although the confinement is not uniform along the column height, the presence of FRP strips introduces intermittent lateral pressure, which enhances the axial load-carrying capacity and ductility of the column. The effectiveness of this confinement mechanism depends on factors such as strip spacing, stiffness of the FRP material, and the interaction between confined and unconfined regions. Similar confinement behavior has been reported in studies on FRP spiral or strip-confined concrete, where the discontinuous confinement still contributes to improved strength and deformation capacity, although to a lesser extent than fully wrapped systems [2,3].
A large number of experimental and analytical studies have been conducted to investigate the behavior of FRP-confined concrete columns, addressing both the strengthening of existing reinforced concrete members and the development of advanced composite structural systems [4]. In reinforced concrete (RC) columns, externally bonded FRP reinforcement has been shown to significantly enhance both the axial load-carrying capacity and the ductility of the member. Unlike internal reinforcement, the contribution of FRP confinement is generally passive and becomes effective only after the column undergoes lateral deformation under axial compression. At the initial stage of loading, the concrete core experiences nearly elastic behavior with limited lateral expansion. As the axial load increases, the concrete begins to dilate, producing transverse strains that are restrained by the surrounding FRP jacket. This confinement action generates tensile stresses in the FRP layers, which continue to increase as the applied axial load increases.
The level of improvement in the axial capacity of FRP-confined RC columns depends on several parameters, including the column geometry, the thickness and number of FRP layers, and the mechanical properties of the composite material. When the hoop tensile strain in the externally bonded FRP reaches its ultimate limit, rupture of the fibers may occur, which can lead to a sudden and brittle failure of the confined column [5]. When internal transverse reinforcement is insufficient, premature failure of the RC column may occur, preventing the FRP confinement system from being fully mobilized and reducing the effectiveness of the strengthening technique.
Various empirical approaches have been proposed to estimate the axial capacity of FRP-confined reinforced concrete columns, with most studies focusing on columns with circular or rectangular cross-sections. At the same time, comparatively fewer investigations have addressed other cross-sectional shapes. In general, the available prediction models for axial behavior can be divided into two main categories: analytical models and design-oriented formulations [6]. Analytical models attempt to simulate the interaction between concrete, internal reinforcement, and external FRP confinement by describing the stress–strain response of the confined concrete throughout the loading process [7]. These methods typically account for the FRP jacket’s confinement effect and its influence on the column’s strength and ductility under axial compression.
In contrast, design-oriented formulations are based on simplified mathematical expressions developed from regression analysis of experimental test results [8]. These equations provide direct relationships between the axial load capacity and the column’s key geometric and material parameters, making them convenient for practical design. Because of their simplicity, clarity, and ease of implementation, design-oriented models are commonly preferred in engineering practice and are widely adopted in design guidelines and standards.
Many existing empirical models for estimating the axial capacity of FRP-confined reinforced concrete columns may produce inaccurate predictions when applied beyond the range of conditions for which they were originally developed. This limitation arises primarily from the complex, highly coupled interactions among the governing parameters and the inherent variability in experimental data, which introduce significant uncertainty into the prediction process. The axial behavior of FRP-confined columns is influenced by multiple interacting factors, including concrete strength, confinement stiffness, column geometry, load eccentricity, and the mechanical properties of the FRP system. As a result, identifying the most effective configuration for externally bonded FRP (EB-FRP) reinforcement remains challenging. The performance of CFRP-strengthened columns is governed by complex and strongly nonlinear relationships among geometric and material parameters. Traditional analytical and regression-based approaches, including least-squares methods, often struggle to accurately capture these multidimensional dependencies, which limits their predictive capability. Therefore, advanced data-driven techniques are required to better represent the nonlinear behavior of such systems and improve the reliability of axial capacity predictions.
In recent years, machine learning (ML) techniques, including genetic programming (GP), adaptive neuro-fuzzy inference systems (ANFISs), support vector machines (SVMs), and artificial neural networks (ANNs), have been increasingly used to model the axial behavior of FRP-strengthened concrete columns [9,10]. These data-driven approaches have attracted considerable attention because of their strong capability to identify complex nonlinear relationships and hidden patterns within large experimental datasets [11,12,13]. Unlike traditional empirical equations, ML-based models can learn directly from data without making simplifying assumptions about the system’s physical behavior. Beyond strength prediction, deep learning techniques have also shown strong potential in a wide range of structural engineering applications, including structural damage identification, response prediction under environmental effects, recovery of missing monitoring data, and reconstruction of structural responses [14,15,16]. For instance, models integrating time-series analysis and neural networks have been applied to damage detection in steel frames under varying conditions, while hybrid architectures such as CNN–LSTM and CNN–BiGRU have been successfully used for nonlinear response prediction and data reconstruction in structural health monitoring systems. These developments further demonstrate the capability of deep learning models to represent complex structural behavior, providing strong motivation for their application in predicting the axial capacity of CFRP-strengthened concrete columns [17]. In addition to data-driven approaches, physics-based nonlinear numerical methods are widely used to study reinforced concrete behavior, particularly for modeling damage evolution and fracture mechanisms. Concrete damage plasticity (CDP) models and cohesive/interface-based formulations are commonly applied to simulate cracking, stiffness degradation, and debonding processes with high fidelity [14,15,16]. However, these methods are typically computationally intensive and require detailed material calibration. In contrast, the proposed data-driven model provides a rapid and efficient tool for predicting the axial capacity of CFRP-strengthened columns. Therefore, the two approaches can be viewed as complementary, combining detailed mechanistic insight with efficient predictive capability [18,19].
Several previous investigations have applied different machine learning algorithms to predict the strength and response of FRP-strengthened reinforced concrete members [20,21,22]. These studies employed various datasets and modeling techniques to capture the nonlinear interaction between material properties, geometric parameters, confinement characteristics, and the resulting structural performance of columns. To provide a clearer overview of the current state of research in this area, Table 1 summarizes selected studies that used machine learning methods to predict the behavior and axial load capacity of FRP-confined concrete columns.
Although machine learning techniques have been increasingly applied to predict the mechanical response of FRP-strengthened reinforced concrete members, several limitations still exist in the current literature. Many previous studies rely on relatively small experimental datasets, lack systematic hyperparameter optimization, or do not employ rigorous validation procedures such as k-fold cross-validation. In addition, a significant portion of existing research is based on conventional ANN models, while the potential advantages of deep neural network (DNN) architectures combined with automated optimization techniques remain underexplored. To address these gaps, this study develops a deep neural network (DNN)-based model for predicting the axial capacity of CFRP-strengthened reinforced concrete columns. The proposed model is trained and validated using a comprehensive database of 469 experimentally tested columns collected from the literature. Automated hyperparameter optimization is performed using the Optuna framework in conjunction with k-fold cross-validation to enhance model robustness, reduce subjectivity in parameter selection, and improve predictive accuracy. The performance of the developed model is evaluated through comparisons with established design provisions for FRP-confined columns, and a detailed parametric analysis is conducted to investigate the influence of key variables. Compared to existing ANN- and DNN-based models, the proposed approach provides improved generalization capability through the use of a larger and more diverse dataset, a systematic and automated hyperparameter optimization process, and a rigorous validation framework. Overall, the developed model offers a more reliable and efficient tool for estimating the axial capacity of CFRP-strengthened concrete columns and supports its application in practical engineering design.
The remainder of this paper is organized as follows. Section 2 presents the overall methodology, including the deep learning framework and the development of the experimental database for CFRP-strengthened concrete columns. Section 3 describes the optimization of model hyperparameters using k-fold cross-validation and the Optuna framework. Section 4 presents the model development, validation, and performance assessment. Section 5 provides a comparison of axial capacity predictions using existing design codes. Section 6 discusses the scope and limitations of the proposed model and outlines directions for future research. Finally, Section 7 summarizes the main conclusions of the study.

2. Methodology

This section presents an overview of DNNs and describes the experimental dataset assembled from previously published studies. Emphasis is placed on the key considerations involved in constructing a reliable and comprehensive database. The predictive performance of the developed model for estimating the axial capacity of concrete columns is strongly influenced by the quality, consistency, and completeness of the collected data.

2.1. Deep Learning Model

Deep learning is a subfield of machine learning (ML) that focuses on developing computational models capable of automatically discovering patterns and relationships within data without explicit programming. Its popularity has grown rapidly due to its strong performance in solving complex problems, particularly in image and natural language processing. One important application of deep learning is regression analysis, where models are trained to estimate continuous numerical values. These models can achieve high predictive accuracy even with complex datasets that are difficult to analyze using traditional statistical methods.
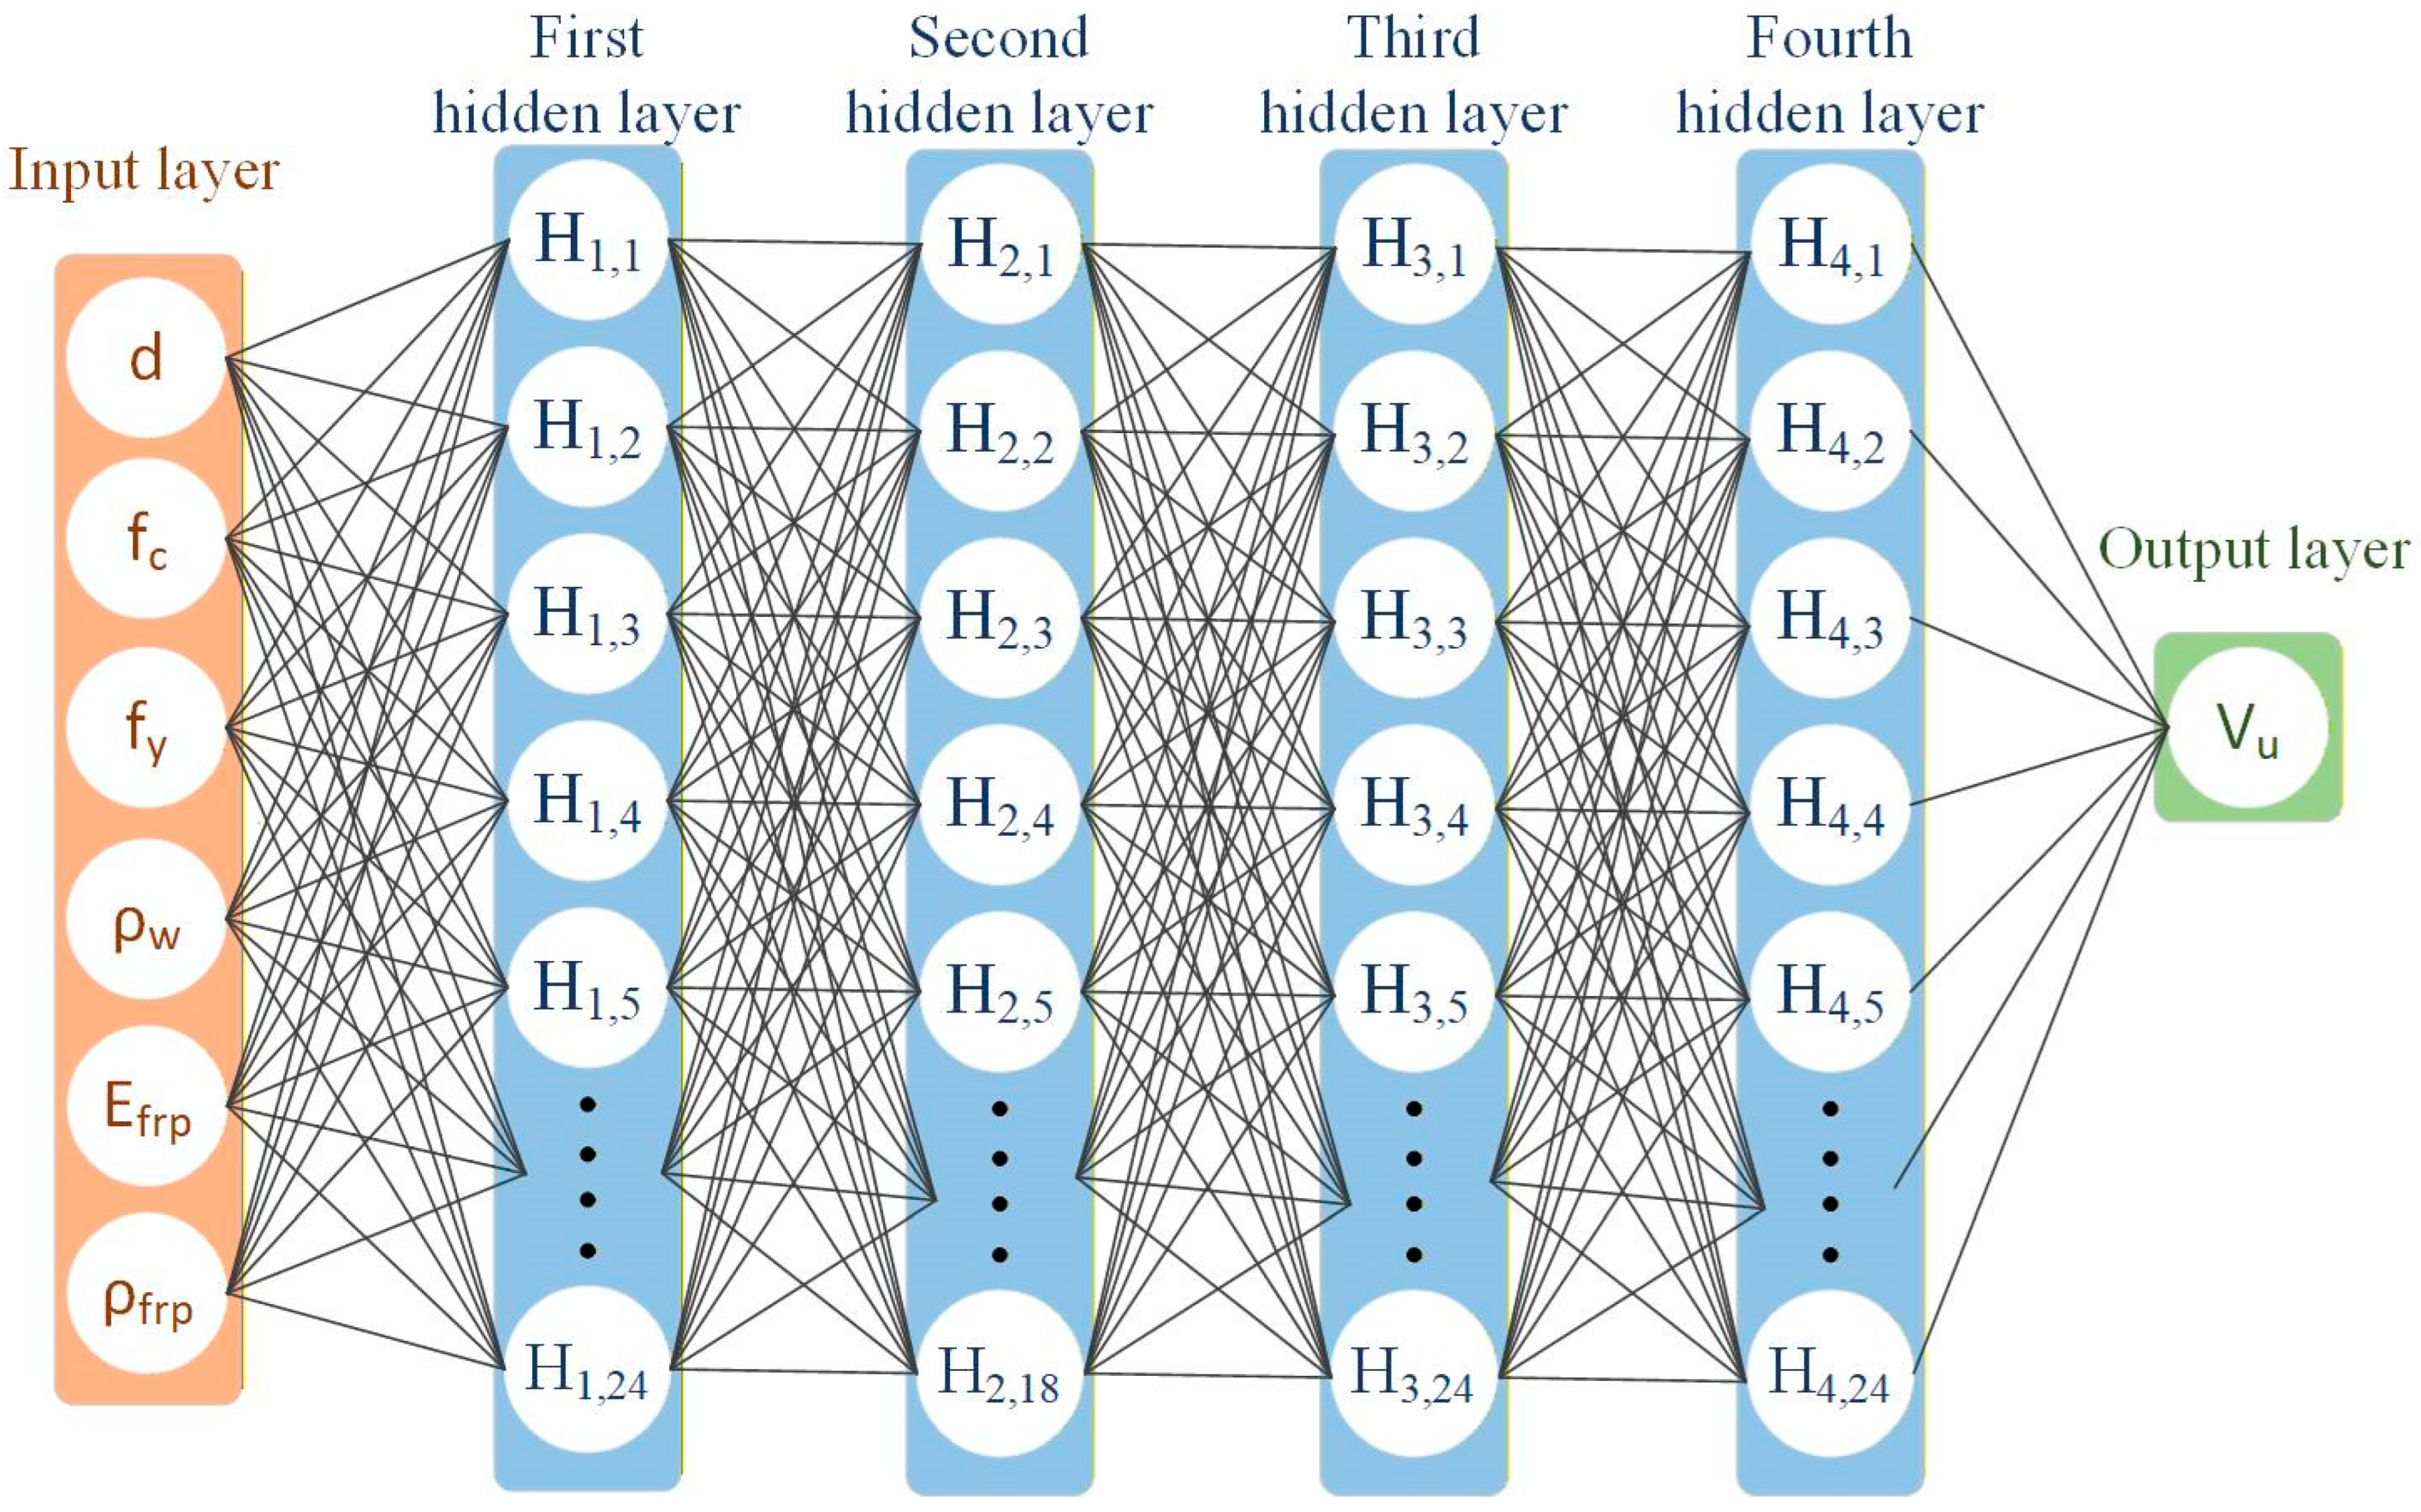
Deep learning models, commonly known as deep neural networks (DNNs), are a subset of the broader family of artificial neural networks (ANNs). A typical DNN consists of multiple layers of interconnected neurons that process information sequentially. These layers generally include an input layer, one or more hidden layers, and an output layer, as illustrated in Figure 1. The input layer receives the original data and passes it to the hidden layers, where the main computational operations take place. Within the hidden layers, nonlinear activation functions transform incoming signals, allowing the network to capture complex relationships among variables. After this processing stage, the final results—such as predicted values of axial capacity for CFRP-strengthened concrete columns—are produced at the output layer [26].
The concept of “deep” learning refers to multiple stacked layers that progressively extract higher-level representations from the data. This layered structure enhances the network’s ability to recognize intricate patterns and nonlinear relationships within the dataset, making DNNs more powerful than conventional neural network models [27]. However, the term is sometimes used more loosely in the literature, even for neural networks containing only a single hidden layer. In certain interpretations, the input layer may also be considered operational, leading to the perception that a network with only one hidden layer contains two functional layers.
Within a neural network, input variables are transformed through a series of mathematical operations controlled by parameters known as weights. These weights determine how strongly each input influences the next layer and play a key role in mapping the input variables to their corresponding target outputs. Achieving high predictive accuracy requires careful adjustment of these parameters during training.
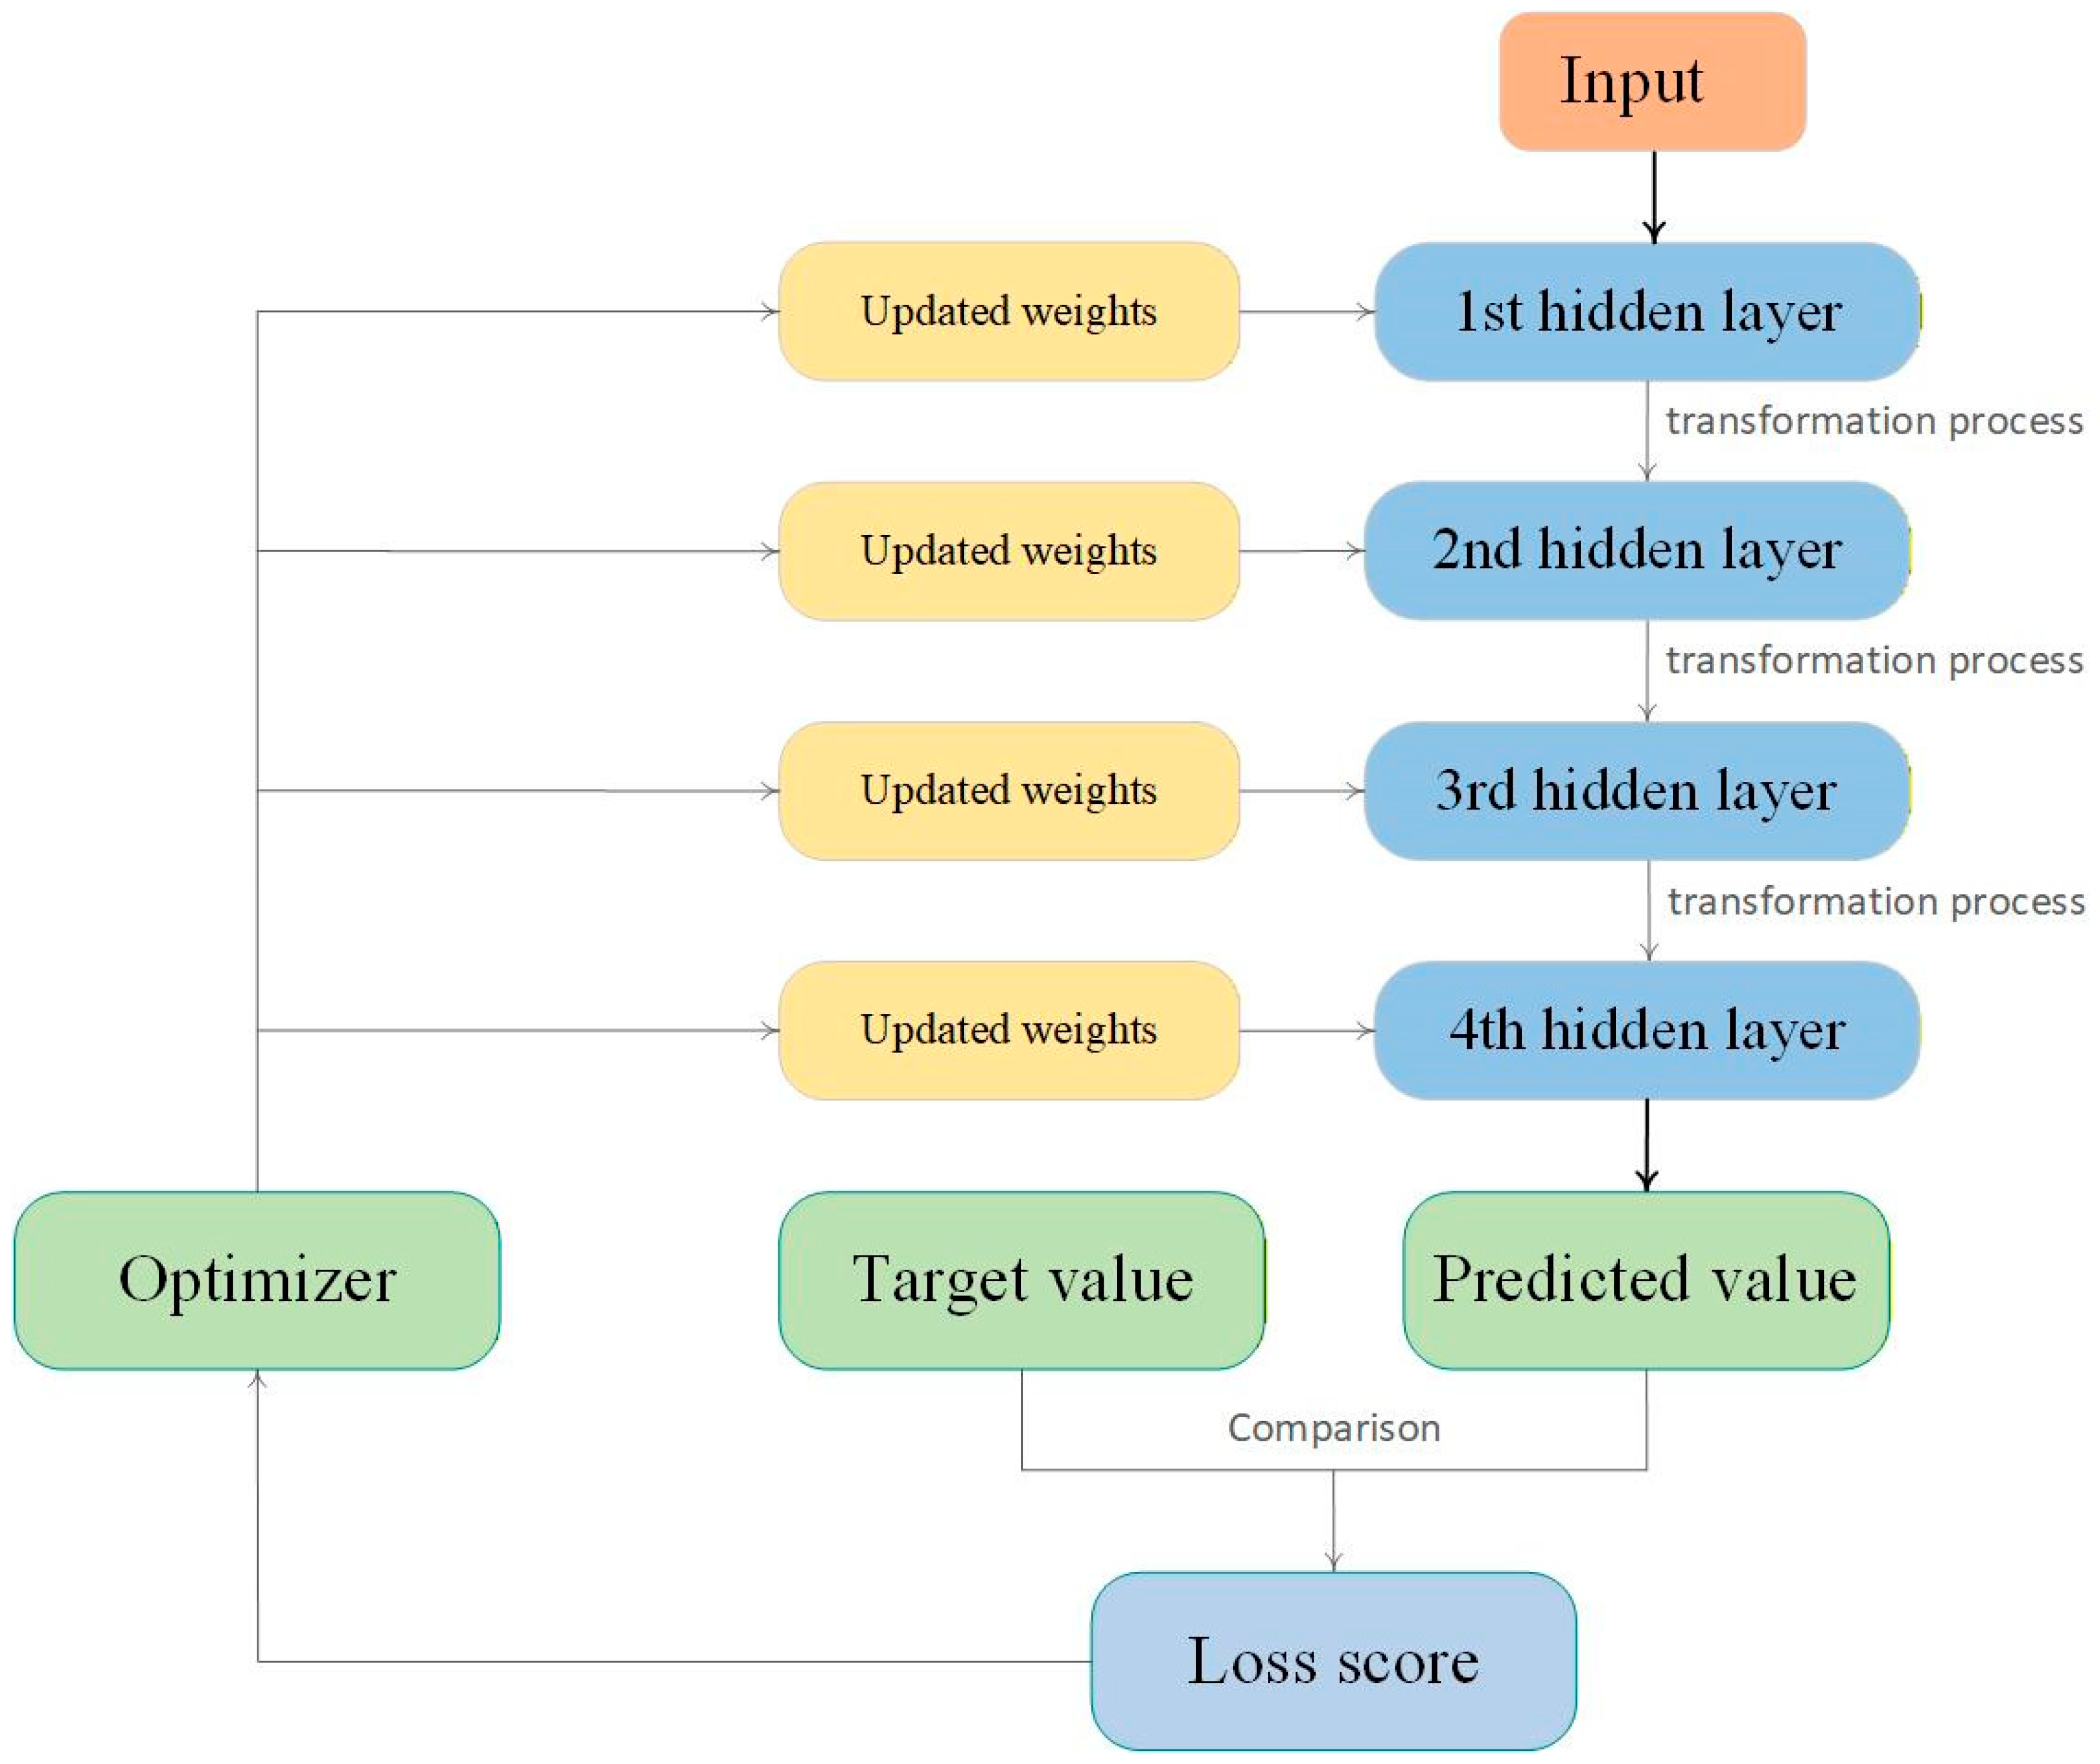
The training of a deep neural network (DNN), illustrated in Figure 2, generally involves two main procedures: forward propagation and backpropagation. At the beginning of training, the network weights are initialized with random values using predefined distributions, such as the Glorot initialization method. During forward propagation, the input data—either individually or in batches—are passed through the network layers to produce predicted outputs. The difference between the predicted values and the actual target values is then measured using a loss function.
Following this step, backpropagation is performed to update the model parameters. In this stage, the gradients of the loss function with respect to each weight are calculated, indicating how each parameter contributes to the prediction error. The weights are then adjusted in the direction that reduces this error, typically by moving in the opposite direction of the gradient. This process is repeated across multiple iterations, known as epochs, allowing the network to gradually improve its performance. Once the training process is completed, the trained model can be used to estimate the axial capacity of CFRP-strengthened concrete columns for new datasets that were not included during training [26].

2.2. CFRP-Wrapped Concrete Column Dataset

This section describes the features of the dataset assembled from experimental studies reported in the literature on reinforced concrete columns strengthened with externally bonded CFRP sheets. The collected database consists of experimental results related to columns confined or strengthened using various CFRP wrapping configurations. Before presenting the dataset in detail, it is important to highlight the fundamental requirements for constructing a dependable and well-structured database. In many computational modeling studies, researchers tend to focus primarily on improving the prediction algorithm while paying less attention to the quality and organization of the dataset. However, careful evaluation of the dataset is equally important for developing reliable predictive models.
The reliability and predictive performance of estimation models are strongly influenced by the statistical quality and consistency of the dataset used during training. Although computational techniques play an important role in model development, the foundation of an accurate predictive model lies in the availability of a dependable and statistically representative database. A well-constructed dataset should adequately cover the full range of relevant parameter values while maintaining high data quality and consistency. Because experimental data are typically collected across multiple independent studies, assembling a sufficiently large dataset is essential for reliable analysis. In addition, the data should preferably originate from reputable and accredited laboratories that follow recognized international testing standards.
Following this methodology, a database containing 469 experimental tests on CFRP-strengthened reinforced concrete columns was compiled from reliable studies reported in the literature [4,9,28,29]. The primary objective was to develop a well-structured and comprehensive dataset, as the predictive performance of deep learning models strongly depends on the quality, consistency, and completeness of the available data. It should be noted that the compiled database includes experimental results obtained from multiple independent studies and laboratories, which may introduce variability due to differences in testing procedures, material properties, and measurement techniques [30,31]. To ensure data consistency and statistical reliability, only data from reputable sources following recognized experimental standards were considered. The dataset was carefully screened to remove incomplete, duplicate, or inconsistent records, and all variables were defined using consistent units and parameters. No arbitrary outlier removal was performed, as extreme values reflect realistic experimental conditions reported in the literature. Retaining these data points helps preserve the diversity of the dataset and enhances the generalization capability of the model. In addition, a normalization procedure was applied to standardize the input variables prior to training, and the use of k-fold cross-validation further reduces the potential influence of variability and extreme values on model performance. Overall, despite inherent inter-laboratory variability, the size, diversity, and preprocessing of the dataset contribute to the robustness and reliability of the proposed model.
The developed database includes nine input variables for the predictive model, representing the key geometric, material, and loading characteristics influencing the behavior of CFRP-strengthened columns. The selection of these variables was based on both their physical relevance and their consistent availability across the compiled experimental database. Only parameters reported in a sufficiently large number of studies were included to avoid excessive data reduction. It is also noted that the effects of some excluded parameters are partially captured through the included variables, particularly those related to FRP mechanical properties and reinforcement characteristics. The compiled dataset provides detailed information on specimen geometry, material properties, and strengthening configurations, including variations in column dimensions (e.g., cross-sectional area and slenderness), confinement types (fully and partially wrapped configurations), FRP materials (primarily CFRP sheets with different mechanical properties), and strengthening schemes (e.g., continuous wrapping or discrete strip confinement). These characteristics are incorporated into the selected input variables, whose ranges are summarized in Table 2, ensuring a comprehensive representation of the factors governing axial behavior. The influence and relative importance of the selected input variables are further examined through the correlation analysis and parametric evaluation presented in this study. The input variables consist of the gross cross-sectional area of the column ( A g ), the column slenderness ratio ( k L / r ) which reflects the stability of the column against buckling, the area of CFRP reinforcement (Af), the CFRP reinforcement ratio ( ρ f ) representing the proportion of CFRP strengthening, the load eccentricity ( e ) which denotes the distance between the load application point and the centroid of the column cross-section, and the eccentricity ratio ( e / h ) which normalizes the eccentricity with respect to the column depth. In addition, the material properties include the concrete compressive strength ( f c ), the tensile strength of the CFRP material ( f f ), and the elastic modulus of the CFRP ( E f ). The experimental axial capacity of the column ( P e x p ) was considered as the target output variable to be predicted by the deep learning model.
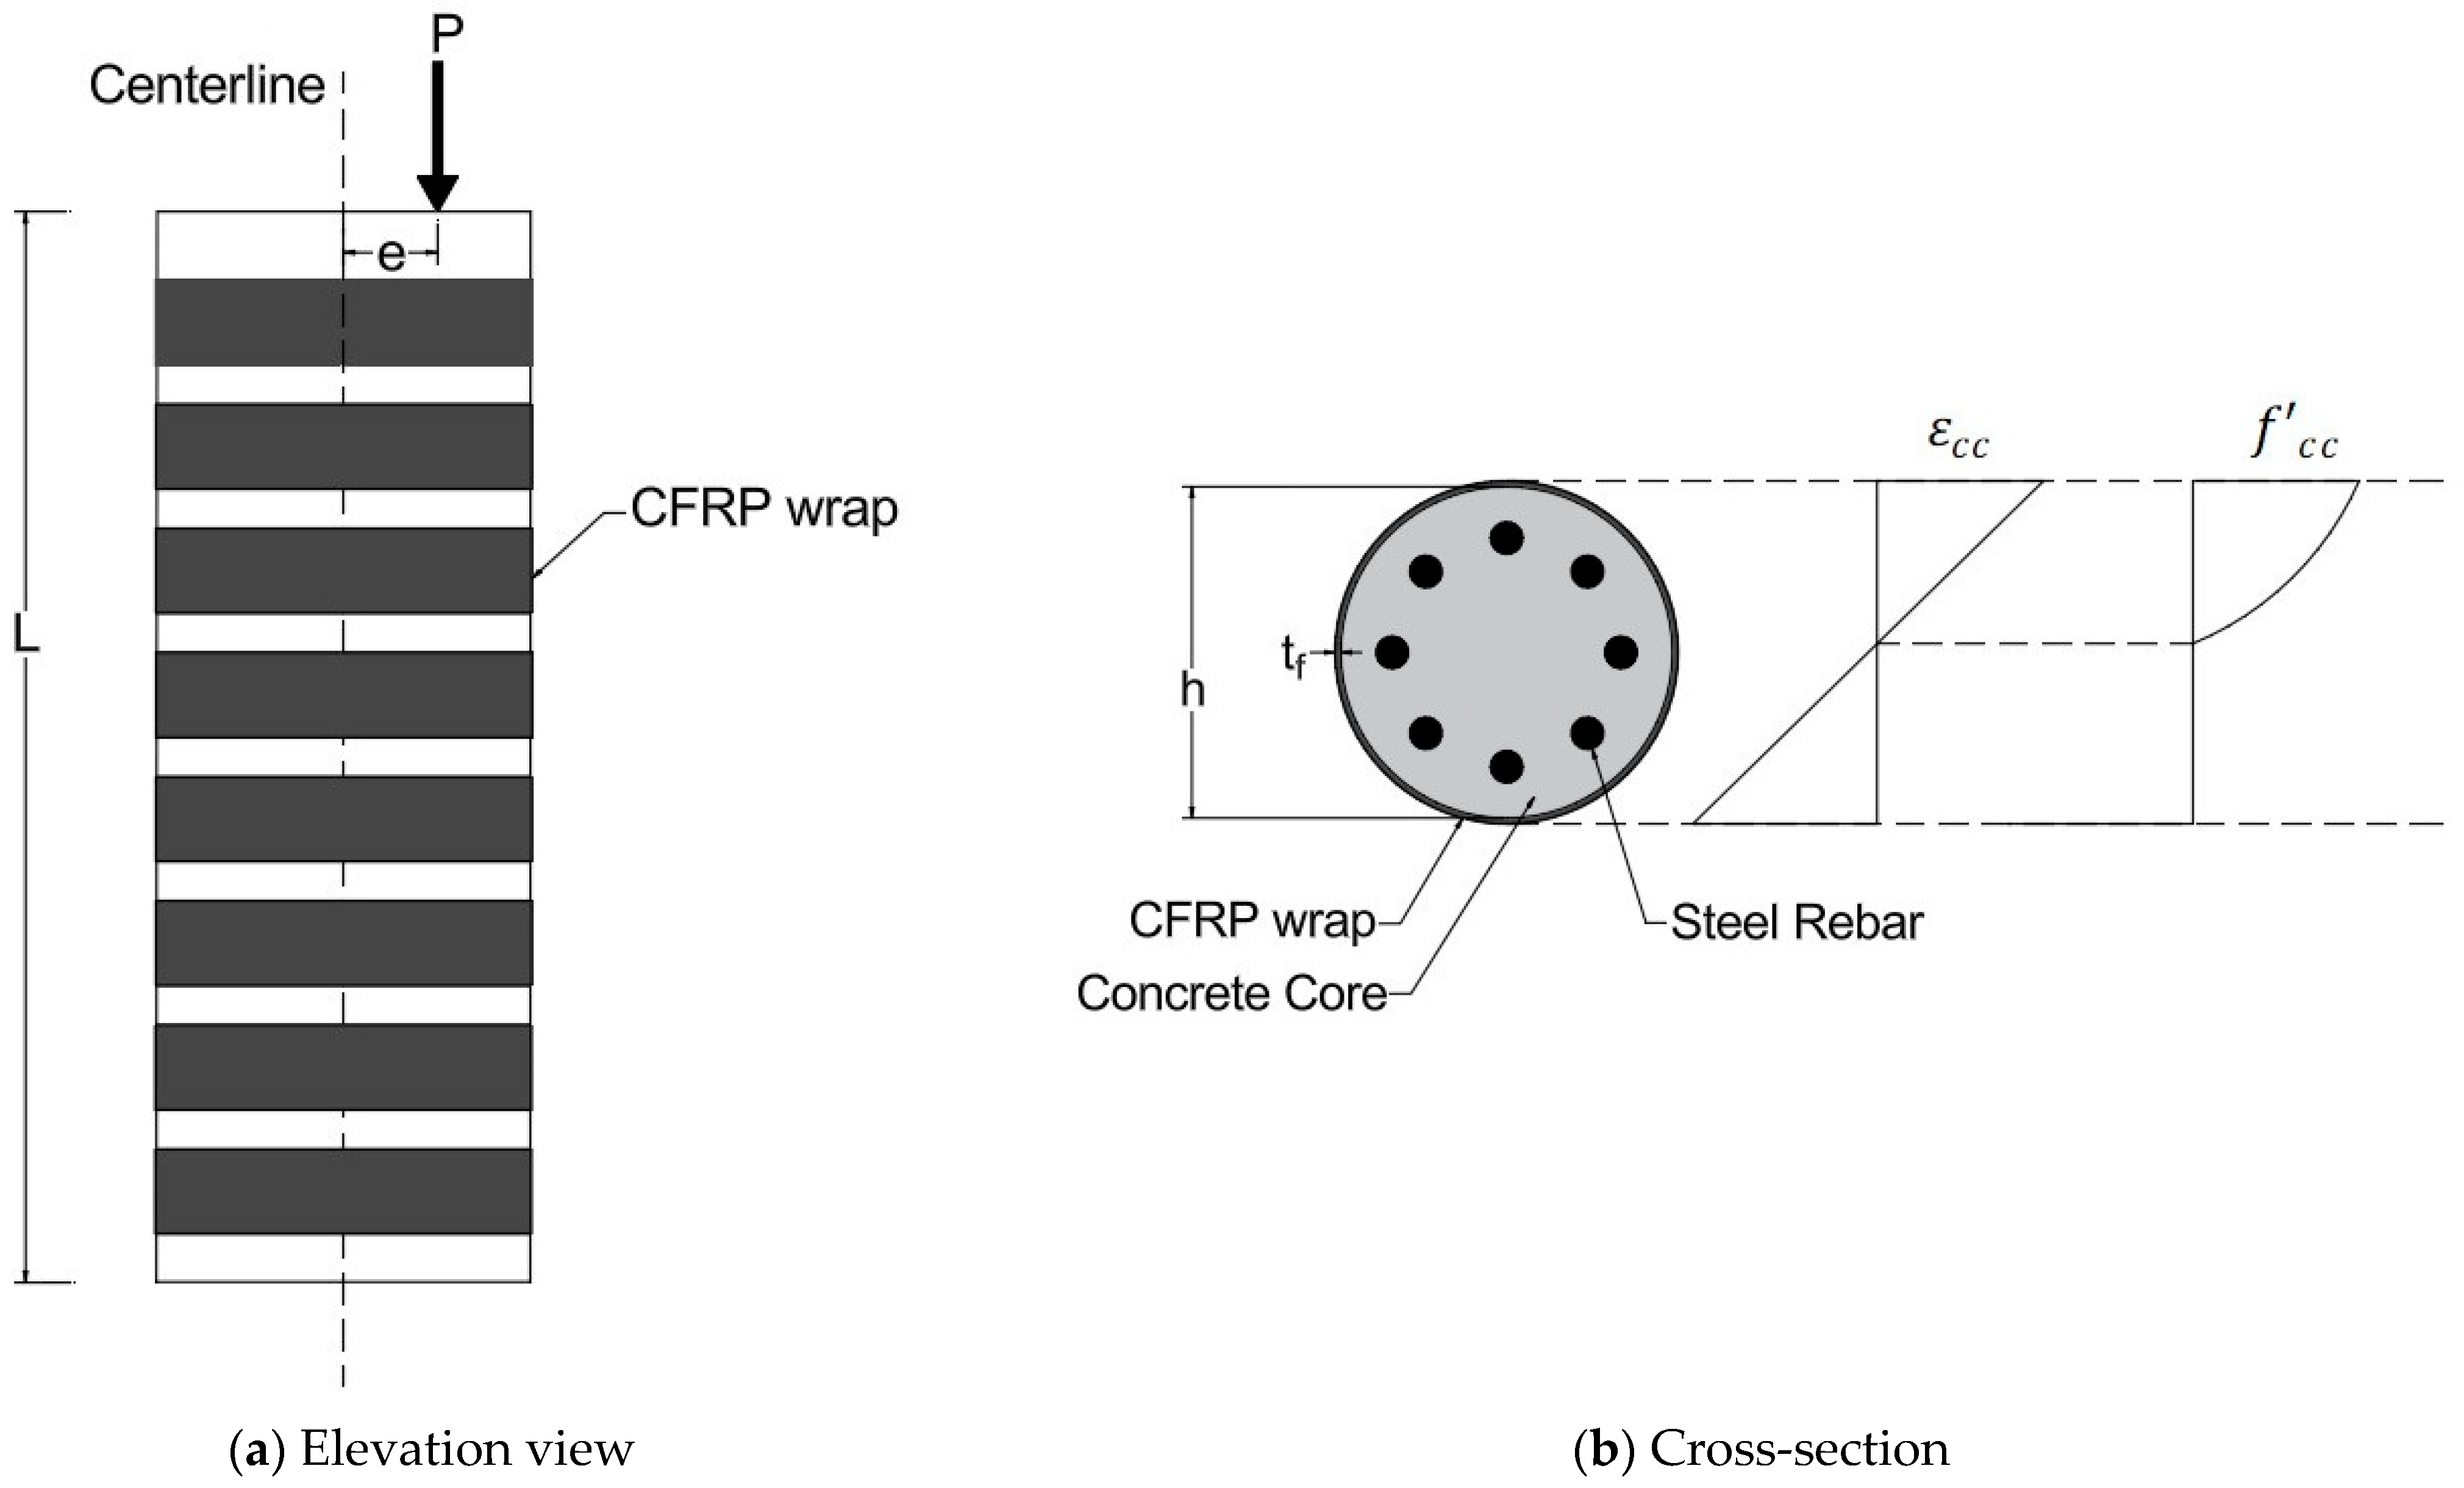
To provide a clearer description of the geometric and strengthening variables included in the database, Figure 3 presents schematic illustrations of a CFRP-strengthened reinforced concrete column. The figure shows the column cross-section, the internal steel reinforcement arrangement, and the CFRP wrapping configuration used to define the input parameters of the predictive model. In Figure 3, h represents the column diameter, t f indicates the CFRP layer thickness, e corresponds to the eccentricity, L is the column height, and P is the axial load. These parameters collectively define the geometric and strengthening characteristics considered in the dataset.
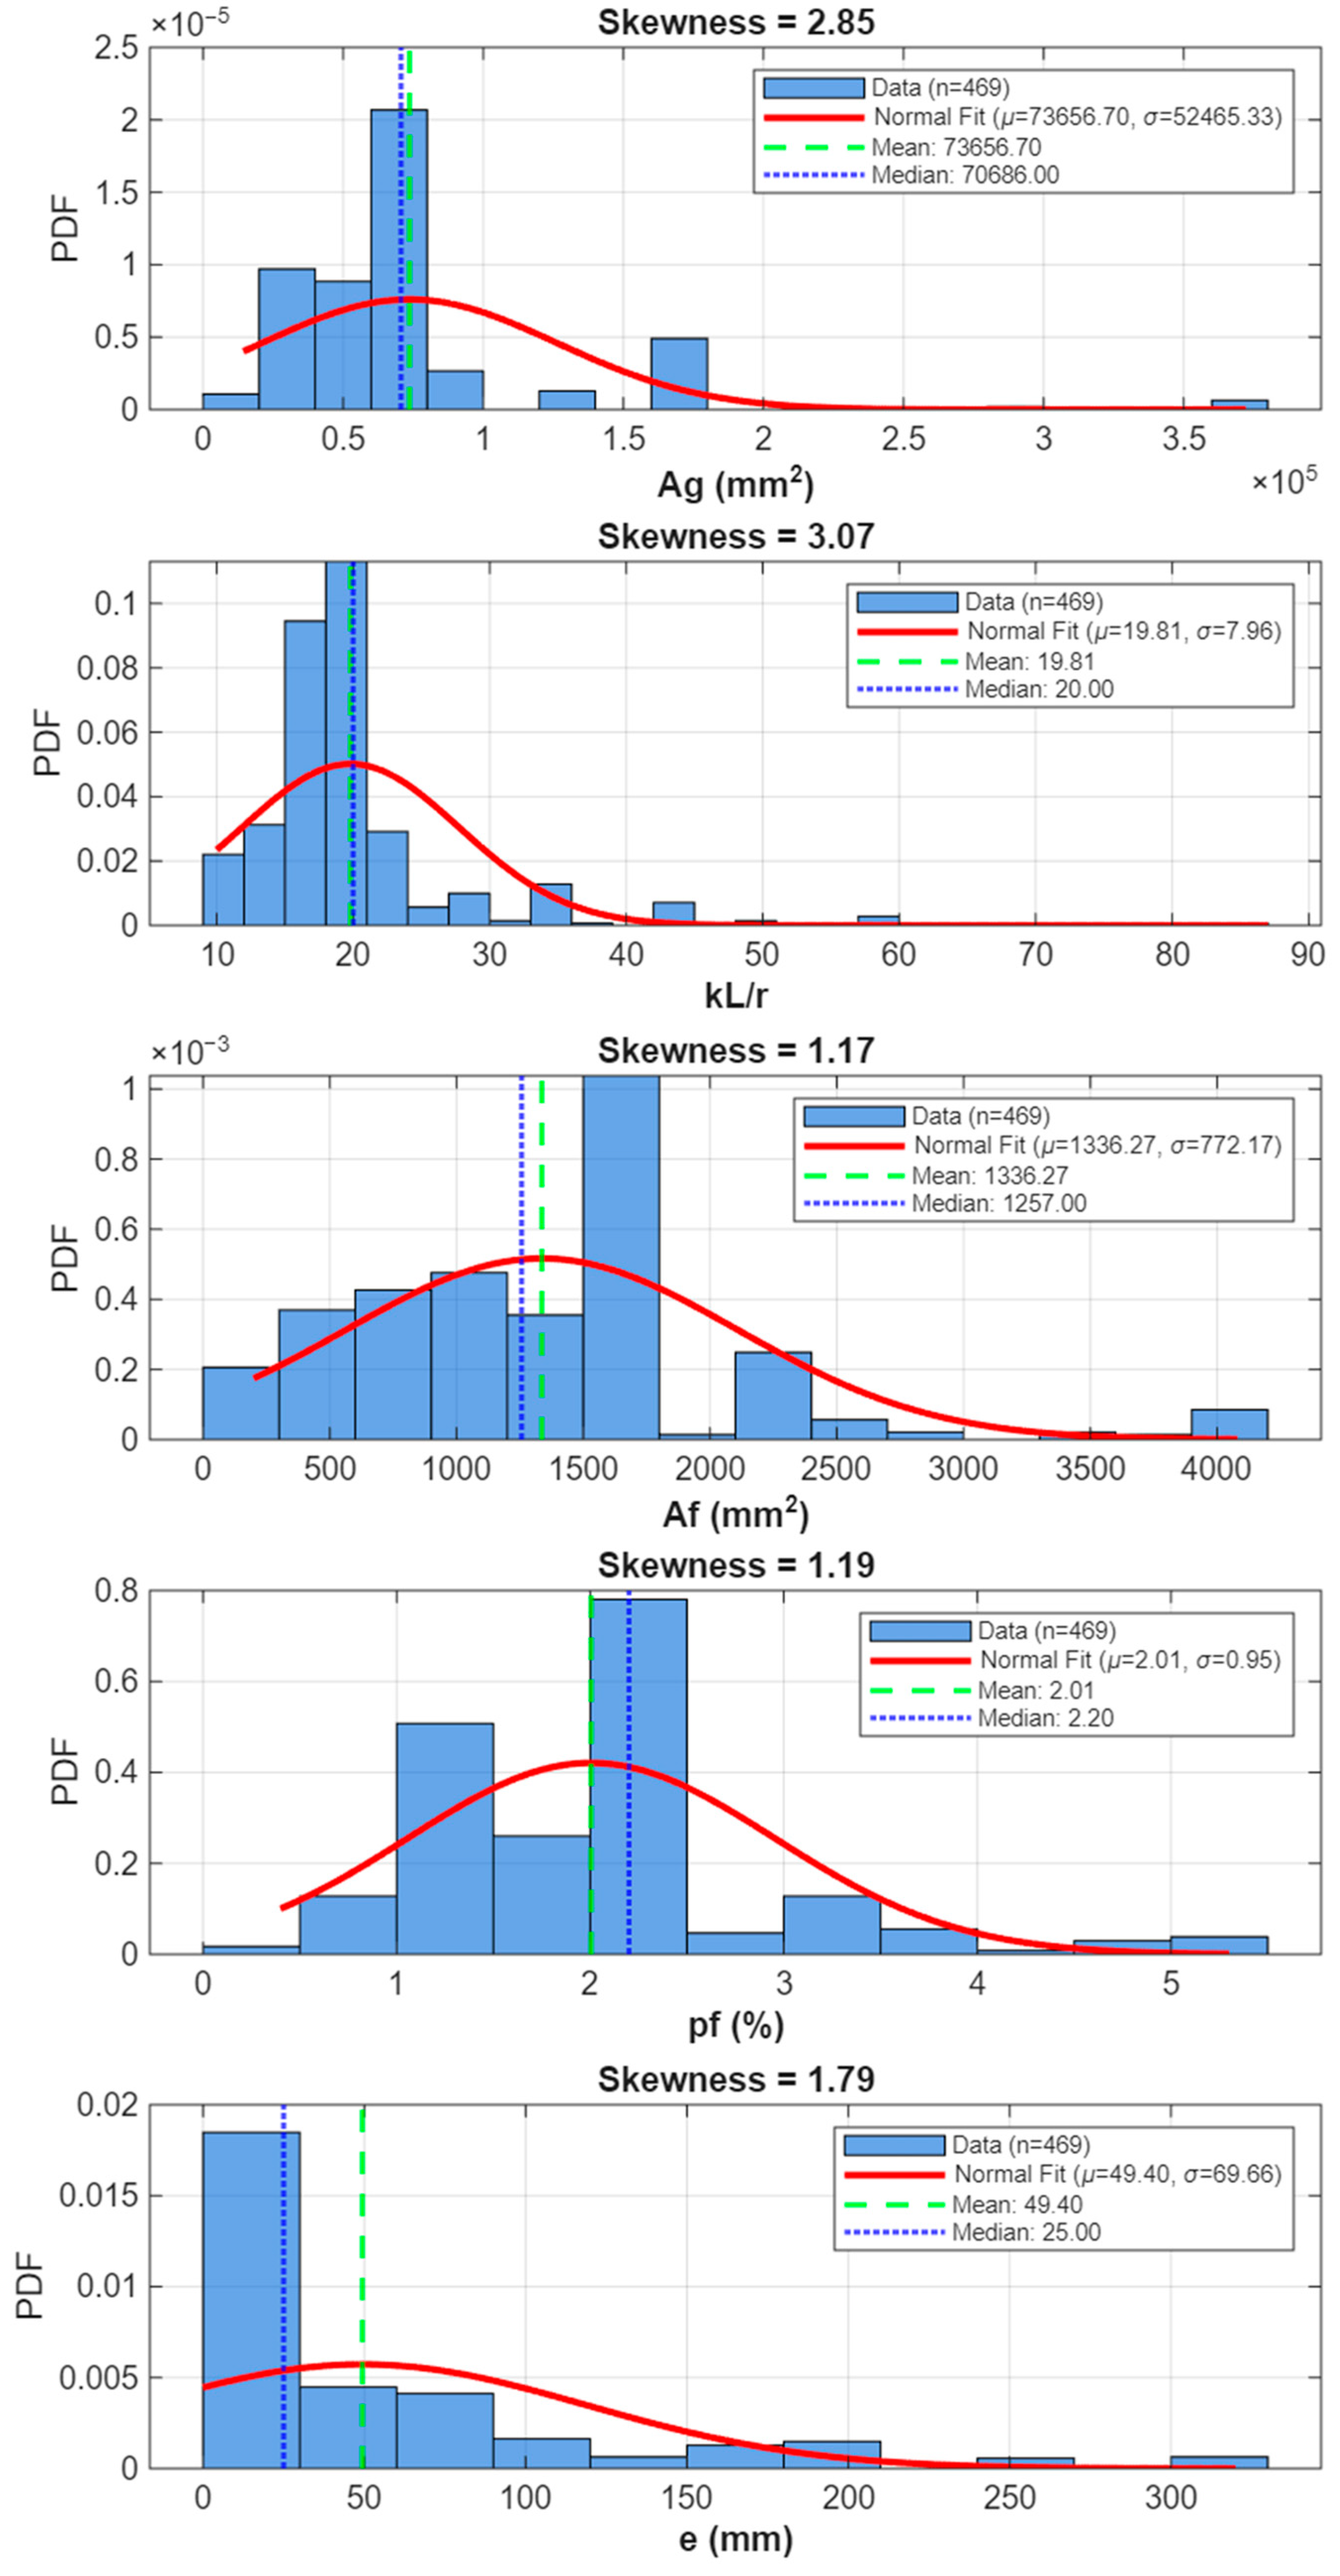
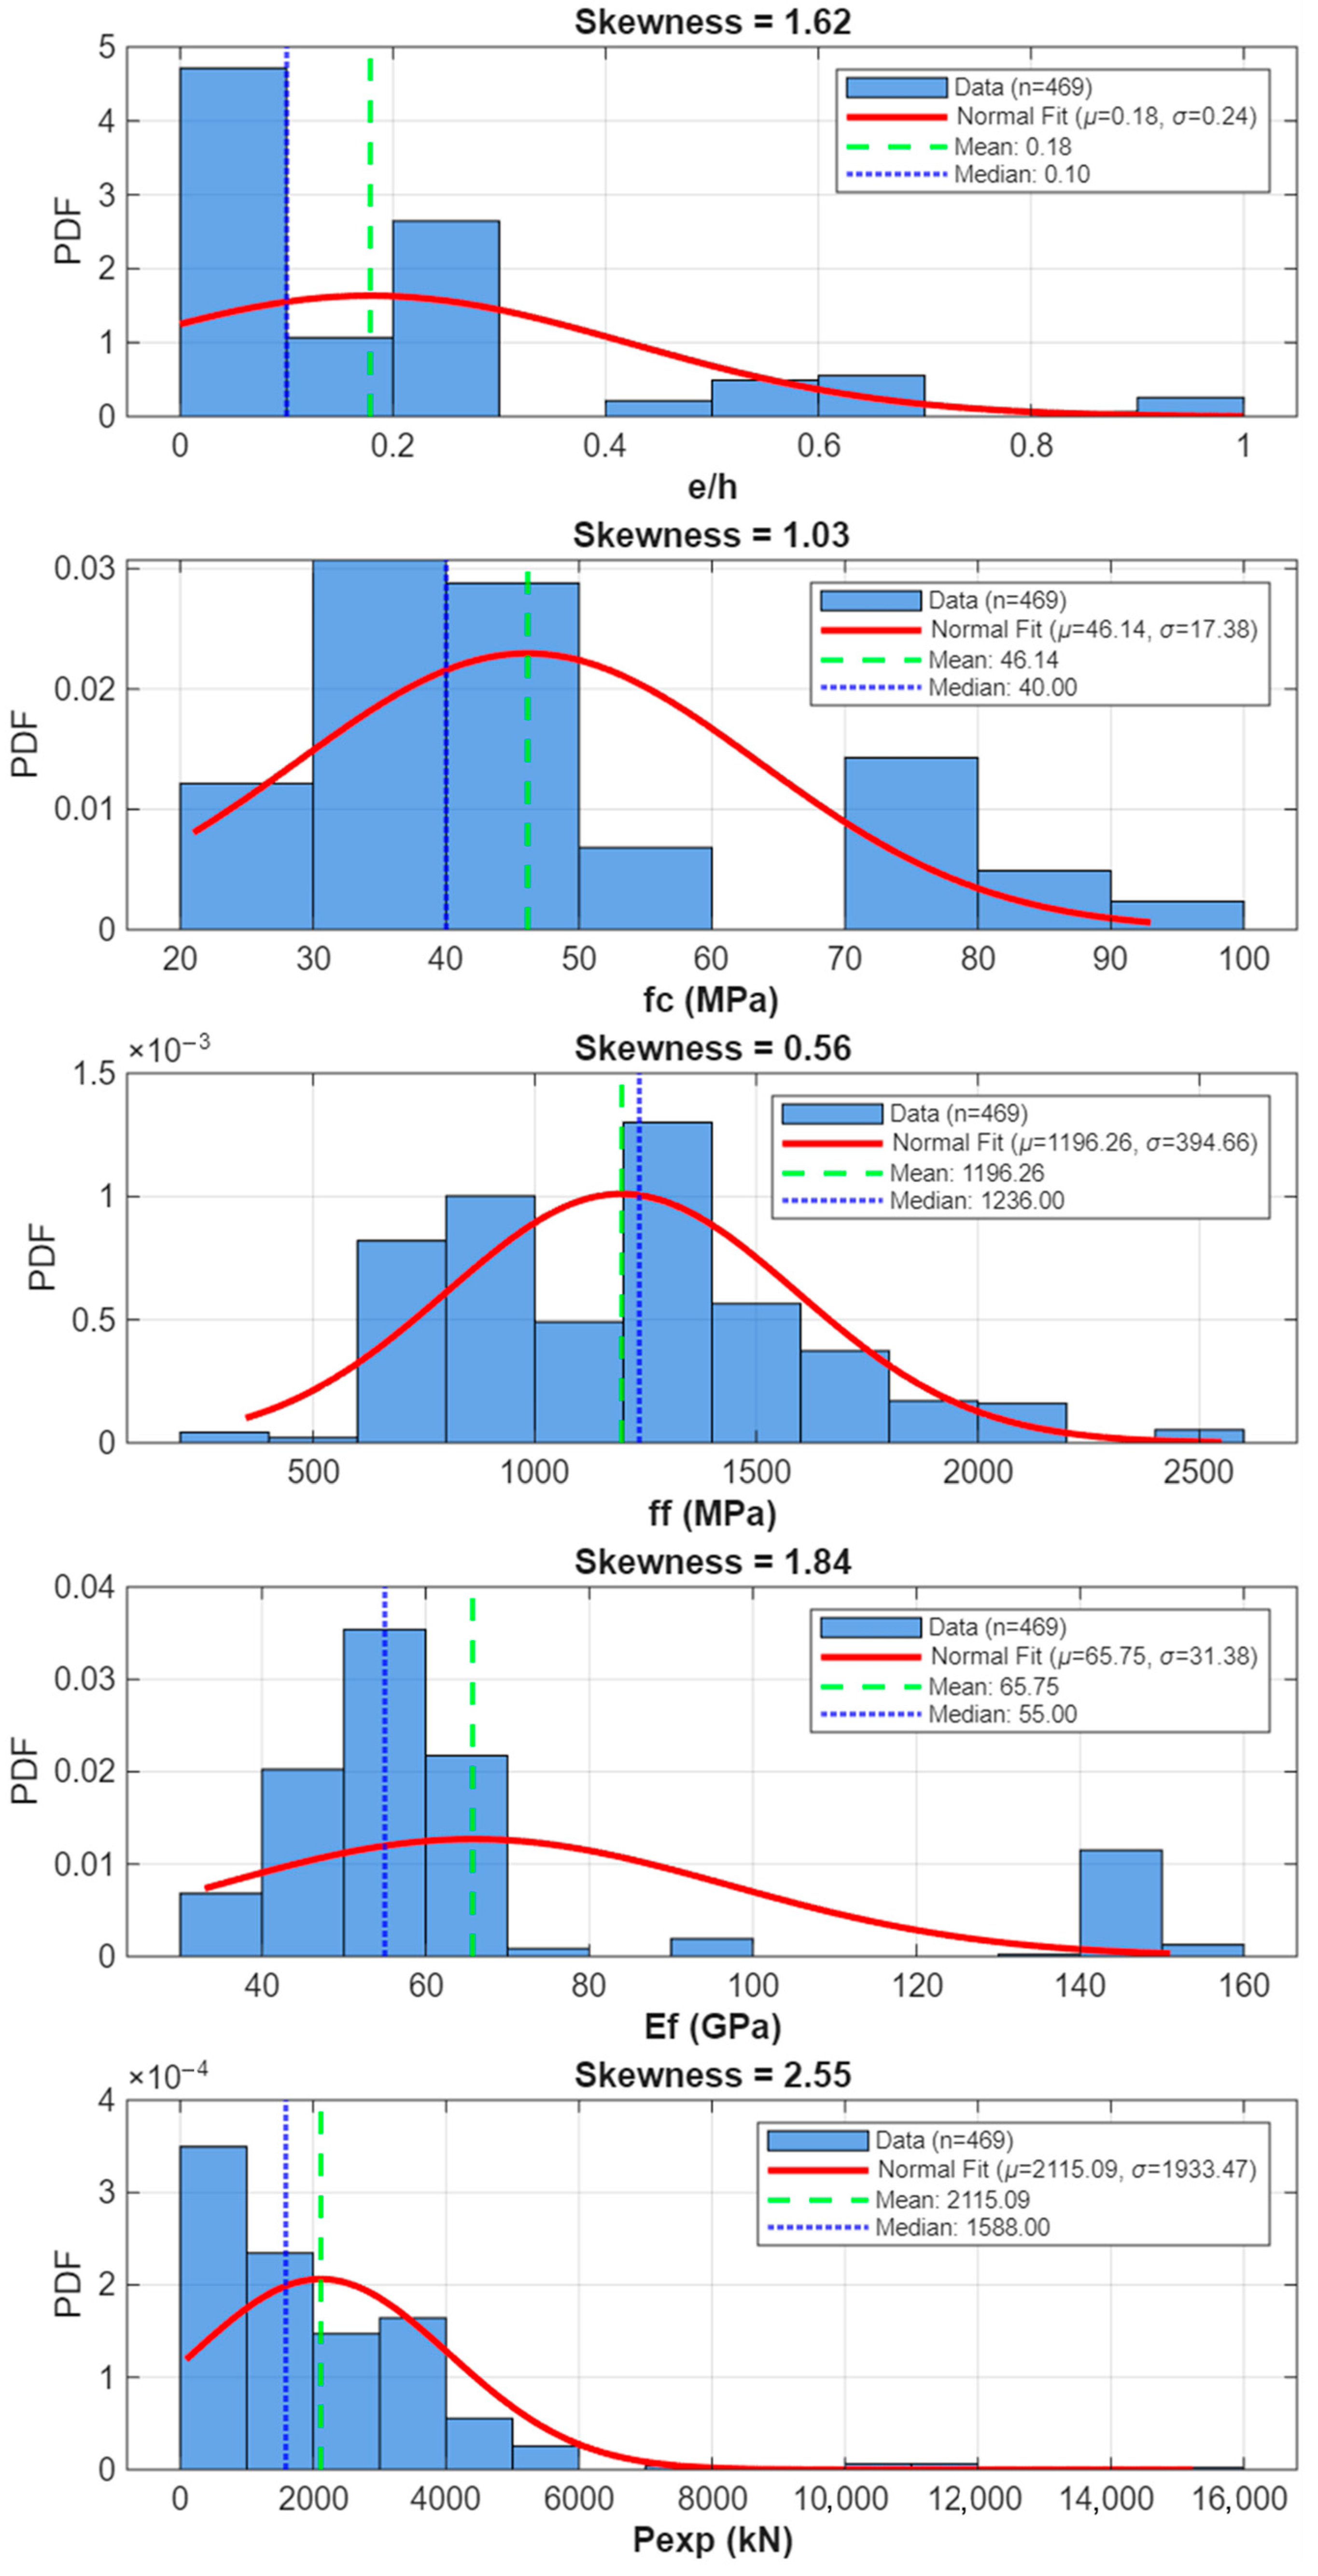
Table 2 presents the statistical summary of the compiled dataset, while Figure 4 shows the corresponding histograms for the considered variables. In addition to the histograms, the figure also presents the mean, median, and skewness for each parameter, providing a clearer understanding of the dataset’s statistical characteristics. The distributions show that some variables are not perfectly symmetric and exhibit different levels of skewness, indicating that the database covers a wide range of practical cases but is not uniformly distributed. Such information is important for evaluating the reliability of the developed model, since machine learning predictions are generally more accurate within parameter ranges well represented in the dataset. Therefore, the histograms help identify the intervals where the trained model is expected to provide reliable estimates of the axial capacity of CFRP-confined reinforced concrete columns, as well as the regions where the available experimental data are limited and additional tests may be needed. A more detailed discussion regarding dataset limitations and recommendations for future work is presented in Section 7 of this paper.
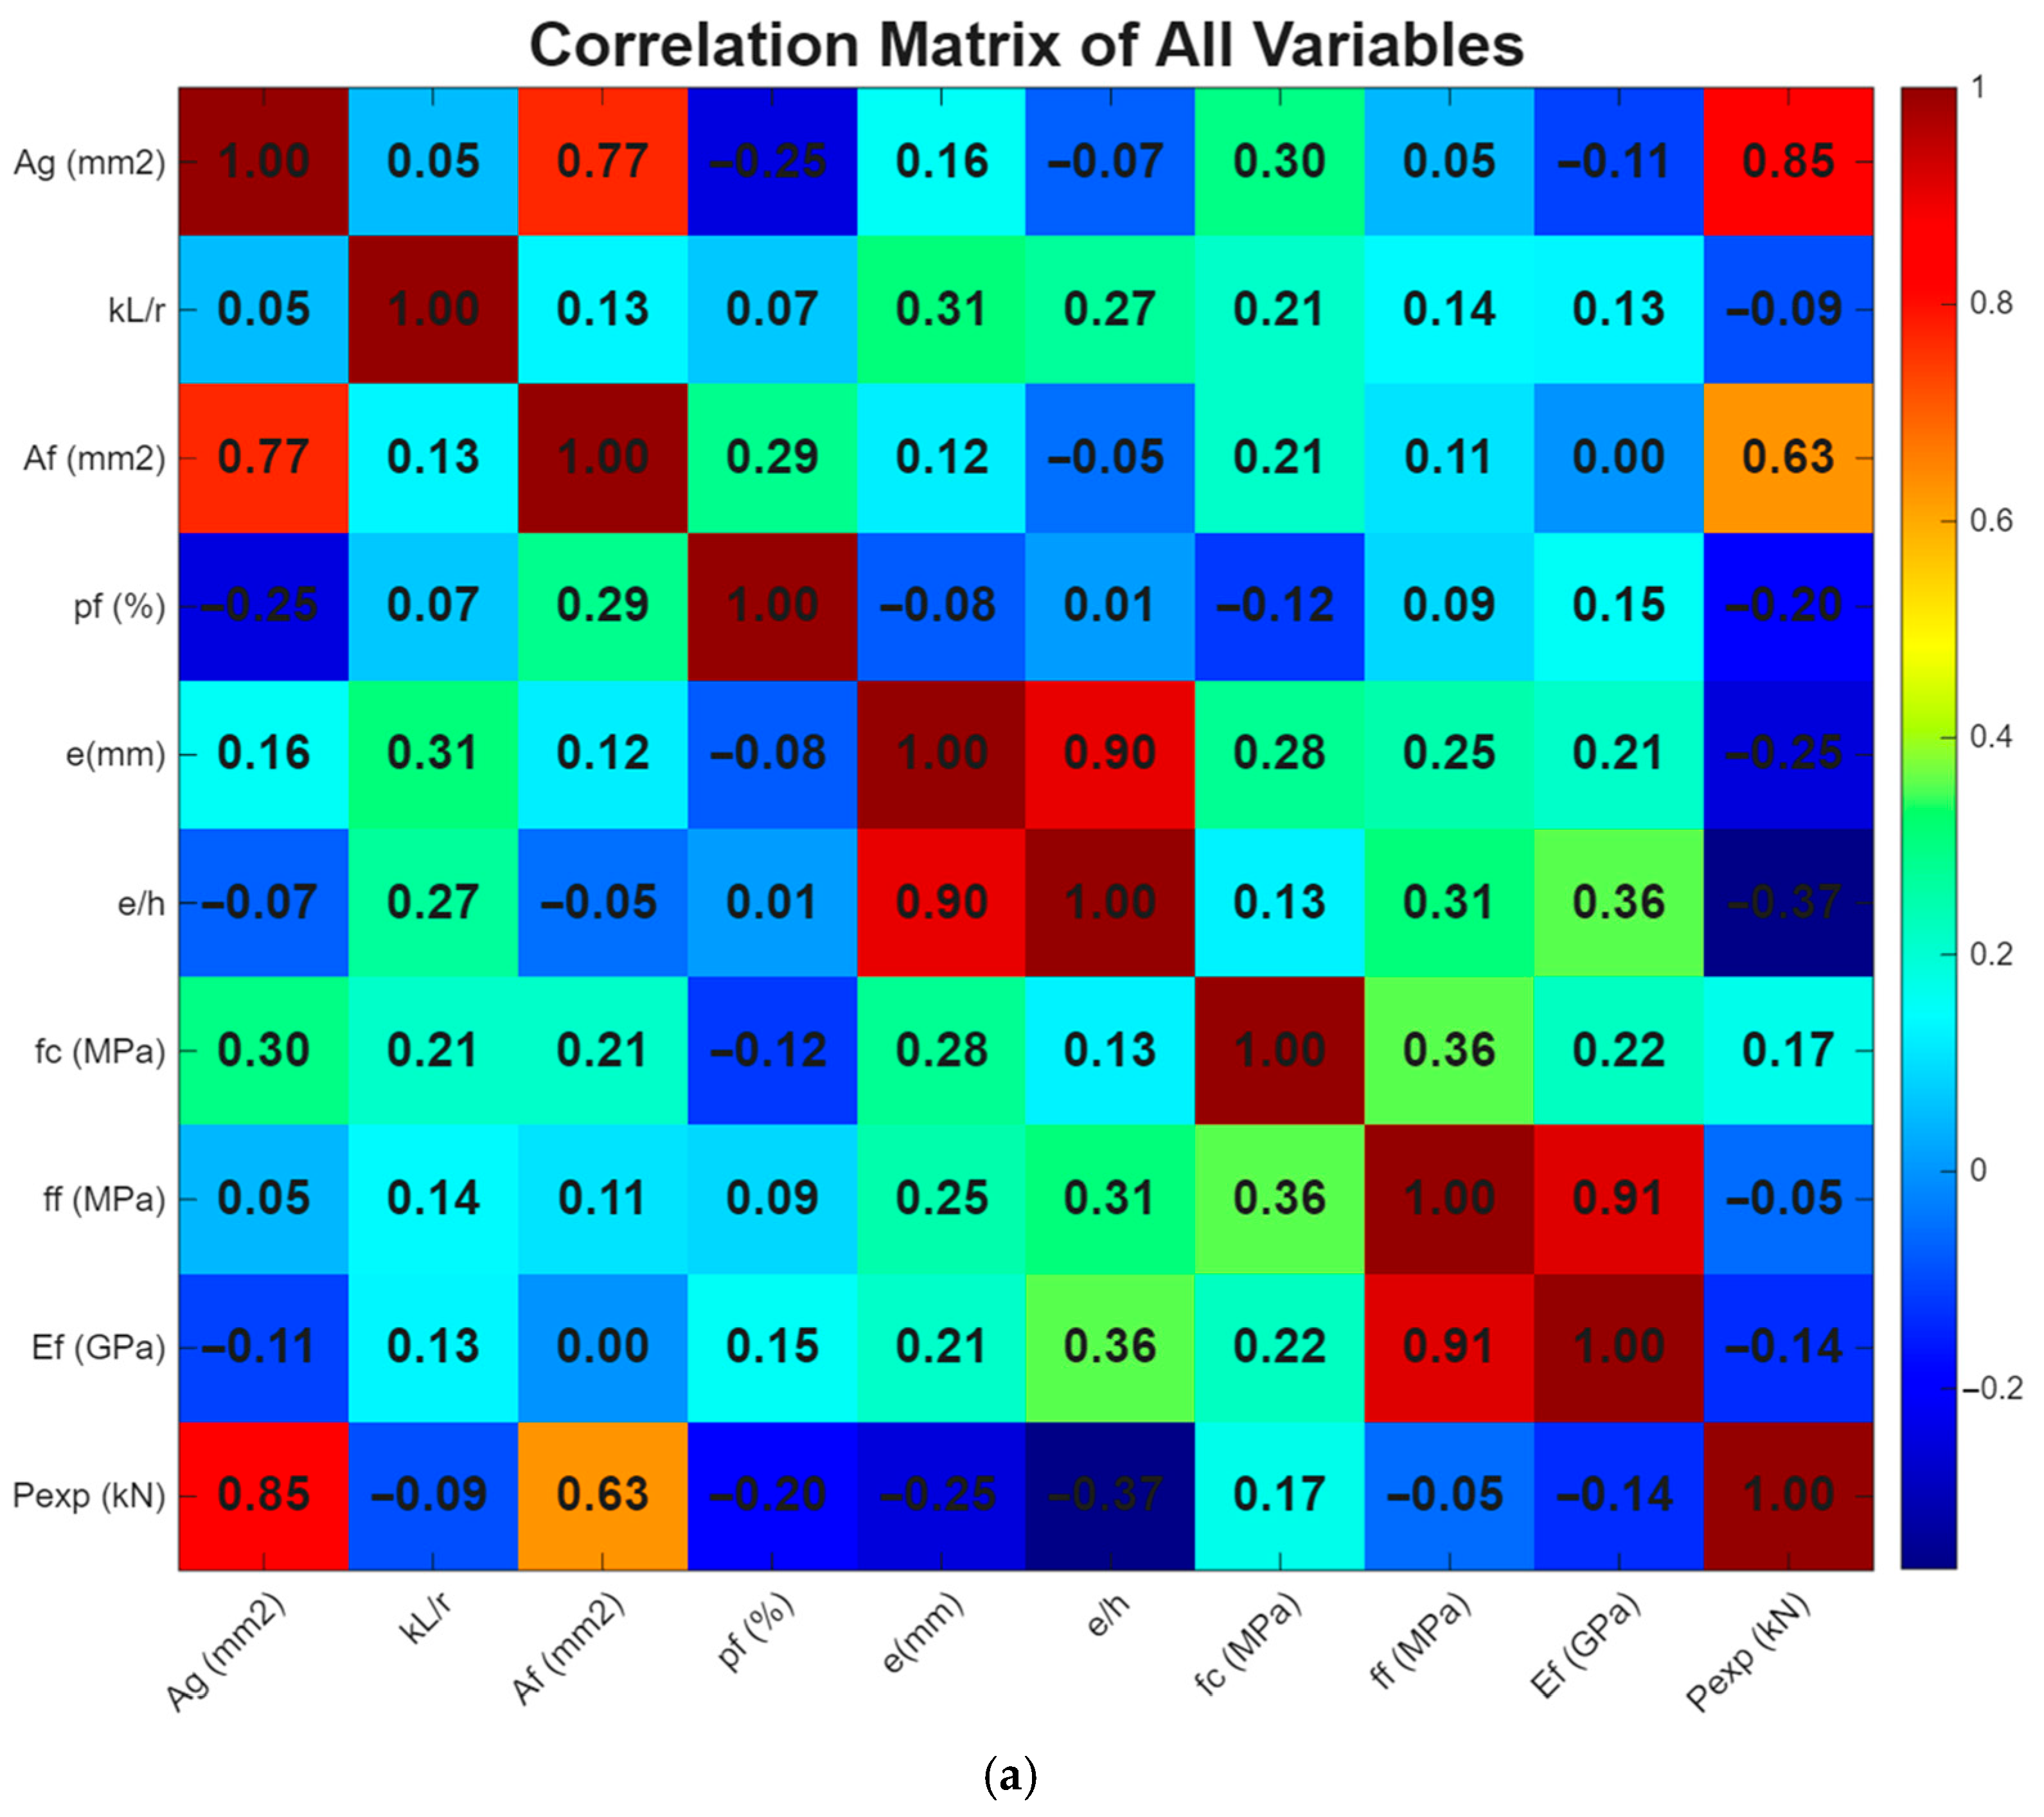
Figure 5a presents the correlation matrix of all input variables and the target variable Pexp. The matrix illustrates the pairwise Pearson correlation coefficients between the geometric, material, and strengthening parameters used in the study, including the gross cross-sectional area A g , slenderness ratio k L / r , FRP area A f , FRP ratio ρ f , load eccentricity e , eccentricity ratio e / h , concrete compressive strength f c , FRP tensile strength ff, FRP elastic modulus E f , and ultimate axial capacity P e x p . The color scale ranges from −1 to +1, where red tones represent strong positive correlations, blue tones represent negative correlations, and green–yellow tones indicate moderate correlations. Among the variables, the ultimate axial capacity Pexp shows the strongest positive correlation with the gross cross-sectional area A g (0.85), indicating that larger column cross-sections significantly increase the axial load-carrying capacity. A strong positive correlation is also observed between P e x p and the FRP area A f (0.63), suggesting that increasing the amount of FRP reinforcement contributes to higher axial strength. A weak positive correlation exists between P e x p and concrete compressive strength f’c (0.17), indicating a limited but noticeable influence within the available dataset. Negative correlations are observed between P e x p and the eccentricity ratio e / h (−0.37), as well as the eccentricity e (−0.25), which confirms that increasing load eccentricity reduces the axial capacity of columns. A small negative correlation is also seen with the FRP ratio ρ f (−0.20), while the relationships between P e x p and other parameters such as E f (−0.14), k L / r (−0.09), and f f (−0.05) are weak, indicating limited direct linear influence on the axial capacity within the dataset. The correlations among the input variables themselves are generally weak to moderate, indicating limited multicollinearity. For example, a strong positive correlation is observed between eccentricity e and eccentricity ratio e / h (0.90), and between FRP tensile strength f f and FRP elastic modulus E f (0.91). A relatively strong correlation is also seen between A g and A g (0.77), while most other parameter pairs show low to moderate correlations. Overall, the correlation matrix confirms that the selected variables provide independent and meaningful information for predicting the axial capacity of CFRP-strengthened concrete columns.
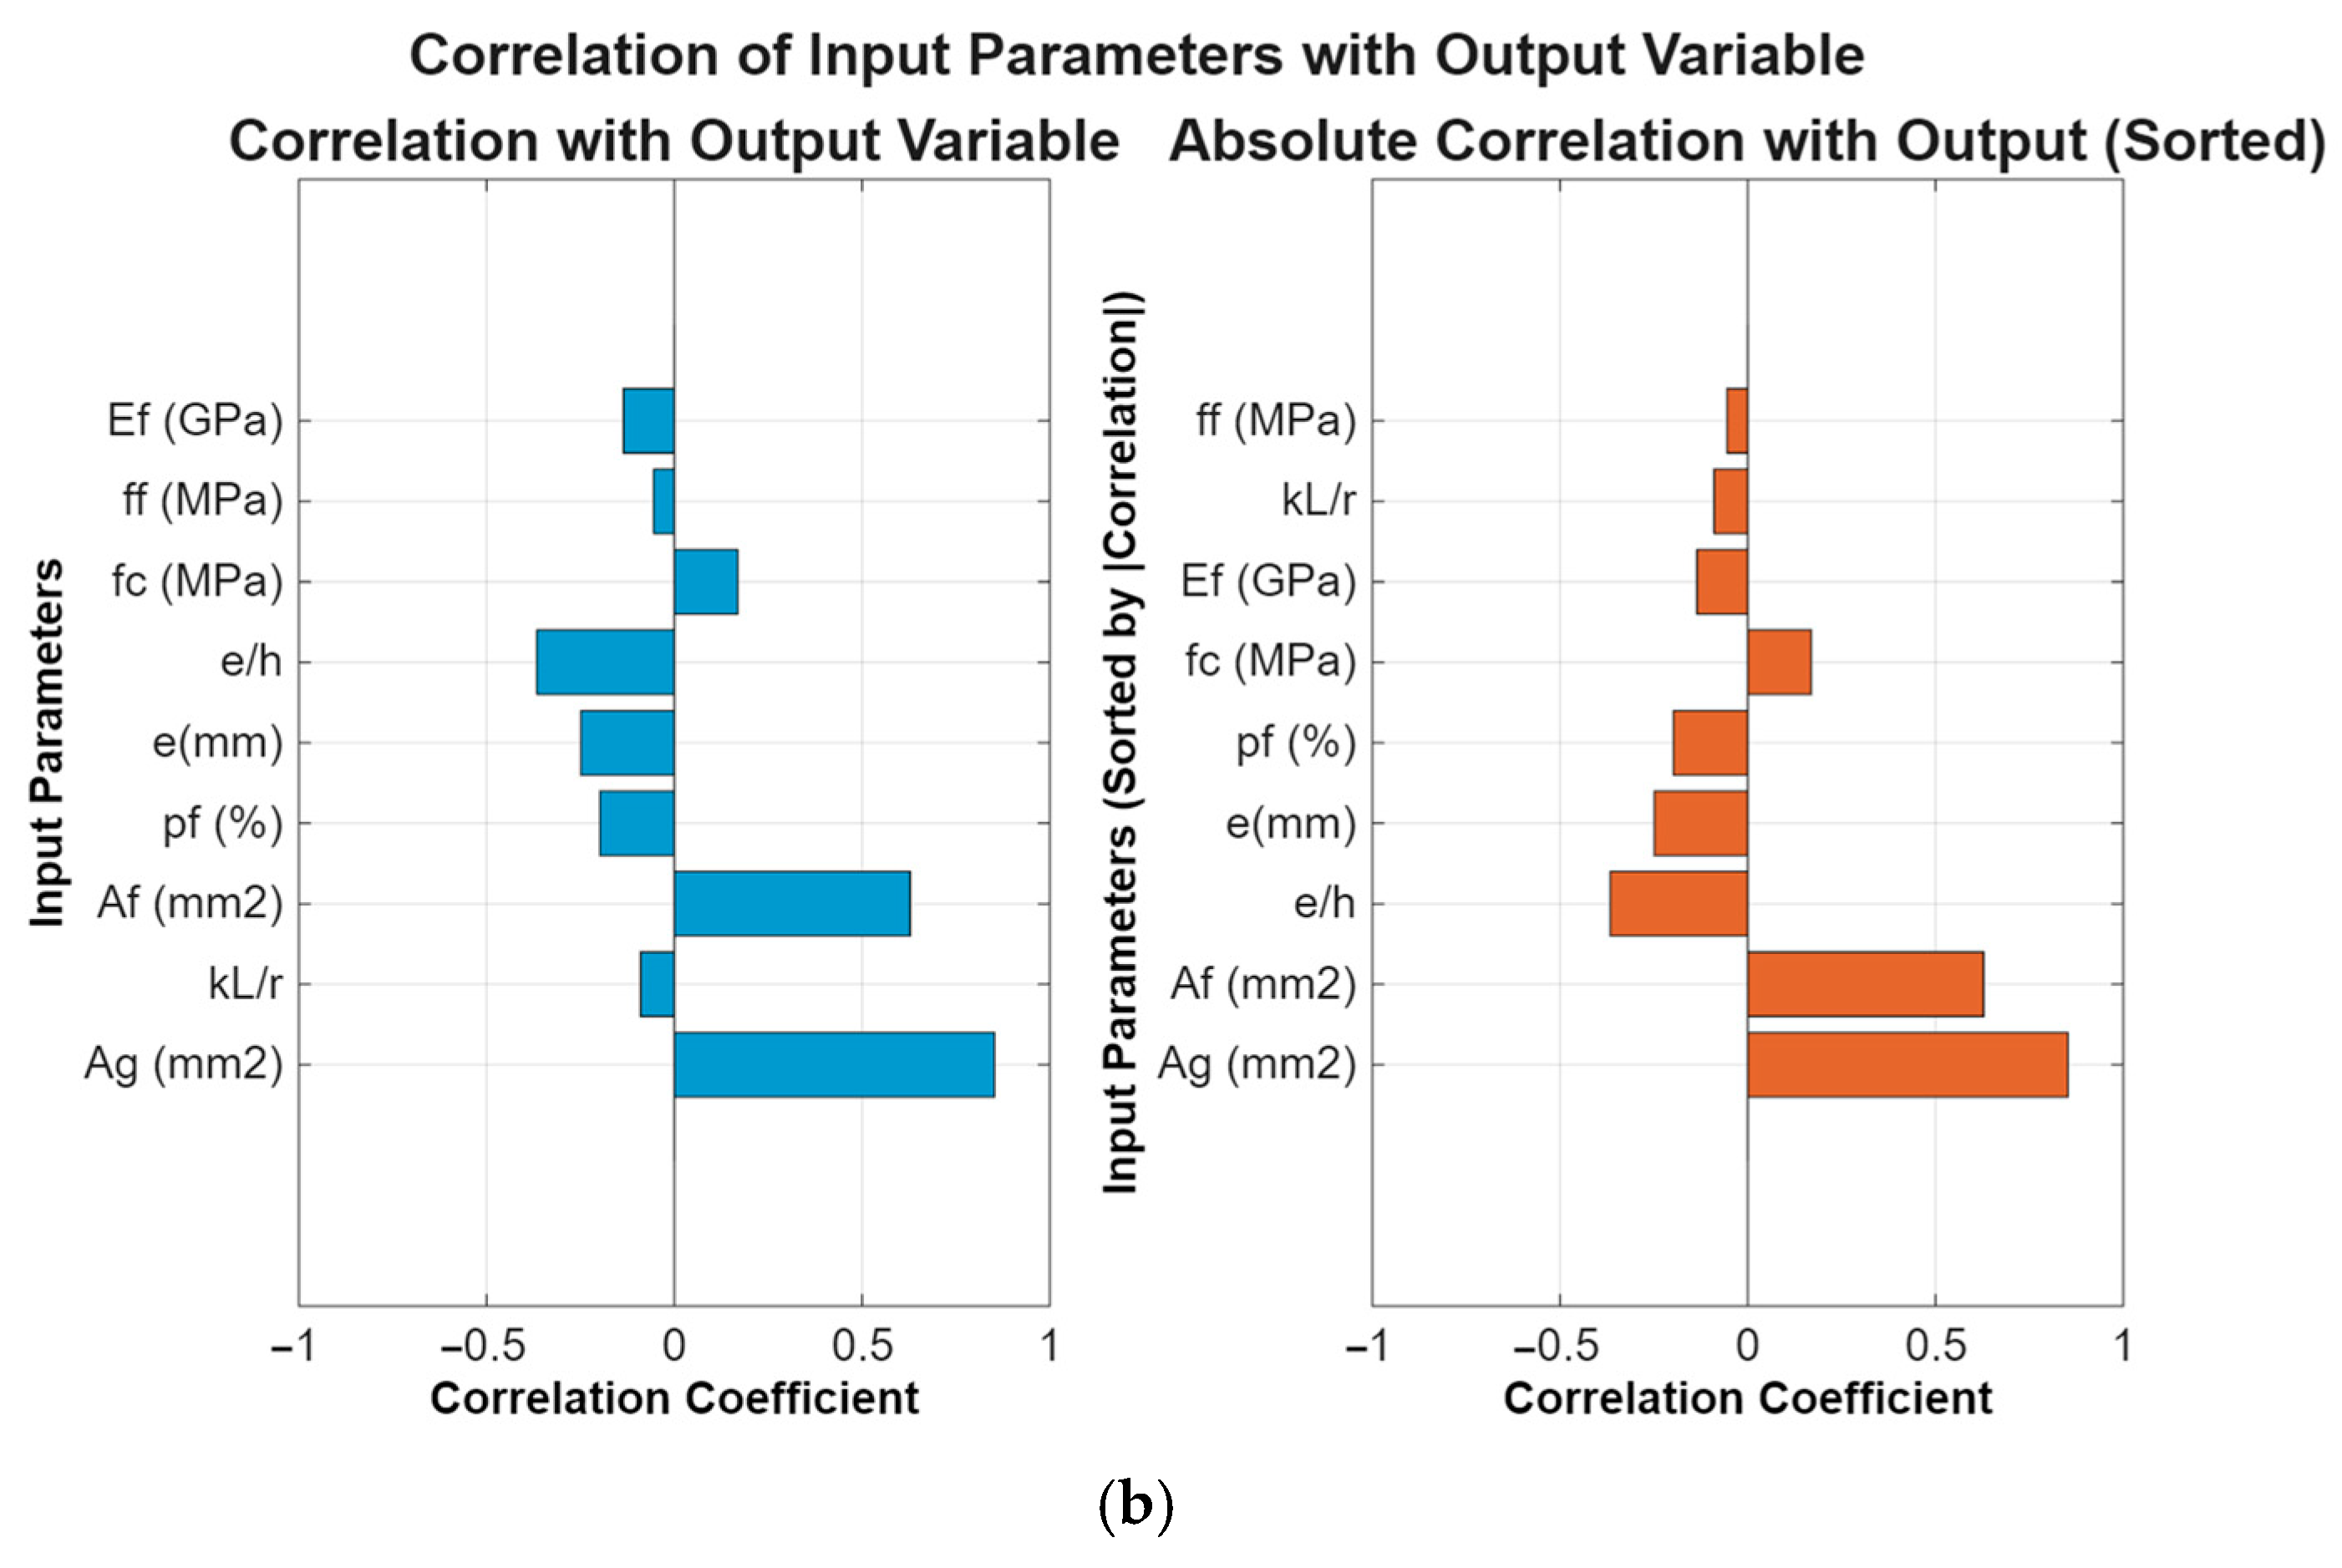
Figure 5b presents the correlation analysis between the input parameters and the output variable representing the axial capacity of CFRP-strengthened concrete columns. The figure consists of two subplots that illustrate both the direction and magnitude of the relationships between each input variable and the predicted axial capacity. The left subplot shows the Pearson correlation coefficients between the input parameters, including the gross cross-sectional area ( A g ), slenderness ratio ( k L / r ), FRP area ( A f ), FRP ratio ( ρ f ), eccentricity ( e ), normalized eccentricity ( e / h ), concrete compressive strength ( f c ), FRP tensile strength ( f f ), and FRP elastic modulus ( E f ), and the output variable. Positive correlation values indicate that the axial capacity increases with the parameter, whereas negative values indicate an inverse relationship. Among the parameters, the gross cross-sectional area ( A g ) and the FRP area ( A f ) show the strongest positive correlations with the axial capacity, indicating that the geometric properties of the column and the amount of FRP confinement play a dominant role in determining the load-carrying capacity. The concrete compressive strength ( f c ) exhibits a weak positive correlation, suggesting a limited but noticeable contribution to the axial strength. In contrast, the eccentricity ( e ), normalized eccentricity ( e / h ), and FRP ratio ( ρ f ) show negative correlations with the output variable, indicating that increased eccentric loading or higher deformation-related parameters tend to reduce the axial capacity in the considered dataset. The slenderness ratio ( k L / r ), FRP tensile strength ( f f ), and FRP elastic modulus ( E f ) demonstrate very weak correlations, implying a relatively small direct linear influence on the predicted axial capacity within the available experimental data. The right subplot shows the absolute values of the correlation coefficients sorted by magnitude, allowing clearer identification of the most influential parameters regardless of the sign of the relationship. The ranking indicates that the gross area ( A g ) has the strongest influence on the axial capacity, followed by the FRP area ( A f ) and the eccentricity-related parameters ( e / h and e ). Parameters such as FRP ratio ( ρ f ) and concrete compressive strength ( f c ) exhibit moderate influence, whereas the slenderness ratio ( k L / r ), FRP modulus ( E f ), and FRP strength ( f f ) show minimal correlation with the output variable. Overall, the results demonstrate that geometric characteristics and confinement-related parameters govern the axial capacity of CFRP-strengthened columns. At the same time, most material properties exhibit comparatively weaker linear correlations within the studied dataset.
To develop and evaluate the DNN model, the dataset was randomly split into two groups: 80% for training and 20% for testing. The training subset was employed to build and calibrate the predictive model. In contrast, the testing subset was used to evaluate the model’s capability to predict the axial capacity of CFRP-strengthened concrete columns for previously unseen data.
Because the input variables have different numerical scales, directly feeding them into the neural network may negatively affect learning. Although the model could eventually adapt to these variations, normalizing the data improves training efficiency and model stability. A common normalization technique is to scale the data to a range of 0.1 to 0.9. Accordingly, the normalized value of the ith element of a given column feature is expressed as x n o r m i .
x n o r m i = 0.8 r a n g e x × x i + 0.9 0.8 r a n g e x × M a x x
r a n g e x = M a x x M i n x
where x i represents the ith value of a given feature, while M a x x and M i n x denote the maximum and minimum values of that feature, respectively.
It should be emphasized that the normalization parameters used for the test dataset were determined solely from the training dataset. Preserving this separation is an essential practice in machine learning to avoid data leakage. This approach ensures that no information from the testing data influences the training stage of the model, even during simple preprocessing steps such as data normalization [32].

3. Optimization of Hyperparameters

3.1. k-Fold Cross-Validation

The performance of deep learning (DL) models is generally evaluated using datasets that were not used during training, commonly called test datasets. As previously mentioned, this step is relatively straightforward. However, designing an effective DL model requires careful selection of hyperparameters, which determine the neural network’s architecture and control its training. These parameters include the number of layers, the optimization algorithm, and the learning rate. Importantly, the dataset used to train the model should not be used directly for hyperparameter tuning, as this practice can lead to overfitting and reduce the model’s ability to perform well on new datasets [32].
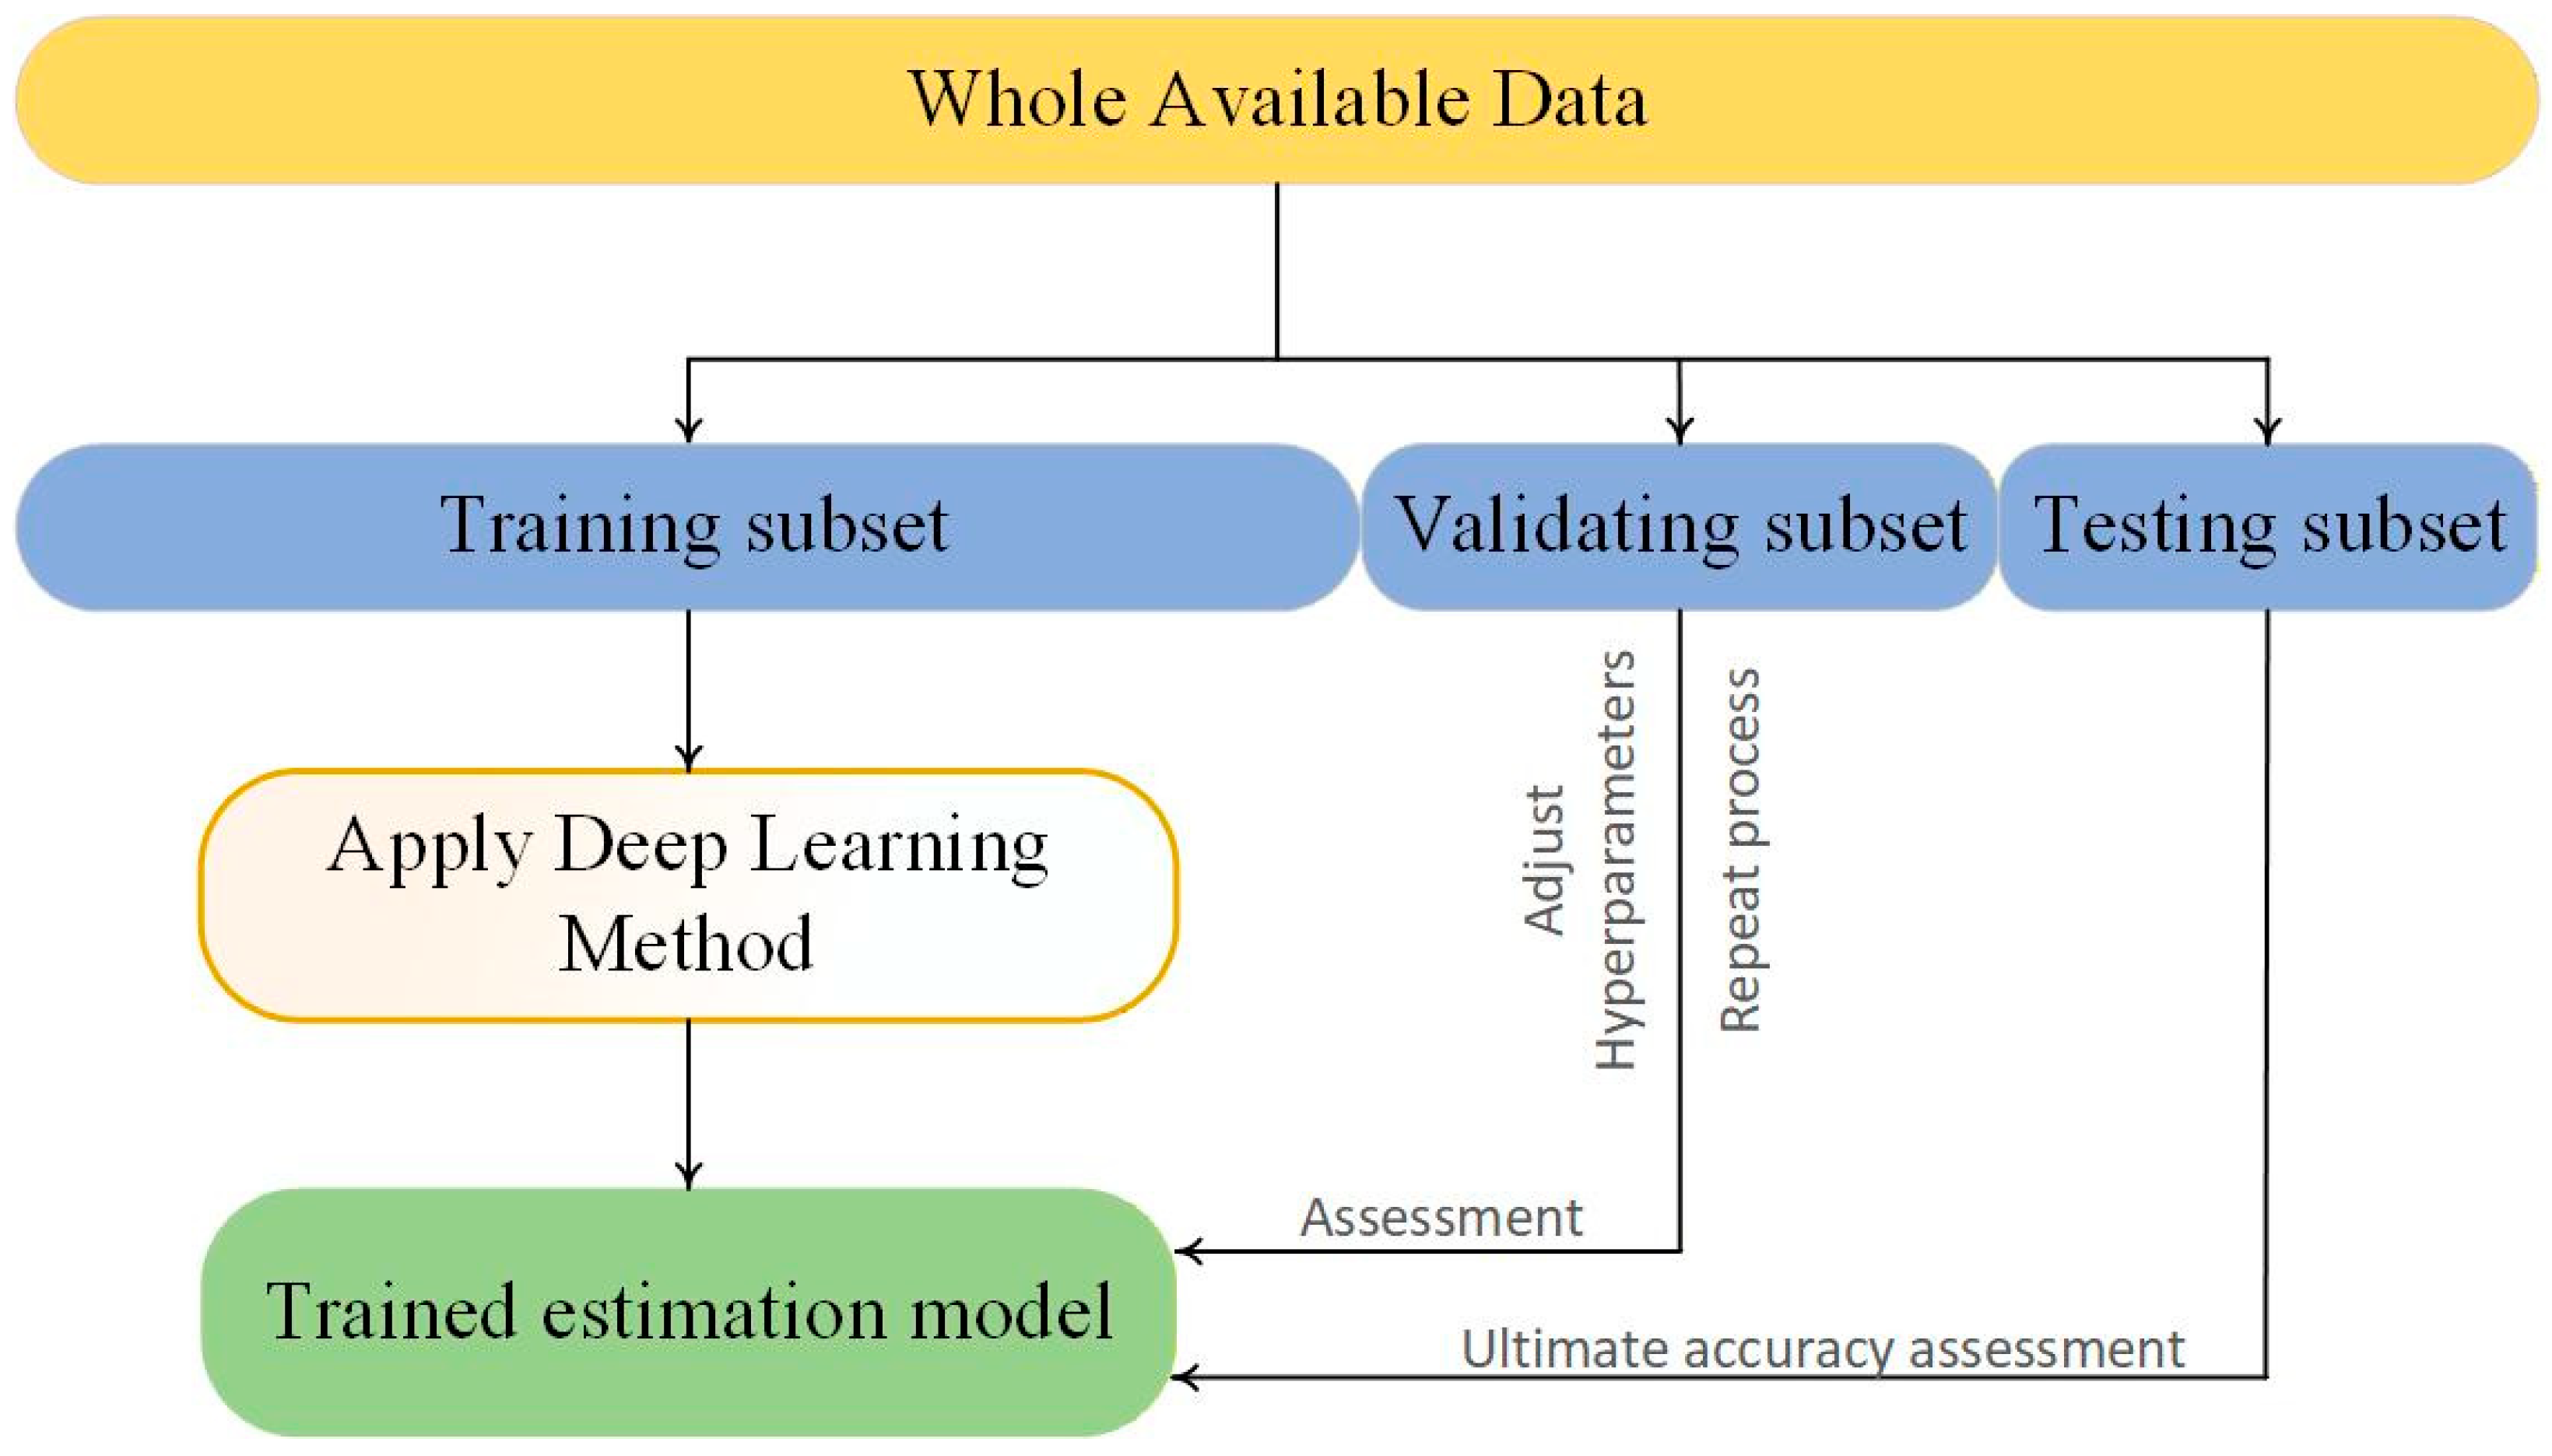
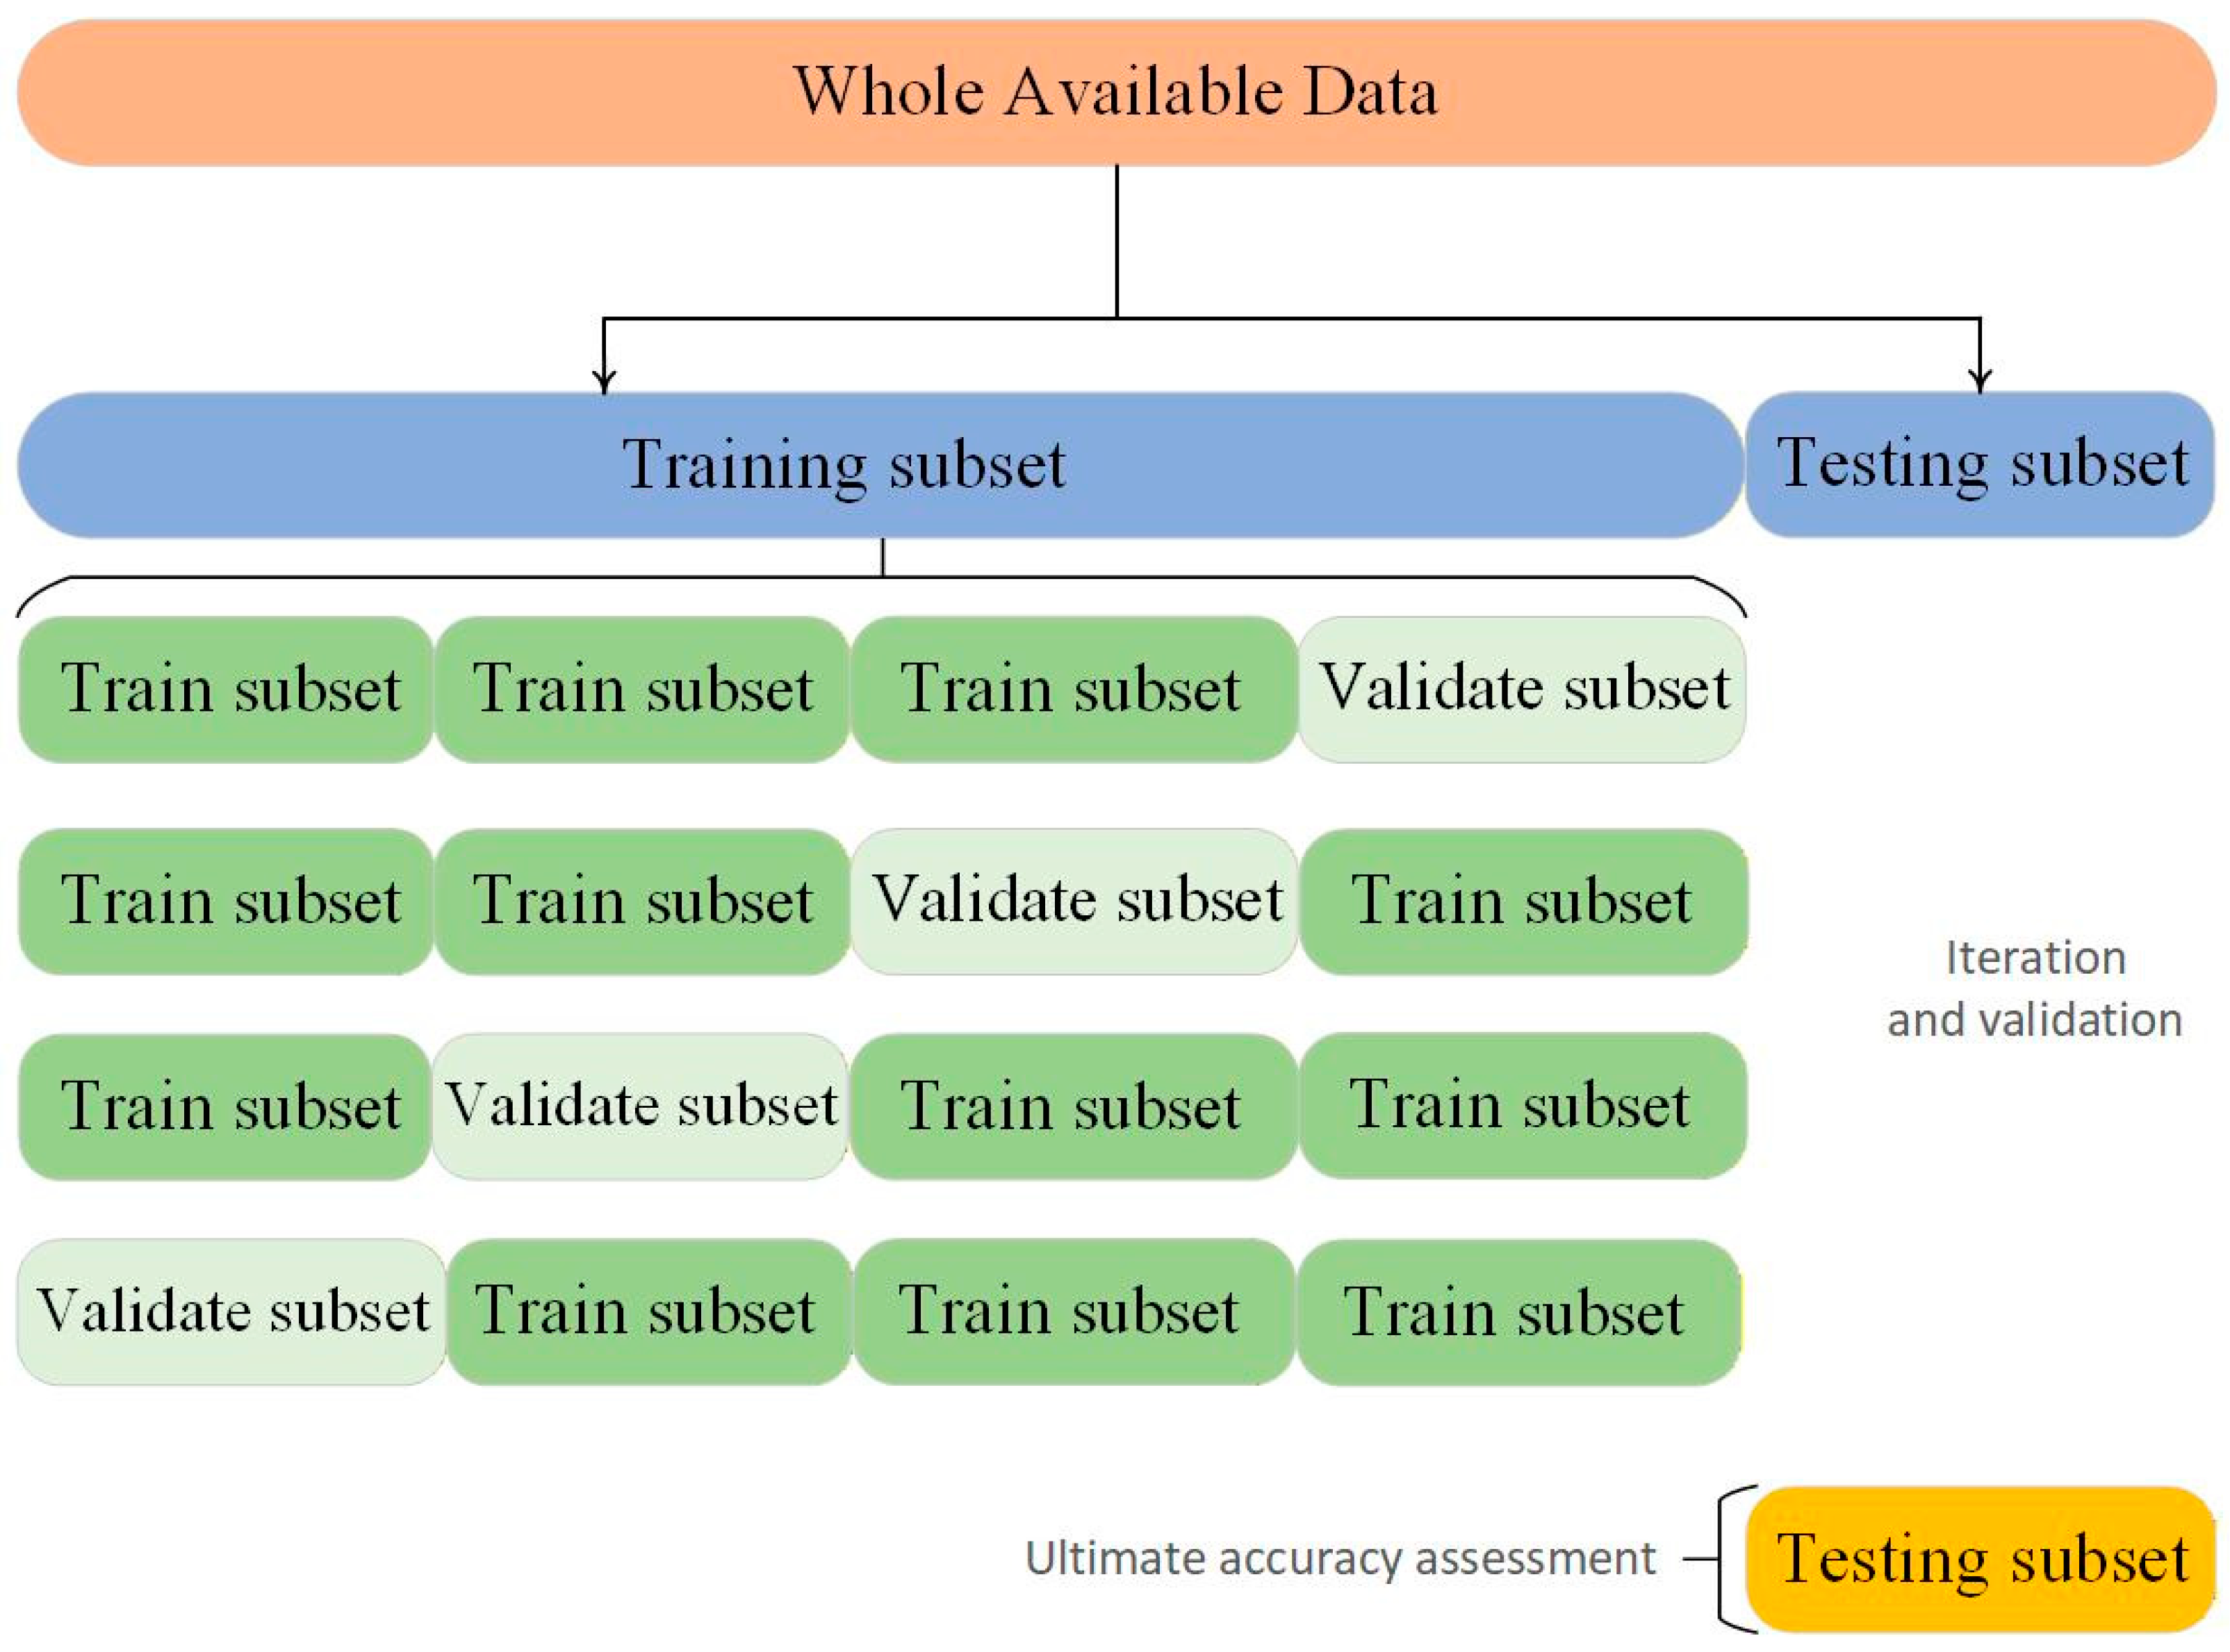
To address this issue, the holdout validation method is often employed [26]. In this approach, a portion of the original training dataset is set aside as a validation set. This subset is used to evaluate different hyperparameter combinations during model development. Several candidate models are trained on the remaining portion of the training data, each with different hyperparameter settings, and their performance is assessed on the validation dataset. The model configuration that achieves the best performance on the validation data is selected as the optimal one. The concept and structure of the holdout validation approach are illustrated in Figure 6.
An important question arises: why not simply divide the dataset into two parts—a training set for model development and a test set for performance evaluation? Although this strategy appears straightforward, it can introduce serious issues, particularly data leakage. Data leakage occurs when information from the validation process unintentionally influences the model during hyperparameter tuning [33]. When hyperparameters are repeatedly adjusted based on the same validation results, the model gradually becomes tailored to that dataset, reducing its ability to generalize to new data. To properly evaluate the model’s predictive capability, its performance must be tested using completely unseen data, referred to as the test dataset. This dataset must remain entirely independent and should not participate in any stage of model training or hyperparameter selection. If test data influence the model, it can no longer serve as an unbiased indicator of model performance. Nevertheless, some studies still rely on the test set for hyperparameter tuning, a practice widely recognized as inappropriate and harmful to the reliability of machine learning results [34].
Although the holdout validation method is simple and easy to implement, it has certain limitations. This issue becomes more pronounced when the available dataset is relatively small. For example, the dataset used in this study contains 469 experimental samples, and reserving a portion for validation results in a relatively small validation subset of about 94 samples (approximately one-fifth of the total data). A validation set of this size can lead to unstable performance estimates, as the calculated accuracy metrics may vary considerably depending on how the data is split between the training and validation sets. As a result, different random splits of the dataset may produce noticeably different validation results. This variability makes it difficult to obtain a consistent and reliable evaluation of the model’s predictive performance [32].
A commonly used solution to address this limitation is k-fold cross-validation. In this method, the original training dataset is divided into k equal subsets, known as folds. During each iteration, one fold is used as the validation set to evaluate the model, while the remaining k−1 folds are combined to form the training dataset. This process is repeated k times, with a different fold serving as the validation set in each iteration. After completing all runs, the validation results from the k iterations are averaged to obtain an overall estimate of the model’s predictive performance.
Although this procedure increases computational cost—since the model must be trained k separate times—it allows for more efficient use of the available data. Unlike the holdout validation approach, where a portion of the dataset is reserved solely for validation, k-fold cross-validation ensures that every observation is used for both training and validation at different stages. As a result, this method provides a more reliable and stable evaluation of model performance with reduced variability in the estimated accuracy [35]. The overall concept of the k-fold cross-validation process is illustrated in Figure 7.

3.2. Optuna

Hyperparameters are predefined settings that control how a machine learning (ML) algorithm operates during training. These settings influence factors such as the model’s learning speed and the algorithm’s overall complexity. Because of their strong influence on model performance, selecting appropriate hyperparameter values is a critical step in ML model development. Unlike model parameters—such as weights and biases in neural networks—which are learned automatically from the data during training, hyperparameters are determined before training begins and remain fixed throughout the learning process. Therefore, hyperparameters are associated with the learning strategy rather than with the model parameters themselves.
Identifying suitable hyperparameter values is essential for obtaining reliable predictive performance. If this step is not carefully addressed, the resulting model may perform poorly. Since hyperparameters cannot be directly estimated from the training data, they must be selected and optimized through external procedures. Traditionally, this process has been performed manually by practitioners. Without clear guidelines, the initial choice of hyperparameters is often based on intuition or trial and error, which can lead to suboptimal configurations [36]. Consequently, model developers typically need to repeatedly adjust the hyperparameters and retrain the model until a combination is found that produces satisfactory performance on the validation dataset.
Deep learning (DL) models typically involve many hyperparameters, including the learning rate, activation function, loss function, number of hidden layers, number of neurons per layer, dropout rate, optimization algorithm, and batch size, among others. Adjusting such a wide range of parameters manually can be extremely time-consuming and computationally demanding. The process becomes even more challenging when evaluation methods such as k-fold cross-validation are used, since the model must be trained repeatedly under different configurations. For this reason, automated approaches for hyperparameter tuning have become increasingly important, as they offer a more efficient and systematic way to identify suitable parameter combinations [36].
Among the available tools for automated hyperparameter optimization, Optuna has gained considerable attention. Optuna is a modern Python-based framework designed to simplify and accelerate hyperparameter search in machine learning applications. The platform enables users to identify optimal hyperparameter configurations by efficiently exploring the search space to optimize a defined objective. In addition, Optuna is compatible with many widely used Python libraries, such as Scikit-learn and PyTorch, which makes it highly practical for machine learning workflows. The functionality of Optuna is mainly based on three key components [35,36].
Define-by-run interface: This feature enables the flexible and dynamic construction of hyperparameter search spaces. In Optuna, hyperparameter tuning is performed by optimizing an objective function, which can be minimized or maximized depending on the selected performance metric. The overall optimization process is referred to as a study, while each evaluation of the objective function is called a trial. During execution of the objective function, Optuna uses the trial instance to progressively build the search space. In other words, the hyperparameter space is defined dynamically as the program runs rather than being fixed beforehand. Users typically employ Optuna’s suggest API, which proposes hyperparameter values based on the results of previous trials. This mechanism makes the search process more efficient over time. In addition, hyperparameters can be easily specified using standard Python syntax, which provides users with a high degree of flexibility when defining the search space.
Sampling and pruning strategies: The efficiency of hyperparameter optimization largely depends on effective methods for exploring candidate hyperparameter values and evaluating their performance. The exploration stage focuses on selecting promising hyperparameter combinations, while the evaluation stage measures their effectiveness and eliminates weak candidates through a technique known as pruning. By combining efficient sampling with early termination of poor-performing trials, the optimization process becomes significantly faster and more computationally efficient. Two main sampling strategies are commonly used: independent sampling, where each hyperparameter is selected independently, and relational sampling, which accounts for possible parameter dependencies. Optuna supports both approaches, allowing users to customize the sampling strategy according to the specific requirements of the problem. In addition, pruning plays a key role in reducing unnecessary computational effort by stopping trials that show little potential for improvement. This mechanism relies on the report API to monitor intermediate results during training and the should_prune API to terminate trials that are unlikely to achieve satisfactory performance.
Flexible and user-friendly configuration: Modern optimization frameworks require an architecture that is both adaptable and easy to configure. Such platforms should support a wide range of applications, from large-scale computational experiments that involve multiple parallel processes to smaller analyses conducted in interactive environments such as Jupyter Notebook. In Optuna, the history of objective function evaluations is recorded in trial objects, where each trial’s results are stored. By default, these records are maintained using an internal in-memory storage system. However, users can modify or extend the storage backend to meet specific project requirements [37]. In addition, the framework allows results to be conveniently exported for further analysis, for example, by converting them into Pandas DataFrames [38]. Optuna also includes a web-based dashboard that enables real-time visualization and detailed examination of optimization results. As an open-source tool, the platform can be easily installed through a simple command, making it readily accessible and practical for researchers and practitioners.
Optuna was integrated with k-fold cross-validation to improve the deep learning (DL) framework by systematically optimizing several important hyperparameters. These parameters included the number of neurons in each hidden layer, the total number of hidden layers, activation functions, batch size, optimization algorithm, and learning rate. In this study, a 10-fold cross-validation scheme was implemented in accordance with commonly recommended practices for model validation [35]. The neural network was designed using a scalar regression architecture, with an output layer consisting of a single neuron without an activation function. This configuration is appropriate for predicting a single continuous numerical value, namely the axial capacity of CFRP-strengthened concrete columns. For the training process, the mean squared error (MSE) was selected as the loss function, as it quantifies squared differences between predicted and actual values and is widely used in regression-based predictive models.
To improve the model’s overall performance and stability, additional techniques such as dropout and batch normalization were incorporated. Batch normalization was applied after the activation function in each hidden layer to stabilize the distribution of layer outputs, keeping their means close to zero and their variances close to 1. This normalization process helps reduce training instabilities, including problems related to exploding or vanishing gradients that may occur when abnormal values propagate through earlier layers [35]. Furthermore, batch normalization enables each layer to learn more independently, improving training efficiency and allowing the use of higher learning rates during optimization.
To further limit overfitting, a dropout technique with a probability of 10% was used during training. In this approach, a portion of neurons is randomly deactivated in each training iteration. This random omission reduces the network’s sensitivity to small variations in the input data and prevents individual neurons from exerting excessive influence on the overall learning process. As a result, the combination of dropout and normalization techniques yields a more stable and generalized model that produces reliable, accurate predictions.
Optuna performed the hyperparameter search across 100 independent trials, with each trial trained for 1000 epochs per cross-validation fold. The best-performing configuration was selected by comparing the average validation performance across folds. In this study, the mean squared error (MSE) was adopted as the evaluation metric, defined as follows:
M S E = 1 n i = 1 n y i y ^ 2
where y ^ i represents the predicted value for the i-th sample, and y i denotes the experimental value. The M S E values were computed for each fold and then averaged across the ten models generated in each trial.
The hyperparameter optimization process described above was carried out using the Optuna framework in combination with 10-fold cross-validation. A total of 100 trials were conducted, and the optimal hyperparameter configuration was selected based on the minimum average validation MSE across all folds. The hyperparameter configuration corresponding to the best-performing trial, identified by the lowest average validation MSE across all cross-validation folds, is presented in Table 3.
To ensure a clear and reproducible modeling workflow, the dataset was first randomly divided into training (80%) and testing (20%) subsets using a fixed random seed. The testing subset was kept completely independent and was not used during model development. The 10-fold cross-validation procedure was applied exclusively within the training subset for hyperparameter optimization and model selection using the Optuna framework. In each trial, the training data were further partitioned into ten folds, where nine folds were used for training and one fold for validation, and this process was repeated until all folds were used for validation. The average validation performance across all folds was used to identify the optimal hyperparameter configuration. After selecting the best-performing model, it was retrained on the full training dataset and evaluated once on the unseen test dataset to obtain the final performance metrics.
The final model architecture consists of four hidden layers with 24, 18, 24, and 24 neurons, respectively, using the tansig activation function, and a single linear output neuron for regression. The network weights were initialized using standard random initialization methods. The model was trained using the RMSprop optimizer with a learning rate of 0.0051 and a batch size of 54. A maximum of 1000 training epochs was specified; however, convergence was typically achieved earlier based on validation performance trends.
The Optuna optimization framework can be better understood by comparing it with other widely used hyperparameter tuning techniques. Conventional approaches, such as grid search and random search, are commonly applied in machine learning studies because they are simple to implement and easy to understand. However, as the number of hyperparameters grows, these methods can become computationally demanding and inefficient.
To address these limitations, more advanced Bayesian optimization techniques have been developed to improve the efficiency of the search process. Table 4 compares several widely used hyperparameter optimization methods, including grid search, random search, Bayesian optimization, and the Optuna framework used in this study. The comparison outlines their main characteristics, strengths, and limitations. In contrast to traditional approaches, Optuna achieves greater efficiency through its adaptive sampling and pruning strategies, which enable the framework to stop poorly performing trials early. This capability significantly reduces computational cost while still achieving high-quality hyperparameter optimization.

4. Model Development, Validation, and Assessment

After identifying the optimal set of hyperparameters, the DNN model was built with these selected configurations and trained on the complete training dataset. Once the training phase was complete, the model’s predictive performance was evaluated on the independent test dataset.
To assess the performance of the developed model, several statistical indicators were computed, including the mean absolute percentage error ( M A P E ), root mean squared error ( R M S E ), mean absolute error ( M A E ), and the coefficient of determination ( R 2 ). These metrics were calculated for both the training and testing datasets to provide a comprehensive evaluation of the model’s accuracy. The mathematical expressions for these performance measures are presented in Equations (4)–(7). A reliable predictive model is generally characterized by lower error values ( M A P E , R M S E , and M A E ) and an R 2 value close to 1, indicating strong agreement between the predicted and observed values and reflecting improved prediction accuracy.
R 2 = 1 i = 1 n y i y ^ i 2 i = 1 n y i y ¯ 2
M A E = i = 1 n y i y ^ i n
R M S E = i = 1 n y i y ^ i 2 n
M A P E = 1 n i = 1 n y i y ^ i y i × 100
In these statistical measures, n represents the total number of experimental samples. At the same time, yi and y ^ i denote the experimental value and the corresponding model-predicted value for the i-th data point, respectively. The symbol y ¯ denotes the mean values of the experimental values. In addition to these commonly used performance metrics, this study also employs the a 20 - i n d e x as an additional indicator to evaluate the predictive capability of the developed model [41].
a 20 - i n d e x = 1 n i = 1 n 1 , i f   y ^ i y i y i 0.20 0 , o t h e r w i s e
The a20-index represents the proportion of model predictions that fall within ±20% of the corresponding experimental values. This metric provides a simple, intuitive way to evaluate prediction accuracy by indicating how often the model produces results close to the observed data. Because of its clarity and ease of interpretation, the a a 20 - i n d e x is often used as a complementary indicator alongside conventional statistical measures when assessing the performance of predictive models [42].
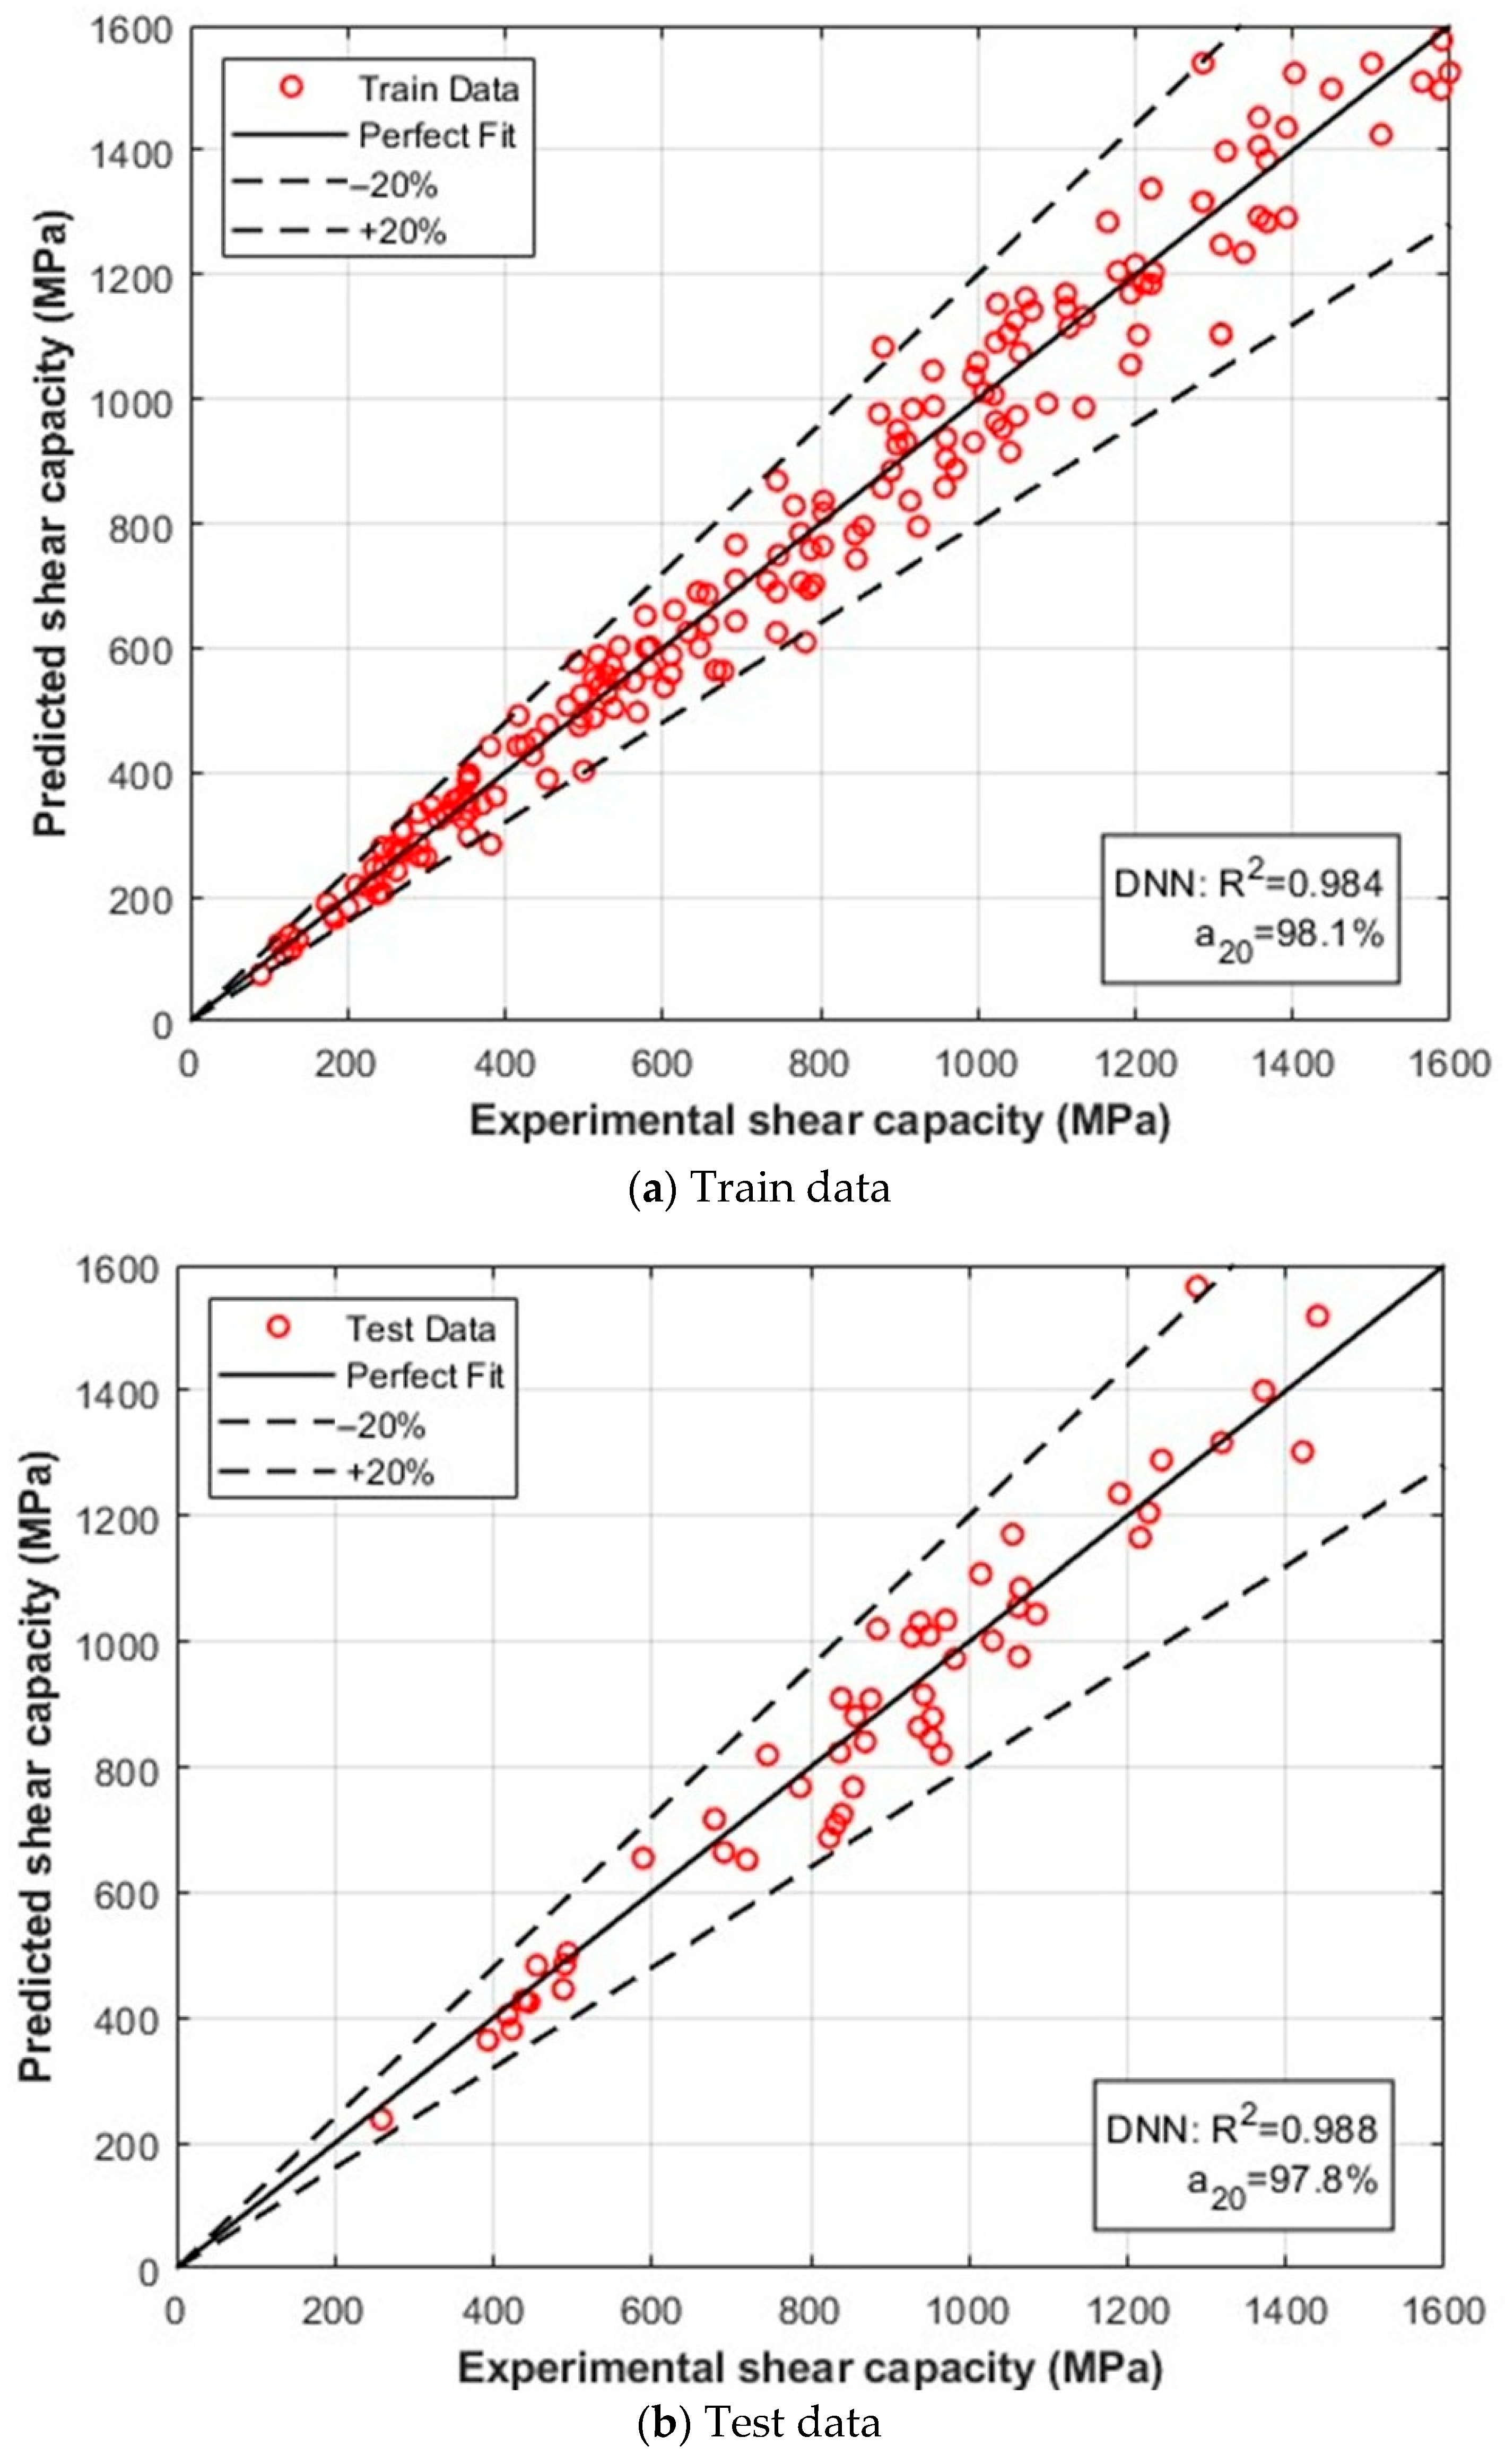
Figure 8 and Table 5 present the evaluation results of the developed DNN model for predicting the axial capacity of CFRP-strengthened concrete columns. These results compare model predictions with experimental observations for both the training and test datasets. As illustrated in Figure 8a,b, the predicted values agree well with the experimental results, with only minor deviations. Furthermore, the calculated statistical indicators confirm the model’s reliability, indicating that the prediction accuracy on the test dataset is very similar to that during training. This consistency demonstrates the robustness of the proposed model and highlights its ability to accurately estimate the axial capacity of CFRP-strengthened concrete columns.
Overfitting is a common challenge in data-driven modeling. It occurs when a model fits the training data very closely but fails to produce reliable predictions when applied to new, unseen data [43]. Another important step in verifying model reliability is evaluating its performance on data not used during training. Such comparisons help confirm the model’s ability to generalize beyond the training dataset. The performance indicators reported in Table 5 and Figure 8 show very similar results for both the training and testing datasets. This consistency suggests that the proposed DNN model for CFRP-strengthened concrete columns maintains stable predictive accuracy and does not overfit, demonstrating strong robustness across different data conditions.
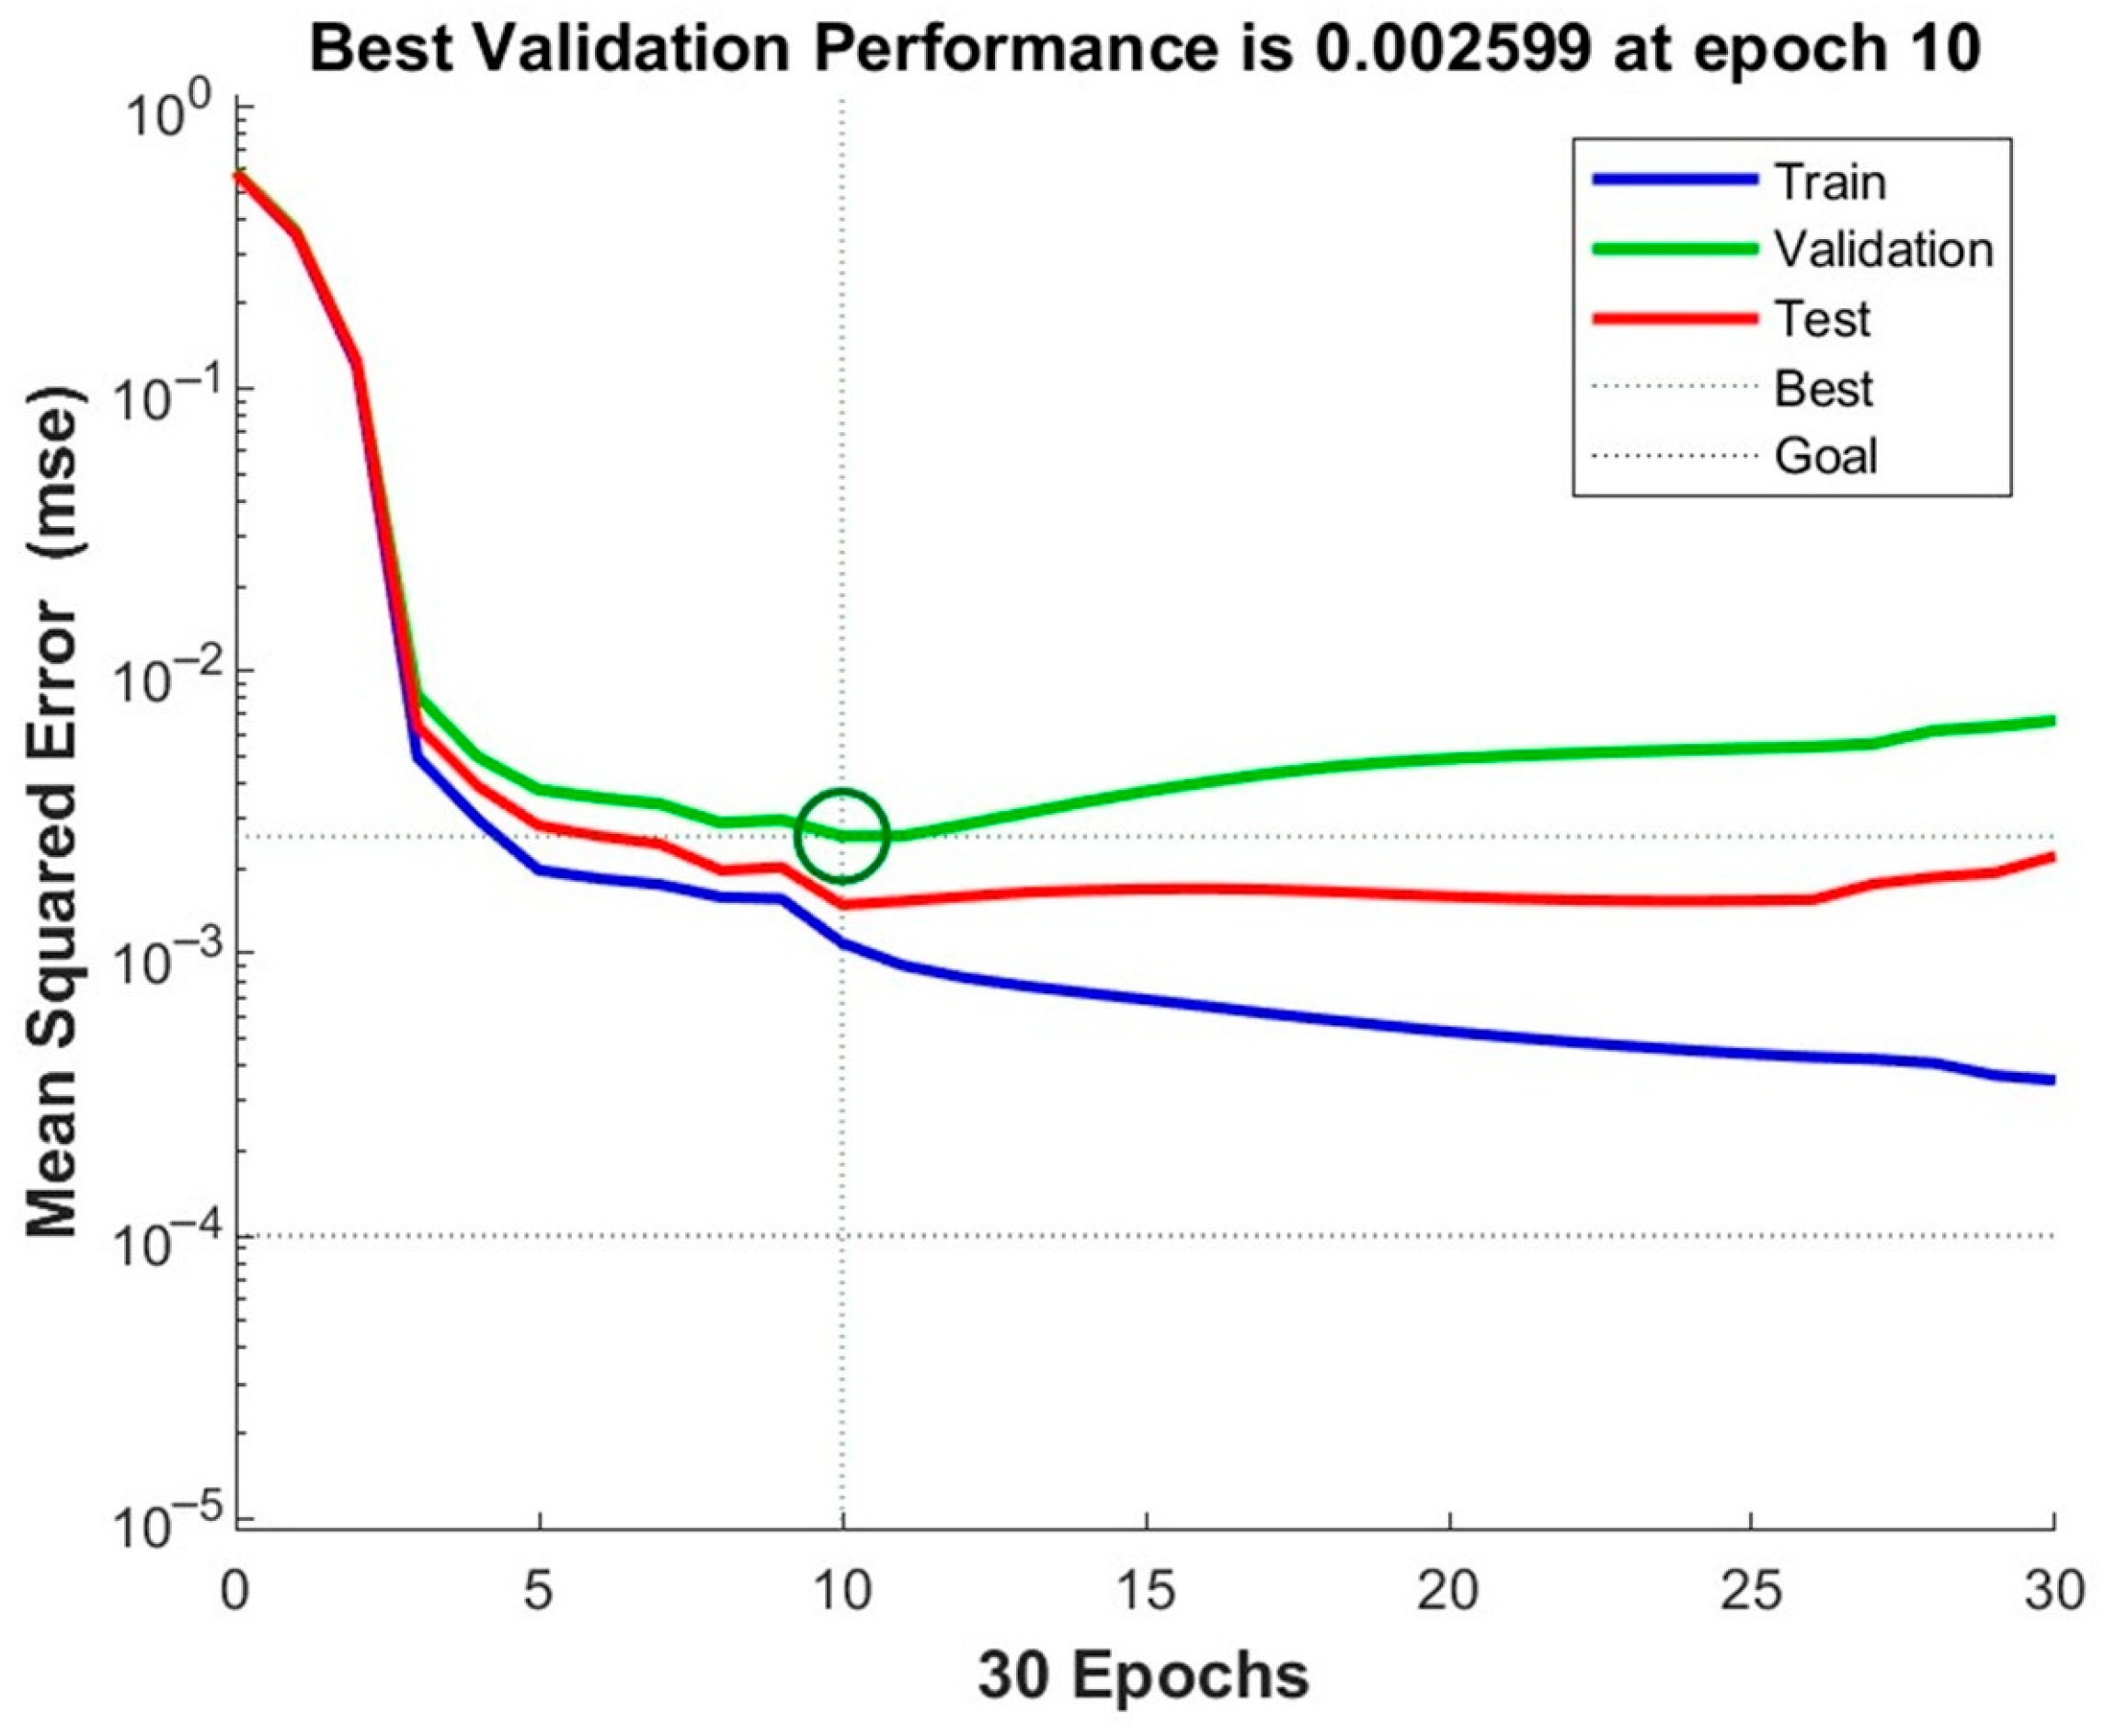
Furthermore, to evaluate the convergence behavior and stability of the proposed DNN model, the evolution of the mean squared error (MSE) for the training, validation, and test datasets over epochs is presented in Figure 9. The results show a rapid reduction in error during the initial training stages, followed by gradual convergence. The best validation performance is achieved at epoch 10, after which the validation error remains relatively stable. The training error continues to decrease smoothly, while the validation and test errors follow a consistent trend without significant divergence. This behavior indicates that the model achieves good generalization performance and that overfitting is effectively controlled.

5. Axial Capacity Estimation Using Design Codes

To provide a reference for evaluating the performance of the proposed deep neural network (DNN) model, the axial capacity of CFRP-strengthened reinforced concrete columns was also calculated using established design provisions from international codes, specifically ACI 440.2R-17 and CSA S806-12. These code-based formulations provide simplified analytical approaches for estimating the axial load-carrying capacity of FRP-strengthened or FRP-reinforced concrete members using commonly available material and geometric parameters.

5.1. ACI 440.2R-17

The ACI 440.2R-17 guideline accounts for the confinement effect provided by the FRP jacket, which increases the compressive strength of concrete from the unconfined strength f c to a confined compressive strength f c c [44].
Confined concrete strength:
f c c = f c + ψ f   3.3 k a f l
f l = 2 E f n t f ε f e D
where f c is the specified compressive strength of concrete, ψ f is the environmental reduction factor for the FRP system, k a is the confinement efficiency factor depending on the cross-section geometry, f l represents the effective lateral confinement pressure provided by the FRP jacket, E f is the tensile modulus of FRP, n is the number of plies, t f is the nominal thickness of one ply, ε f e represents the effective strain in FRP, and D is the diameter of the column cross-section [44].
Nominal axial load capacity:
P n = 0.85   f c c A g + A s t + f y A s t
where A g is the gross cross-sectional area of the column, A s t is the total area of longitudinal steel reinforcement, and f y is the yield strength of the steel reinforcement.
Factored axial capacity [44]:
φ P n = φ 0.85   f c c A g + A s t + f y A s t
where φ is the strength reduction factor, taken as 0.65 for tied columns and 0.75 for spirally reinforced columns.

5.2. CSA S806-12

The CSA S806-12 standard provides a formulation for estimating the axial capacity of FRP-reinforced concrete columns. For a short column subjected to concentric axial loading, the nominal axial capacity is calculated as [45]:
P n = 0.85   f c A g + A f + 0.35   f f u A f
where A g is the gross cross-sectional area of the column, A f is the area of longitudinal FRP reinforcement, f c is the concrete compressive strength, and f f u is the ultimate tensile strength of the FRP [45].
Design axial capacity:
P r = φ P n
where the strength reduction factor φ is taken as 0.65. This equation is mainly applicable to short columns subjected to concentric compression. For slender columns, CSA S806 requires either an additional stability or a moment magnification analysis.
The performance of the proposed DNN model was evaluated using multiple statistical indicators, including the coefficient of determination ( R 2 ), root mean square error ( R M S E ), mean absolute error ( M A E ), mean absolute percentage error ( M A P E ), and the a20-index. The combination of these metrics provides a comprehensive assessment of model accuracy, error distribution, and prediction reliability. The results indicate that the model achieves high predictive accuracy with low error values and strong agreement with experimental data. In particular, the high a 20 - i n d e x value confirms that a large proportion of predictions fall within an acceptable error range, demonstrating the robustness and consistency of the model.
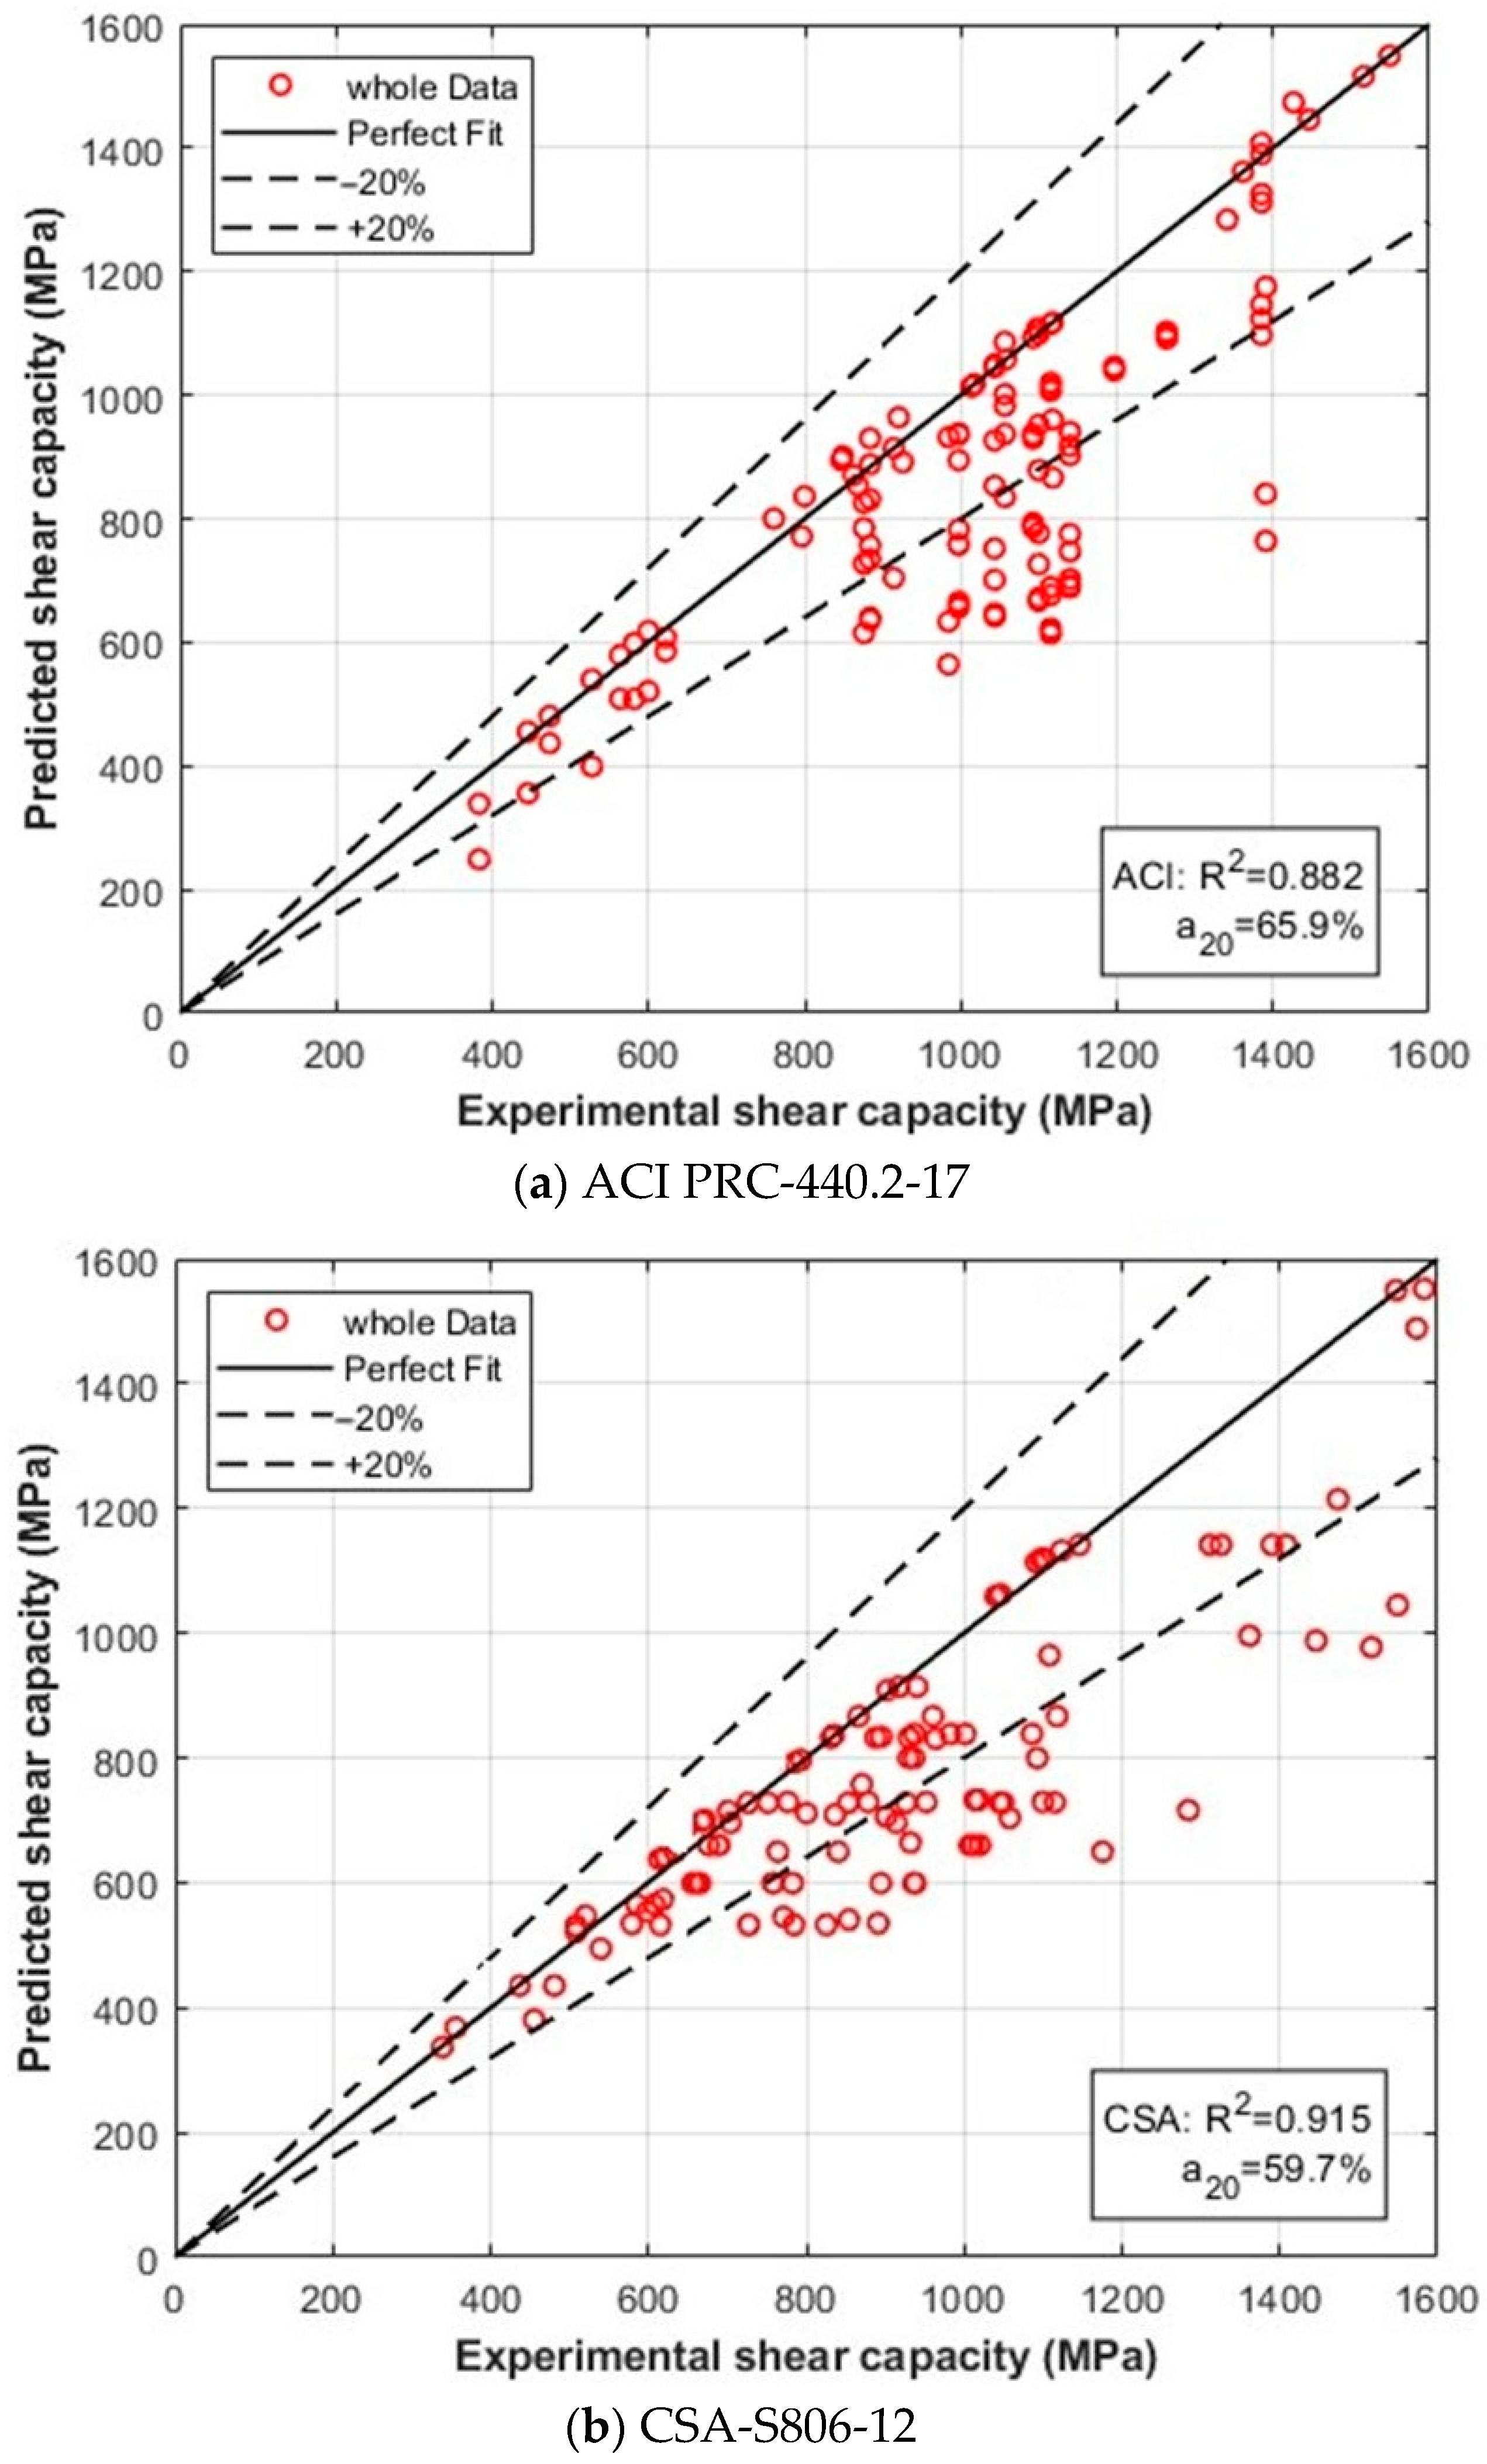
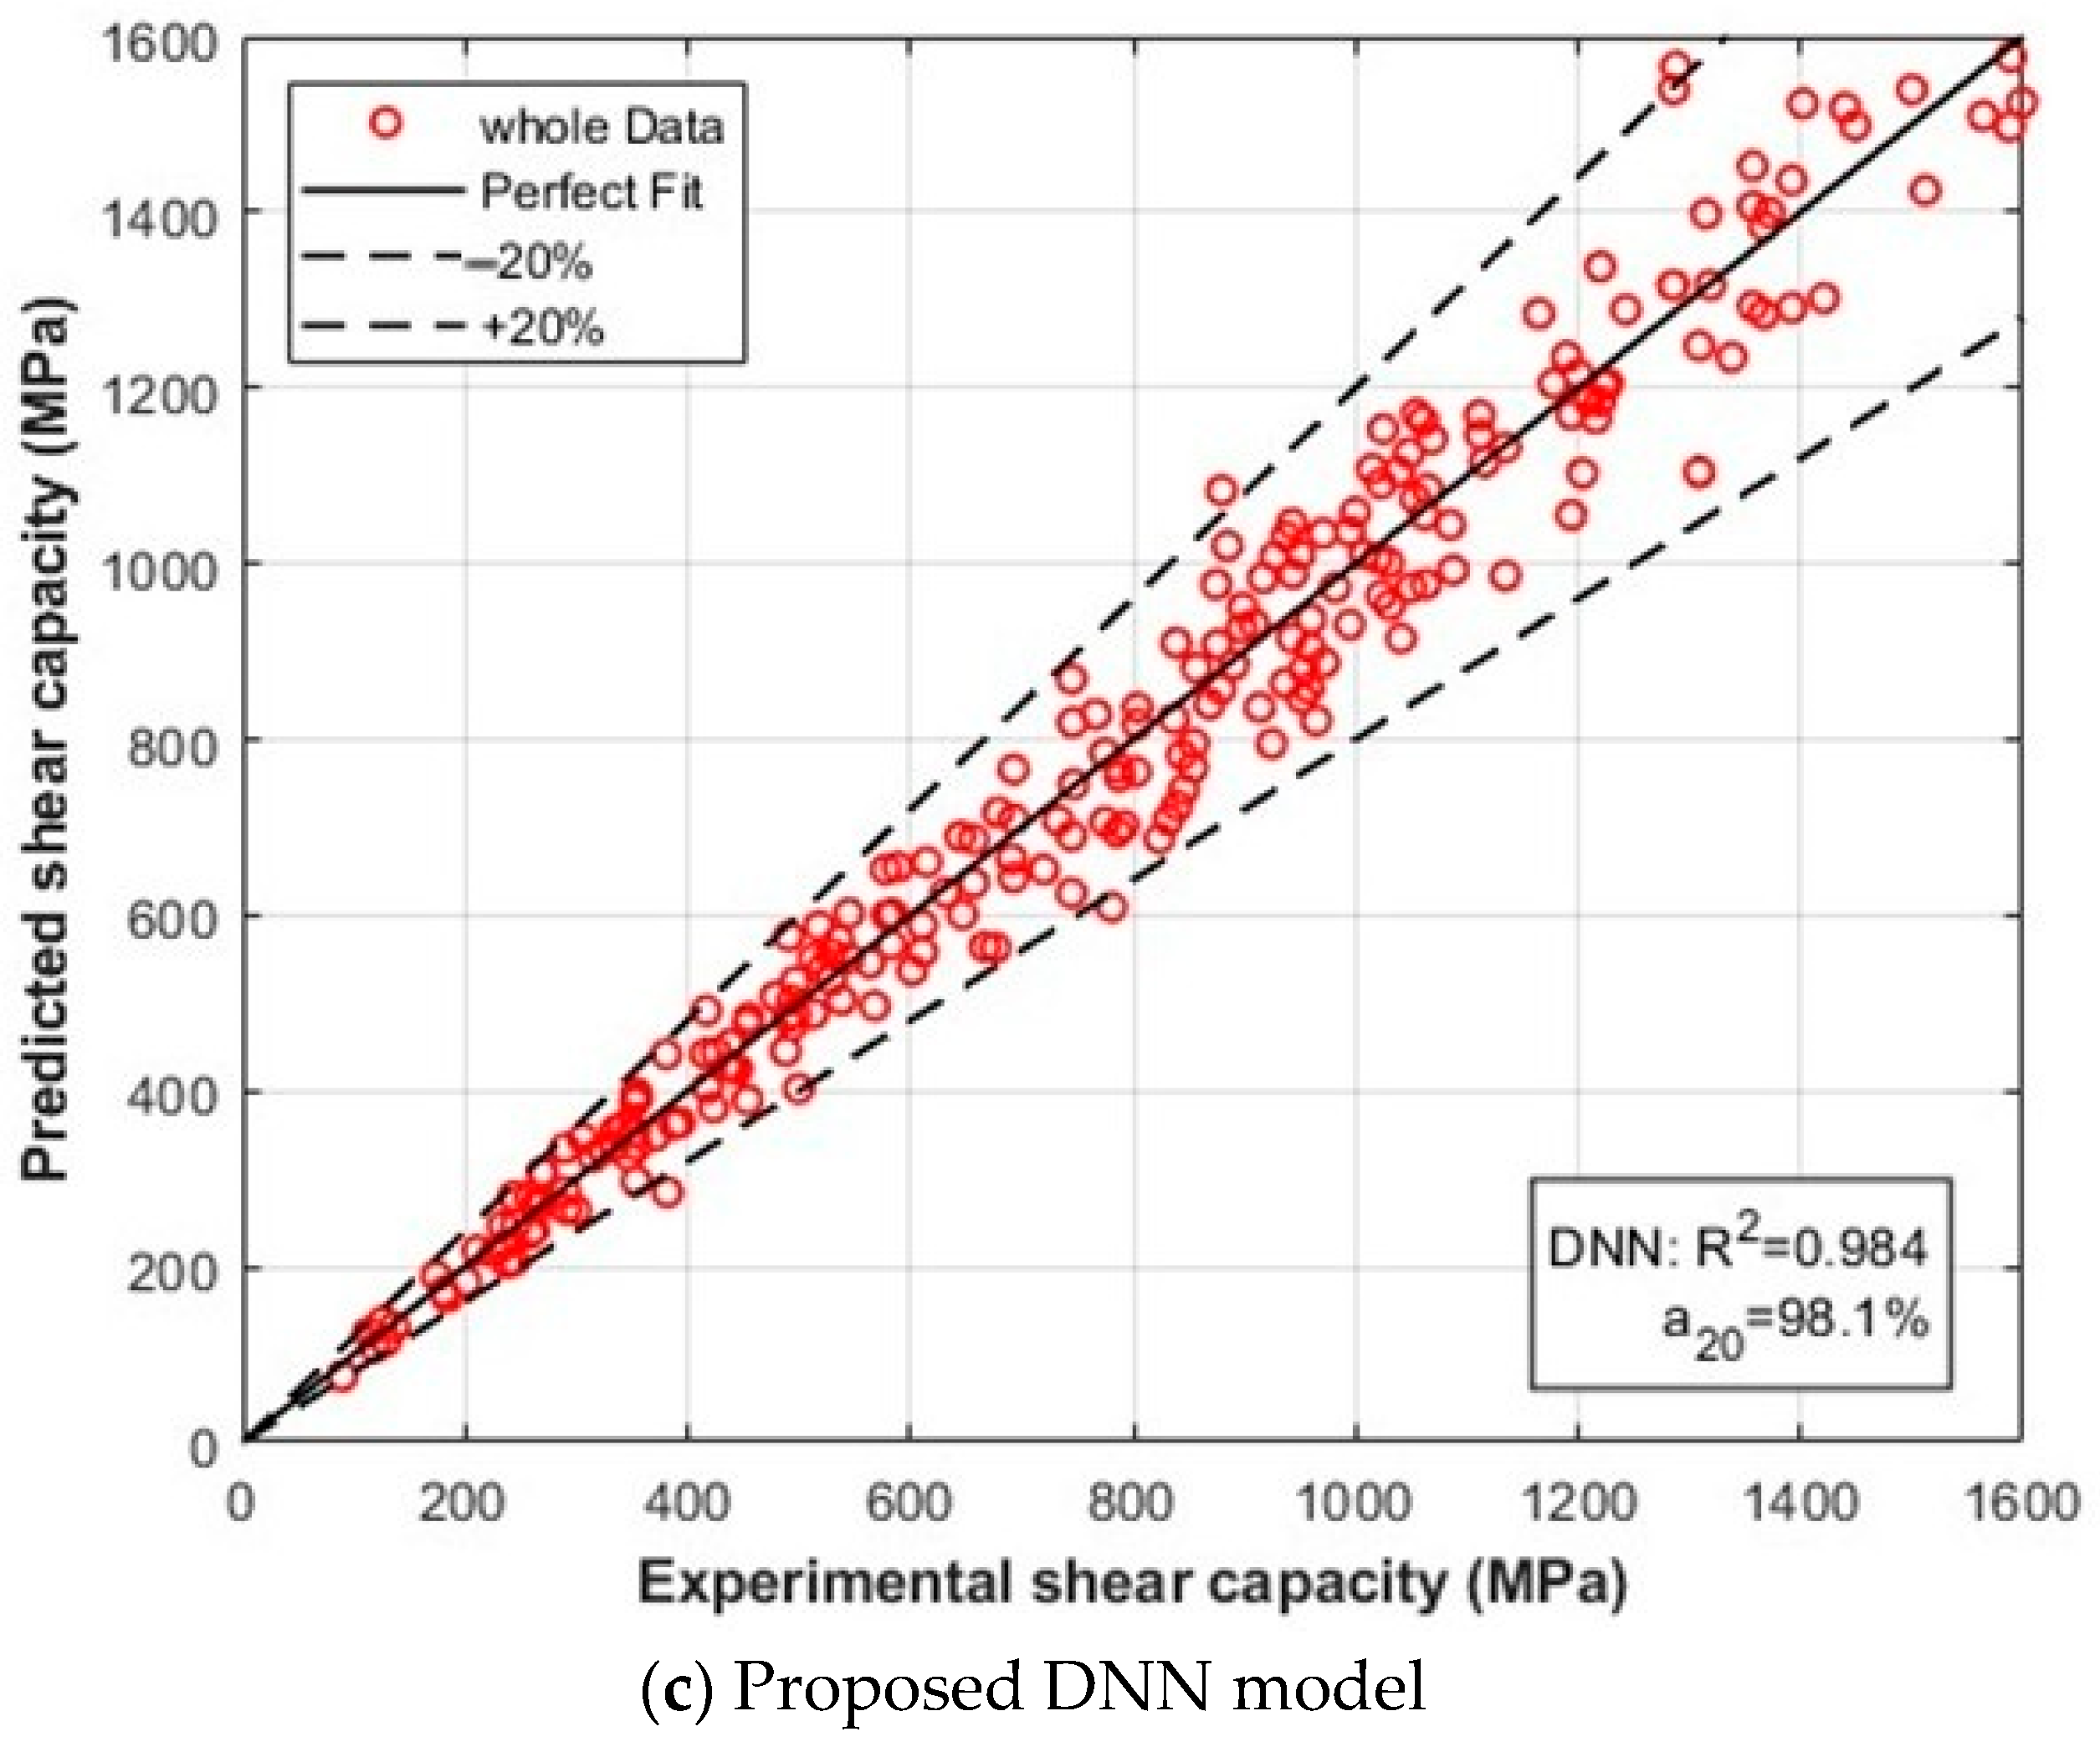
Table 6 presents a comparative analysis between the developed DNN model and the design code provisions using the entire dataset. The results show that the proposed DNN achieves significantly lower M A E , R M S E , and M A P E values, while yielding higher R2 and a 20 - i n d e x scores compared to the most effective design codes. In contrast, the code-based models exhibit larger prediction errors and less favorable accuracy indicators. These findings highlight the superior predictive capability of the proposed DNN model in estimating the axial capacity of CFRP-strengthened concrete columns. This trend is further illustrated in Figure 10, where the DNN predictions show closer agreement with experimental results compared to the design code approaches.
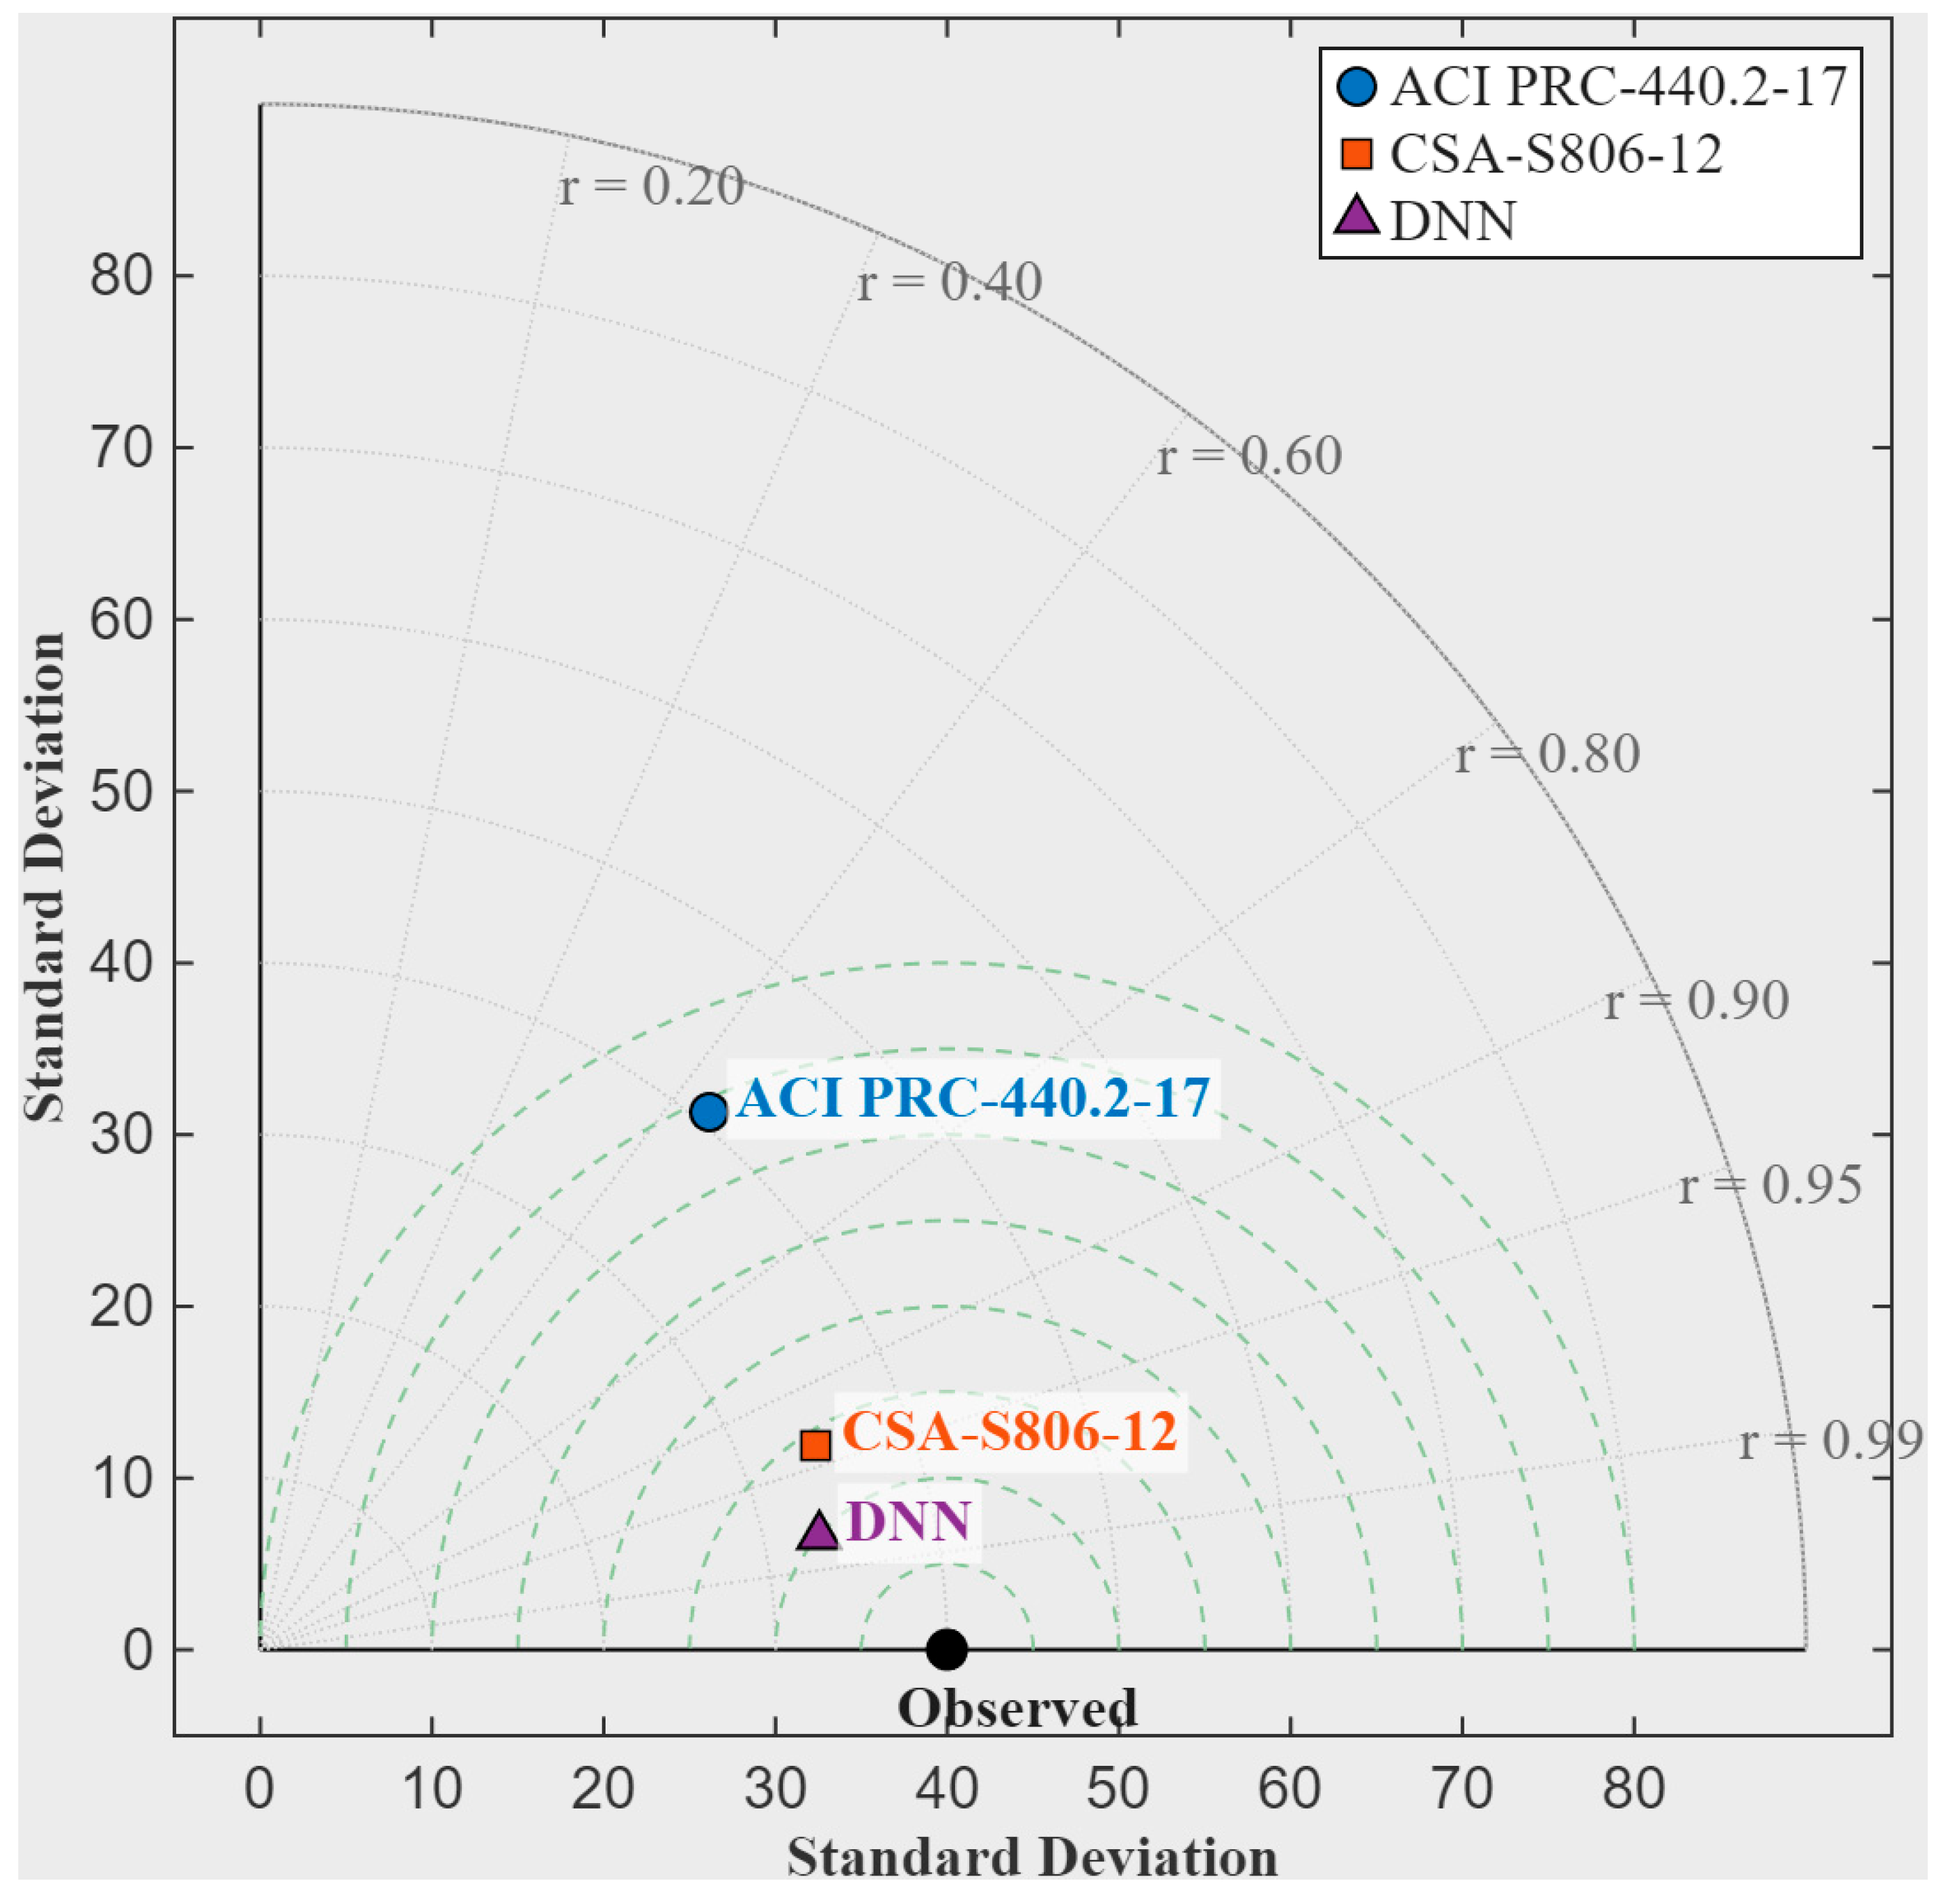
Figure 11 presents a Taylor diagram comparing the predictive performance of different models for the axial capacity of CFRP-strengthened reinforced concrete columns against the experimental dataset. The diagram simultaneously illustrates three statistical indicators: the standard deviation, the correlation coefficient ( r ), and the root-mean-square error ( R M S E ) between the predicted and experimental axial capacities. In the diagram, the radial distance from the origin represents the standard deviation, the angular position corresponds to the correlation coefficient, and the concentric dashed arcs indicate the R M S E relative to the observed data. The reference point labeled “Observed” represents the standard deviation of the experimental axial capacity values. Three prediction approaches are evaluated in the diagram: ACI PRC-440.2-17, CSA-S806-12, and the proposed Deep Neural Network (DNN) model. Among the compared methods, the DNN model is located closest to the reference point, indicating the lowest RMSE, a standard deviation close to the experimental value, and the highest correlation coefficient, demonstrating the best predictive performance for the axial capacity of CFRP-strengthened columns. The ACI PRC-440.2-17 model shows the largest standard deviation among the compared methods, indicating greater dispersion between the predicted and experimental values. Although its correlation with the experimental results is moderate, the greater variability leads to a higher R M S E than the DNN model. The CSA-S806-12 model shows smaller dispersion than ACI but still deviates from the observed point, with lower correlation and higher prediction error than the DNN model. Overall, the Taylor diagram confirms that the deep learning-based DNN model provides the best agreement with the experimental axial capacity results, outperforming the existing design code formulations in terms of correlation, standard deviation, and RMSE.
The performance of the proposed DNN model was compared with widely used design provisions, including ACI 440.2R-17 and CSA S806, which are commonly adopted in engineering practice for estimating the axial capacity of FRP-confined columns. While these code-based approaches provide simplified and conservative estimates, they are limited in their ability to capture the complex nonlinear interactions among governing parameters. In contrast, the proposed DNN model demonstrates significantly improved prediction accuracy, as evidenced by higher R 2 values and lower error metrics. This improvement highlights the capability of data-driven models to better represent the underlying structural behavior and provides a more reliable tool for practical prediction of axial capacity. Although the proposed model is developed using a data-driven approach, its predictions are consistent with established structural mechanics principles. The correlation analysis and parametric study confirm the expected influence of key variables, such as the increase in axial capacity with higher concrete strength and enhanced confinement provided by CFRP properties. In addition, the confinement mechanism associated with CFRP wrapping, including both continuous and partial configurations, provides a physical explanation for the observed behavior. The agreement between the model predictions and existing design provisions further supports the reliability and physical consistency of the proposed approach.

6. Model Scope and Future Work

As discussed earlier, the quality and coverage of the dataset play a critical role in developing reliable deep learning (DL) prediction models, as they directly influence the accuracy and applicability of the results. In particular, the dataset defines the range of input parameters within which the proposed model can produce reliable predictions. Therefore, from a practical design perspective, the DNN model developed in this study should be applied only within the parameter ranges presented in Table 2. Application of the model outside these ranges may lead to unreliable or non-conservative predictions, as it has not been trained on such conditions. Although the dataset is compiled from validated experimental studies, it may not fully represent all field conditions, including variations in material properties, construction practices, and loading scenarios encountered in design offices. Consequently, the proposed model should be used as a complementary tool alongside established design codes and sound engineering judgment, particularly when applied to conditions near or beyond the limits of the available data.
In addition to predictive accuracy, understanding the influence of input variables is essential for practical application. The correlation analysis and parametric study presented in this work provide insight into the relative importance of key parameters affecting axial capacity, such as concrete strength, confinement characteristics, and geometric properties. These analyses help interpret the model behavior and ensure consistency with known structural mechanics principles. From a practical standpoint, the proposed model can be used as a rapid assessment tool for estimating axial capacity and as a complementary method alongside established design codes. Its implementation in spreadsheet-based or programming environments can further facilitate its integration into engineering design workflows.
To further improve the model’s reliability and broaden its applicability, future research should expand the available dataset. This could include incorporating additional experimental data or generating synthetic data, especially for parameter ranges currently underrepresented. For example, as illustrated in the parameter distributions shown in Figure 4, certain ranges contain limited experimental data. Increasing the number of observations in such regions would help enhance the robustness and generalization capability of the deep learning model.
Although the developed DNN model provides highly accurate predictions of the axial capacity of CFRP-strengthened concrete columns, converting data-driven models into simplified design-oriented equations remains an important direction for future research. The outcomes obtained from the proposed model may serve as a foundation for developing improved empirical design formulas or for calibrating existing design provisions using expanded experimental datasets. In addition, future investigations could extend the current framework to predict the complete axial stress–strain behavior of CFRP-strengthened concrete columns rather than focusing solely on the ultimate axial capacity. Such advancements would further strengthen the practical use of deep learning methods in structural engineering applications.
It should be noted that the reported results are based on a representative random train–test split combined with k-fold cross-validation for model selection. Although this approach provides a reliable estimate of model performance, further robustness assessment through repeated random splits or multiple independent runs could provide additional insight into variability and generalization and is recommended for future work.

7. Conclusions

This study demonstrated the effectiveness of deep learning techniques for predicting the axial capacity of CFRP-strengthened reinforced concrete columns. A deep neural network (DNN) model was developed using a comprehensive database of 469 experimental tests collected from the published literature. The model was trained on normalized input data and optimized via automated hyperparameter tuning with the Optuna framework, combined with k-fold cross-validation, which improved the stability and generalization of the predictive model.
The statistical evaluation confirmed the high accuracy of the proposed model. The developed DNN achieved R 2 values close to 0.99 and an a20-index of 0.98 for both training and testing datasets, with low R M S E , M A E , and M A P E values, indicating excellent agreement between predicted and experimental axial capacities. The similarity between training and testing results also showed that the model does not overfit and can reliably predict axial capacity on unseen data.
The predictive performance of the proposed model was also compared with commonly used design provisions, including ACI 440.2R-17 and CSA S806-12. The comparison demonstrated that the deep learning model achieved significantly lower errors and higher correlation with experimental results than the code-based equations. This confirms that data-driven approaches are better at capturing complex, nonlinear relationships among geometric properties, material characteristics, and confinement parameters that govern the axial behavior of CFRP-confined columns.
Overall, the results indicate that the proposed deep learning model can be used as an efficient and reliable tool for estimating the axial capacity of CFRP-strengthened concrete columns. The developed approach may assist engineers in structural assessment, strengthening design, and evaluation of existing members. Future research should focus on expanding the experimental database, especially in parameter ranges with limited data, and on developing simplified, design-oriented formulations based on predictions from advanced machine learning models.

Author Contributions

Conceptualization, C.V.C. and A.A.; Methodology, N.S.M.; Investigation, N.S.M. and A.A.; Data curation, N.S.M. and A.A.; Writing—original draft, N.S.M., C.V.C. and A.A.; Visualization, N.S.M. and A.A.; Supervision, C.V.C.; Project administration, C.V.C. All authors have read and agreed to the published version of the manuscript.

Funding

This research received no external funding.

Institutional Review Board Statement

Not Applicable.

Informed Consent Statement

Not Applicable.

Data Availability Statement

The data presented in this study are available on request from the corresponding author.

Conflicts of Interest

The authors declare no conflicts of interest.

References

  1. Teng, J.G.; Chen, J.-F.; Smith, S.; Lam, L. FRP-Strengthened RC Structures. In FRP: Strengthened RC Structures; Teng, J.G., Chen, J.F., Smith, S.T., Lam, L., Eds.; Wiley-VCH: Weinheim, Germany, 2002; p. 266. ISBN 0-471-48706-6. [Google Scholar]
  2. Liao, J.; Zeng, J.-J.; Jiang, C.; Li, J.-X.; Yuan, J.-S. Stress-Strain Behavior and Design-Oriented Model for FRP Spiral Strip-Confined Concrete. Compos. Struct. 2022, 293, 115747. [Google Scholar] [CrossRef]
  3. Shakouri Mahmoudabadi, N.; Camp, C.V.; Ahmad, A. Predicting the Shear Capacity of CFRP-Wrapped Concrete Beams with Steel Stirrups Using Deep Learning. Buildings 2026, 16, 1207. [Google Scholar] [CrossRef]
  4. Ozbakkaloglu, T.; Lim, J.C. Axial Compressive Behavior of FRP-Confined Concrete: Experimental Test Database and a New Design-Oriented Model. Compos. Part B Eng. 2013, 55, 607–634. [Google Scholar] [CrossRef]
  5. Al-Rousan, R. Behavior of Circular Reinforced Concrete Columns Confined with CFRP Composites. Procedia Manuf. 2020, 44, 623–630. [Google Scholar] [CrossRef]
  6. Teng, J.; Jiang, T.; Lam, L.; Luo, Y. Refinement of a Design-Oriented Stress–Strain Model for FRP-Confined Concrete. J. Compos. Constr. 2009, 13, 269–278. [Google Scholar] [CrossRef]
  7. Lam, L.; Teng, J.G. Design-Oriented Stress–Strain Model for FRP-Confined Concrete. Constr. Build. Mater. 2003, 17, 471–489. [Google Scholar] [CrossRef]
  8. Yazici, V.; Hadi, M.N. Axial Load-Bending Moment Diagrams of Carbon FRP Wrapped Hollow Core Reinforced Concrete Columns. J. Compos. Constr. 2009, 13, 262–268. [Google Scholar] [CrossRef]
  9. Cakiroglu, C.; Islam, K.; Bekdaş, G.; Kim, S.; Geem, Z.W. Interpretable Machine Learning Algorithms to Predict the Axial Capacity of FRP-Reinforced Concrete Columns. Materials 2022, 15, 2742. [Google Scholar] [CrossRef] [PubMed]
  10. Sayed, Y.A.K.; Ibrahim, A.A.; Tamrazyan, A.G.; Fahmy, M.F.M. Machine-Learning-Based Models versus Design-Oriented Models for Predicting the Axial Compressive Load of FRP-Confined Rectangular RC Columns. Eng. Struct. 2023, 285, 116030. [Google Scholar] [CrossRef]
  11. Arora, H.C.; Kumar, S.; Kontoni, D.-P.N.; Kumar, A.; Sharma, M.; Kapoor, N.R.; Kumar, K. Axial Capacity of FRP-Reinforced Concrete Columns: Computational Intelligence-Based Prognosis for Sustainable Structures. Buildings 2022, 12, 2137. [Google Scholar] [CrossRef]
  12. Al-Sayegh, A.T.; Mahmoudabadi, N.S.; Shabbir, F.; Alkandari, F.J.; Saghir, S.; Ahmad, A. Prediction of Load-Bearing Capacity of RC Columns (CWA) Using Artificial Neural Networks (ANN) Trained on a Hybrid Experimental Database HEXP. J. Eng. Res. 2025, 13, 3007–3025. [Google Scholar] [CrossRef]
  13. Al-Sayegh, A.T.; Mahmoudabadi, N.S.; Behbehani, L.J.; Saghir, S.; Ahmad, A. Estimating the Axial Strain of Circular Short Columns Confined with CFRP under Centric Compressive Static Load Using ANN and GRA Techniques. Heliyon 2024, 10, e34146. [Google Scholar] [CrossRef] [PubMed]
  14. Pakniat, S.; Najafizadeh, J.; Kadkhodaavval, M. Machine Learning for Earthquake Engineering Analysis: Comparing Regression Models to Predict Peak Ground Acceleration. World J. Adv. Res. Rev. 2025, 26, 856–867. [Google Scholar] [CrossRef]
  15. Kazemi, F.; Asgarkhani, N.; Ghanbari-Ghazijahani, T.; Jankowski, R. Ensemble Machine Learning Models for Estimating Mechanical Curves of Concrete-Timber-Filled Steel Tubes. Eng. Appl. Artif. Intell. 2025, 156, 111234. [Google Scholar] [CrossRef]
  16. Noman, M.; Yaqub, M.; Salman, M.; Faizan, M.; Mahmoudabadi, S.; Ahmad, A. Predicting Axial Load Capacity of CFRP Fire-Damaged RC Columns through DANN. Innov. Infrastruct. Solut. 2025, 10, 571. [Google Scholar] [CrossRef]
  17. Amini Pishro, A.; Zhang, Z.; Amini Pishro, M.; Liu, W.; Zhang, L.; Yang, Q. Structural Performance of EB-FRP-Strengthened RC T-Beams Subjected to Combined Torsion and Shear Using ANN. Materials 2022, 15, 4852. [Google Scholar] [CrossRef]
  18. Maio, U.D.; Greco, F.; Lonetti, P.; Blasi, P.N.; Sgambitterra, G. Flood-Induced Load Effects on Real-Scale Structures: A 3D Multilevel Dynamic Analysis. Fract. Struct. Integr. 2025, 19, 59–73. [Google Scholar] [CrossRef]
  19. Zhang, J.; Zhu, S.; Cai, C.; Wang, M.; Li, H. Experimental and Numerical Analysis on Concrete Interface Damage of Ballastless Track Using Different Cohesive Models. Constr. Build. Mater. 2020, 263, 120859. [Google Scholar] [CrossRef]
  20. Shakouri Mahmoudabadi, N.; Bahrami, A.; Saghir, S.; Ahmad, A.; Iqbal, M.; Elchalakani, M.; Özkılıç, Y.O. Effects of Eccentric Loading on Performance of Concrete Columns Reinforced with Glass Fiber-Reinforced Polymer Bars. Sci. Rep. 2024, 14, 1890. [Google Scholar] [CrossRef]
  21. Mahmoudabadi, N.S.; Camp, C.V. Rapid Analysis of CFRP-Reinforced Concrete Structures Using Artificial Neural Networks. In Advanced Optimization Applications in Engineering; IGI Global Scientific Publishing: Hershey, PA, USA, 2024; pp. 60–96. ISBN 979-8-3693-2161-4. [Google Scholar]
  22. Wahab, S.; Suleiman, M.; Shabbir, F.; Mahmoudabadi, N.S.; Waqas, S.; Herl, N.; Ahmad, A. Predicting Confinement Effect of Carbon Fiber Reinforced Polymers on Strength of Concrete Using Metaheuristics-Based Artificial Neural Networks. J. Civ. Eng. Front. 2023, 4, 45–59. [Google Scholar] [CrossRef]
  23. Ahmad, A.; Chaiyasarn, K.; Farooq, F.; Ahmad, W.; Suparp, S.; Aslam, F. Compressive Strength Prediction via Gene Expression Programming (GEP) and Artificial Neural Network (ANN) for Concrete Containing RCA. Buildings 2021, 11, 324. [Google Scholar] [CrossRef]
  24. Chen, L.; Nouri, Y.; Allahyarsharahi, N.; Naderpour, H.; Rezazadeh Eidgahee, D.; Fakharian, P. Optimizing Compressive Strength Prediction in Eco-Friendly Recycled Concrete via Artificial Intelligence Models. Multiscale Multidiscip. Model. Exp. Des. 2024, 8, 24. [Google Scholar] [CrossRef]
  25. Munir, M.J.; Kazmi, S.M.S.; Wu, Y.-F.; Lin, X.; Ahmad, M.R. Development of a Novel Compressive Strength Design Equation for Natural and Recycled Aggregate Concrete through Advanced Computational Modeling. J. Build. Eng. 2022, 55, 104690. [Google Scholar] [CrossRef]
  26. Vasilev, I. Python Deep Learning: Exploring Deep Learning Techniques and Neural Network Architectures with PyTorch, Keras, and TensorFlow, 2nd ed.; Packt Pub.: Birmingham, UK, 2019. [Google Scholar]
  27. Bhattacharyya, S. Deep Learning: Research and Applications; De Gruyter frontiers in computational intelligence; De Gruyter: Berlin, Germany, 2020. [Google Scholar]
  28. Junaid, M.T.; Alateyat, A.; Ibrahim, B.; Awad, R.; Hamad, K.; Barakat, S. Data-Driven Assessment and Design of Axially Loaded FRP-Reinforced Concrete Columns. Struct. Concr. 2025, 26, 6722–6764. [Google Scholar] [CrossRef]
  29. Tarawneh, A.; Almasabha, G.; Murad, Y. ColumnsNet: Neural Network Model for Constructing Interaction Diagrams and Slenderness Limit for FRP-RC Columns. J. Struct. Eng. 2022, 148, 04022089. [Google Scholar] [CrossRef]
  30. Liao, J.; Yang, K.Y.; Zeng, J.-J.; Quach, W.-M.; Ye, Y.-Y.; Zhang, L. Compressive Behavior of FRP-Confined Ultra-High Performance Concrete (UHPC) in Circular Columns. Eng. Struct. 2021, 249, 113246. [Google Scholar] [CrossRef]
  31. Zeng, J.-J.; Ye, Y.-Y.; Gao, W.-Y.; Smith, S.T.; Guo, Y.-C. Stress-Strain Behavior of Polyethylene Terephthalate Fiber-Reinforced Polymer-Confined Normal-, High- and Ultra High-Strength Concrete. J. Build. Eng. 2020, 30, 101243. [Google Scholar] [CrossRef]
  32. Goodfellow, I.; Bengio, Y.; Courville, A. Deep Learning; MIT Press: Cambridge, MA, USA, 2016; ISBN 978-0-262-33737-3. [Google Scholar]
  33. Kuhn, M.; Johnson, K. Data Pre-Processing. In Applied Predictive Modeling; Kuhn, M., Johnson, K., Eds.; Springer: New York, NY, USA, 2013; pp. 27–59. ISBN 978-1-4614-6849-3. [Google Scholar]
  34. Raschka, S.; Mirjalili, V. Python Machine Learning: Machine Learning and Deep Learning with Python, Scikit-Learn, and TensorFlow, 3rd ed.; Expert insight; Packt Pub.: Birmingham, UK, 2019. [Google Scholar]
  35. Stevens, E.; Antiga, L.; Viehmann, T.; Chintala, S. Deep Learning with PyTorch; Manning Publications: Shelter Island, NY, USA, 2020. [Google Scholar]
  36. Akiba, T.; Sano, S.; Yanase, T.; Ohta, T.; Koyama, M. Optuna: A Next-Generation Hyperparameter Optimization Framework. In Proceedings of the 25th ACM SIGKDD International Conference on Knowledge Discovery & Data Mining; Association for Computing Machinery: New York, NY, USA, 2019. [Google Scholar]
  37. Victoria, S.; Sheila, M. Best Practices for Computational Science: Software Infrastructure and Environments for Reproducible and Extensible Research. J. Open Res. Softw. 2014, 2, 21. [Google Scholar] [CrossRef]
  38. Nelli, F. Python Data Analytics; Apress: Berkeley, CA, USA, 2015; ISBN 978-1-4842-0959-2. [Google Scholar]
  39. Bergstra, J.; Bengio, Y. Random Search for Hyper-Parameter Optimization. J. Mach. Learn. Res. 2012, 13, 281–305. [Google Scholar]
  40. Frazier, P.I. Bayesian Optimization. In Recent Advances in Optimization and Modeling of Contemporary Problems; INFORMS TutORials in Operations Research; INFORMS: Catonsville, MD, USA, 2018; pp. 255–278. ISBN 978-0-9906153-2-3. [Google Scholar]
  41. Shah, H.A.; Yuan, Q.; Akmal, U.; Shah, S.A.; Salmi, A.; Awad, Y.A.; Shah, L.A.; Iftikhar, Y.; Javed, M.H.; Khan, M.I. Application of Machine Learning Techniques for Predicting Compressive, Splitting Tensile, and Flexural Strengths of Concrete with Metakaolin. Materials 2022, 15, 5435. [Google Scholar] [CrossRef]
  42. Chou, J.-S.; Pham, A.-D. Enhanced Artificial Intelligence for Ensemble Approach to Predicting High Performance Concrete Compressive Strength. Constr. Build. Mater. 2013, 49, 554–563. [Google Scholar] [CrossRef]
  43. Bishop, C.M. Pattern Recognition and Machine Learning; Springer: New York, NY, USA, 2006; Volume 2, pp. 5–43. [Google Scholar]
  44. ACI PRC-440.2-17; Guide for the Design and Construction of Externally Bonded FRP Systems for Strengthening Concrete Structures. ACI Committee 440: Farmington Hills, MI, USA, 2017.
  45. CSA S806:12 (R2021); Design and Construction of Building Structures with Fibre-Reinforced Polymers. Canadian Standards Association: Toronto, ON, Canada, 2021.
Figure 1. Selected DNN architecture.
Infrastructures 11 00151 g001
Figure 2. Training procedure of the selected deep learning neural architecture.
Infrastructures 11 00151 g002
Figure 3. Schematic representation of the CFRP-wrapped reinforced concrete column.
Infrastructures 11 00151 g003
Figure 4. Data distribution patterns of the CFRP-wrapped column dataset.
Infrastructures 11 00151 g004aInfrastructures 11 00151 g004b
Figure 5. (a) Correlation Heatmap matrix of the critical parameters. (b) Correlation of the input parameter with the output parameter.
Infrastructures 11 00151 g005aInfrastructures 11 00151 g005b
Figure 6. Illustration of the holdout validation procedure.
Infrastructures 11 00151 g006
Figure 7. Illustration of the k-fold cross-validation procedure.
Infrastructures 11 00151 g007
Figure 8. Comparison between experimental and predicted values.
Infrastructures 11 00151 g008
Figure 9. Mean squared error (MSE) versus epochs for the developed DNN model.
Infrastructures 11 00151 g009
Figure 10. Estimated values compared to actual experimental results.
Infrastructures 11 00151 g010aInfrastructures 11 00151 g010b
Figure 11. Taylor Diagram of the models.
Infrastructures 11 00151 g011
Table 1. Summary of previous machine learning studies on the prediction of concrete column properties.
StudyML AlgorithmsDataset SizePredicted OutputBest AlgorithmAccuracy Metric
Cakiroglu et al. (2022) [9]Interpretable ML models~200 samplesAxial capacity of FRP-RC columnsML modelR2, RMSE
Abuodeh et al. (2020) [10]Hybrid ML models~300 samplesAxial compressive load of FRP-confined columnsML modelR2
Lee & Lee (2014) [11]ANN~150 samplesAxial capacity of FRP-RC columnsANN-based modelR2, RMSE
Nikoo et al. (2021) [23]GEP, ANN~200 samplesConcrete compressive strengthGEPR2
Mansouri et al. (2016) [24]ANN, ML~300 samplesConcrete compressive strengthHybrid AI modelRMSE
Keshtegar et al. (2021) [25]Advanced computational modeling~250 samplesConcrete compressive strengthComputational modelR2
Table 2. Summary of statistical characteristics for CFRP-wrapped column data.
VariableUnitMinimumMaximumDifferenceAveragest.dev
A g mm 2 14,400372,100357,70073,657.7052,465.33
kL/r-10877719.817.96
A f mm 2 200408038801336.27772.17
ρ f %0.45.34.92.010.95
e mm 032032049.4069.66
e/h-0110.180.24
f c MPa 21937246.1417.38
f f MPa 348255022021196.26394.66
E f GPa 3315111865.7531.38
P e x p kN 9015,23515,1452115.091933.47
Table 3. Hyperparameters identified using Optuna optimization.
HyperparameterProposed ValueIdeal Value
Hidden layers2–64
Number of neurons per layer8–881st layer (24), 2nd layer (18),
3rd layer (24), 4th layer (24)
Hidden activation functionSigmoid, logsig, tansig, Linear, Tanh, ReLU, ELU, GELU, SELUtansig
Batch size 1 8 (27), 1 6 (36), 1 4 (54), 1 2 (108)54
OptimizerSGD, Adam, RMSpropRMSprop
learning rate = 0.0051474242
Table 4. Comparison of commonly used hyperparameter optimization methods.
MethodDescriptionAdvantagesLimitations
Grid Search [39]Exhaustively evaluates all possible hyperparameter combinationsSimple to implement, deterministic resultsComputationally expensive, inefficient for large search spaces
Random Search [39]Randomly samples hyperparameter combinationsMore efficient than grid search, better exploration of large search spacesMay still require many evaluations, no learning from previous trials
Bayesian Optimization [40]Uses probabilistic models to guide searchEfficient search focuses on promising regionsMore complex implementation
Optuna [36]Adaptive Bayesian optimization framework with pruning and dynamic search spaceHighly efficient, supports early stopping of poor trials, and flexible search spaceRequires slightly higher implementation complexity
Table 5. Performance of the proposed CFRP-wrapped column DNN.
Dataseta20-Index R 2 MAE
(MPa)
RMSE
(MPa)
MAPE
(%)
Train0.980.981472427.11
Test0.980.991553526.76
Table 6. Performance of the CFRP-wrapped column DNN and design codes.
Modela20-Index R 2 MAE
(MPa)
RMSE
(MPa)
MAPE
(%)
ACI PRC-440.2-170.650.88478214.92
CSA-S806-120.600.92425617.41
DNN0.980.9814267.04
Disclaimer/Publisher’s Note: The statements, opinions and data contained in all publications are solely those of the individual author(s) and contributor(s) and not of MDPI and/or the editor(s). MDPI and/or the editor(s) disclaim responsibility for any injury to people or property resulting from any ideas, methods, instructions or products referred to in the content.