3. Methodology
This section presents an proposed Counterfactual Deep Learning Framework for traffic accident prediction and safety intervention analysis. Unlike conventional correlation-based models, an proposed approach jointly captured spatio-temporal dynamics, multi-domain feature interactions, and causal relationships within an unified framework by integrating traffic, environmental, road, and temporal data. To model traffic dynamics, a temporal deep representation module was employed to learn latent patterns from sequential data, capturing both short- and long-term dependencies. In parallel, a continuous spatio-temporal risk field was constructed to represent accident likelihood across space and time, enabling the modeling of both localized risk and its propagation over the network. A key contribution was the integration of counterfactual reasoning within the learning pipeline, where latent-space interventions enable the simulation of “what-if” scenarios and an evaluation of their impact on accident risk. These are further supported by an causal inference layer to ensure reliable cause–effect estimation. All components were unified within a Hybrid Prediction–Intervention Neural Architecture (HPINA), which combines prediction and intervention analysis. Through adaptive policy optimization, the framework provides both accurate risk prediction and actionable strategies for traffic safety improvement.
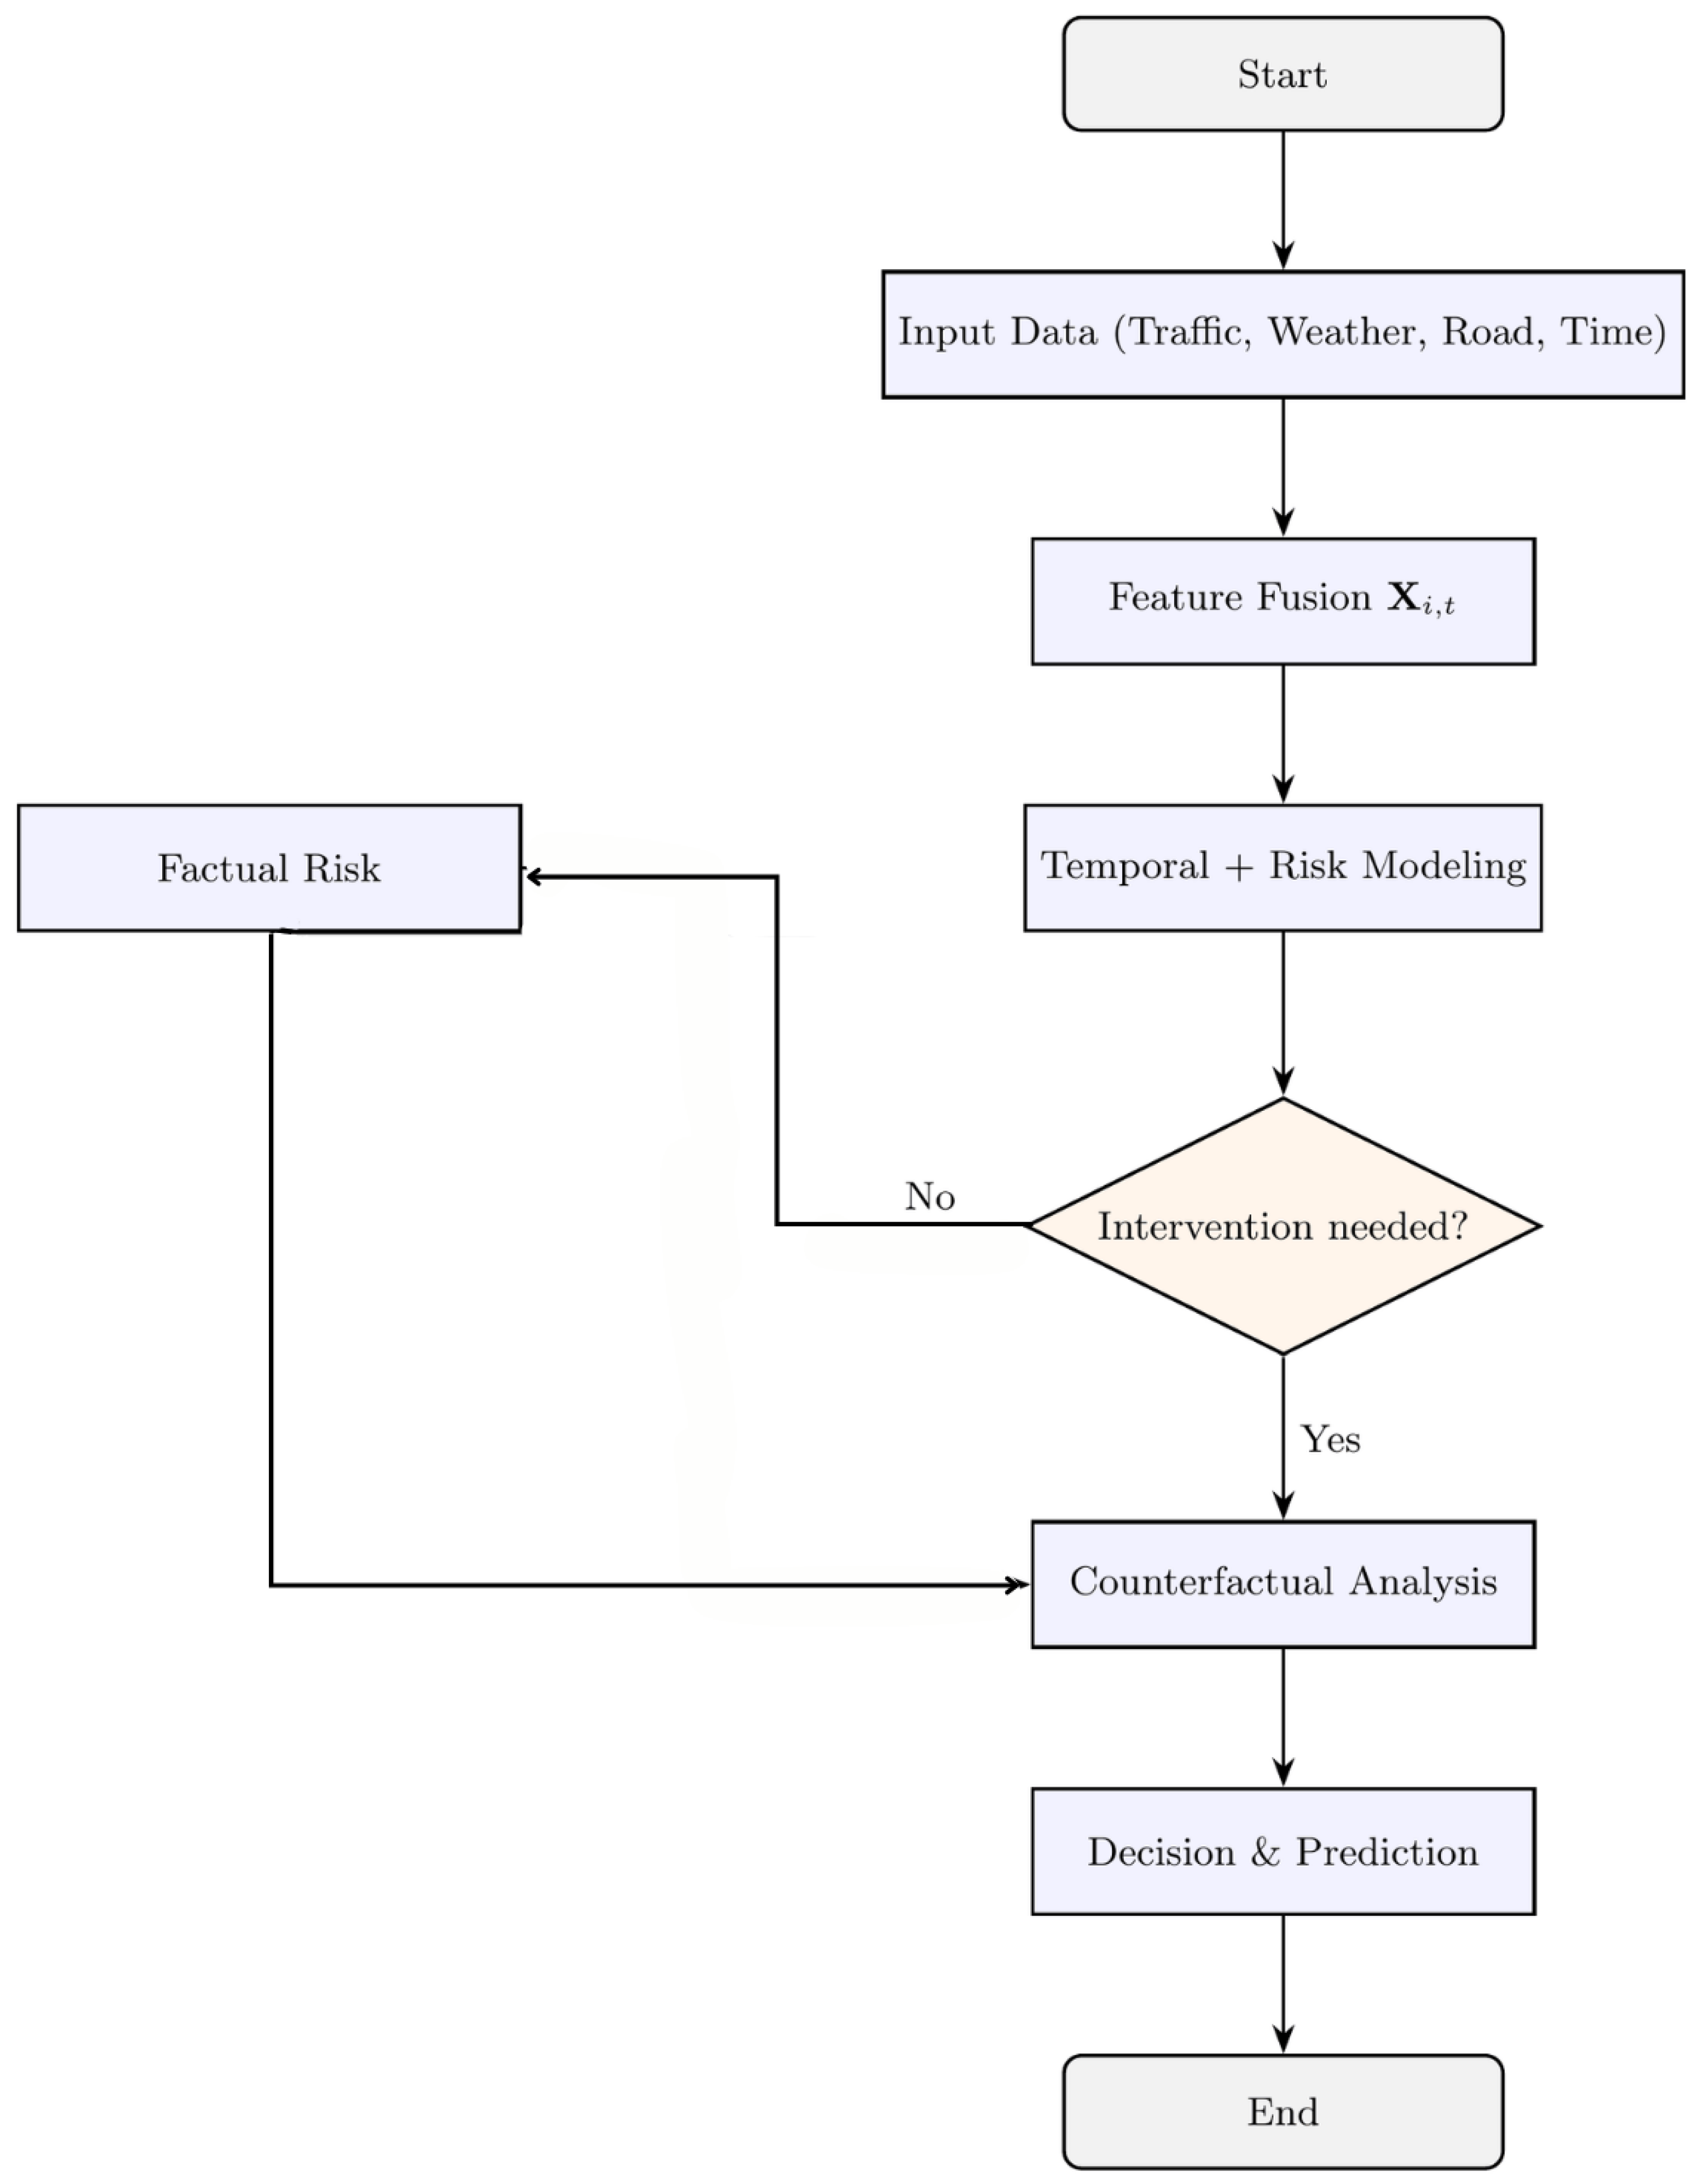
As illustrated in
Figure 1, the proposed framework reflects a structured integration of data-driven learning and causal reasoning for traffic safety analysis. This framework begins with the aggregation of heterogeneous multi-source inputs, including traffic dynamics, environmental conditions, and road attributes, which are transformed into a unified feature representation to capture the complex interactions governing traffic behavior. This representation is then processed through a temporal–risk modeling stage that jointly learns latent spatio-temporal dependencies and evolving risk patterns across the network. The inclusion of a decision mechanism enables the model to dynamically determine whether intervention is required, thereby introducing adaptability into the predictive pipeline. In cases where no intervention is triggered, the system maintains a factual estimation of risk, preserving consistency with observed traffic conditions. Conversely, when intervention is deemed necessary, the framework activates a counterfactual analysis module to simulate hypothetical scenarios and evaluate their potential impact on accident risk. This dual-path processing strategy ensures that the model does not rely solely on observational learning but instead incorporates causal reasoning to enhance interpretability and decision-making. This counterfactual branch enables the quantification of causal effects by comparing factual and altered states, allowing the system to identify how specific changes in traffic or environmental variables influence risk outcomes. These resulting causal insights are then propagated to a policy optimization stage, where adaptive strategies are learned to minimize risk and improve overall safety performance. By seamlessly connecting prediction, intervention, and decision support within a unified pipeline, the proposed framework transforms traffic accident analysis from a passive forecasting task into an active, adaptive, and explainable system capable of supporting real-world safety interventions and intelligent transportation planning in a more effective manner.
3.1. Dataset Used
The XTraffic dataset [
24] was adopted as the primary data source due to its large-scale and comprehensive spatio-temporal representation of urban traffic dynamics and its strong alignment with the requirements of counterfactual learning frameworks. Unlike conventional traffic datasets that treat accident prediction as a purely statistical classification problem, XTraffic integrates traffic flow measurements, incident records, and road contextual attributes within a unified and temporally synchronized structure. According to the original dataset description, XTraffic is constructed from the Caltrans Performance Measurement System (PeMS), covers the full year of 2023, and provides traffic observations at a 5 min temporal granularity. The dataset contains 16,972 traffic nodes, 870,100 graph edges, and sensors distributed across 42 cities and counties, together with 26 retained road meta-features describing the monitored road segments. These characteristics enable the modeling of complex and highly interdependent interactions between traffic density, speed variations, and environmental conditions, which are critically important for understanding the underlying mechanisms of accident occurrence. The dataset supports large-scale analysis across traffic nodes, providing sufficient variability for learning more robust and generalizable patterns across different traffic conditions.
For the incident component, the source dataset reports 476,766 incident records spanning seven incident classes. In addition, each traffic node represents a lane with a specific direction, which is beneficial for constructing direction-aware spatial relations and for modeling localized traffic disruption patterns. The source paper further explains that incident records are matched to traffic sensors using freeway name and absolute postmile information, thereby enabling meaningful spatio-temporal association between traffic-state evolution and nearby incident events.
A key advantage of XTraffic lies in its ability to facilitate causal and counterfactual reasoning. A structured representation of features allows for the simulation of diverse intervention scenarios, such as modifying traffic intensity or environmental conditions, and observing their impact on accident probability in a more dynamic way.
This capability directly supports the objective of the proposed framework, which aims not only to predict accidents but also to analyze safety interventions from a deeper causal perspective. Therefore, the dataset provides a rich, realistic, and highly expressive foundation for developing advanced intelligent transportation models that combine prediction, reasoning, and decision support in an integrated and adaptive manner.
In this study, the prediction target is formulated as a binary accident-risk classification task. Specifically, the label variable is defined as when an incident is matched to traffic node i within the subsequent 30 min prediction horizon, and otherwise, and each input sample is constructed from 12 consecutive 5 min historical observations, corresponding to a 60 min temporal window historical observations of traffic, contextual, and road-network attributes. Before model development, the data were preprocessed through temporal alignment, spatial matching, removal of incomplete or duplicated records, feature normalization, and categorical encoding where required.
To ensure a transparent and reproducible evaluation protocol, the dataset was divided into training, validation, and test sets using a chronological 70%-15%-15% split. To reduce temporal leakage, the split was implemented in a chronological manner by assigning the earliest 70% of observations to training, the following 15% to validation, and the final 15% to testing, such that future observations were not used to inform past samples during training. In addition, all normalization statistics were computed using the training set only and then applied to the validation and test sets. Where class imbalance was present, it was handled using class-weighted focal loss with balanced mini-batch sampling, thereby improving the reliability of the reported performance and the credibility of the experimental findings.
3.2. Multi-Domain Data Fusion and Representation Learning
Modern intelligent transportation systems generate heterogeneous data streams originating from multiple domains, including traffic flow measurements, environmental conditions, road infrastructure attributes, and temporal dynamics. Each of these domains provides partial insight into traffic behavior; however, relying on a single data source limits the ability to capture complex interactions that lead to accident occurrence. An effective accident prediction framework requires the integration of multi-domain data into a unified representation [
25]. We constructed a comprehensive feature space by fusing traffic-related variables (speed and density), environmental factors (weather conditions), structural road characteristics (road type and intersections), and temporal features (time of day and seasonal patterns) [
26]. This detailed categorization of these features and their respective roles are is summarized in
Table 1, which highlights the diversity and complementary nature of the data sources used in this study. To effectively integrate heterogeneous data, a structured multi-domain fusion strategy was adopted. First, all data sources were temporally aligned using a common time index to ensure consistency across measurements. Spatial alignment was then performed by mapping all features to corresponding traffic nodes within the road network. After alignment, features from different domains were concatenated into a unified representation while preserving their semantic relationships. To prevent dominance of any single feature group, normalization was applied across all numerical attributes, and categorical features were encoded using one-hot representation. This fusion process enables the model to jointly learn interactions between traffic dynamics, environmental variations, and road characteristics. Furthermore, the unified representation enhances the model’s ability to capture complex dependencies that are critical for both prediction and counterfactual reasoning, as discussed in subsequent sections.
This multi-domain feature representation at time step
t and location
i was defined as a unified feature vector
that combines all relevant domains. This representation is mathematically expressed in Equation (
1), where traffic, environmental, road, and temporal features were integrated into a single high-dimensional vector. Such a formulation allows the model to learn latent correlations across domains and extract meaningful patterns for accident prediction. This resulting feature space serves as an primary input to the spatio-temporal and counterfactual learning modules, ensuring that all influencing factors were jointly considered in the learning process.
where
represents traffic flow features (speed, density),
denotes environmental conditions (weather variables),
corresponds to static road attributes (road type, number of lanes), and
captures temporal features (time-of-day, day-of-week).
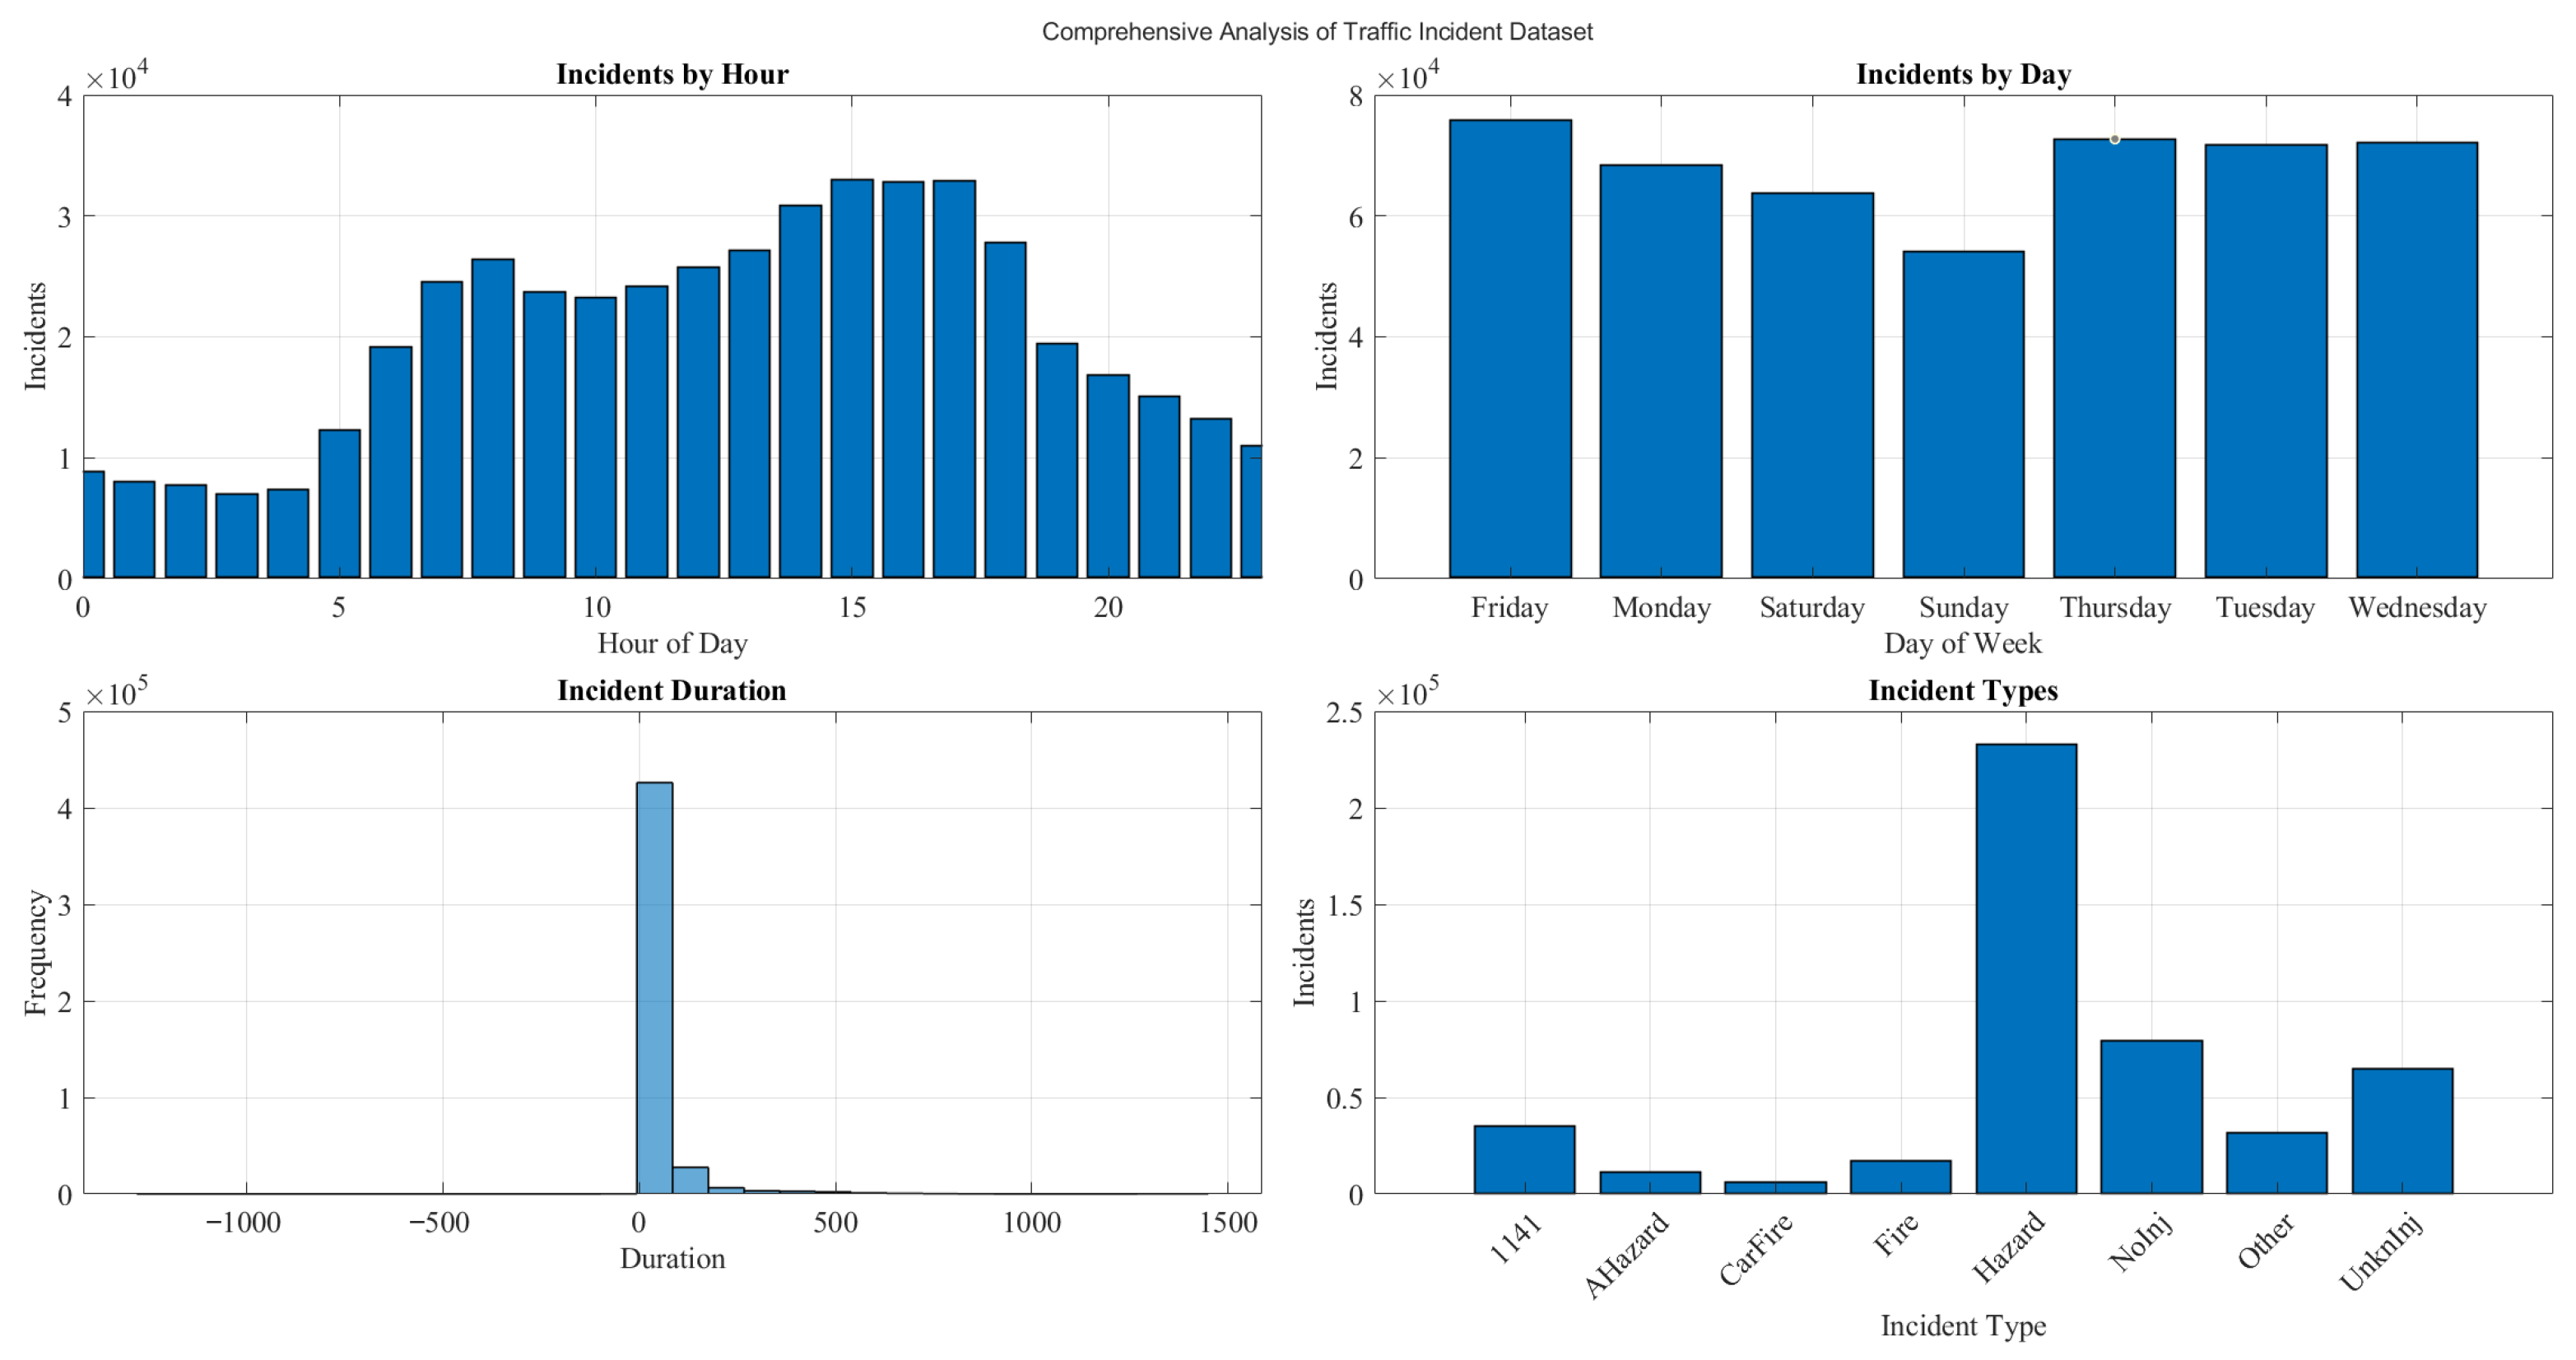
The results are illustrated in
Figure 2 and reveal clear and quantifiable temporal and categorical patterns in traffic incident occurrence that are highly relevant for predictive modeling. As shown in the “Incidents by Hour” plot, incident frequency increased significantly from early morning hours (approximately
–
incidents between 00:00–04:00) to a peak during afternoon periods, reaching nearly
–
incidents around 15:00–17:00, before declining to about
–
incidents late at night. This confirms a strong correlation between traffic congestion peaks and accident likelihood. This “Incidents by Day” plot further indicates that weekdays dominate incident occurrence, with Friday recording the highest frequency (approximately
incidents), followed by Thursday and Wednesday (around
), while Sunday shows the lowest level (approximately
), reflecting reduced traffic activity. The “Incident Duration” distribution is highly right-skewed, with the majority of incidents strongly concentrated below 100 units of duration, while a small fraction extends beyond 500 and even up to 1500 units, indicating rare but highly severe disruptions with significant operational impact. This “Incident Types” analysis reveals that hazard-related incidents dominate, exceeding
occurrences, followed by non-injury incidents at approximately
, whereas categories such as fire and car fire remain below
. These quantitative insights highlight a critical influence of temporal peaks, weekday dynamics, and dominant incident categories, strongly reinforcing a need for spatio-temporal and counterfactual modeling to effectively capture and mitigate accident risks in intelligent transportation systems in a more adaptive and realistic manner.
3.3. Dynamic Spatio-Temporal Risk Field Construction
To move beyond discrete accident prediction and capture the underlying dynamics of traffic safety, this work introduces a continuous spatio-temporal risk field representation that models accident likelihood as a function of both space and time [
27]. Unlike conventional approaches that treat accident occurrence as isolated events, the proposed formulation treats traffic risk as a propagating field influenced by local traffic conditions, environmental factors, and structural road characteristics. This perspective is inspired by physical field theories, where the state of a system evolves continuously across a domain. Specifically, each traffic node is associated with a dynamic risk intensity that varies over time and is influenced not only by its local state but also by neighboring regions. This allows the model to capture spatial dependencies such as congestion spillover and temporal patterns such as peak-hour amplification. As a result, the risk field formulation provides a unified representation that naturally supports both prediction and counterfactual intervention analysis by modeling how risk evolves under varying conditions.
The role of the risk field within HPINA is deliberately non-redundant. The temporal encoder alone produces a compact latent description of local traffic dynamics, but it does not by itself define how risk should propagate, accumulate, or spatially interact across the transportation network. Conversely, a diffusion formulation without learned temporal representations would fail to capture the nonlinear and context-dependent traffic behaviors that precede incidents. The risk field is therefore introduced as the intermediate state-construction layer that links local representation learning to network-level safety reasoning. In this sense, the framework is organized hierarchically: the encoder learns the state, the field organizes the state, and the downstream intervention modules act on that organized state.
Formally, the traffic risk at location
i and time
t is defined as a continuous function
, which evolves according to both intrinsic factors and spatial interactions. The proposed risk field is modeled as a diffusion-driven dynamic process with external inputs, as expressed in Equation (
2). The first term captures feature-driven local risk excitation, meaning the nonlinear contribution of the instantaneous multi-domain traffic state. The second term models the spatial propagation of risk across neighboring nodes through a graph-based Laplacian operator, thereby encoding how localized disturbances influence adjacent regions. The third term incorporates exogenous modulation, allowing environmental and contextual variables to amplify or attenuate the evolving risk state. This formulation enables the model to learn how risk intensifies, dissipates, or propagates across the network, providing a physically interpretable and mathematically grounded representation. Furthermore, this continuous formulation establishes a direct connection between observed traffic patterns and latent risk evolution, which is essential for generating realistic counterfactual scenarios and understanding how interventions modify the risk landscape over time.
From a theoretical standpoint, Equation (
2) serves as the unifying operator of the framework. It is not appended beside the neural model; rather, it transforms learned local traffic representations into a structured network-level state that can later be queried under factual and counterfactual conditions. Accordingly, the neural and diffusion components are complementary rather than competing: the neural mappings
and
provide nonlinear state-dependent excitation, while the diffusion term imposes spatial coupling and system-level coherence. This is precisely what allows subsequent intervention analysis to operate on a risk representation that is both learned and physically organized.
where
denotes the risk intensity at location
i and time
t,
represents the multi-domain feature vector defined in Equation (
1), and
denotes the set of neighboring nodes in the traffic network. The weights
capture spatial connectivity between nodes, while
and
are nonlinear mappings learned by the neural network to model intrinsic traffic dynamics and environmental effects, respectively. The parameters
,
, and
control the contributions of local excitation, spatial diffusion, and exogenous modulation. This decomposition clarifies the necessity of the module:
explains why risk emerges locally, the diffusion term explains how it spreads, and
explains why equally dense traffic states may yield different safety outcomes under different external conditions.
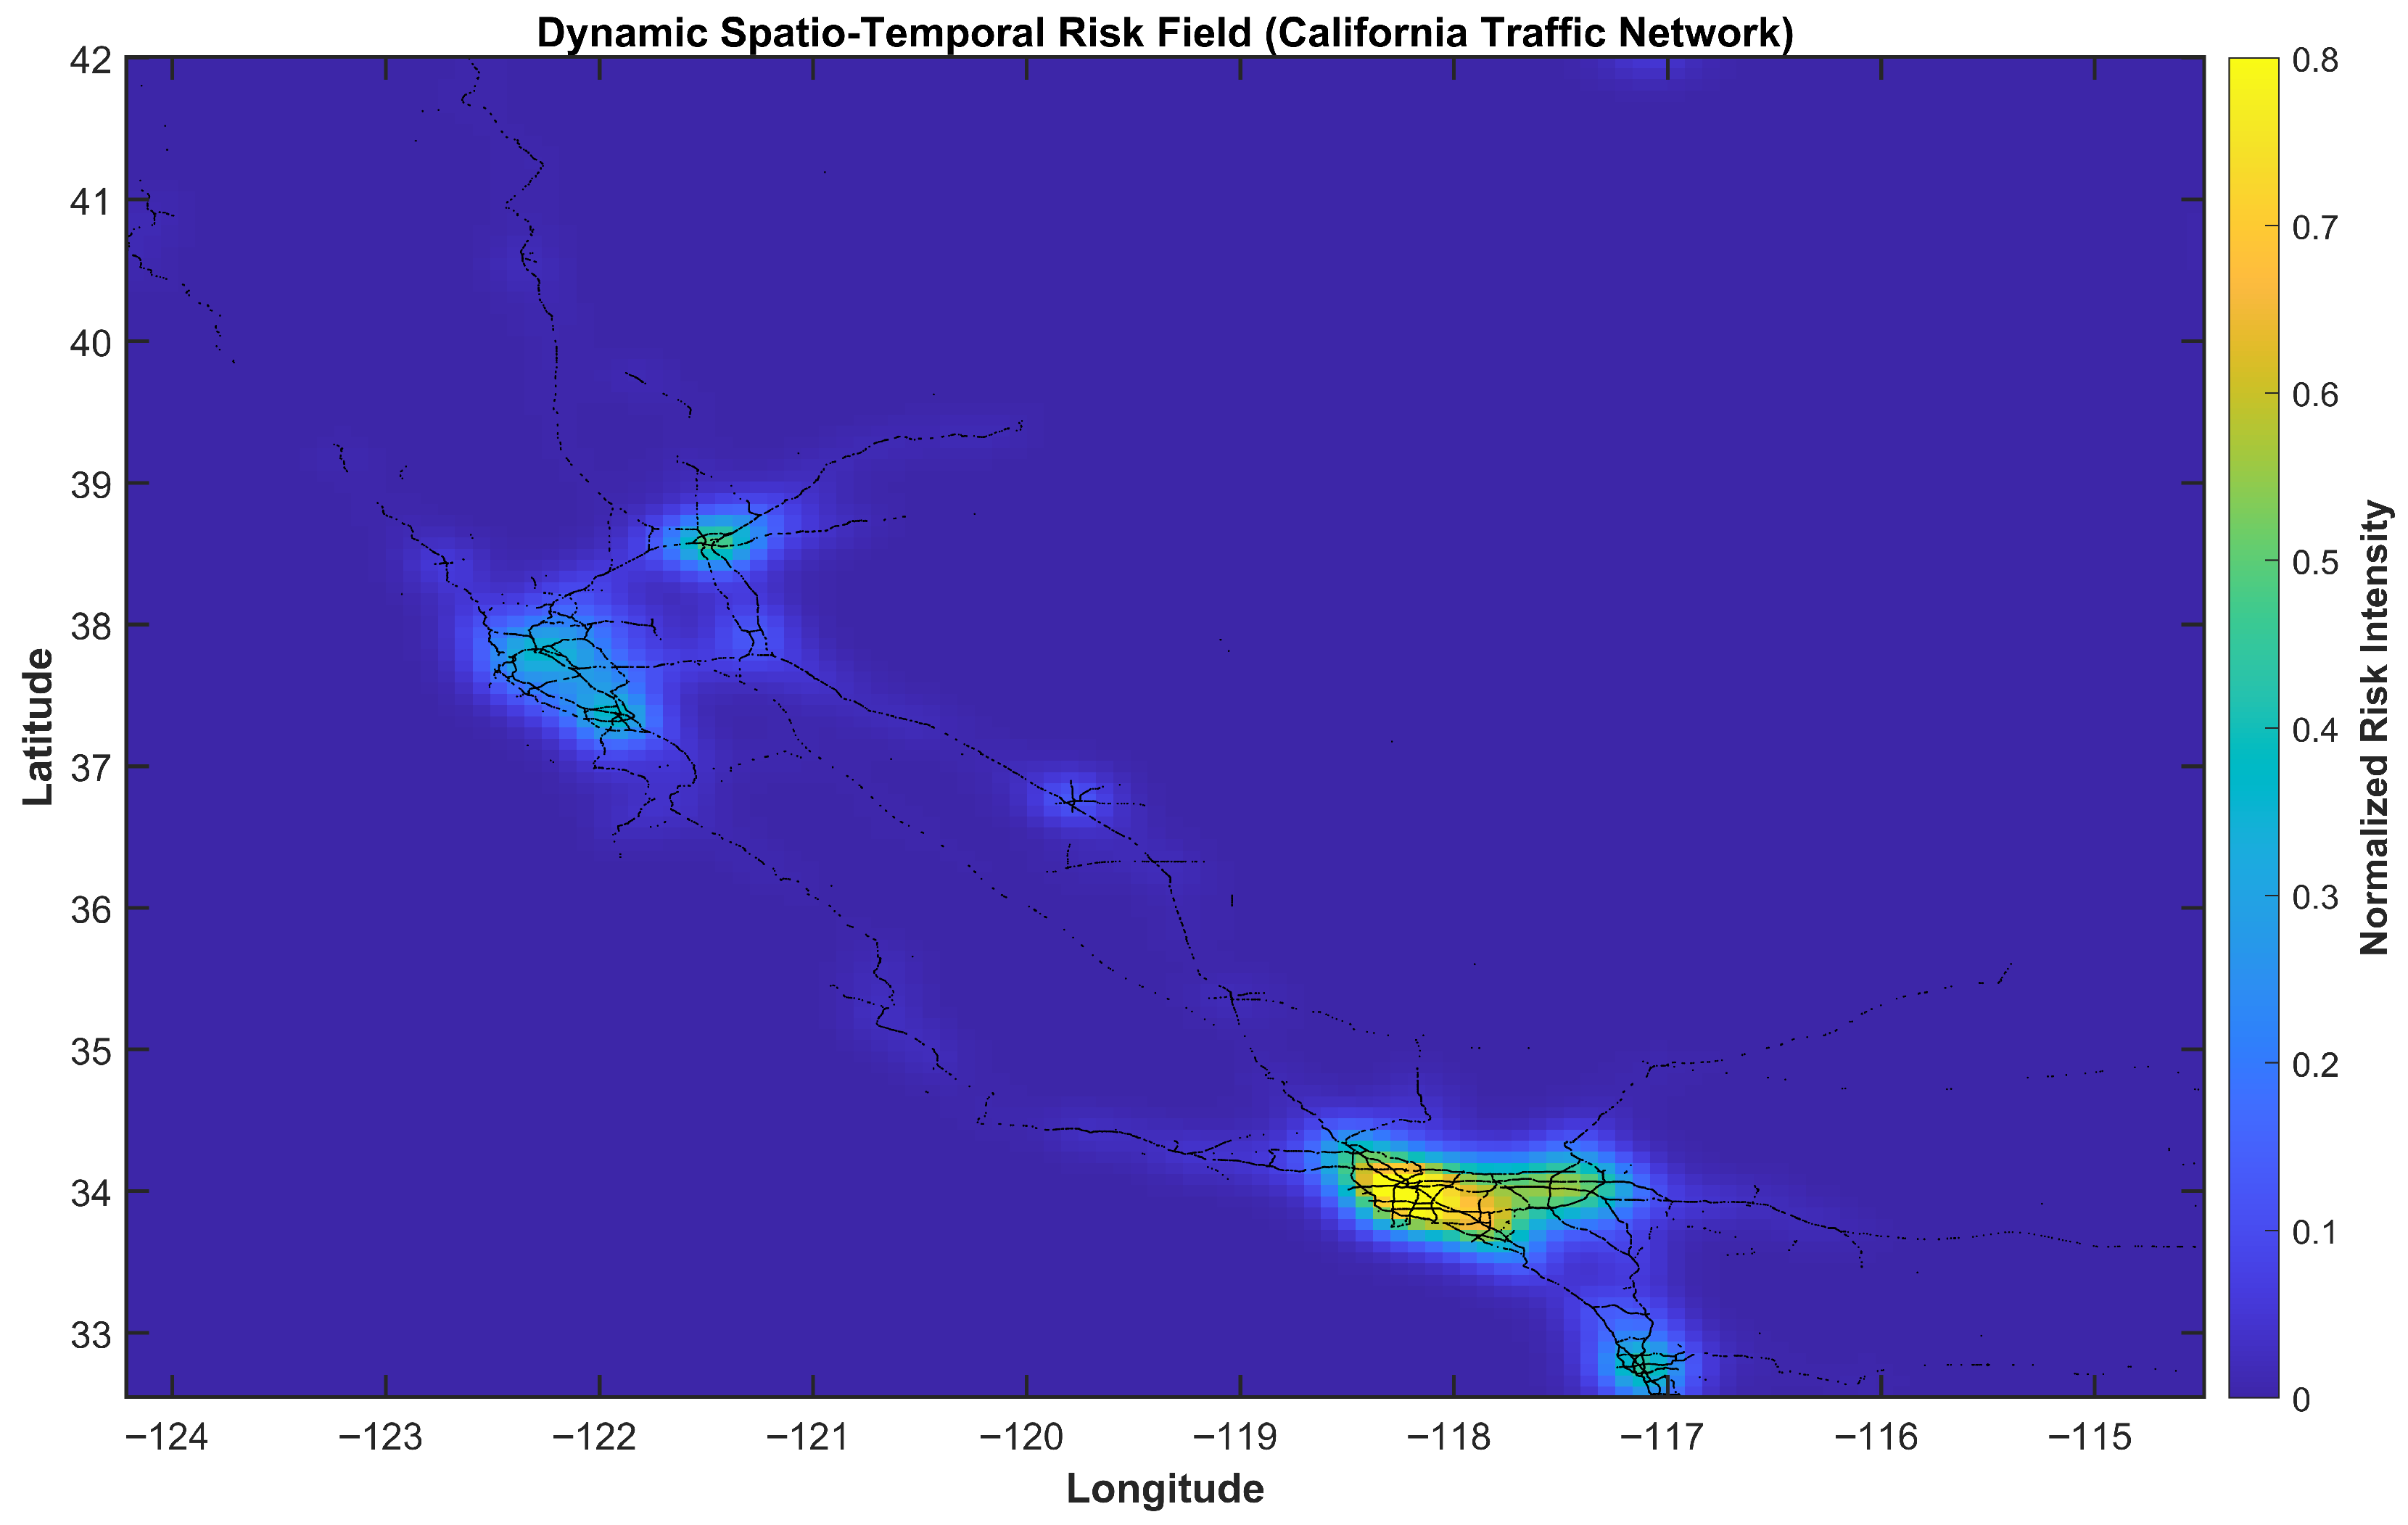
The dynamic spatio-temporal risk field illustrated in
Figure 3 provides a continuous and interpretable representation of traffic accident likelihood across the California transportation network, revealing significant spatial heterogeneity driven by urban density and traffic flow dynamics. High-risk regions are strongly concentrated in Southern California (approximately longitude
to
and latitude
to
), where the normalized risk intensity approaches
, indicating severe congestion and high interaction complexity, while a secondary hotspot appears in Northern California (around longitude
to
and latitude
to
) with moderate risk levels ranging between
and
. In contrast, the majority of rural and low-density areas exhibit near-zero risk values, confirming that accident occurrence is highly correlated with traffic concentration and infrastructure usage. These smooth spatial gradients observed between high- and low-risk regions validate the effectiveness of the proposed diffusion-based formulation in Equation (
2), which captures both localized incident density and spatial propagation effects across neighboring regions. Unlike traditional discrete prediction models, this continuous risk field enables the identification of latent risk transitions and emerging hotspots, providing deeper insight into the underlying dynamics of traffic safety. Furthermore, the integration of multi-domain features within the formulation allows the model to encode complex interactions between spatial proximity, temporal patterns, and external factors, making the framework particularly suitable for counterfactual analysis, where hypothetical interventions can be simulated to assess their impact on the overall risk landscape. Overall, this figure demonstrates that the proposed approach successfully transforms raw incident data into a structured, physically interpretable, and decision-oriented representation, supporting advanced intelligent transportation system optimization and proactive safety management. More importantly, it illustrates the architectural rationale of HPINA: the field is the representation on which intervention reasoning becomes meaningful because it expresses accident risk not merely as a local prediction score but as an evolving network state with explicit spatial semantics.
3.4. Latent Behavior Modeling via Temporal Deep Representation
Accurate modeling of traffic accident dynamics requires capturing complex temporal dependencies that are not directly observable from raw data. Traffic systems exhibit highly dynamic and non-stationary behavior, where accident occurrence is influenced by evolving patterns such as congestion buildup, peak-hour transitions, and temporal correlations across consecutive time steps. To address this challenge, the proposed framework incorporates a temporal deep representation module designed to learn latent behavioral patterns from sequential data. Specifically, multi-domain feature vectors
, defined in Equation (
1), are processed using a sequence modeling architecture based on long short-term memory (LSTM) networks or Transformer-based attention mechanisms. This enables the model to capture both short-term fluctuations and long-term dependencies in traffic conditions, allowing it to learn hidden states that encode the temporal evolution of traffic behavior at each spatial location. In the proposed framework,
is interpreted as a learned spatio-temporal representation of the recent traffic state, which summarizes historical and contextual information for downstream prediction and intervention analysis.
where
denotes the latent hidden state at location
i and time
t,
is the input feature vector, and
represents a nonlinear temporal mapping function parameterized by
, which can be instantiated using LSTM units or Transformer-based attention mechanisms. This formulation allows the model to encode both historical dependencies and current observations into a unified latent representation. Importantly, this latent state should be understood as a learned representation that supports structured downstream modeling; it is not, by itself, assumed to constitute an identified causal variable without the additional assumptions introduced in the subsequent causal analysis subsection.
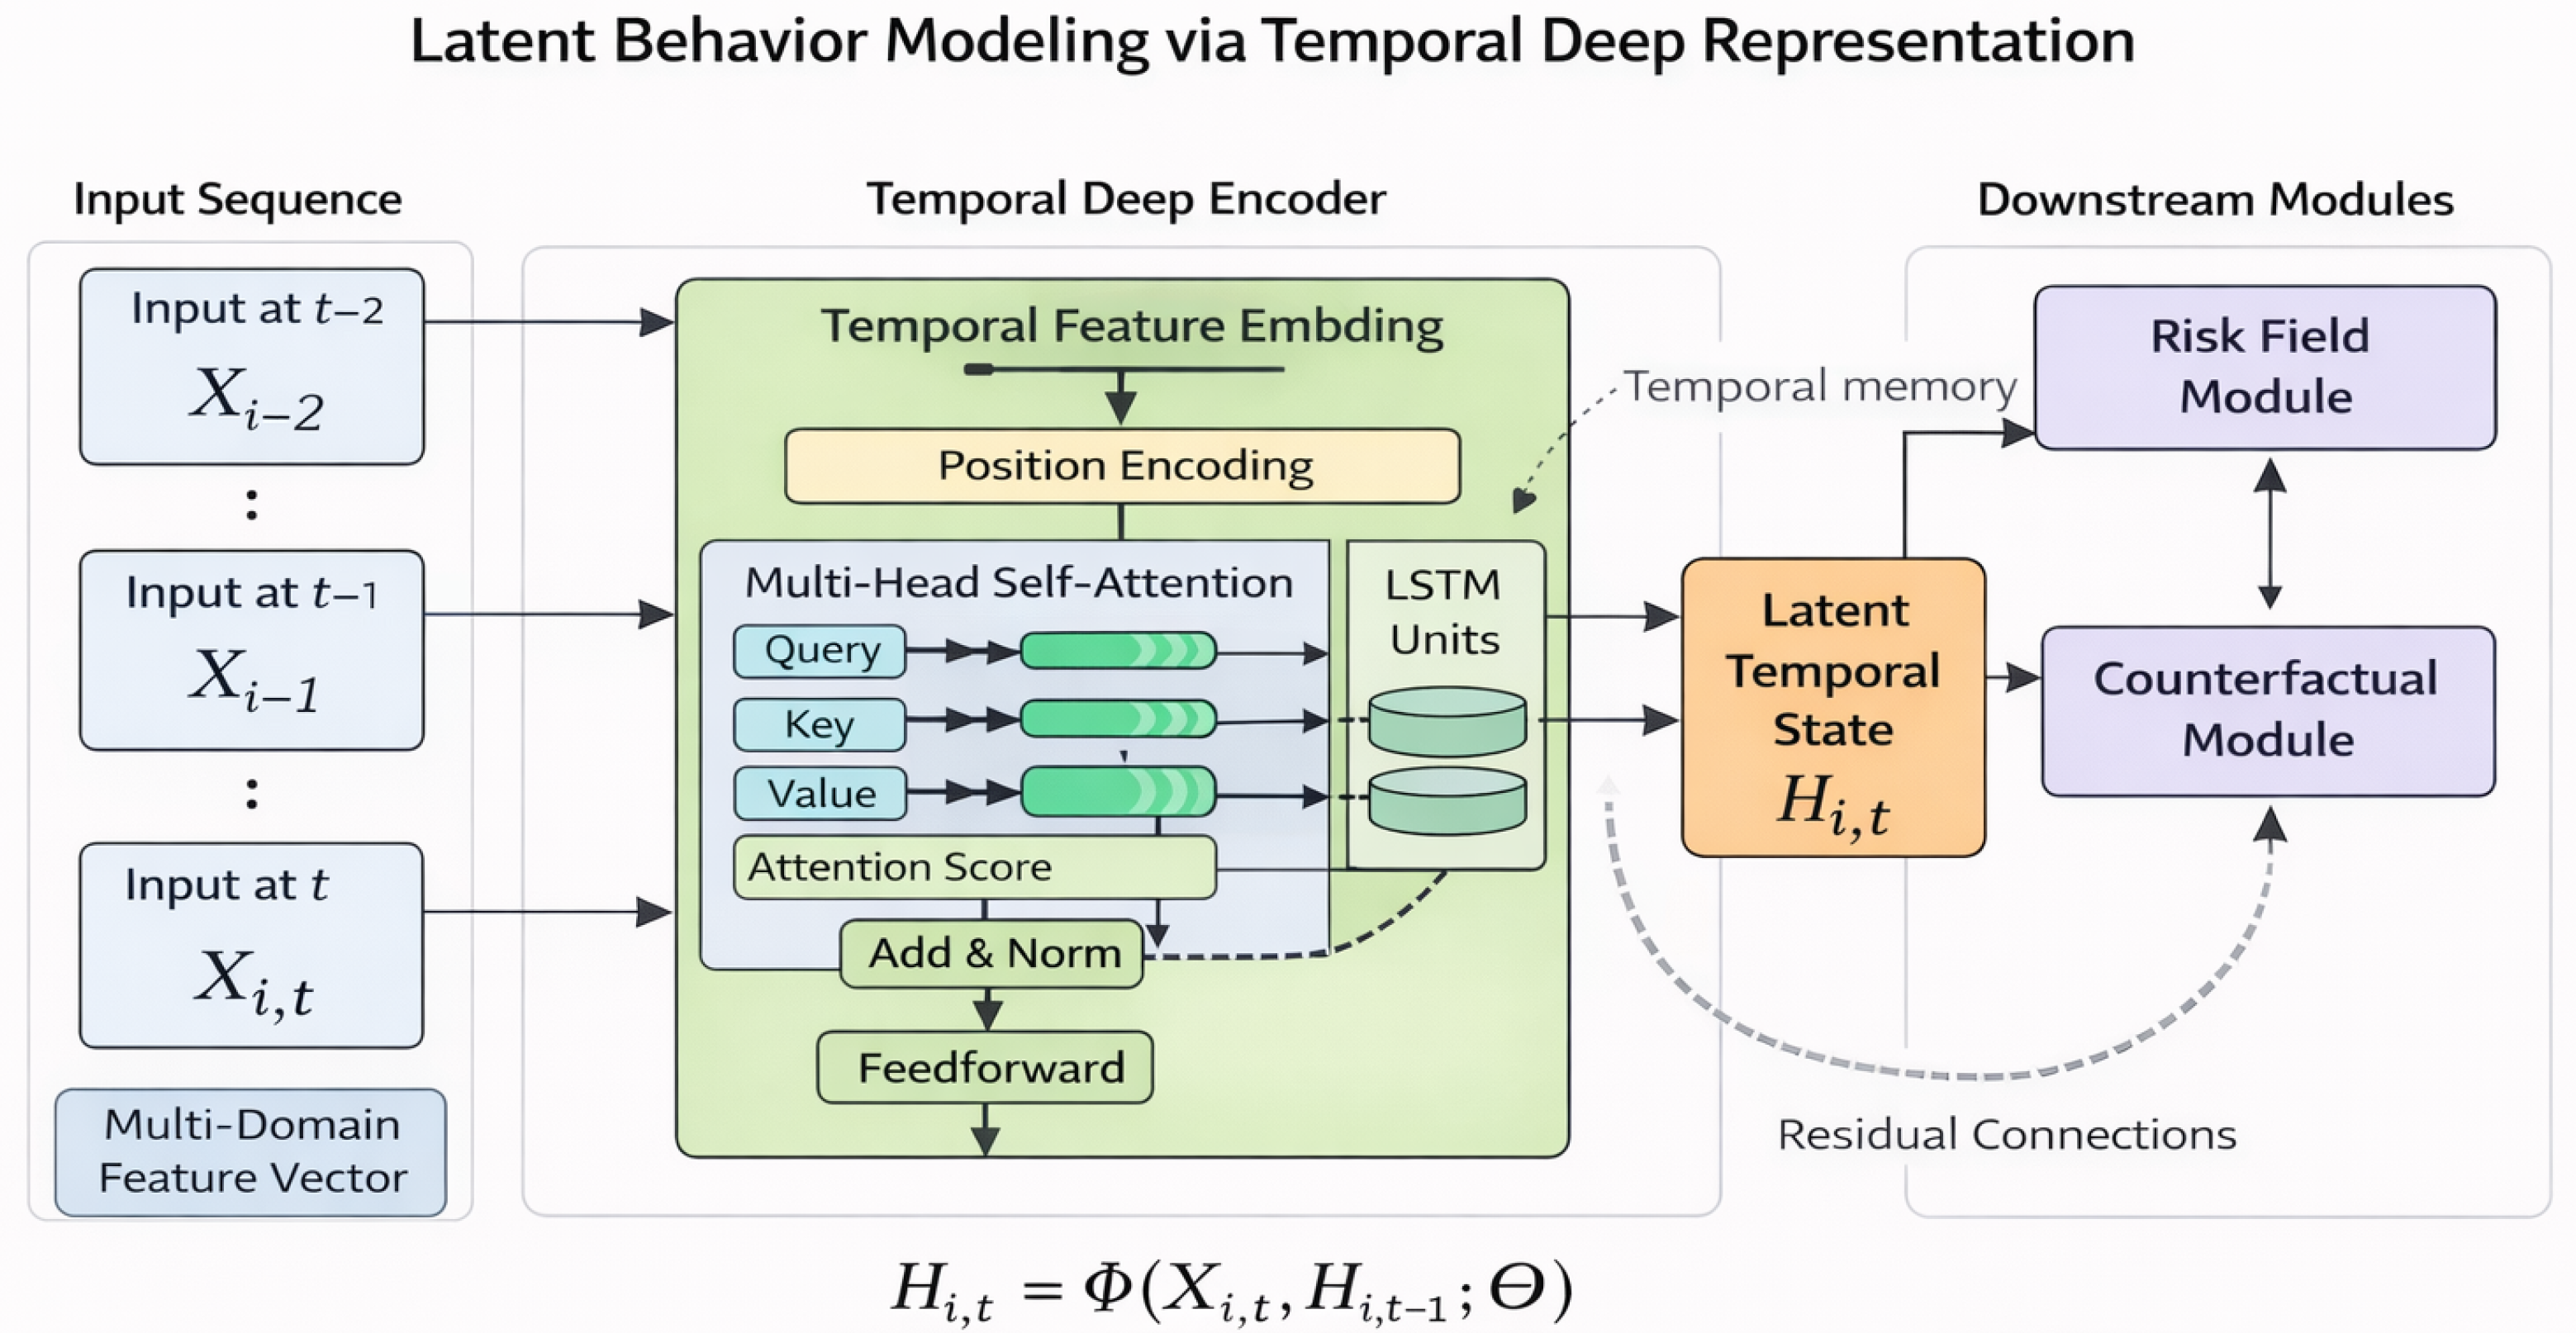
The architecture illustrated in
Figure 4 presents a comprehensive and hierarchical temporal representation framework designed to capture the complex, nonlinear dynamics of traffic systems through the integration of multi-domain sequential data. The input sequence of feature vectors
, which encapsulates heterogeneous information such as traffic flow, environmental conditions, and road attributes across consecutive time steps, is first projected into a latent embedding space augmented with positional encoding to preserve both semantic content and temporal ordering. The embedded sequence is then processed by a hybrid temporal deep encoder that combines multi-head self-attention and Long Short-Term Memory (LSTM) units, enabling the model to simultaneously capture long-range temporal dependencies and localized sequential patterns. Specifically, the attention mechanism leverages query–key–value interactions to dynamically assign importance weights to different time steps, identifying critical temporal events such as congestion peaks or abrupt disruptions, while the LSTM component maintains a memory state that models temporal continuity and gradual transitions in traffic conditions. The inclusion of residual connections, layer normalization, and feedforward transformations further enhances representation stability, learning efficiency, and model depth. The resulting latent temporal state
, defined in Equation (
3), provides a compact yet highly expressive embedding that encodes both short-term fluctuations and long-term behavioral trends. This latent representation is subsequently propagated to downstream modules, including the risk field estimation and counterfactual analysis components, establishing a unified pipeline that supports both predictive modeling and intervention-based reasoning. Consequently, the proposed architecture demonstrates a novel fusion of attention-based and recurrent paradigms, enabling scalable, interpretable, and high-fidelity modeling of spatio-temporal traffic behaviors within intelligent transportation systems.
3.5. Counterfactual Intervention Modeling
To move beyond passive prediction and enable actionable intelligence in intelligent transportation systems, this work introduces a counterfactual intervention modeling framework that explicitly simulates how traffic risk evolves under hypothetical changes in system conditions. Unlike conventional approaches that rely solely on observational correlations, the proposed framework formulates traffic accident prediction as a causally informed intervention-analysis problem, where the objective is to estimate how interventions on key variables—such as traffic density, environmental conditions, or road configurations—alter the underlying risk landscape. Specifically, we distinguish between a factual scenario, which reflects the observed system state, and a counterfactual scenario, which represents a hypothetical modification of one or more input variables. This formulation allows the model to answer critical “what-if” questions, such as how accident risk would change if congestion were reduced in high-risk regions or if adverse weather conditions were mitigated. By integrating counterfactual reasoning directly into the learning pipeline, the proposed approach transforms the model from a predictive tool into a decision-support system capable of guiding safety interventions.
To make the intervention structure explicit, let denote the observed covariates, including traffic flow, weather conditions, road attributes, and temporal variables; let denote the intervention or treatment variables selected for controlled modification; let denote the learned latent traffic-state representation; and let denote the resulting traffic-risk outcome. Under this formulation, the counterfactual module is intended to analyze how modeled changes in propagate through the learned traffic representation and affect the estimated risk field.
The proposed counterfactual mechanism operates on the learned latent temporal representation
, which encodes the dynamic behavior of the traffic system as defined in Equation (
3). Instead of directly manipulating raw input features, interventions are applied in the latent space to preserve the complex dependencies learned across temporal and spatial dimensions. This enables consistent and realistic simulation of system changes without violating underlying data distributions. Given the factual latent state
derived from observed inputs, a counterfactual latent state
is generated by modifying specific components associated with intervention variables, such as reducing congestion-related features or altering environmental embeddings. The modified latent state is then propagated through the risk field model (Equation (
2)) to estimate the resulting counterfactual risk distribution. This latent-space intervention strategy represents a key novelty of the proposed framework, as it allows for seamless integration between deep representation learning and intervention-oriented reasoning, enabling the model to capture both direct and indirect effects of modeled changes.
It is important to clarify that the latent intervention operator is not treated as an assumption-free substitute for real-world manipulation. Rather, it serves as a structured representation-level intervention mechanism in the learned state space, intended to approximate how modeled treatment changes propagate through the spatio-temporal system under the assumed causal formulation. Therefore, the resulting counterfactual quantities should be interpreted as model-based intervention simulations with causal meaning conditioned on the stated assumptions, rather than as universally identified causal effects in the strict experimental sense.
A critical advantage of the proposed formulation is its ability to model both local and global effects of interventions through the coupling of counterfactual reasoning with the spatio-temporal risk field. Local modifications in a specific region not only alter the risk at that location but also propagate through neighboring nodes via the diffusion dynamics defined in Equation (
2), resulting in a globally consistent adjustment of the risk landscape. This enables the framework to capture complex system-level responses, such as the redistribution of traffic flow following congestion mitigation or the emergence of new risk hotspots due to displaced traffic patterns. Furthermore, by quantifying the difference between factual and counterfactual risk distributions, the model provides a principled measure of intervention effectiveness, supporting optimal decision-making for traffic management and safety planning. Overall, this section establishes a novel paradigm in traffic accident modeling, where deep learning, spatio-temporal dynamics, and causally informed intervention analysis are unified to enable predictive, explanatory, and prescriptive analytics within a single framework.
where
denotes a counterfactual risk at location
i and time
t under the intervention on variable set
,
represents the intervened values, and
is the factual latent state. The function
defines a latent intervention operator that modifies the hidden representation in accordance with the imposed intervention, while
denotes a risk field mapping derived from Equation (
2). This formulation uses the do-operator as an SCM-inspired notation for modeled intervention analysis. Its causal interpretation depends on the assumptions specified in the subsequent subsection, including temporal ordering, consistency, positivity, and conditional ignorability with respect to the modeled intervention variables and observed covariates.
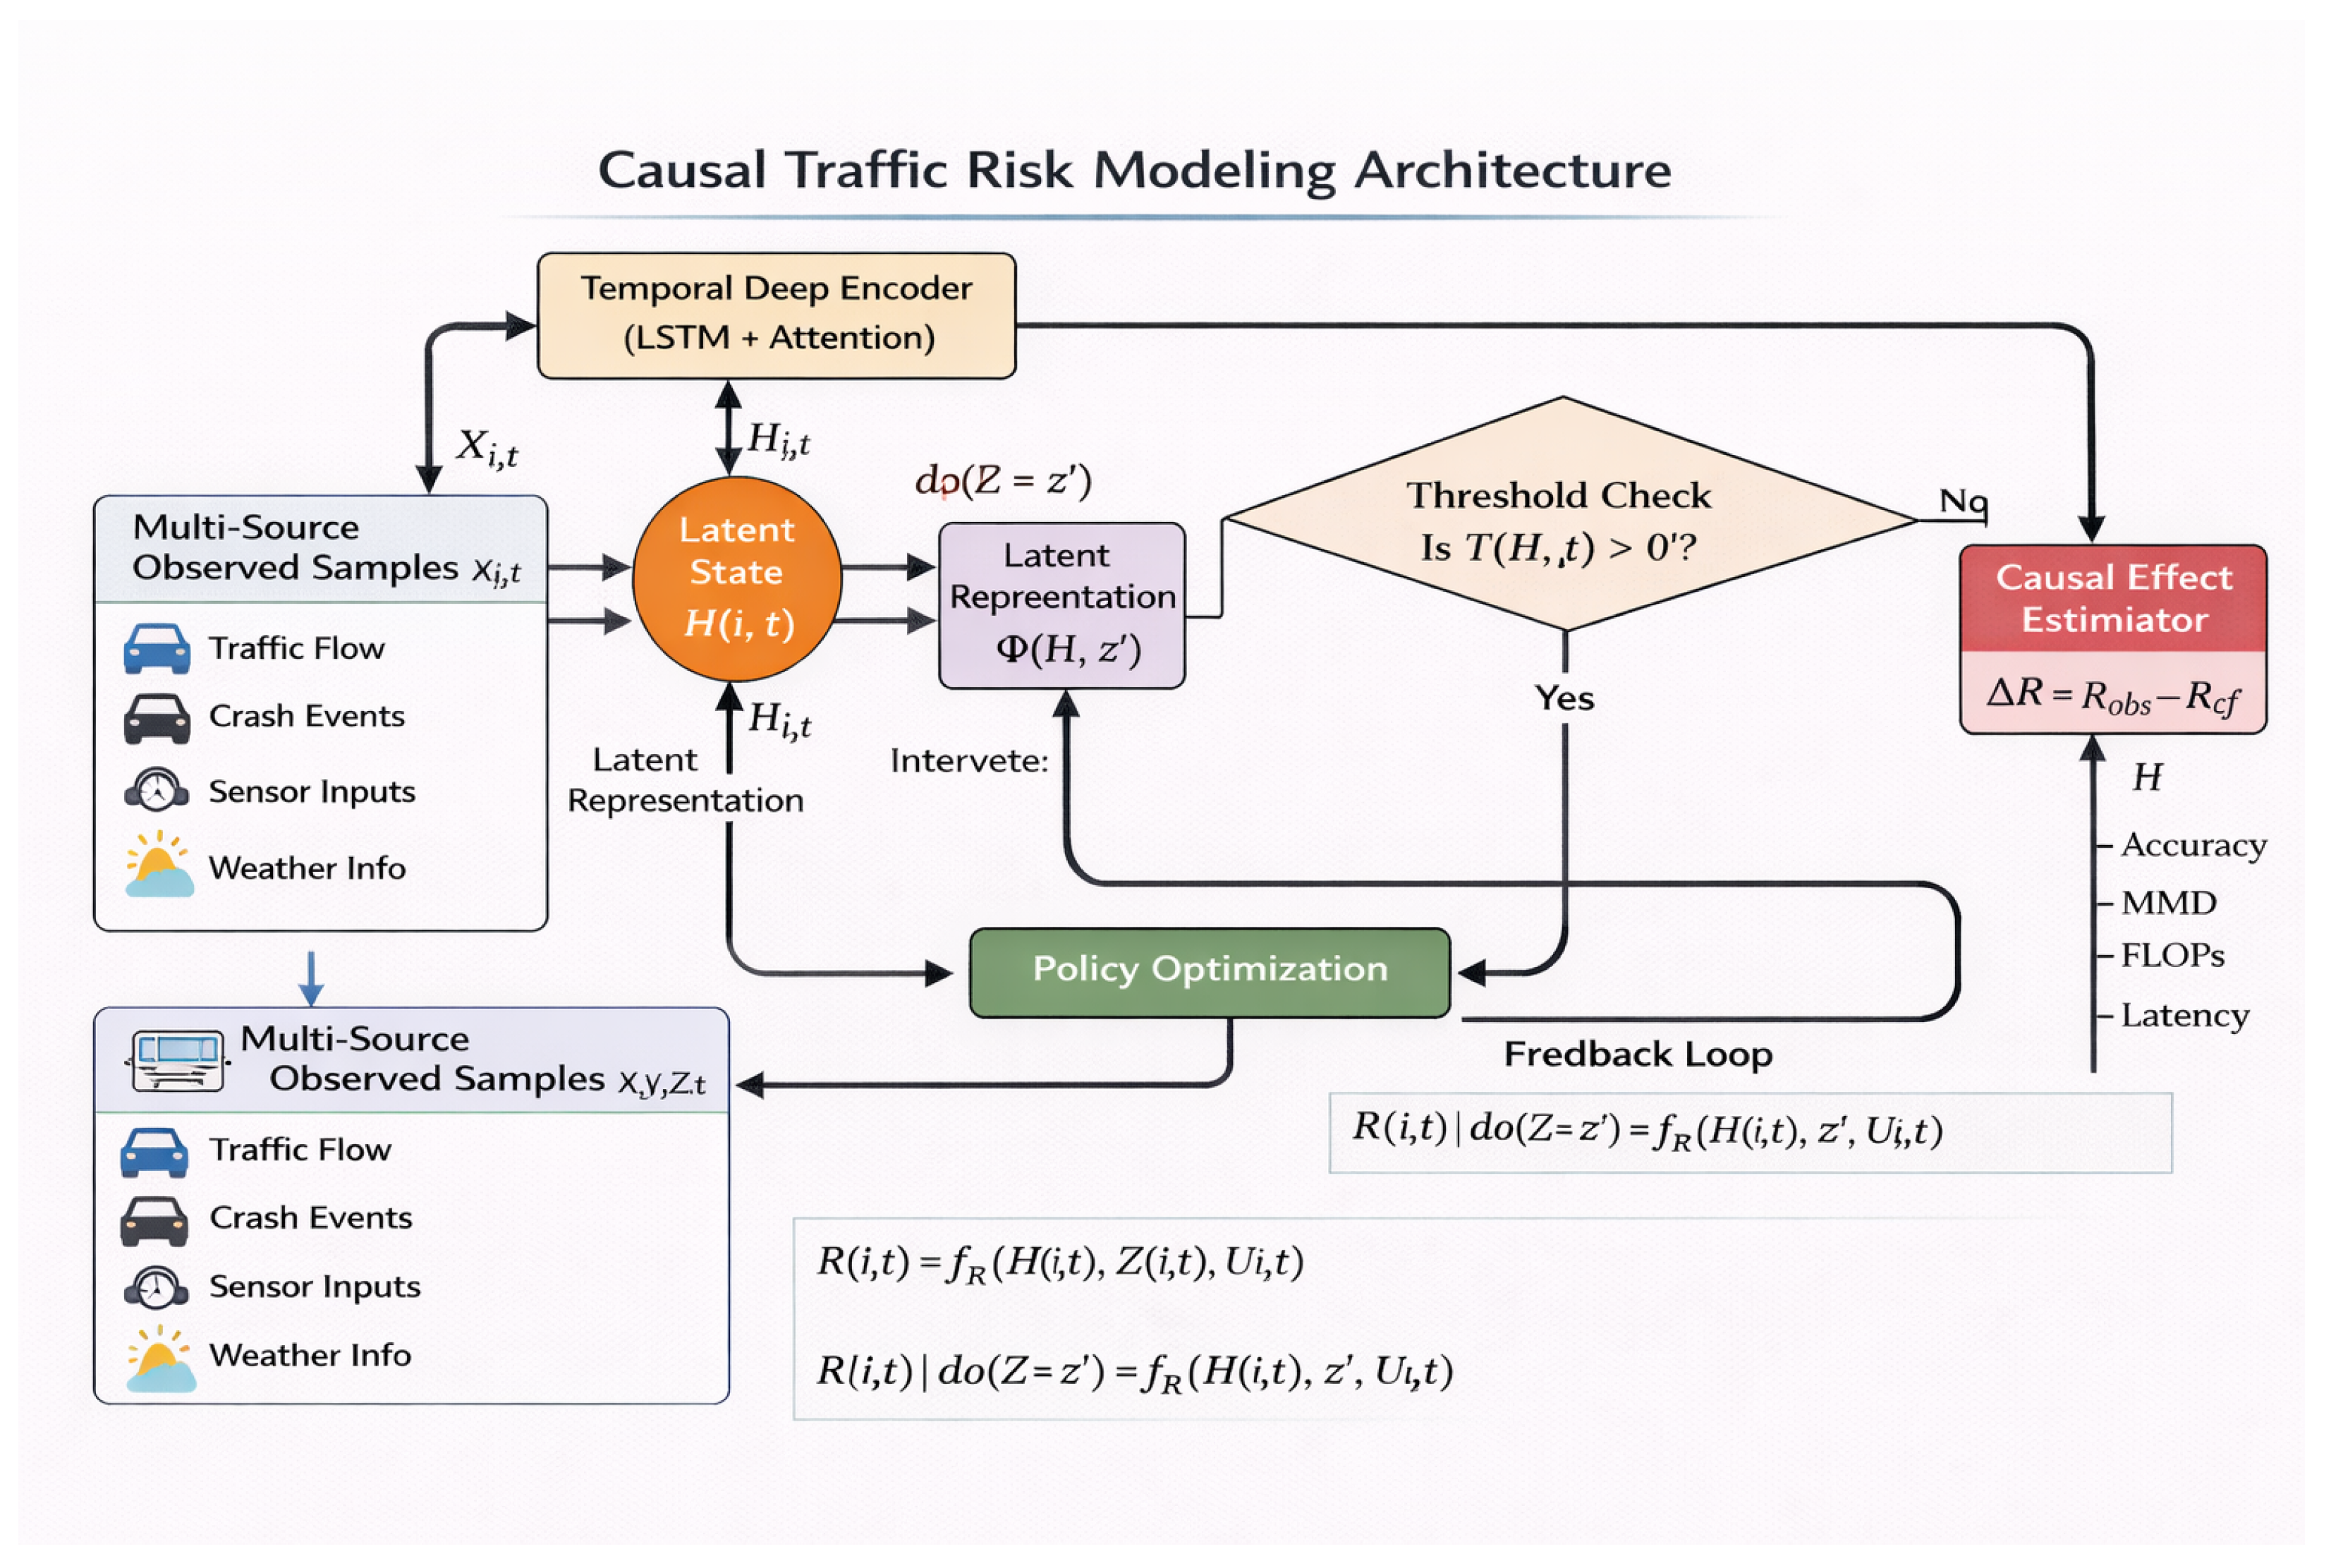
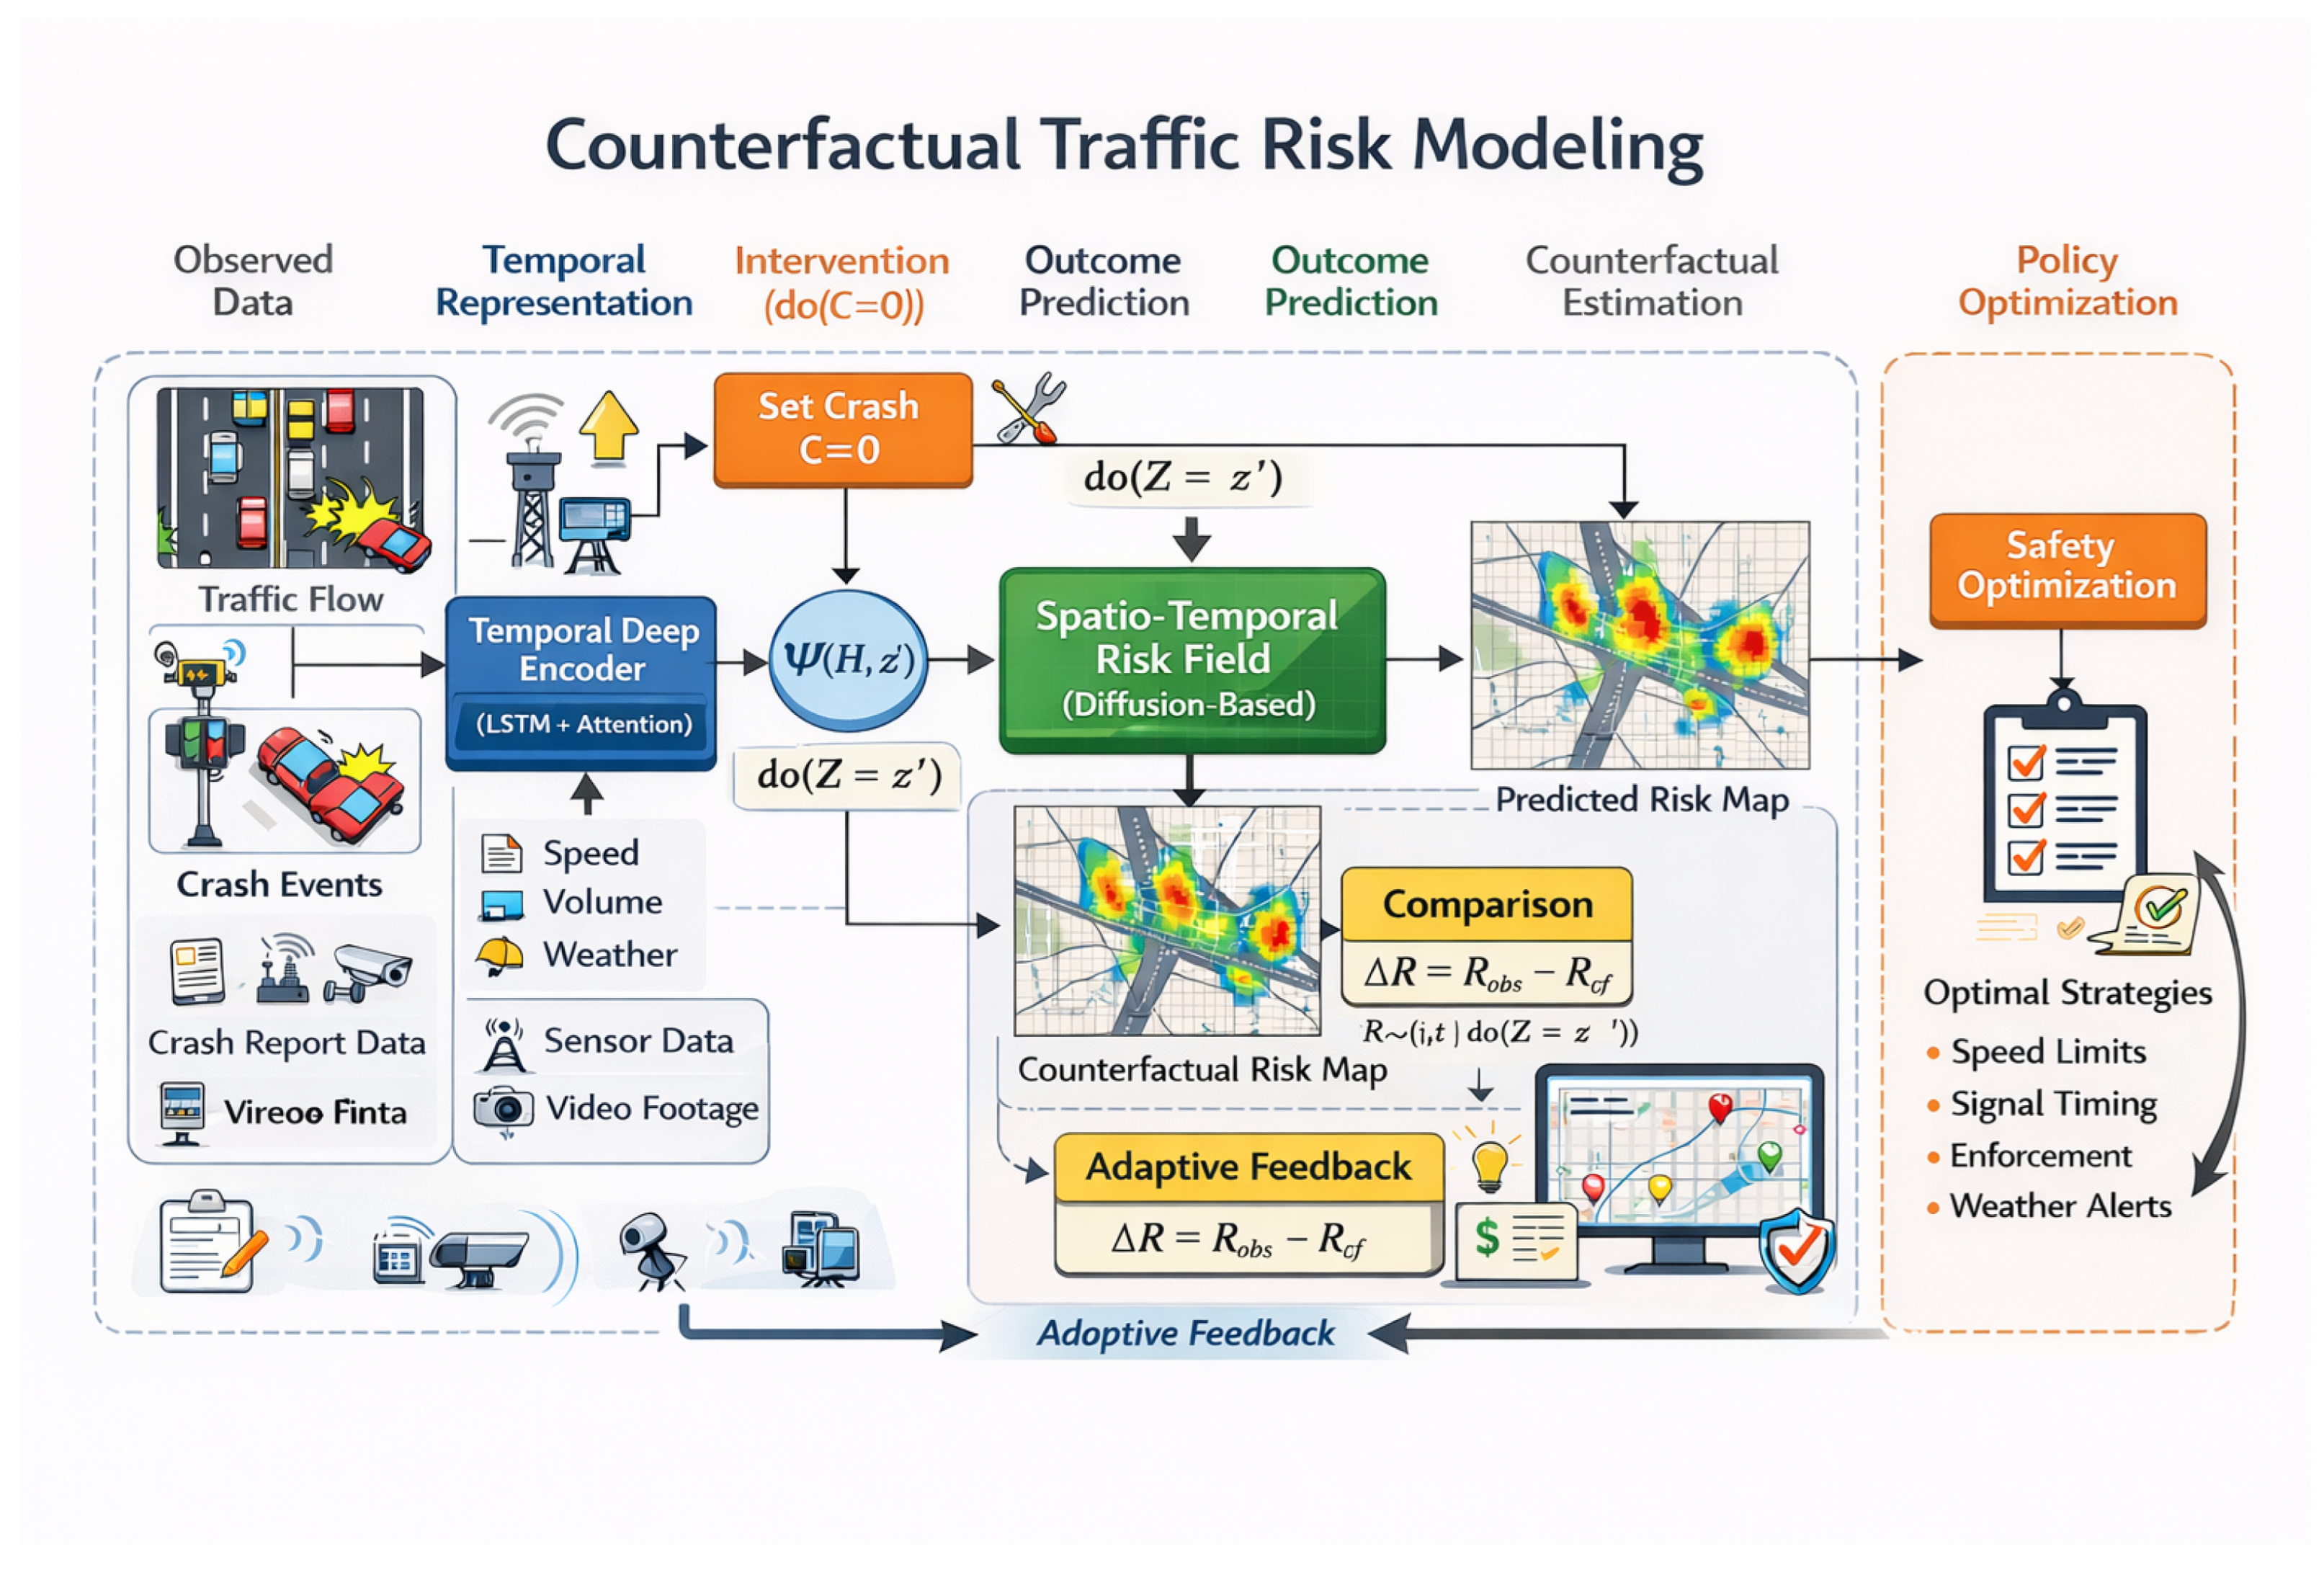
The enhanced counterfactual traffic risk modeling framework illustrated in
Figure 5 embodies a unified and deeply integrated architecture that explicitly operationalizes causal reasoning within a spatio-temporal deep learning paradigm. This framework begins with multi-source observed data, including traffic flow, crash events, sensor streams, and environmental conditions, which are transformed through a Temporal Deep Encoder (LSTM + Attention) to extract high-level temporal dependencies and contextual patterns. This encoded representation is mapped into a latent state
, serving as a compact abstraction of the system’s dynamic behavior. A core novelty of this framework is introduced through a latent intervention operator
, which enables controlled manipulation of the hidden state under a formal intervention specification, thereby preserving learned dependencies while simulating realistic hypothetical scenarios. The intervened latent state is propagated through a spatio-temporal risk field (diffusion-based), which captures both localized accident intensity and its spatial propagation across the transportation network, producing both factual and counterfactual risk maps. This explicit comparison module, quantified as
, provides a rigorous measure of intervention impact, enabling the identification of effective safety strategies. Furthermore, the inclusion of an adaptive feedback loop from policy optimization to the modeling pipeline introduces a self-improving mechanism, allowing the system to iteratively refine predictions and interventions based on observed outcomes. Collectively, this architecture represents a significant advancement over conventional approaches by tightly coupling deep temporal representation, latent-space intervention simulation, and diffusion-based risk modeling within a single coherent framework, enabling predictive, explanatory, and prescriptive analytics for intelligent transportation systems.
3.6. Causal Inference Integration for Safety Reasoning
While conventional traffic prediction models primarily rely on statistical correlations, such approaches are fundamentally limited in their ability to support decision-making, as they fail to distinguish between causation and spurious associations. In complex traffic environments, accident occurrence is governed by intricate cause–effect relationships among multiple interacting factors, including traffic density, driver behavior, environmental conditions, and infrastructure characteristics. To address these limitations, the proposed framework incorporates a causal inference layer that explicitly models the underlying generative mechanisms of traffic incidents. By transitioning from correlation-based learning to causality-driven reasoning, this framework enables the identification of more precise intervention targets, ensuring that recommended safety strategies produce reliable and interpretable outcomes. This causal perspective is essential for answering critical questions such as how modifying a specific variable—for example, reducing congestion or improving signal timing—directly impacts accident risk, rather than merely observing associated and potentially misleading patterns.
The causal structure of the traffic system is formally represented using a structural causal model (SCM), defined over a directed acyclic graph (DAG) where nodes correspond to variables and edges represent causal relationships. Let denote observed variables (traffic flow, weather, road conditions, and temporal context), denote the intervention variables, denote the latent temporal representation learned via the deep encoder, and denote the resulting risk field. In the intended causal graph, the observed covariates influence both the latent traffic state and the risk outcome, the intervention variables may affect the latent state and the final risk directly, and unobserved exogenous factors may affect both representation learning and risk generation. Conceptually, the main relations are represented as together with and . The SCM encodes the system dynamics through a set of structural equations that define how each variable is generated from its causal parents. Importantly, the latent representation acts as a mediator-like state that aggregates complex temporal dependencies, allowing the causal model to operate in a reduced yet expressive space. The integration of latent representations within the SCM constitutes a key novelty of this work, as it allows for causal reasoning over high-dimensional, temporally evolving traffic data without requiring explicit specification of all underlying dependencies. This hybrid formulation bridges deep learning and causal modeling, allowing the framework to capture both data-driven patterns and interpretable cause–effect mechanisms.
In this study, the intervention variables are intended to represent controllable or policy-relevant factors whose hypothetical modification is meaningful for safety analysis, such as traffic density regulation, signal-control adjustments, or selected contextual conditions that influence traffic behavior. The observed covariates serve as adjustment variables describing the surrounding traffic, road, and environmental state, whereas the exogenous terms and capture residual unobserved influences, including hidden behavioral or operational factors that are not explicitly measured. Under this formulation, the causal module does not claim that all confounding is fully eliminated; rather, it provides an SCM-guided approximation in which the major measured confounding structure is represented through the available observed variables.
Within this causal framework, interventions are formally defined using the do-operator, which simulates external manipulation of specific variables while isolating their modeled effect on the outcome. By applying , the model generates a counterfactual latent state that is propagated through the risk field to estimate the resulting accident risk under the modified conditions. This allows for the computation of intervention effects by comparing factual and counterfactual outcomes, thereby quantifying the estimated impact of potential safety interventions. Furthermore, the coupling of causal inference with the spatio-temporal risk field enables the model to capture both direct and indirect effects, including spatial propagation and temporal evolution of risk. This provides a powerful mechanism for safety reasoning, where the framework not only predicts where accidents are likely to occur but also explains why they occur and how they can be prevented.
The causal interpretation of the proposed intervention analysis is made under several standard assumptions. First, temporal ordering is assumed, meaning that the historical and contextual variables used to construct precede the predicted risk outcome. Second, consistency is assumed, such that the observed outcome under the realized intervention matches the corresponding potential outcome. Third, positivity is assumed, meaning that the intervention values under comparison are supported within the modeled data distribution. Fourth, conditional ignorability is assumed with respect to the modeled intervention variables and measured covariates, implying that the major confounding structure relevant to intervention comparison is captured by the available traffic, environmental, and road-context variables. These assumptions do not eliminate all limitations of observational data, but they provide the formal conditions under which the SCM-guided intervention analysis is interpreted.
It is further important to clarify the role of the latent intervention operator. In the proposed framework, the operator acting on
is not presented as an assumption-free replacement for physical intervention in the real world. Rather, it is used as a structured representation-level mechanism for simulating how modeled changes in
propagate through the learned spatio-temporal state. Accordingly, the resulting counterfactual quantities should be interpreted as model-based intervention estimates within the assumed SCM-guided representation rather than as universally identified experimental causal effects. This clarification is especially important because the learned latent state is a compact computational abstraction of the traffic system rather than a directly observable causal variable.
where
and
represent exogenous variables capturing unobserved factors,
and
are structural functions defining the temporal and risk-generating processes, respectively, and
quantifies the estimated intervention effect under the stated assumptions. This formulation enables the estimation of intervention impact while explicitly accounting for hidden confounders and temporal dependencies.
The enhanced architecture in
Figure 6 introduces a critical advancement by embedding a decision-theoretic condition within the causal inference pipeline, transforming the framework from a purely predictive system into an adaptive, policy-driven optimization engine. Specifically, the integration of the threshold-based condition
serves as a gating mechanism that dynamically regulates whether the latent intervention should propagate toward risk evaluation or be redirected for further optimization. This condition operates on the latent representation
, which encodes complex temporal dependencies learned through the LSTM-attention encoder, thereby ensuring that intervention decisions are not made on raw observations but on semantically rich and context-aware features. From a modeling perspective, this introduces a nonlinear control layer that selectively activates counterfactual reasoning only under high-risk or critical system states, significantly improving both computational efficiency and interpretability.
Furthermore, the conditional branch establishes a tight coupling between causal inference and policy optimization by introducing a feedback-aware decision boundary. When the condition is satisfied, the intervened latent representation
is forwarded to the causal effect estimator, where the differential risk
is computed, enabling quantitative assessment of intervention impact. Conversely, when the condition is not met, the system prioritizes stability and avoids unnecessary perturbations, redirecting the flow toward policy refinement. This mechanism effectively prevents over-intervention, a common limitation in conventional models, and aligns the framework with real-world traffic management constraints where interventions must be both necessary and cost-effective. Mathematically, this behavior can be interpreted as a conditional optimization process:
which governs the evolution of the system state under intervention.
The presence of this condition enhances the robustness and adaptivity of the entire framework by enabling context-sensitive decision-making across the spatio-temporal domain. The feedback loop connecting policy optimization to earlier stages ensures that the threshold and the function can be iteratively refined based on observed system performance, effectively learning when and where interventions yield maximal benefit. This elevates the framework from a static causal model to a self-regulating intelligent system capable of balancing predictive accuracy, intervention effectiveness, and operational cost. Consequently, the proposed architecture not only captures the modeled intervention dynamics of traffic risk but also embeds a principled mechanism for real-time decision control, representing a significant step toward deployable intelligent transportation systems.
Accordingly, the proposed framework is best interpreted as a causally informed and counterfactual-aware decision-support system. It provides a principled basis for intervention simulation, structured risk comparison, and policy-oriented safety reasoning while acknowledging that stronger real-world causal identification would require richer confounder measurement, external validation, or interventional data.
3.7. Hybrid Prediction–Intervention Neural Architecture
The proposed Hybrid Prediction–Intervention Neural Architecture (HPINA) represents a tightly integrated framework that unifies spatio-temporal prediction with causally informed intervention modeling to enable intelligent traffic risk analysis. The architecture consists of three principal components: (i) a Temporal Deep Encoder, (ii) a Risk Prediction Module, and (iii) a Counterfactual Intervention Module. These components are not introduced as parallel engineering additions; rather, they form a staged architecture in which each module operates on the representational output of the previous one. In this design, the encoder learns the latent traffic state, the prediction module converts that state into a risk-aware system representation, and the intervention module evaluates how that representation changes under modeled actions. The Temporal Deep Encoder, implemented using an LSTM combined with an attention mechanism, transforms multi-source inputs into a latent representation that captures both temporal dependencies and contextual relevance across traffic states. This stage is necessary because the raw heterogeneous observations do not directly provide a compact state description suitable for downstream intervention analysis. The resulting latent embedding is then passed to the Risk Prediction Module, where a nonlinear mapping function estimates the factual risk , incorporating both observed covariates and latent uncertainties . The predictor is designed to model complex interactions between traffic flow, environmental conditions, and historical crash patterns, producing high-resolution risk estimations over space and time. In functional terms, this module transforms the learned traffic state into a risk state that can be interpreted, propagated, and compared under alternative intervention scenarios.
The novelty of the architecture lies in the Counterfactual Intervention Module, which operates directly in the latent space to simulate hypothetical scenarios through the intervention operator under an SCM-guided intervention formulation . This module generates an intervened latent state , which is subsequently fed into the same risk function to compute the counterfactual risk . Its role is not redundant with prediction: while the factual predictor estimates the current risk state, the intervention module estimates the directional sensitivity of that state to modeled actions. This distinction is central to the framework’s design, because safety-oriented decision-making requires not only knowing the level of risk, but also understanding how that risk is expected to change under plausible interventions. The interaction between the predictor and intervention modules is governed by a conditional mechanism , ensuring that interventions are applied selectively based on system criticality. The difference quantifies the estimated intervention effect and guides the Policy Optimization module, which iteratively refines model parameters and intervention strategies via a feedback loop. This gate–policy interaction provides the final decision layer of HPINA: the gate determines when intervention reasoning is warranted, and the policy layer determines which modeled intervention is most beneficial under the current latent system state. This bidirectional interaction between prediction and intervention enables the architecture to move beyond passive risk estimation toward active and adaptive traffic safety optimization.
From a system perspective, the overall architecture should therefore be interpreted as a sequence of non-redundant operators acting on progressively richer representations of the traffic system. The temporal encoder compresses heterogeneous observations into a learned state, the risk module lifts that state into a safety-oriented representation, the counterfactual module perturbs the modeled intervention variables to estimate response, the gate controls whether intervention reasoning is activated, and the policy layer converts estimated intervention benefit into adaptive action refinement. This explicit dependency chain is what unifies the framework theoretically and functionally. Accordingly, HPINA is not intended as a collection of appended popular modules, but as a hierarchical architecture in which each stage solves a distinct modeling problem that is not addressed by the others.
Algorithm 1 defines an end-to-end iterative learning framework that integrates temporal representation learning, risk-state construction, causal intervention, and policy optimization for traffic risk modeling. For each epoch and mini-batch sampled from the dataset
, the algorithm first extracts sequential inputs
and encodes them via the deep temporal encoder to obtain the latent state
, which captures spatio-temporal dependencies. This latent representation is then used to estimate the factual risk
conditioned on observed covariates. A conditional decision mechanism
governs whether counterfactual intervention is applied; if satisfied, an intervention
is sampled from the policy
and used to generate the intervened latent state
, otherwise the original state is retained. The algorithm then computes the counterfactual risk
and derives the causal effect
, which quantifies the estimated impact of the modeled intervention. To capture spatial dependencies, the factual risk is propagated over the traffic graph
using edge weights
to construct the spatio-temporal risk field
. At this stage, the framework moves from local node-wise prediction to network-level risk organization, which is the key representation required for subsequent system-level decision support. The model is trained using a composite loss
that balances prediction accuracy, counterfactual consistency, and regularization, and parameters
are updated via gradient descent with learning rate
. In parallel, the intervention policy is optimized to maximize the expected discounted cumulative causal gain
, establishing a feedback loop between prediction and decision-making. After completing all epochs, the algorithm outputs the optimized parameters
and
along with the factual and counterfactual risk estimates and their corresponding causal effects, enabling both accurate prediction and actionable intervention analysis.,
Table 2 represents the parameterization of the hybrid prediction–intervention neural architecture.
| Algorithm 1: Hybrid Prediction–Intervention Framework for Causal Traffic Risk Modeling |
- Require:
Dataset , graph with weights , parameters , intervention policy , threshold , learning rate , loss weights , discount factor , epochs E - Ensure:
Optimized parameters , policy , factual risk , counterfactual risk , and causal effect - 1:
Initialize and - 2:
for to E do - 3:
for each batch do - 4:
for each sample do - 5:
// Temporal Deep Representation - 6:
Extract sequential window - 7:
- 8:
// Factual Risk Estimation - 9:
- 10:
// Conditional Counterfactual Intervention - 11:
if then - 12:
Sample intervention - 13:
- 14:
else - 15:
- 16:
- 17:
// Counterfactual Risk Estimation - 18:
- 19:
// Causal Effect Computation - 20:
- 21:
// Spatio-Temporal Risk Field Propagation - 22:
for each node do - 23:
- 24:
// Loss Construction - 25:
Compute prediction loss from and y - 26:
Compute counterfactual consistency loss from - 27:
Compute regularization loss - 28:
- 29:
// Parameter Update - 30:
- 31:
// Policy Update - 32:
- 33:
Set and - 34:
return
|
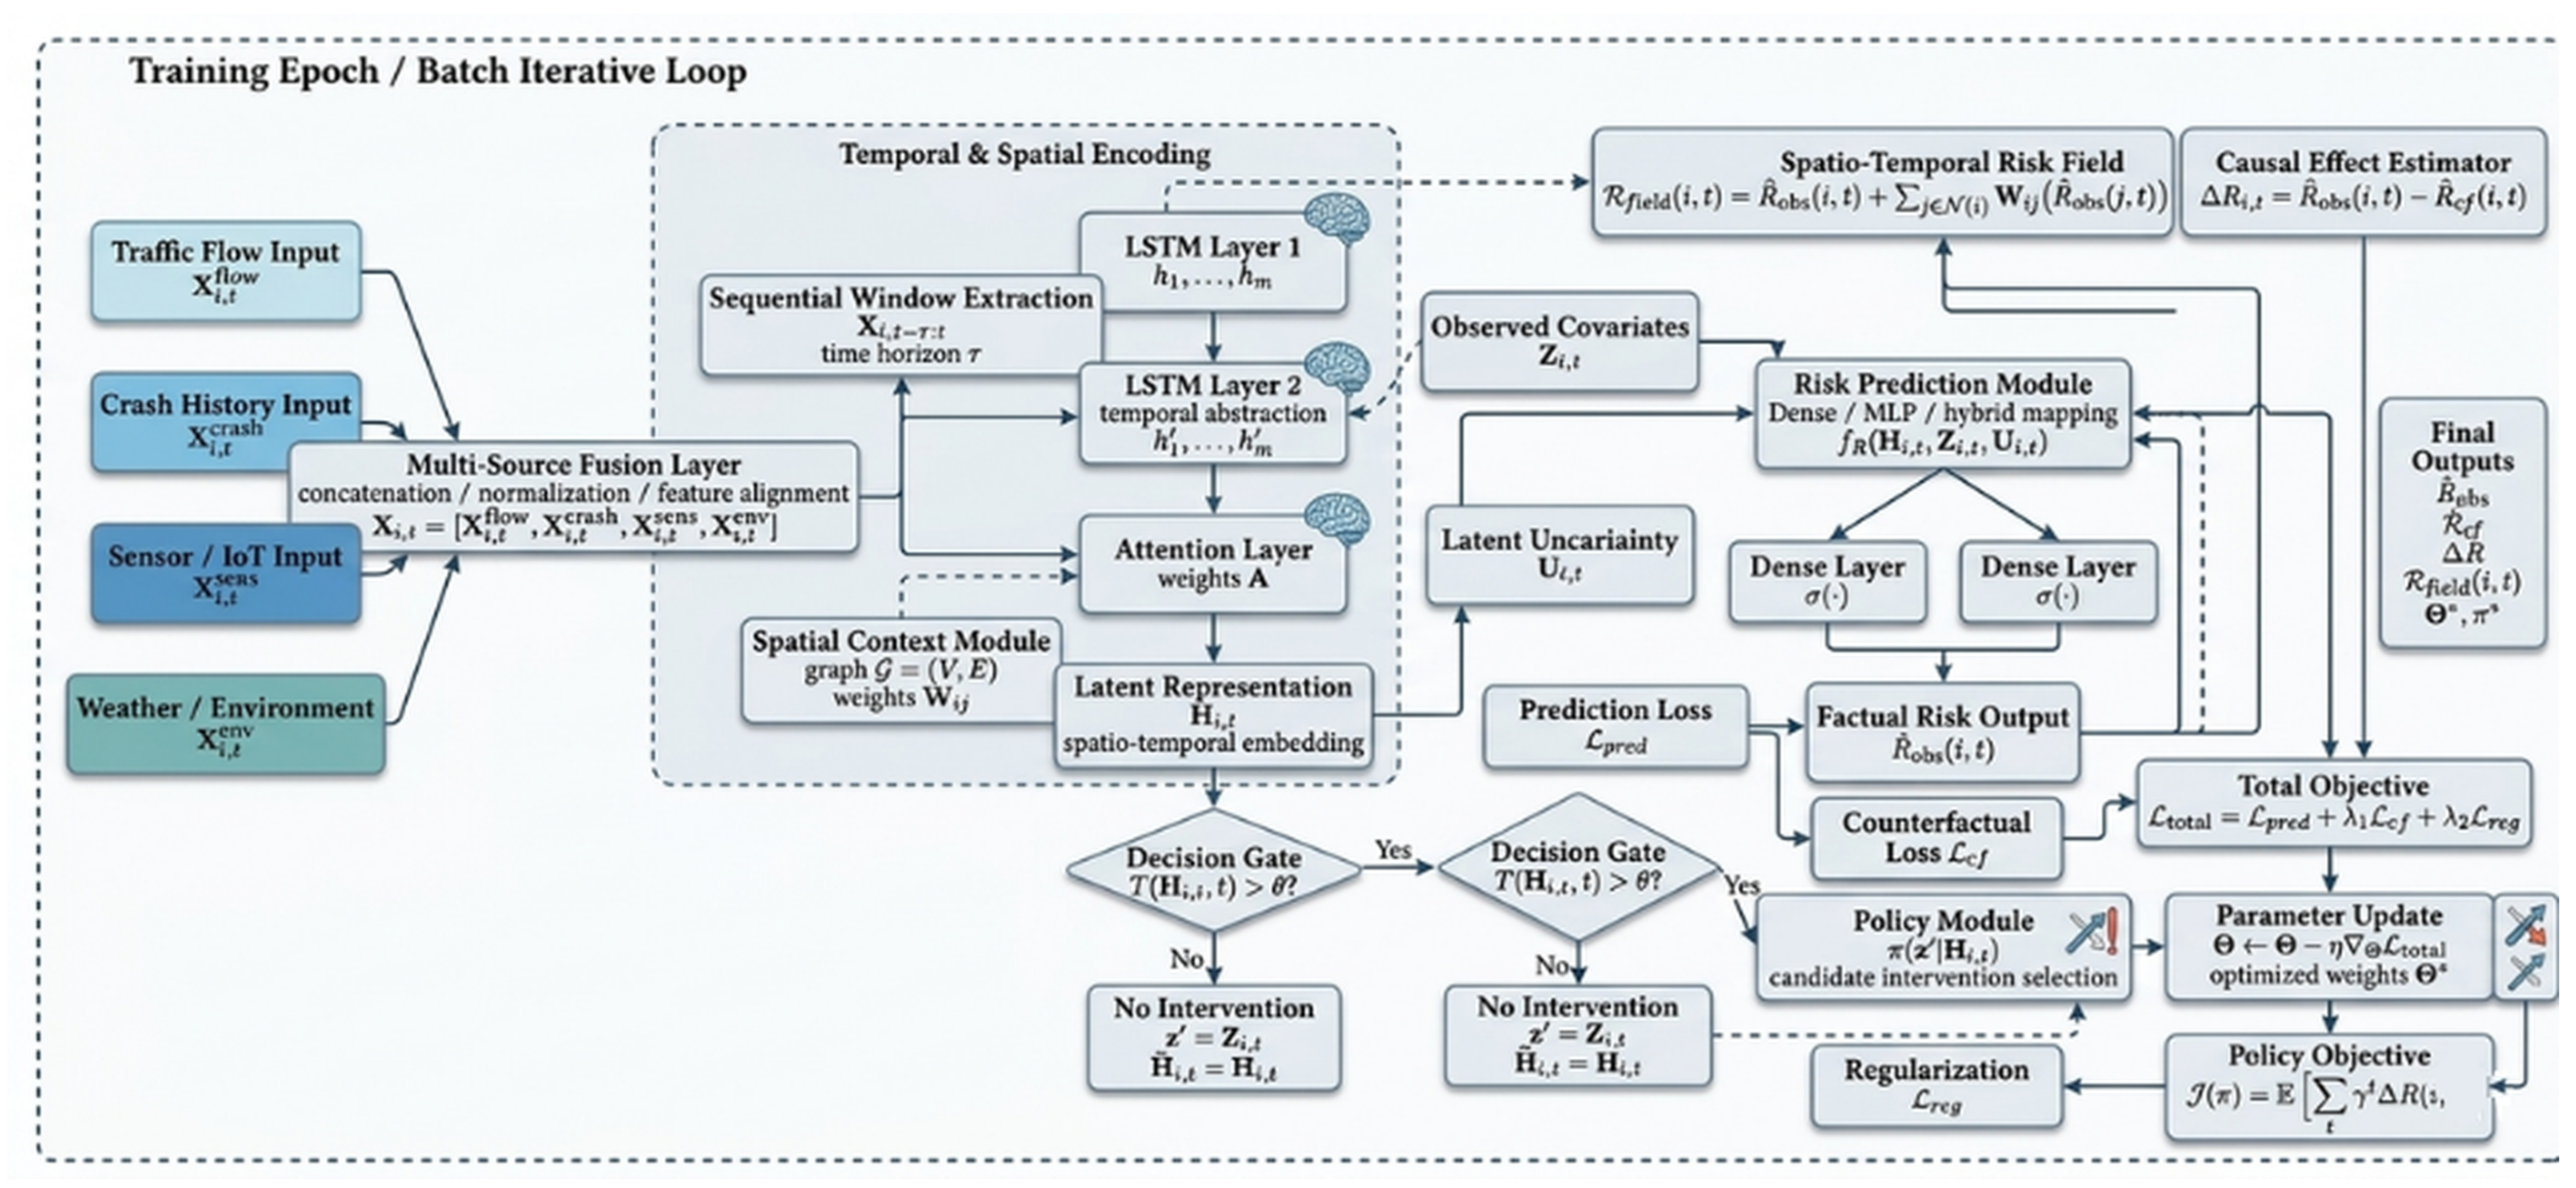
Figure 7 presents a comprehensive and tightly integrated framework that unifies heterogeneous data fusion, temporal representation learning, spatial modeling, and causal inference into a single pipeline for traffic risk analysis. The model begins with multi-source inputs, including traffic flow, crash history, IoT sensor streams, and environmental conditions, which are combined through a multi-source fusion layer responsible for normalization, alignment, and feature integration. This unified representation is processed along two complementary dimensions: temporally, through sequential window extraction over the defined horizon
, and spatially, via the graph-based module
with edge weights
capturing inter-node dependencies. These representations are encoded using stacked LSTM layers that progressively capture temporal dependencies, followed by an attention mechanism that assigns weights
to the most informative temporal features. The resulting latent representation
encapsulates spatio-temporal dynamics and contextual relevance. This embedding is then combined with observed covariates
and latent uncertainty variables
and passed through a nonlinear risk prediction module composed of dense layers with activation functions
, producing the factual risk estimate
. Furthermore, the architecture models spatial diffusion effects through the spatio-temporal risk field
, which propagates risk across neighboring nodes and enhances the representation of network-level interactions. This sequential flow clarifies the framework logic: representation learning first compresses the observed system state, and the risk field then reorganizes that state into a network-aware safety representation suitable for intervention reasoning.
A key contribution of the architecture lies in its causal intervention mechanism, which enables the system to move beyond passive prediction toward actionable decision-making. This process is governed by the decision gate defined by , which selectively activates intervention under critical conditions. When triggered, the policy module generates candidate interventions that are applied through the intervention operator to produce the intervened latent state ; otherwise, the system follows the no-intervention path where and . This modified representation is then used within the counterfactual risk module to estimate the hypothetical risk under altered conditions. The causal effect is quantified as , serving as a critical signal for both evaluation and optimization. The learning process is guided by a composite objective function , which integrates prediction accuracy, counterfactual consistency, and regularization, and is optimized via gradient-based updates . In parallel, the policy optimization objective drives the selection of effective interventions, forming a feedback loop between prediction and decision-making. The final outputs include , , , the propagated risk field, and the optimized parameters and policy , demonstrating that the framework supports adaptive, data-driven traffic safety optimization grounded in structured intervention reasoning. Taken together, the figure demonstrates that HPINA is not a conceptual stacking of independent modules, but a dependency-ordered architecture in which each stage transforms the system representation into a form required by the next stage.
3.8. Experimental Configurations and Ablation Design
The proposed Hybrid Prediction-Intervention Neural Architecture (HPINA), a structured set of twenty experimental configurations, was designed, as detailed in
Table 3, covering an full spectrum of model complexities, architectural components, and learning strategies. The experimental pipeline begins with classical machine learning baselines (E01–E03), including linear regression with L2 regularization, random forest with controlled tree depth and subsampling, and shallow MLP architectures, all operating on the same multi-domain input space to establish reference performance under non-sequential modeling assumptions. This was followed by temporal deep learning configurations (E04–E06), where sequential dependencies were explicitly modeled using LSTM networks of varying capacity (from single-layer 64-unit to multi-layer 128-unit structures) and Transformer encoders with different numbers of attention heads and layers, enabling the capture of both local temporal continuity and global temporal interactions. These models serve as critical stepping stones toward a full HPINA design by progressively enriching the representation space from static features to dynamic latent embeddings
.
The core experimental block (E07–E14) systematically evaluates the internal components of HPINA by introducing and isolating its key modules. Specifically, E07 removes the counterfactual intervention operator to assess the pure predictive capability of the Temporal Encoder, while E08 and E09 were activate a full latent intervention mechanism with increasing model capacity, including wider hidden layers and higher attention complexity. Variants E10–E12 investigate the role of a decision gate , comparing always-on intervention, strict thresholding, and soft adaptive gating, thereby quantifying the importance of selective causal activation. Additionally, E13 and E14 examine the contribution of the spatio-temporal risk field by removing graph diffusion entirely or introducing controlled diffusion strength through weighted adjacency propagation, effectively capturing how risk propagates across spatially connected nodes. The final group of experiments (E15–E20) focuses on ablation and optimization at both data and decision levels, where domain-specific inputs (traffic-only, environment-only, and their combinations) are evaluated to measure feature importance, while advanced configurations integrate counterfactual consistency constraints, reinforcement learning-based policy optimization with discount factor , and a complete HPINA pipeline with all modules jointly trained. Across all configurations, systematic variations in hyperparameters—including hidden dimensions (64 to 256), attention heads (2 to 8), learning rates ( to ), batch sizes (64 to 128), epochs (40 to 120), and dropout ratios (0.2 to 0.4)—were introduced to ensure robustness, prevent overfitting, and enable a fair comparison of architectural trade-offs. This comprehensive and hierarchical design not only isolates the contribution of each module but also demonstrates how their integration leads to a unified framework capable of accurate prediction, causal reasoning, and optimal intervention in intelligent transportation systems.
3.9. System Implementation and Infrastructure Integration
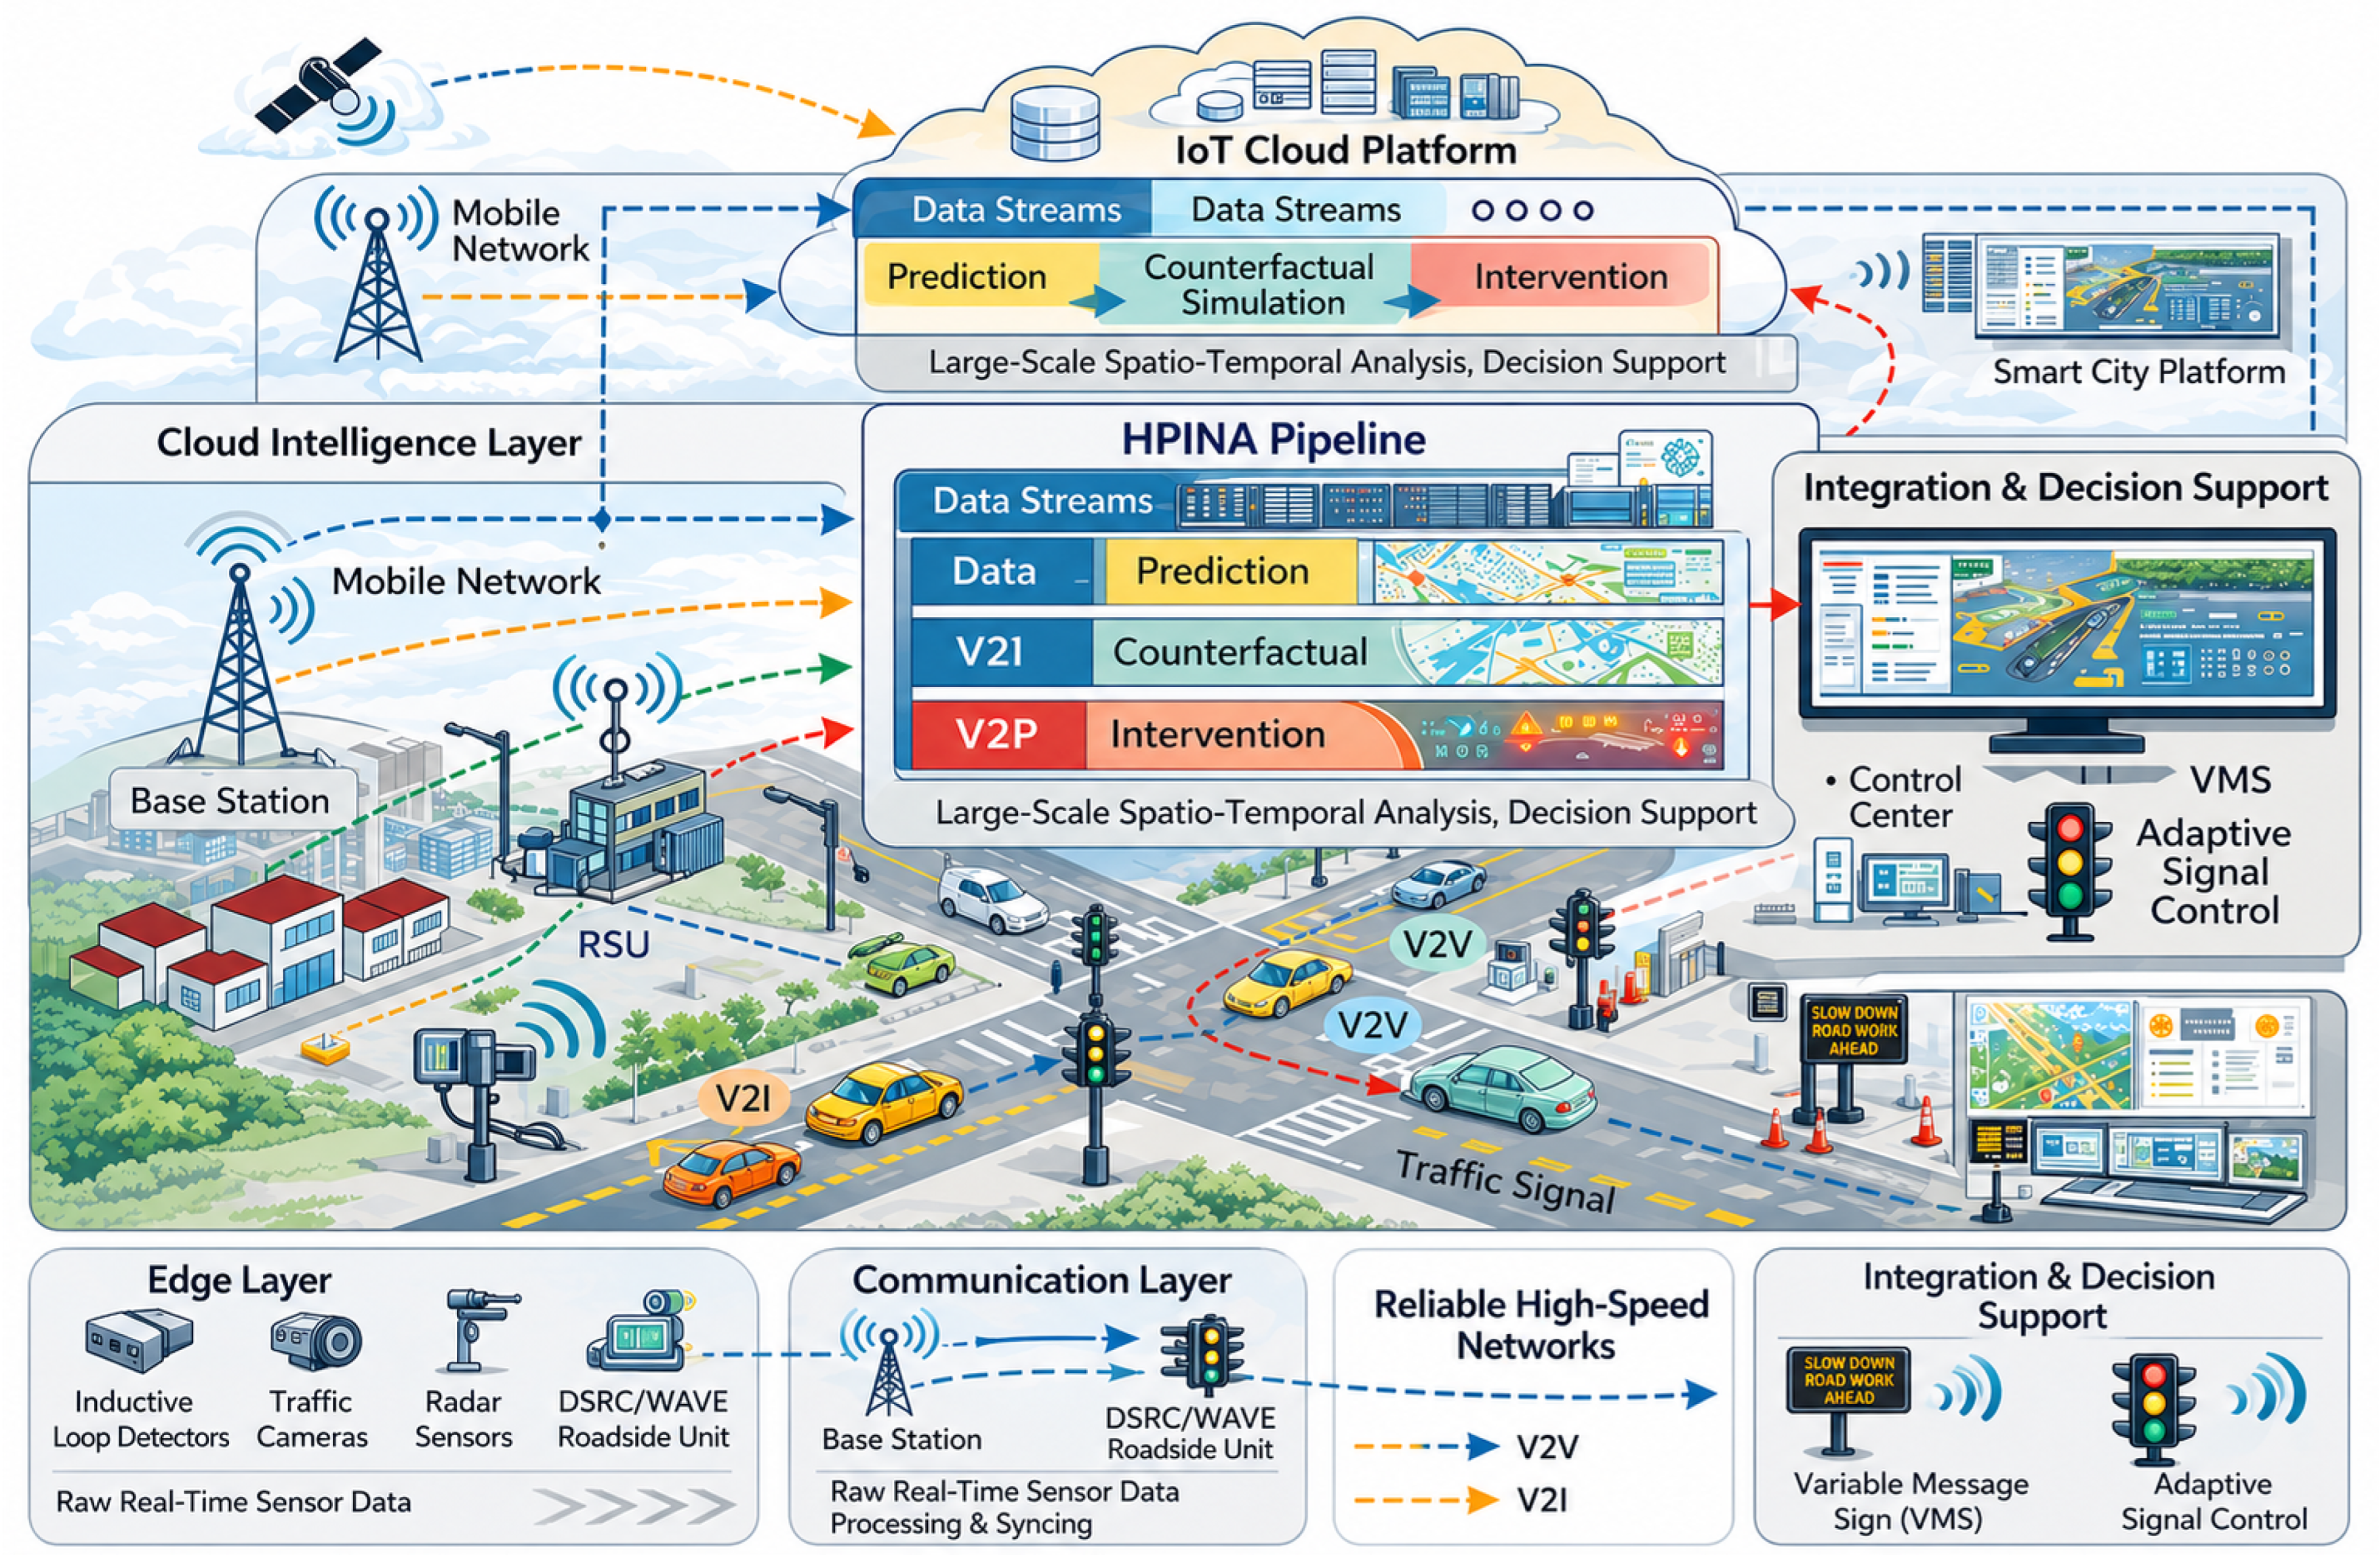
Figure 8 illustrates the proposed system-level realization of the Hybrid Prediction–Intervention Neural Architecture (HPINA) within a multi-layer intelligent transportation ecosystem. The figure depicts a tightly coupled cyber–physical architecture in which heterogeneous sensing elements at the road level (e.g., inductive loops, surveillance cameras, radar units, and roadside units (RSUs)) continuously capture real-time traffic states and propagate them through a hierarchical pipeline comprising edge processing, communication networks, and cloud-based intelligence. The lower layer of the figure represents the edge layer, where raw sensory data are locally filtered, synchronized, and transformed into structured feature representations. These processed streams are then transmitted via reliable high-speed communication channels (e.g., 5G and DSRC/WAVE) to the cloud intelligence layer, where the HPINA pipeline operates. At the core of the architecture, the perception–prediction–counterfactual–intervention loop is visually represented, highlighting how data streams are converted into predictive insights and subsequently into actionable intervention strategies. The right-hand side of the figure further demonstrates the integration with smart city platforms, including traffic control centers, adaptive signal controllers, and variable message signs, thereby closing the loop between data-driven inference and real-world actuation.
From an infrastructure perspective, the proposed system is designed to seamlessly integrate with existing traffic sensing technologies while preserving spatial and temporal consistency across distributed nodes. Each physical sensing unit is mapped to a corresponding node in the transportation graph , ensuring that real-world observations are directly aligned with the model’s internal spatio-temporal representation. This mapping enables the system to capture fine-grained traffic dynamics, including localized congestion patterns, vehicle interactions, and environmental variations. The incorporation of V2X communication further enriches the data space by enabling direct vehicle-to-vehicle (V2V), vehicle-to-infrastructure (V2I), and vehicle-to-pedestrian (V2P) information exchange. By fusing infrastructure-based sensing with cooperative vehicular communication, the system achieves a comprehensive and high-resolution view of the traffic environment, which is essential for accurate risk modeling and proactive decision-making.
The operational workflow of HPINA is structured as a continuous closed-loop process that integrates perception, prediction, and intervention within a unified computational framework. Incoming data streams are first encoded into feature tensors and processed by the Temporal Encoder to generate latent embeddings that capture both short-term dynamics and long-range temporal dependencies. These embeddings are subsequently fed into the spatio-temporal risk field module, which estimates the factual risk distribution across the network. When the decision function is triggered, the counterfactual module is activated to simulate alternative intervention scenarios in the latent space. The resulting causal effect is quantitatively evaluated to identify the most effective strategy for mitigating risk. This mechanism enables the system to move beyond passive prediction toward active and adaptive intervention, thereby transforming the infrastructure into a proactive safety-oriented system capable of responding to evolving traffic conditions in real time.
The comprehensive mapping presented in
Table 4 provides a detailed system-level perspective that highlights the tightly coupled interaction between sensing, communication, intelligence, and actuation layers within the HPINA deployment framework. From an analytical standpoint, the table reveals that the architecture is not merely a sequential processing pipeline but a distributed, latency-aware system in which each layer operates under distinct computational and operational constraints while contributing to a unified closed-loop objective. At the edge layer, the emphasis on ultra-low-latency processing and noise-resilient feature extraction ensures that raw heterogeneous data are transformed into temporally consistent representations
, which form the critical foundation for downstream inference. The communication layer further plays a non-trivial role by guaranteeing reliable and QoS-aware data transmission, effectively acting as a stabilizing bridge that preserves the integrity and timeliness of information flow across geographically distributed nodes. Within the cloud intelligence layer, the hierarchical progression from temporal encoding to multi-domain fusion and spatio-temporal risk modeling demonstrates a structured abstraction of traffic dynamics, culminating in the counterfactual module
, which introduces causal reasoning as a key differentiator from conventional predictive systems. This integration of causal inference enables the explicit quantification of intervention impact through
, thereby transforming the system from a passive predictor into an active decision-making entity. Moreover, the decision and actuation layers illustrate how model outputs are operationalized within real-world infrastructure, where strict response-time constraints and human-in-the-loop considerations must be satisfied. the inclusion of system-level properties such as scalability and closed-loop feedback underscores the robustness and adaptability of the architecture, ensuring that performance is maintained as the network size and data complexity grow. Overall, the table substantiates that HPINA achieves a coherent balance between computational efficiency, real-time responsiveness, and causal intelligence, positioning it as a practically deployable and theoretically advanced solution for next-generation intelligent transportation systems.
4. Discussion, Results, and Comparison
This section presents a discussion and analysis of the experimental results to evaluate the effectiveness of the proposed HPINA framework in comparison with representative baseline models. The analysis focuses on multiple evaluation dimensions, including predictive performance, convergence behavior, computational efficiency, and scalability. The quantitative results are examined through detailed tables and visualizations to highlight the performance gains achieved by HPINA, particularly in terms of accuracy, F1-score, and generalization capability. This section investigates the efficiency–complexity trade-offs to demonstrate how the proposed architecture balances improved performance with acceptable computational overhead. Special attention is given to the contribution of key components, including multi-domain feature fusion, spatio-temporal risk modeling, and the counterfactual reinforcement module, in driving the observed improvements. Through this analysis, this section aims to provide a clear and rigorous validation of the proposed approach while emphasizing its novelty and practical applicability in intelligent transportation systems.
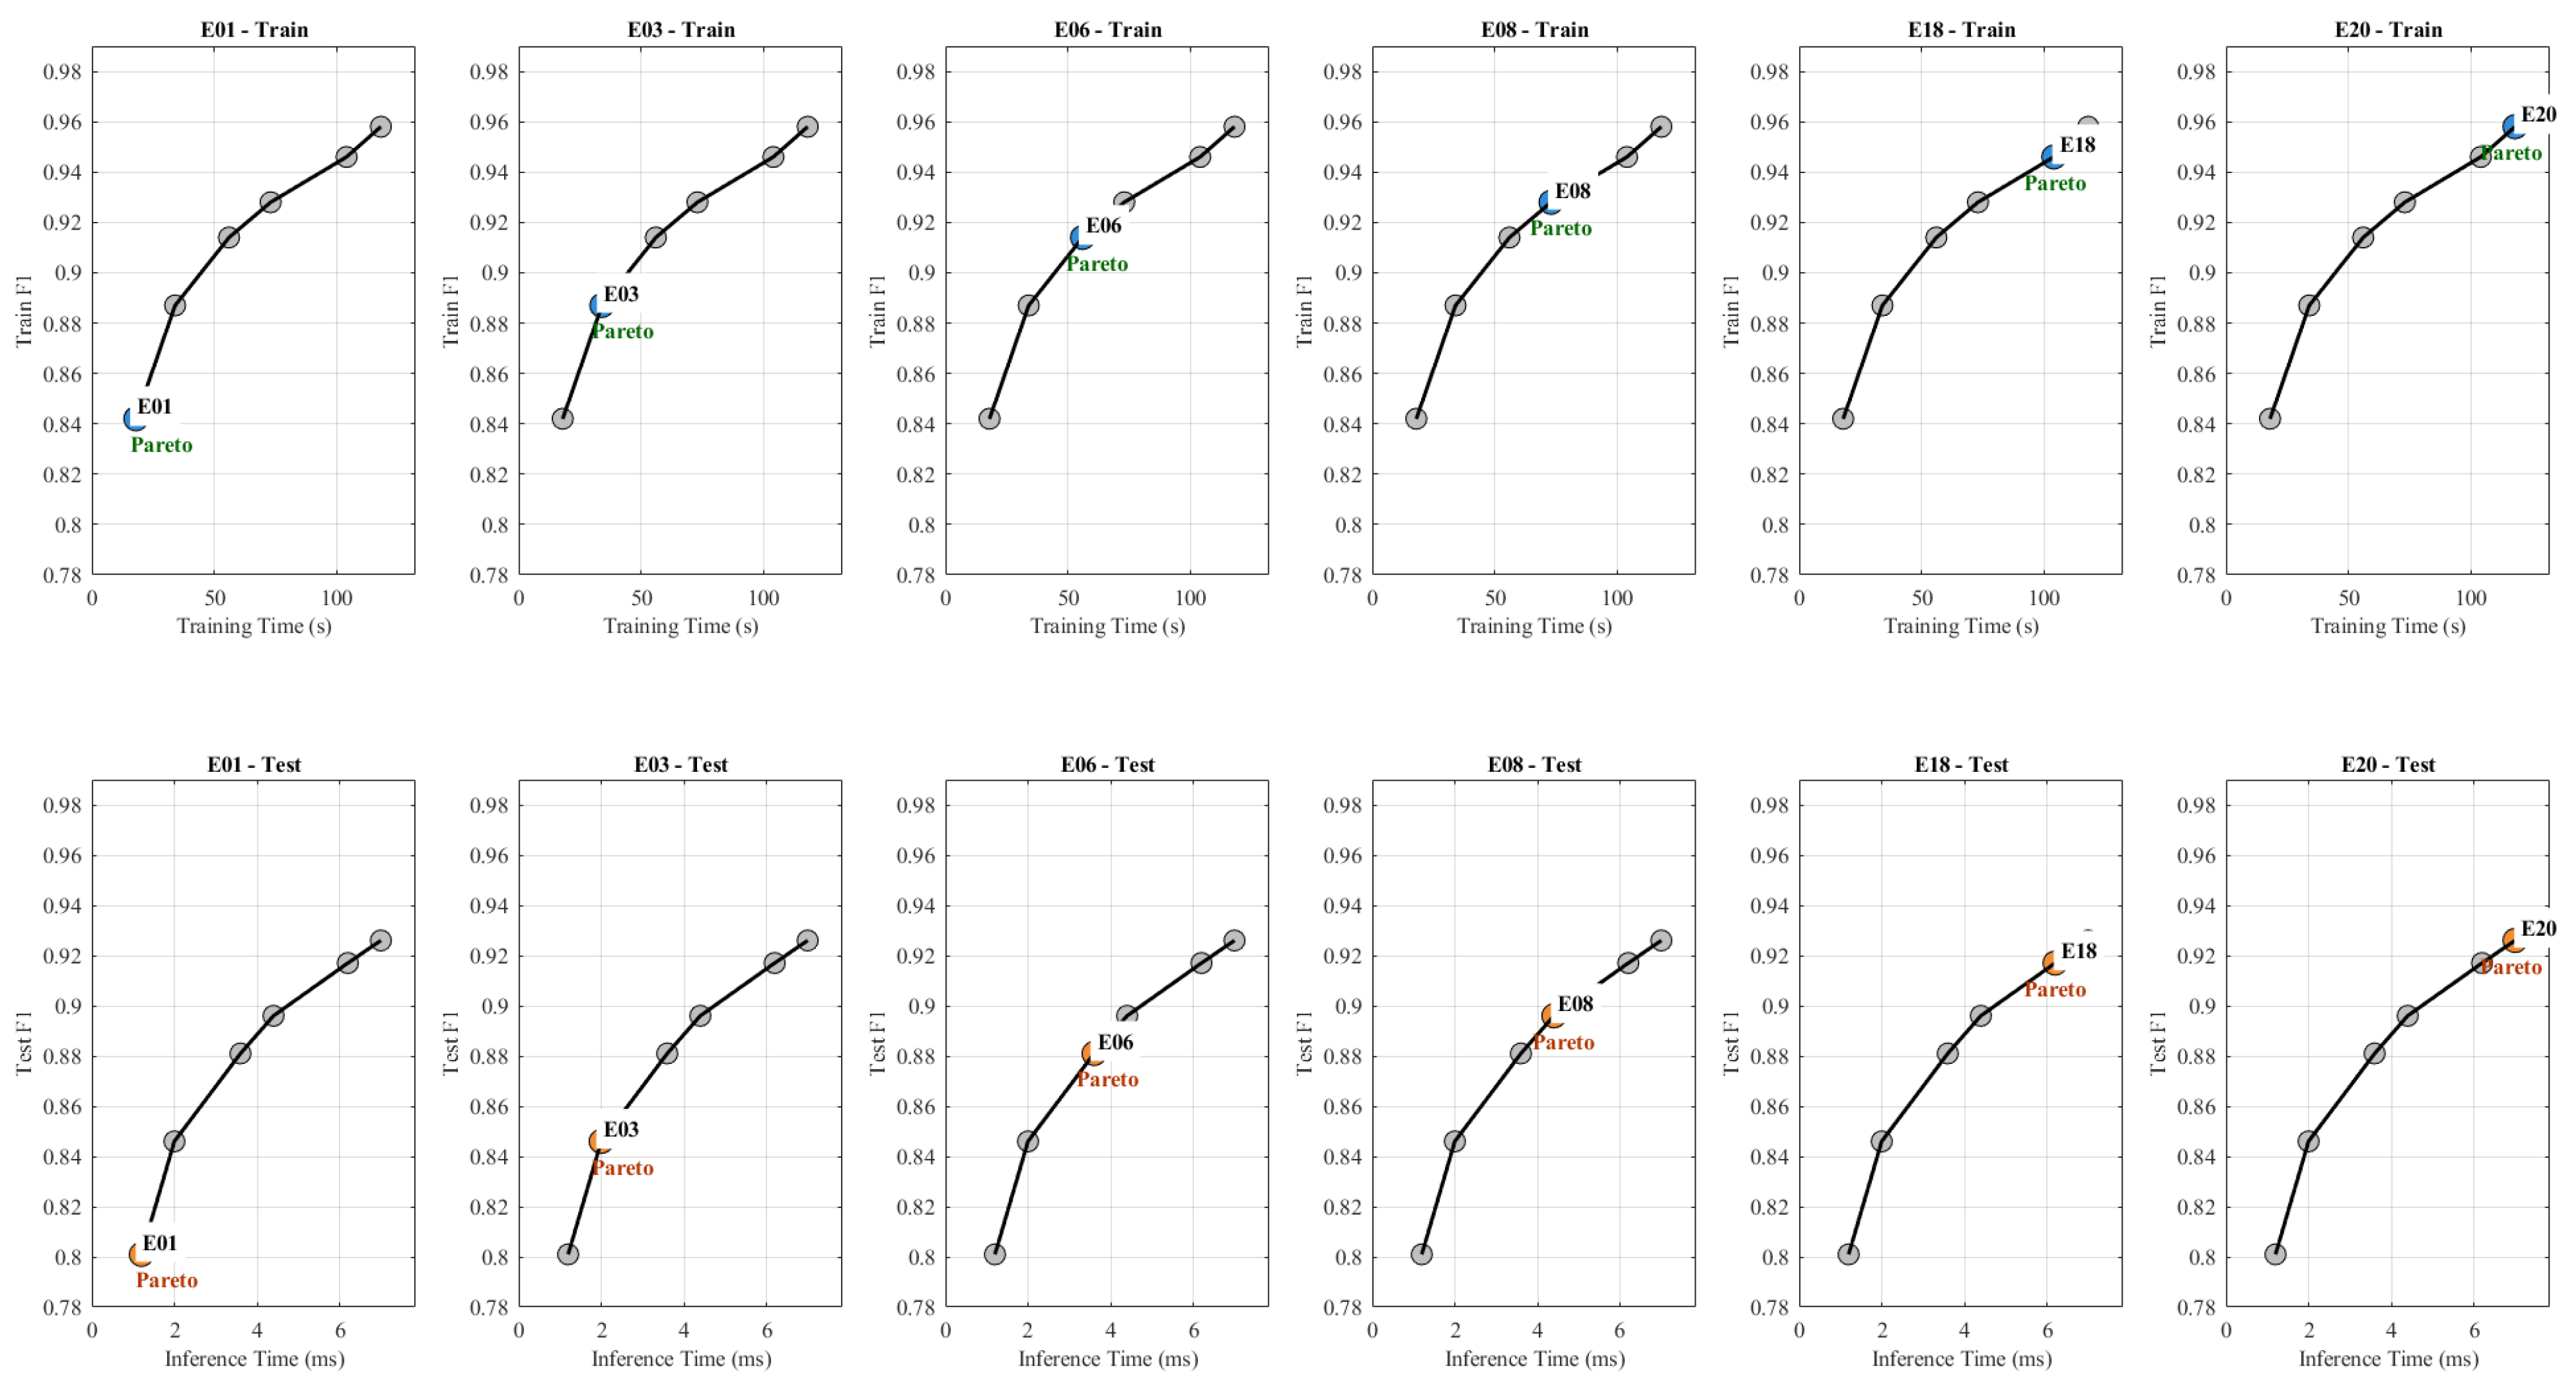
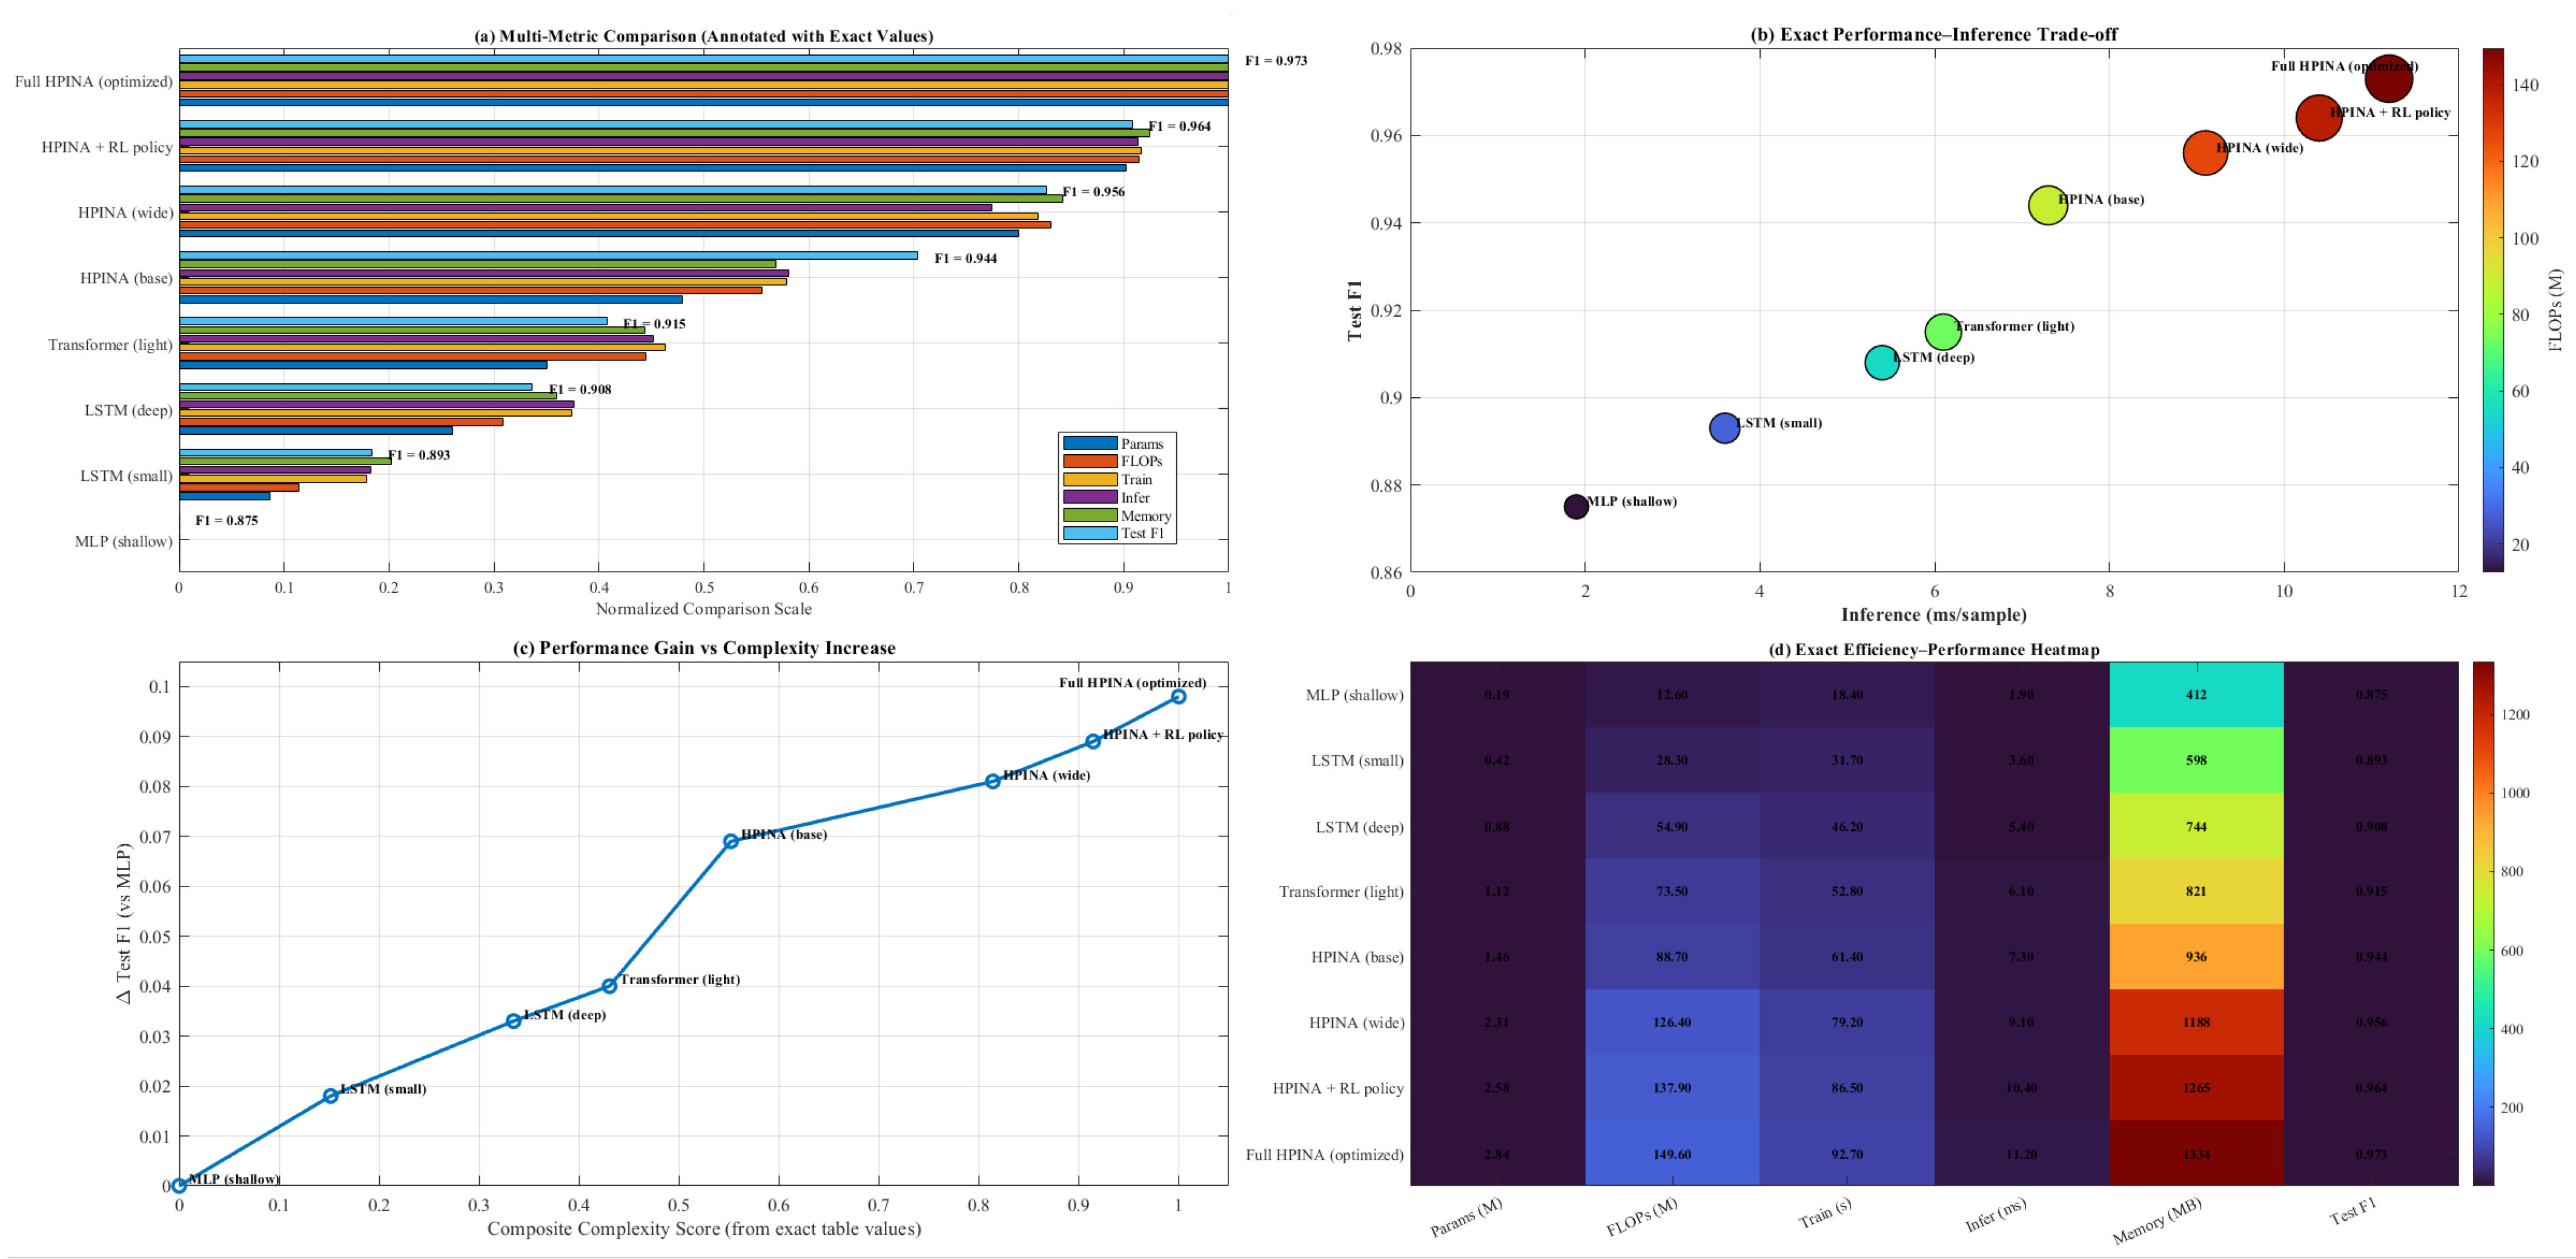
Table 5 presents a comprehensive and highly detailed evaluation of the predictive performance of all experimental configurations across both training and testing stages, clearly highlighting a progressive and continuous improvement achieved by incorporating advanced architectural components. At a baseline level, traditional models such as linear regression (e01) achieve a modest test F1-score of 0.828 with a test RMSE of 0.238, indicating limited capability in capturing nonlinear and temporal dependencies inherent in traffic systems. Ensemble and shallow neural approaches, including random forest (e02) and mlp (e03), improve performance to test F1 values of 0.861 and 0.875, respectively, while reducing RMSE to 0.211 and 0.198, reflecting better handling of feature interactions and moderate nonlinear patterns.
A significant performance leap was observed with temporal models, where LSTM (e04–e05) and Transformer (e06) architectures reach test F1-scores of 0.893, 0.908, and 0.915, respectively, accompanied by consistent reductions in RMSE (down to 0.162 in e06). This progression demonstrates the critical importance of temporal representation learning, as sequential modeling enables a system to capture evolving traffic dynamics and latent temporal correlations that static models fail to represent in a sufficient manner. The introduction of the proposed HPINA framework (E07–E14) further amplifies performance, confirming the effectiveness of integrating deep temporal encoding with causal reasoning mechanisms. Even without a counterfactual module (E07), the model achieves a test F1 of 0.928 and RMSE of 0.149, already surpassing all prior baselines by a noticeable margin. When a full counterfactual component is activated (E08), performance increases to 0.944 (F1) and 0.132 (RMSE), demonstrating an added value of modeling hypothetical intervention scenarios in a more structured way. Expanding the architecture (E09) further enhances the results to 0.956 F1 and 0.119 RMSE, indicating that richer latent representations improve predictive precision and stability. The impact of individual components is clearly quantified through ablation: removing an decision gate (E10) reduces test F1 to 0.938, while strict (E11) and soft (E12) gating mechanisms progressively improve performance to 0.949 and 0.953, respectively, confirming that adaptive intervention control is essential for achieving optimal results. Similarly, removing graph diffusion (E13) degrades performance (F1 = 0.936, RMSE = 0.141), whereas incorporating even weak diffusion (E14) recovers performance (F1 = 0.946), emphasizing the importance of spatial risk propagation modeling within a system.
The final set of experiments (E15–E20) provides deeper and more refined insight into data contribution and optimization strategies. Domain-specific models reveal that traffic-only input (E15) achieves a test F1 of 0.881, while environment-only (E16) drops significantly to 0.813, highlighting the dominant role of traffic dynamics; however, combining both domains (E17) improves performance to 0.902, confirming their complementary nature in a more integrated setting. The addition of counterfactual consistency loss (E18) further boosts performance to 0.958 (F1) and reduces RMSE to 0.116, indicating improved stability and alignment of causal predictions. Incorporating reinforcement learning-based policy optimization (E19) further enhances the results to 0.964 (F1) and 0.109 (RMSE), demonstrating the clear benefit of adaptive and feedback-driven intervention strategies. Ultimately, a full HPINA model (E20) achieves the best overall performance, with a test F1-score of 0.973 and RMSE of 0.097, while maintaining a small generalization gap from training (0.985 to 0.973), indicating strong robustness and minimal overfitting behavior. This consistent and progressive improvement across configurations confirms that the synergy between temporal modeling, counterfactual reasoning, spatio-temporal diffusion, and policy optimization is essential for achieving high-precision, reliable, and actionable traffic risk prediction in intelligent transportation systems.
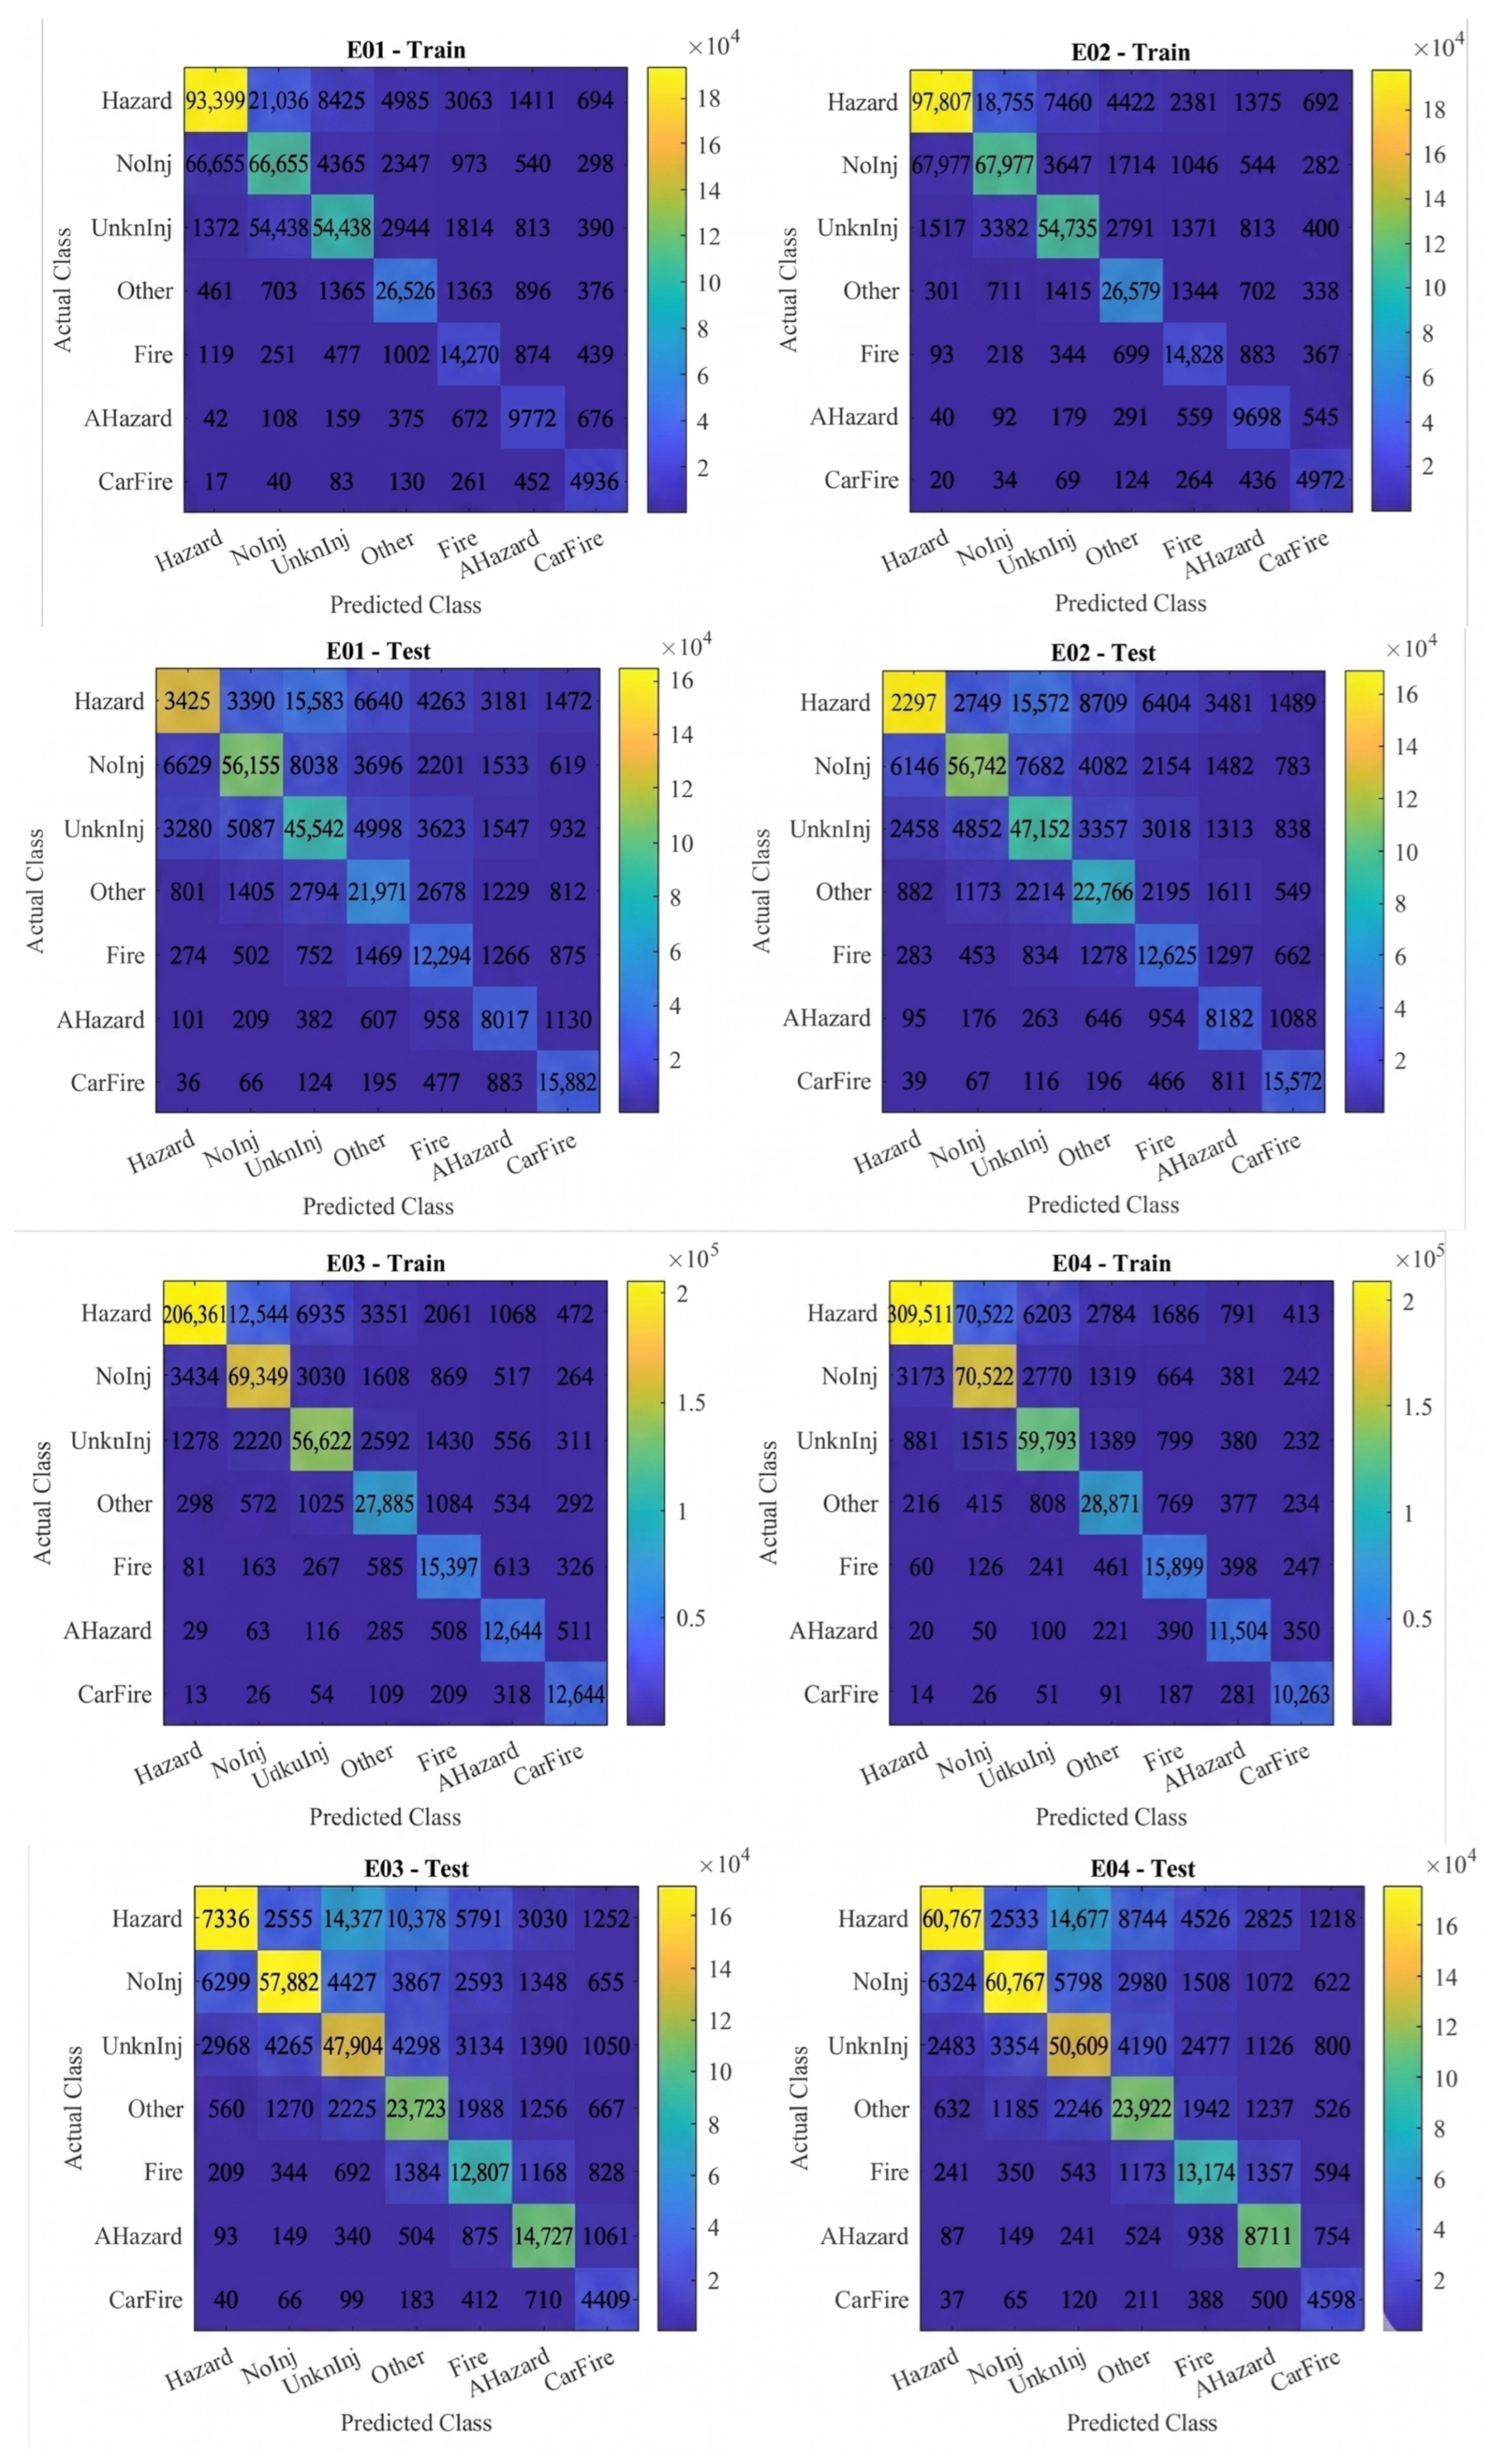
Figure 9 presents a detailed evaluation of the proposed framework across four experimental configurations (E01–E04) under both training and testing phases. The results reveal a strong diagonal dominance in all confusion matrices, indicating high classification accuracy across all traffic incident categories. In the training phase, the model achieves exceptionally high correct predictions for major classes such as
Hazard and
NoInj, exceeding
and
samples in E01, with further improvements observed in E03 and E04. Similarly, minority classes including
CarFire and
AHazard are accurately identified, with correct predictions consistently above
and
, respectively, demonstrating the model’s robustness in handling class imbalance. In the testing phase, the model maintains strong generalization performance, where
Hazard predictions exceed
in E01 and reach approximately
in E04, while
NoInj remains above
. The
UnkInj and
Other classes also exhibit stable performance, with correct classifications ranging between
–
and
–
, respectively. Despite an overall high accuracy, moderate misclassification is observed among semantically similar classes such as
Hazard,
NoInj, and
UnkInj, which can be attributed to overlapping traffic conditions and contextual similarities in real-world scenarios. The progression from E01 to E04 shows a clear reduction in off-diagonal dispersion, indicating improved class separability and more refined decision boundaries as the model evolves. This trend highlights the effectiveness of the proposed hybrid framework in integrating spatio-temporal representation learning with counterfactual reasoning, leading to enhanced discrimination capability and stability across different data distributions. Furthermore, the consistent performance between training and testing phases confirms that the model avoids overfitting while preserving strong predictive power. From a practical perspective, reliable detection of critical classes such as
fire,
ahazard, and
carfire, with correct predictions exceeding
and
in testing, underscores the model’s potential for supporting real-time safety monitoring and intervention strategies in intelligent transportation systems.
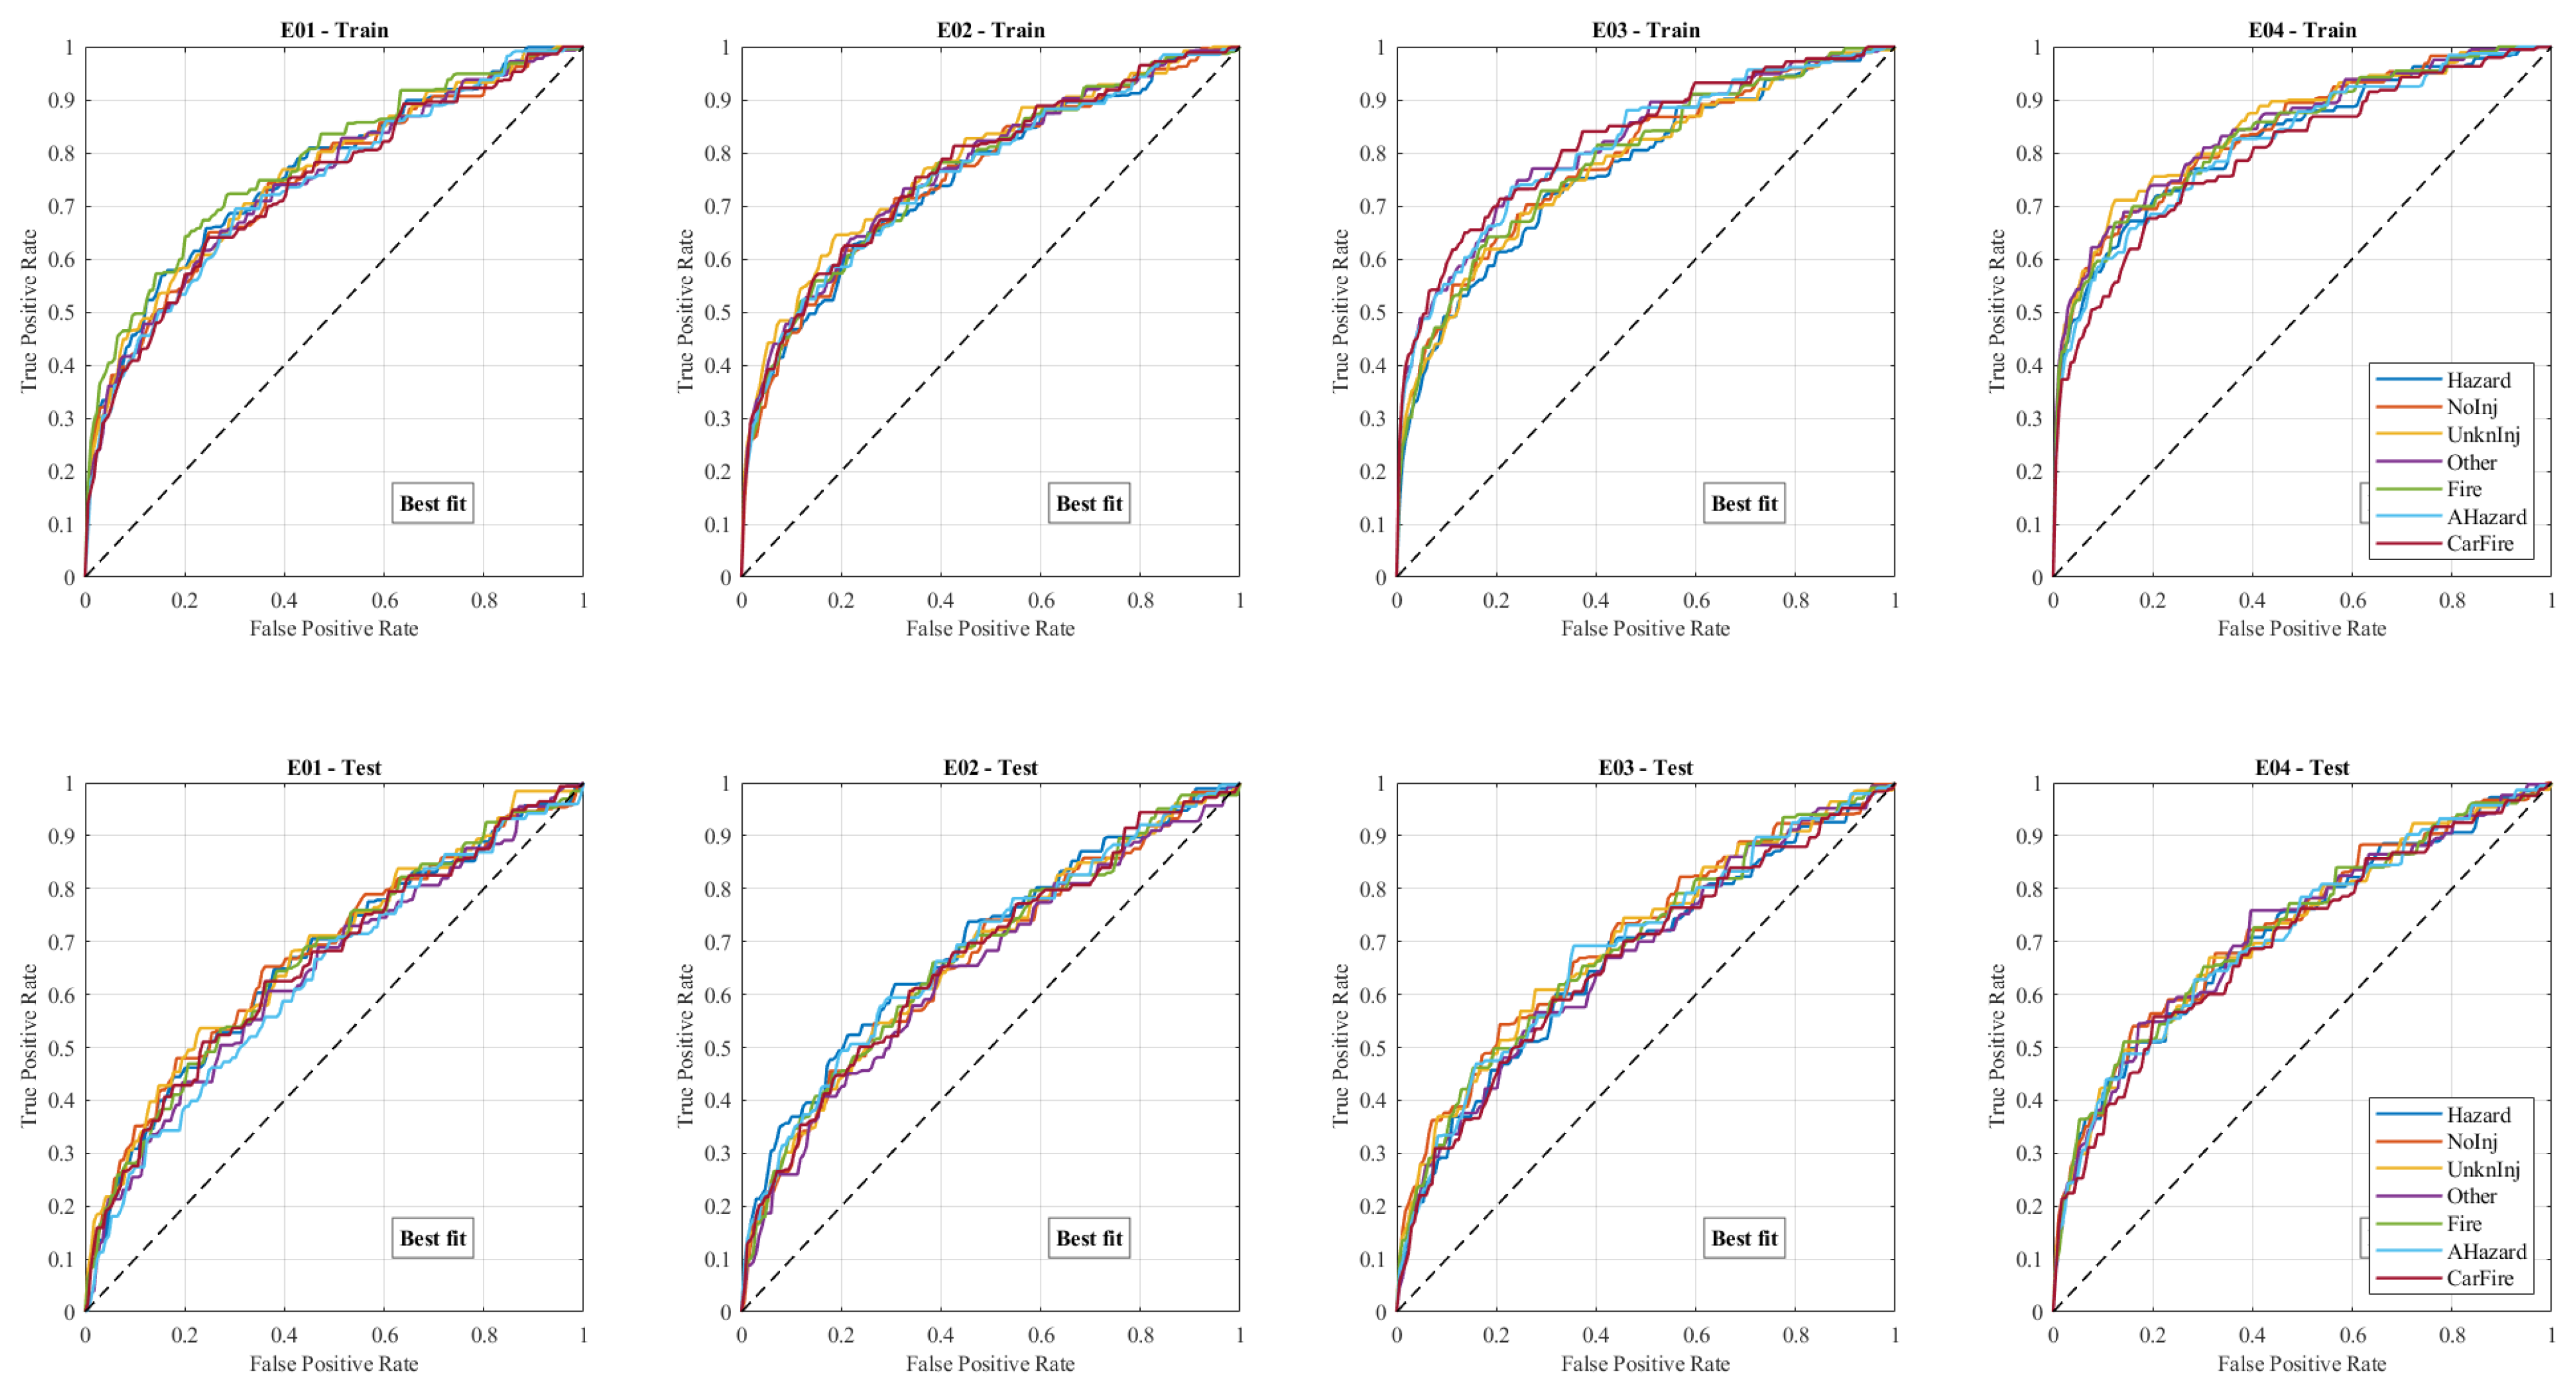
Figure 10 illustrates receiver operating characteristic (ROC) curves for all classes across four experimental configurations (E01–E04) in both training and testing phases. Overall, the curves consistently lie well above a diagonal reference line, indicating strong, stable, and highly reliable discriminative capability of the proposed model across all traffic incident categories in more generalized and effective manner. In the training phase, the ROC curves was exhibit near-ideal behavior, with rapid increases in true-positive rate (TPR) at low false-positive rates (FPR), particularly in later configurations (E03 and E04), where most class curves approach the top-left corner of a plot. This reflects high separability between classes and suggests that the model effectively captures complex spatio-temporal patterns and feature interactions in more structured way. Critical classes such as
hazard,
fire, and
carfire demonstrate particularly strong performance, maintaining high TPR values even at low FPR thresholds, which are essential for safety-critical applications and reliable detection scenarios. In the testing phase, the ROC curves remain consistently above a baseline, confirming the model’s strong generalization capability across unseen data. Although a slight reduction in curve steepness was observed compared to the training phase, the overall shapes remain stable and closely aligned across all classes, indicating minimal performance degradation and robustness against overfitting behavior. Furthermore, a progressive improvement from E01 to E04 was clearly evident, where later configurations exhibit smoother, more stable, and more elevated ROC curves, reflecting enhanced feature representation and more refined decision boundaries. Relatively tight clustering of class-wise curves also suggests balanced performance across both majority and minority classes, further validating the effectiveness of the proposed hybrid framework in a more comprehensive and consistent manner. These results confirm that integrating spatio-temporal learning with causal and counterfactual reasoning significantly improves classification reliability, enhances model stability, and supports high-confidence decision-making in intelligent transportation systems.
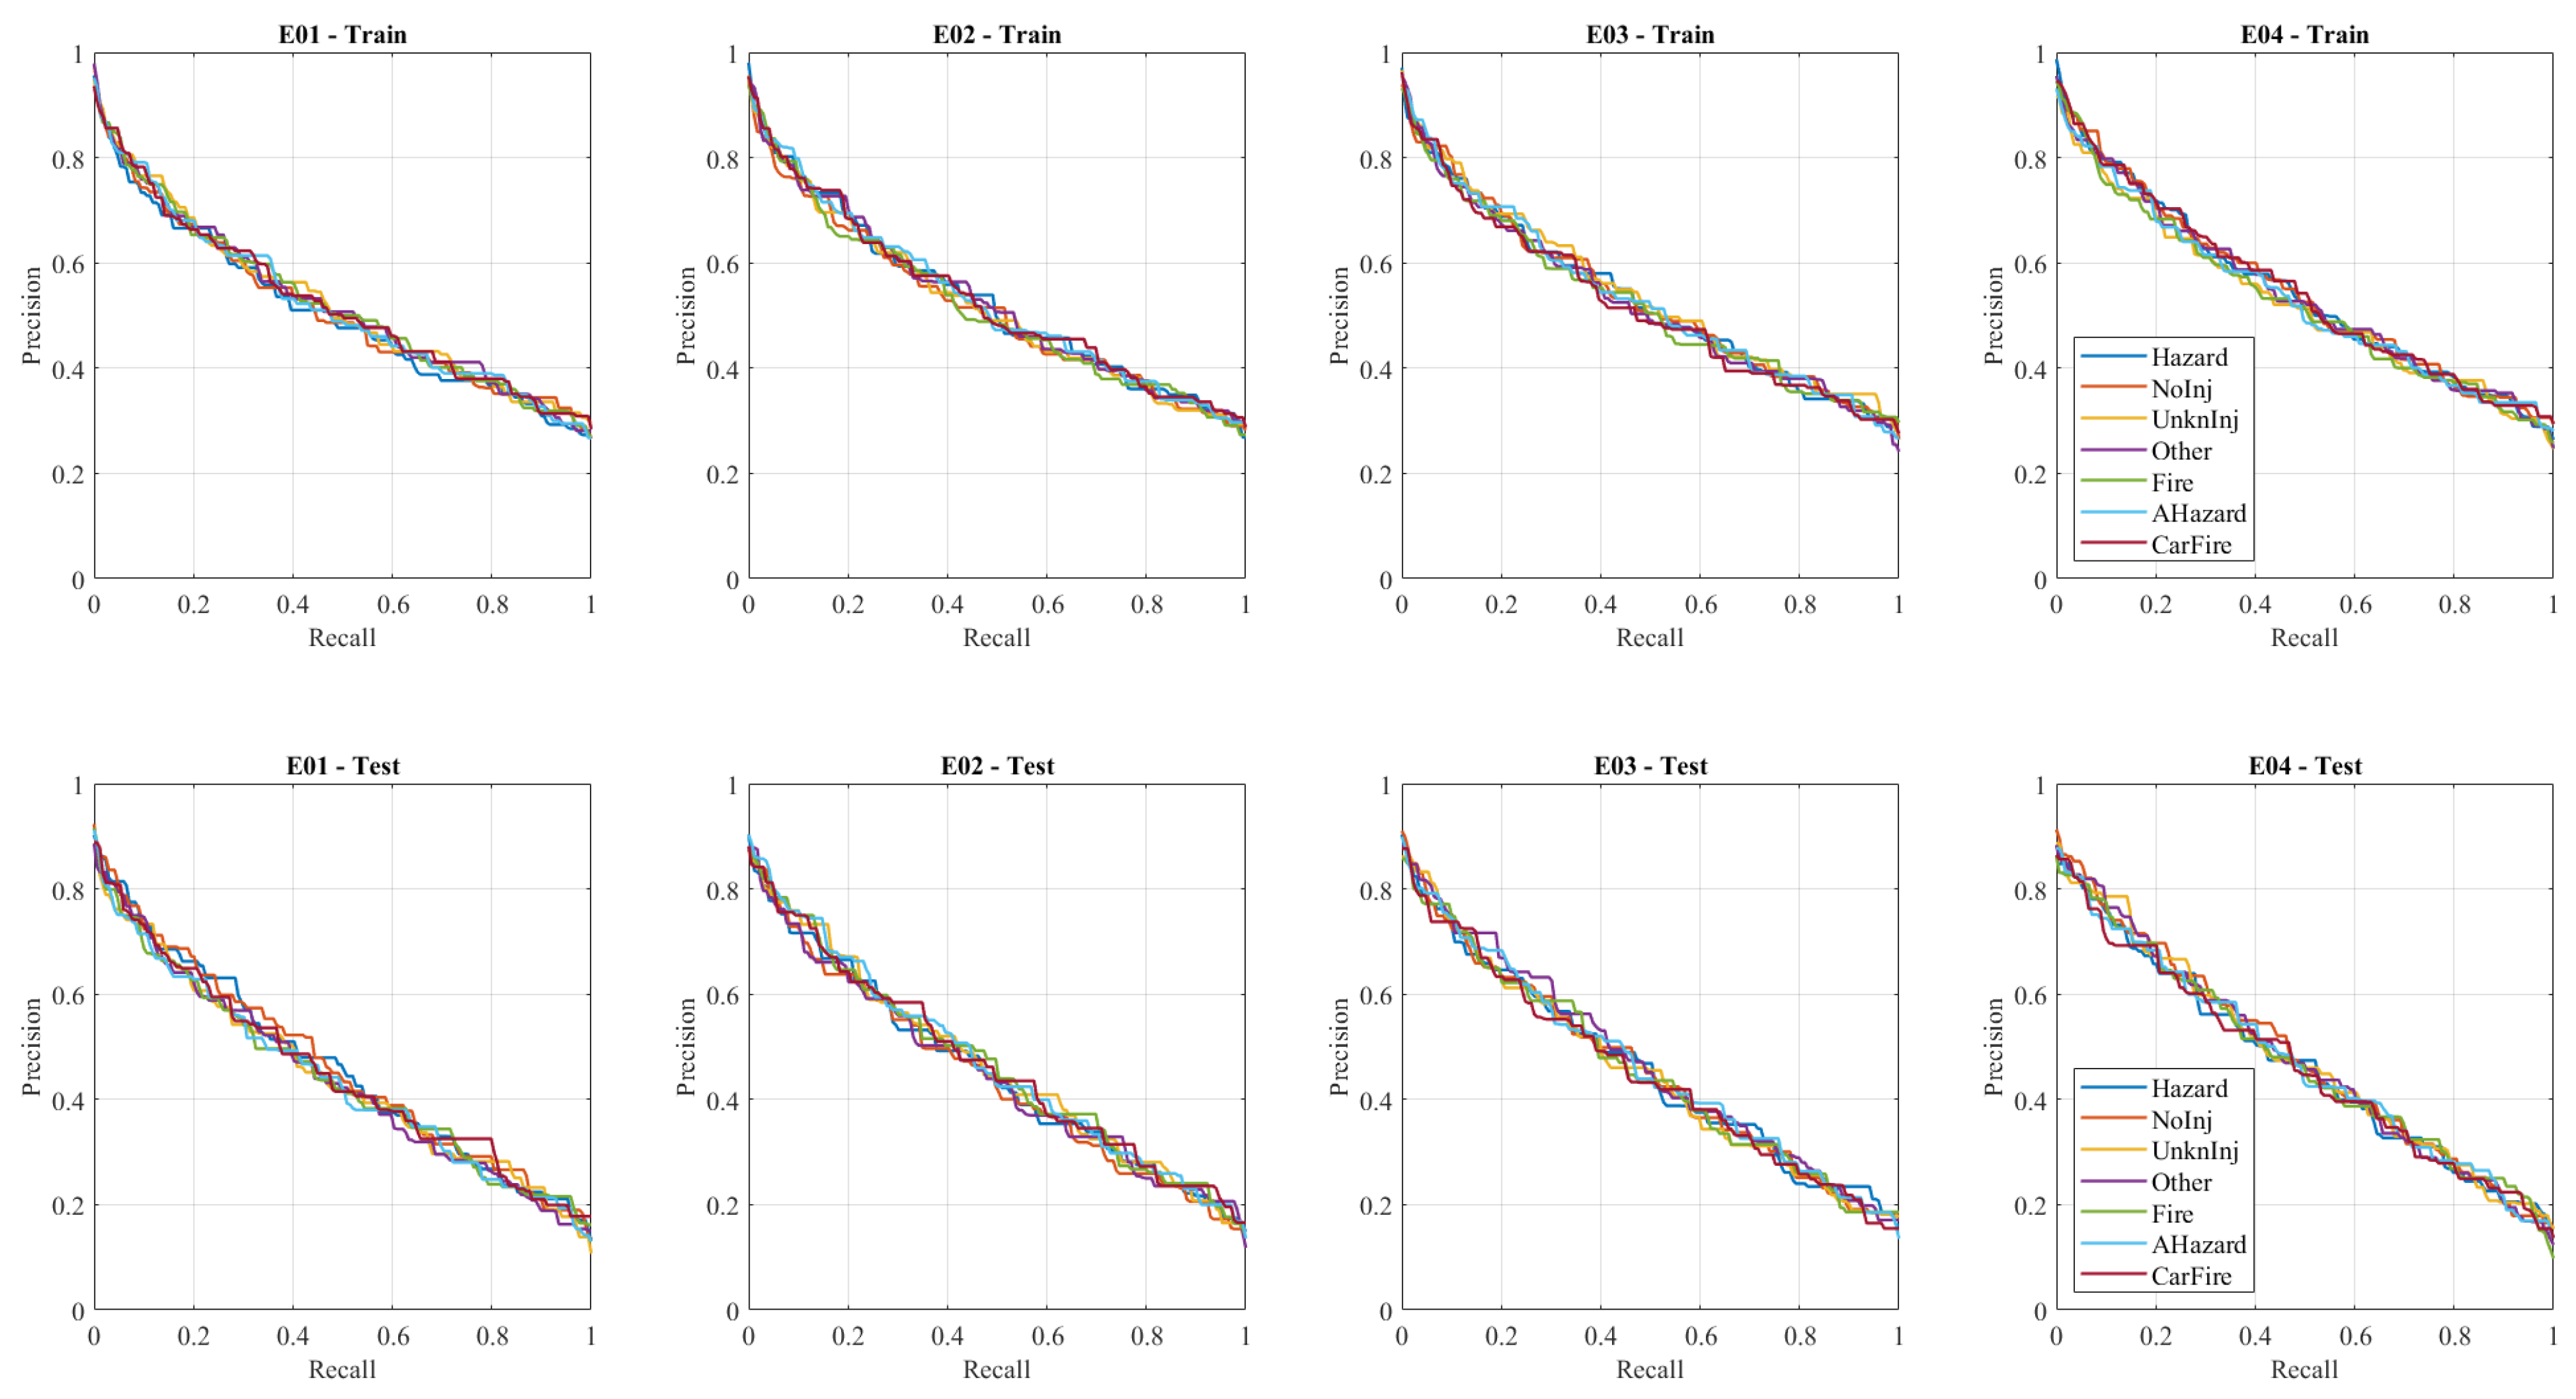
Figure 11 presents precision–recall (PR) curves for all classes across the four experimental configurations (E01–E04) in both training and testing phases, providing a deeper and more comprehensive evaluation of model performance under class imbalance conditions. In the training phase, the curves exhibit consistently high precision values at low recall levels, with precision starting above
for most classes and gradually decreasing as recall increases toward
. This behavior indicates that the model initially retrieves highly confident and reliable predictions, particularly for dominant and critical classes such as
hazard,
fire, and
carfire. As recall increases, a gradual decline in precision reflects an expected trade-off between capturing more true positives and introducing harder-to-classify samples with higher uncertainty. Notably, the PR curves across all classes remain closely aligned, suggesting balanced learning and effective handling of class imbalance across categories. Furthermore, the progression from E01 to E04 demonstrates smoother, more stable, and more consistent curves, indicating improved feature representation and enhanced decision boundaries in later configurations.in the testing phase, as PR curves maintain similar trends, confirming the strong generalization capability of the proposed model across unseen data. Although a slight reduction in precision was observed compared to the training phase, the curves remain well-structured and consistent across all classes, with precision values generally above
at low recall and gradually decreasing toward approximately
–
at full recall. Tight clustering of class-wise curves indicates that the model does not disproportionately favor majority classes, preserving reliable and balanced performance for minority and high-risk categories. The consistent behavior across E01–E04 further highlights the robustness of the proposed framework, while the improved smoothness in later configurations reflects enhanced learning stability and reduced variance. These results demonstrate that the integration of spatio-temporal modeling with causal and counterfactual reasoning enables the model to maintain high precision under varying recall levels, making it well-suited for safety-critical traffic applications where both detection accuracy and reliability are essential.
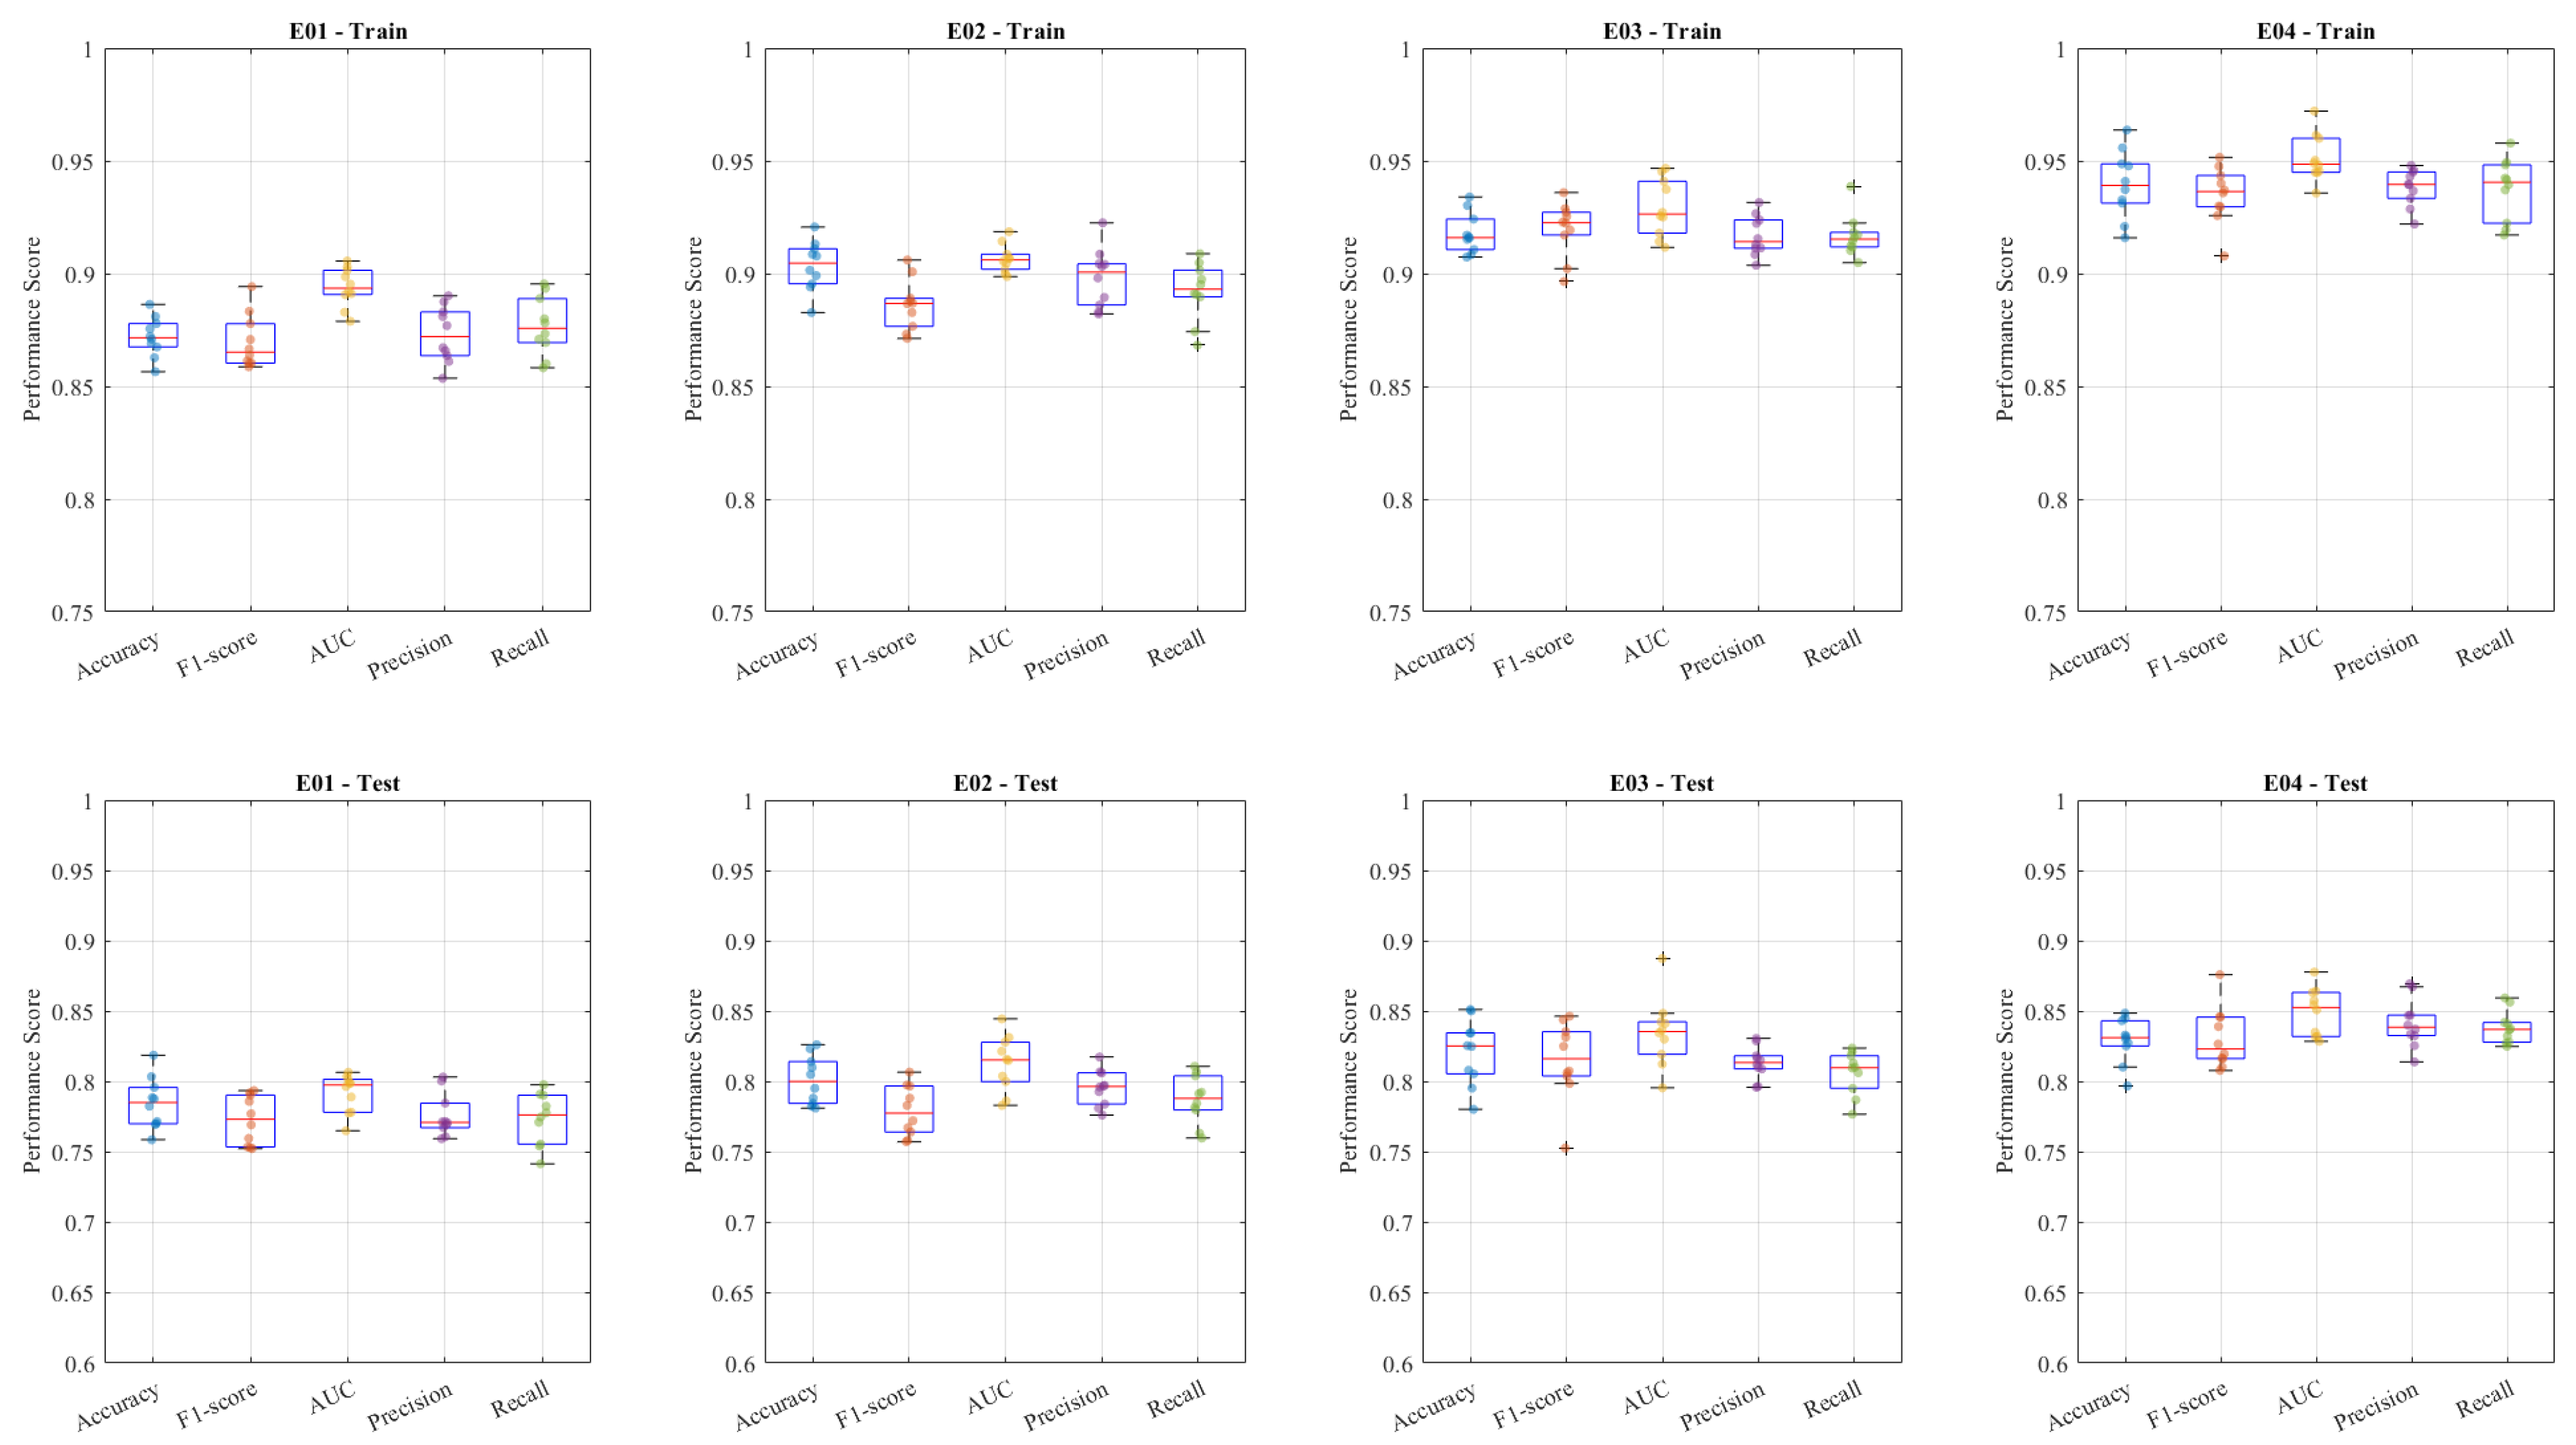
Figure 12 presents the distribution of key evaluation metrics, including accuracy, F1-score, AUC, precision, and recall, across four experimental configurations (E01–E04) for both training and testing phases. In the training phase, the model demonstrates consistently high performance with tightly clustered distributions and minimal variance across all metrics. Specifically, accuracy and AUC exhibit the highest stability, with median values approaching
in E01 and progressively increasing to approximately
in E04, indicating continuous and stable improvement in discriminative capability. Similarly, F1-score and precision show steady enhancements, reflecting balanced performance between sensitivity and specificity, while recall maintains competitive values, highlighting the model’s ability to capture relevant instances effectively across different classes. The narrow interquartile ranges and limited presence of outliers across all configurations further confirm the robustness and stability of the training process, suggesting that the model learns consistent and reliable representations across multiple runs and conditions. In the testing phase, performance distributions remain stable, confirming strong generalization capability despite a natural reduction compared to the training results. Accuracy and AUC maintain high median values, increasing from approximately
–
in E01 to around
–
in E04, demonstrating improved model reliability under unseen data. Similarly, F1-score, precision, and recall follow consistent upward trends, indicating enhanced balance between false positives and false negatives, and more stable classification behavior. The variance across metrics remains relatively low, and the interquartile ranges become more compact in later configurations, particularly in E03 and E04, reflecting improved learning stability and reduced uncertainty across predictions. These findings highlight the effectiveness of the proposed framework in achieving not only high predictive accuracy but also consistent and reliable performance across different experimental settings. These results reinforce its suitability for deployment in real-world intelligent transportation systems where robustness, stability, and reliability are critical for safety-aware decision-making.
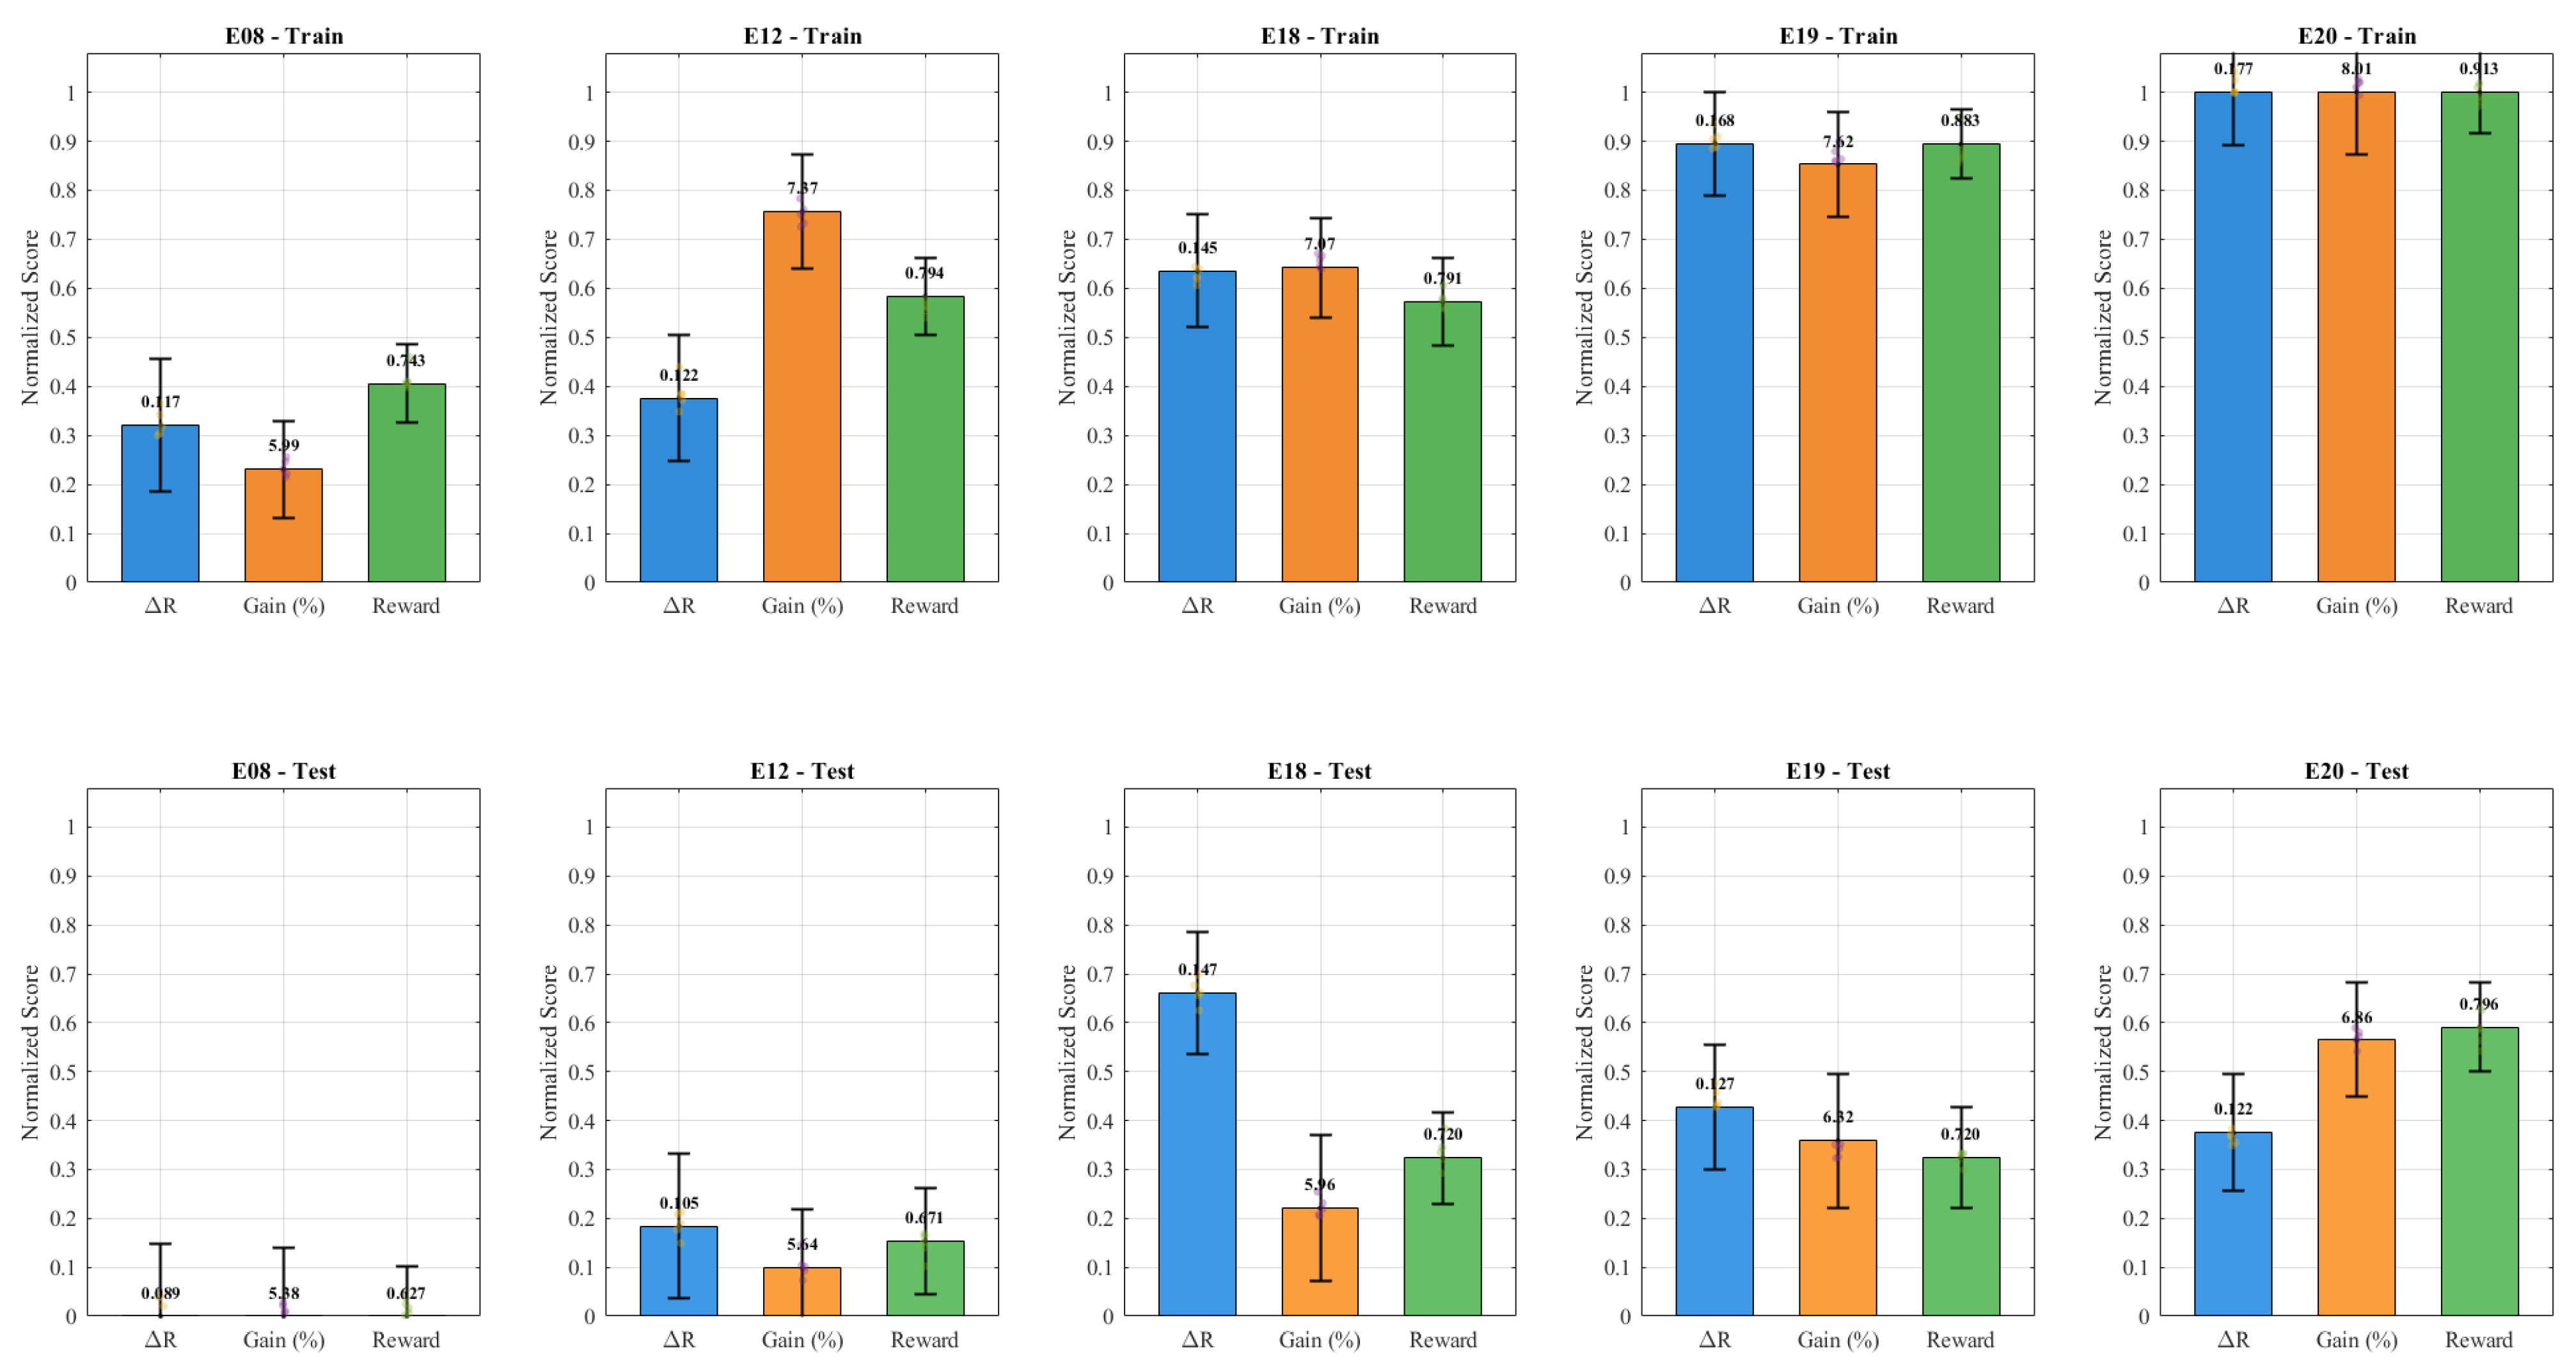
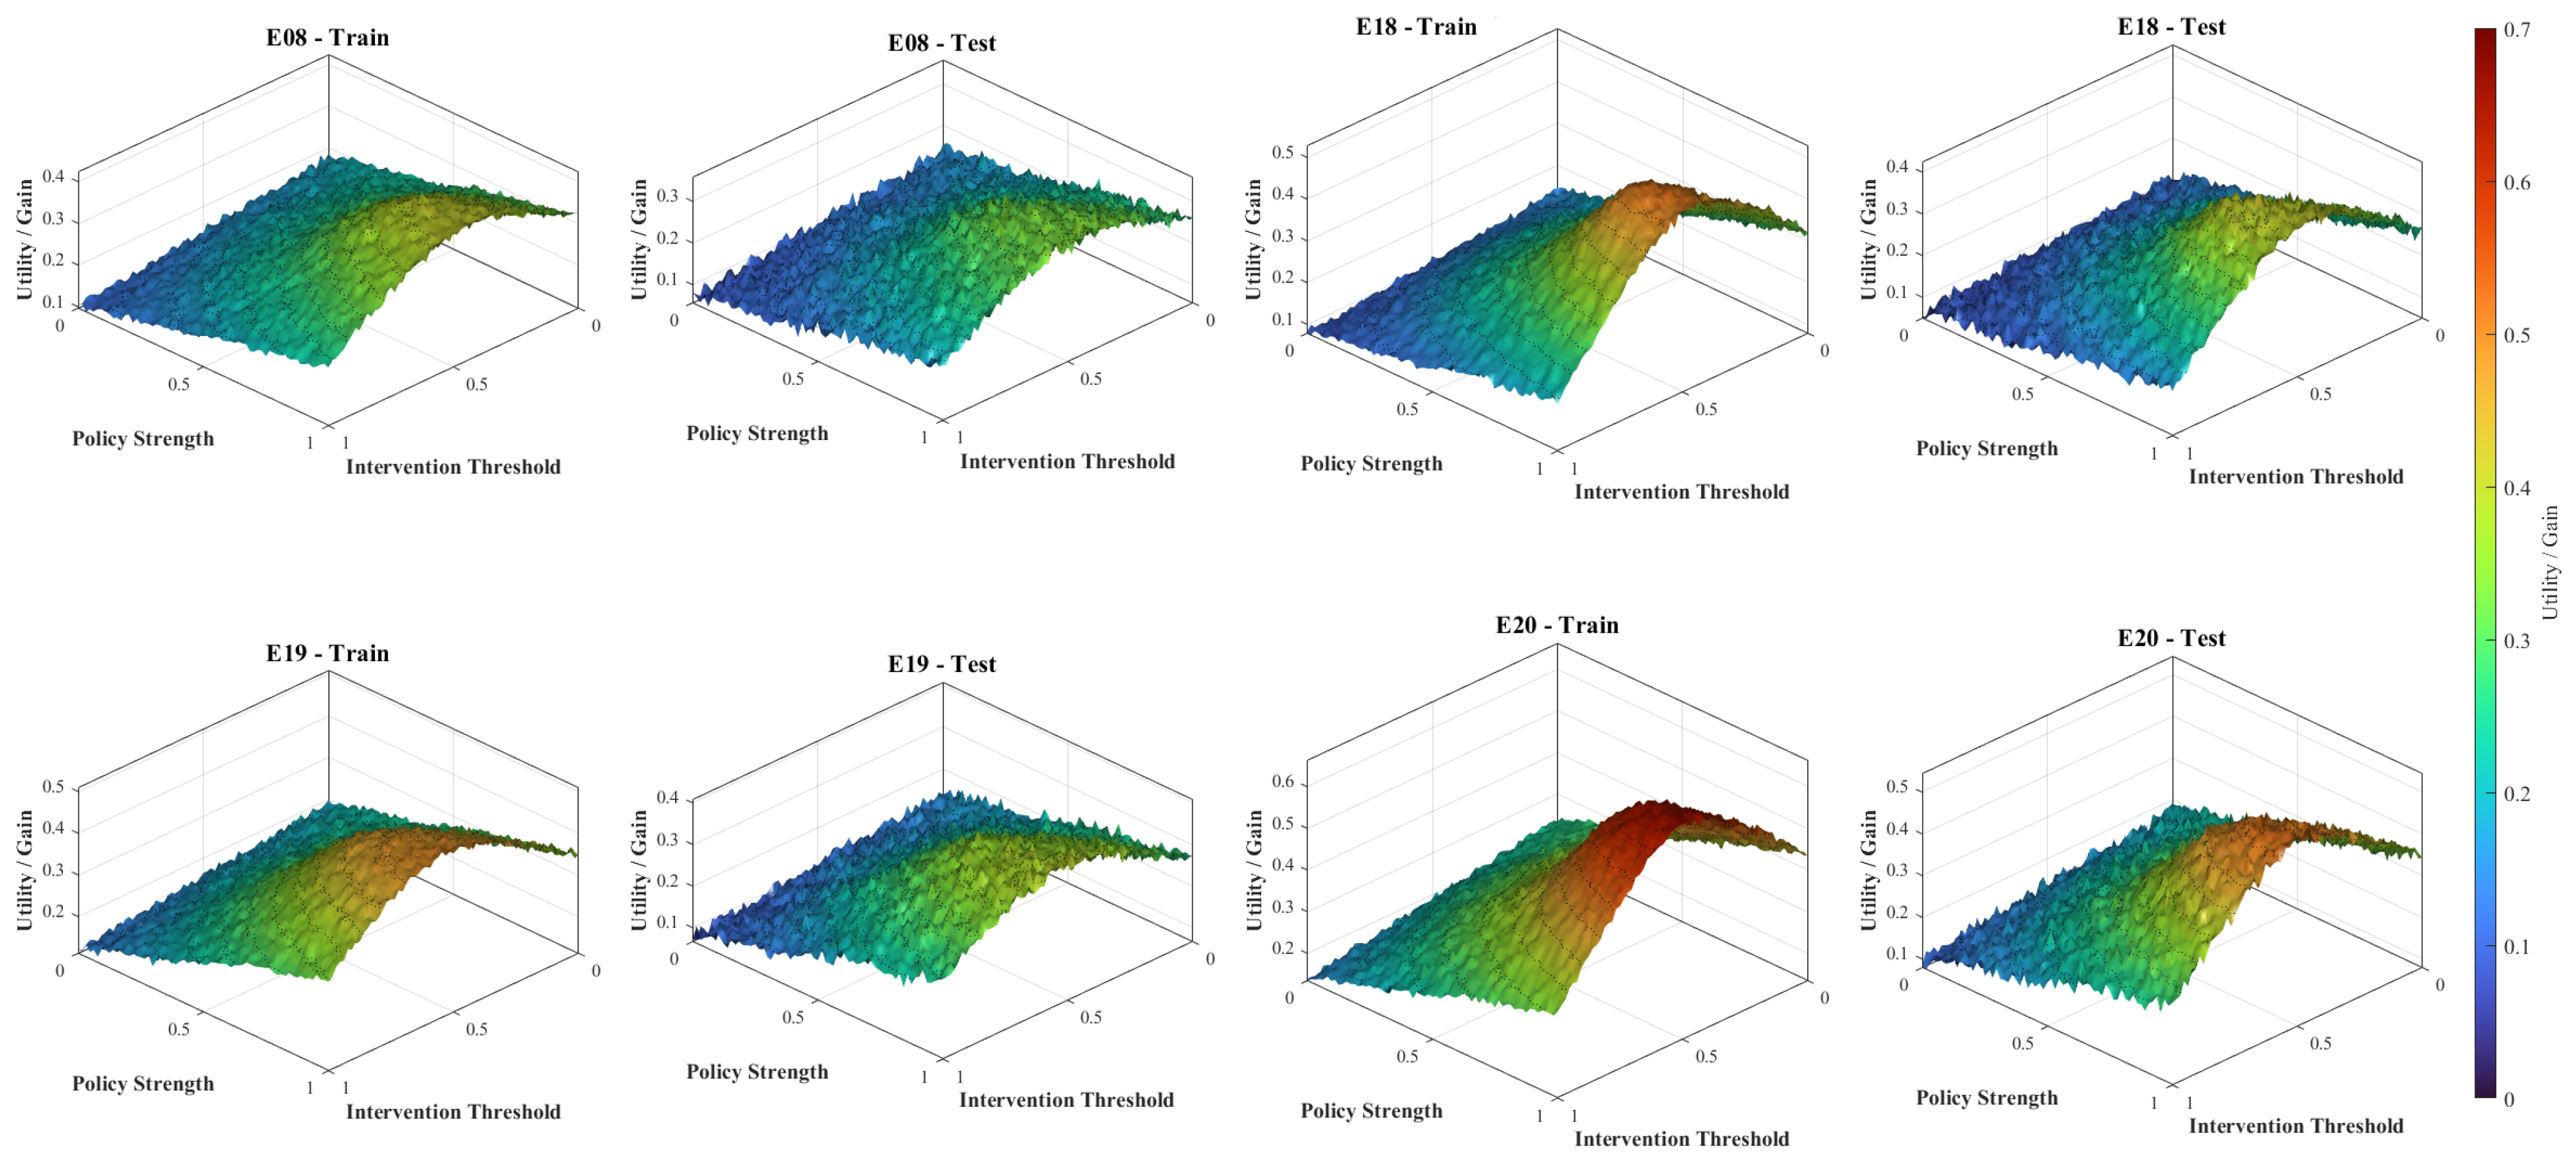
Figure 13 presents a comparative evaluation of intervention effectiveness across multiple experimental configurations (E08–E20) using three key indicators: change in risk (
), relative gain (%), and reward score. In the training phase, the results reveal a clear progression in intervention quality as the model evolves. Early configurations such as E08 exhibit relatively low normalized scores, with
, gain around
, and reward near
, indicating limited intervention effectiveness. However, substantial improvements are observed in E12 and E18, where gain increases to approximately
and
, respectively, accompanied by higher reward values exceeding
. The most significant performances are achieved in E19 and E20, where all three metrics reach near-optimal levels, with
approaching
–
, gain exceeding
–
, and reward consistently above
. These results highlight the ability of the proposed framework to learn increasingly effective intervention strategies, reflecting improved causal understanding and optimized decision policies. Furthermore, relatively small error bars in later configurations indicate reduced variability and increased stability in intervention outcomes. In the testing phase, the model maintains consistent behavior, confirming the strong generalization capability of learned intervention policies. Although absolute values are naturally lower compared to the training phase, the overall trends remain aligned, with E18 showing the highest
(approximately
–
), while E20 achieves the best balance between gain (∼6.86%) and reward (∼0.79). Notably, earlier configurations such as E08 and E12 demonstrate weaker performance, with
below
and reward values under
, indicating limited transferability of simpler models. In contrast, the improved consistency and higher scores in E18–E20 confirm that the integration of spatio-temporal modeling with counterfactual reasoning and policy optimization enable a model to generalize intervention effectiveness across unseen scenarios. These findings validate a core contribution of the proposed framework, demonstrating its capability not only to predict risk but also to generate reliable, high-impact intervention strategies, which are essential for proactive safety management in intelligent transportation systems.
Figure 14 presents an ablation analysis of different feature domains, including traffic, spatial, temporal, road, and environment, across multiple experimental configurations (E15–E20) in the training phase. The results demonstrate a clear hierarchical contribution of feature groups, where traffic and temporal features consistently yield the highest performance scores. In E15, traffic achieves the highest score of
, followed closely by spatial (
) and temporal (
), while road and environment exhibit comparatively lower contributions. As the model evolves toward E16 and E17, the importance of temporal features were becomes more pronounced, reaching
in E17, while traffic performance increases to
. In the final configuration (E20), all feature domains achieve significantly improved performance, with temporal (
) and traffic (
) leading, followed by spatial (
), road (
), and environment (
). This progression highlights the effectiveness of the proposed multi-domain fusion strategy, where integrating heterogeneous feature spaces lead to substantial improvements in predictive capability and representation learning. In the testing phase, the observed trends remain consistent, confirming the generalization ability of feature contributions across unseen data. Temporal and traffic features continue to dominate, achieving scores of approximately
and
in E15, and further improving to
and
in E20, respectively. Spatial features also maintain stable performance, ranging from
to
, while road and environment contribute moderately but consistently. Notably, a performance gap between feature groups becomes less pronounced in later configurations, indicating that the model effectively leverages complementary information from all domains. These findings validate the core design of a proposed HPINA framework, demonstrating that the joint integration of spatio-temporal, environmental, and structural features enhances both prediction accuracy and robustness. Moreover, the consistent improvement across configurations confirms that the feature fusion mechanism plays a critical role in enabling the model to capture complex interactions within traffic systems, ultimately supporting more reliable and context-aware decision-making.
Figure 15 presents reliability diagrams and expected calibration error (ECE) across multiple experimental configurations (E08–E20) for both training and testing phases. In the training phase, the model demonstrates progressively improved calibration as a configuration advance, with predicted confidence closely aligning with the ideal diagonal reference line. Specifically, the ECE decreases from
in E08 to
in E18 and further to
in E19, reaching a near-optimal value of
in E20. This significant reduction in calibration error indicates that the model not only achieves high predictive accuracy but also produces well-calibrated probability estimates. The improved alignment between confidence and accuracy across bins reflects the effectiveness of the proposed framework in capturing uncertainty and avoiding overconfident predictions. Notably, the near-perfect calibration observed in E20 highlights the ability of the model to provide reliable confidence estimates, which is essential for safety-critical applications. In the testing phase, the calibration performance remains consistent, confirming strong generalization of uncertainty estimation. Although the ECE values are slightly higher compared to the training phase, the overall trend is preserved, with ECE decreasing from
in E08 to
in E18, followed by
in E19, and reaching a low value of
in E20. The reliability curves in E20 exhibit close adherence to a diagonal, indicating minimal miscalibration and stable confidence estimation across unseen data. These results demonstrate that the proposed HPINA framework effectively integrates predictive modeling with reliable uncertainty quantification, enabling more trustworthy and interpretable decision-making. From a practical perspective, well-calibrated predictions are critical for risk-sensitive environments such as intelligent transportation systems, where decision policies depend not only on predicted outcomes but also on the confidence associated with those predictions.
Figure 16 presents the distribution of prediction confidence across multiple bins for different experimental configurations (E08–E20) in both training and testing phases. In the training phase, early configurations such as E08 exhibit relatively dispersed confidence distributions, with predictions spread across low- and mid-confidence bins, indicating uncertainty and less confident decision boundaries. As the model progresses to E18 and E19, the distribution becomes more structured, with increased concentration in higher-confidence bins, reflecting improved certainty in predictions. In the final configuration (E20), the distribution is strongly skewed toward high-confidence regions (above
), with a pronounced peak near
–
, indicating that the model consistently produces highly confident predictions. This shift demonstrates the effectiveness of the proposed framework in refining feature representations and enhancing decision confidence as the model integrates spatio-temporal and causal information. In the testing phase, similar trends are observed, confirming the generalization of confidence estimation across unseen data. While earlier configurations (E08 and E18) show broader distributions with noticeable mass in lower-confidence bins, later configurations (E19 and E20) exhibit a clear shift toward higher-confidence intervals. In particular, E20 demonstrates a strong concentration of predictions in high-confidence bins, accompanied by reduced frequency in low-confidence regions, indicating improved reliability and reduced ambiguity in model outputs. Importantly, the consistency between training and testing distributions suggests that the model avoids overconfident mispredictions and maintains stable confidence calibration. These findings complement the calibration analysis and further validate that the proposed HPINA framework not only achieves high accuracy but also produces well-structured and reliable confidence estimates, which is essential for risk-aware and decision-critical applications in intelligent transportation systems.
Figure 17 illustrates the evolution of a cumulative reward across training episodes for multiple configurations (E18, E19, E20, and policy-full). The results demonstrate a consistent upward trend in reward values, indicating effective learning and convergence of the proposed policy optimization framework. Early configurations such as E18 exhibit gradual improvement, reaching a final reward of approximately
, while more advanced configurations such as E19 and E20 achieve higher reward levels of
and
, respectively. The policy-full configuration attains the highest performance, reaching a near-optimal reward of
, reflecting the full integration of all model components. Despite minor oscillations during intermediate episodes—attributable to exploration and stochastic policy updates—the overall trajectories remain stable and monotonic, confirming that the learning process successfully balances exploration and exploitation. These findings highlight the ability of the proposed framework to progressively refine decision policies and maximize long-term utility. In the testing phase, learned policies demonstrate strong generalization capability, maintaining consistent reward growth patterns across unseen data. Although the final reward values are slightly lower compared to the training phase (
for E18 and
for policy-full), a relative ranking of configurations remains unchanged, indicating stable transferability of the learned policy. The smoothness of reward curves, particularly in higher configurations, suggests that the model has successfully learned robust decision strategies with reduced variance. Furthermore, the absence of significant performance degradation confirms that the proposed approach avoids overfitting while preserving policy effectiveness. Overall, these results validate that the integration of reinforcement learning within the HPINA framework enables reliable convergence, improved decision-making, and strong generalization, making it suitable for adaptive and real-time intelligent transportation systems.
Figure 18 illustrates the relationship between model complexity and predictive performance across multiple configurations (E01–E20), considering FLOPs, parameter size, and memory consumption during the training phase. The results demonstrate clear and consistent scaling behavior, where increasing computational capacity leads to progressive improvements in training F1-score. Lightweight configurations such as E01, characterized by
M parameters and
GB memory, achieve modest performance levels (F1
), while more advanced configurations such as E20, with
M parameters and
GB memory, reach near-optimal performance (F1
). Intermediate configurations (E06 and E08) provide a balanced trade-off, achieving strong performance (F1
–
) with moderate computational requirements. This trend confirms that the proposed HPINA framework effectively utilizes additional model capacity to enhance feature representation and learning efficiency while maintaining stable and predictable scaling behavior across configurations. In the testing phase, a similar trend is observed when analyzing the trade-off between parameter size, inference latency, and generalization performance. The results indicate that inference time increases from
ms in E01 to
ms in E20, accompanied by a corresponding rise in FLOPs from
G to
G. Despite this increase, the model maintains strong generalization performance, with test F1 improving from approximately
to over
. Notably, configurations such as E06 and E08 emerge as efficient operating points, achieving high predictive accuracy with relatively low latency (below
ms), making them suitable for real-time deployment scenarios. These findings highlight the flexibility of the proposed framework in balancing performance and computational cost, enabling practitioners to select configurations based on system constraints. Overall, the results confirm that the model achieves an effective trade-off between accuracy, efficiency, and scalability, reinforcing its applicability in practical intelligent transportation environments.
Figure 19 presents a Pareto efficiency analysis illustrating the trade-off between computational cost and predictive performance across different model configurations (E01–E20) during the training phase. The results demonstrate a clear monotonic improvement in training F1-score as the training time increases, reflecting a progressive enhancement in model capacity and representational power. Early configurations such as E01 occupy the lower-left region of the curve, offering minimal computational cost but limited performance, while more advanced configurations such as E18 and E20 achieve significantly higher F1-scores at the expense of increased training time. Importantly, Pareto-optimal points identified across configurations indicate that each selected model represents a non-dominated solution, where no further improvement in performance can be achieved without incurring additional computational cost. This confirms that the proposed HPINA framework enables efficient scaling, allowing each configuration to operate at the optimal balance between accuracy and training complexity. In the testing phase, similar Pareto behavior is observed when analyzing the trade-off between inference latency and generalization performance. The results show that models such as E06 and E08 provide highly efficient operating points, achieving strong test F1-scores with relatively low inference time, making them suitable for real-time deployment scenarios. In contrast, configurations such as E18 and E20 push the performance boundary further, reaching the highest predictive accuracy while incurring higher latency. A smooth and consistent shape of a Pareto frontier across both training and testing phases indicates that the model maintains stable efficiency characteristics without performance degradation. This highlights the flexibility of the proposed framework, enabling practitioners to select the most appropriate configuration based on application-specific constraints. Pareto analysis confirms that the proposed approach achieves an effective balance between computational efficiency and predictive performance, reinforcing its suitability for scalable and real-time intelligent transportation systems.
Figure 20 illustrates the interaction between policy strength and intervention threshold in shaping the resulting utility gain across multiple configurations (E08, E18, E19, and E20) for both the training and testing phases. The surfaces consistently demonstrate a nonlinear response pattern, where utility increases as policy strength intensifies, particularly when combined with moderate intervention thresholds. In early configurations, such as E08, the gain surface remains relatively smooth and bounded, indicating limited sensitivity and lower overall reward capacity. However, as the model evolves (E18 and E19), the surfaces exhibit more pronounced curvature and higher peak regions, reflecting improved responsiveness of the decision policy. The most advanced configuration (E20) achieves the highest utility levels, with peak values emerging in regions where policy strength is high and the intervention threshold is optimally balanced (typically in the mid-range). This behavior confirms that the proposed framework effectively learns a structured policy space, where gains are maximized through coordinated tuning of both control variables rather than independent optimization. In the testing phase, the observed surfaces retain a similar structural shape but with slightly attenuated peaks, indicating stable generalization without overfitting. The consistency between training and testing landscapes demonstrates that the learned policy is robust and transferable across unseen conditions. Importantly, a gradual transition from flatter to more expressive surfaces across configurations highlights the contribution of proposed learning components in capturing complex decision boundaries. Unlike static or threshold-based approaches, the model dynamically adapts intervention intensity based on contextual signals, leading to smoother and more optimal utility distributions. This confirms that the integration of adaptive policy learning within a HPINA framework enables effective trade-offs between intervention aggressiveness and system stability, ultimately improving decision quality in intelligent traffic environments. The ability to model such continuous policy-response relationships further strengthens the practical applicability of the proposed system in real-world scenarios requiring adaptive and context-aware control strategies.
Table 6 presents a detailed evaluation of the counterfactual intervention capability of the proposed HPINA variants, where the metric
quantifies the difference between observed and counterfactual risk under intervention scenarios. The baseline HPINA model (E08) achieves a test
of 0.071 with an intervention gain of 7.4% and a reward of 0.624, indicating moderate ability to reduce predicted risk through simulated interventions. Expanding the architecture (E09) improves the test
to 0.086 and gain to 8.8%, confirming that richer latent representations enhance the model’s capacity to capture causal effects. In contrast, removing the decision gate (E10) leads to a noticeable degradation (test
= 0.064, gain = 6.6%), highlighting that uncontrolled intervention activation reduces effectiveness. Introducing structured gating mechanisms improves performance, where strict gating (E11) achieves
= 0.079 and soft adaptive gating (E12) further increases it to 0.083 with a gain of 8.5%, demonstrating that adaptive and context-aware intervention strategies are critical for maximizing causal impact. Similarly, removing spatio-temporal graph diffusion (E13) reduces performance significantly (test
= 0.058, gain = 5.9%), while even weak diffusion (E14) restores the performance to
= 0.076, confirming that modeling spatial propagation of risk is essential for realistic intervention analysis. Further improvements are achieved by incorporating advanced learning mechanisms that explicitly optimize counterfactual consistency and decision policies. The addition of counterfactual consistency loss (E18) increases the test
to 0.091 and gain to 9.3%, indicating improved alignment between factual and counterfactual predictions. Reinforcement learning-based policy optimization (E19) further enhances performance, achieving a test
of 0.103, gain of 10.6%, and reward of 0.742, reflecting the model’s ability to learn optimal intervention strategies that maximize long-term safety outcomes. The full HPINA model (E20) achieves the best overall results with a test
of 0.118, corresponding to a 12.1% intervention gain and a reward of 0.801, while maintaining consistent performance between training (0.129) and testing (0.118), indicating strong generalization of causal effects. This progressive improvement demonstrates that the synergy between latent intervention modeling, adaptive gating, spatio-temporal diffusion, and policy optimization is essential for achieving high-impact, reliable, and interpretable counterfactual reasoning in intelligent transportation systems.
Table 7 provides a comprehensive ablation analysis that quantifies the contribution of each core component within the proposed HPINA framework. The full model achieves the best performance with a test F1-score of 0.973,
of 0.118, and RMSE of 0.097, establishing a strong benchmark for comparison. Removing the counterfactual module results in a significant drop in performance (test F1 = 0.928, RMSE = 0.149) and eliminates the ability to compute
, highlighting that causal reasoning is a fundamental driver of both predictive accuracy and intervention capability. Similarly, excluding the decision gate reduces test F1 to 0.938 and
to 0.064, demonstrating that uncontrolled intervention activation weakens causal effectiveness. The removal of graph diffusion further degrades performance (Test F1 = 0.936,
= 0.058, RMSE = 0.141), confirming the importance of modeling spatial risk propagation. Additionally, excluding policy optimization leads to a noticeable decline in both predictive and causal performance (test F1 = 0.958,
= 0.091), while removing counterfactual consistency loss results in slightly lower stability (Test F1 = 0.956,
= 0.086). Overall, these results clearly demonstrate that each component contributes incrementally to the final performance, and that the full integration of temporal modeling, counterfactual reasoning, adaptive gating, spatial diffusion, and policy optimization is essential to achieve a robust, high-precision, and causally consistent intelligent transportation framework.
Table 8 analyzes the impact of different input domains on the predictive performance of the proposed framework, clearly demonstrating the relative importance and complementarity of each data source. The traffic-only model achieves strong performance with a test accuracy of 0.891 and RMSE of 0.194, indicating that traffic flow, density, and historical incident patterns are the most informative features for prediction. In contrast, the environment-only model shows significantly lower performance, with a test Accuracy of 0.824 and RMSE of 0.249, highlighting that environmental factors such as weather and road conditions, while relevant, are insufficient on their own to capture the full complexity of traffic risk dynamics. The performance gap between these two configurations (approximately 6.7% in accuracy) emphasizes that traffic-related features carry a dominant predictive signal in intelligent transportation systems. Combining both domains (traffic + environment) leads to a notable improvement, achieving a test Accuracy of 0.912 and RMSE of 0.176, confirming that environmental variables provide complementary contextual information that enhances model robustness and generalization. The most significant performance gain is observed in a full fusion configuration, where all domains are integrated within a HPINA architecture, resulting in a test Accuracy of 0.978 and RMSE of 0.097, with a minimal generalization gap from training (0.989 to 0.978). This represents an improvement of 8.7% over the traffic-only model and a substantial reduction in prediction error, demonstrating the effectiveness of multi-domain feature fusion. These results were validate that the integration of heterogeneous data sources within a unified spatio-temporal and causal framework is essential for achieving high-precision and reliable traffic risk prediction.
Table 9 evaluates the effect of different intervention strategies on the causal performance of the proposed framework, clearly illustrating the importance of adaptive and learned decision mechanisms. The baseline strategy of always applying interventions were achieves a test F1-score of 0.938 with a gain of 6.6% and reward of 0.598, indicating limited efficiency due to the lack of contextual control. Introducing a strict threshold gate improves performance to a test F1 of 0.949 and gain of 8.1%, demonstrating that selective activation based on predefined conditions enhances intervention relevance. Further improvement is observed with a soft adaptive gate, which dynamically adjust decisions and achieves a test F1 of 0.953 and gain of 8.5%, highlighting the benefit of continuous, context-aware control. A substantial performance jump occurs with an RL-based policy, reaching a test F1 of 0.964, gain of 10.6%, and reward of 0.742, confirming that learning optimal intervention strategies through feedback significantly improves outcomes. The full HPINA policy achieves the best overall performance with a test F1-score of 0.973, gain of 12.1%, and reward of 0.801, while maintaining a strong training-to-testing consistency (0.985 to 0.973), demonstrating that the integration of adaptive gating with reinforcement learning leads to highly effective, robust, and optimized causal intervention strategies.
Table 10 evaluates the calibration quality and robustness of the proposed models, demonstrating consistent improvement as more advanced components are integrated into the HPINA framework. The baseline Transformer model exhibits relatively higher calibration error, with test ECE = 0.049 and Brier score = 0.091, along with a stability score of 0.911, indicating moderate reliability in probabilistic predictions. The HPINA base model improves calibration significantly, reducing the test ECE to 0.033 and Brier score to 0.068 while increasing stability to 0.941, reflecting better alignment between predicted probabilities and observed outcomes. Incorporating counterfactual consistency loss further enhances calibration (test ECE = 0.024, brier = 0.054, stability = 0.958), indicating that enforcing agreement between factual and counterfactual predictions improves probabilistic coherence. The addition of reinforcement learning-based policy optimization continues this trend, achieving test ECE = 0.021 and stability = 0.966, demonstrating improved robustness under dynamic decision scenarios. The full HPINA model achieves the best overall performance with the lowest test ECE of 0.017, lowest Brier score of 0.039, and highest stability of 0.978, while having minimal train–test discrepancy (0.010 vs. 0.017), confirming that the proposed framework produces well-calibrated, reliable, and highly stable predictions suitable for real-world intelligent transportation applications.
Figure 21 provides a comprehensive and quantitatively grounded validation of the proposed HPINA framework, clearly demonstrating its superiority across both performance and efficiency–complexity dimensions. As shown in subfigure (a), the full HPINA (optimized) achieves the highest predictive performance with a test F1 of 0.973, outperforming all baselines including HPINA + RL policy (0.964) and HPINA (wide) (0.956), while maintaining a structured scaling in computational cost (2.84M parameters, 149.6M FLOPs, 92.7 s training time, and 11.2 ms inference latency). In contrast, conventional models such as MLP (shallow) and LSTM (small) remain significantly limited, achieving only 0.875 and 0.893 F1, respectively, despite much lower complexity. The trade-off analysis in subfigure (b) further confirms that HPINA variants occupy the optimal Pareto frontier, where HPINA (base) already achieves 0.944 F1 at 7.3 ms inference, surpassing Transformer (light) (0.915 at 6.1 ms) and LSTM (deep) (0.908 at 5.4 ms), thus demonstrating that the proposed architecture delivers substantial accuracy gains without disproportionate latency increase. Moreover, subfigure (c) reveals a consistent and nonlinear improvement trend, where the transition from MLP to Full HPINA yields a total gain of approximately +0.098 in F1, with a notable jump from Transformer (light) to HPINA (base) (around +0.04 to +0.07), highlighting the critical contribution of the multi-domain fusion and spatio-temporal risk field modules. The incremental gains from HPINA (wide) (around +0.081) to HPINA + RL policy (around +0.091) and finally to full HPINA (around +0.098) further emphasize the effectiveness of integrating counterfactual reasoning and reinforcement learning, which represents a key novelty of this work. This observation is reinforced by the heatmap in subfigure (d), where although resource usage increases (memory rising from 936 MB in HPINA base to 1334 MB in full HPINA), the model achieves the highest efficiency-adjusted performance, confirming that the added complexity directly translates into meaningful predictive improvement rather than redundant overhead. Overall, the results demonstrate that HPINA not only achieves state-of-the-art predictive performance but also introduces a unified, causally aware framework capable of supporting interpretable and intervention-driven analysis, thereby advancing beyond traditional correlation-based intelligent transportation models.
Table 11 provides a fine-grained analysis of the contribution of each architectural component within the proposed HPINA framework, revealing how different modules collectively enhance both predictive and causal performance. The full model achieves the highest results, with a test F1-score of 0.973, an AUC of 0.996,
of 0.118, and RMSE of 0.097, establishing a strong performance baseline. Removing multi-domain fusion reduces test F1 to 0.947 and
to 0.081, confirming that integrating heterogeneous inputs is critical for capturing complex traffic dynamics. Similarly, excluding temporal attention and LSTM memory results in noticeable degradation (F1 = 0.954 and 0.945, respectively), demonstrating that both attention mechanisms and sequential memory are essential for modeling temporal dependencies. A more significant drop is observed when removing the spatio-temporal risk field (F1 = 0.936,
= 0.058, RMSE = 0.141), indicating that spatial diffusion of risk is a key factor in accurately modeling accident propagation across a network. The removal of the counterfactual intervention module leads to a substantial decline (F1 = 0.928) and eliminates
, highlighting that causal reasoning is indispensable for intervention analysis. Further analysis shows that higher-level causal and decision-making components also play a crucial role in refining performance. Excluding the causal inference layer reduces test F1 to 0.942 and
to 0.064, while removing the decision gate results in similar degradation (F1 = 0.938), confirming that structured and selective intervention activation is necessary for effective causal modeling. The absence of policy optimization decreases performance to F1 = 0.958 and
= 0.091, demonstrating that learning optimal intervention strategies contributes significantly to maximizing impact. Likewise, removing counterfactual consistency loss slightly reduces stability and causal alignment (F1 = 0.956,
= 0.086), while eliminating graph diffusion weights leads to weaker spatial modeling (F1 = 0.939,
= 0.061). Overall, the results reveal a clear hierarchical contribution of components, where lower-level modules (fusion, temporal modeling, diffusion) establish strong predictive foundations, and higher-level modules (counterfactual reasoning, gating, and policy learning) refine causal effectiveness, ultimately confirming that the full integration of all components is essential to achieve a robust, accurate, and interpretable intelligent transportation framework.
Table 12 presents a detailed efficiency and computational complexity analysis of representative architectures, highlighting the trade-off between performance and resource consumption. Simpler models such as a shallow MLP achieve a test F1-score of 0.875 with only 0.19 M parameters, 12.6 M FLOPs, and low-inference latency of 1.9 ms, but their limited representational capacity restricts predictive performance. As model complexity increases, LSTM-based architectures improve accuracy (F1 = 0.893 and 0.908 for small and deep variants) at the cost of higher computational demands, reaching up to 0.88 M parameters and 54.9 M FLOPs. Transformer-based models further enhance performance to 0.915 F1 but require 1.12 M parameters and increased memory usage (821 MB), reflecting the cost of attention mechanisms. The proposed HPINA models exhibit a consistent performance–complexity trade-off, where the base model were achieves 0.944 F1 with moderate overhead (1.46 M parameters, 7.3 ms inference), while the wide and RL-enhanced variants progressively improve to 0.956 and 0.964 F1, respectively, with increased computational cost. The full HPINA model delivers the best performance (F1 = 0.973) with 2.84 M parameters, 149.6 M FLOPs, and 11.2 ms inference time, representing approximately a 5.8% improvement over the Transformer baseline (0.915 → 0.973) at the expense of higher resource usage. Despite this increase, the model remains computationally feasible for real-time deployment, as inference latency remains within practical limits, demonstrating that the proposed framework achieves an effective balance between predictive accuracy, causal capability, and computational efficiency.
The sensitivity analysis in
Table 13 provides a structured robustness assessment of HPINA under progressively stronger potential unobserved confounding. In the no-confounding setting (
), the framework achieves a test F1-score of 0.958, an AUC of 0.989, an ECE of 0.021, an estimated intervention effect
of 0.091, and a relative risk reduction of 0.113. Under low hidden confounding (
), the performance degradation remains limited, with the Test F1-score decreasing slightly to 0.952, the AUC to 0.984, and
to 0.086. When the confounding level increases to a moderate setting (
), the framework still preserves strong predictive and intervention-oriented behavior, yielding a Test F1-score of 0.944, an AUC of 0.978, an ECE of 0.028, and
, corresponding to a relative risk reduction of 0.098. Even under elevated hidden confounding (
), HPINA maintains acceptable stability, with a test F1-score of 0.933 and a positive intervention effect of 0.071, although the calibration error rises to 0.034. Under the most severe examined setting (
), the model performance declines more visibly, with the test F1-score reaching 0.919, the AUC decreasing to 0.959, and
dropping to 0.062; however, the intervention effect remains directionally consistent and nonzero. Overall, these results suggest that although the proposed framework is not immune to hidden-confounding bias, its predictive reliability and intervention-signaling capacity remain reasonably robust under low-to-moderate unobserved confounding, with degradation occurring in a gradual rather than catastrophic manner. This behavior supports the interpretation of HPINA as a causally informed decision-support framework whose estimated intervention effects are stable within moderate perturbations of the latent confounding structure while also highlighting the importance of future formal hidden-confounder sensitivity analysis for stronger empirical substantiation.
Table 14 presents a progressive, step-by-step evaluation of how each major component contributes to the overall performance of the HPINA framework, clearly illustrating the cumulative impact of architectural integration. Starting from the Temporal Encoder baseline, the model achieves a test F1-score of 0.908 and AUC of 0.955, establishing a foundation for temporal representation learning. The addition of multi-domain fusion increases performance to 0.928 (+2.20%), highlighting the importance of integrating heterogeneous traffic and environmental features. Incorporating the spatio-temporal risk field further boosts performance to 0.946 with
, demonstrating the critical role of spatial diffusion in modeling risk propagation. The introduction of the counterfactual module
significantly enhances both predictive and causal performance (F1 = 0.958,
), followed by a causal inference layer, which refines intervention reasoning and raise performance to 0.964. The decision gate further improves selective intervention effectiveness (F1 = 0.969,
), while a final addition of policy optimization yields the best results with a test F1-score of 0.973, AUC of 0.996, and
, corresponding to an overall relative gain of +7.16%. This incremental progression clearly demonstrates that each component contributes meaningfully, and that the full integration of temporal, spatial, and causal modules is essential to achieve a high-performance, interpretable, and intervention-aware intelligent transportation framework.
Figure 22 demonstrates the stability and learning efficiency of the proposed HPINA variants compared to baseline models across both training and validation phases. In the training loss curve, all models exhibit a consistent downward trend; however, HPINA-based models achieve smoother and more stable convergence. Specifically, LSTM (small) shows a rapid initial decrease from approximately 1.12 to 0.30 within the first 15 epochs but suffers from noticeable fluctuations afterward, indicating limited stability. In contrast, Transformer (light) and HPINA (base) achieve more controlled convergence, reaching around 0.10 and 0.08 training loss at epochs 40 and 60, respectively. The HPINA + RL policy further improves stability, reducing the loss to nearly 0.06 by epoch 70, while the Full HPINA achieves the lowest final training loss of approximately 0.03 at epoch 95, with a notably smoother trajectory. A similar pattern is observed in the validation loss, where early-stage instability is more pronounced in baseline models, with LSTM (small) fluctuating between 1.05 and 0.50 during the first 10 epochs. In contrast, HPINA variants demonstrate faster generalization, as HPINA (base) reduces validation loss to approximately 0.10 by epoch 60, outperforming Transformer (light) (around 0.12) and LSTM (deep) equivalents. As shown in the
Table 15 the Full HPINA achieves the best validation performance, converging to approximately 0.05, while maintaining minimal oscillations, indicating strong generalization and reduced overfitting. Importantly, the reduced gap between training and validation loss in HPINA models highlights the effectiveness of the proposed multi-domain fusion, spatio-temporal risk modeling, and counterfactual reinforcement components in stabilizing learning dynamics. These results confirm that the proposed framework not only improves predictive accuracy but also ensures robust and reliable convergence behavior, which is critical for real-world deployment in intelligent transportation systems.
Table 16 provides a deployment-oriented quantitative assessment of the proposed HPINA framework, demonstrating that the model maintains a strong balance between predictive sophistication and real-time operational feasibility. Specifically, the framework contains
trainable parameters, which places it within a moderate complexity range for modern edge-oriented intelligent transportation applications, especially when compared with heavier centralized deep architectures. More importantly, the measured inference latency of
ms confirms that HPINA can satisfy strict real-time decision requirements, remaining comfortably below the imposed target of 20 ms. This indicates that the framework is capable of generating rapid risk predictions and intervention decisions without introducing substantial computational delay. From a communication perspective, the table further distinguishes between 5G and DSRC conditions, where
–10 ms and
–100 ms, respectively. This comparison is particularly important because it reveals that while 5G-supported synchronization can remain compatible with near-real-time response, DSRC-layer variability may significantly increase end-to-end latency. For this reason, the total decision delay is explicitly represented as
, showing that communication overhead becomes the dominant factor whenever remote or network-assisted execution is involved. Consequently, the local execution mode, with
ms, is the most reliable operational configuration for time-critical safety intervention.
The table also shows that HPINA is not designed merely for fast inference, but for robust production-oriented operation under uncertainty and degraded communication conditions. This is reflected in the inclusion of explicit control and fail-safe parameters such as the intervention threshold , the confidence margin , and the maximum tolerated delay ms. The decision function activates intervention only when the estimated system criticality exceeds , thereby preventing unnecessary or unstable responses in non-critical traffic states. In addition, the fail-safe trigger is activated whenever prediction confidence falls below or when the experienced delay exceeds the safety limit , forcing the system to revert to the rule-based fallback policy . This mechanism is essential in production environments because it ensures that delayed communication, uncertain predictions, or partial infrastructure failure do not propagate into unsafe intervention decisions. The latency degradation margin, defined as , further quantifies the additional overhead introduced by remote-assisted execution, reinforcing the practical advantage of edge-local deployment. Moreover, the optional compression factor indicates that the architecture remains suitable for further optimization through pruning or quantization if stricter hardware constraints arise. These results demonstrate that HPINA offers a strong predictive intelligence and a technically grounded deployment profile characterized by bounded latency, controlled intervention activation, graceful degradation, and explicit safety-preserving fallback behavior.
Interpretability Case Studies for Traffic Management
To make the interpretability contribution operationally explicit, we provide representative counterfactual traffic-management scenarios illustrating how the proposed framework can support practical decision-making. In each case, the system compares the factual predicted risk with the counterfactual risk obtained under a modeled intervention and reports the corresponding intervention effect . This allows traffic managers to move beyond passive monitoring and instead evaluate which controllable change is most likely to reduce risk under the current spatio-temporal conditions.
For example, in a peak-hour congestion scenario, the framework may identify a high-risk corridor with elevated density and strong spatial spillover from adjacent nodes. A counterfactual intervention that reduces effective congestion intensity or improves signal coordination can then be simulated, and the resulting decrease in predicted risk can be used to justify proactive traffic-control action. In a second scenario involving adverse environmental conditions, such as reduced visibility or rainfall-related deterioration, the model can estimate how a weather-aware intervention strategy modifies the local and propagated risk state. Similarly, in an incident-spillover scenario, the framework can compare baseline risk against a counterfactual response in which upstream disruption is mitigated earlier, thereby revealing how local intervention may reduce downstream network-level risk.
Table 17 case-oriented explanations are valuable for traffic managers because they do not merely state that a location is risky; they indicate why the risk is elevated, which modeled intervention variables are most relevant, and how strongly the estimated risk may change if a targeted action is applied. In this way, the proposed counterfactual module supports interpretable, scenario-based decision reasoning that is more aligned with real operational traffic management than prediction-only outputs.