1. Introduction
Pavement surface macrotexture is critical to road safety and operational performance, directly influencing friction, noise generation [
1,
2], and rolling resistance [
3]. The progressive degradation of surface macrotexture over time is a significant concern for highway agencies, affecting user safety, vehicle emissions, and maintenance planning. Research consistently shows that both microtexture and macrotexture contribute to tire–road friction, with microtexture dominant at low speeds and macrotexture at higher speeds [
1,
4]. Field and laboratory studies indicate that macrotexture strongly influences friction under wet conditions, making macrotexture monitoring essential for wet-weather safety [
4] and a relevant variable for friction modeling [
5], despite low correlations at the network level [
6]. Furthermore, macrotexture is responsible for a significant amount of energy loss at the tire–road interface, accounting for a large share of greenhouse gas (GHG) emissions [
3]. Recent studies also emphasize that skid resistance should be assessed across multiple texture scales and measurement methods, as pavement surface features from the micro- to macro-scale interact with tire hysteresis and adhesion mechanisms during tire–road contact [
7].
In the context of Portuguese highways, where traffic volumes continue to increase, and climatic conditions vary considerably across regions, identifying the mechanisms and factors driving macrotexture deterioration is essential for developing effective and sustainable pavement management strategies.
Texture degradation is a complex phenomenon influenced by multiple interacting factors. Traffic loading, measured as cumulative axle loads or equivalent single axle loads (ESALs), has been identified as a significant factor in accelerating texture polishing [
5,
7] and promoting material loss [
8]. Environmental and climatic conditions, including precipitation, humidity, temperature variations, and freeze–thaw cycles, contribute substantially to the physical and chemical deterioration of pavement surfaces [
8]. Additionally, pavement structural characteristics and material properties control degradation rates, with different mixture types and surface layer designs producing distinct deterioration curves [
9].
Recent studies have also shown that surface texture deterioration directly impacts tire–pavement friction mechanisms, especially hysteresis-based friction components that rely on aggregate shape and texture depth. Numerical simulations and experimental analyses have demonstrated that gradual texture smoothing can significantly decrease friction performance in both dry and wet conditions [
10].
Similarly, investigations of runway pavements have shown that macrotexture deterioration, combined with wet surface conditions, can significantly reduce skid resistance, underscoring the safety implications of texture changes over time [
11].
Geometric features and spatial variations, such as differences between wheel paths and pavement edges, further introduce site-specific variations that can significantly affect degradation patterns [
12]. Despite the recognized importance of these factors, existing macrotexture prediction models often fail to adequately capture the hierarchical nature of pavement data and the influence of context-specific variables.
Although considerable research has focused on pavement performance modeling, the macrotexture degradation in high-speed road networks has received comparatively less attention than modeling based on laboratory tests, outdoor accelerated tests, or other scale textures, such as microtexture associated with friction [
13], or even distresses like rutting or cracking. Existing macrotexture models often rely on deterministic approaches that assume homogeneous degradation patterns across pavement sections, neglecting the inherent variability associated with site-specific conditions [
14]. Furthermore, many models have been developed using data from specific geographic regions and may not be directly transferable to the Portuguese context, where climatic patterns, traffic characteristics, and construction practices differ from those in other countries.
State-of-the-art research has identified several critical limitations in current macrotexture degradation modeling approaches. First, limited long-term and high-frequency datasets undermine the robustness of long-term predictions, and studies show that longer time series and appropriate time scales for input data significantly improve model performance [
15]. Second, representativeness and network coverage remain constraints, as project-level degradation curves may not adequately represent wider networks, particularly when maintenance treatments alter trends [
9]. Third, measurement standardization, sensor interoperability, and threshold definitions for texture and skid resistance vary across studies, creating issues with data quality and comparability [
2]. Fourth, unobserved heterogeneity arising from material properties, construction variability, and other unmeasured factors requires advanced statistical treatment to produce accurate section-specific predictions [
16].
Advanced statistical methodologies, particularly linear mixed-effects models (LMMs), provide a rigorous framework for addressing these limitations. LMMs have proven effective for panel and time-series macrotexture and friction data, as they can accommodate the hierarchical structure inherent in pavement monitoring data, where repeated measurements are nested within road segments while simultaneously accounting for both fixed effects (systematic influences of explanatory variables) and random effects (unobserved heterogeneity across segments) [
14,
15].
Recent applications have demonstrated that mixed-effects formulations allow for the separation of population-level and section-level effects, providing more accurate predictions by properly handling repeated-measures correlations [
17,
18]. This methodological approach enables more reliable predictions and provides insights into the relative importance of various factors influencing texture degradation.
The present study aims to develop comprehensive macrotexture degradation models, specifically calibrated for Portuguese highway conditions, using linear mixed-effects modeling techniques. The primary objectives are (i) to characterize the degradation patterns of macrotexture on flexible pavements in the Portuguese highway network over time; (ii) to quantify the influence of traffic volume, climatic conditions, pavement structural characteristics, geometric features, and geographic location on macrotexture degradation rates; (iii) to develop predictive models that account for the hierarchical structure of pavement data and capture both within-segment and between-segment variability through random intercept and random slope specifications; and (iv) to assess the predictive performance of alternative model specifications, structured according to the availability and ease of data acquisition by road agencies, by comparing models including only traffic and climatic covariates with models additionally incorporating pavement and geometric characteristics using cross-validation procedures.
This research contributes to pavement management in several relevant ways. First, it provides empirically grounded insights into texture degradation mechanisms under Portuguese operating conditions, addressing a gap in the literature, where most models have been developed for other geographic contexts [
8,
9]. Second, the use of linear mixed-effects models with a two-level data structure (road segments at level 2, repeated measurements at level 1) represents a methodologically rigorous approach that explicitly accounts for the hierarchical and heterogeneous nature of the data, offering advantages over traditional deterministic regression techniques that assume independence and homogeneity [
14,
16]. Third, the systematic evaluation of traffic, climatic, structural, geometric, and spatial factors enables highway agencies to identify critical determinants of texture deterioration and prioritize interventions accordingly, addressing the call for models that incorporate site-specific conditions [
9,
15].
From a practical perspective, the developed models can support more informed decision-making in pavement maintenance planning and resource allocation. By accurately predicting macrotexture degradation patterns and identifying sections at higher risk of rapid deterioration, highway managers can optimize intervention timing and select appropriate treatment strategies. Cross-validation to assess predictive performance ensures that the models are robust and reliable for practical application [
15]. Furthermore, the modeling framework is sufficiently flexible to accommodate additional variables and adapt to other pavement networks, thereby enhancing its broader applicability beyond the Portuguese context.
The study also contributes methodologically by addressing several limitations identified in previous research. By using data from a Portuguese motorway concessionaire, complemented with weather-related information, the study addresses concerns about data representativeness and network coverage [
9]. The inclusion of a broad set of candidate variables, grouped into five categories (traffic volume, climate data, pavement design characteristics, geometric features, and spatial location), responds to findings that multiple interacting factors drive texture degradation [
8,
12]. The two-level hierarchical structure and random-effects specification directly address the need to model unobserved heterogeneity and section-specific effects [
16,
17].
2. Methodology
A review of the literature highlighted the need for surface-texture degradation models that explicitly account for site-specific conditions and the suitability of regression-based approaches for this purpose. Informed by these findings, the present study aims to characterize the degradation of surface texture on flexible pavements and to assess the influence of traffic loading, climatic conditions, pavement structural characteristics, roadway geometry, and geographic location on this process.
The methodological framework was organized into three sequential phases: (i) defining the study context and collecting data, (ii) developing and applying the modeling framework to address the research objectives, and (iii) discussing the results.
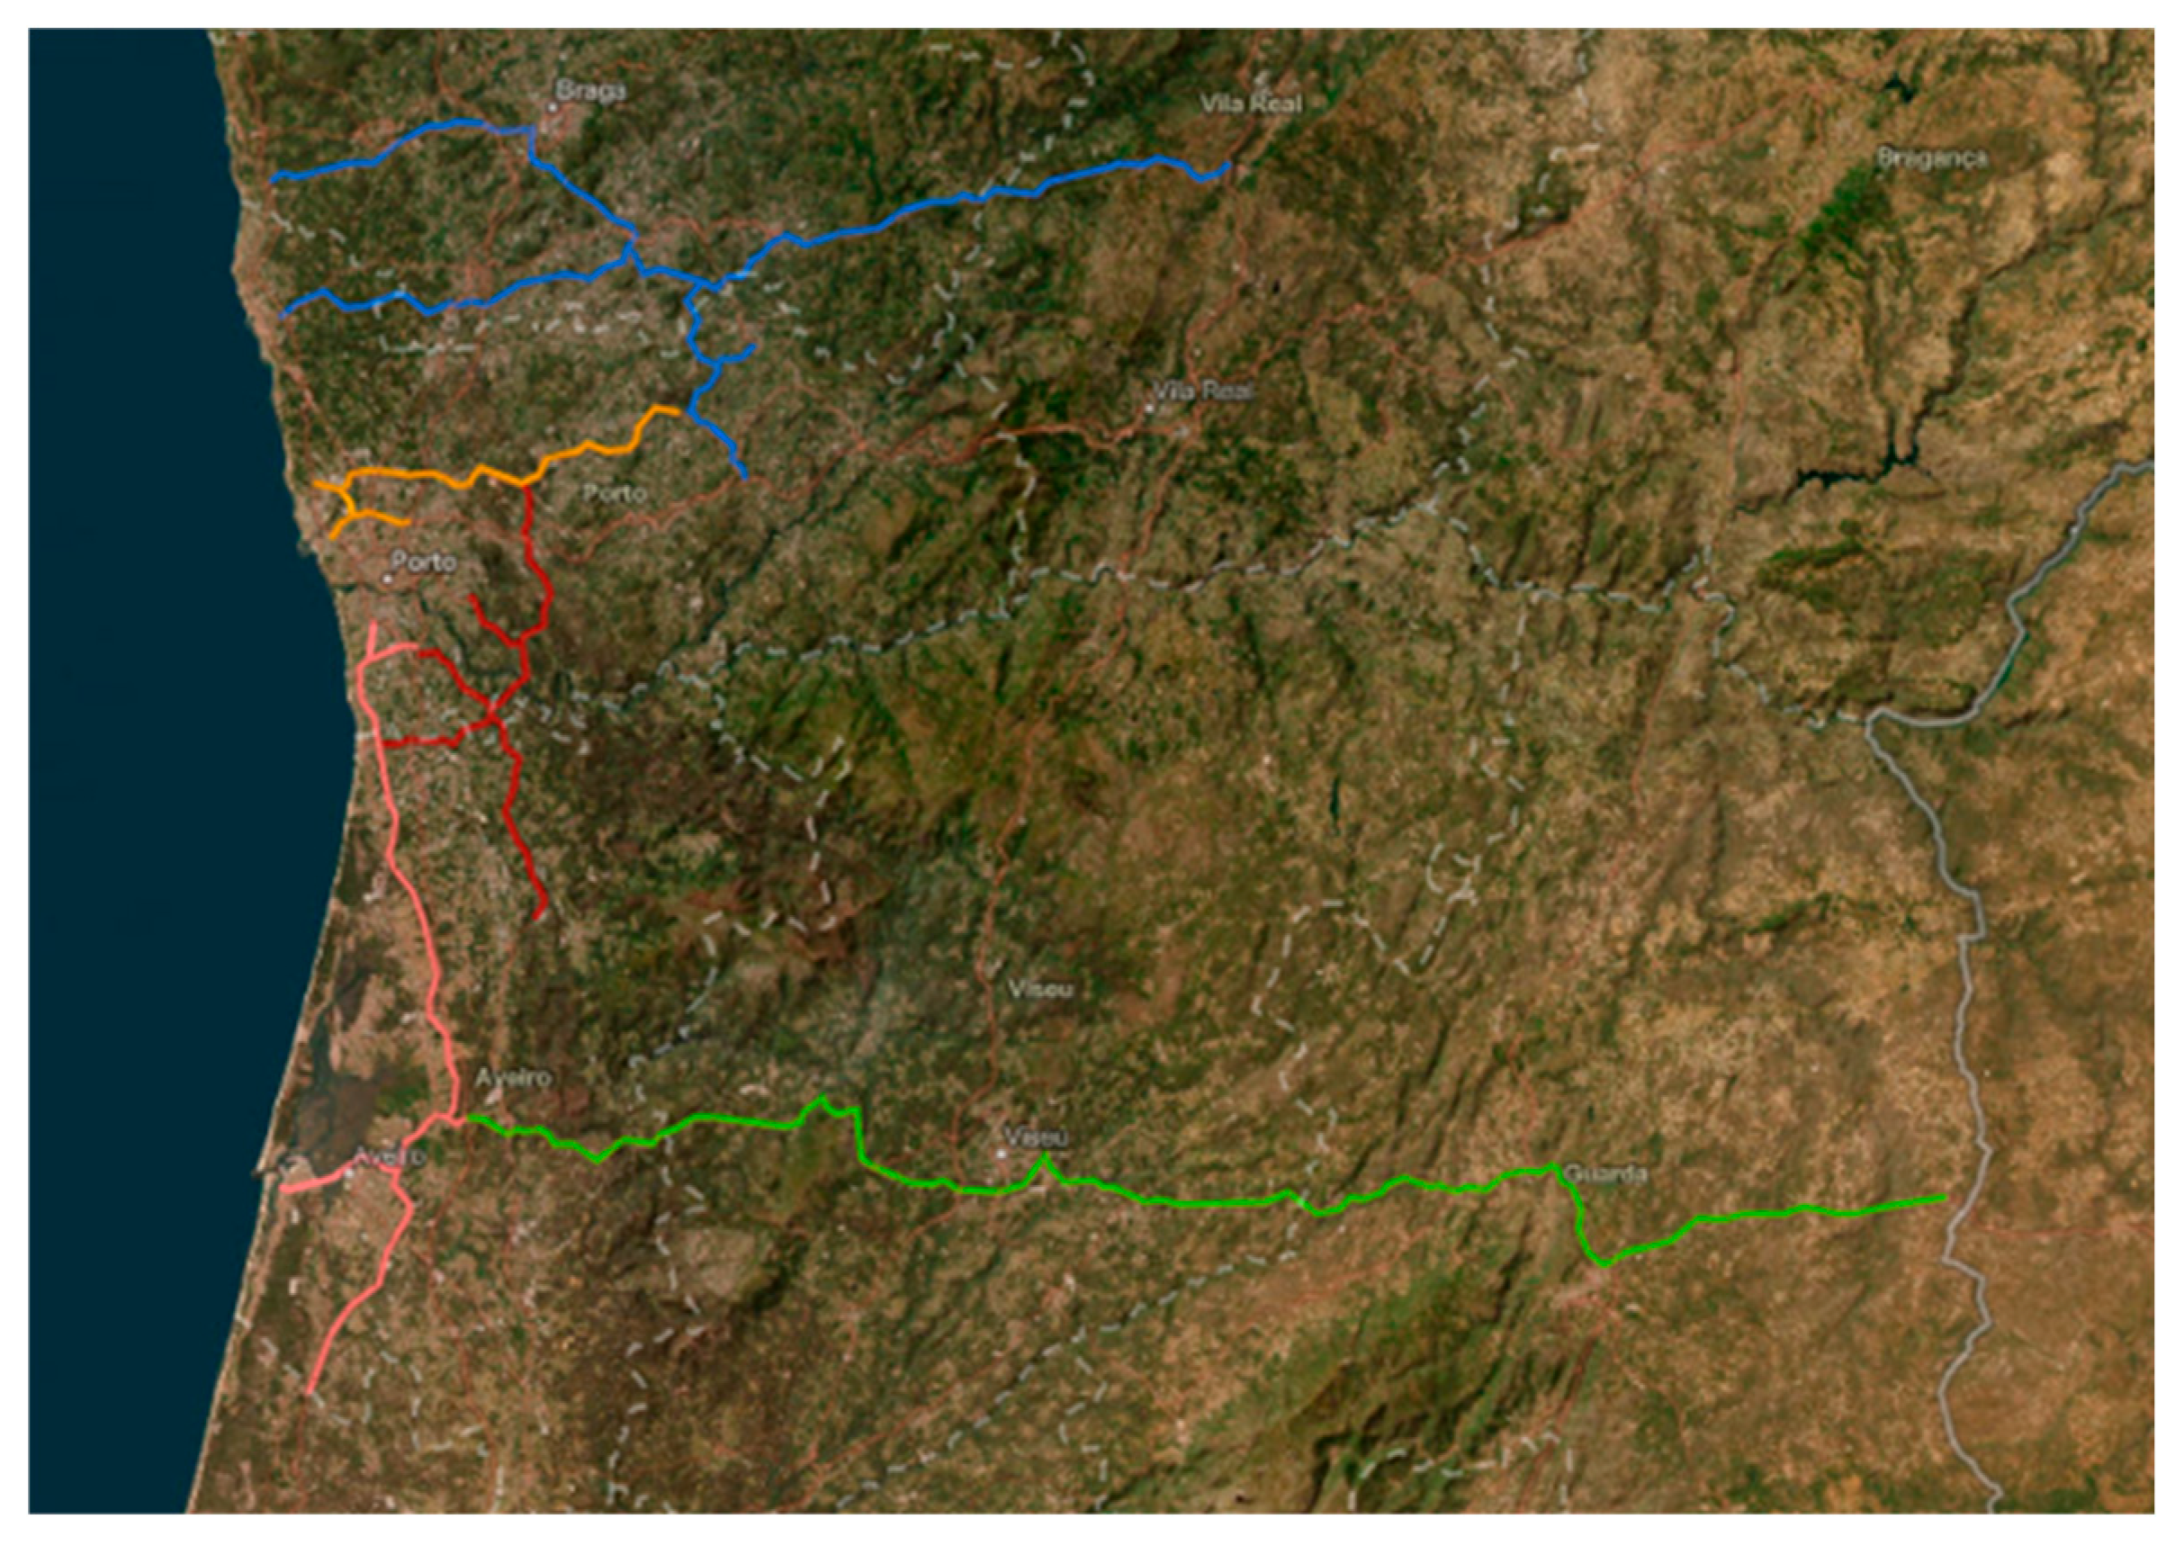
In the first phase, data were obtained from a Portuguese motorway concessionaire and supplemented with meteorological information. A comprehensive set of candidate explanatory variables was identified based on previous studies and the structure of existing texture degradation models. These variables were grouped into five categories: traffic volume, climatic conditions, pavement design characteristics, geometric features, and spatial location. An initial exploratory data analysis was conducted to assess data quality and variable distributions.
In the second phase, LMMs with random intercepts and random slopes were estimated using a two-level hierarchical structure, with road segments at Level 2 and repeated surface texture measurements over time at Level 1. Two specifications were considered: (a) models including only traffic- and climate-related variables and (b) models incorporating pavement structural and geometric characteristics. Model predictive performance was then evaluated using cross-validation.
Lastly, the results were discussed from an engineering perspective.
The remainder of this paper is organized as follows.
Section 3 describes the materials and data sources, as well as the methodological procedures adopted.
Section 4 presents the modeling approach and compares the results. Finally,
Section 5 provides the results, discussion, and conclusions.
4. Modeling Approach and Results
4.1. Formulation
LMMs are statistical models that incorporate both fixed and random effects, with each type of effect entering the model linearly. LMMs are particularly useful for analyzing data with correlated observations, such as repeated measures, as presented in this study. Here, pavement sections were identified by their PK, and repeated texture measurements were taken over time for each PK.
LMMs extend traditional linear models by including random effects, which serve as additional error terms to account for correlation among observations. In this context, many pavement sections exhibited unobserved heterogeneity, differences across sections not captured by observed covariates. This unobserved variability was addressed by employing random-intercept and random-slope models, allowing each section to have its own baseline level of texture and for the effect of time to vary across sections. Time was specified as a random slope to allow the texture evolution rates to vary across pavement sections, while the remaining covariates were treated as fixed effects to ensure numerical stability. The linear mixed-effects model for the
i-th pavement section can be expressed as follows:
where:
Yi = represents a vector (of size Ti × 1) of responses for the i-th PK.
Xi = is the known fixed-effects covariates matrix (of size Ti × p).
β = is a vector (of size p × 1) of unknown regression coefficients (or fixed-effects parameters).
bi = is a vector (of size q × 1) of random-effects associated with the i-th PK;
Zi= is the random-effects covariates matrix (of size Ti × q);
εi = represents an error vector (of size Ti × 1) of n residuals associated with an observed response for the i-th PK.
Moreover,
Where D is the q × q covariance matrix for the random effects, and Ri is the Ti × Ti covariance matrix of the errors in kilometric point i. In this study, we considered two alternative structures to the covariance matrix of the errors (Ri): conditionally independent errors and first-order autoregressive errors (AR(1)).
In general terms, maximum likelihood methods (Maximum Likelihood, ML, or Restricted Maximum Likelihood, REML) estimate the parameters in LMM. However, ML estimates of the covariance parameters tend to be biased, whereas REML estimates are unbiased.
Following the methodology described by Pinheiro and Bates [
22], the significance of fixed-effects terms in the model was evaluated using conditional F-tests based on a sequential sum-of-squares approach. When comparing nested models that differ only in the fixed-effects structure, the likelihood ratio test (LRT) is used. This test compares the log-likelihoods of the two models and is valid only when the fixed effects are estimated by ML [
22].
Akaike’s Information Criterion (AIC) [
22] and Bayesian Information Criterion (BIC) [
23] are also used to compare models. These criteria account for model fit, the number of estimated parameters, and the sample size. The model with the lowest AIC or BIC value best balances goodness-of-fit and parsimony. In this study, both AIC and BIC were used to determine the most appropriate structure for the residual covariance matrix (Ri), which captured the correlation among repeated measurements within each kilometric point.
Cross-validation techniques were used to evaluate the predictive performance of the models. In particular, the k-fold cross-validation method was adopted, as it is considered one of the most robust techniques for estimating model accuracy. In k-fold cross-validation, the dataset is randomly divided into k equal-sized subsets. One subset is used to train the model, and the remaining subsets are used to test it. This process is repeated k times so that each subset is used once as the test set. The prediction error is computed as the mean squared difference between observed and predicted values.
To maintain the hierarchical structure of the dataset, cross-validation was conducted at the pavement-section (PK) level instead of at the individual observation level. The dataset was randomly divided into ten mutually exclusive groups of pavement sections. In each iteration, the model was trained on all observations from sections in nine folds and tested on the remaining fold. This approach ensured that repeated measurements from the same pavement section were not simultaneously included in both the training and testing sets, thereby preventing information leakage and providing a more accurate assessment of predictive performance for hierarchical longitudinal data.
To quantify predictive performance, the root mean squared error (RMSE), mean absolute error (MAE), and mean bias error (MBE) were used. Smaller values for these metrics indicate more accurate predictions.
All statistical analyses were conducted using R statistical software (version 4.5.0) and the library
nlme was employed to estimate the model [
24].
4.2. Modelling Results
Two models were considered: Model I, which included only traffic- and climate-related variables, and Model II, which extended Model I by incorporating pavement and geometric variables. Model predictions were generated at the 100 m pavement section level, which matches the spatial resolution used in the concessionaire’s monitoring and maintenance planning.
Initially, the two error covariance structures were evaluated to determine the most appropriate specification for the errors in each model (
Table 7).
Based on the AIC and BIC values, the AR(1) structure was found to best capture the temporal correlation in both models, indicating that errors from measurements taken closer in time are more strongly correlated than those from measurements taken further apart. The results of the likelihood ratio test also show that the AR(1) error structure captured the temporal correlation significantly better than the independence structure for both models. The parameter estimates, standard errors (SE), and
p-values for the two models with the AR(1) structure are summarized in
Table 8.
For Model I (Equation (2)), the covariates found to be statistically significant were Time, Ac.ADT, Low min temp, Average no. days temp max25, and P. By incorporating the statistically significant covariates related to highway characteristics into Model I, Model II (Equation (3)) was obtained. The resulting models are as follows:
Model II
where
with
, where
, with
and
.
At first glance, the estimated fixed coefficients exhibited similar magnitudes, indicating that refining the covariance structure had little effect on the parameter estimates.
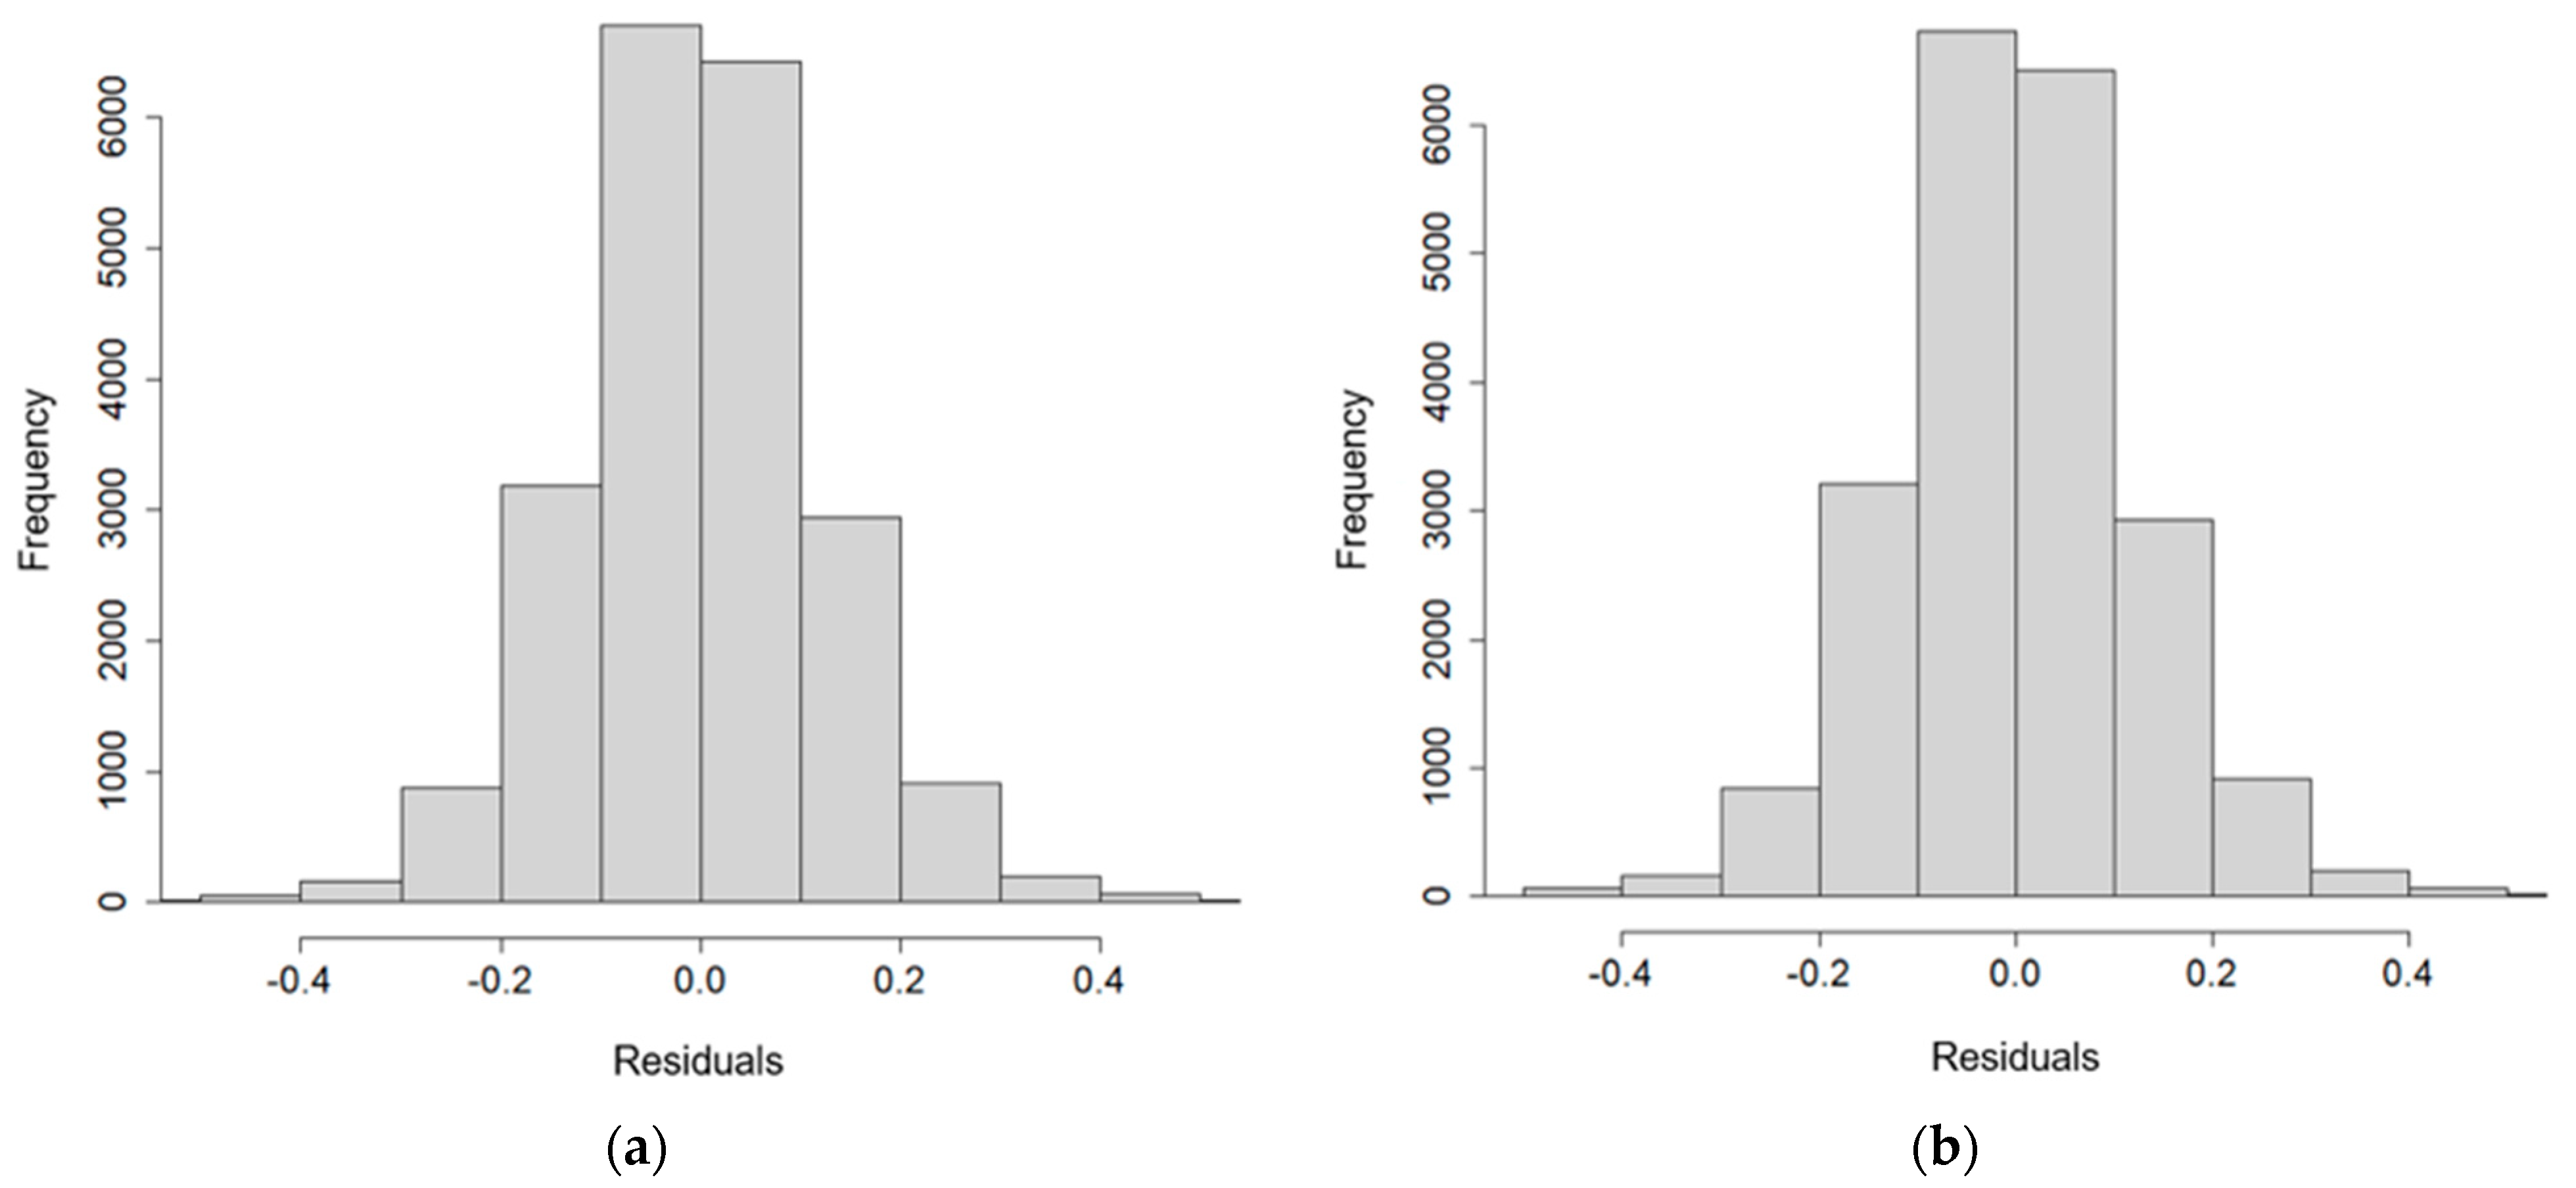
Figure 2 shows the histogram of the standardized residuals.
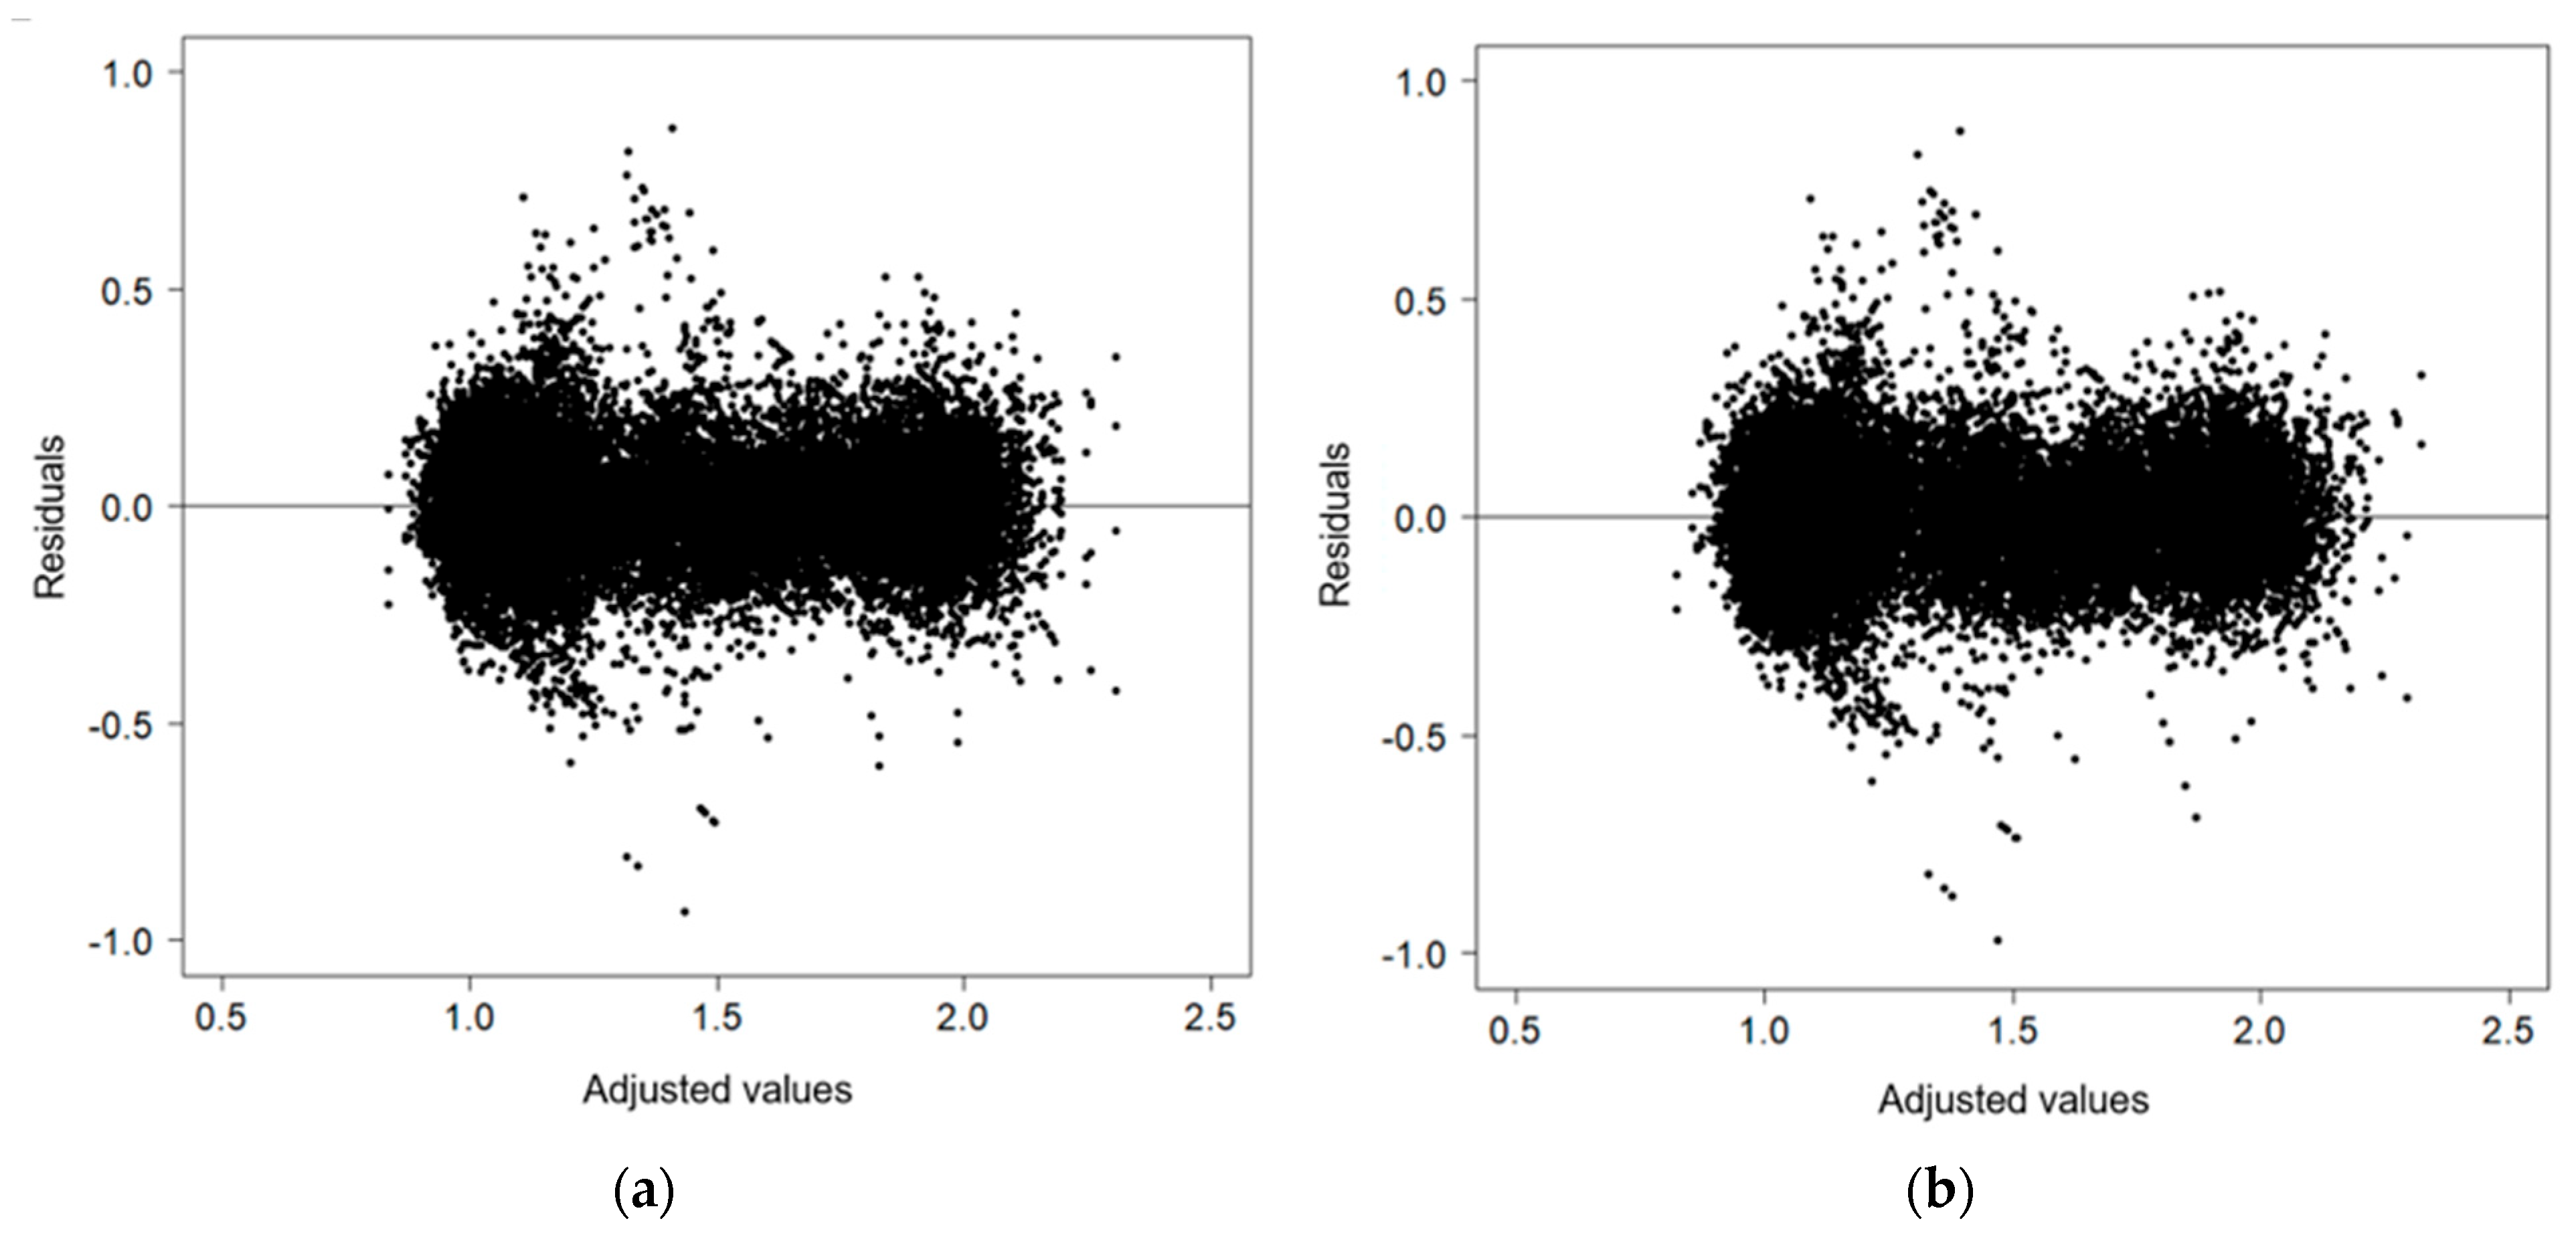
The graphs of residuals versus fitted values for each model were analyzed to assess the adequacy of the curve fit (
Figure 3). For a model to fit the data well, residuals should be randomly distributed around the horizontal line at zero. The residuals appeared to be homogeneously distributed, indicating that the models provided a satisfactory fit to the data.
4.3. Comparison of Models
Table 9 resumes the goodness-of-fit statistics for the two models. Model II had substantially lower AIC and BIC values (AIC = −17,285.40; BIC = −17,141.75) compared to Model I (AIC = −13,817.50; BIC = −13,729.72), indicating a better fit. This was confirmed by the likelihood ratio test, which yielded a highly significant result (LRT = 3481.90;
p < 0.0001), demonstrating that Model II provided a significantly better goodness-of-fit than Model I.
4.4. Model Comparison of Predictive Abilities
To evaluate the predictive performance of the models quantitatively, a tenfold cross-validation was implemented. The model comparison results are shown in
Table 10. The results show that Model II performed better in predictive ability for future observations, yielding the smallest RMSE, MAE, and MBE.
5. Discussion
The present study investigated surface macrotexture evolution on Portuguese highways using linear mixed-effects models that account for repeated measurements and section-level heterogeneity. The results indicate that temporal macrotexture variation, described by MPD, is statistically associated with traffic exposure, climatic conditions, pavement surface type, and selected geometric and spatial characteristics. These findings support the applicability of mixed-effects modeling frameworks for pavement surface performance analysis, as previously suggested in the literature [
14,
16,
17].
The time effect, which was statistically significant in both model specifications, indicates a systematic increase in MPD measurements across the monitoring cycles considered in this study. Given the data collection protocol and the absence of maintenance interventions during the observation period, this result reflects changes in surface macrotexture under normal service conditions. Similar time-dependent behavior in pavement surface indicators has been reported in earlier studies using repeated-measurement datasets [
9,
15].
The positive coefficients for Time and Ac.ADT indicate a rising MPD trend during the observation period. Although pavement surface texture is usually expected to decrease over time because of aggregate polishing and surface wear, the pattern observed in this study matches an early-life surface evolution phase often reported for newly built asphalt pavements.
In the studied network, the first monitoring cycle took place roughly six to eight months after the roads became operational. At this stage, the pavement surface might still have a relatively thick asphalt binder film partially covering the aggregates. As traffic load increases during the initial years of service, this excess binder is gradually worn away, revealing the aggregate skeleton and increasing the apparent macrotexture depth. This process can cause a seeming rise in MPD during the early life of the pavement before longer-term degradation processes, such as aggregate polishing and material loss, become dominant. Therefore, the increasing MPD trend observed in the models should be interpreted as reflecting the initial surface-stabilization phase rather than long-term macrotexture growth. Over extended monitoring periods, it is expected that the texture evolution curve will eventually reach a peak, followed by a gradual decline as polishing, and wear processes become more prominent.
The results further indicate a statistically significant and positive association between accumulated traffic volume and texture (MPD increases with traffic). This finding aligns with prior research identifying traffic loading as a primary driver of surface wear. However, traffic often acts at the surface by smoothing and polishing [
8,
12,
15]. In this study, Ac.ADT raised the MPD, confirming the trend found by Huang et al. on outdoor accelerated tests [
4]. Moreover, using measured traffic data for modeling rather than design estimates reduces uncertainty about traffic assumptions and aligns with recommendations from prior network-level pavement performance studies [
9].
Several climatic variables were also found to be statistically significant. The negative associations observed for the lower minimum temperature and for the Ac. no. days temp max25 suggest that thermal exposure is related to macrotexture evolution within the analyzed network. These results suggest that both high and low temperatures may contribute to reductions in MPD, although through different mechanisms related to the rheological behavior of asphalt mixtures and aggregate–binder interaction [
8,
25].
At high temperatures, the asphalt binder becomes softer and more susceptible to viscous flow. Under repeated traffic loads, this softening can lead to localized binder migration, partial filling of surface voids, and slight aggregate reorientation within the surface layer. These processes can gradually level the pavement surface, decreasing the height of surface irregularities that create macrotexture. Additionally, higher temperatures may accelerate binder aging and oxidation, altering the mixture’s mechanical properties and influencing surface development over time.
On the other hand, low temperatures stiffen the binder and reduce the asphalt mixture’s ability to withstand traffic loads. Under these conditions, the pavement surface becomes more brittle, which can lead to microcracking or localized aggregate loss. Although these processes differ from those at high temperatures, they can also change the surface profile, ultimately lowering the measured MPD values. Therefore, the combined effects of temperature extremes demonstrate a complex interaction between climate exposure, traffic loading, and material properties that affect macrotexture development.
The negative coefficient associated with precipitation suggests that moisture exposure may contribute to changes in surface texture, in agreement with findings from previous investigations of pavement surface performance [
8,
12]. Although the monitoring period did not capture very long-term climatic trends, the observed associations indicate that spatial climatic variability is relevant in the Portuguese context. As in Portuguese motorways, maintenance activities involving the pavement surface often occur about 10 years after construction. Therefore, weather-related variables might be even more relevant if larger lifespans are considered.
Including pavement structural and geometric variables in Model II substantially improved model fit and predictive performance compared with Model I. This outcome suggests that traffic and climate variables alone are insufficient to fully explain the observed macrotexture variability, consistent with earlier panel-data analyses of pavement surface characteristics, namely friction [
9,
14], which reveal contradictory effects [
13], supporting the pertinence of the separate study of the macrotexture performance [
5]. The statistically significant positive coefficients for porous asphalt (PA) indicate higher texture levels than for gap-graded asphalt concrete, consistent with established knowledge of the macrotexture characteristics of porous asphalt surfaces [
1,
4]. The effect observed for rubber-modified gap-graded asphalt further highlights the influence of surface course composition on texture behavior.
The significance of lane position suggests that operational factors related to traffic distribution across lanes are associated with differences in macrotexture. In particular, higher MPD values in the right and slow lanes reflect differences in traffic composition and loading patterns typical of multi-lane highway operation, as reported in previous studies [
9,
12]. On many motorways, the outer lanes carry a higher proportion of heavy vehicles, which generate greater vertical loads and shear stresses at the tire–pavement interface than passenger vehicles [
5]. These loading conditions can accelerate processes such as aggregate exposure and localized binder removal at the pavement surface. As the binder film surrounding the aggregates is gradually worn away, the aggregate particles become more exposed, increasing the macrotexture amplitude measured by MPD. Also, over time, the aggressive shear stress promotes aggregate removal, particularly in porous, gap-graded surface layers, as in this study. In this mechanism, extreme temperatures exert a smoothing effect by reducing the MPD. Evidence supporting this performance is hard to find, as long-term field studies are scarce; however, early-stage field studies point in this direction. In contrast, the left lane generally carries a higher proportion of light vehicles traveling at higher speeds, which may result in greater polishing of the aggregate surface and less pronounced macrotexture development.
Additionally, vehicle trajectories in the outer lanes tend to be more concentrated within the wheel paths of heavy vehicles, which may intensify localized mechanical interaction between tires and the pavement surface. Over time, these traffic-induced mechanisms can generate spatial variability in texture evolution across lanes. Although the statistical model identifies associations rather than direct causal relationships, the observed pattern is consistent with previously reported differences in pavement surface characteristics resulting from heterogeneous traffic distribution across lanes.
Similarly, the effect of vertical alignment, particularly in slope sections, indicates that roadway geometry is associated with measurable variation in texture evolution, although these relationships should be interpreted as statistical associations rather than causal effects. The absence of plan variables’ effects on MPD for asphalt surfaces aligns with the inconsistent performance found in [
6], asking for an interaction analysis.
The negative association observed in low-altitude sections suggests the presence of residual spatial variability that may reflect combined environmental and operational influences not fully captured by individual explanatory variables. This finding aligns with previous studies emphasizing the role of geographic context in pavement performance modeling [
8,
16].
From a methodological perspective, the statistically significant random effects confirm substantial between-section variability, supporting the use of mixed-effects models for texture analysis. In addition, the superiority of the AR(1) error structure indicates that temporal correlation among repeated measurements is relevant and should be explicitly accounted for, in line with recommendations from previous pavement modeling studies [
14,
17].
The cross-validation results indicate that Model II provides improved predictive performance, as reflected in lower RMSE and MAE values. This suggests that incorporating pavement and geometric characteristics enhances the model’s ability to predict future texture observations, which is essential for practical pavement management applications [
9,
15].
6. Conclusions
This study proposed linear mixed-effects models to analyze surface macrotexture evolution on Portuguese highways, described by the MPD, using network-level monitoring data. The results indicate that surface MPD variation over time is statistically associated with cumulative traffic loading, climatic conditions, pavement surface type, lane position, and selected geometric and spatial characteristics within the analyzed network. These associations highlight the multifactorial nature of macrotexture evolution and the importance of accounting for a broad set of explanatory variables when modeling pavement surface performance.
LMMs proved suitable for this type of analysis because the modeling framework explicitly accounts for repeated measurements and unobserved section-level heterogeneity. Including random effects captured substantial between-section variability, and adopting an autoregressive error structure addressed the temporal correlation between successive observations. Together, these elements improved model reliability and supported valid statistical inference.
The comparison of model specifications showed that incorporating pavement structural and geometric characteristics significantly improved both the goodness-of-fit and predictive performance compared with models based solely on traffic and climatic variables. This result indicates that macrotexture behavior cannot be fully explained without accounting for surface course type and roadway geometry. In particular, porous asphalt surfaces were associated with systematically higher texture values, which was expected, while lane position and vertical alignment were linked to measurable spatial variability in texture evolution.
From an application perspective, the proposed modeling framework provides a statistically robust basis for macrotexture-related analyses within pavement management systems. By improving the ability to predict future texture evolution at the section level, the models may assist highway agencies in identifying sections with higher rates of macrotexture change and in supporting long-term maintenance planning decisions.
Future research should extend this work by incorporating longer monitoring periods, maintenance intervention data, and alternative model structures, including nonlinear formulations and interaction effects. Such extensions would further improve our understanding of texture degradation processes and enhance the applicability of mixed-effects models for pavement surface performance assessment.