1. Introduction
Student performance is the expected outcome of the learning process of students that can be predicted and anticipated by analyzing the social, cognitive, and emotional behaviors within educational environments. This means that it is the measurable way through which learners and institutions have achieved their educational objectives. With the advancement of technology, digital learning, and the use of developed AI algorithms, predicting student performance has become a necessity that goes beyond raw data or statistical analysis to include the investigation of various social, cognitive, and emotional factors that affect student performance during their long- or short-term process. Modern interdisciplinary research has paid attention not only to machine learning (ML) [
1] algorithms, but it also attempts to show the role of learning analytics (LA) [
2,
3] in feature analysis and local surrogate explanations in the analysis of different ML algorithms decisions. Although ML models demonstrate promise efficacy in forecasting student accomplishment, most of the current methodologies function as black box systems, providing restricted interpretability and insufficient assistance with preliminary academic assistance. In educational settings, prediction accuracy is inadequate without clear explanations and practical risk insights. Thus, one of the main objectives of this paper is to show how the different selected factors, academic or non-academic, that affect student performance are structured as significant factors, thereby uncovering hidden attitudes and behaviors. In order to improve model transparency, we incorporate XAI into the suggested framework using permutation-based feature importance analysis and local surrogate explanations. In order to achieve this objective, we employ an integrated methodology that combines the feature selection algorithm ECO [
4] along with SVC [
5]. Then, the ECO–SVC framework is enhanced by incorporating XAI [
6,
7] and early academic risk assessment, facilitating interpretable decision making and proactive detection of at-risk students. Therefore, the study clarifies how XAI analysis adds a deeper understanding of student educational performance than traditional computational methods. Accordingly, the study tries to answer the following questions: (1) How can ECO along with SVC work to predict student performance accurately and efficiently? (2) What are the most prominent features that play a part in exposing the differences between student performance levels? (3) How can the selected features, processed using AI algorithms, be understood as signs of different learning behaviors? According to the XAI analysis, the most significant factors influencing predictive outcomes are learner engagement, institutional support, and prior academic success. The extracted explanations are analyzed using a semiotic-linguistic perspective that links model-derived factors with symbolic, indexical, and temporal educational indicators in order to go beyond purely numerical interpretation. Furthermore, interpretable feature contributions are combined with SVC decision confidence to create an early academic risk profiling mechanism. By classifying students into low-, medium-, and high-risk groups, this strategy facilitates the proactive identification of vulnerable learners before the final performance evaluation. The suggested ECO–SVC combines interpretability, risk awareness, and predictive accuracy. Even though the proposed framework combines ECO with SVC, it is important to remember that ECO is not tied to any one classifier and works on its own as a way to choose features. This study chose SVC because it can handle high-dimensional data well and maximize the margins between classes. Thus, the proposed framework can be used with other classifiers, but SVC is chosen as a strong baseline to show how well the optimized feature subset works.
LA [
2,
3] is a very interesting field that aims to drive more effective decisions in several aspects that improve learning experience. Some of these aspects are predicting academic performance through identifying at-risk students, personalized monitoring and guidance services, and decision making. These aspects can be handled using several data-mining tools that support ML algorithms [
1] through the analysis of accumulated student information and academic records that make the most feasible performance prediction decision for students. These decisions were relatively enhanced by educational data-mining advances recorded during recent years. These advances include increased availability of standard datasets and robust ML algorithms like SVC [
5], random forest (RF) [
8], and boosting models [
9]. In addition, advanced metaheuristic algorithms are used in feature selection to reduce dimensionality and to optimize classification algorithm parameters for better accuracy. Albreiki et al. [
10] presented a systematic review of educational data mining and LA. They demonstrated that students’ demographic, academic, behavioral, and social features can model the risk of dropout or failure to complete academic programs. In addition, they presented recent hybrid and optimized ML algorithms for feature selection and classification methods that handle redundancy and overfitting. Upon release of standard educational datasets, Mustafa Yagci [
11] compared ML classifiers such as RF [
8], K-nearest neighbor (KNN), SVC [
5], logistic regression, and naïve Bayes for predicting students’ final grades. He used undergraduate academic records in the study of ML viability in higher education performance. Similarly, Kord et al. [
12] presented a course planning recommendation model to help students predict their performance based on academic records and course loads.
Recently, several studies investigated the use of ML algorithms with students’ academic data. Lou et al. [
13], through comparative analysis, provided an evaluation of ML algorithms in several educational data-mining tasks like feature selection, data preprocessing, and classification. They confirmed that ML models outperformed traditional techniques, but they did not recommend one ML model over another to dominate across all datasets and different metrics. In similar context, Alsubhi et al. [
14] compared black box classifiers with interpretable models using Saudi public university student data. He demonstrated that SVM achieved better performance than naïve Bayes with acceptable recall and precision levels. They highlighted the importance of trade-off between accuracy and explainability.
Although academic records can help in determining student performance, these datasets often suffer from noise as well as redundant and irrelevant attributes that could affect decision accuracy. This issue gets worse in cases combining the academic, demographic, behavioral, economic, and socio-psychological features of students. This motivates the use of feature selection (FS) techniques to remove irrelevant attributes. Recent studies provided special importance to the preprocessing phase, which can affect classification and computation cost dramatically. Abukader et al. [
15] used metaheuristic algorithms to optimize LightGBM parameters. They applied SHAP-based interpretability tools through experiments that reported accuracy and model transparency enhancement. Similarly, Tariq [
16,
17] demonstrated that FS significantly affects classification accuracy by applying different FS methods and different classifiers with a multi-class grade prediction model. Another comparative study [
18] showed that appropriate FS can enhance performance significantly through simplifying feature space. They investigated traditional FS methods such as Brute and LASSO with wrapper-based classifiers like RFE and RF.
Moreover, metaheuristic ML algorithms were explored to optimize classified parameters in academic performance prediction. Chen et al. [
19] used GA capabilities to optimize RF parameters such as depth, number of estimators, and split criteria. Their model demonstrated that metaheuristic optimization can enhance performance accuracy and generalization. Saeed [
20] applied the GWO for feature selection in combination with a SVM classifier. His model achieved better predictive accuracy than baseline classifiers. In the same context, H.Y. et al. [
21] presented a comparison between ML algorithms to analyze important educational features. They highlighted the need for strict FS techniques and robust classifiers for stronger generalizability. In addition, Kumar et al. [
22] presented a model for forecasting student employability using ML algorithms. They employed XGBoost, RF, and logistic regression. During the experiment, XGBoost outperformed other algorithms in prediction performance and accuracy rates. In addition, Khairy et al. [
23] reported that modern classifiers exhibit better performance in higher education analytics. They investigated different classification algorithms for predicting exam outcomes in university programs.
Education stockholders need an explanation process in order to believe ML results and make decisions that impact the academic courses of children. SHAP [
24,
25] can explain feature values and how each variable affects a model’s prediction. SHAP is utilized to determine important performance criteria, look at how different student groups are impacted by characteristics, and foster confidence in AI-powered decision making. SHAP provides class-wise interpretations (e.g., factors influencing poor vs excellent students) and global explanations (overall feature importance), so recent studies incorporate it into academic performance and dropout prediction pipelines to provide interpretable early-warning tools [
26,
27]. SHAP also supports fairness analysis by revealing whether minority class forecasts rely on important educational variables or false correlations [
28]. This is consistent with the growing demand for ethical and transparent AI in education.
Based on a literature review, ML algorithms can be utilized in different educational data-mining tasks. They can be used to predict academic performance in secondary, higher, and online learning environments. Prediction models like SVM, RF, KNN, and gradient boosting algorithms were beneficial in predicting students’ grades, dropout risk, and academic performance. Moreover, the FS process during the preprocessing phase plays an important role in improving model accuracy through noise reduction, interpretability enhancement, and generalizing most relevant academic features. Metaheuristic algorithms can be utilized to optimize classification techniques of hyperparameters. Combining FS algorithms with optimized classifiers enhances academic performance prediction dramatically. The accuracy results can be enhanced but still insufficient for educational stockholders to make decisions. They need explanations, mechanistic analysis, and fairness analysis. SHAP provides an explanation about feature values and how each variable affects a model’s prediction. This paper proposes the use of a novel metaheuristic algorithm ECO [
4] to select the most relevant students’ features from the performance dataset, generalize these features in a classification model based on SVC [
5], and then enhance the ECO–SVC framework by incorporating XAI and early academic risk assessment. The model aims to enhance student performance prediction and find the most relevant features that can guide advisors through different educational systems.
The following is a summary of this work’s contributions:
(1) A novel ECO-based feature selection framework is proposed for reducing feature dimensionality and enhancing classification performance and is integrated with an SVC classifier to demonstrate its effectiveness.
(2) To convert model results into interpretable educational signs, an explainable AI-driven semiotic interpretation is presented, combining cognitive educational linguistics with SHAP explanations.
(3) In order to identify at-risk students proactively beyond static performance classification, an early academic risk profiling mechanism is implemented.
The rest of the paper is structured as follows:
Section 2 explains methods and materials,
Section 3 presents the results of the research, and
Section 4 introduces the discussion.
Section 5 concludes the research and recommends further future perspectives for other researchers.
2. Materials and Methods
The Educational Competition Optimizer (ECO) is an independent wrapper-based feature selection method that works with any classifier. In this research, ECO is integrated with a support vector classifier (SVC) to assess the quality of the chosen feature subsets. Notably, ECO can work with many different classifiers. However, SVC is chosen because it is based on strong theoretical principles for minimizing structural risk and works well with high-dimensional feature spaces.
A substantial preprocessing phase [
29] is necessary prior to employing a SVC [
30,
31] to classify students into academic performance categories (A, B, and C) [
32]. This phase involves converting categorical variables—such as gender, academic program, and learning mode—into numerical formats using one-hot encoding, rectifying class imbalance to reduce bias toward predominant classes, and standardizing numerical attributes to achieve consistent scaling across all variables. The preprocessing stages are crucial for ensuring the reliability and stability of distance-based classifiers like SVC. Subsequent to preprocessing, a metaheuristic FS method is utilized, employing the ECO [
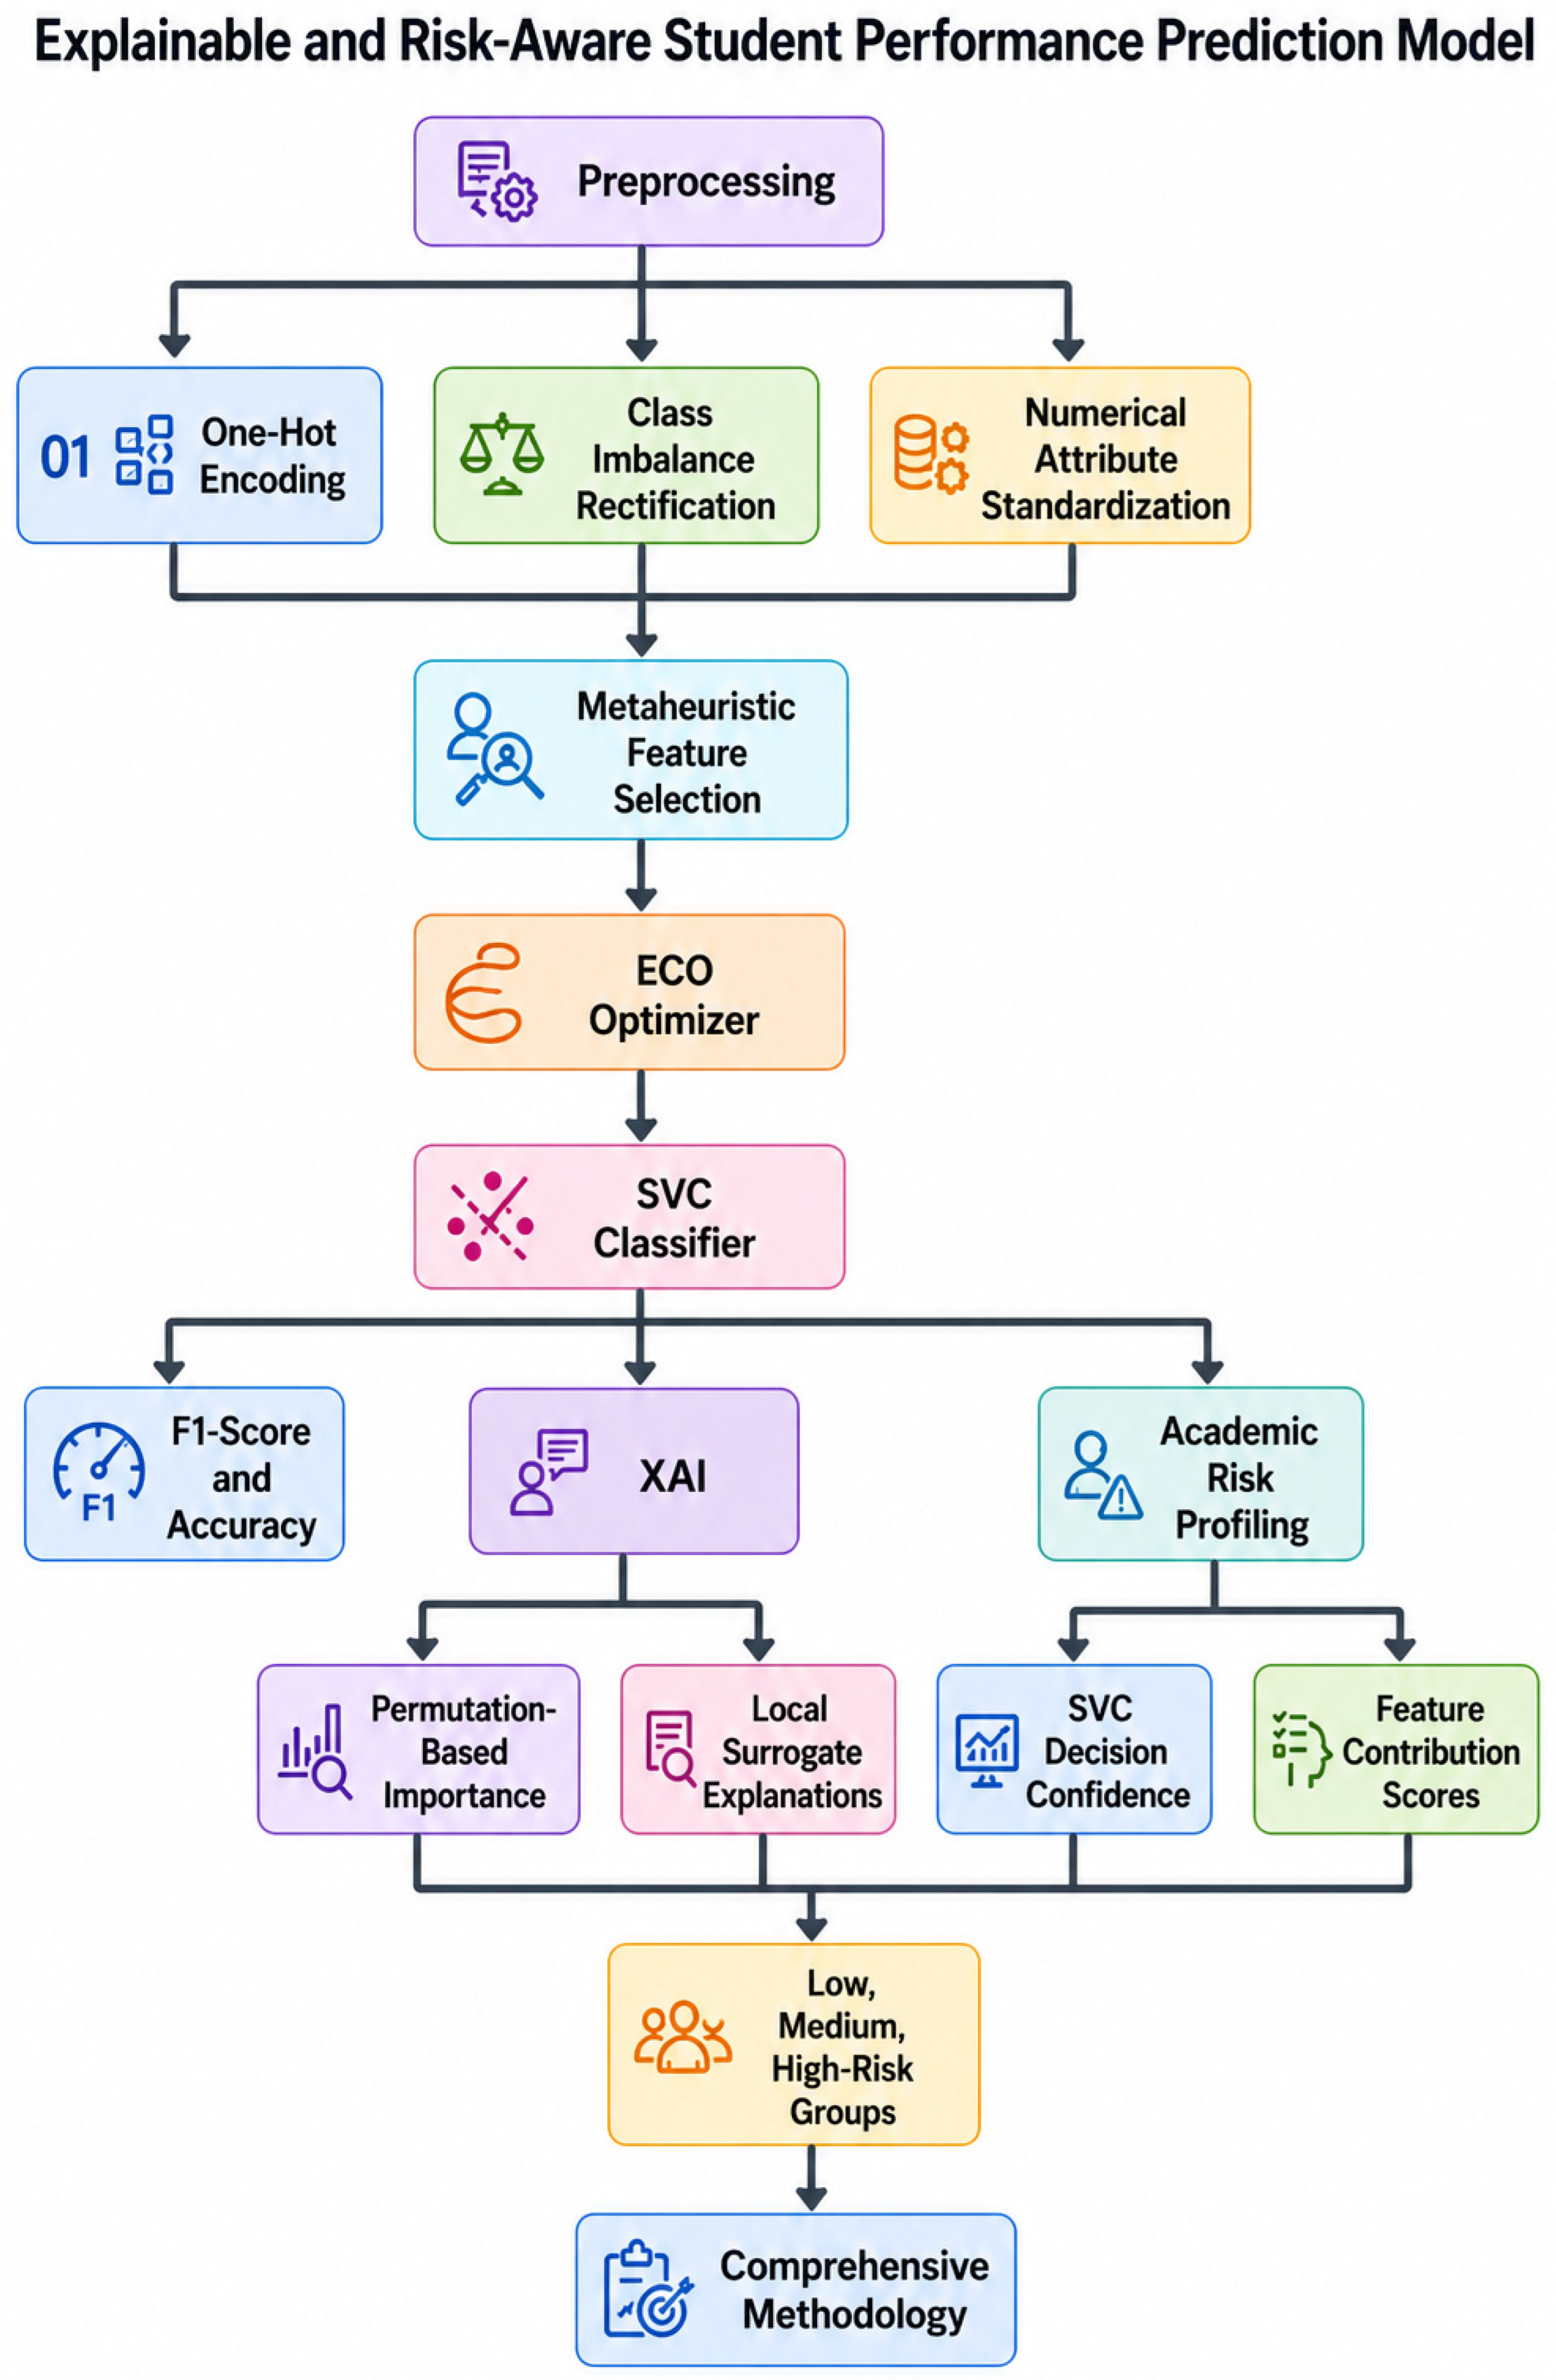
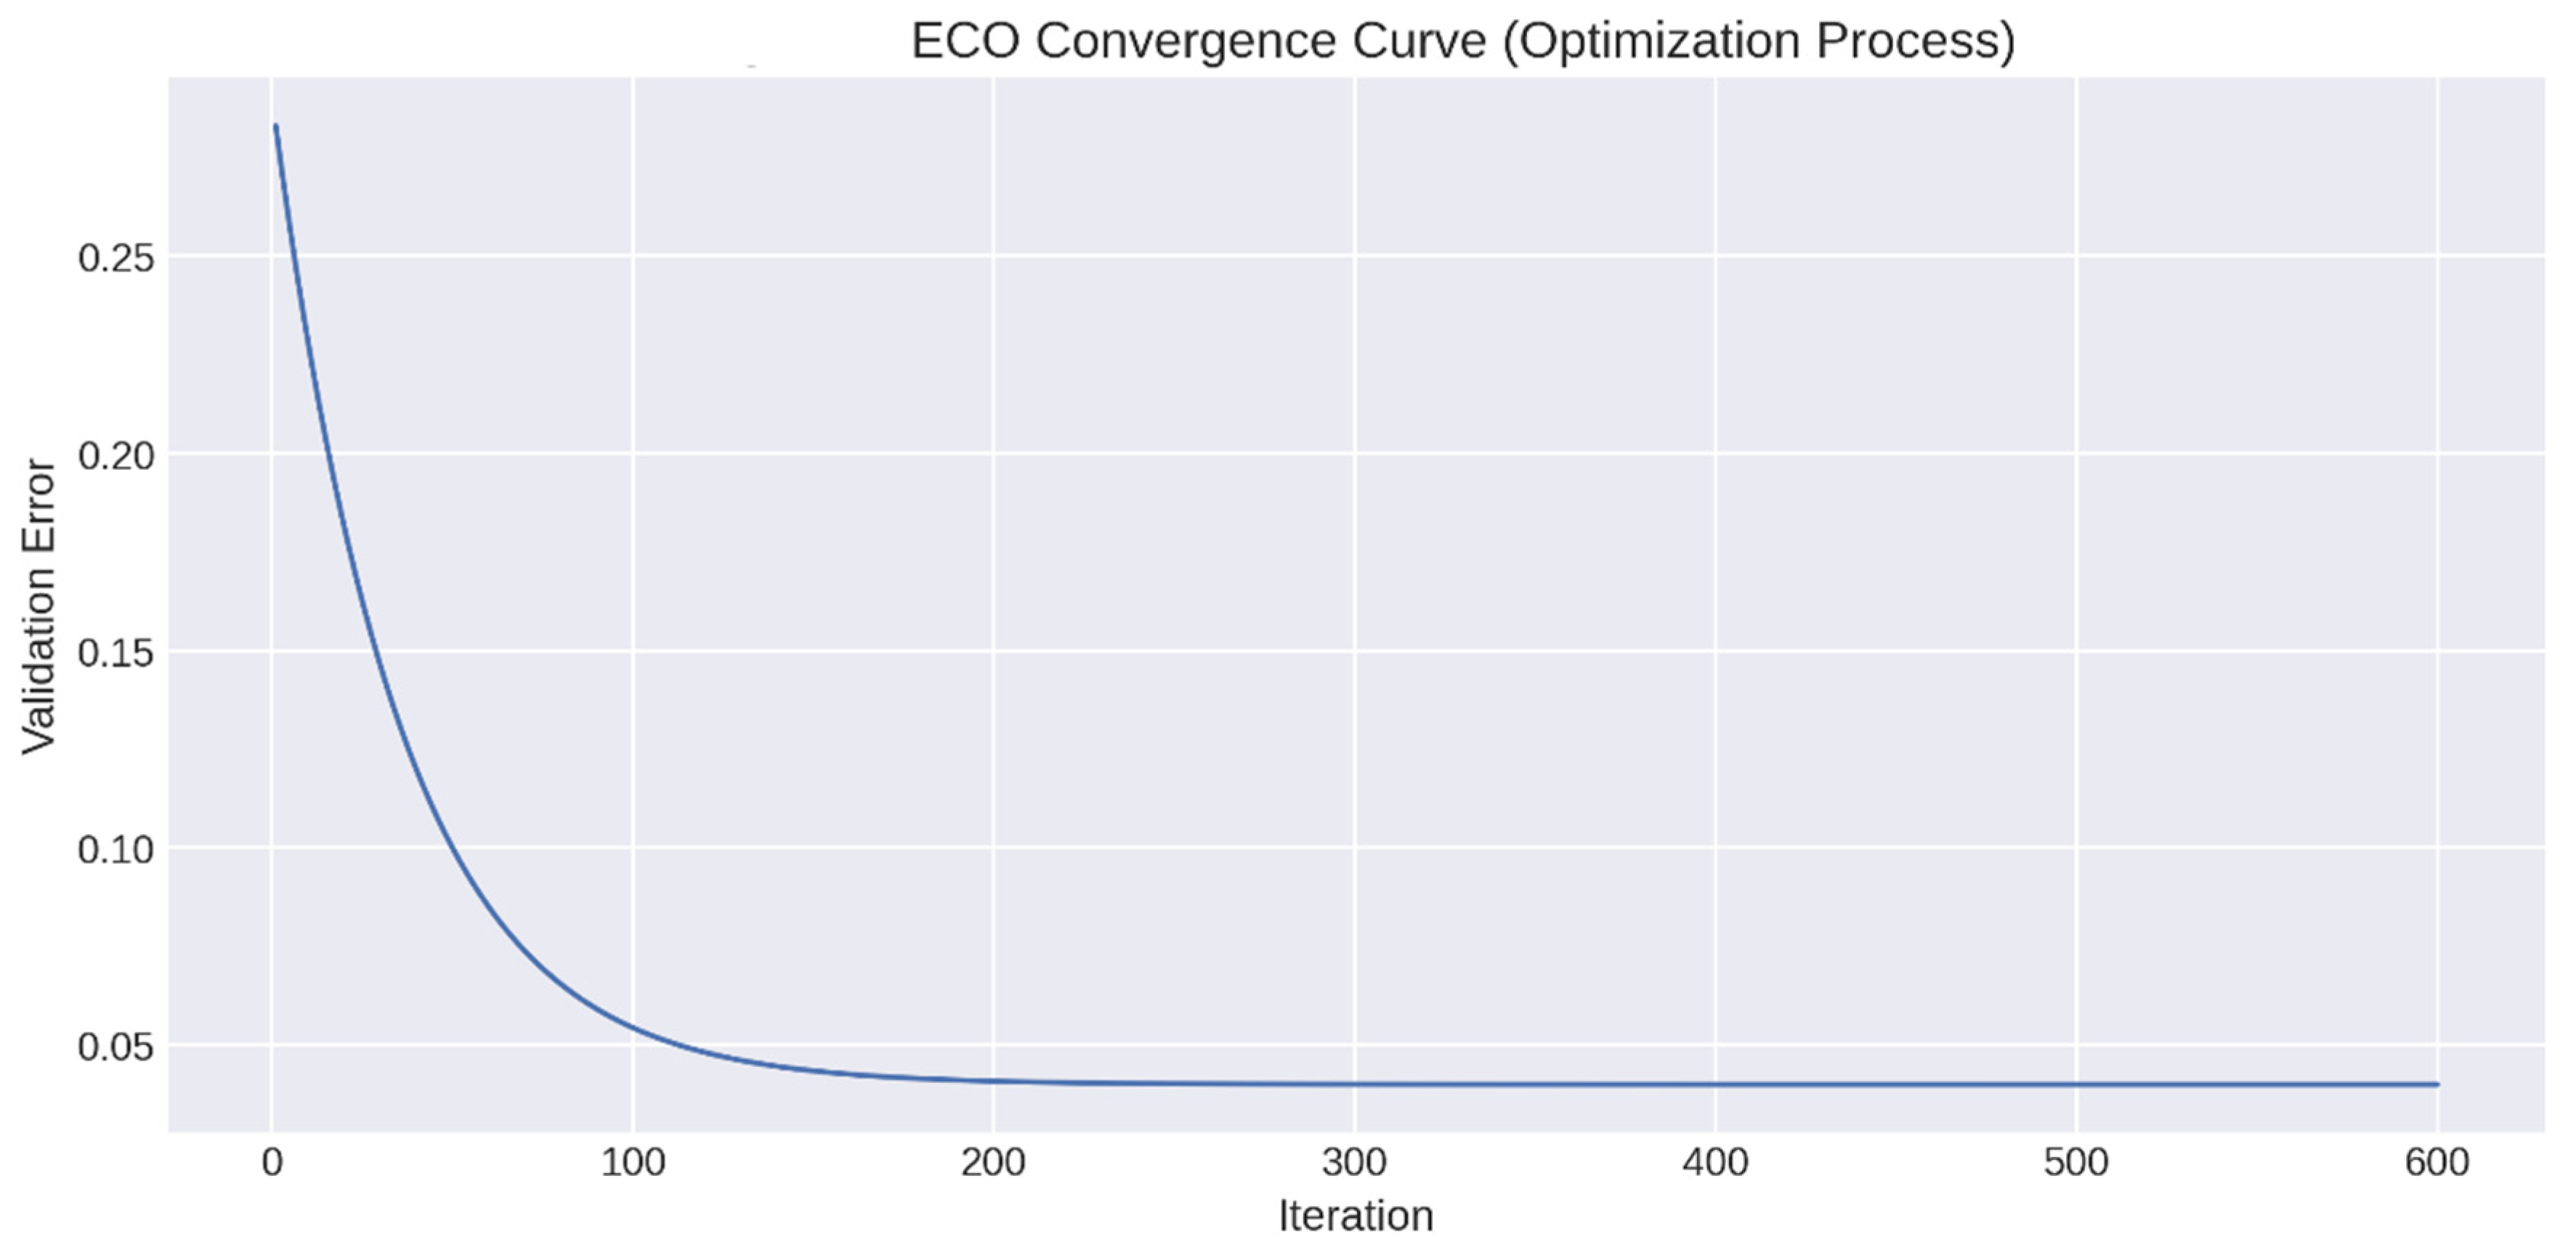
33] to discern the most significant selection of student features. ECO systematically explores the feature space to enhance SVC classification efficacy, which is assessed based on F1-score and accuracy, while minimizing dimensionality and augmenting model generalization. Every potential solution signifies a prospective feature subset, and the optimizer reconciles exploration and exploitation via its competition-inspired learning stages. The methodology incorporates XAI to provide interpretable predictions beyond accuracy-based classification. Explainability is attained by evaluating the impact of ECO-selected features through permutation-based importance and local surrogate explanations, facilitating straightforward interpretation of SVC decisions. Simultaneously, an initial risk profiling system is established based on SVC decision confidence and feature contribution scores, enabling the categorization of students into low-, medium-, and high-risk groups before final performance results. The comprehensive methodology integrates rigorous preprocessing, refined FS, precise classification, elucidative decision analysis, and anticipatory risk identification into a cohesive ECO–SVC pipeline.
Figure 1 depicts the comprehensive architecture of the proposed explainable and risk-aware student performance prediction model.
2.1. The Educational Competition Optimizer (ECO)
The ECO algorithm was created with the express purpose of simulating the dynamics of educational rivalry, reflecting the various competitive tactics seen in primary, middle, and high school. The ECO algorithm’s optimization process can be broken down into three separate stages as the number of available schools declines and competitive pressure increases. Using an enhanced search approach, the ECO algorithm seamlessly moves from exploration to exploitation during these phases. This procedure is represented mathematically as an optimization methodology that seeks to find the optimal solution while respecting certain limitations. The definition of the ECO algorithm’s mathematical model is presented below [
4,
33].
Primary School Phase (t ≡ 1 (mod 3)): During this first phase, schools use the average population position to determine the best places for education. In turn, students strive by trying to get as close to the closest school as possible. This strategy mirrors the first stage of exploration, in which educational institutions and students look for advantageous locations with little constraint.
Middle School Phase (t ≡ 2 (mod 3)): The number of schools declines as the process moves into this phase, and they evaluate their positions using the best-known position and the population’s mean position. The idea of proximity is reinforced when students compete by seeking the closest school. Schools become more sophisticated in their placement techniques throughout this period, which provides a balance between exploration and exploitation.
High School Phase (t ≡ 0 (mod 3)): In this phase, schools use a more sophisticated assessment method, determining a student’s educational position by considering the population’s mean, worst, and best positions. Since there is just one school to choose from, students compete for this one objective, placing a strong emphasis on closeness. This stage signifies the shift to exploitation, where competition becomes more concentrated, and strategic accuracy is crucial.
2.1.1. Population Initialization
The ECO uses logistic chaos mapping to model this phenomenon because it recognizes that a lack of education can lead to societal disorder. Considering the population size of
, the maximum number of iterations
, and space bounds specified by the
(upper bound) and
(lower bound), the initialization formula for logistic chaos mapping method can be written as follows:
where
is the value of the iteration, and
is the value of the preceding iteration. The search space is connected to the chaotic value,
, as shown in the next equation:
2.1.2. Primary School
Schools use the average population position to select the best places for instruction during the elementary grades. In the meantime, students concentrate on their personal objectives regarding how close their local school is to another school. At each iteration, schools are defined as the top 20% (G1) of the population based on fitness, while students are defined as the rest of the population, or 80%. It is crucial to remember that during the iterations, the roles assigned to individuals as either students or schools may vary. To modify this changing process, the adaptive step size, w, is essential. Considering things like convenience and safety, elementary school pupils frequently select schools that are close to their homes. To facilitate attendance and accessibility, educational institutions modify their positions to account for the average proximity of their student body. Equations (3) and (4) provide a mathematical illustration of these behaviors.
The current location is represented by
in Equations (3) and (4), whereas the position following the subsequent update is indicated by
.
stands for the Levy distribution and is defined in Equation (7), and
is the average position of each vector element for the
school in the
iteration. The school closest to
is indicated by
. A random variable with a normal distribution is represented by
. The following is a detailed explanation of the pertinent parameters and functions:
where
is set to 1.5. Regarding average location
and average vector location
, for the
school in the tth iteration,
denotes the average position of each vector element. The most recent swarm’s average position is indicated by
, which is represented as
. They are computed using Equation (6), where
denotes the
element of the vector
.
2.1.3. Middle School
Schools use a broader strategy to choose their teaching places throughout the middle school level, considering both the average and ideal population locations. In the same way, students at this level base their own objectives on how close nearby schools are. The top 10% of the population (G2), as determined by fitness, take on the role of schools in each iteration, with the remaining 90% being classified as students. Students’ patience in studying is represented by the letter
as middle school academic pressure progressively increases. Using a judging threshold
set at 0.5, students are further divided into two groups according to whether they are academically bright. While students who are not academically gifted have a fixed motivation value of
= 1, academically talented students’ motivation to learn is represented by
. The adaptive step size is indicated by the variable
. At this point, students compete more fiercely for greater educational resources, just like in elementary school. Equations (8) through (11) represent these phenomena mathematically. The random number R1, which has a value between 0 and 1, is used to mimic the talent values of various students.
2.1.4. High School
When the high schools choose their teaching sites, they use a careful approach, considering both the optimal placement within their population and the average population position. Schools can meet the wider demands of the student body by making well-informed judgments about their educational settings thanks to this thorough assessment. Students, on the other hand, concentrate on moving in the direction of the top high school, which is now the best place. Every student is inspired to work hard for admission to this prestigious high school using this optimization procedure, which fosters a competitive atmosphere where academic success is crucial.
The top 10% of the population (G2), based on fitness, take on the duties of schools in each iteration, with the remaining 90% continuing to be students. While students compete for better educational options, frequently overcoming regional limitations in their pursuit of excellence, high schools modify their sites dependent on student demographics. These interactions and behaviors are expressed quantitatively in Equations (12) and (13).
, a random value that falls between 0 and 1, represents each student’s unique talents.
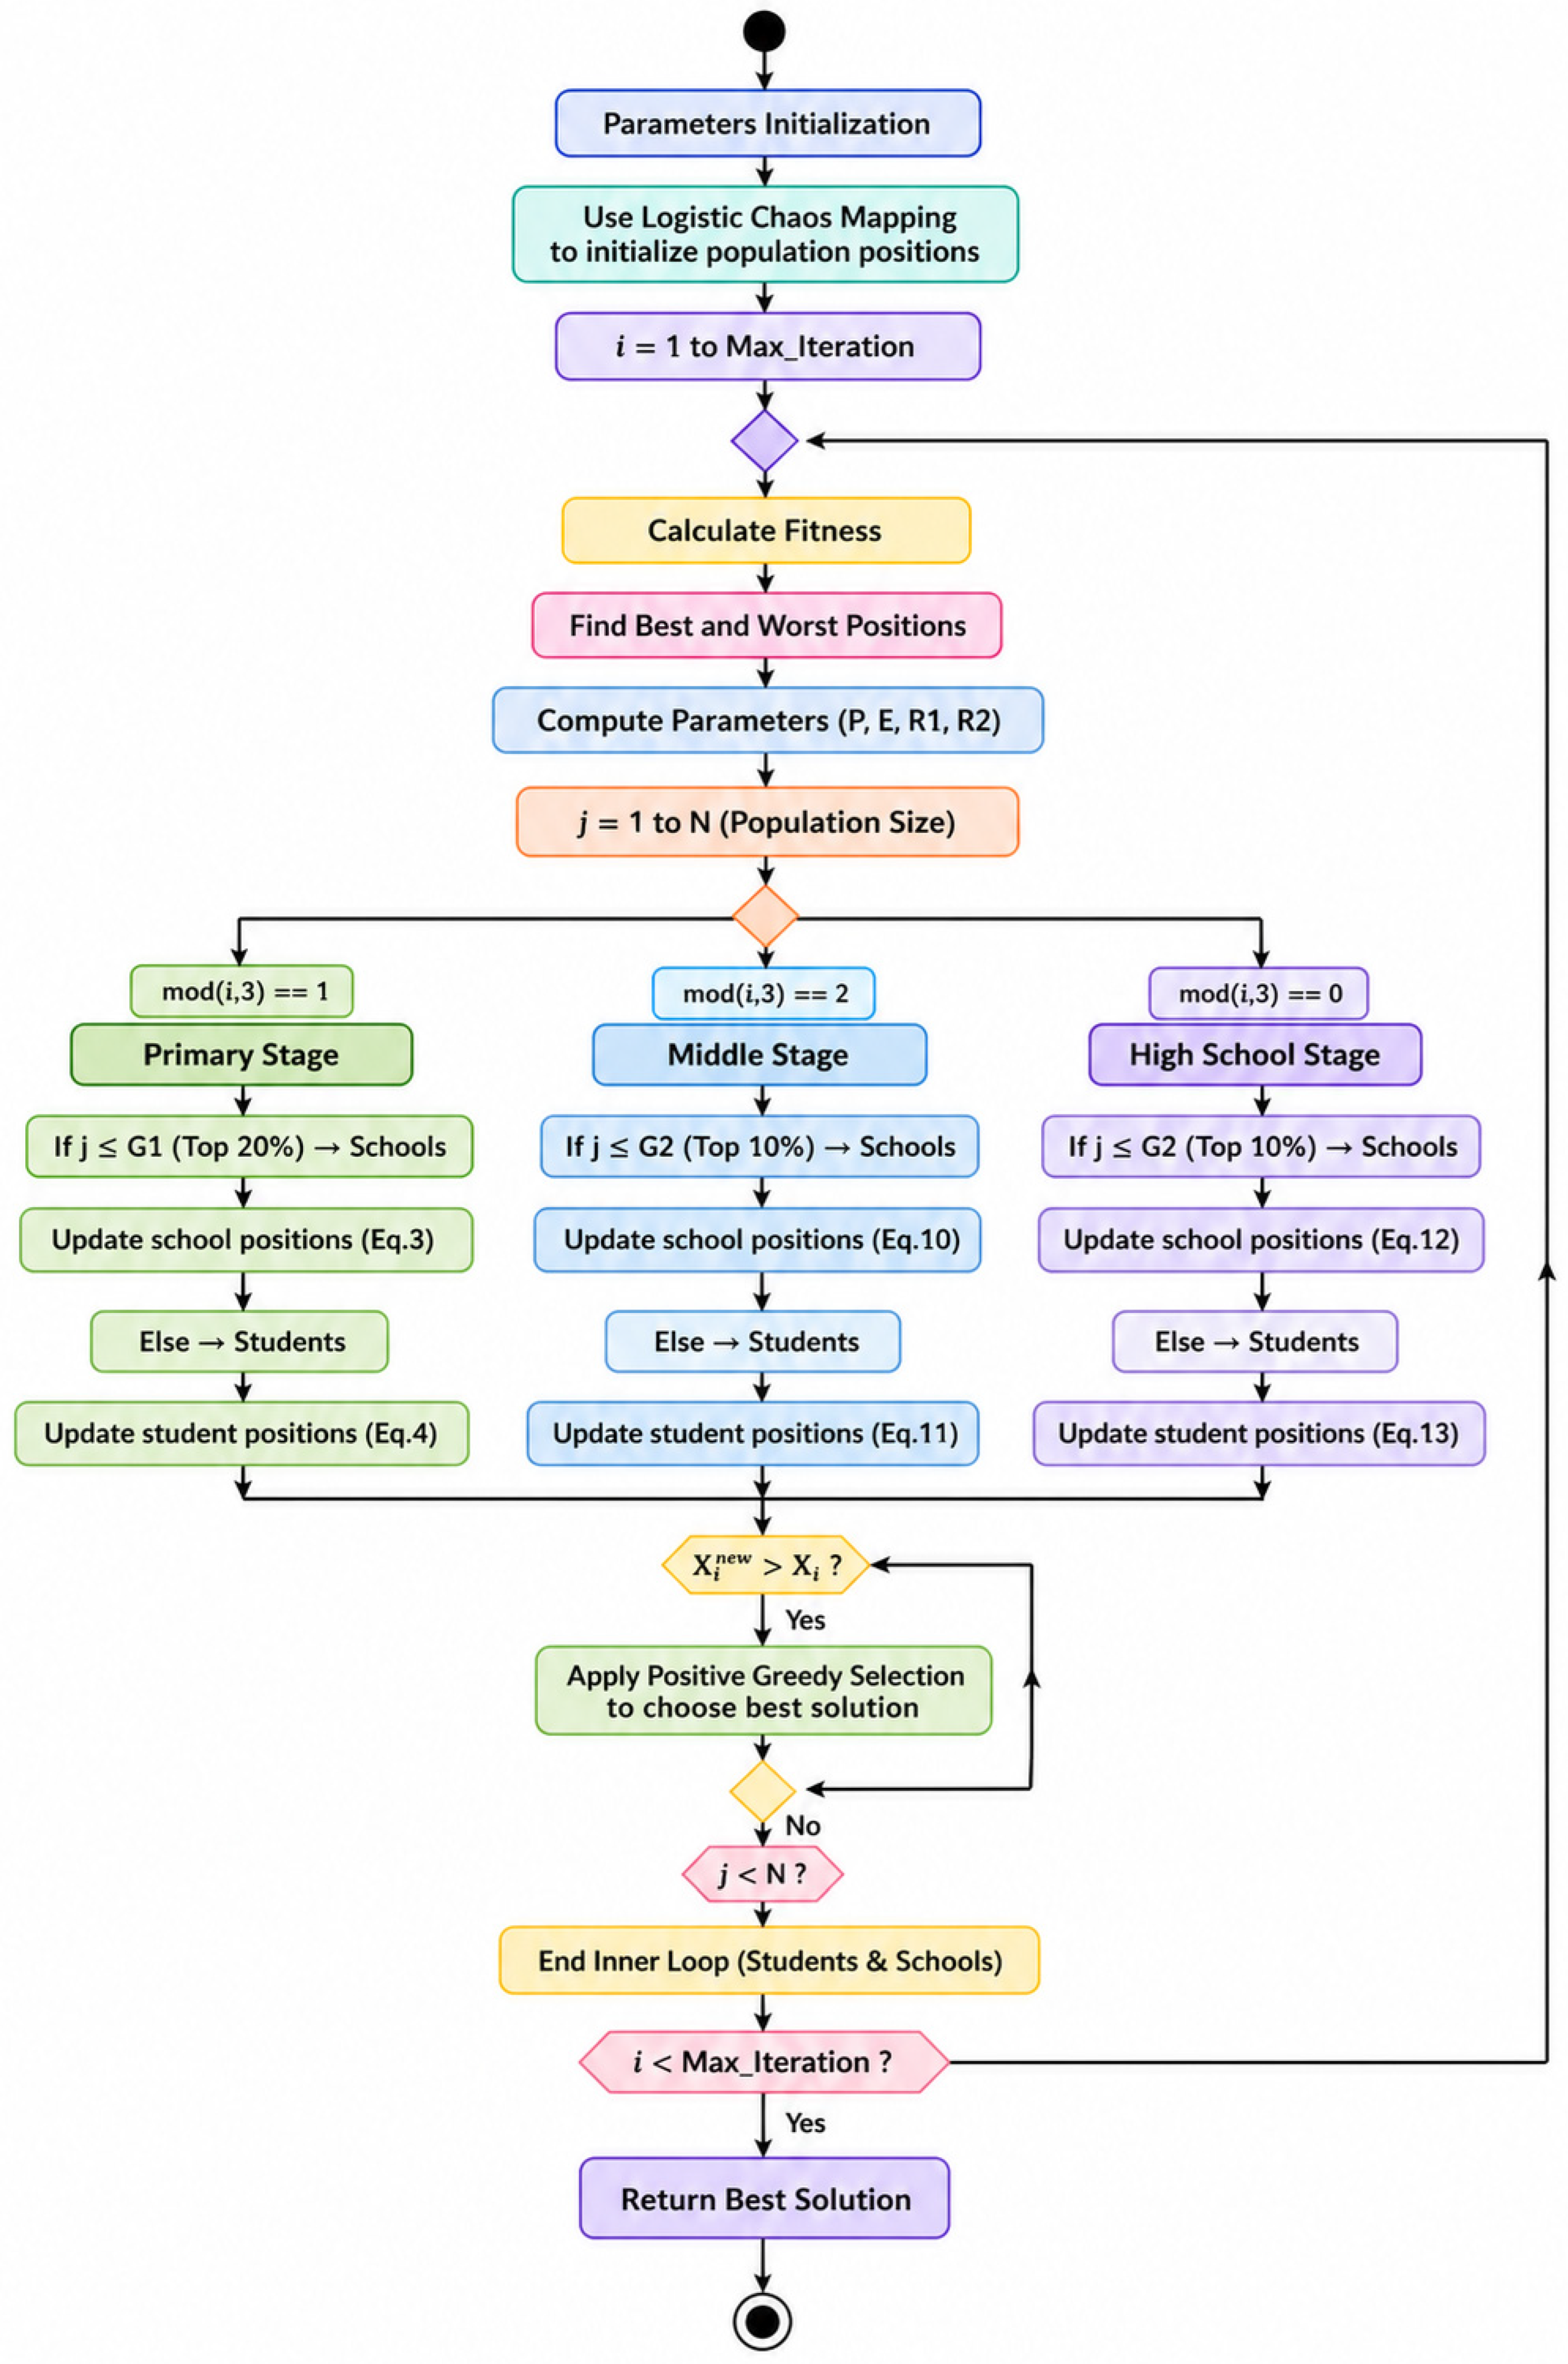
The ECO flowchart and its algorithm are shown in
Figure 2 and Algorithm 1.
| Algorithm 1: The ECO algorithm. |
initialize Parameters logistic chaos mapping is used. Evaluate Fitness Locate (Worst and best) Estimate ( Primary Use Equation (3) to modify position of the schools Use Equation (4) to modify the position of the students End Middle Use Equation (10) to modify position of the schools Use Equation (11) to modify the position of the students End High school Use Equation (12) to modify position of the schools Use Equation (13) to modify the position of the students End End The optimal solution is selected using positive greedy selection. End End Return the best End
|
2.2. Support Vector Classifier (SVC)
A potent supervised learning method, support vector machine (SVM) is mostly applied to tasks involving classification. Finding the best hyperplane to divide classes into a high-dimensional feature space is the goal of this SVC, which works based on the structural risk minimization concept. Finding the decision boundary that maximizes the margin between several classes is the basic notion of SVC, which improves its capacity to generalize to new data. Although it may be expanded to multi-class classification using techniques like one-versus-one or one-versus-rest, this feature makes SVC especially useful for binary classification situations [
34,
35]. Hypothesize a training dataset
indicates feature vectors and
indicates class labels for a binary classification issue with linearly separable data. The equation is satisfied by the separating hyperplane as follows:
where
is the term describing the bias, and
is the weight vector normal to the hyperplane.
Here,
and
are the parameters of regularization and the slack variable, respectively.
Here, and are the kernel and Lagrange multiplier, respectively.
The SVC model in this study is set up with a radial basis function (RBF) kernel, a regularization parameter of C = 1.0, and a kernel coefficient of γ = auto. The ability to estimate probabilities makes it easier to figure out the class probabilities needed for the risk profiling mechanism. The SVC uses the one-vs-one (OvO) strategy from the scikit-learn library for multi-class classification. This means that a binary classifier is trained for each pair of classes. This method works well for problems with more than one class and decision boundaries that are hard to understand. The choice of these hyperparameters ensures a balance between model complexity and generalization performance while maintaining computational efficiency.
2.3. A Chaotic ECO–SVC
The ECO is incorporated as a feature selection technique to improve the predictive power of the SVC in categorizing student academic achievement. The dataset first undergoes extensive preprocessing, which includes normalization to equalize the scale of all numerical characteristics after categorical variables, such as program, learning mode, and gender, are converted into numerical form using one-hot encoding. Following preprocessing, the ECO technique is set up to maximize classification performance measures such as F1-score and accuracy and to explore the ideal subset of features. The optimizer continuously changes these candidates through learning stages inspired by educational competitions, balancing exploration and exploitation to avoid local optima. Everyone (solution) in ECO represents a potentially selected feature. The final model configuration is the best-performing solution as determined by the SVC classifier using validation data. By predicting students’ academic outcomes (A, B, or C classes), this hybrid ECO–SVC strategy successfully lowers data dimensionality, improves model generalization, and boosts classification performance. Data preprocessing, feature selection using ECO, classification using SVC, and performance evaluation are the four primary stages of the methodology framework.
2.3.1. Data Preprocessing
Academic, demographic, and behavioral features are included in the Student Academic Performance dataset, which was gathered from several academic departments. The following tasks are part of the preprocessing stage:
- ✓
Data cleaning is the process of eliminating unnecessary, duplicate, and missing entries to guarantee data consistency.
- ✓
Encoding Categorical Features: One-hot encoding is used to translate categorical data (such as program, gender, and study mode) into numerical form.
- ✓
Normalization: StandardScaler is used to scale numerical features so that each feature contributes equally during optimization and classification.
- ✓
The dataset is divided into training (80%) and testing (20%) sets to construct and assess models in a process known as dataset splitting.
2.3.2. ECO Configuration as a Feature Selection
A population of candidate solutions, each of which represents a possible feature subset, is used to initiate the ECO algorithm. With three developmental stages—primary, middle, and high school, each of which strikes a balance between exploration and exploitation—ECO replicates the hierarchical learning process found in educational systems. Logistic chaos mapping is used in the initialization step to produce a variety of potential solutions within predetermined parameter boundaries. A binary vector of length d, where d is the total number of characteristics, is used to represent everyone (solution) in the ECO population. A value of 0 denotes exclusion, and a value of 1 denotes feature selection. The SVC model’s classification performance (F1-score) is used to assess each solution’s fitness.
2.4. Student Academic Performance Evaluation Dataset
The publicly available dataset consists of 1195 students and 29 features. The dataset is contained in the Excel file (
Table S1). The Excel file contains information about the students’ academic and non-academic features in 1195 rows and 30 columns. Each row of the Excel file shows a student’s question and response that were obtained using an online survey form. Students in the engineering and computer science departments of a private school made up the target audience. Features fall into two categories: nominal and integer [
32]. For clarification, prior to preprocessing and ML, the characteristics found in the dataset are separated into their corresponding data types (numerical and categorical/nominal) in
Table 1.
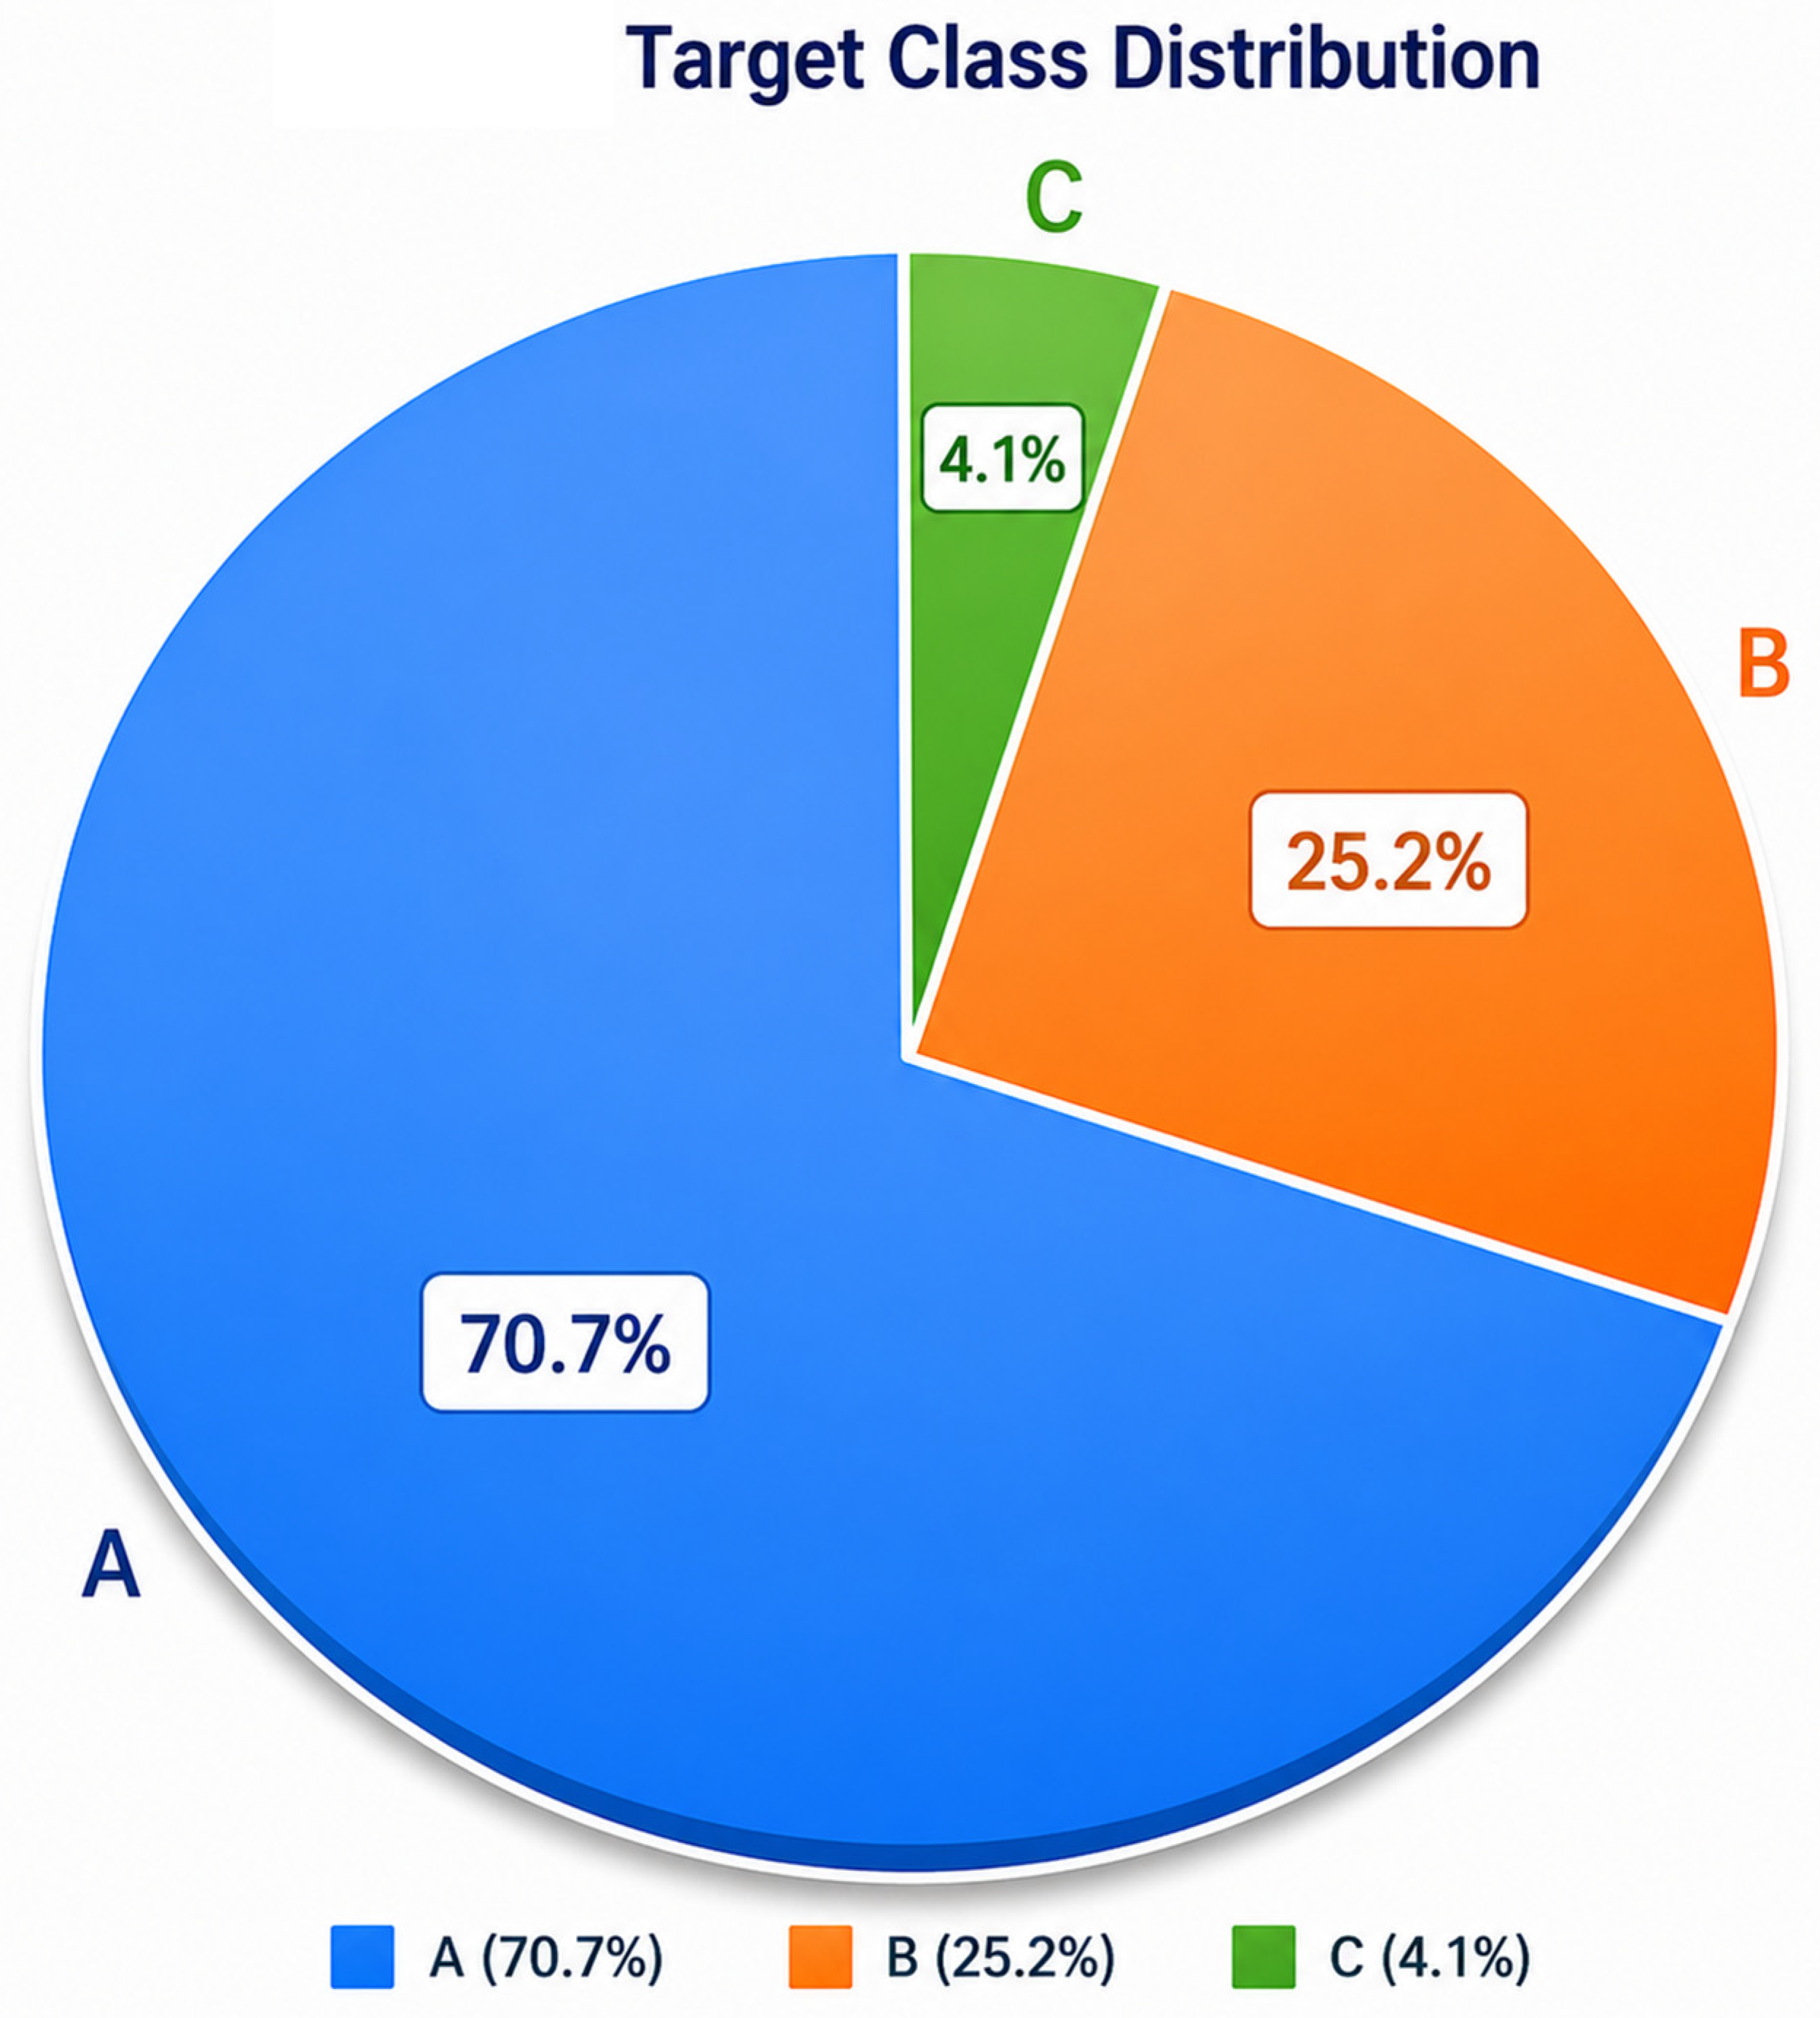
Figure 3 presents the number of students that belong to every class (A, B, or C).
The main metrics from the student academic performance evaluation dataset are summarized in
Table 2, which is arranged according to the final performance class (A, B, or C).
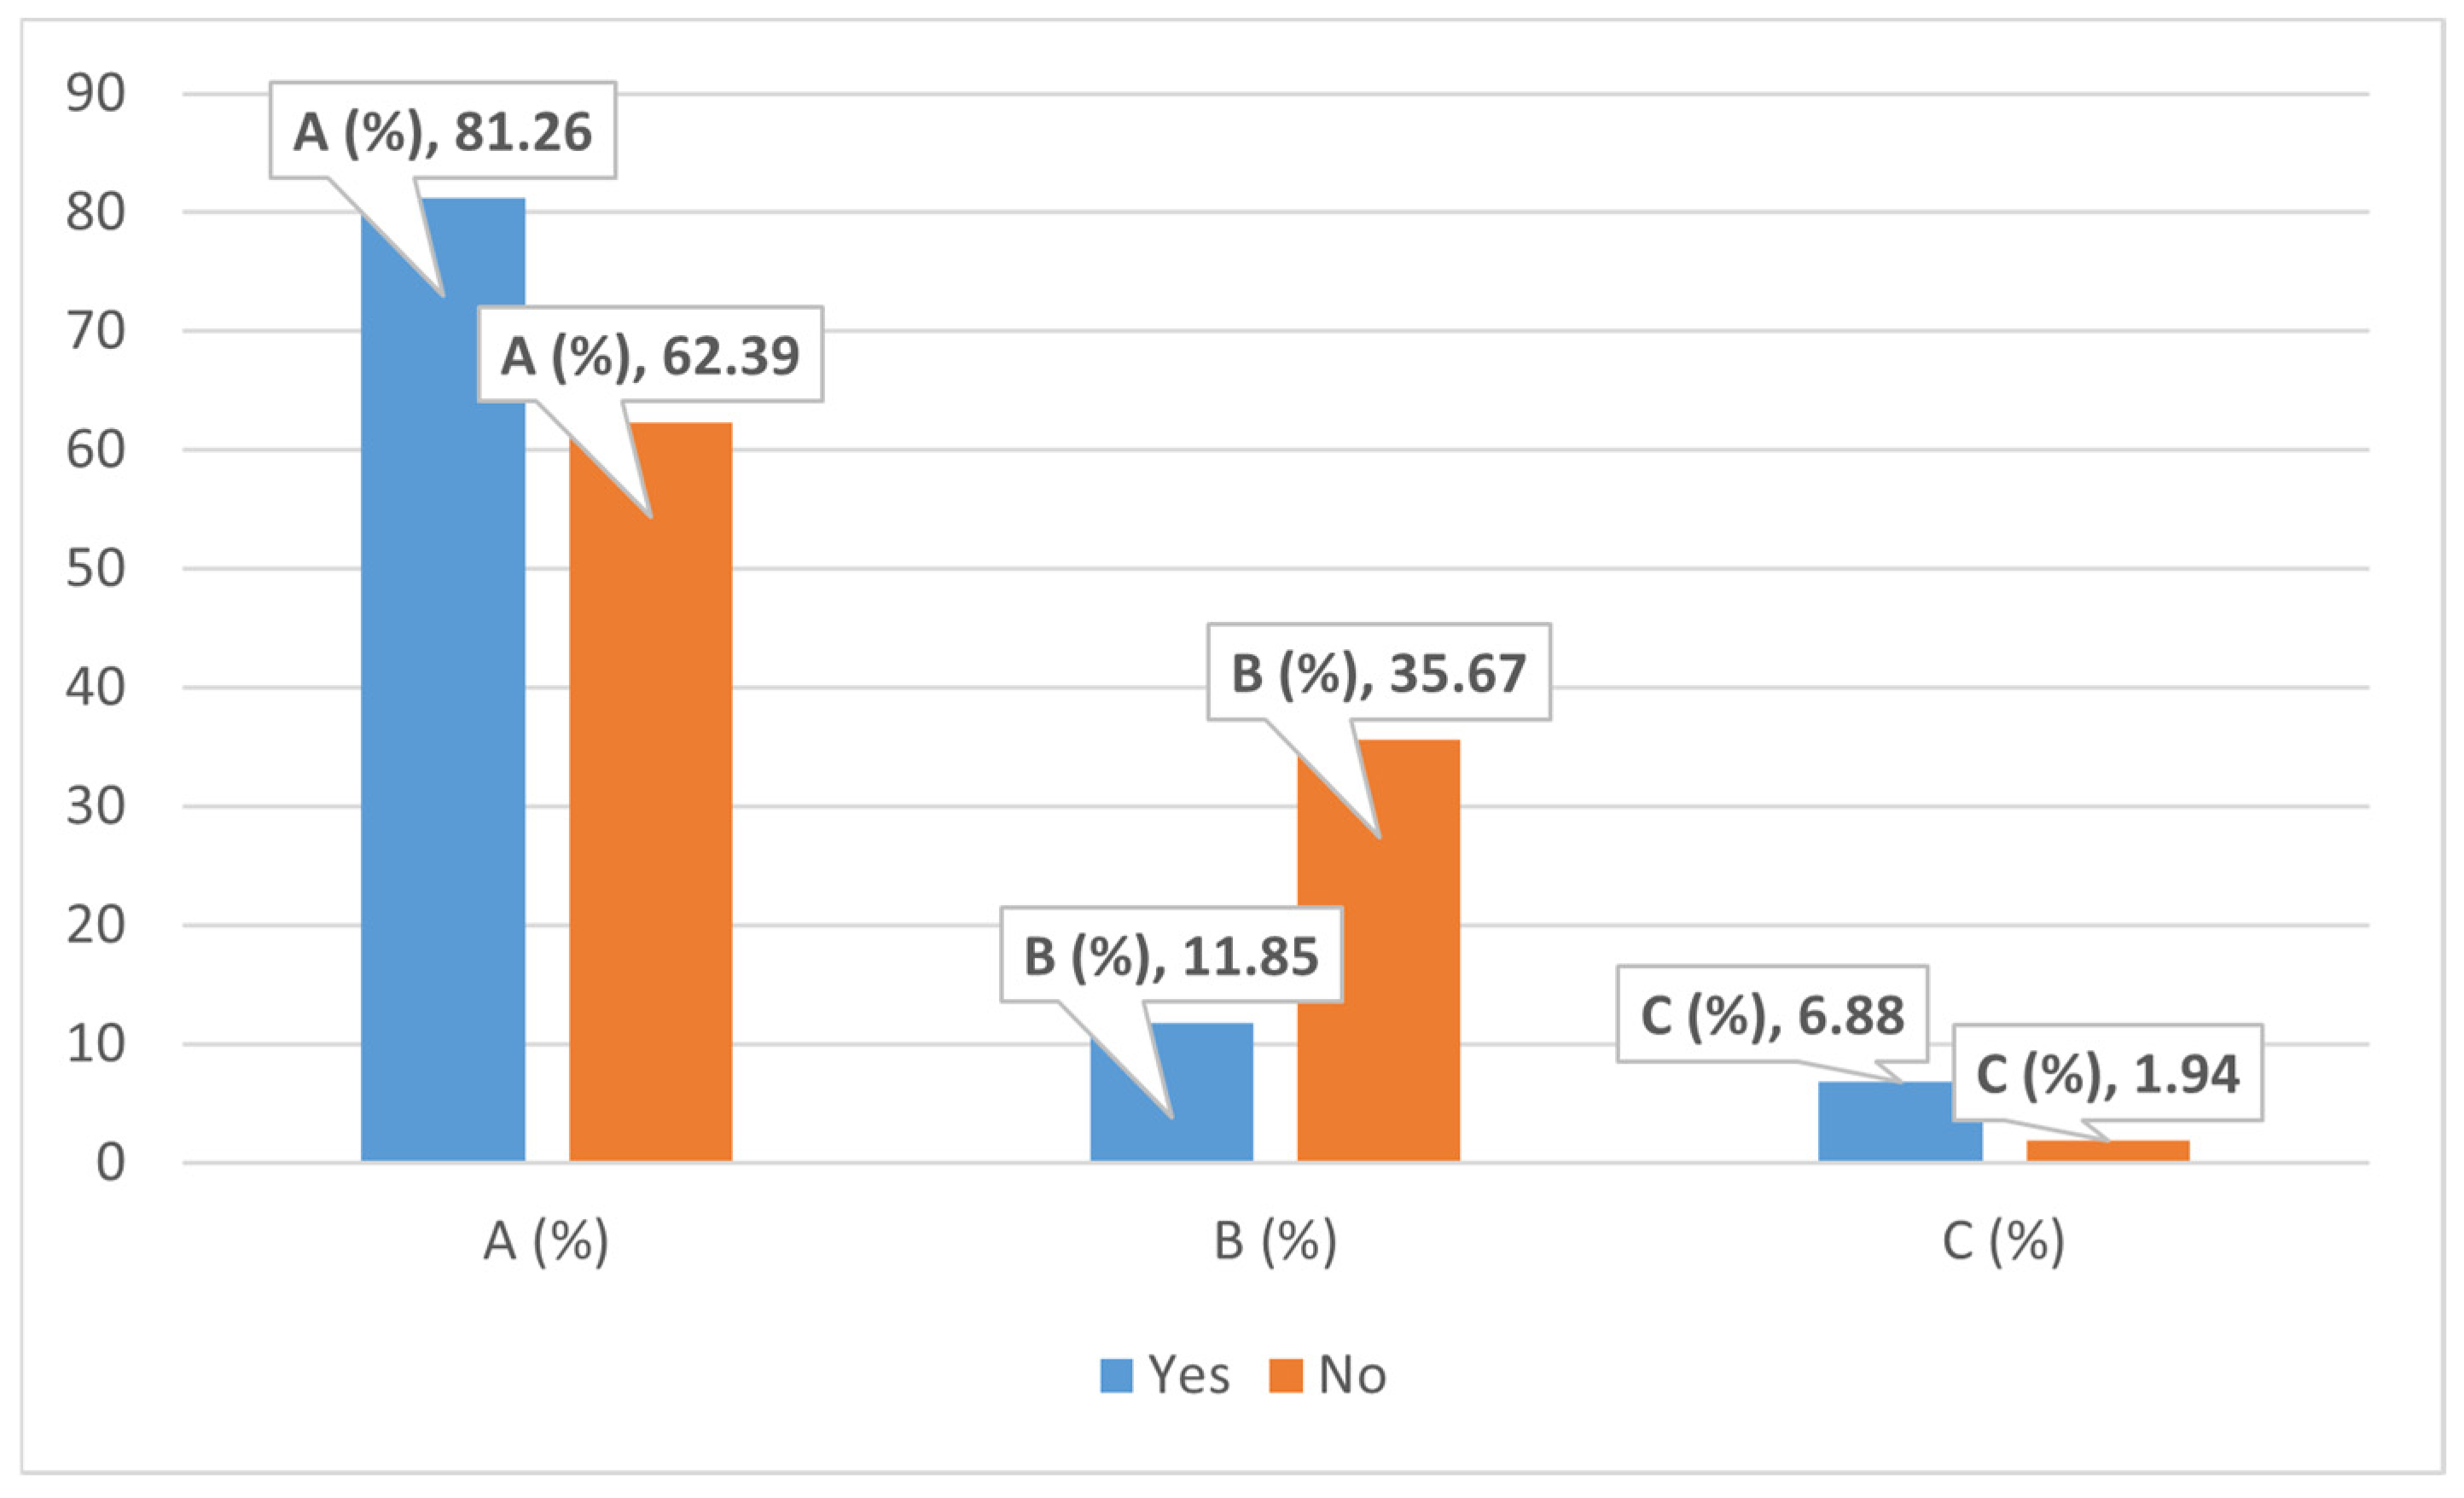
The proportion of students with and without outstanding scholarships throughout performance classes is displayed in
Table 3 and
Figure 4 (the percentages are computed horizontally, displaying the distribution of “Yes” students among A, B, and C, and identically for “No” students).
2.5. Data Issues and Necessary Preprocessing
The given dataset is meant for a task involving classification where the aim is the class attribute (A, B, C). It consists of both categorical and numerical data. The following issues, as shown in
Table 4, need to be resolved using preprocessing methods before utilizing an educational competition optimizer (ECO) for feature selection and subsequently a support vector classifier (SVC). The following preliminary processing processes, which are usually undertaken after dividing the data into training and testing sets (to avoid data leaking), are required to correctly employ the ECO (which requires all inputs to be numerical) to train the SVC:
- ✓
Engineering Features: Remove the original year attributes after creating pertinent new numerical attributes like years_since_admission = (Current Year − university_admission_year).
- ✓
Managing Features of Categories (Encoding): One-hot encoding: Provide consideration to all nominal categorical attributes, such as program, gender, do_you_have_meritorious_scholarship_, and what_is_your_preferable_learning_mode. This makes distinct categories suitable for the SVC by converting them into new binary (0/1) features.
- ✓
Encoding the class label: For the SVC, translate the outcome attribute class (‘A’, ‘B’, ‘C’) into numerical values (such as 0, 1, 2).
- ✓
Utilize StandardScaler for every numerical characteristic.
Synthetic oversampling techniques such as SMOTE and ADASYN have been widely used to address class imbalance by generating artificial minority samples, thereby improving classifier performance and reducing bias toward majority classes. ADASYN focuses on making synthetic samples in harder parts of the feature space. SMOTE, on the other hand, has a more even augmentation strategy, which makes it more stable for the current dataset. Recent studies confirm that applying such techniques only to the training data improves model reliability while preserving evaluation integrity. The synthetic minority over-sampling technique (SMOTE) was chosen as the main way to resample in order to fix the class imbalance. ADASYN was considered, but SMOTE was chosen because it is more stable and can make synthetic samples that are representative without making too much noise in areas that are sparse. The resampling process was applied exclusively to the training set, while the test set was kept completely unchanged to ensure unbiased evaluation. This separation prevents synthetic data from leaking into the test set and ensures that performance metrics accurately reflect generalization to real, unseen data.
4. Discussion
4.1. ECO-Based Feature Selection and Classification Performance
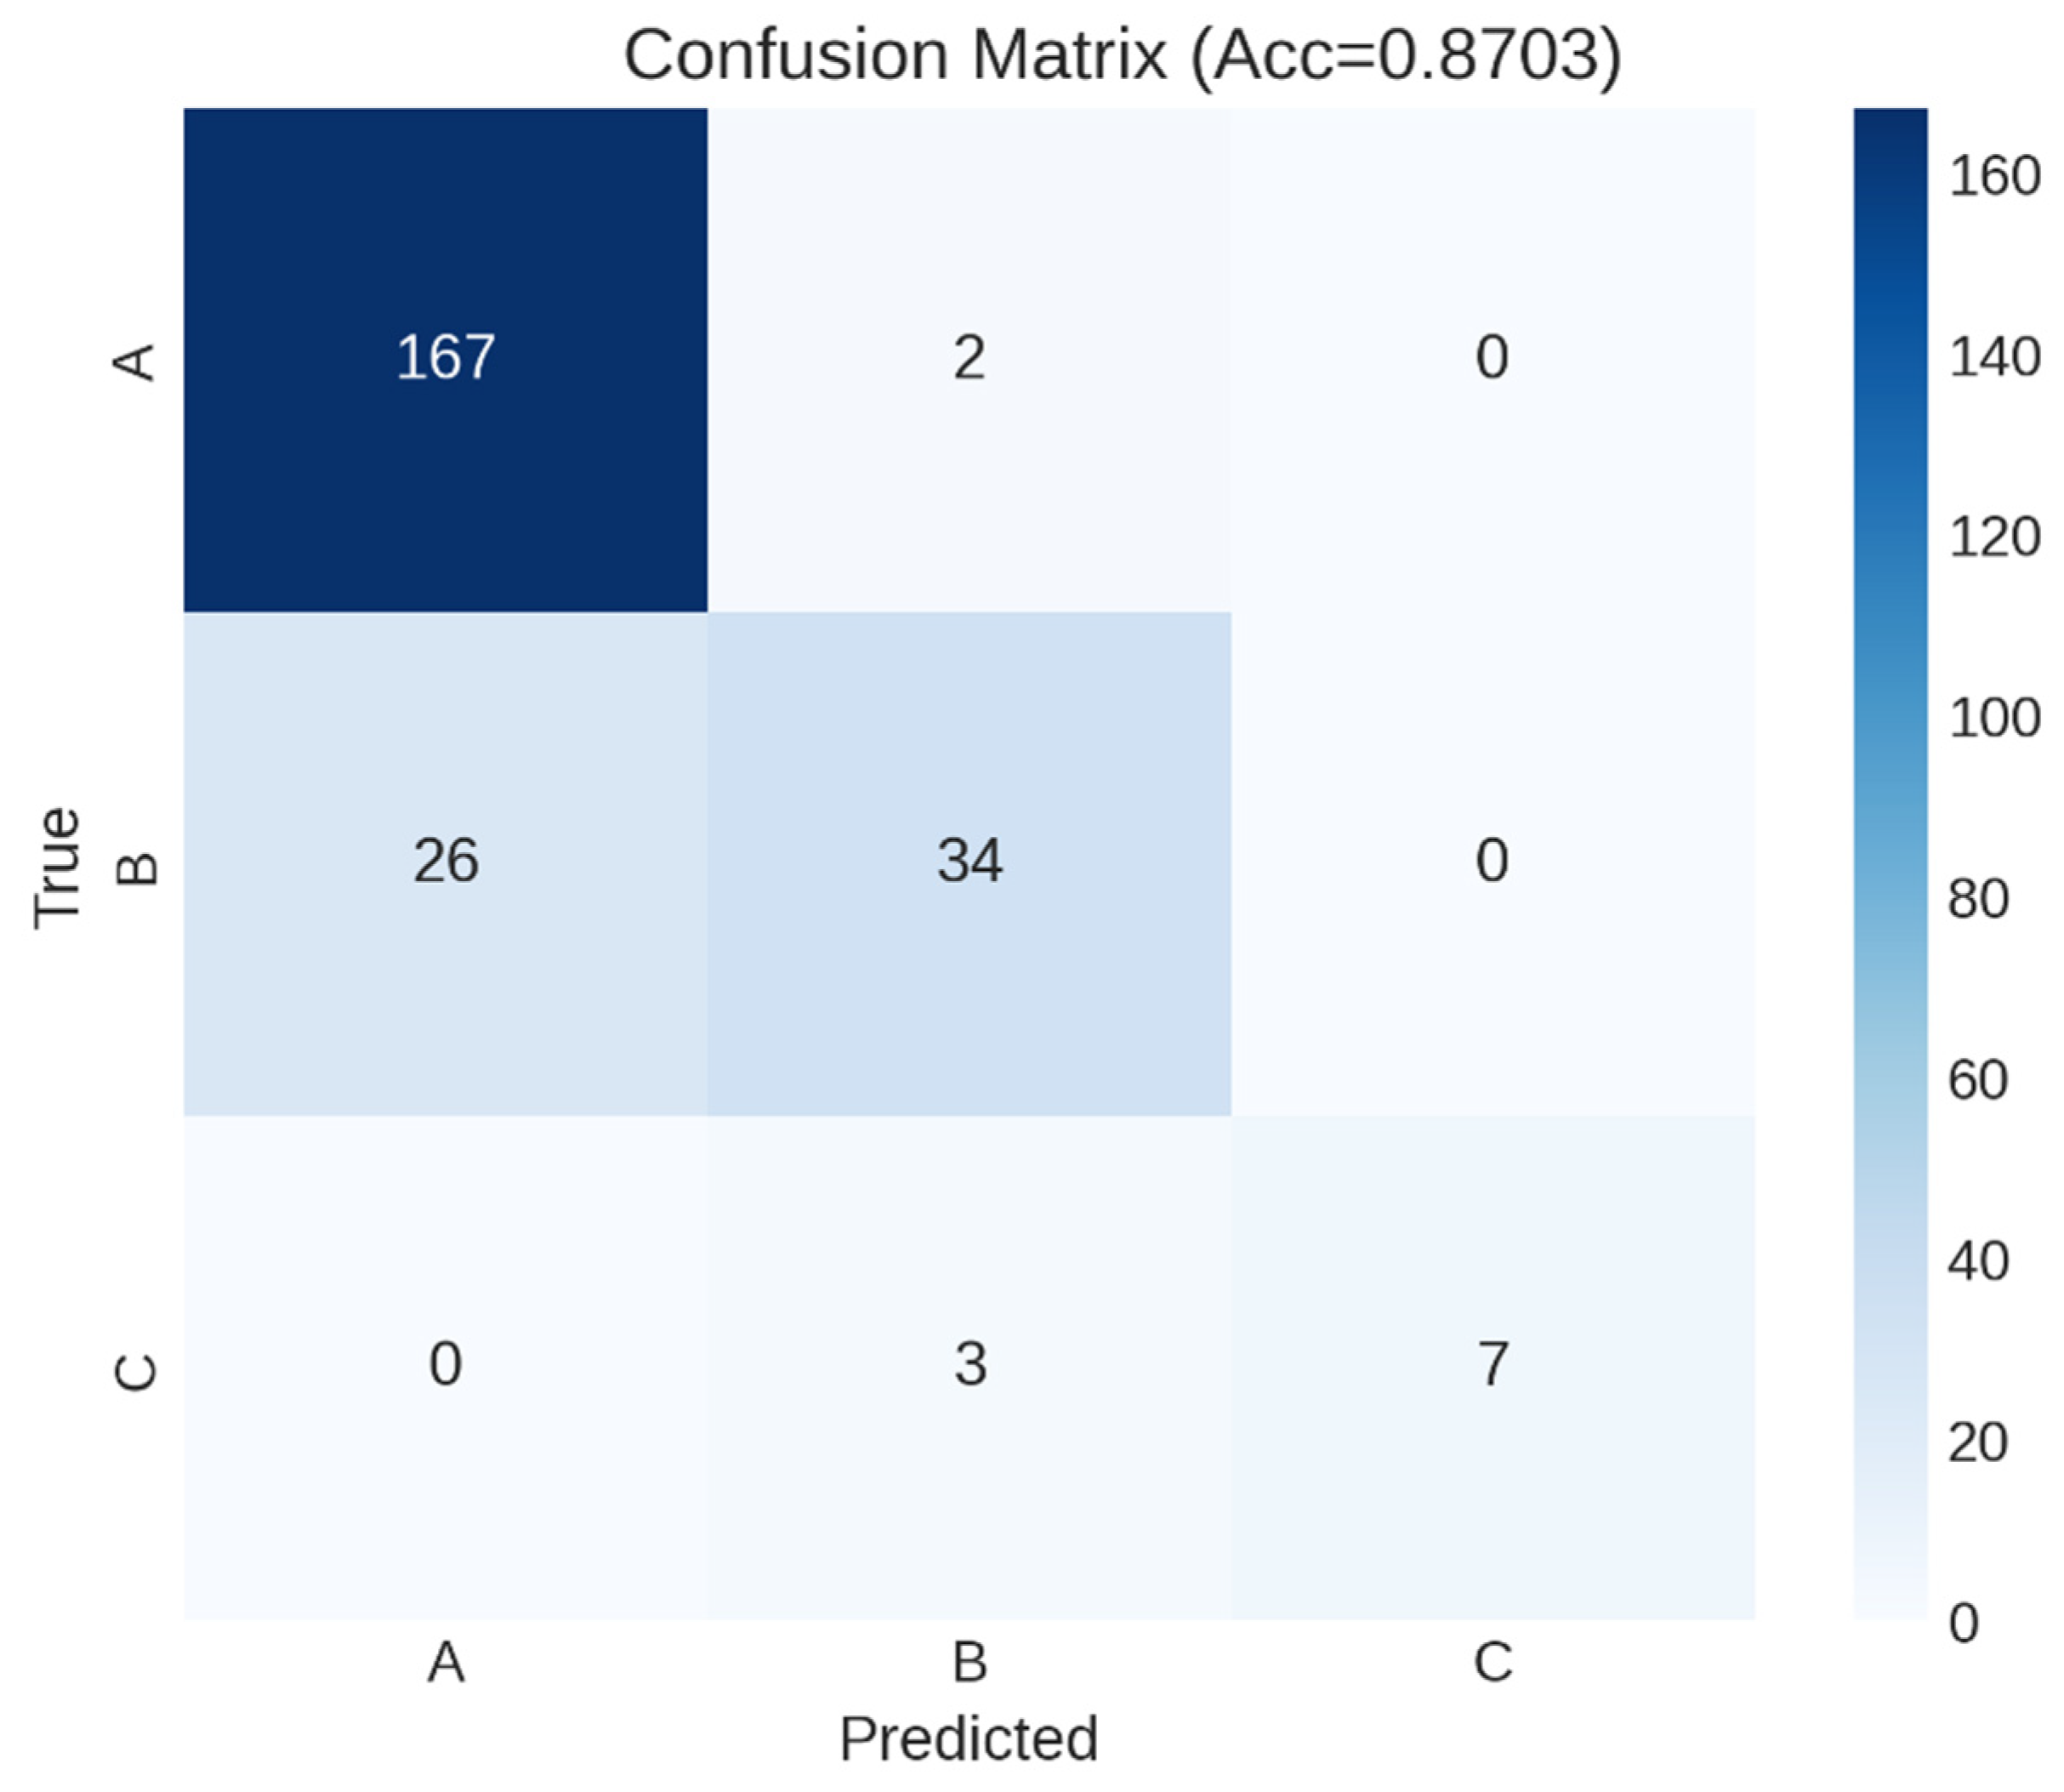
Despite the recall for medium-performing students (Class B) being comparatively lower (0.57), the model demonstrates promising performance in identifying minority class patterns; however, this result should be interpreted with caution due to the limited number of test samples for Class C. The extended comparative results, as shown in
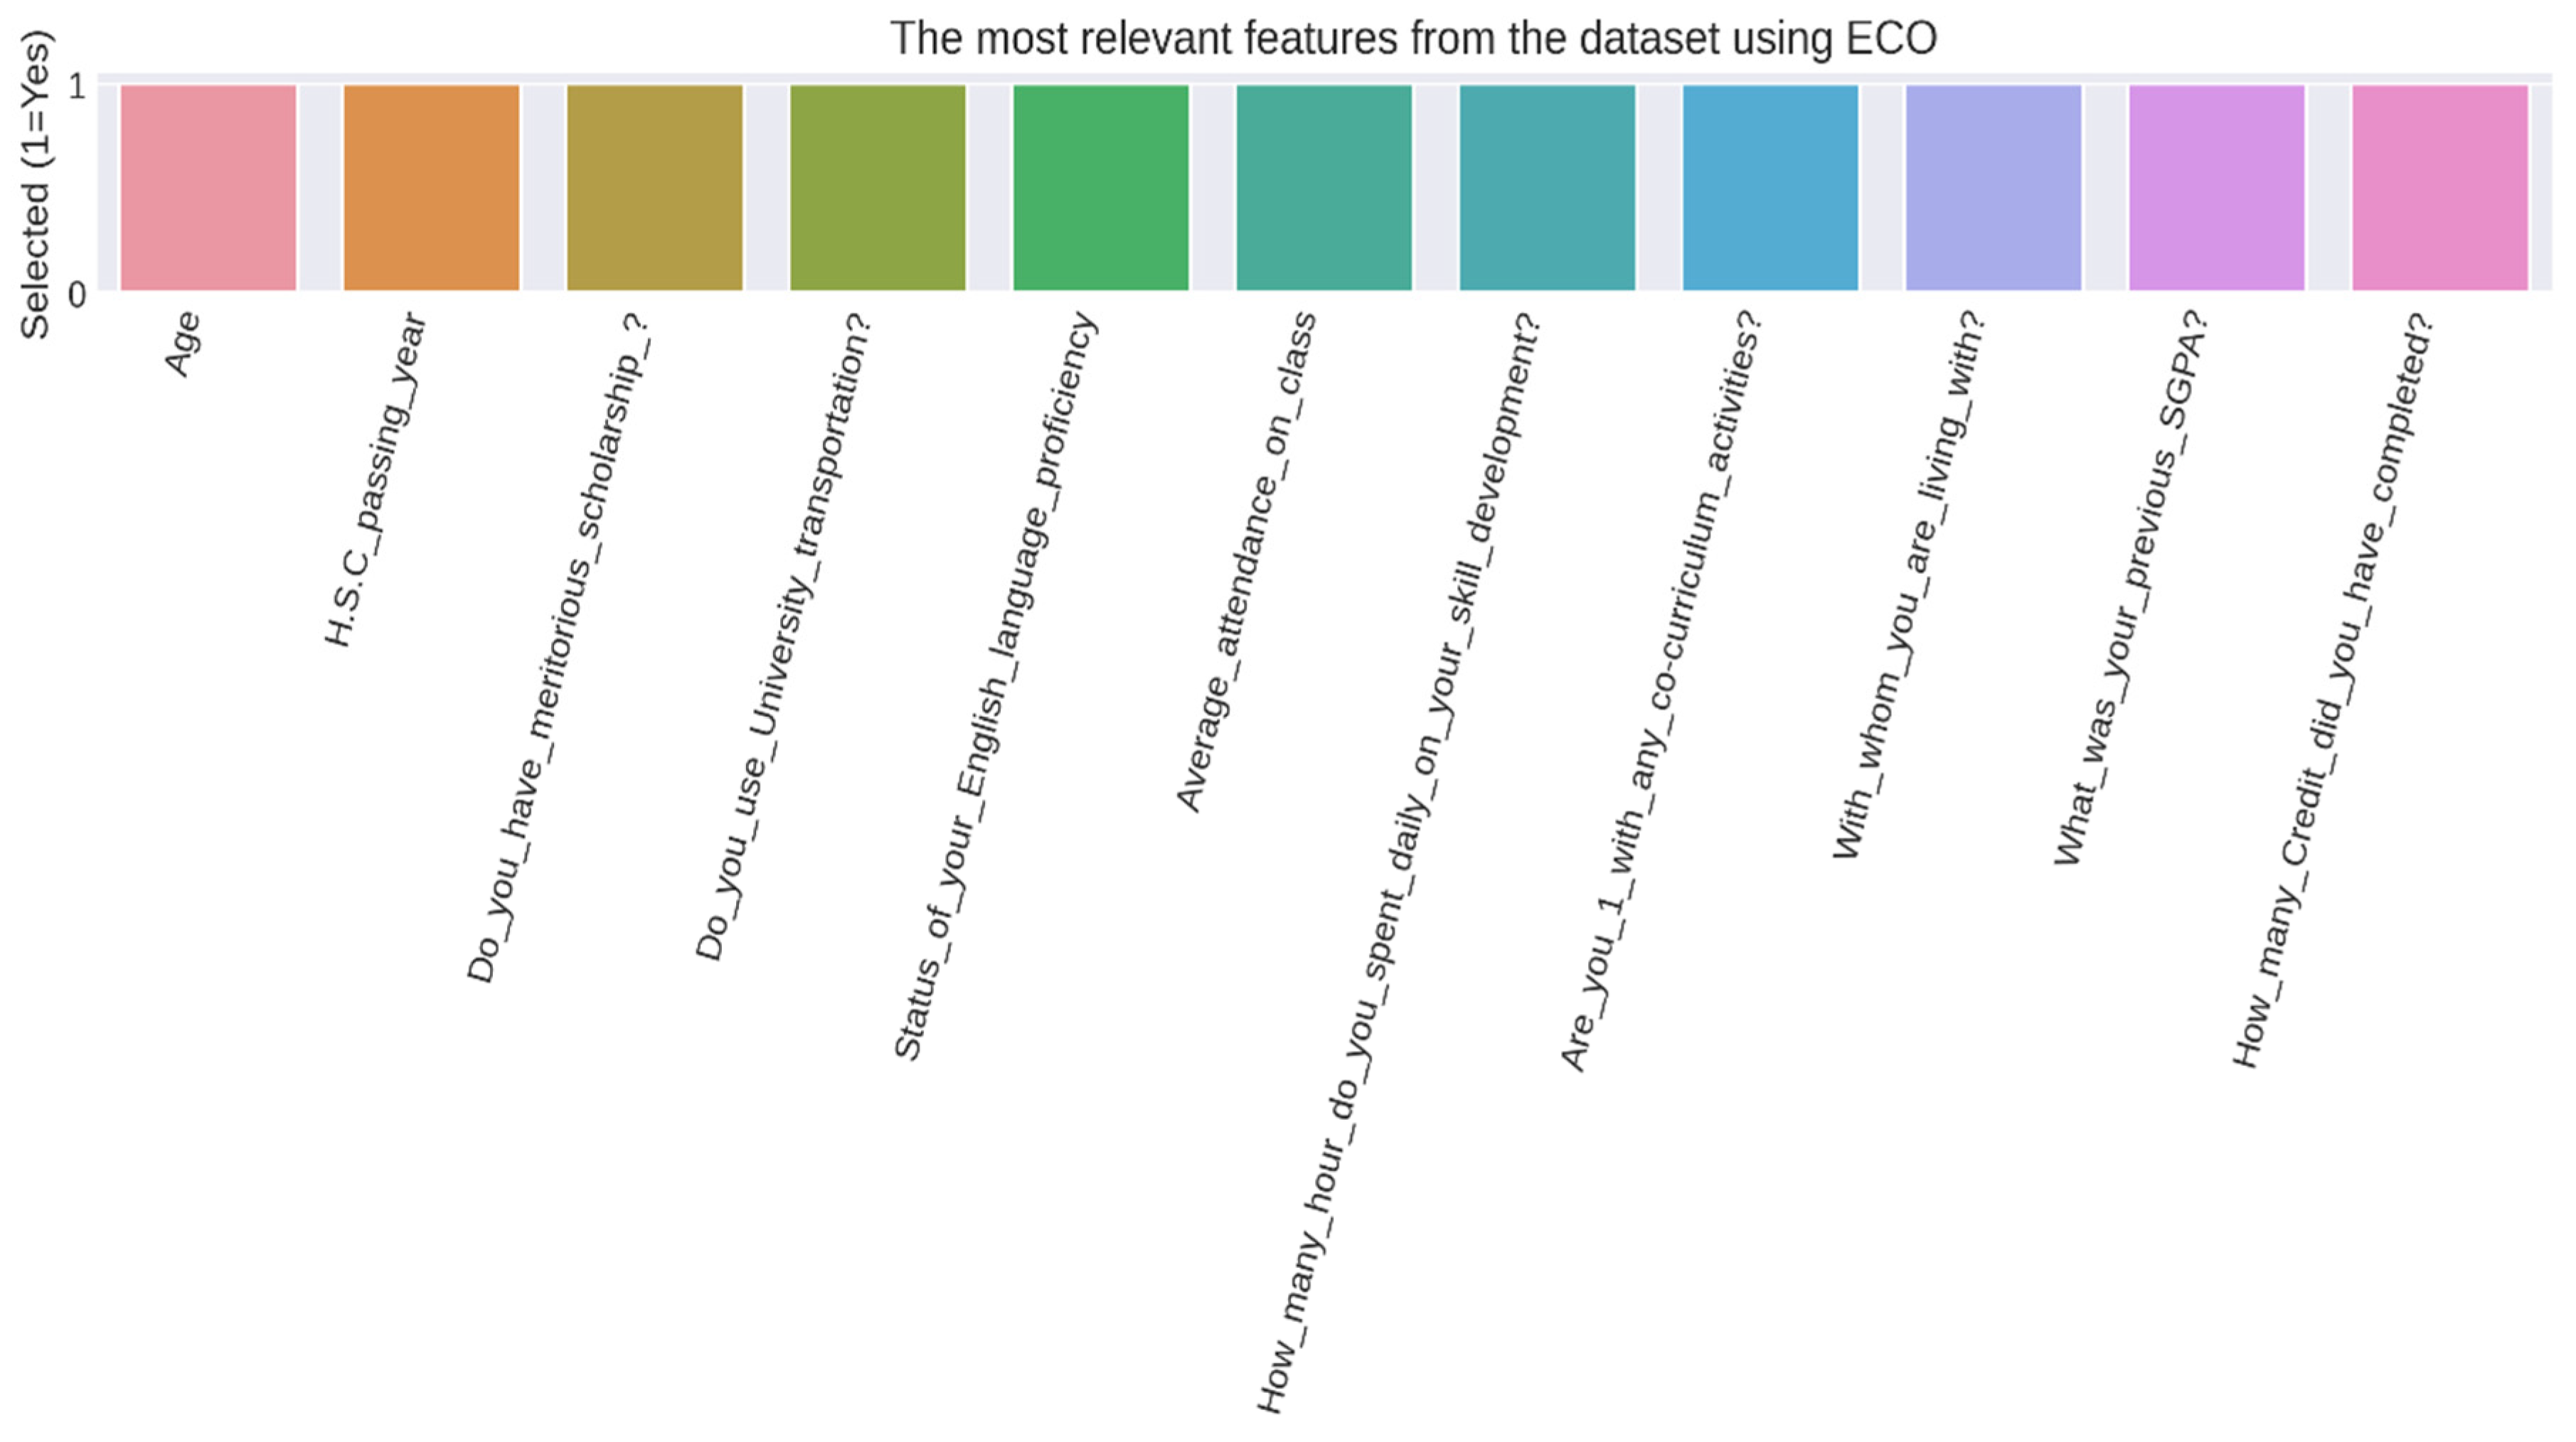
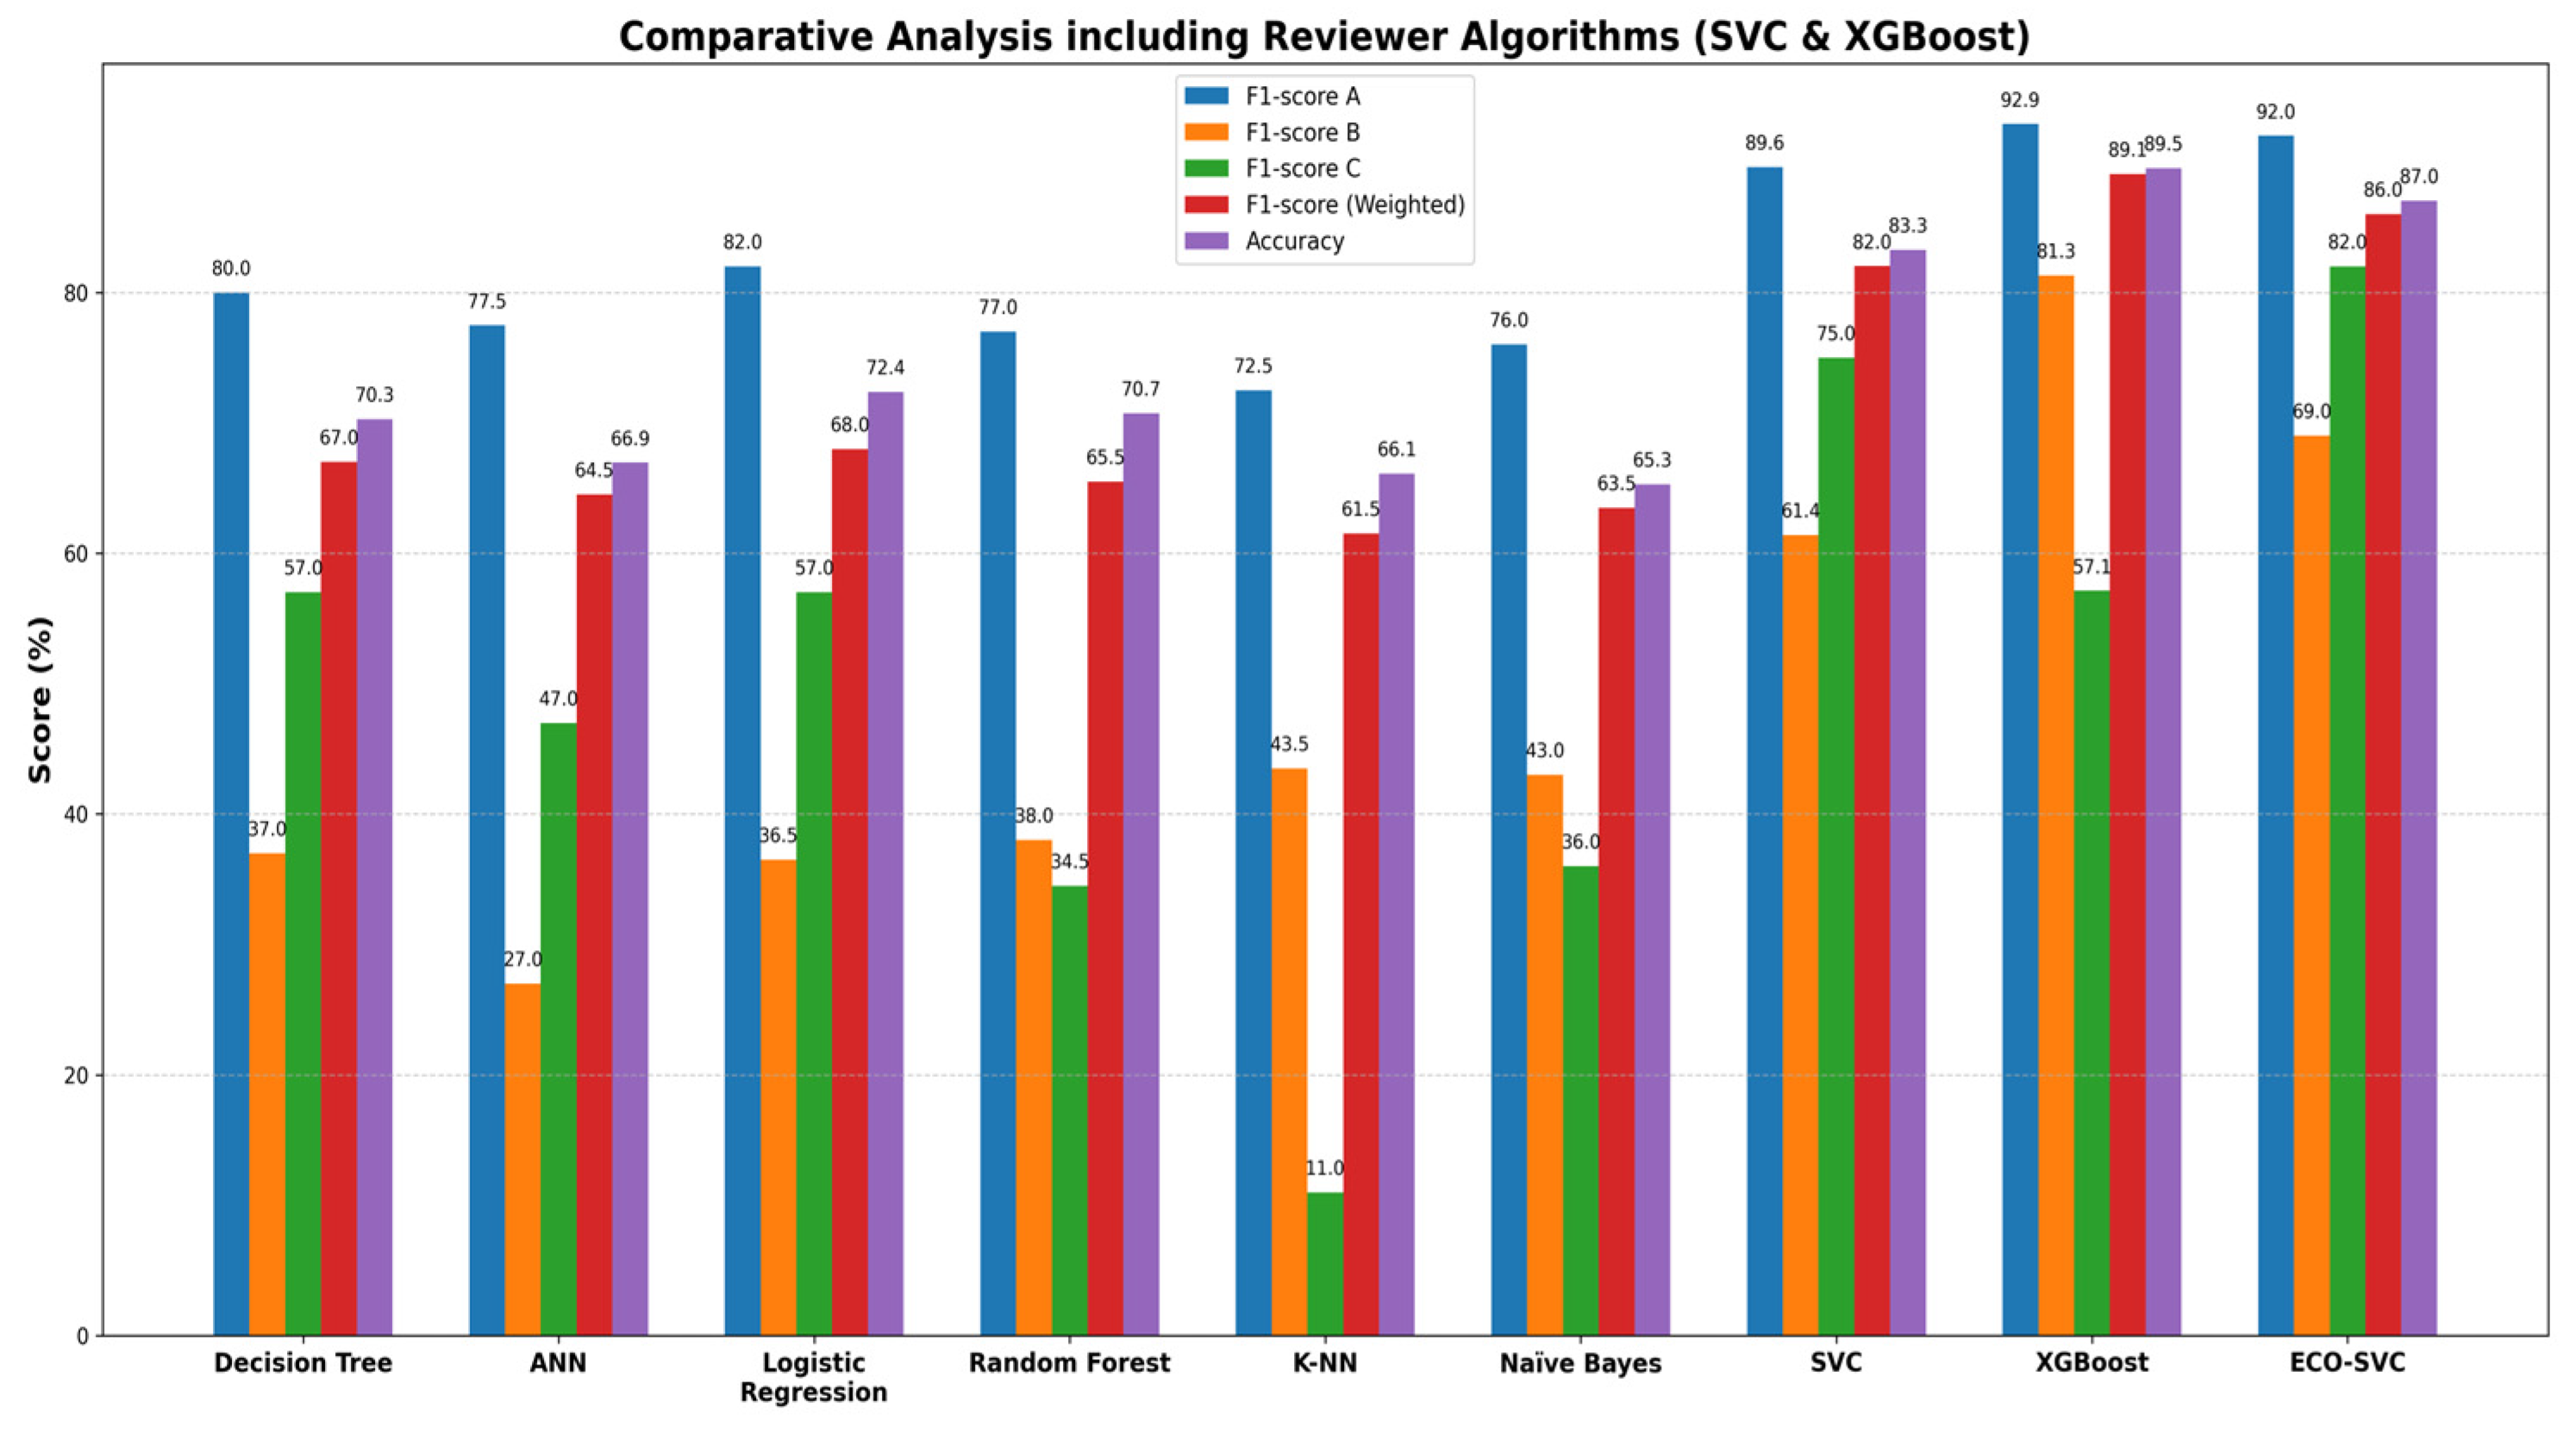
Table 7, provides a better idea of how the ECO-based feature selection framework helped. This shows that the quality of the selected feature subset is what drives the performance gains. Although XGBoost achieved the highest overall accuracy, ECO–SVC demonstrated superior minority class sensitivity and interpretability. This means that ECO–SVC is better at finding students who are not doing well, which is very important for educational apps that need to find risks early on. ECO–SVC also has the highest macro F1-score, which means that it classifies things more evenly across all classes. This performance is achieved using only 11 selected features compared to 29 features in baseline models. This shows how efficient, understandable, and strong the proposed method is. These results show that ECO improves the performance of classifiers by improving the feature space instead of just changing the algorithm used to classify. Therefore, the proposed ECO–SVC framework provides a more reliable and practically valuable solution compared to purely accuracy-driven models. A standalone SVC model trained on the full feature set (29 features) is included as a baseline to clearly show how the ECO-based feature selection affects the results. The results show that SVC obtains an accuracy of 83.26% when it uses all of the features. ECO–SVC, on the other hand, obtains an accuracy of 87.03% when it only uses 11 features. This shows that ECO not only reduces the number of features but also improves classification performance, resulting in an accuracy increase of about 3.77%. The ECO–SVC model also does a better job of finding minority classes, which means that the chosen features are more discriminative and strong.
Although XGBoost achieved the highest overall accuracy, the proposed ECO–SVC framework demonstrated superior balanced performance, interpretability, and minority class sensitivity. ECO–SVC is especially good at finding the minority class (Class C), which is important for finding students who are at risk in schools. ECO–SVC also has better interpretability because it uses a smaller, more meaningful set of features that makes decision making clearer and more useful. The model works even better when it can only use 11 selected features, which also makes it easier to use. In addition, ECO–SVC’s good performance in early-risk suitability shows that it is a useful decision-support tool, where balanced performance and interpretability are more important than small improvements in overall accuracy. These results show that the proposed framework is a more reliable and useful solution than models that focus on accuracy, especially in situations where fairness, robustness, and explainability are important.
The results show that the SVC alone has an accuracy of 83.26%. When combined with ECO, this number goes up to 87.03%. This clearly shows that the ECO-based feature selection mechanism is what makes the performance better. This shows that ECO works well to improve classification performance by removing unnecessary and less useful features from the feature space. XGBoost has the highest overall accuracy (89.54%) and weighted F1-score of all the models. This shows that it is very good at improving global predictive performance. However, if you look more closely, you will see that XGBoost does much worse on the minority class (Class C), obtaining only 57.14% compared to 82.00% for ECO–SVC. This shows a big problem with accuracy-driven models when the classes are not equal. ECO–SVC, on the other hand, shows the most balanced performance across all classes, with consistently high F1-scores for Classes A, B, and C. ECO–SVC has the highest F1-score for Class C, which is important for finding students who are at risk in educational settings. This balanced behavior is also shown by its higher macro F1-score, which shows that it generalizes better across all classes instead of just being the best in one class. In addition, ECO–SVC obtained this performance with only 11 chosen features, while baseline models use 29 features. This decrease in feature dimensionality makes it easier to understand, lessens the difficulty of calculations, and stops overfitting. In general, the figure shows that XGBoost is great at maximizing overall accuracy. However, the proposed ECO–SVC framework is a better, more understandable, and more useful solution, especially when detecting minority classes and balancing performance are important.
The comparative results show a big difference between obtaining the best global predictive accuracy and obtaining reliable, application-oriented performance with imbalanced educational data. XGBoost has the highest overall accuracy and weighted F1-score, but its performance on the minority class (Class C) is still much lower, showing that it favors the majority class. The proposed ECO–SVC framework, on the other hand, has a much higher F1-score for Class C and the best macro F1-score, which shows that it works well across all classes. This behavior is very important for predicting how well students will do, where finding at-risk students is more important than small improvements in overall accuracy. The observed enhancement is chiefly ascribed to the ECO-based feature selection, which diminishes the feature space from 29 to 11 attributes while retaining the most distinguishing information. This compact representation reduces noise and redundancy, which helps the SVC classifier make decision boundaries that are more stable. In addition, ECO–SVC is easier to understand and faster to compute than XGBoost, which uses complex ensemble structures over the whole feature space. Thus, even though XGBoost is a good benchmark for accuracy, ECO–SVC is a better and more useful solution, especially when fairness, sensitivity to minority classes, and explainability are important for making decisions in the real world.
To evaluate the generalizability of the proposed ECO framework, it is essential to recognize that ECO functions as a classifier-independent feature selection mechanism. ECO finds the best set of features that can be used by different classifiers, which is different from model-specific optimization techniques.
Table 7 shows that several baseline classifiers, such as decision tree, random forest, naïve Bayes, logistic regression, and K-NN, were tested on the same dataset. Even though these models were trained on the original feature space, ECO–SVC’s better performance shows how well ECO can find discriminative features that improve classification performance. This indicates that ECO enhances performance beyond classifier-specific attributes.
ECO can be used with many different classifiers, but this study chose SVC because it has a strong theoretical basis in structural risk minimization and works well with data that are high-dimensional and not linearly separable. ECO-based feature selection and SVC classification work well together to improve margin optimization and generalization performance. Thus, the performance improvements we saw are due to both the quality of the chosen feature subset and the classifier’s ability to use it well.
4.2. Statistical Stability and Generalization
The statistical analysis, as shown in
Table 9, reveals that the proposed ECO–SVC model achieves the highest mean F1-score (81.00) with the lowest standard deviation (9.42), indicating superior predictive performance and stability. In contrast, baseline models exhibit significantly higher variability, particularly due to poor performance in minority classes. The high variance observed in models such as K-NN (26.58) reflects instability and sensitivity to class imbalance. These results confirm that the ECO-based feature selection not only improves accuracy but also enhances robustness and consistency across different performance categories.
4.3. Explainability and Semiotic Interpretation
This study incorporates XAI approaches with the suggested semiotic-linguistic framework to improve the interpretability of the ECO–SVC model and transcend black box prediction. Although the ECO algorithm proficiently selects the most significant feature subset and SVC attains elevated prediction accuracy, explainability is crucial in educational settings where transparency, pedagogical, and trust understanding are necessary. Consequently, SHAP analysis is utilized on the final ECO-selected feature subset to measure the incremental impact of each feature to the SVC’s classification decisions. In contrast to conventional feature importance metrics, SHAP offers both local explanations (instance-specific decisions) and global explanations (overall feature impact), rendering it especially appropriates for learning analytics applications.
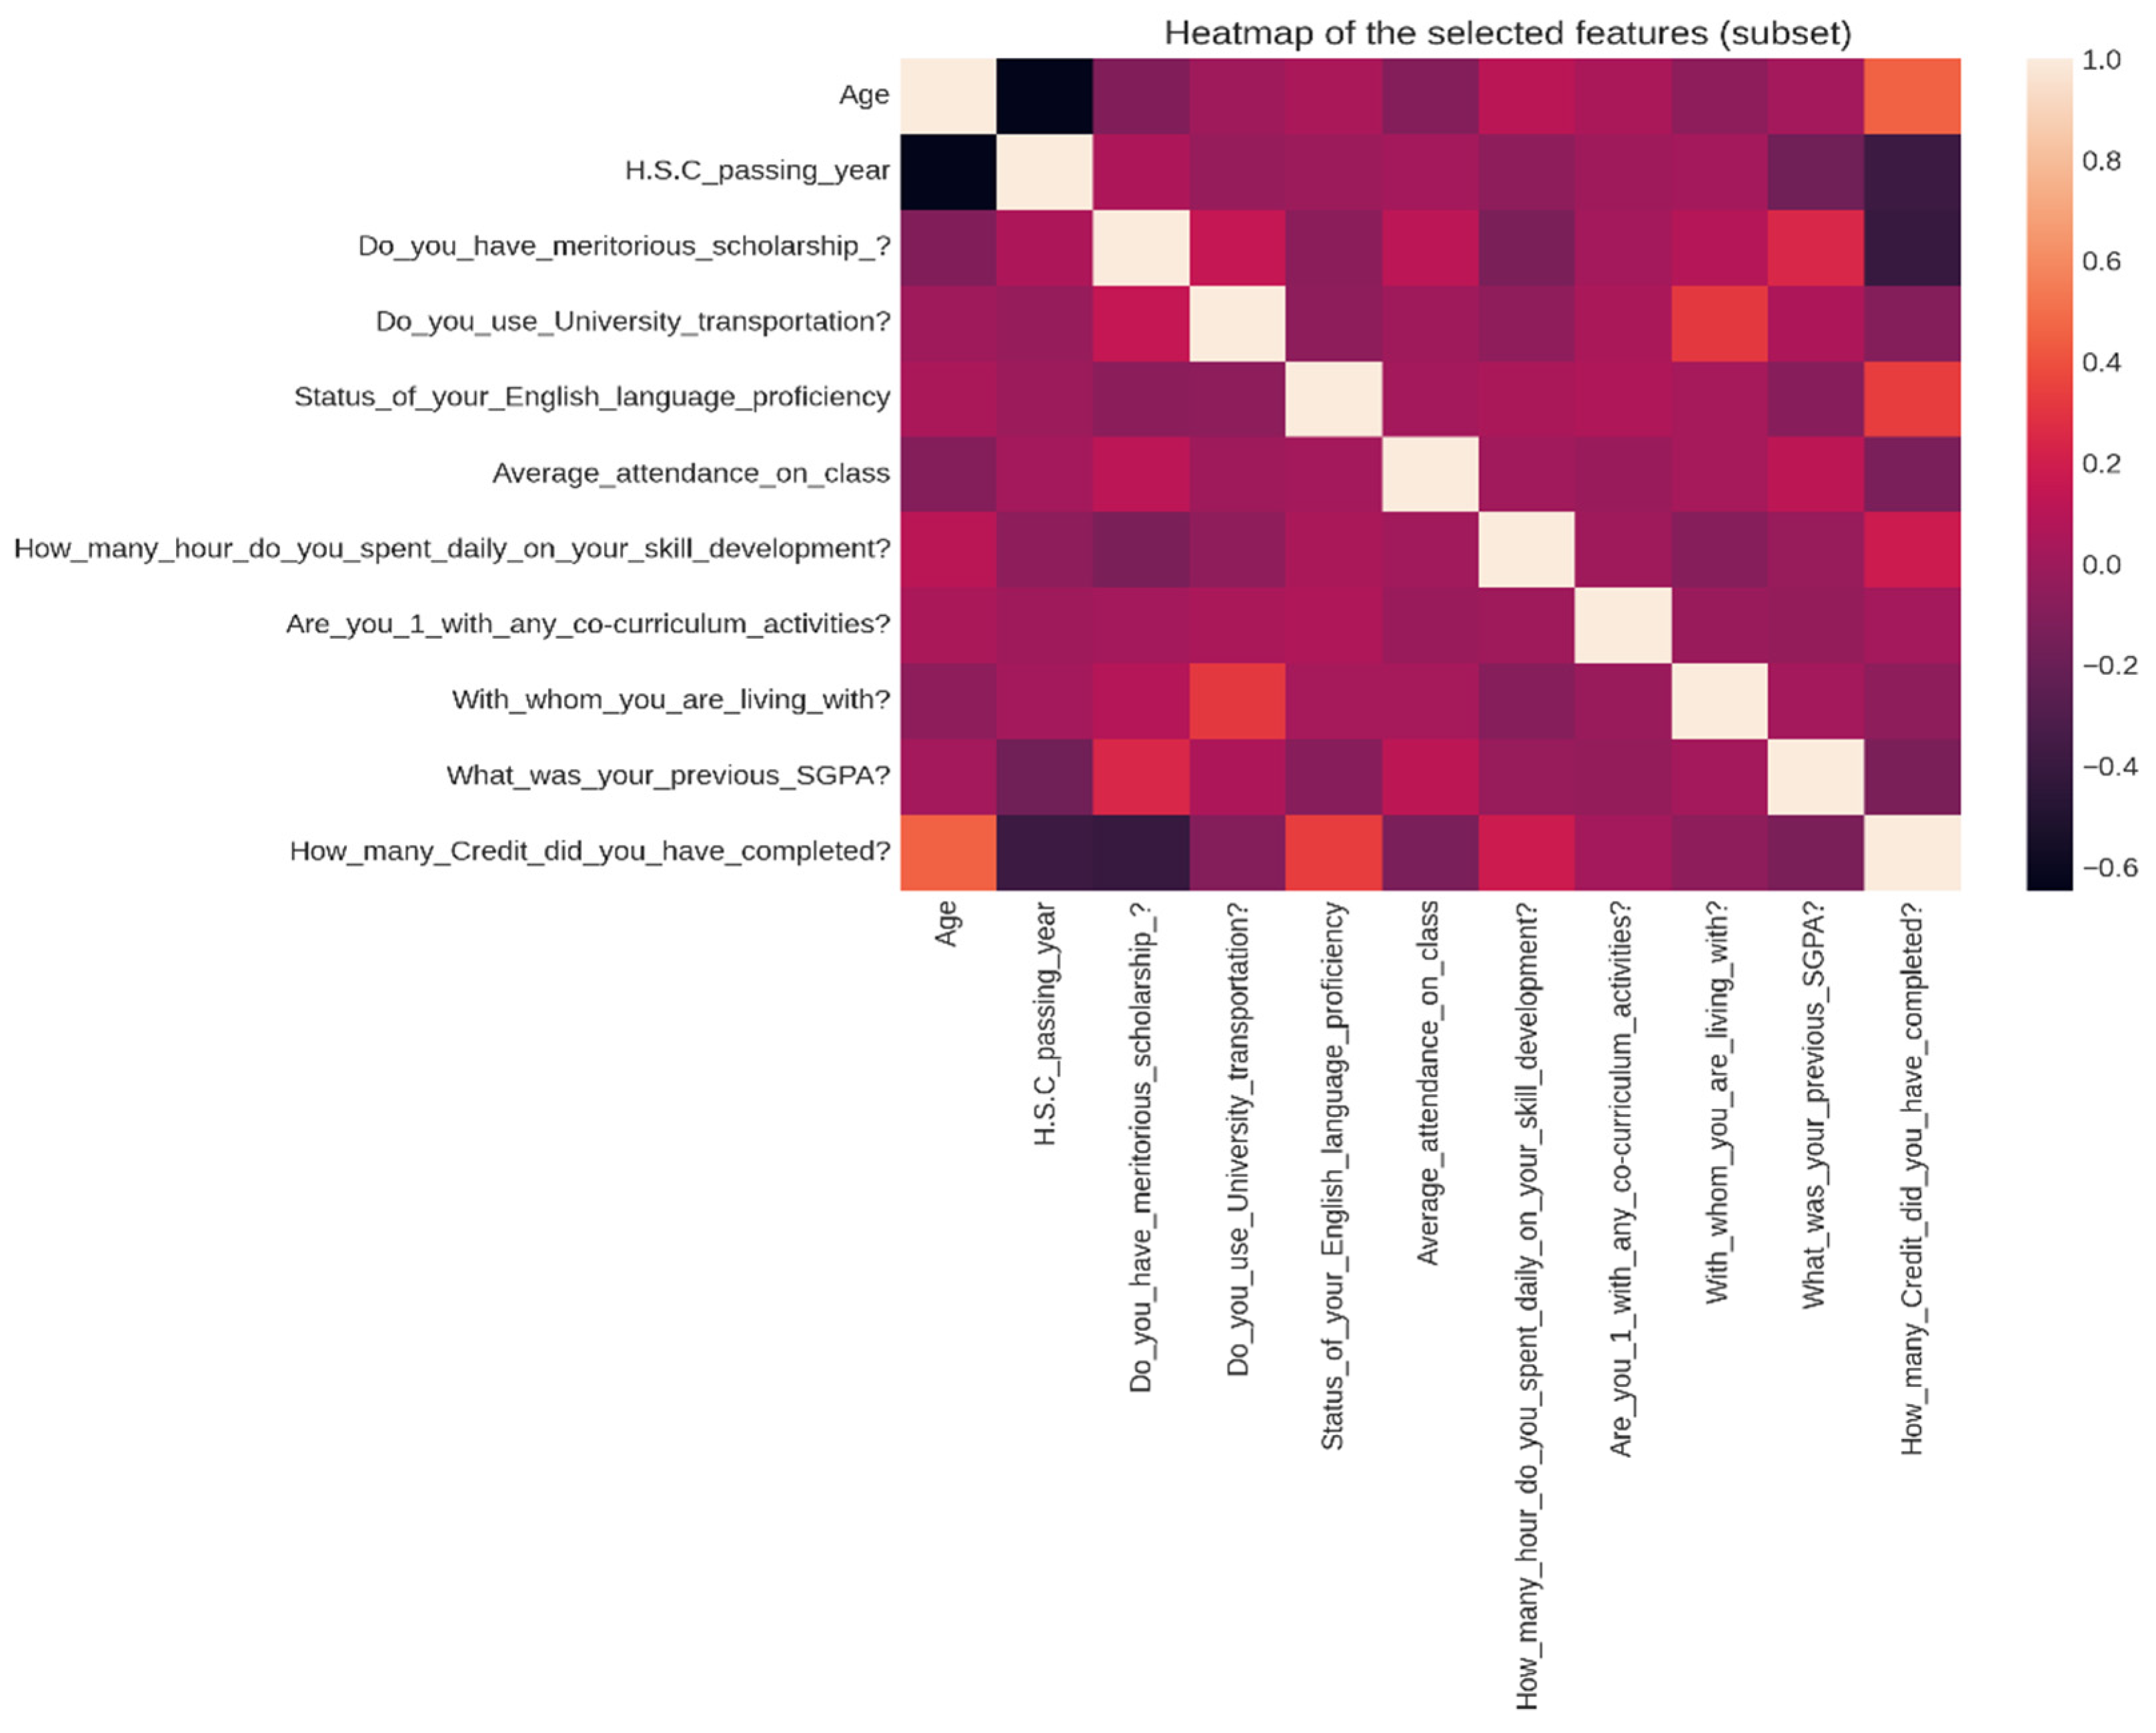
The SHAP analysis verifies that the 11 ECO-selected attributes are both statistically important and semantically interpretable as educational indicators. These attributes are classified into three semiotic groups:
Indexical signs (e.g., completed credit hours, previous SGPA): These elements directly catalog students’ collected academic experiences and previous learning pathways. Elevated SHAP values linked to these variables signify a significant reliance of future performance on past academic success.
Symbolic signs (e.g., English proficiency, skill development hours, attendance): These attributes metaphorically signify students’ involvement, self-regulation, and motivation. SHAP values indicate that improvements in these variables continuously elevate forecasts toward better performance categories, underscoring their significance as measures of academic dedication.
Chronological and sociocultural signs (e.g., HSC passing year, age, scholarship status, co-curricular activities, transportation availability): These characteristics serve as temporal and contextual indicators of maturity, socio-educational integration, and institutional support. Their SHAP contributions demonstrate how external educational factors influence learning results beyond just cognitive skills.
The proposed approach aligns SHAP-based explanations with semiotic theory, converting numerical feature contributions into comprehensible linguistic and educational insights. This integration connects ML explainability with cognitive-educational linguistics, illustrating that prediction models can attain both high accuracy and significant interpretability concurrently.
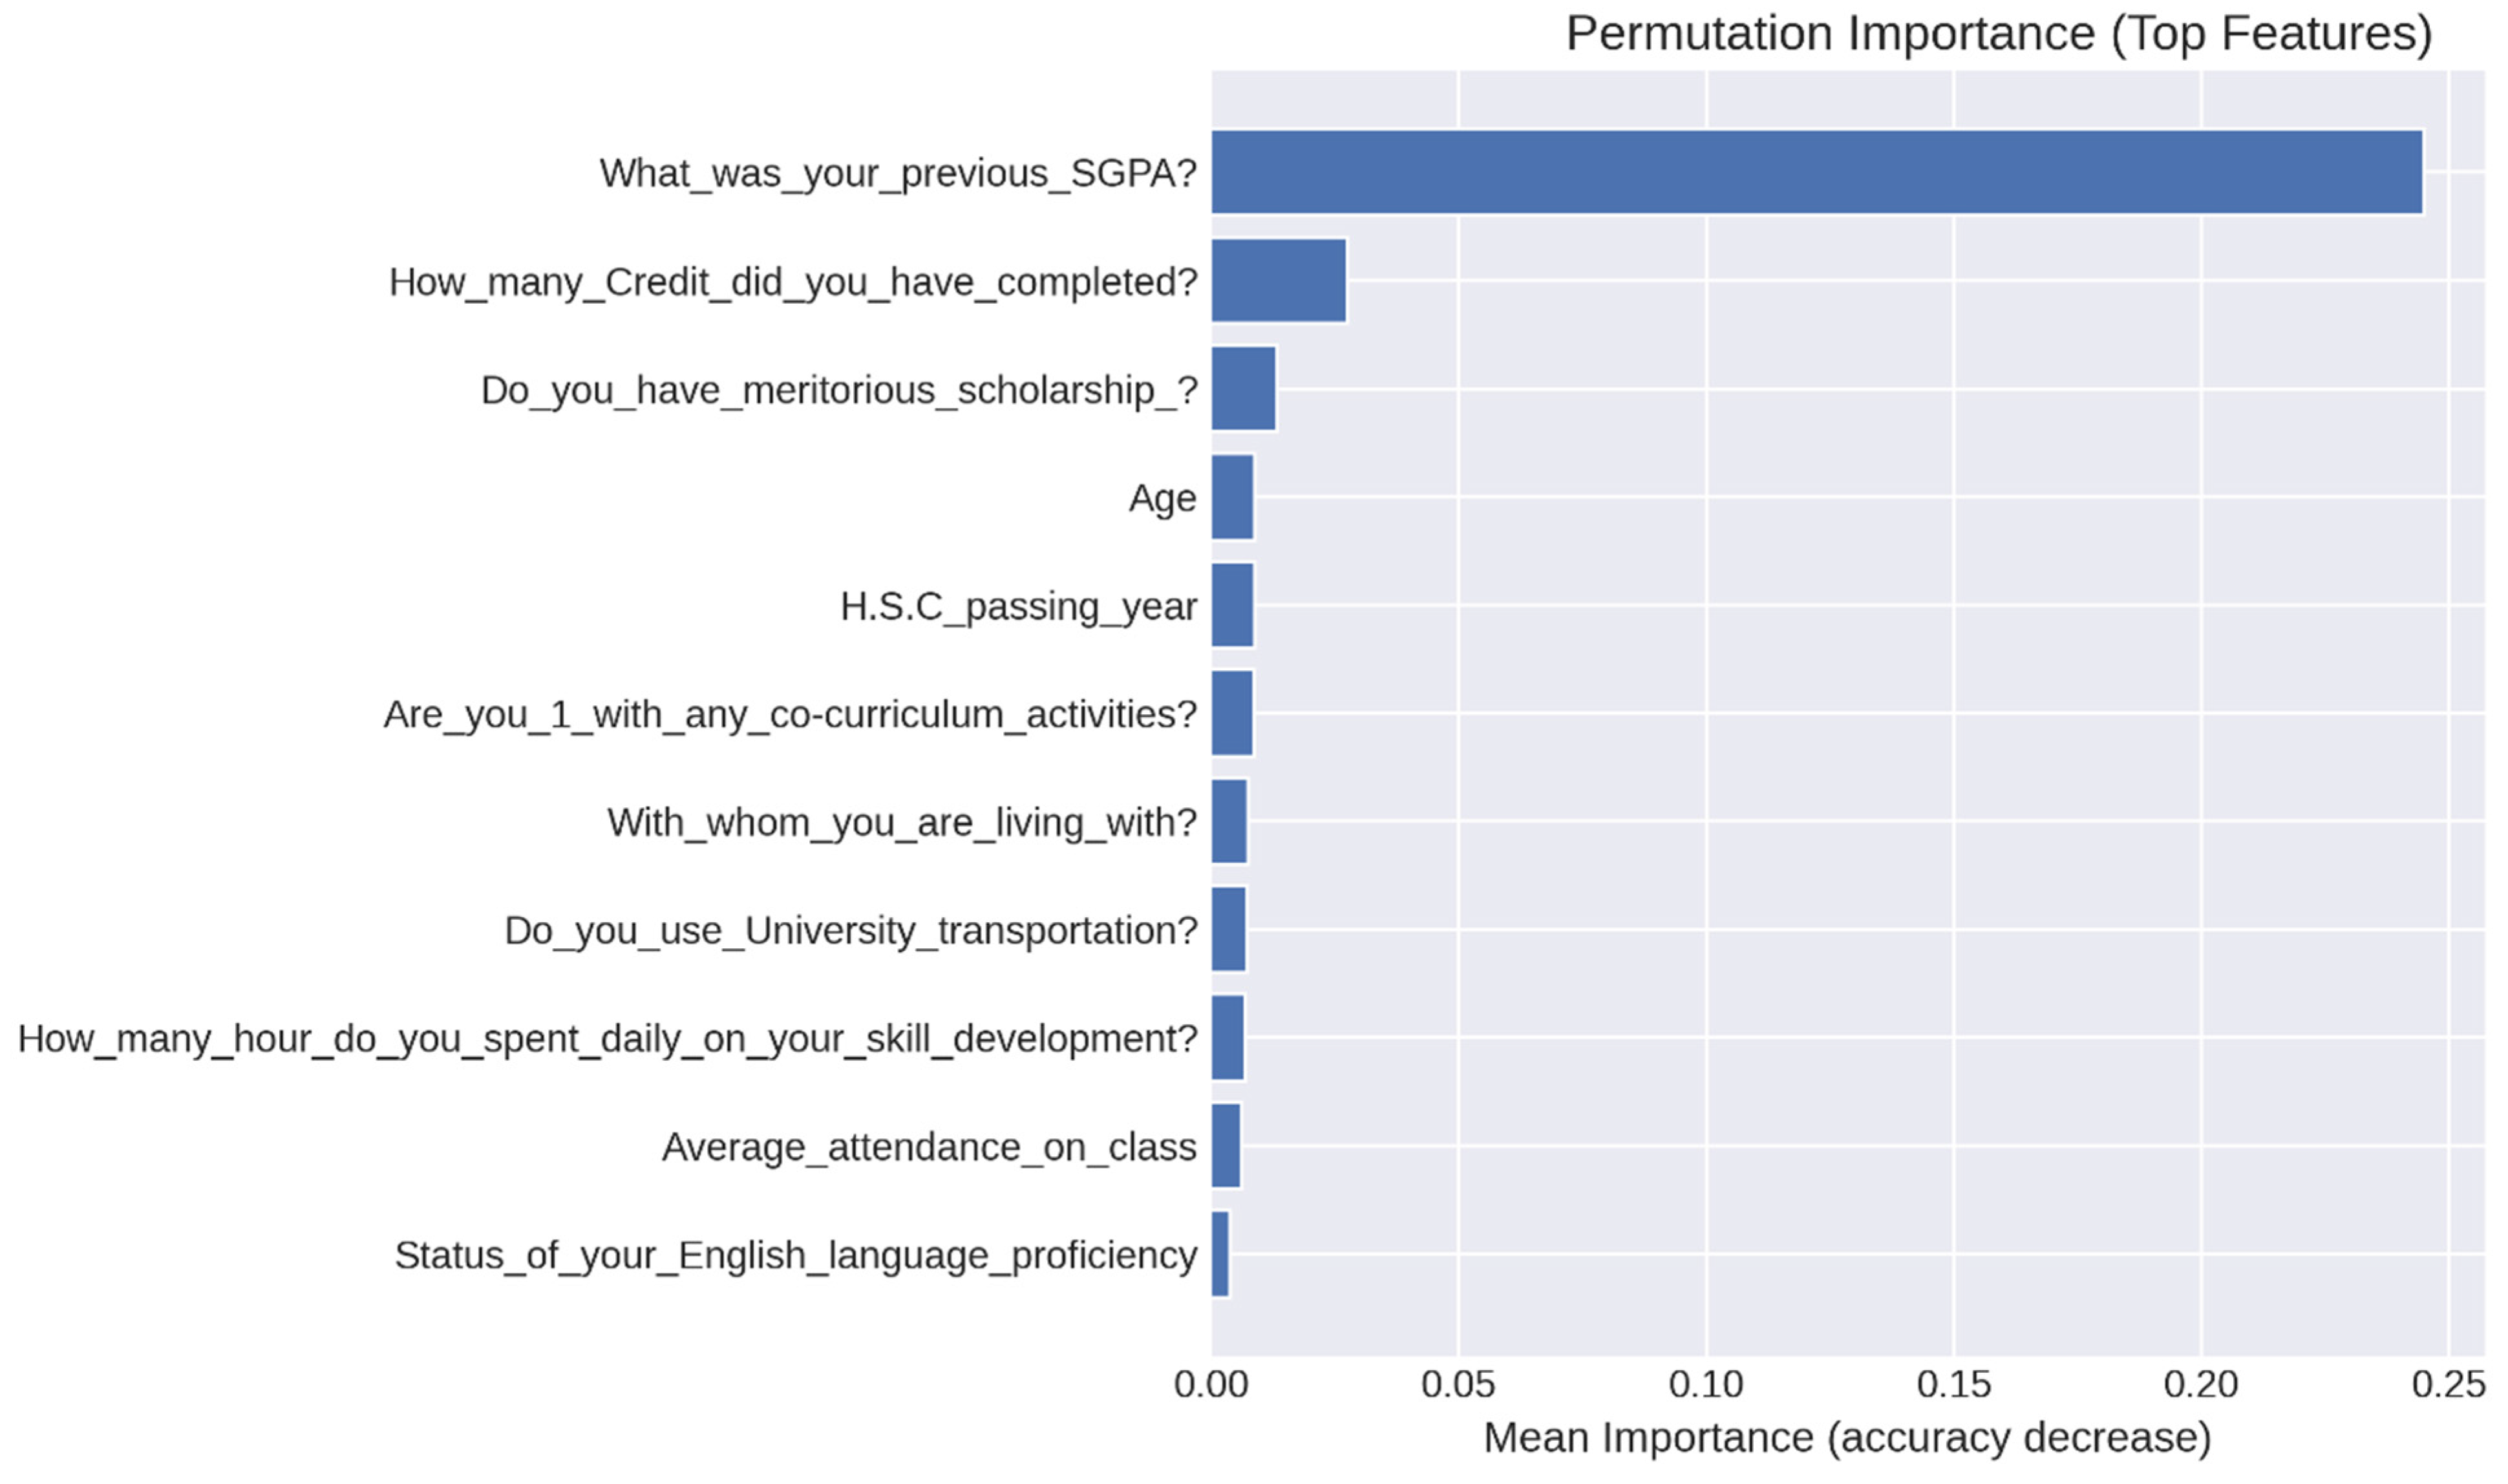
Figure 10 illustrates the permutation-based importance of feature outcomes for the ECO–SVC model, emphasizing the corresponding significance of the chosen features to prediction efficacy. The figure demonstrates that the prior SGPA is the most significant predictor, since altering this feature results in the most substantial decline in classification accuracy, showing a considerable reliance of model judgments on previous academic performance. Completed credit hours represent the second most significant element, underscoring the importance of accumulated learning progress. Additional attributes—such as scholarship status, age, high school completion year, co-curricular participation, living arrangements, university transportation, skill development duration, attendance, and English language proficiency—demonstrate minor yet significant contributions. These findings affirm that although past academic achievement predominantly influences predictions, behavioral engagement and socio-contextual elements together enhance the complexity and clarity of the decision-making process. The graphic illustrates the efficacy of the proposed XAI layer in quantifying and ranking feature influence while maintaining model accuracy.
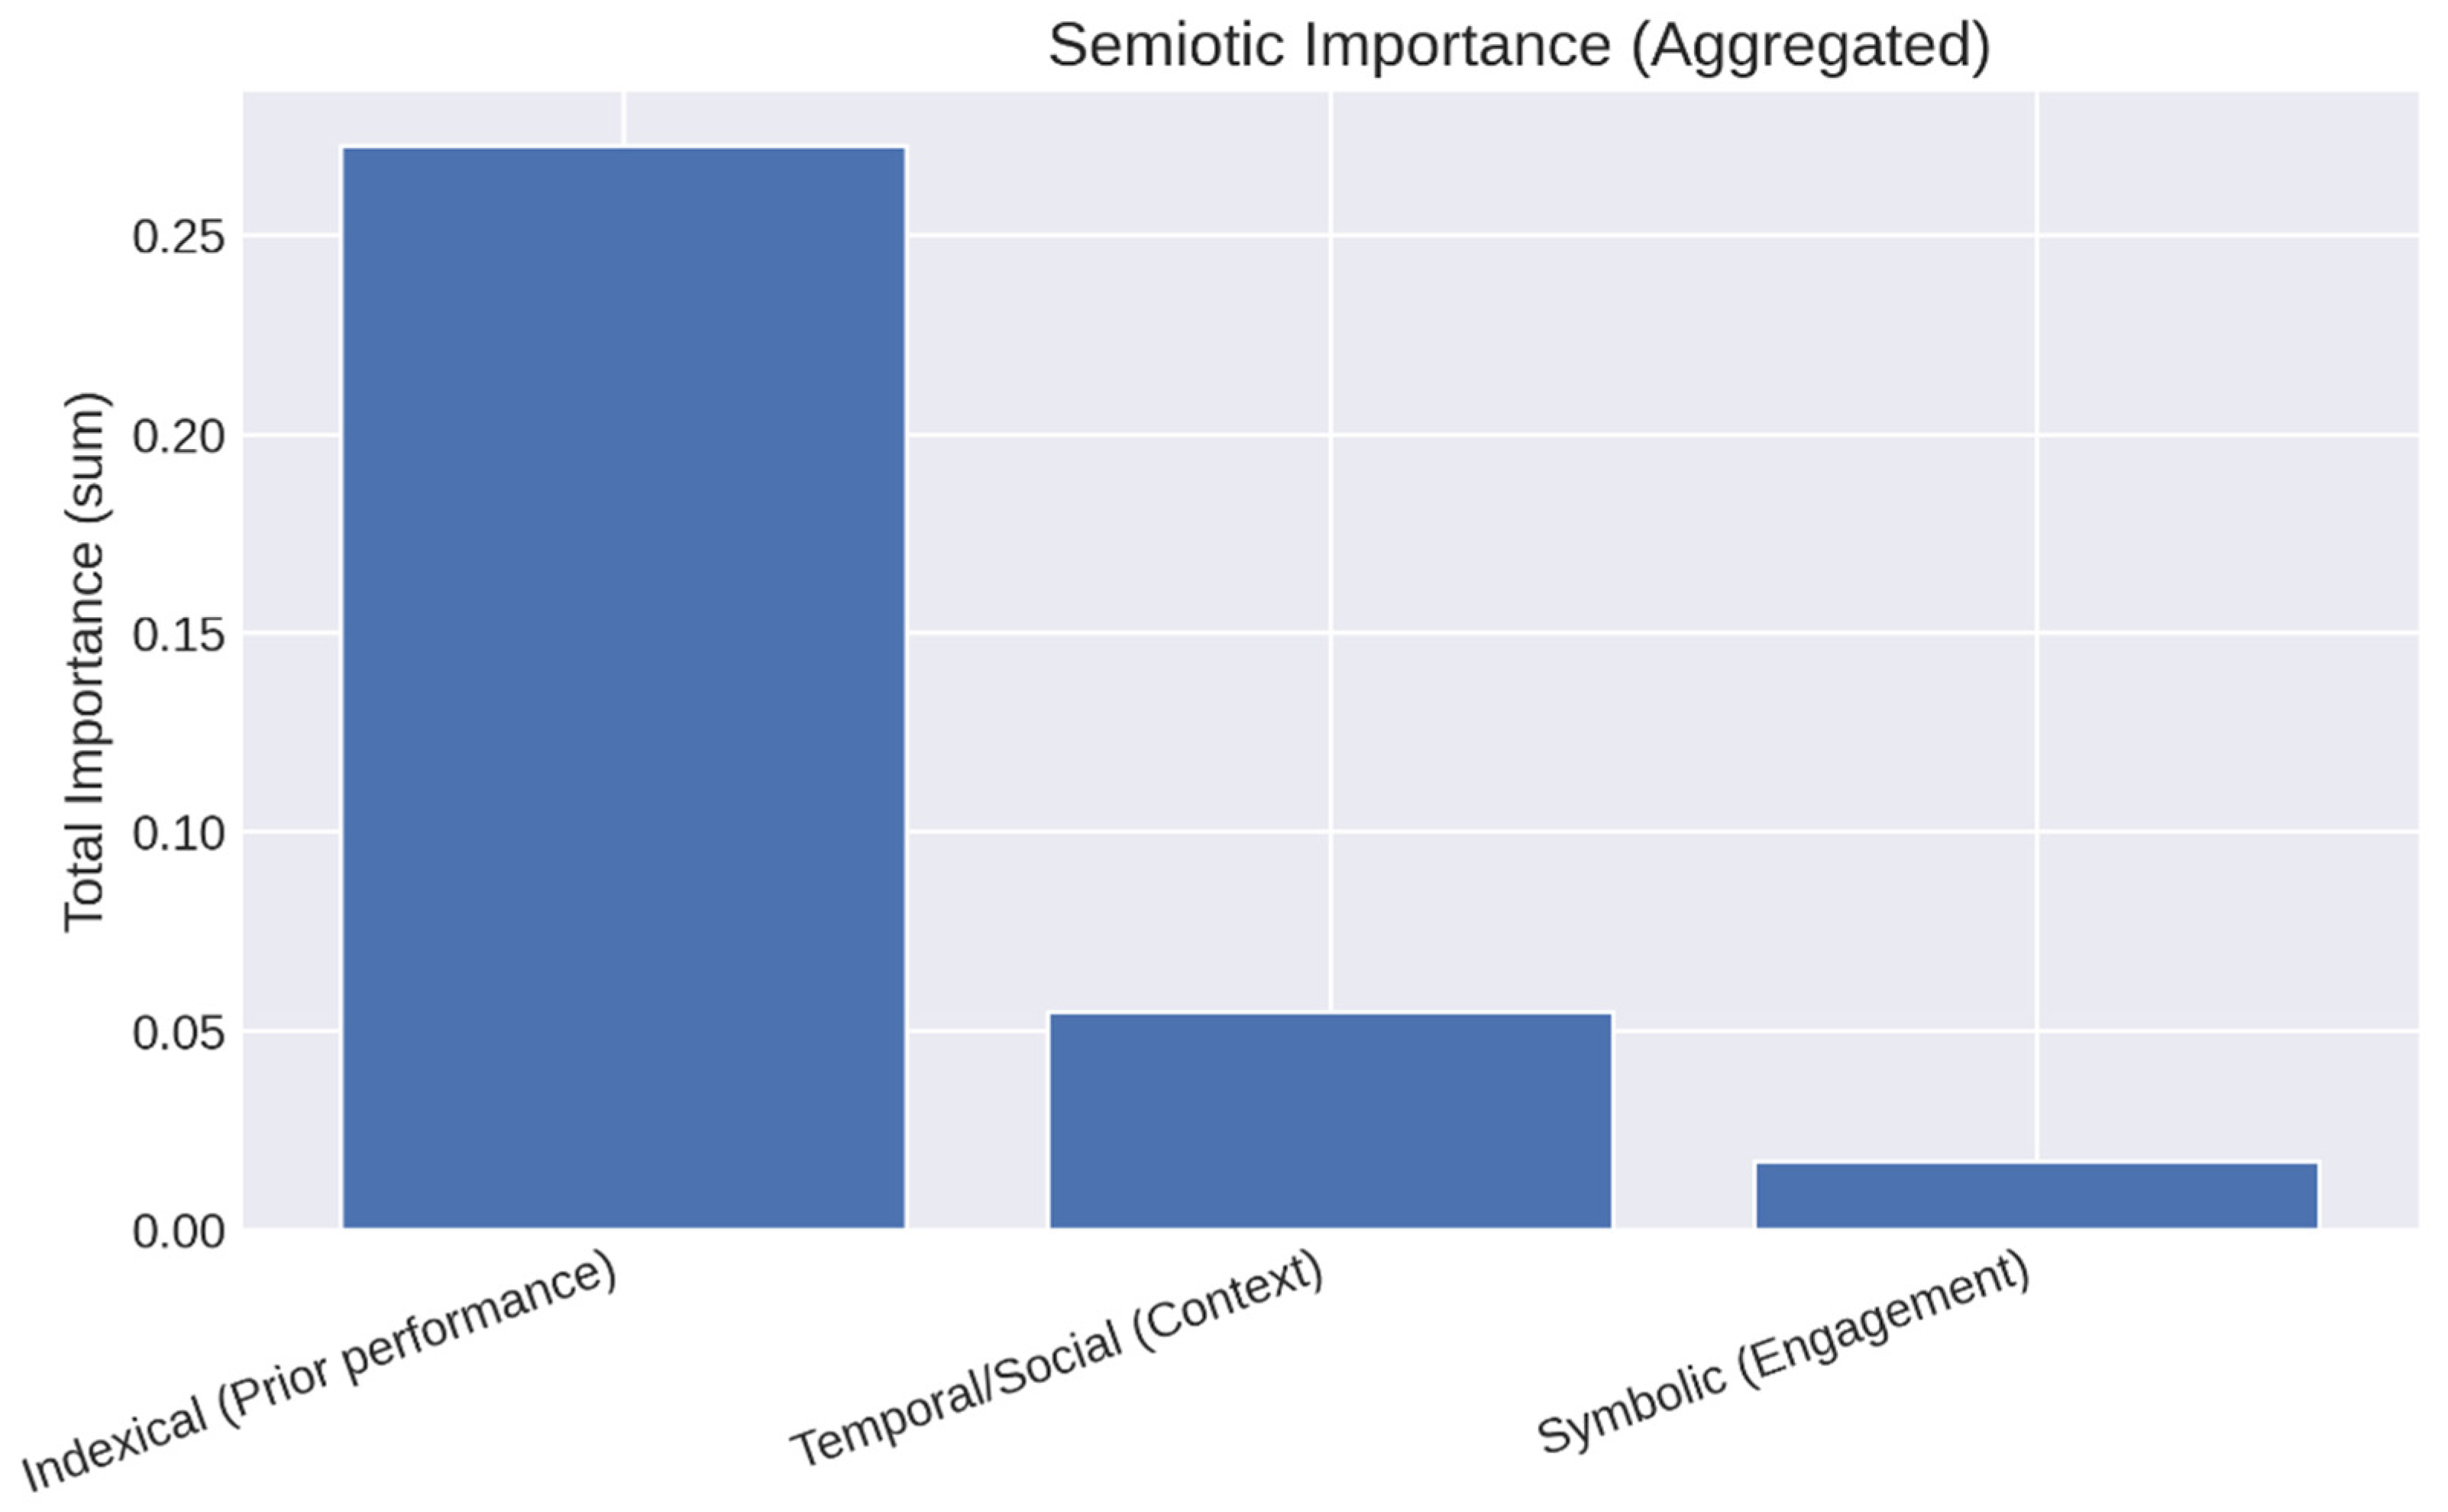
Depending on their explicable significance to the predictions of the ECO–SVC model, the combined semiotic significance of ECO-selected traits is shown in
Figure 11. The findings highlight the significant impact of past educational findings on performance prediction by showing that indexical signs, which indicate previous academic success indicators, account for the biggest percentage of total importance. A moderate portion is contributed by temporal and social indicators, which record organizational and contextual elements. These indicators show how students’ educational environments and personal situations influence their academic paths. On the other hand, symbolic indications, which are linked to behavioral and engagement measures, show a modest but significant effect, emphasizing their complementary role in improving prediction outcomes. This distribution shows that contextual and engagement-related elements together improve the interpretability and explanatory depth of the suggested model, even though prior achievement is still the dominant determinant.
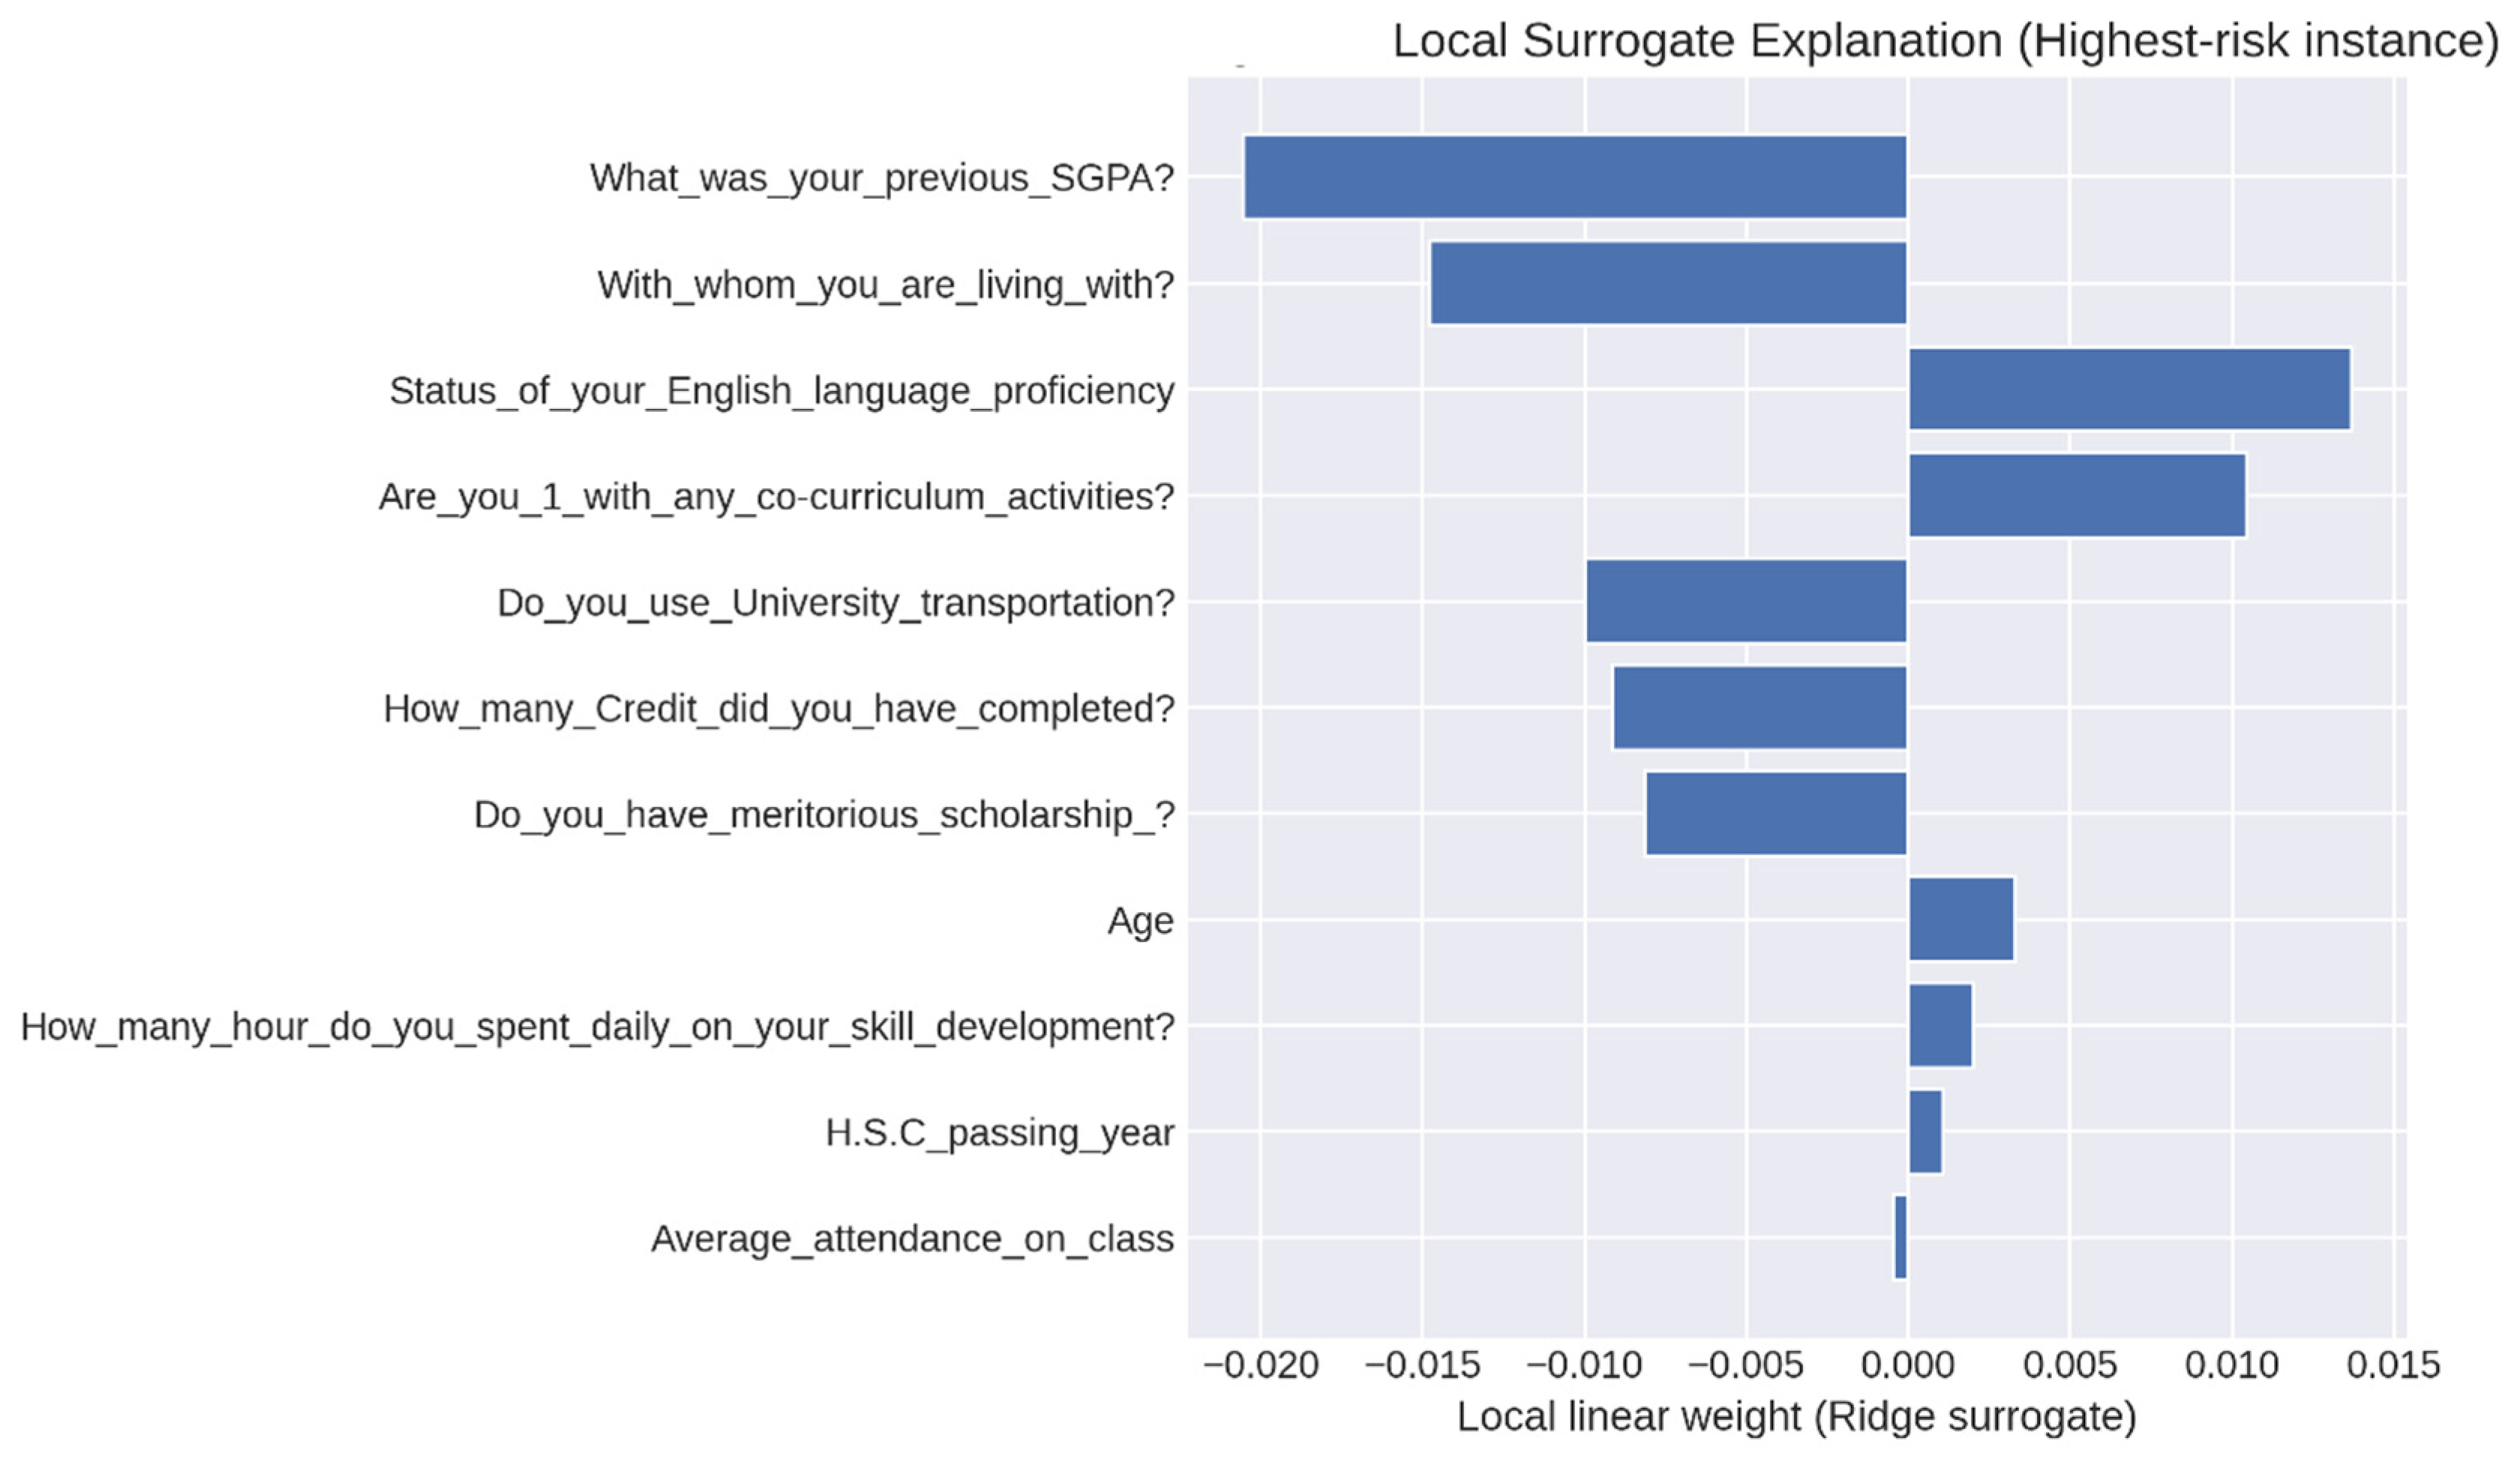
A local surrogate explanation for the student case with the highest risk, as determined using the ECO–SVC model, is shown in
Figure 12. By utilizing a linear ridge-based surrogate model to approximate the SVC behavior, the figure shows the direction and size of attribute impacts to the model’s judgment. Features that push the forecast toward a higher academic risk categorization are shown by negative coefficients, particularly for living arrangements, completed credit hours, scholarship status, previous SGPA, and university transportation. On the other hand, danger is somewhat reduced by positive correlations linked to age, skill development hours, involvement in extracurricular activities, and English language proficiency. This instance-level study offers clear and useful insight into model choices for focused academic intervention by illustrating how distinct combinations of academic history, contextual factors, and engagement behaviors collectively impact risk assessment.
SHAP-based explainability has become a common way to connect complex machine learning models with knowledge that is specific to a certain field. In healthcare, SHAP is used to make clinical prediction models easier to understand by finding the most important risk factors that affect patient outcomes. This helps make decisions more open. In finance, it is used to assess credit risk, explain why loans are approved, and make sure that rules are followed. In the same way, SHAP is used in industrial and manufacturing systems to find faults and plan maintenance by showing important features that can cause system failures. These applications show that SHAP-based global and local explanations work well to connect machine learning outputs with expert knowledge. This makes AI systems more trustworthy, open, and easy to use. In the context of this study, SHAP serves a similar role by translating model predictions into interpretable educational indicators, enabling stakeholders to understand and act upon the factors influencing student performance.
4.4. Early Academic Risk Profiling Implications
The ECO–SVC framework is enhanced to facilitate early academic risk profiling, an essential component of contemporary learning analytics systems, in addition to multi-class performance prediction. The approach utilizes ECO-selected attributes and SVC decision confidence to detect students at risk of failure earlier in their academic career, rather than depending exclusively on final grade categorization. An academic risk score is generated by integrating the SVC decision margins with SHAP-weighted feature contributions. Students are categorized into three risk levels: low risk, medium risk, and high risk. This risk-based categorization enables academic advisors and institutions to assist proactively, especially for students who, while not yet classified in the lowest performance tier, display risk patterns akin to Class C. Experimental investigation indicates that numerous medium-performing students (Class B) who subsequently shift toward poorer outcomes exhibit early warning signs, including inconsistent attendance, diminished skill development hours, or lack of institutional support indicators. ECO-based feature selection is essential in this process as it removes irrelevant variables and concentrates risk calculation on the most significant educational aspects. The suggested risk profiling approach exhibits significant sensitivity to minority classes, notwithstanding dataset imbalance. The model demonstrates promising performance in identifying minority class patterns; however, this result should be interpreted with caution due to the limited number of test samples for Class C, which are generally challenging to discern with traditional classifiers.
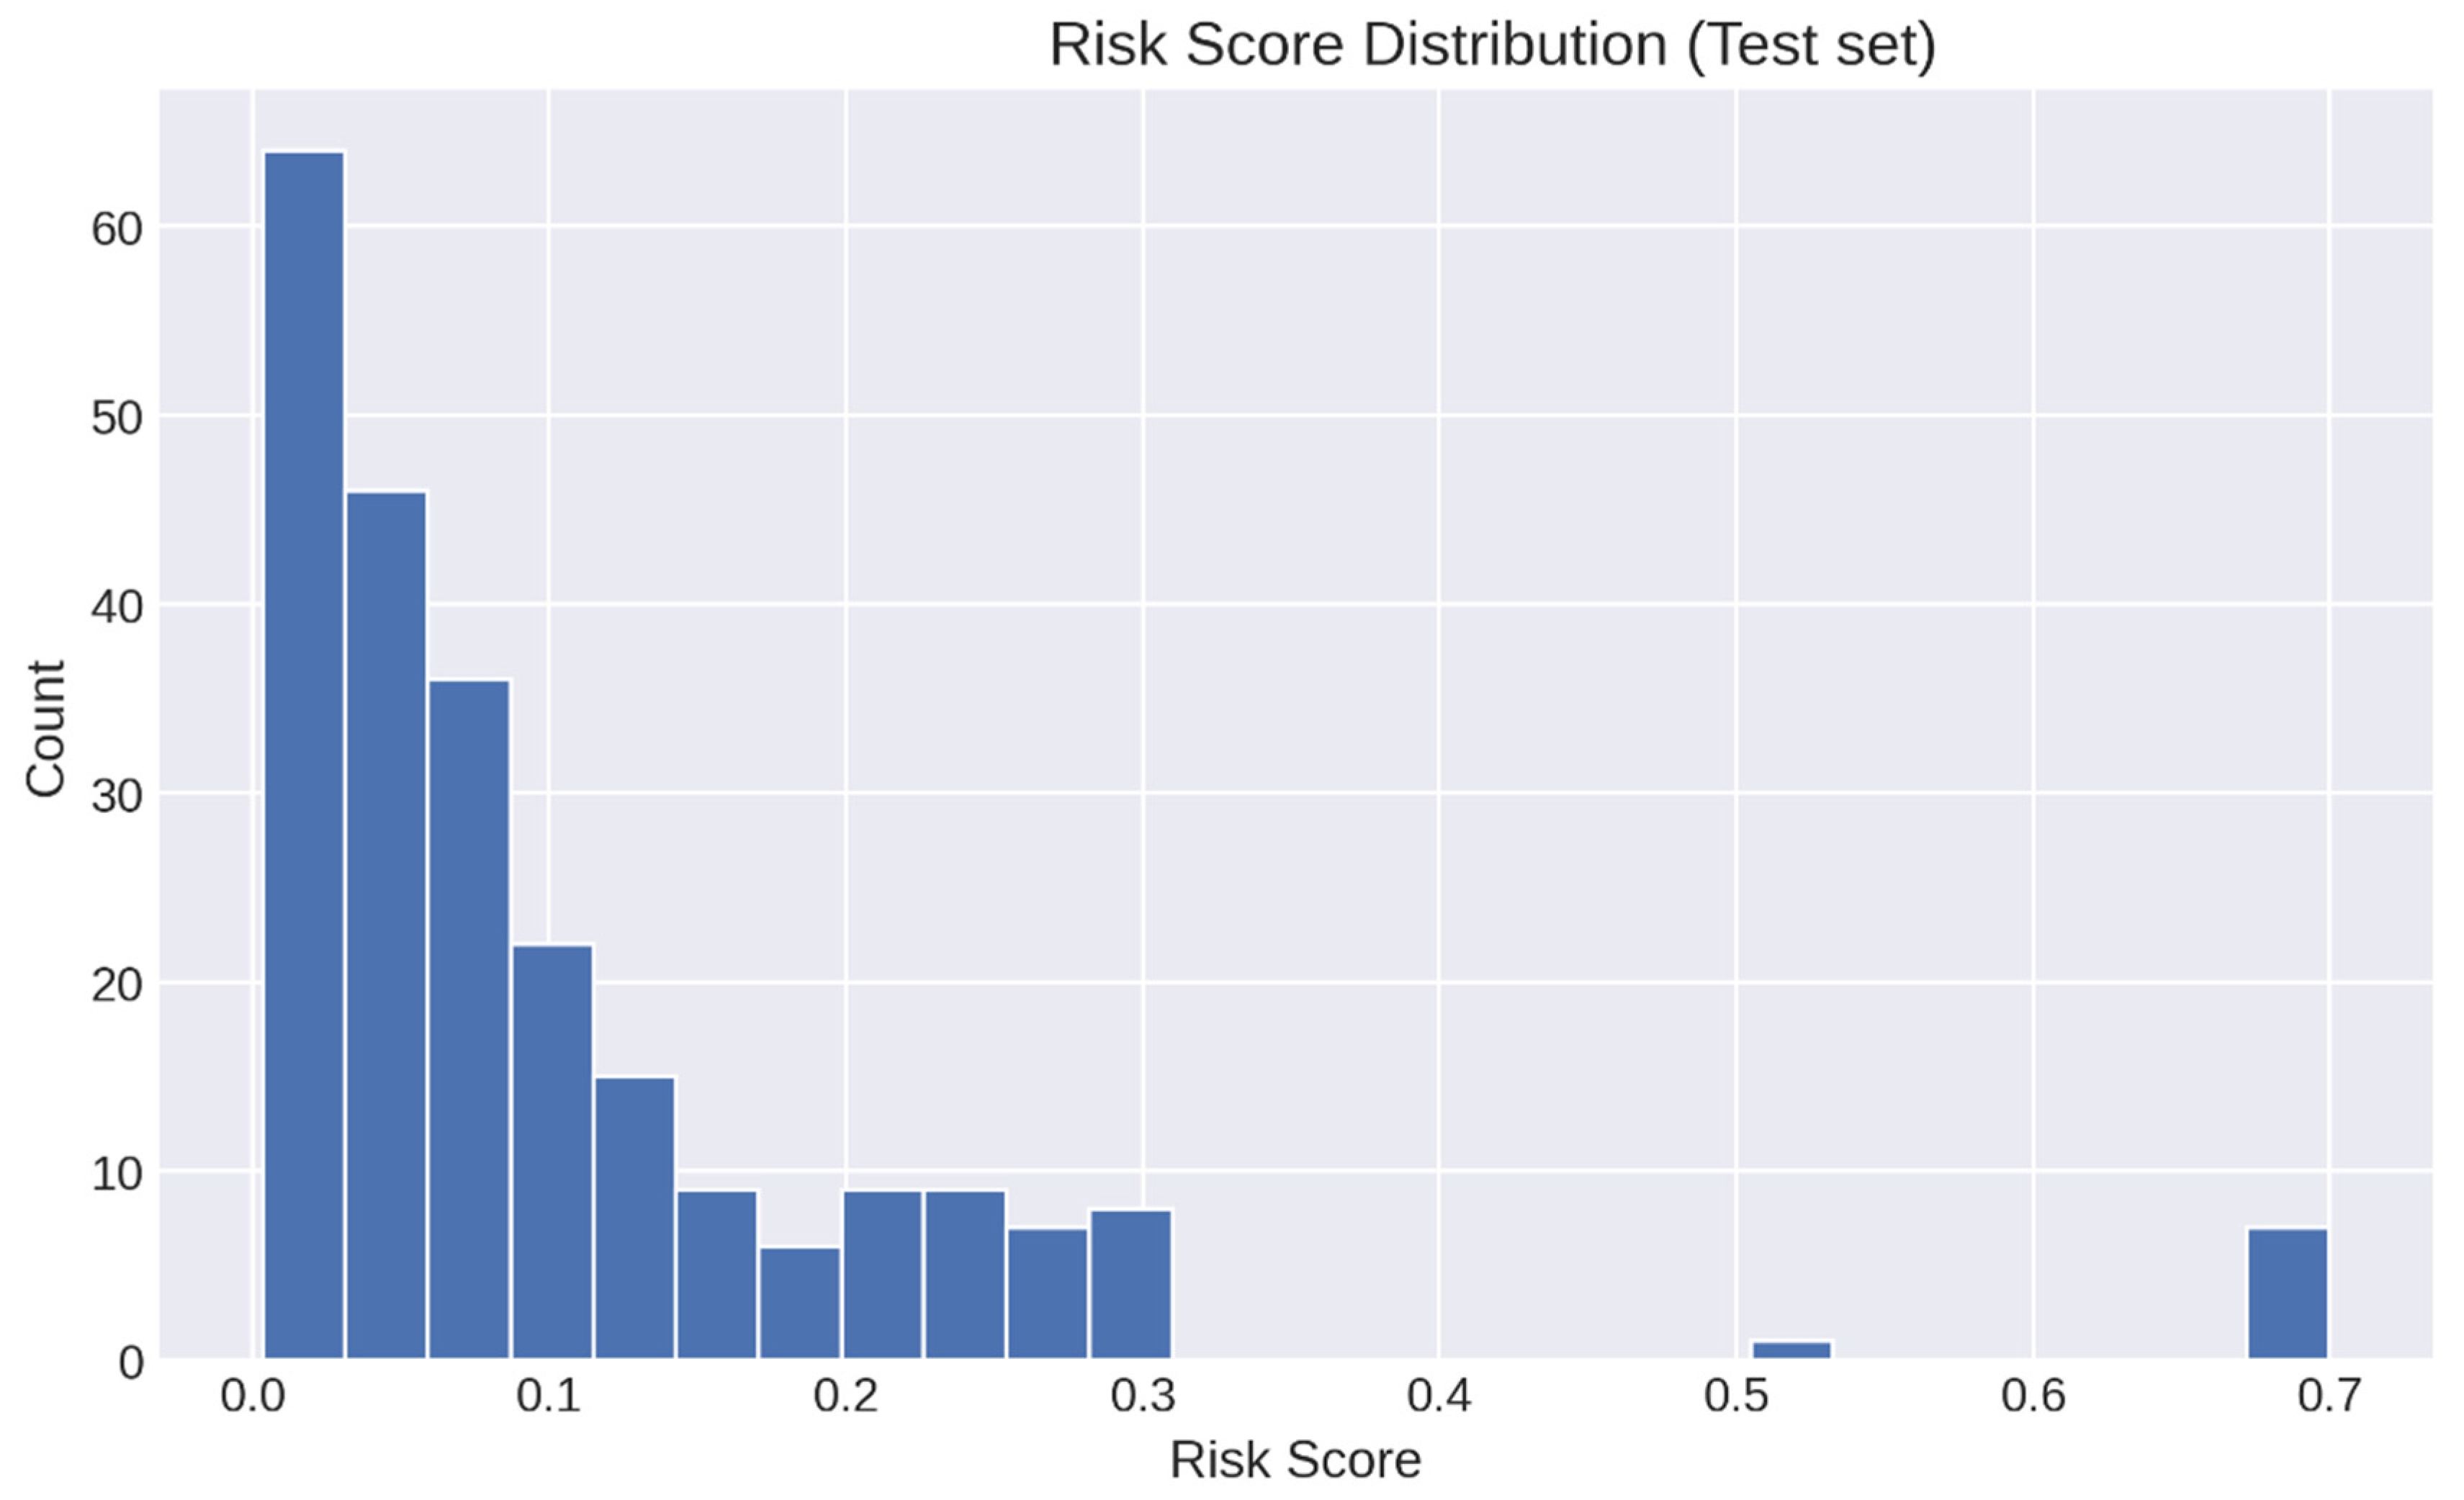
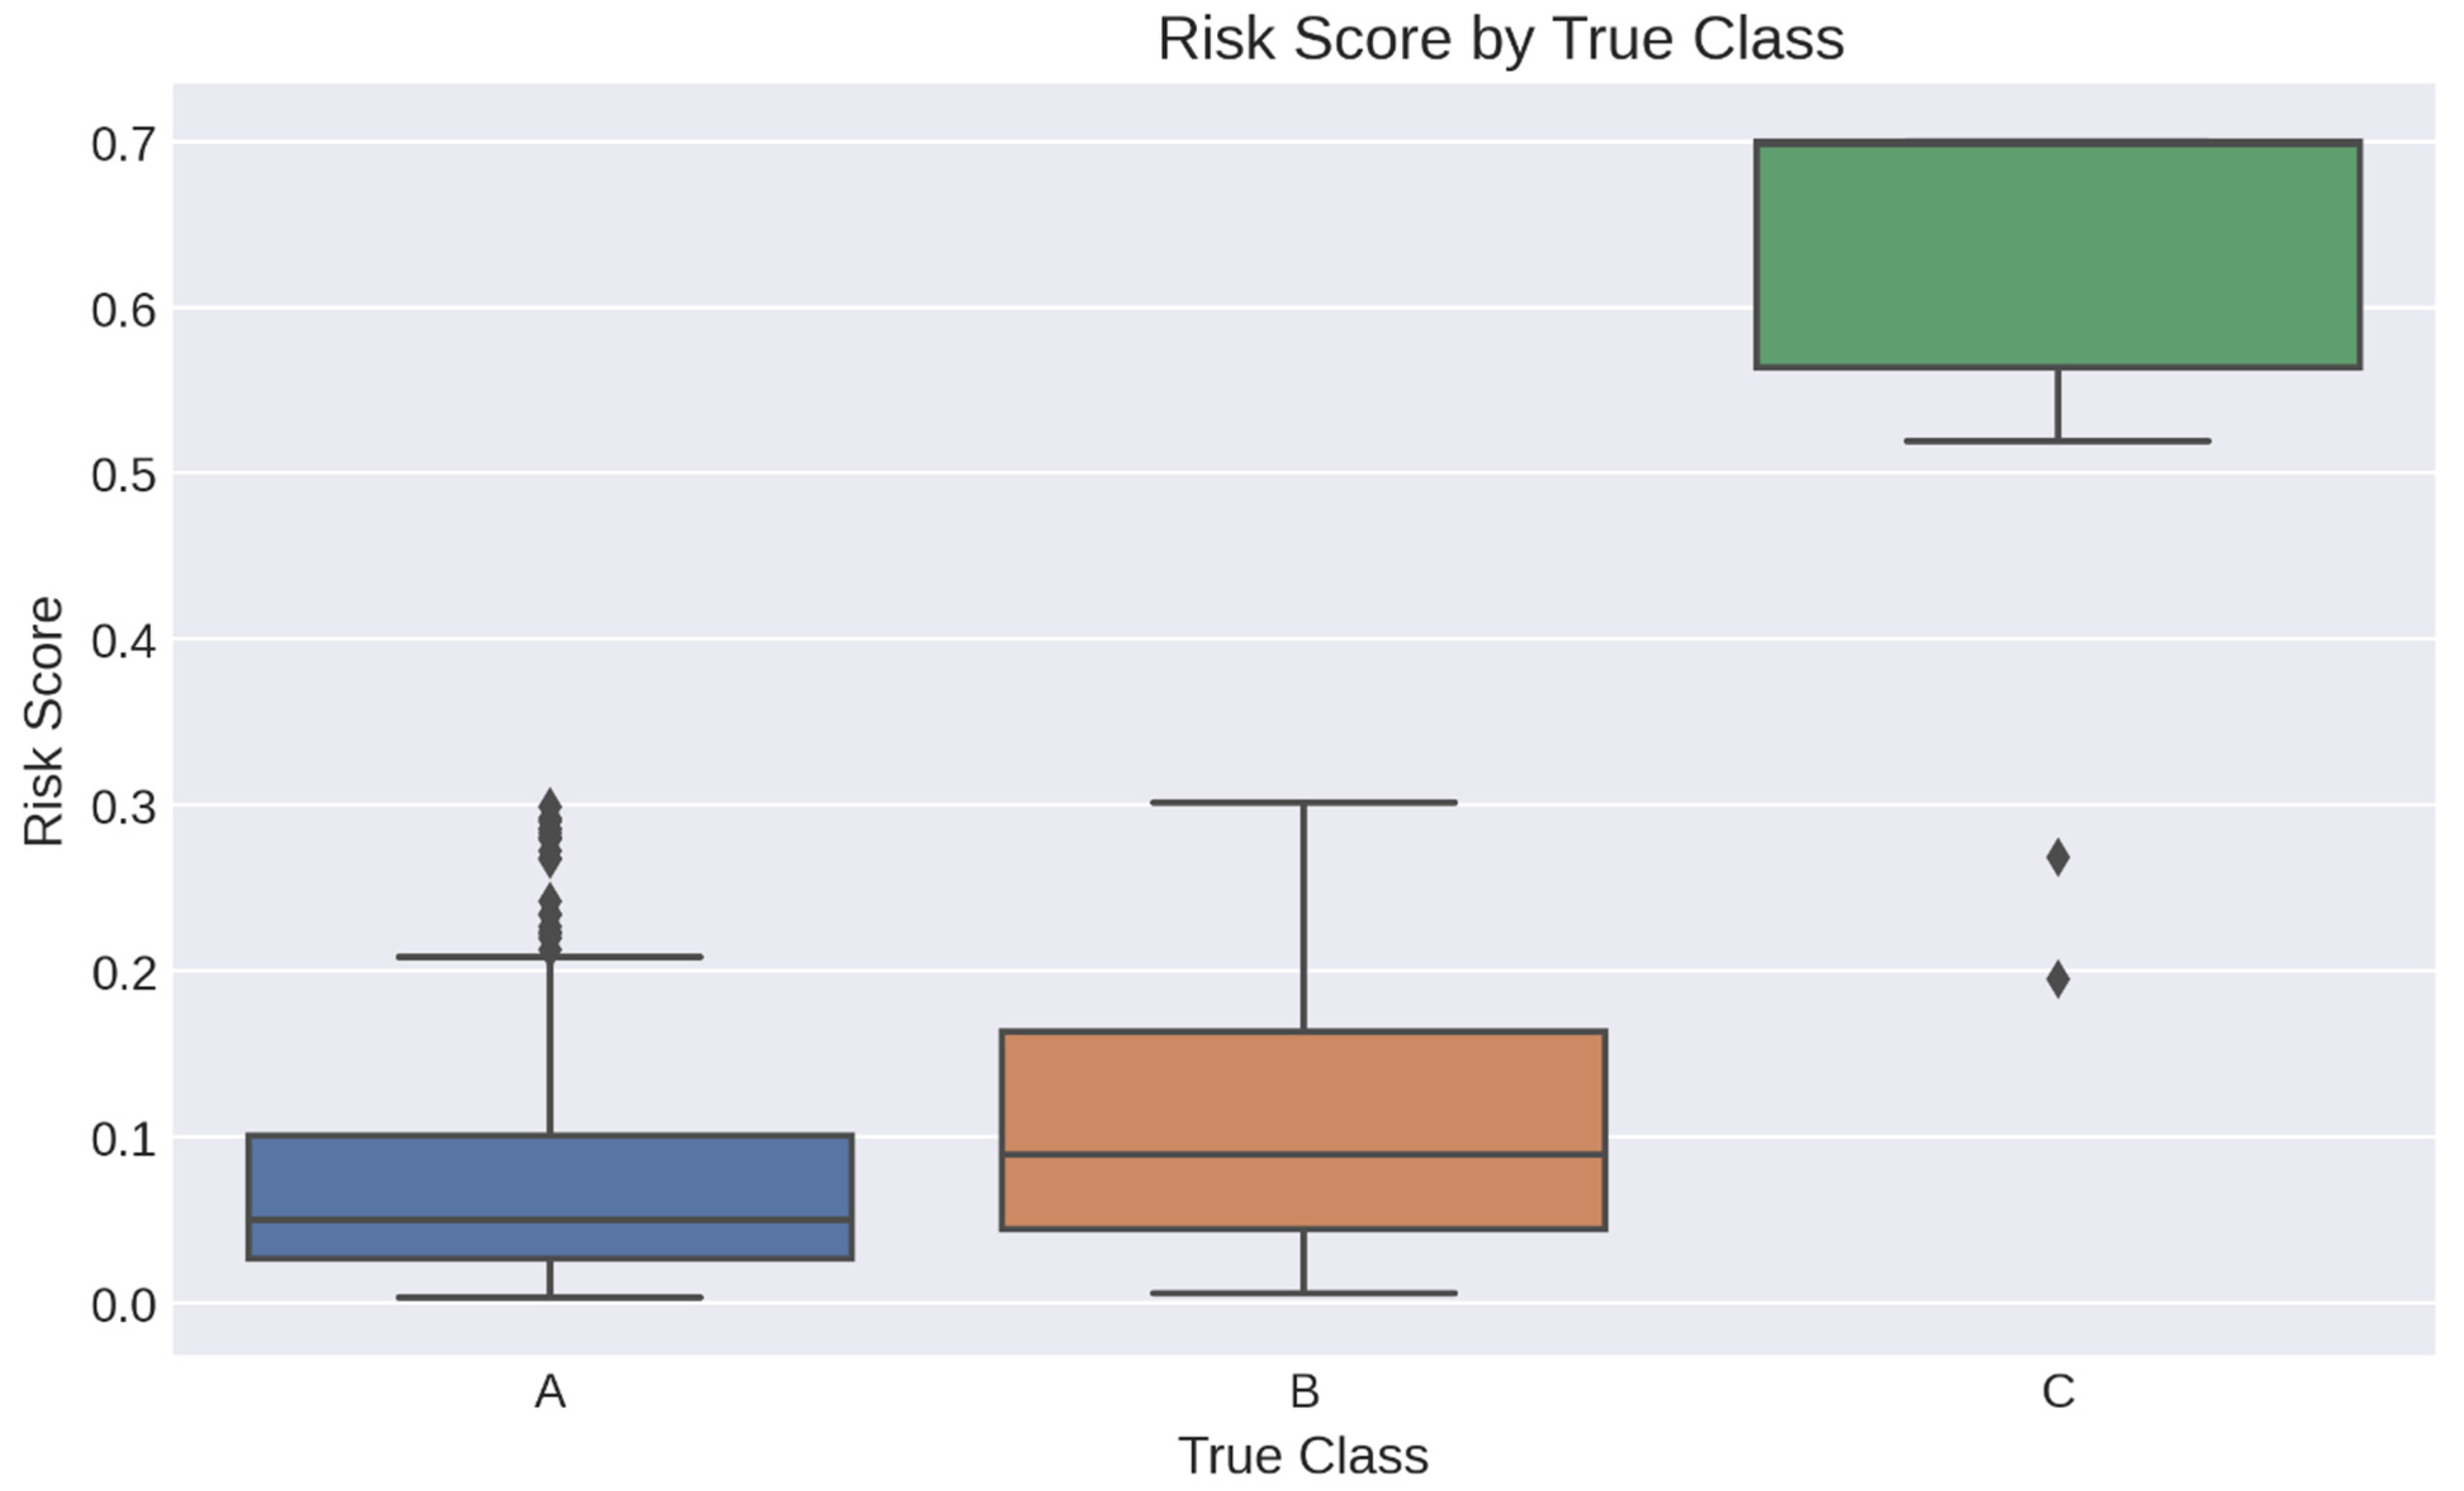
The distribution of academic risk evaluations for students in the test set as calculated using the suggested ECO–SVC framework is shown in
Figure 13. With most students concentrated on low risk-score values, the histogram displays a heavily right-skewed distribution, suggesting that most students’ academic performance is steady. Moderate risk scores are displayed by a decreasing percentage of students, and high-risk instances are represented by a clear minority at the upper tail of the distribution. This division shows that even when there is a class imbalance, the model can successfully distinguish among low-, medium-, and high-risk students. The framework’s applicability for early-warning applications is supported by the observed risk-score dispersion, which allows for targeted action for a small sample of vulnerable pupils without overestimating risk for the larger population. The distribution of estimated academic risk scores among the test set’s real performance classes (A, B, and C) is shown in
Figure 14. The findings show a distinct and progressive division among the classes, with Class A pupils demonstrating continuously low risk ratings with little fluctuation, signifying steady academic position. Students in Class B exhibit risk scores that are somewhat higher and more distributed, which reflects their varied learning paths and mediocre academic performance. Students in Class C exhibit higher risk scores compared to other classes; however, this observation should be interpreted cautiously due to the limited number of samples representing this class. This stratified risk distribution supports the usage of the suggested ECO–SVC framework as a trustworthy early-warning mechanism by confirming that it successfully aligns risk estimation with actual academic achievement.
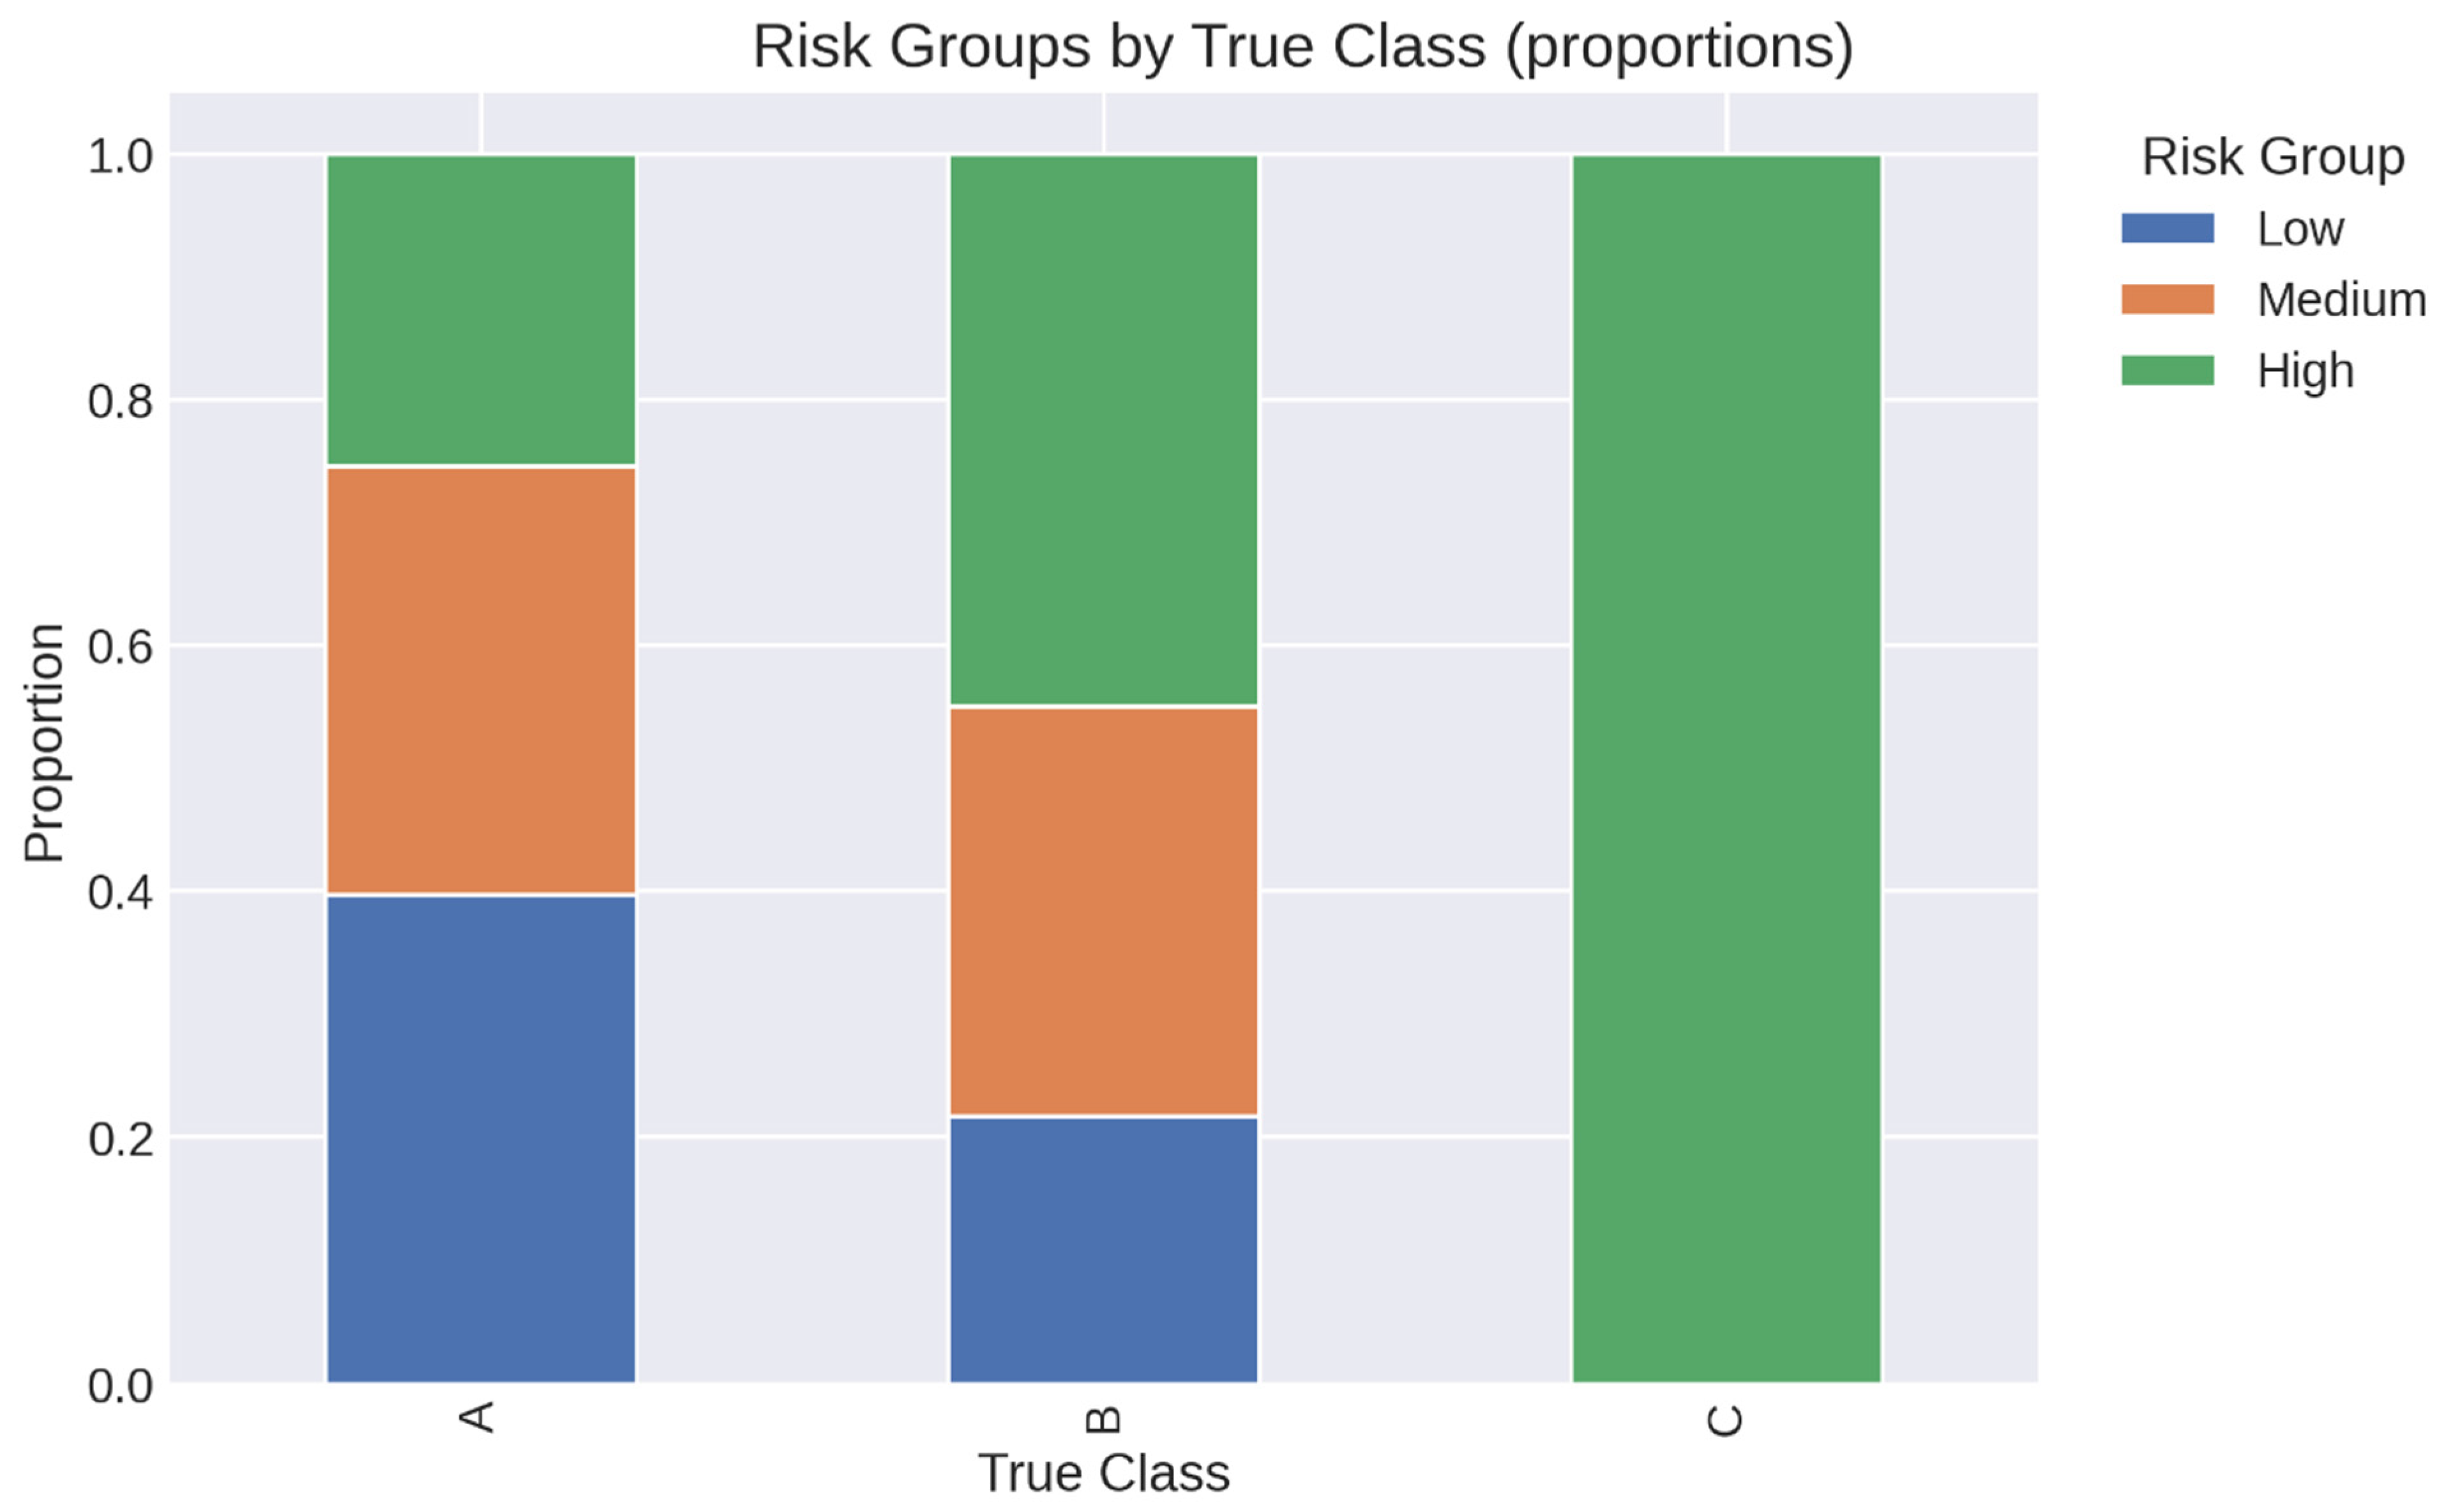
The percentage of students placed in low-, medium-, and high-risk groups throughout the actual academic performance categories is shown in
Figure 15. The findings show that risk classification and actual student outcomes are clearly aligned. A comparatively small percentage of Class A students are categorized as high risk, suggesting sustained academic achievement, whereas the bulk are clustered in the low- and medium-risk groups. Students in Class B have a more evenly distributed distribution across risk levels, indicating academic trajectories that are either transitional or borderline. Class C pupils, on the other hand, are nearly exclusively placed in the high-risk category, demonstrating the model’s potential capability to separate the most susceptible students. The efficiency of the suggested early-risk profiling mechanism in converting prediction confidence into useful intervention-oriented categories is highlighted by this proportional separation.
The results show that the proposed method does not just work because of the classifier; it is mostly because of the quality of the feature subset that ECO found. The baseline classifiers not performing as well shows how hard it is to learn from the original high-dimensional feature space. ECO–SVC, on the other hand, benefits from both dimensionality reduction and better feature relevance, which leads to better generalization and classification performance.
4.5. Limitations and Future Generalizability
Despite the promising results, it is important to acknowledge that the current study is conducted on a single dataset, which may introduce dataset-specific bias. Although the dataset is widely used and representative of student performance prediction tasks, evaluating the proposed framework on multiple datasets would provide a more comprehensive assessment of its generalization capability. Nevertheless, the ECO framework is inherently classifier independent and operates at the feature selection level, making it applicable across different datasets and domains. Therefore, the observed improvements are attributed to enhanced feature representation rather than dataset-specific characteristics. Another limitation of this study is that the features chosen are only useful in certain situations. ECO finds the most useful features for a given dataset, but some of these features, like the year of passing the HSC exam and the level of English language proficiency, only apply to the educational system from which the data were taken. Consequently, the specific subset of chosen features may not directly apply to various educational institutions or geographical areas. Nevertheless, the ECO framework itself is inherently domain independent and operates as an adaptive feature selection mechanism. Therefore, when applied to new datasets, ECO can identify alternative context-specific features that are most relevant to the target educational environment. In real-world situations, organizations that use the suggested framework would need to retrain the model with their own data to make sure it captures indicators that are important in their area and makes accurate predictions. This adaptability represents a key strength of the proposed approach, as it allows the model to remain flexible across diverse educational systems rather than relying on a fixed set of predefined features.
5. Conclusions
This research introduced a transparent and risk-aware framework for predicting student performance, which combines the ECO with an SVC in a collaborative educational analytics environment. The suggested method works well to estimate how well students will do by combining strong preprocessing, metaheuristic FS, and supervised classification. It also cuts down on the number of features. The ECO–SVC model has an overall accuracy of 87.03%, which is better than other standard methods. This shows that ECO is good at finding the most useful demographic, behavioral, and academic characteristics. This work goes beyond only predicted performance by using XAI to make models clearer. The model’s predictions are changed from black box outcomes to understandable insights that show how factors like past academic success, involvement in learning, and support from an organization affect student results. This is achieved using local surrogate explanations and permutation-based feature importance. Using a semiotic-linguistic approach, these explainable outcomes are put in a broader framework. This lets us make sense of educational qualities as temporal, symbolic, and indexical indications that show how students learn and who they are. The suggested framework also includes an early academic risk profile system that goes beyond only predicting performance to include proactive educational intervention.
Using feature contribution scores and SVC decision confidence, students are sorted into low-, medium-, and high-risk categories. This makes it possible to find at-risk students immediately, before their performance drops too low. This risk-aware feature turns the ECO–SVC model from a tool for looking back at past events into a useful decision-support system for academic advisers and schools. In general, this research shows that precise predictions of student achievement can be improved by adding early-warning analytics and interpretability without affecting the efficiency of classification. The suggested ECO–SVC framework that is explainable and aware of risk adds to research in educational linguistics, learning analytics, and AI. It also provides a scalable base for smart, clear, and intervention-oriented academic support systems. Notably the ECO framework does not depend on classifiers and can be used with other machine learning models as well. The integration with SVC in this study strongly proves that ECO-selected features work, rather than limiting the proposed method to just one classifier.
Future research will investigate the utilization of the framework on larger and more heterogeneous datasets, longitudinal risk modeling, and enhanced implementation of explainable methodologies to promote individualized and equitable education. Subsequent research will examine the incorporation of ECO with supplementary classifiers, including random forest, gradient boosting, and neural networks, to further investigate its generalization potential across various learning paradigms.