Article

A System-Level Planning Framework for Rooftop Photovoltaic-Based Vehicle Fleet Electrification Under Seasonal and Spatial Constraints


by
Or Yatzkan
1,
Orit Rotem-Mindali
1,*,
Reuven Cohen
2,
Eyal Yaniv
3 and
David Burg
4,5
1
Department of Environment, Planning and Sustainability, Bar Ilan University, Ramat-Gan 5290002, Israel
2
Department of Mathematics, Bar Ilan University, Ramat-Gan 5290002, Israel
3
Graduate School of Business Administration, Bar Ilan University, Ramat-Gan 5290002, Israel
4
Department of Mathematics, Tel-Hai Academic College, Upper Galilee 1220800, Israel
5
Program for the Human Environment, Rockefeller University, New York, NY 10065, USA
*
Author to whom correspondence should be addressed.
Inventions 2026, 11(3), 48; https://doi.org/10.3390/inventions11030048
Submission received: 22 April 2026 / Revised: 10 May 2026 / Accepted: 12 May 2026 / Published: 18 May 2026

Abstract

As global efforts to decarbonize the transportation sector intensify, integrating renewable energy sources into electric vehicle (EV) infrastructure has become a critical challenge, particularly under strong temporal mismatches between generation and demand. This study evaluates the potential of urban rooftop photovoltaic (PV) systems in Israel to support full electrification of the private vehicle fleet using a planning-oriented modeling framework that links energy supply, transport demand, and seasonal variability. Current annual fleet demand is estimated at 14 TWh, based on both internal combustion vehicle replacement and EV-specific consumption. A three-stage modeling framework is applied. First, national vehicle data are used to estimate total electricity demand. Second, rooftop PV generation potential is calculated using a monthly irradiance model, rooftop availability data, and system-level efficiency factors. Under these assumptions, residential rooftop PV could generate up to 81 TWh per year, corresponding to approximately 44 km2 of usable rooftop area. Third, temporal matching between supply and demand is evaluated, with explicit focus on intra-annual variability rather than only annual energy balance. Winter irradiance declines to approximately 45% of summer levels, while maintaining continuous charging requires approximately 38 GWh of energy storage. These results show that system feasibility is constrained by winter minimum generation rather than annual energy balance. The findings highlight that large-scale rooftop PV-based electrification is primarily limited by a temporal mismatch between generation and demand. This shifts the evaluation of PV-EV integration from a static annual energy perspective to a temporal system-design problem. This underscores the importance of integrating storage, grid flexibility, and system-level planning when evaluating the role of distributed PV in supporting electrified transport.

1. Introduction

The transportation sector is a major source of greenhouse gas emissions, largely driven by the dominance of internal combustion (IC) engine vehicles in private mobility [1,2]. Electrification of the vehicle fleet offers a key pathway to emission reduction, but its effectiveness depends on the use of low-carbon electricity sources [3,4]. This creates a system-level challenge of supplying large-scale EV demand with reliable renewable energy in urban environments [5]. Photovoltaic (PV) systems offer a promising zero-carbon source for vehicle electrification [6,7]. However, PV generation varies significantly over time due to diurnal and seasonal changes in solar irradiance, daylight hours, and weather conditions [8,9]. These variations create major challenges for uninterrupted year-round fleet electrification, especially in winter when generation drops sharply while nighttime charging demand peaks. Meeting such demand reliably, therefore, requires substantial energy storage and grid infrastructure upgrades beyond simple annual energy balances [10]. Rooftop PV systems can help address this challenge by utilizing existing urban infrastructure [11,12,13]. Yet, real-world deployment is limited by available roof space, seasonal variability, and the need for large-scale storage [14,15]. In practice, deployment is further constrained by rooftop suitability conditions, including shading effects, roof orientation, structural limitations, and competing rooftop uses, as well as by economic and behavioral factors such as installation costs, payback periods, and household willingness to adopt distributed PV systems [16,17]. Large-scale battery storage solutions are also essential to ensure a stable energy supply, particularly during extended periods of minimal sunlight [18]. While numerous international studies have examined rooftop PV integration for EV charging, most focus on generation potential or localized demand matching without fully coupling these analyses to national-scale vehicle electrification [19,20]. In particular, few studies jointly consider seasonal variability, cumulative storage requirements, and rooftop constraints within a single system-level framework [21,22]. Existing studies also tend to evaluate annual energy sufficiency without explicitly identifying the critical reliability conditions under which supply becomes constrained. As a result, the ability of urban rooftops to theoretically supply fleet-wide electricity demand remains insufficiently quantified. Table 1 provides a comparative overview of key metrics from previous studies, highlighting differences in geographic scope, seasonal consideration, storage assumptions, rooftop constraints, and relevance to national-scale EV fleet electrification.
Against this broader background, Israel offers a particularly informative case for examining the coupling between urban rooftop PV potential and large-scale vehicle electrification. The country combines high solar irradiance with dense urban development, limited land availability, and strong reliance on private vehicles [26]. At the same time, Israel exhibits pronounced seasonal contrasts in solar production and marked spatial disparities between dense metropolitan cores and peripheral cities [27]. This combination creates a stringent test case for evaluating whether rooftop PV systems can support large-scale vehicle electrification under real spatial and temporal constraints. The analysis presented here addresses these gaps by developing an integrated planning framework that combines fleet electricity demand, rooftop PV generation potential, seasonal supply-demand mismatch, and storage requirements within a unified assessment structure. The framework is intended not only for the Israeli case, but also as a transferable decision-support approach for other urban regions with high solar potential and growing electrified transport demand.
In this framework, we model the feasibility of electrifying the current vehicle fleet using PV systems installed on urban rooftops. It seeks to answer several research questions. Can the existing vehicle fleet be powered entirely by electricity generated from urban rooftop PV systems? Since this question concerns full annual coverage, the evaluation must consider both high-solar summer periods and low-irradiance winter conditions, where output drops sharply. What are the seasonal limitations affecting solar power generation? What storage capacity is required to ensure vehicle electrification during periods of minimal solar output? And how scalable is this solution if the size of the vehicle fleet were to double? By addressing these, the research aims to enhance the broader understanding of PV electricity generation and its potential role in vehicle electrification, with a particular focus on urban environments. The present work makes five main contributions. First, it introduces an integrated national-scale modeling framework that jointly assesses urban rooftop PV generation and the electricity demand of a fully electrified private vehicle fleet. Second, it explicitly incorporates seasonal variability in solar production, identifying winter conditions as the binding constraint for system feasibility rather than annual averages. Third, it quantifies the energy storage capacity required to support nighttime and low-irradiance charging at the fleet level. Fourth, it evaluates the scalability of rooftop PV-based electrification under a future scenario of fleet growth. Fifth, it translates these outputs into a practical planning framework that can support infrastructure prioritization, storage sizing, and regional energy coordination. Together, these contributions provide a spatially and temporally explicit assessment of the limits and potential of PV-powered vehicle electrification in dense, land-constrained urban environments. More broadly, this study contributes to the transition toward integrated urban energy systems that couple renewable generation with electrified transport.

2. Materials and Methods

2.1. Overview of Research Approach

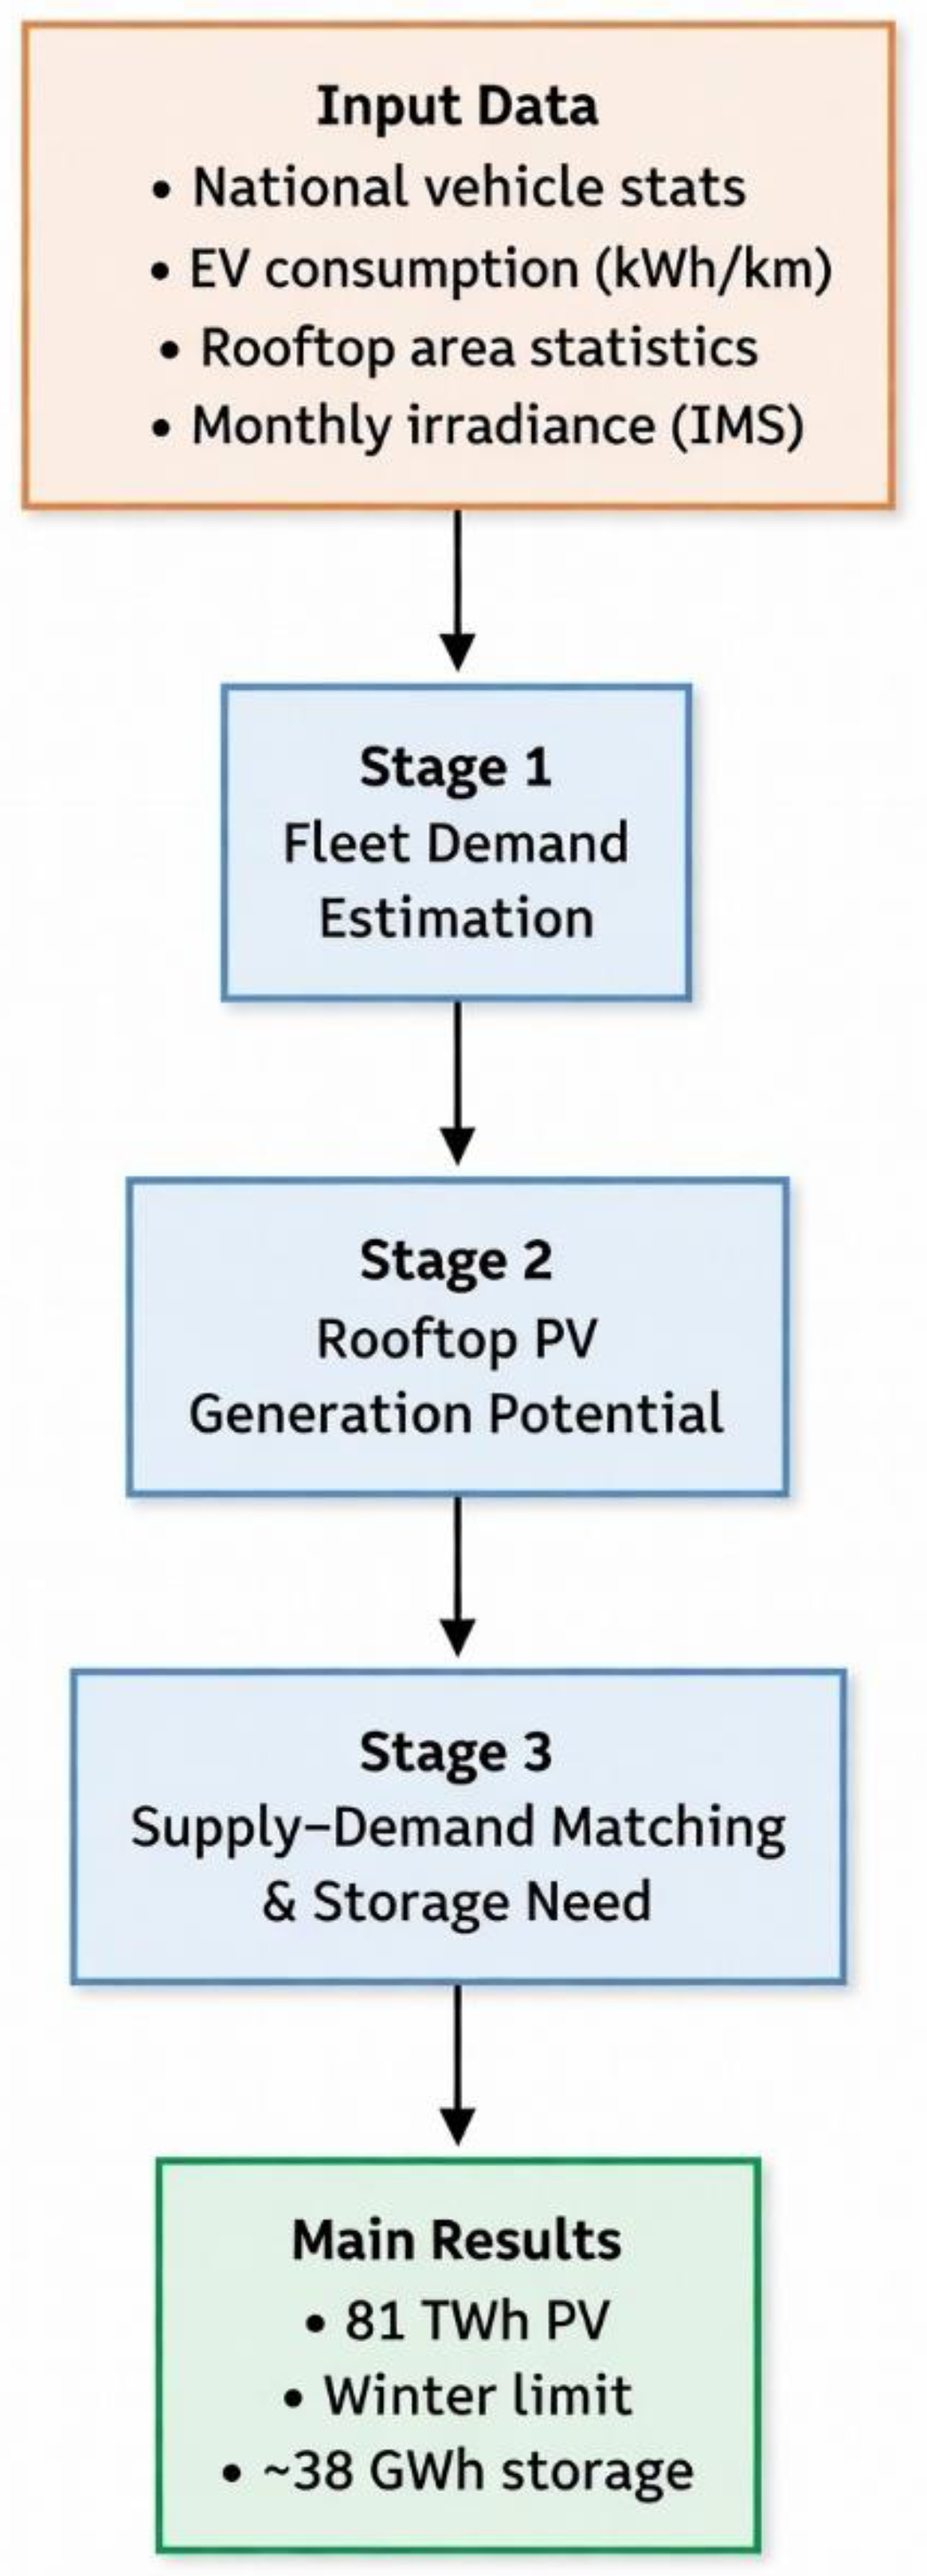
The analysis employs a modeling-based approach to assess the feasibility of using rooftop photovoltaic (PV) systems to support the electrification of Israel’s private vehicle fleet. The research process involves three main stages: (1) estimating the electricity demand of a fully electrified vehicle fleet, (2) calculating the electricity generation potential from urban rooftop PV installations, and (3) analyzing the seasonal and spatial matching between generation and demand, while accounting for storage requirements and system losses. The three stages are integrated into a deterministic spatial–temporal energy balance framework that explicitly couples demand, supply, and storage constraints under monthly resolution. The overall structure of the modeling framework and the interactions between its main components are illustrated in Figure 1. All reported daily values represent statistical averages derived from annual totals and are not intended to represent specific operational days. The full calculation framework, including intermediate outputs and supporting datasets, is provided in the Supplementary Materials (File S1).

2.2. Case Study Context

The framework adopts Israel as a national-scale case study for urban PV-based vehicle electrification. The selection is motivated by a combination of climatic, demographic, and infrastructural characteristics that are highly relevant to the research objectives. Geographically, Israel is located in the south-eastern Mediterranean basin, with a moderate climate and 1600–1800 effective sunshine hours annually, and relatively low cloud cover for most of the year [28]. Demographically, the country exhibits high population density and elevated private vehicle ownership rates, particularly in major urban centers such as Tel Aviv (9500 people·km−2) [29], which may pose challenges of meeting transport electrification demand from limited rooftop areas. At the same time, peripheral municipalities possess greater rooftop availability per capita, creating opportunities for surplus PV generation. Atmospheric conditions such as haze and air pollution attenuate solar energy, especially in the central and Haifa regions [30]. This unique combination of high insolation, spatial variability in rooftop availability, and diverse urban–peripheral characteristics makes Israel a representative and analytically valuable setting for assessing the feasibility of large-scale rooftop PV integration into transport electrification strategies.

2.3. Energy Demand Estimation for a Fully Electrified Fleet

To estimate the electricity required to electrify Israel’s private vehicle fleet, we applied two complementary calculation methods. The use of two independent formulations provides internal model validation and reduces dependence on a single estimation pathway. All variables are summarized in Table A1. Similar two-method demand estimation frameworks have been used in national EV electrification studies [3,31,32], supporting the robustness of the comparative approach used here.
Method 1: Estimating transportation energy demand based on existing internal-combustion energy consumption.
The majority of mechanical energy is currently delivered by the IC fleet. This depends on vehicle kilometrage, fuel economy, gasoline energy content, and IC engine efficiency. The total annual useful energy is given by:
EIC = ncars · dannual · ηfuel · efuel · ηIC
where ncars is the number of private vehicles, dannual is average annual kilometrage (km·car−1·yr−1), ηfuel is the fuel economy (km·L−1), efuel is the energy content value of fuel (kWh·L−1), and ηIC is the IC engine efficiency (0.32). In 2025, there were 3.56 million private cars, and the average kilometrage is 17,000 km·car−1·yr−1 [33,34]. We accept a value of fuel efficiency to be 12 km·L−1 [31]. The energy content of 95 octane gasoline, the most used in Israel, is 8.9 kWh·L−1 [35] while only 30% of this is available to move the vehicle due to IC inefficiencies and mechanical losses [36]. These values define the physical conversion chain from fuel energy input to mechanical output. Substituting these values into Equation (1): EIC ≈ 14 × 109 kWh·yr−1, which is equivalent to: EIC ≈ 14 TWh·yr−1.
This value represents the estimated useful mechanical energy demand of the current private vehicle fleet and serves as the upper-bound benchmark for electrification demand.
Method 2: Direct estimation using EV energy consumption per kilometer.
We now calculate the electricity needed for an entire comparable fleet based on EVs. The annual fleet electricity demand would be:
EEV = ncars · dannual · eEV · ηEV
where eEV and ηEV are the electricity needed to drive an EV and the EV efficiency, respectively. The average EV requires 190 Wh·km−1 [37,38] and its efficiency for converting electrical power into kinetic energy is on the order of 95% [39]. Substituting values into Equation (2): EEV ≈ 13 × 1012 Wh·yr−1, which is equivalent to: EEV ≈ 13 TWh·yr−1.
The two independent estimation approaches yield closely aligned results (13–14 TWh·yr−1), indicating internal consistency between top-down (fuel-based) and bottom-up (EV-based) demand estimation methods. For the remainder of the analysis, the higher estimate of E = 14 TWh·yr−1 is used as a conservative upper-bound demand scenario. This choice ensures that subsequent PV supply and storage calculations are not underestimated.

2.4. Estimation of Potential Solar PV Electricity Production

2.4.1. Solar Irradiance Model

The incident solar irradiance on a horizontal surface is approximated using a clear-sky reference flux of 1100 W·m−2 [40]. Maximum irradiance occurs when the panel is oriented perpendicular to incoming radiation under clear-sky midday conditions. The actual irradiance declines as a function of cos (θ), where θ is the solar zenith angle—the angle between the sun’s position and the vertical direction [41]. Solar elevation angles for Tel Aviv (32°4′40.687″ N, 34°47′15.702″ E) are computed for the 15th day of each month. Monthly values are used as representative seasonal states. These monthly mid-point values are used as representative seasonal states for the irradiance model. Table A2 summarizes the calculated solar geometry parameters. The use of Tel Aviv as a reference location is intended to represent a central and highly urbanized coastal region, serving as a national proxy for solar resource conditions in densely populated areas. Spatial heterogeneity in rooftop distribution and electricity demand is addressed separately in the spatial allocation framework. Atmospheric attenuation due to clouds, haze, and seasonal aerosol conditions is incorporated as a second-stage correction factor. Data on direct solar radiation for the years 2014 to 2024 were retrieved for the Bet Dagan meteorological station near Tel Aviv [42]. The data were concatenated and averaged for each month. Then the ratio between direct irradiance and the modeled theoretical available solar power is calculated. This monthly ratio is used as an atmospheric transmission factor applied to the clear-sky irradiance model.
Irradiance Model and Polynomial Fitting
The objective is to estimate the theoretical daily solar irradiance available to rooftop PV systems throughout the year. To estimate daily irradiance, the sun’s path throughout the day must be integrated. Exact solar geometry formulations contain multiple trigonometric terms and are computationally cumbersome for repeated monthly integration [43,44]. Simplified approximations have therefore been widely applied [45]. Because PV generation occurs only during daylight hours, the positive daily solar trajectory can be approximated using a polynomial function. To capture the seasonal variation in solar irradiance, monthly irradiance patterns were represented using a polynomial fitting approach. The sun’s elevation data was retrieved from the National Renewable Energy Laboratory (Golden, CO, USA) [46] and then fit as a smooth function of time. The parameters of this function were estimated using least-squares fitting. The fitted curve follows Equation (3):
f(x) = a0 − a1x + a2x2 − a3x3 + a4x4
This 4th-order polynomial was selected based on goodness-of-fit and model parsimony criteria (AIC). This method provides a continuous approximation of the daily irradiance curve and enables the computation of monthly irradiance proportions. Comparable polynomial approximations have been reported in previous solar resource studies [47,48]. The parameter values for all 12 months are listed in Table 2. The area under each curve is used to obtain the monthly irradiance scaling factors applied later in Section 3.2.

2.4.2. Solar PV Systems for Fleet Electrification

PV production is influenced not only by geometric irradiance but also by atmospheric conditions. Cloud cover and haze reduce the amount of solar energy reaching the panel surface. To quantify this effect, we calculate total monthly atmospheric absorption as the ratio of measured irradiance to theoretical clear-sky irradiance. The daily maximum irradiance was obtained from the Israel Meteorological Service (Bet Dagan, Israel). For each month, we estimate its mean (see Table 3) [42]. These are applied as multiplicative modifiers to the clear-sky irradiance value.
The monthly effective irradiance used for PV output calculations is then computed as:
GPV = gclear-sky,month · fatm,month · (1 − ηsystem)
where gclear-sky,month is the theoretical solar irradiance under clear-sky conditions for each month (calculated from the polynomial model in Section 2.4.1), and fatm,month is the monthly atmospheric absorption factor accounting for cloud cover and haze (from Table 3). System-level losses (including DC–AC conversion and wiring inefficiencies), denoted by ηsystem, are on the order of 0.21 [49,50]. The resulting monthly values define the seasonal PV production profile, which is aggregated to compute annual generation as presented in Section 3.2.
Seasonal Variation in PV Generation
Seasonal variability in PV generation is quantified by calculating the average daily electrical output per square meter for each month. The monthly incident energy GPV,month, summed from daily effective irradiance after applying the atmospheric absorption factors fatm,month from Table 3, is converted to electrical energy using:
GPV,daily,month = (GPV,month/1000)·(PVspectrum · PVefficiency)/Ndays,month
where PVspectrum = 0.85 represents the fraction of the solar spectrum effectively utilized by silicon PV cells [51], PVefficiency = 0.21 is the module efficiency [52], and Ndays,month is the number of days in the month. This formulation integrates solar geometry, daylight duration, and atmospheric attenuation, producing lower winter yields and higher summer yields. The monthly values are subsequently aggregated to estimate annual PV yield (Section 3.2) and to evaluate storage needs.

2.4.3. Rooftop Area Assessment

The estimation of available rooftop area for solar photovoltaic (PV) installations is a crucial factor in determining the feasibility of fleet electrification via solar energy [53]. Data from the Israel Central Bureau of Statistics (Jerusalem, Israel) for the year 2022 were used to assess the built-up area and total jurisdictional area for each municipality (Table A1 in Appendix A). Key variables included population size, the number of vehicles, the built-up area measured in square kilometers, and the percentage of built-up area relative to the total jurisdiction. To evaluate the rooftop area suitable for PV deployment, built-up areas were analyzed under the assumption that only a fraction of these surfaces can be utilized for solar installations. The rooftop utilization factor is set to 0.32, consistent with prior studies, representing a mid-range estimate within commonly reported values (0.2–0.4) [54]. Applying this factor to the residential built-up area results in an effective rooftop area of 226 km2, which is used as the available surface for PV deployment in the modeling framework.

2.5. Energy Storage Requirements

Storage solutions and infrastructure are required to ensure a stable energy supply for EV charging [55], given the intermittent variability in solar energy production. Storage requirements are presented in terms of energy capacity (GWh), as future battery technologies are likely to improve gravimetric energy density (Wh/kg), thereby reducing the mass and footprint required for a given storage capacity. The average nightly charging demand is approximately 38 GWh. This is based on an annual EV electricity demand of 14 TWh⋅yr−1 divided by 365 days (see Section 3.4 for further discussion, including storage for periods of limited solar generation). The analysis, therefore, focuses on the magnitude of energy that must be stored rather than on the mass or volume of specific battery technologies. Although this estimate relies on fixed coefficients for fleet energy demand and storage infrastructure, these values fall within the commonly reported ranges in the literature. A full sensitivity analysis is beyond the scope of this study, but the selected parameters provide a consistent baseline for estimating the order of magnitude of required storage capacity. While the present work uses a simplified, static estimate of nightly storage demand, previous work has developed dynamic battery models that capture charge and discharge behavior, vehicle availability, and temporal charging patterns [55,56]. These modeling approaches could be integrated into future research to refine storage sizing and operational planning. For the nightly storage requirement calculated here, the resulting energy capacity is further discussed in Section 3.4. This value provides a conservative upper-bound estimate suitable for system-level planning.

2.6. Matching Supply and Demand: Seasonality and Storage Impact

Daily values used in the present study represent annual average daily PV generation, obtained by dividing total yearly output by 365. These values correspond to statistical averages and do not represent specific days, due to strong seasonal and weather-related variability in PV production. A seasonal, spatial, and temporal matching analysis is conducted to evaluate the alignment between rooftop PV generation and electric vehicle (EV) electricity demand across different times of the year. Monthly and daily variations in both supply and demand are used to identify mismatch periods and assess their implications for system design and storage requirements [57]. Nighttime charging is assumed as a conservative baseline reflecting typical private vehicle availability patterns in urban environments and periods of peak grid stress. This assumption is used to represent a worst-case temporal mismatch between photovoltaic generation and electricity demand, rather than an optimized or behaviorally adaptive charging strategy. Smart-charging strategies and demand shifting mechanisms are beyond the scope of this study. This assumption provides a consistent baseline for evaluating system-level storage requirements under constrained temporal alignment.
The modeling framework provides a spatially and temporally explicit representation of rooftop PV potential. Monthly irradiance values, together with system performance assumptions, are used to estimate PV generation, while demand is derived from fleet-level electricity consumption. System operation is constrained by seasonal variability, with winter months representing the limiting condition due to reduced irradiance, shorter daylight duration, and lower PV output. Under these conditions, PV generation reaches its minimum, while demand remains relatively constant. To capture operational stress conditions, extended sequences of low-irradiance days are also considered. These periods represent conservative design scenarios for continuous energy supply and are used to inform storage sizing and system robustness requirements.
Storage and infrastructure requirements are therefore derived from minimum-generation conditions rather than annual averages. This enables identification of system constraints under binding conditions, rather than describing typical operational performance [58].

3. Results

3.1. Energy Demand for Vehicle Fleet Electrification

Using the two methods detailed in Section 2.3, total electricity demand for full electrification of Israel’s light-duty vehicle fleet is estimated at approximately 14 TWh per year. Both methods yield closely aligned values, indicating internal consistency between IC and EV-based approaches. This value is used as the reference annual demand baseline for all subsequent supply and storage calculations.

3.2. Seasonal Solar Irradiance and PV Output

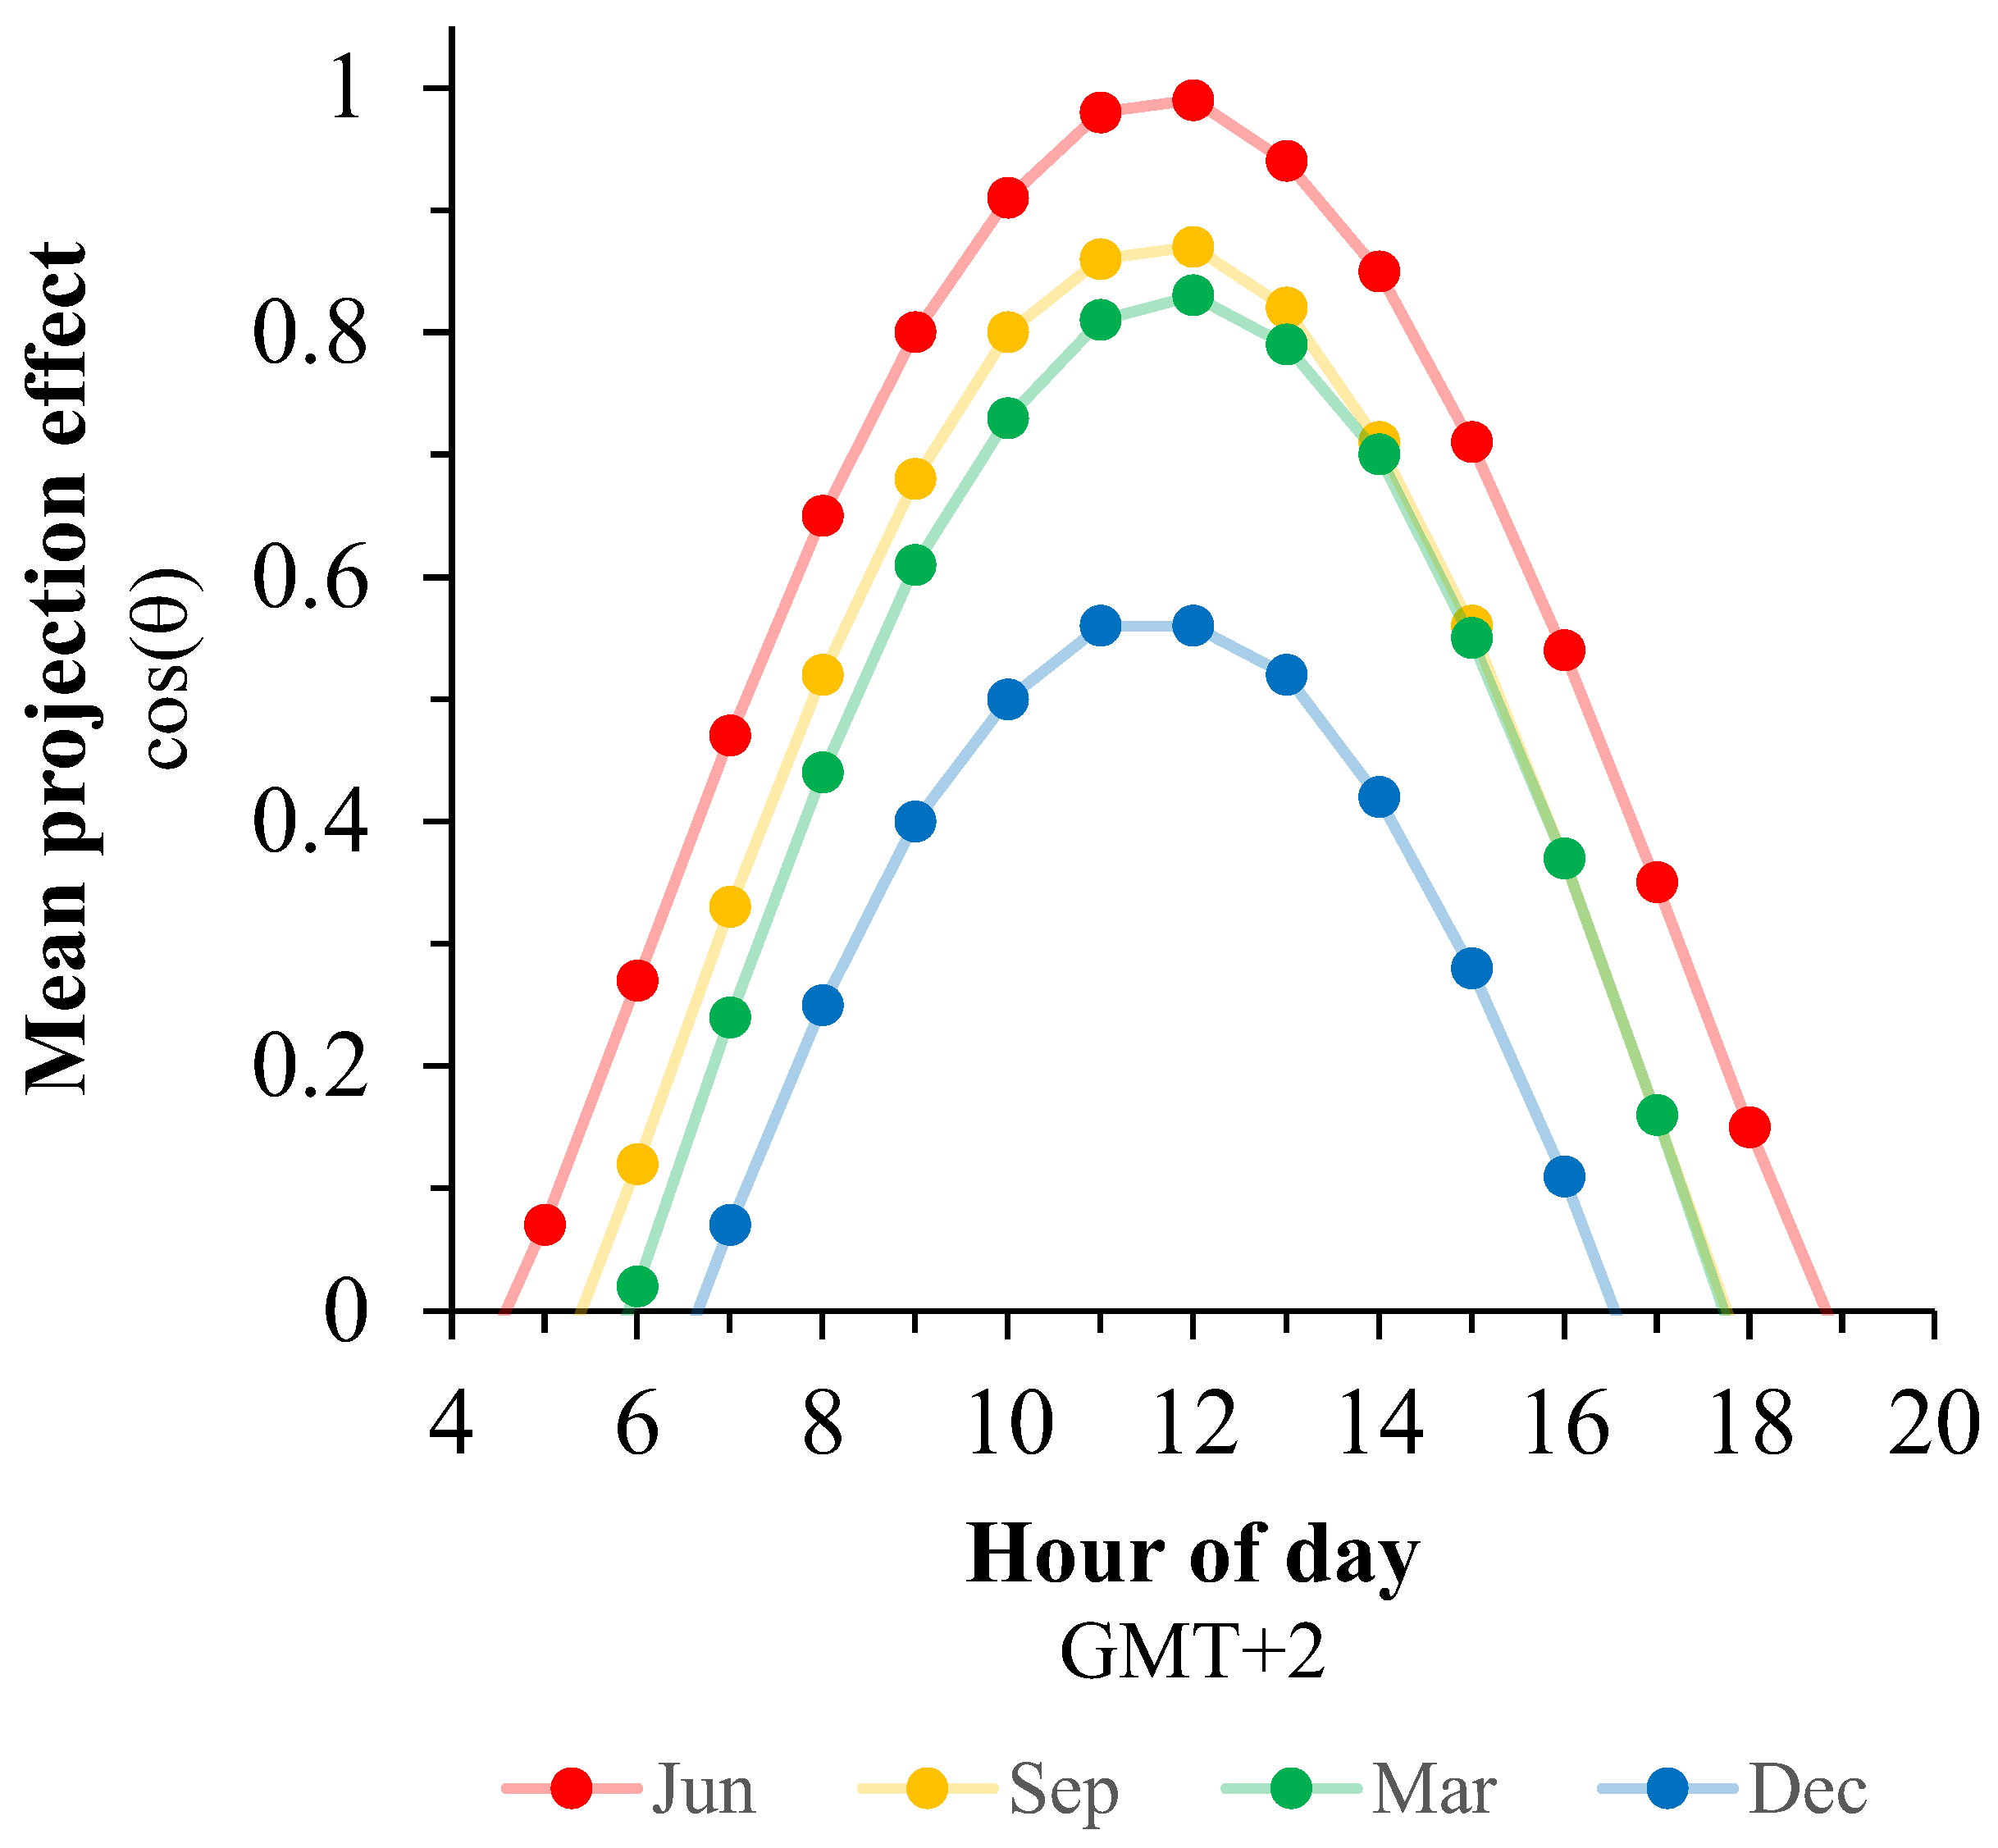
Monthly irradiance values exhibit a clear seasonal pattern. Peak values occur during June and July, while December values reach approximately 45 percent of the summer maximum. Figure 2 illustrates the solar elevation profiles for representative months, highlighting the seasonal variation in solar geometry. The area under each curve reflects the relative potential solar energy available to PV systems during each period. The modeled irradiance values were compared with clear-sky reference datasets (e.g., PVGIS), with an average deviation of approximately 2 percent. Larger deviations are observed during transitional seasons, likely due to differences in cloud cover representation across datasets [58,59,60].
Using the irradiance and atmospheric correction factors described in Section 2.4.2, the aggregated annual PV output equals 358 kWh⋅m−2⋅yr−1, on average. This value incorporates monthly variation and system-level losses and is used directly in the energy supply calculations in Section 3.3. These findings indicate that annual PV yield is high under Israeli climatic conditions, but strongly uneven across seasons.
Solar elevation data are accessed from NASA POWER [61]. The curves are polynomial fits, and the integral is a maximal estimate for solar power potential relative to the clear-sky irradiance. The seasonal variation in the projection effect is illustrated for the months June, September, March, and December. The curves are the polynomial fits for each of the representative months.

Monthly PV Electricity Generation

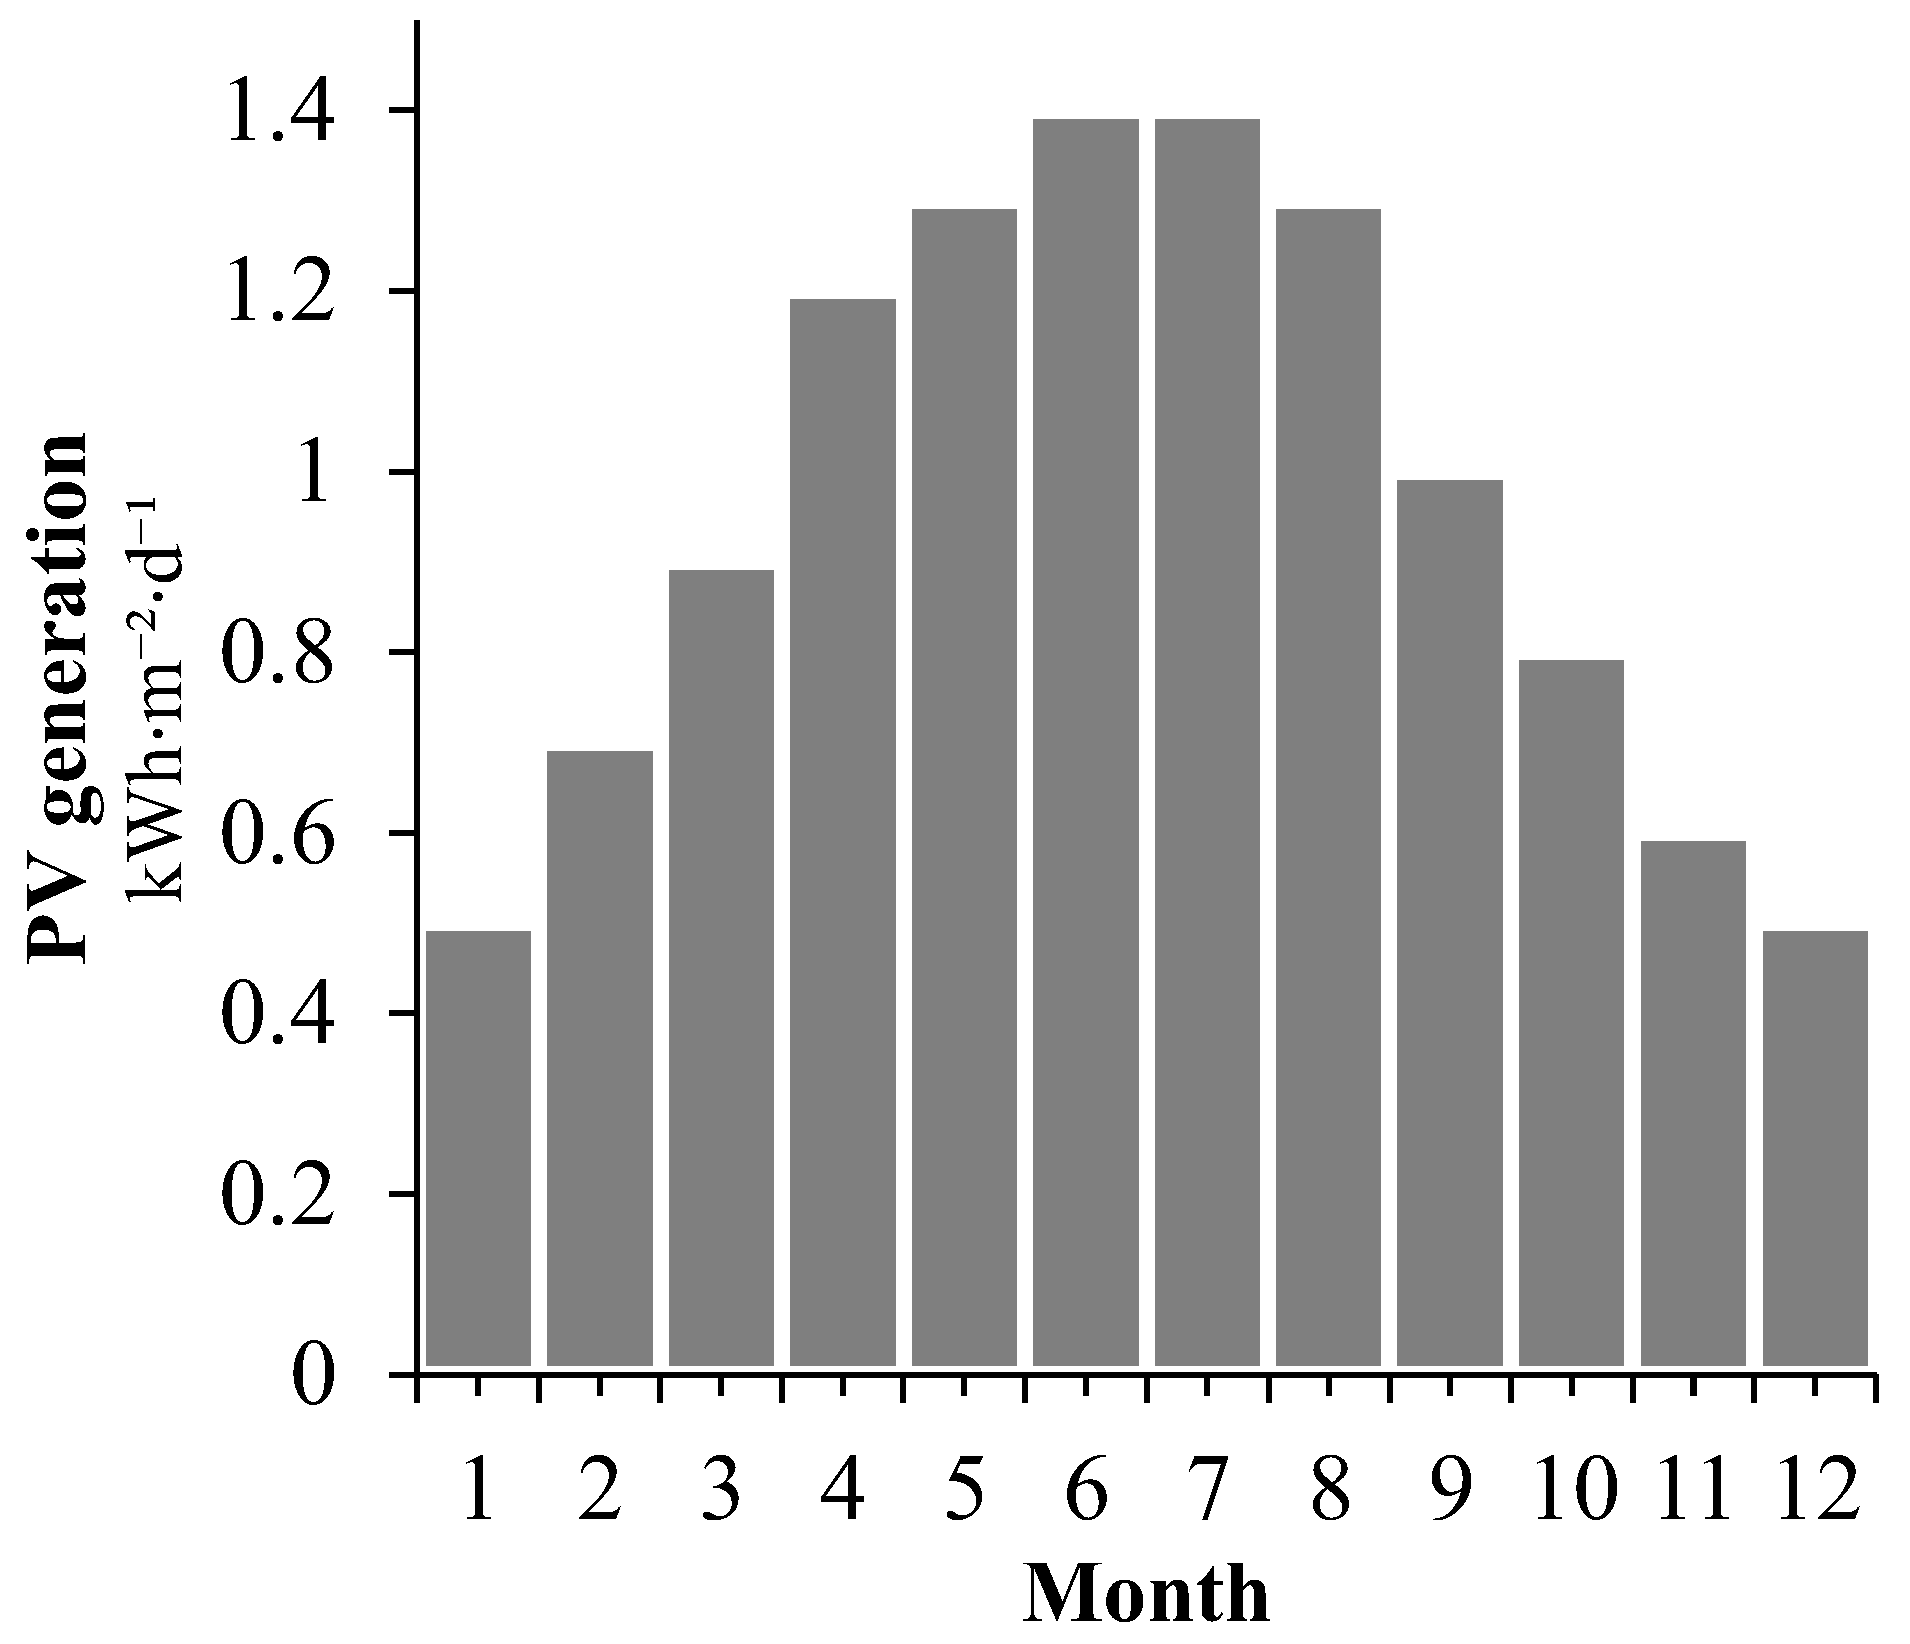
Applying the methodology described in Section Seasonal Variation in PV Generation, the average daily electrical output per square meter of PV panel is calculated for each month. The results show a consistent seasonal pattern, with higher production during summer months and lower production during winter months (Table 4, Figure 3).
Winter months (December–January) yield approximately one-third of peak summer values (June and July). This variation is primarily driven by lower solar elevation angles, shorter daylight duration, and increased atmospheric attenuation. Aggregation of monthly values yields an annual average PV generation of 358 kWh⋅m−2⋅yr−1, which is consistent with the value used in Section 3.2. The pronounced seasonal amplitude confirms that annual averages alone are insufficient for evaluating reliable EV charging supply.

3.3. Energy Supply from PV Rooftop Systems

Electrical energy supply from PV systems is assessed based on the available urban rooftop area in Israel. The total built-up urban area in 2023 is 1479 km2, representing 5.4 percent of the total land area. Residential areas account for approximately half of this total, at 708 km2. Using established ratios of rooftop area to residential area [62], rooftop coverage is estimated at approximately 0.32 of the residential built-up area. Based on a total residential area of 708 km2, the total urban rooftop area is therefore estimated at 226 km2.
With an average annual solar irradiance of 358 kWh⋅m−2⋅yr−1, the total potential annual energy production from urban residential rooftops is:
226 ⋅ 106 ⋅ m2 ⋅ 358 kWh⋅m−2⋅yr−1 = 81 TWh⋅yr−1
A simple calculation yields an ideal PV area requirement of approximately 39 km2, derived by dividing the annual EV electricity demand (14 TWh) by the mean annual PV yield (358 kWh·m−2·yr−1). In contrast, the system-level framework applied in this study yields a slightly higher value of approximately 44 km2. This difference reflects conversion losses, seasonal variability, and conservative design assumptions associated with storage-constrained operation. The 81 TWh·yr−1 represents the theoretical upper-bound annual generation potential under full rooftop utilization, while the 44 km2 estimate reflects the practical system-level requirement under the modeling assumptions of this study.

Spatial Analysis of PV Potential

Municipal-level data from Table A1 were analyzed to compare rooftop PV potential with local EV energy demand. The results reveal substantial spatial variation across municipalities. Dense urban centers such as Tel Aviv and Jerusalem exhibit limited rooftop area per capita and are unable to fully meet local demand through rooftop PV. In contrast, peripheral municipalities such as Be’er Sheva, Dimona, and Eilat show higher rooftop availability and can generate surplus PV potential relative to local demand. These findings indicate a structural spatial imbalance between urban demand centers and peripheral generation potential. This suggests that inter-municipal energy exchange or regional coordination mechanisms may be required to balance supply and demand across space. Accordingly, system-wide optimization may require inter-municipal electricity exchange, regional storage deployment, or transmission reinforcement to balance deficits and surpluses across space.

3.4. Electrical Energy Storage

To allow an uninterrupted energy supply to charge an EV fleet during nighttime hours for one day, 38 GWh is needed. This ‘one day’ value is a statistical construct based on mean annual daily demand, not an actual daily PV profile. Storage requirements are expressed solely in terms of energy capacity to be stored. This value, therefore, provides a first-order baseline for diurnal balancing and is consistent with system-level storage-sizing approaches used in high-renewable-energy systems.

3.5. Winter Charging Constraints

The results presented above are based on annual average daily PV generation, calculated by dividing total yearly output by 365 days. While this approach provides a useful baseline, it does not capture the significant temporal variability in solar resource availability. In Israel, PV generation exhibits strong seasonal variation: during the summer months, daily output reaches approximately 1.4 kWh·m−2·day−1, whereas in winter (December–January) it declines to about 0.5 kWh·m−2·day−1, representing a reduction of roughly 65% relative to peak summer production. Consequently, system design based solely on annual averages substantially underestimates the required PV capacity. To ensure a continuous electricity supply sufficient for fleet electrification under winter conditions, the required rooftop PV area increases to approximately 70 km2. This is higher than the system-level annual estimate of ~44 km2 and substantially higher than the ideal annual-energy balance estimate of ~39 km2. This indicates that system feasibility is governed by seasonal minimum generation rather than by the annual energy balance alone. This challenge is further exacerbated by multi-day periods of low irradiance. Analysis of a 10-year dataset (2014–2024) indicates that sequences of up to seven consecutive overcast days may occur. Under such conditions, maintaining uninterrupted fleet electrification would require approximately 266 GWh of stored energy, based on an estimated daily demand of 38 GWh. Although these estimates are derived from aggregated demand and do not explicitly account for the temporal charging behavior of individual vehicles, they provide a conservative system-level benchmark for evaluating the infrastructure required to ensure reliable electrification under worst-case winter conditions.

3.6. Future Fleet Growth Scenario

Using our modeling technique, simple scenarios can be explored. For example, in the future scenario where the personal vehicle fleet doubles, the area of PV systems will need to double, as will the storage needs. Charging 7 million EVs will require 140 km2 of PV panels generating 28 TWh⋅yr−1 to power the fleet and also suffice during winter months, along with storage infrastructure for approximately 266 GWh (38 GWh⋅7 days, based on the longest recorded overcast period). However, the rooftop area will only increase 54% to 350 km2 (See Appendix A, Table A1). This suggests that long-term scalability may be constrained by competing rooftop uses, urban densification, and infrastructure limitations, despite sufficient theoretical energy potential. Accordingly, future expansion may require complementary solutions such as façade PV, parking-canopy PV, utility-scale solar generation, or regional hybrid energy systems.

4. Discussion

This study shows that, under favorable conditions, urban rooftop PV in Israel can theoretically meet the annual electricity demand required for full electrification of the private vehicle fleet. However, this represents an upper-bound technical potential and does not reflect real-world operational constraints. Although annual rooftop PV production exceeds estimated annual demand, seasonal variability introduces a fundamental temporal constraint that is not captured by annual energy balances. Winter months exhibit substantially lower solar irradiance due to shorter daylight hours, lower solar angles, increased cloud cover, and more frequent rainy days [63,64]. These conditions lead to reduced PV generation and identify winter as the binding constraint on system feasibility. In contrast, summer months benefit from extended daylight and relatively stable irradiance conditions [65], allowing PV generation to approach or exceed fleet electricity demand. In practice, EV charging demand is not uniformly distributed over time and is typically concentrated during evening hours, which may further increase the mismatch between PV generation and demand. Although summer irradiance may enable PV generation to match or exceed fleet demand, year-round electrification requires accounting for temporal alignment between supply and demand rather than annual totals alone. Addressing these constraints requires system-level solutions, including battery storage, vehicle-to-grid (V2G) integration, and hybrid energy systems [66]. Battery storage can support diurnal shifting of energy, while V2G systems enable distributed storage using electric vehicles as flexible resources [67]. However, these approaches primarily address short-term variability. Multi-day and seasonal deficits, particularly during winter low-irradiance periods, may still require additional generation capacity, large-scale storage, or grid-level balancing mechanisms [68,69]. The storage estimates presented in this framework reflect system-level requirements under simplified assumptions and should be interpreted as indicative upper-bound values rather than precise operational sizing. These estimates are based on aggregated fleet demand and do not account for temporal charging behavior or operational constraints at the vehicle level. More detailed dynamic models that incorporate charging cycles, temporal demand variation, and operational constraints [55,56] could provide more refined storage estimates in future work.
Additional implementation constraints should also be considered when interpreting these results. First, the rooftop estimates used in this analysis represent an upper-bound technical potential and do not fully account for practical installation constraints such as shading, roof orientation, structural limitations, or competing rooftop uses [70]. As a result, the practically deployable PV area may be lower than the theoretical rooftop availability assumed in this framework [71]. Second, household adoption of rooftop PV depends not only on technical feasibility, but also on economic and behavioral factors, including installation costs, financial incentives, payback periods, and willingness to invest in distributed energy systems [72]. Third, actual PV electricity generation may be reduced by operational losses associated with dust accumulation, inverter inefficiencies, wiring losses, and long-term module degradation [73]. Finally, large-scale battery deployment introduces additional lifecycle challenges, including performance degradation, maintenance requirements, replacement cycles, and end-of-life recycling [74]. These factors were beyond the scope of the present system-level analysis and should be incorporated in future operational and techno-economic assessments. Spatial disparities further influence system feasibility. Densely populated urban centers, such as Tel Aviv and Jerusalem, have limited rooftop area per capita and cannot fully meet local demand through rooftop PV alone. In contrast, peripheral municipalities such as Be’er Sheva, Dimona, and Eilat exhibit higher rooftop availability and can generate surplus PV potential relative to local demand. These results highlight the importance of inter-municipal energy exchange and spatially distributed energy planning to balance regional deficits and surpluses [75]. From a grid perspective, these findings indicate that high PV penetration alone is insufficient to ensure a reliable electricity supply without complementary infrastructure. Grid integration, storage deployment, and demand-side management strategies are required to accommodate temporal variability and spatial imbalances. Strengthening grid flexibility and enabling energy exchange across regions are therefore essential components in supporting large-scale electrification based on renewable energy [76]. These findings have direct implications for national energy planning, particularly in defining storage targets, grid flexibility requirements, and spatial energy allocation strategies. Additional uncertainties include future travel demand, EV efficiency improvements, charging behavior, and changes in urban form. These factors may alter regional electricity demand profiles and should be incorporated into future scenario analyses [77,78,79].
Overall, rooftop PV represents a substantial renewable resource, but its system value depends on integration within a broader energy framework that explicitly accounts for temporal mismatch, spatial heterogeneity, and infrastructure constraints. These findings emphasize that electrification strategies must be evaluated at the system level, rather than relying on annual energy balance alone.

5. Conclusions

This study highlights the strategic importance of rooftop photovoltaic (PV) systems as a renewable energy source for large-scale vehicle electrification in urban settings, while also identifying temporal mismatch as a key constraint on system feasibility. Under idealized conditions, rooftop PV could generate up to 81 TWh annually, exceeding the estimated fleet electricity demand of 14 TWh per year. Seasonal analysis shows that winter PV generation falls significantly below summer levels, making winter months the binding constraint on system feasibility. To enable a reliable year-round supply, including nighttime and low-irradiance charging, approximately 38 GWh of energy storage would be required to address diurnal and seasonal mismatches. Importantly, when extended low-irradiance periods are considered, storage requirements increase substantially, reaching on the order of ~266 GWh under multi-day winter conditions. This result emphasizes that storage needs are governed not only by daily cycling but also by rare but critical extreme events. The main contribution of this study is the development of an integrated planning framework that combines fleet electricity demand, rooftop PV availability, seasonal solar variability, spatial disparities, and storage requirements within a single quantitative assessment. Unlike previous studies that typically assess PV potential in isolation, this research accounts for geographic disparities between dense urban cores and peripheral cities, seasonal variability in solar generation, and behavioral trends that influence actual demand. In addition, the study explicitly links annual energy potential to winter-constrained system design, providing a more realistic benchmark for feasibility assessment. While rooftop PV presents a viable renewable energy solution, its scalability is constrained by limited rooftop space in dense urban centers. Alternative deployment strategies, such as PV integration on public infrastructure or in peripheral cities, may help mitigate this limitation and enable regional energy-sharing models. Complementary solutions, including large-scale solar farms or hybrid renewable energy systems, are needed to address multi-month seasonal deficits. Vehicle-to-grid (V2G) can mitigate short-term fluctuations of hours to days, but cannot resolve seasonal deficits alone. Thus, V2G should be viewed as a complementary flexibility mechanism, while long-duration storage and distributed generation are required to address seasonal balancing. From a system perspective, these findings indicate that planning based on annual energy balance alone is insufficient and may significantly underestimate infrastructure requirements. Instead, system design must be anchored in worst-case seasonal conditions and temporal supply–demand mismatch.
Future directions based on these results include refining the ~38 GWh storage estimate using dynamic vehicle-level models, techno-economic evaluation of long-duration storage, detailed spatial analysis of realistic rooftop utilization, and pilot testing of combined V2G and demand-response strategies. The methodological framework developed here is also transferable to other geographic contexts, allowing assessment of solar-powered vehicle electrification potential across diverse climates and urban forms.
Israel’s case provides insights for other urban regions with high solar potential. Realizing the full benefits of solar-powered fleet electrification depends on strategic alignment of technological, spatial, and regulatory innovations, adaptive energy management, and targeted policy interventions tailored to both central and peripheral energy landscapes. Overall, achieving system-wide feasibility requires coordinated planning across generation, storage, and spatial distribution, rather than optimization of rooftop PV capacity alone. These insights can support the design of practical electrification strategies under real-world spatial and temporal constraints.

Supplementary Materials

The following supporting information can be downloaded at https://www.mdpi.com/article/10.3390/inventions11030048/s1. File S1: Excel workbook containing the calculation framework, intermediate model outputs, and supporting numerical data used in the PV generation, rooftop area, and storage analyses.

Author Contributions

Conceptualization, O.Y.; methodology, O.Y. and D.B.; formal analysis, O.Y. and D.B.; data curation, O.Y. and D.B.; original draft preparation, O.Y.; review and editing, O.R.-M., R.C., and E.Y.; supervision, O.R.-M., R.C., and E.Y. All authors have read and agreed to the published version of the manuscript.

Funding

This research was supported by the Jewish National Fund (Grant No. 207191) and by VATAT. No external grant number was provided for the latter.

Institutional Review Board Statement

Not applicable.

Informed Consent Statement

Not applicable.

Data Availability Statement

The authors declare that the data supporting the findings of this study are available within the paper from the Central Bureau of Statistics (CBS) (see Table A1 in Appendix A) [https://www.cbs.gov.il/en/publications/Pages/2023/Statistical-Abstract-of-Israel-2023-No-74.aspx (accessed on 8 March 2025)] and in the Israel Meteorological Service (IMS) repository, [https://ims.gov.il/en/data_gov (accessed on 20 March 2025)].

Conflicts of Interest

The authors declare no conflicts of interest. The funders had no role in the study design; in the collection, analysis, or interpretation of the data; in the writing of the manuscript; or in the decision to publish the results.

Appendix A

Table A1. Municipal-level demographic, vehicular, and built-up land data.
CityPopulationPrivate VehiclesBuilt-Up Area
(km2)
Residential Area (km2)CityPopulationPrivate VehiclesBuilt-Up Area
(km2)
Residential Area (km2)
Umm al-Fahm57,67718,9999.48Bi’ina853629601.31.1
Ofakim33,99984304.93.5Giv’at Ze’ev20,03459471.81.6
Or Yehuda36,81513,7453.32.2Jadeidi-Makr21,50777622.72.4
Or Akiva19,90272002.91.8Gedera30,39210,6154.63.6
Eilat52,75318,76414.14.7Julis665728401.91.6
Elad49,593622121.3Jaljulia10,48036861.10.8
Ariel19,64762253.22Gan Yavne24,25196314.13.4
Ashdod225,97561,37519.99.9Ganei Tikva22,69490351.61.4
Ashkelon149,16049,35416.711.1Jisr az-Zarqa15,315329610.8
Baqa al-Gharbiyye30,97311,0716.55.6Jish (Gush Halav)315413490.70.6
Be’er Ya’akov29,85210,0753.62.2Jatt12,47348313.42.8
Be’er Sheva211,25171,60830.319.1Daliyat al-Karmel18,06171386.96.7
Beit She’an18,90065393.72.3Daburiyya10,78239221.71.5
Beit Shemesh141,76419,7769.36.1Deir al-Asad12,93544971.81.6
Beitar Illit63,22051092.61.8Deir Hanna10,59940601.81.7
Bnei Brak212,39519,7506.23.2Har Adar410820500.80.8
Bat Yam126,29034,1166.94.1Zikhron Ya’akov23,85794754.93.7
Givat Shmuel28,16297411.71.2Zemer736027952.11.9
Giv’atayim61,28120,81532.1Zarzir841222442.62.3
Dimona35,89212,2017.14.3Hura23,94330044.84.4
Hod HaSharon65,36328,0048.76.8Hurfeish658123411.81.7
Herzliya103,31845,00913.610.6Hazor HaGlilit976433122.11.4
Hadera100,63136,17914.29.6Harish27,00675882.21.9
Holon197,46491,14013.68.2Tuba-Zangariyye701123141.51.4
Haifa282,832118,9403620.3Tur’an14,655493321.7
Tiberias46,69814,2576.84.3Yanuh-Jat6851256321.7
Tayibe45,38816,30686.1Yavne’el444813682.21.8
Tira27,39210,9977.46.6Yesod HaMa’ala18048221.21.1
Tirat Carmel26,80694612.91.9Yafia19,53869602.22
Tamra35,40513,0536.35Yeruham11,03131683.31.8
Yavne53,59519,7586.13.7Yarka17,576667854
Yehud-Monosson30,61913,2133.92.8Kabul14,47344882.22
Yokne’am Illit24,15890443.42.3Kaokab Abu al-Hija372414920.80.7
Jerusalem966,210231,11067.548.3Kokhav Ya’ir894949822.32
Kfar Yona27,89810,3233.53Kuseife23,21917543.53.3
Kfar Saba101,80141,11210.27Kisra-Sumei910828592.52.2
Kafr Qasim24,75789176.45.5Ka’abiyye-Tabbash-Hajajre573219471.31.3
Karmiel46,31116,0337.54.7Kafr Bara385614230.50.5
Lod82,62949,0718.25.4Kfar Vradim553127571.81.6
Maghar23,62485404.74.4Kafr Yasif10,32345881.41.1
Migdal HaEmek26,02983744.32.4Kfar Kama3479141710.8
Modi’in-Maccabim-Re’ut97,09736,67510.97.9Kafr Kanna23,70580073.62.9
Modi’in Illit80,99645752.41.5Kafr Manda21,07364302.62.4
Ma’ale Adumim37,55513,0285.52.9Kafr Qara19,691788065.3
Ma’alot-Tarshiha22,31580714.12.9Kfar Shmaryahu194813401.61.2
Nahariya60,80621,28774.6Kfar Tavor442521831.61.2
Nof HaGalil42,65714,77363.6Lehavim697732622.52.1
Nes Tziona50,45618,97364.2Lakiya15,29528932.82.7
Nazareth77,92529,53485.6Mevasseret Zion24,94311,3063.42.8
Nesher23,76090383.41.7Majd al-Krum15,63052822.72.2
Netivot42,03910,7105.23.4Migdal19887751.30.8
Netanya224,06674,85718.411.9Majdal Shams11,40545782.42
Sakhnin32,74312,9235.14.4Mazkeret Batya15,42463582.21.8
Acre (Akko)49,61416,9726.83.3Mazra’a407814940.60.5
Afula59,07519,4328.85.8Metula169385410.6
Arraba26,64191914.24Meitar10,56546783.53.1
Arad27,58284417.65.2Mas’ade3812152210.8
Petah Tikva252,27088,47621.812.1Mi’ilya326715411.20.9
Safed (Tzfat)37,47283935.13.3Ma’ale Efrayim13184670.60.3
Kalansuwa23,87782144.94.4Ma’ale Iron15,64252893.23
Kiryat Ono41,90015,9433.42.8Mitzpe Ramon517814302.11.1
Kiryat Ata60,10221,4688.96.1Mashhad865527781.41.2
Kiryat Bialik43,26716,3464.32.6Nahf13,55843081.91.6
Kiryat Gat60,58216,3337.74Sajur442516311.11
Kiryat Yam39,44111,8523.12.4Savyon4051287732.8
Kiryat Motzkin46,56517,3103.22.4Ghajar27456970.20.2
Kiryat Malakhi25,022769431.9Omer765648793.82.9
Kiryat Shmona22,336853653Eilabun581223981.21
Rosh HaAyin71,65130,7208.26.4Ilut865424611.61.4
Rishon LeZion257,128125,35425.815.1Ein Mahil13,74843991.41.4
Rahat76,23714,834119.7Ein Qiniyye21729230.70.7
Rehovot147,87850,69513.18.7Immanuel43726690.60.3
Ramla77,79825,0998.64.8Isfiya12,74649034.54.3
Ramat Gan169,70687,60813.38.1Ar’ara25,82375695.55.1
Ramat HaSharon47,97021,6497.34.8Ar’ara-BaNegev19,68224973.73.3
Ra’anana78,56234,3919.16.6Fureidis13,57041861.20.9
Sderot30,55397664.42.7Fassuta3236144110.8
Shefa-‘Amr43,02316,3098.36.6Peki’in (Buqei’a)602625971.81.6
Tel Aviv-Yafo467,875221,4283923.6Pardes Hanna-Karkur44,21016,6379.77.6
Abu Ghosh788023531.31.2Pardesiya7251369810.9
Abu Snan14,45552392.32.1Kedumim459014251.10.9
Even Yehuda14,26665253.52.9Kadima-Tzoran22,92093584.13.4
Oranit911439751.41.2Katzrin7606312821.2
Azor13,47454571.91.3Kiryat Arba749916071.61.2
Iksal15,146531621.6Kiryat Tivon18,51980734.63.9
Elyakhin346115410.90.8Kiryat Ye’arim647110490.40.3
Alfei Menashe796634811.21.1Kiryat Ekron11,051419821.3
Elkana4072161010.7Karnei Shomron966333201.81.4
I’billin13,69249583.53.1Rama778935911.51.3
Efrat11,80439531.51.3Rosh Pinna323717012.81.4
Bu’eine-Nujeidat10,13734121.51.4Reineh19,26556733.42.8
Buq’ata675224451.61.5Rekhasim13,73619711.21
Bir al-Maksur995934352.32.2Ramat Yishai807136971.51.2
Beit El568113440.70.5Shibli-Umm al-Ghanam627922221.41.3
Beit Aryeh-Ofarim540923061.31.2Segev Shalom11,86518503.73.3
Beit Jann12,30746023.23.1Shoham21,44192752.72.1
Beit Dagan764443141.10.8Shlomi705528481.60.9
Bnei Ayish689532,3190.60.5Sha’ab738126830.80.7
Binyamina16,07558804.63.5Tel Mond14,17959702.32
Basma10,49738082.11.9Tel Sheva22,187360443.6
Basmat Tab’un806826191.91.7
Table A2. Hourly sun elevation and percent theoretical solar irradiation (cos θ) for each month *.
MonthTimeΘ
(°)
cos θMonthTimeθ
(°)
cos θMonthTimeθ
(°)
cos θ
Jan82.630.05May62.370.04Sep76.810.12
Jan913.450.23May714.520.25Sep819.460.33
Jan1022.970.39May827.050.45Sep931.810.53
Jan1130.550.51May939.740.64Sep1043.410.69
Jan1235.350.58May1052.360.79Sep1153.380.80
Jan1336.610.60May1164.430.90Sep1259.920.87
Jan1434.090.56May1274.250.96Sep1360.580.87
Jan1528.250.47May1375.660.97Sep1455.030.82
Jan1619.920.34May1467.050.92Sep1545.560.71
Jan179.900.17May1555.260.82Sep1634.190.56
Feb86.490.11May1642.710.68Sep1721.930.37
Feb918.080.31May1730.020.50Sep189.300.16
Feb1028.580.48May1817.450.30Oct72.620.05
Feb1137.290.61May195.210.09Oct814.840.26
Feb1243.150.68Jun64.120.07Oct926.350.44
Feb1345.010.71Jun715.950.27Oct1036.590.60
Feb1442.410.67Jun828.250.47Oct1144.630.70
Feb1535.980.59Jun940.830.65Oct1249.100.76
Feb1626.90.45Jun1053.520.80Oct1348.80.75
Feb1716.180.28Jun1166.050.91Oct1443.820.69
Feb184.460.08Jun1277.360.98Oct1535.450.58
Mar70.850.01Jun1380.220.99Oct1625.010.42
Mar813.450.23Jun1470.450.94Oct1713.380.23
Mar925.660.43Jun1558.140.85Oct181.100.02
Mar1037.030.60Jun1645.460.71Nov89.040.16
Mar1146.800.73Jun1732.820.54Nov919.660.34
Mar1253.560.80Jun1820.400.35Nov1028.780.48
Mar1355.450.82Jun198.380.15Nov1135.610.58
Mar1451.740.79Jul62.150.04Nov1239.210.63
Mar1543.770.69Jul714.030.24Nov1338.860.63
Mar1633.340.55Jul826.370.44Nov1434.650.57
Mar1721.630.37Jul938.980.63Nov1527.370.46
Mar189.260.16Jul1051.670.78Nov1617.940.31
Apr79.040.16Jul1164.120.90Nov177.120.12
Apr821.740.37Jul1275.260.97Dec84.120.07
Apr934.360.56Jul1379.070.98Dec914.480.25
Apr1046.540.73Jul1470.580.94Dec1023.380.40
Apr1157.550.84Jul1558.580.85Dec1130.160.50
Apr1265.550.91Jul1645.960.72Dec1234.020.56
Apr1367.030.92Jul1733.270.55Dec1334.340.56
Apr1460.970.87Jul1820.750.35Dec1431.070.52
Apr1550.760.77Jul198.580.15Dec1524.750.42
Apr1638.890.63Aug710.590.18Dec1616.170.28
Apr1726.390.44Aug823.200.39Dec176.020.10
Apr1813.700.24Aug935.890.59
Apr191.100.02Aug1048.370.75
Aug1160.070.87
Aug1269.340.94
Aug1371.790.95
Aug1465.270.91
Aug1554.450.81
Aug1642.240.67
Aug1729.610.49
Aug1816.910.29
Aug194.410.08
(*) calculated for 15th of each month.

References

  1. Lee, J.H.; Lim, S. The selection of compact city policy instruments and their effects on energy consumption and greenhouse gas emissions in the transportation sector: The case of South Korea. Sustain. Cities Soc. 2018, 37, 116–124. [Google Scholar] [CrossRef] [Scilit]
  2. Ribeiro, F.N.D.; Umezaki, A.S.; Chiquetto, J.B.; Santos, I.; Machado, P.G.; Miranda, R.M.; Almeida, P.S.; Simões, A.F.; Mouette, D.; Leichsenring, A.R.; et al. Impact of different transportation planning scenarios on air pollutants, greenhouse gases and heat emission abatement. Sci. Total Environ. 2021, 781, 146708. [Google Scholar] [CrossRef] [Scilit]
  3. Muratori, M.; Alexander, M.; Arent, D.; Bazilian, M.; Cazzola, P.; Dede, E.M.; Farrell, J.; Gearhart, C.; Greene, D.; Jenn, A.; et al. The rise of electric vehicles—2020 status and future expectations. Prog. Energy 2021, 3, 022002. [Google Scholar] [CrossRef] [Scilit]
  4. Sica, L.; Carboni, A.; Deflorio, F.; Botta, C. Electric vehicle recharging options in urban areas: Discrete choice modeling to estimate user preference. Sustain. Cities Soc. 2025, 121, 106175. [Google Scholar] [CrossRef] [Scilit]
  5. Saleh, H.; Hassan, A. The challenges of sustainable energy transition: A focus on renewable energy. Appl. Chem. Eng. 2024, 7, 2084. [Google Scholar] [CrossRef] [Scilit]
  6. Dominković, D.F.; Bačeković, I.; Ćosić, B.; Krajačić, G.; Pukšec, T.; Duić, N.; Markovska, N. Zero carbon energy system of South East Europe in 2050. Appl. Energy 2016, 184, 1517–1528. [Google Scholar] [CrossRef] [Scilit]
  7. Maka, A.O.M.; Ghalut, T.; Elsaye, E. The pathway towards decarbonisation and net-zero emissions by 2050: The role of solar energy technology. Green Technol. Sustain. 2024, 2, 100107. [Google Scholar] [CrossRef] [Scilit]
  8. Ghorbani, S.; Deymi-Dashtebayaz, M.; Yazdani, M.; Remiorz, L. Thermoeconomic and multi-objective optimization of a solar-powered MED-TVC desalination system considering ejector positioning and seasonal energy input. Solar Energy 2025, 298, 113638. [Google Scholar] [CrossRef] [Scilit]
  9. Hassan, M.A.; Bailek, N.; Bouchouicha, K.; Ibrahim, A.; Jamil, B.; Kuriqi, A.; Nwokolo, S.C.; El-kenawy, E.-S.M. Evaluation of energy extraction of PV systems affected by environmental factors under real outdoor conditions. Theor. Appl. Climatol. 2022, 150, 715–729. [Google Scholar] [CrossRef] [Scilit]
  10. Khan, N.; Dilshad, S.; Khalid, R.; Kalair, A.R.; Abas, N. Review of energy storage and transportation of energy. Energy Storage 2019, 1, e49. [Google Scholar] [CrossRef] [Scilit]
  11. A’amar, K.; Bicer, Y.; Al-Ansari, T. Advancements and techno-economic viability of pole-integrated vertical PV tubes: Evaluating alternatives to conventional flat panels in arid and low-maintenance environments—A review article. Sol. Energy 2025, 295, 113517. [Google Scholar] [CrossRef] [Scilit]
  12. Sun, T.; Shan, M.; Rong, X.; Yang, X. Estimating the spatial distribution of solar photovoltaic power generation potential on different types of rural rooftops using a deep learning network applied to satellite images. Appl. Energy 2022, 315, 119025. [Google Scholar] [CrossRef] [Scilit]
  13. Ajirotutu, R.O.; Adeyemi, A.B.; Ifechukwu, G.-O.; Iwuanyanwu, O.; Ohakawa, T.C.; Garba, B.M.P. Designing policy frameworks for the future: Conceptualizing the integration of green infrastructure into urban development. World J. Adv. Res. Rev. 2024, 24, 911–923. [Google Scholar] [CrossRef] [Scilit]
  14. Ghaleb, B.; Asif, M. Application of solar PV in commercial buildings: Utilizability of rooftops. Energy Build. 2022, 257, 111774. [Google Scholar] [CrossRef] [Scilit]
  15. Panagiotidou, M.; Brito, M.C.; Hamza, K.; Jasieniak, J.J.; Zhou, J. Prospects of photovoltaic rooftops, walls and windows at a city to building scale. Sol. Energy 2021, 230, 675–687. [Google Scholar] [CrossRef] [Scilit]
  16. Gagnon, P.; Margolis, R.; Melius, J.; Phillips, C.; Elmore, R. Rooftop Solar Photovoltaic Technical Potential in the United States. A Detailed Assessment; National Renewable Energy Lab.: Golden, CO, USA, 2016; NREL/TP--6A20-65298, 1236153. [Google Scholar] [CrossRef] [Scilit]
  17. Kraschewski, T.; Heumann, M.; Breitner, M.H. Adoption and spatial distribution disparities of residential plug-in and rooftop photovoltaic systems in Germany. Renew. Sustain. Energy Rev. 2025, 209, 115092. [Google Scholar] [CrossRef] [Scilit]
  18. Chen, T.; Jin, Y.; Lv, H.; Yang, A.; Liu, M.; Chen, B.; Xie, Y.; Chen, Q. Applications of Lithium-Ion Batteries in Grid-Scale Energy Storage Systems. Trans. Tianjin Univ. 2020, 26, 208–217. [Google Scholar] [CrossRef] [Scilit]
  19. Irfan, M.; Deilami, S.; Huang, S.; Veettil, B.P.; Irfan, M.; Deilami, S.; Huang, S.; Veettil, B.P. Rooftop Solar and Electric Vehicle Integration for Smart, Sustainable Homes: A Comprehensive Review. Energies 2023, 16, 7248. [Google Scholar] [CrossRef] [Scilit]
  20. Reddy, G.H.; Depuru, S.R.; Gope, S.; Narayana, B.V.; Bhukya, M.N. Simultaneous Placement of Multiple Rooftop Solar PV Integrated Electric Vehicle Charging Stations for Reliability Benefits. IEEE Access 2023, 11, 130788–130801. [Google Scholar] [CrossRef] [Scilit]
  21. Heijde, B.; Vandermeulen, A.; Salenbien, R.; Helsen, L. Representative days selection for district energy system optimisation: A solar district heating system with seasonal storage. Appl. Energy 2019, 248, 79–94. [Google Scholar] [CrossRef] [Scilit]
  22. Joshi, S.; Mittal, S.; Holloway, P.; Shukla, P.R.; Ó Gallachóir, B.; Glynn, J. High resolution global spatiotemporal assessment of rooftop solar photovoltaics potential for renewable electricity generation. Nat. Commun. 2021, 12, 5738. [Google Scholar] [CrossRef] [Scilit] [PubMed]
  23. Ji, N.; Zhu, R.; Huang, Z.; You, L. An urban-scale spatiotemporal optimization of rooftop photovoltaic charging of electric vehicles. Urban Inform. 2024, 3, 4. [Google Scholar] [CrossRef] [Scilit]
  24. Kobashi, T.; Choi, Y.; Hirano, Y.; Yamagata, Y.; Say, K. Rapid rise of decarbonization potentials of photovoltaics plus electric vehicles in residential houses over commercial districts. Appl. Energy 2022, 306, 118142. [Google Scholar] [CrossRef] [Scilit]
  25. Liu, J.; Li, M.; Xue, L.; Kobashi, T. A framework to evaluate the energy-environment-economic impacts of developing rooftop photovoltaics integrated with electric vehicles at city level. Renew. Energy 2022, 200, 647–657. [Google Scholar] [CrossRef] [Scilit]
  26. Shriki, N.; Rabinovici, R.; Yahav, K.; Rubin, O.D. Methodology for estimating the potential of ground-mounted solar photovoltaic as part of the national electricity grid: The case of Israel. Energy Sustain. Dev. 2022, 68, 332–349. [Google Scholar] [CrossRef] [Scilit]
  27. Shefer, D.; Antonio, M. Spatial Inequality Between and Within Urban Areas: The Case of Israeli Cities. Eur. Plan. Stud. 2013, 21, 373–387. [Google Scholar] [CrossRef] [Scilit]
  28. Janusz-Szymańska, K.; Wiciak, G.; Remiorz, L.; Hulak, D. Heat Storage Using Solar Pond Technology and Post-Mining Brine—Preliminary Analysis. Heat Transf. Eng. 2025, 46, 310–320. [Google Scholar] [CrossRef] [Scilit]
  29. CBS Population—Statistical Abstract of Israel 2024. Available online: https://www.cbs.gov.il/en/publications/Pages/2024/Population-Statistical-Abstract-of-Israel-2024-No75.aspx (accessed on 28 March 2025).
  30. Bergin, M.H.; Ghoroi, C.; Dixit, D.; Schauer, J.J.; Shindell, D.T. Large Reductions in Solar Energy Production Due to Dust and Particulate Air Pollution. Environ. Sci. Technol. Lett. 2017, 4, 339–344. [Google Scholar] [CrossRef] [Scilit]
  31. Oh, G.; Leblanc, D.J.; Peng, H. Vehicle Energy Dataset (VED), A Large-Scale Dataset for Vehicle Energy Consumption Research. IEEE Trans. Intell. Transp. Syst. 2022, 23, 3302–3312. [Google Scholar] [CrossRef] [Scilit]
  32. Wei, W.; Ramakrishnan, S.; Needell, Z.A.; Trancik, J.E. Personal vehicle electrification and charging solutions for high-energy days. Nat. Energy 2021, 6, 105–114. [Google Scholar] [CrossRef] [Scilit]
  33. CBS Publications Vehicle Kilometers Travelled, 2022. Available online: https://www.cbs.gov.il/en/publications/Pages/2024/Vehicle-Kilometers-Travelled-2022.aspx (accessed on 28 March 2025).
  34. CBS Transport and Road Safety—Statistical Abstract of Israel 2024. Available online: https://www.cbs.gov.il/en/publications/Pages/2024/Transport-and-Road-Safety-Statistical-Abstract-of-Israel-2024-No75.aspx (accessed on 28 March 2025).
  35. Veza, I.; Asy’ari, M.Z.; Idris, M.; Epin, V.; Rizwanul Fattah, I.M.; Spraggon, M. Electric vehicle (EV) and driving towards sustainability: Comparison between EV, HEV, PHEV, and ICE vehicles to achieve net zero emissions by 2050 from EV. Alex. Eng. J. 2023, 82, 459–467. [Google Scholar] [CrossRef] [Scilit]
  36. Baweja, S.; Kumar, R. Efficiency Improvement of Internal Combustion Engines Over Time. In Novel Internal Combustion Engine Technologies for Performance Improvement and Emission Reduction; Singh, A.P., Agarwal, A.K., Eds.; Springer: Singapore, 2021; pp. 147–173. [Google Scholar] [CrossRef] [Scilit]
  37. Mądziel, M.; Campisi, T. Energy Consumption of Electric Vehicles: Analysis of Selected Parameters Based on Created Database. Energies 2023, 16, 1437. [Google Scholar] [CrossRef] [Scilit]
  38. Nelson, P.A.; Ahmed, S.; Gallagher, K.G.; Dees, D.W. Modeling the Performance and Cost of Lithium-Ion Batteries for Electric-Drive Vehicles, 3rd ed.; Argonne National Laboratory (ANL): Argonne, IL, USA, 2019. [Google Scholar] [CrossRef] [Scilit]
  39. Szarka, G.D.; Stark, B.H.; Burrow, S.G. Review of Power Conditioning for Kinetic Energy Harvesting Systems. IEEE Trans. Power Electron. 2012, 27, 803–815. [Google Scholar] [CrossRef] [Scilit]
  40. Iqbal, M. An Introduction To Solar Radiation; Elsevier: Amsterdam, The Netherlands, 2012. [Google Scholar]
  41. Yousef, B.A.A.; Radwan, A.; Olabi, A.G.; Abdelkareem, M.A. Sun composition, solar angles, and estimation of solar radiation. In Renewable Energy—Volume 1: Solar, Wind, and Hydropower; Academic Press: Cambridge, MA, USA, 2023; pp. 3–22. [Google Scholar] [CrossRef] [Scilit]
  42. IMS Meteorological Database|Israel Meteorological Service. Available online: https://ims.gov.il/en/data_gov (accessed on 24 February 2026).
  43. Maleki, S.A.M.; Hizam, H.; Gomes, C. Estimation of Hourly, Daily and Monthly Global Solar Radiation on Inclined Surfaces: Models Re-Visited. Energies 2017, 10, 134. [Google Scholar] [CrossRef] [Scilit]
  44. Stein, J.S.; Hansen, C.W.; Reno, M.J. Global Horizontal Irradiance Clear Sky Models: Implementation and Analysis; Sandia National Laboratories (SNL-NM): Albuquerque, NM, USA, 2012. [Google Scholar] [CrossRef] [Scilit]
  45. Inman, R.H.; Pedro, H.T.C.; Coimbra, C.F.M. Solar forecasting methods for renewable energy integration. Prog. Energy Combust. Sci. 2013, 39, 535–576. [Google Scholar] [CrossRef] [Scilit]
  46. SPA. Available online: https://midcdmz.nrel.gov/spa/ (accessed on 22 February 2026).
  47. Hammad, B.K.; Fouad, R.H.; Ashhab, M.S.; Nijmeh, S.D.; Mohsen, M.; Tamimi, A. Adaptive control of solar tracking system. IET Sci. Meas. Technol. 2014, 8, 426–431. [Google Scholar] [CrossRef] [Scilit]
  48. Li, J.; Chen, B. Optimal Solar Zenith Angle Definition for Combined Landsat-8 and Sentinel-2A/2B Data Angular Normalization Using Machine Learning Methods. Remote Sens. 2021, 13, 2598. [Google Scholar] [CrossRef] [Scilit]
  49. Hossain, M.F. Photon energy amplification for the design of a micro PV panel. Int. J. Energy Res. 2018, 42, 3861–3876. [Google Scholar] [CrossRef] [Scilit]
  50. Polman, A.; Knight, M.; Garnett, E.C.; Ehrler, B.; Sinke, W.C. Photovoltaic materials: Present efficiencies and future challenges. Science 2016, 352, aad4424. [Google Scholar] [CrossRef] [Scilit]
  51. Caballero, J.A.; Fernández, E.F.; Theristis, M.; Almonacid, F.; Nofuentes, G. Spectral Corrections Based on Air Mass, Aerosol Optical Depth, and Precipitable Water for PV Performance Modeling. IEEE J. Photovolt. 2018, 8, 552–558. [Google Scholar] [CrossRef] [Scilit]
  52. Center for Sustainable Systems Solar PV Energy Factsheet|Center for Sustainable Systems. Available online: https://css.umich.edu/publications/factsheets/energy/solar-pv-energy-factsheet (accessed on 11 July 2025).
  53. Munoz, M.N.; Ballantyne, E.E.F.; Stone, D.A. Assessing the Economic Impact of Introducing Localised PV Solar Energy Generation and Energy Storage for Fleet Electrification. Energies 2023, 16, 3570. [Google Scholar] [CrossRef] [Scilit]
  54. Singh, R.; Banerjee, R. Estimation of rooftop solar photovoltaic potential of a city. Sol. Energy 2015, 115, 589–602. [Google Scholar] [CrossRef] [Scilit]
  55. Hasan, M.K.; Mahmud, M.; Ahasan Habib, A.K.M.; Motakabber, S.M.A.; Islam, S. Review of electric vehicle energy storage and management system: Standards, issues, and challenges. J. Energy Storage 2021, 41, 102940. [Google Scholar] [CrossRef] [Scilit]
  56. Lawder, M.T.; Suthar, B.; Northrop, P.W.C.; De, S.; Hoff, C.M.; Leitermann, O.; Crow, M.L.; Santhanagopalan, S.; Subramanian, V.R. Battery Energy Storage System (BESS) and Battery Management System (BMS) for Grid-Scale Applications. Proc. IEEE 2014, 102, 1014–1030. [Google Scholar] [CrossRef] [Scilit]
  57. Fei, Z.; Yang, H.; Du, L.; Guerrero, J.M.; Meng, K.; Li, Z. Two-Stage Coordinated Operation of a Green Multi-Energy Ship Microgrid With Underwater Radiated Noise by Distributed Stochastic Approach. IEEE Trans. Smart Grid 2025, 16, 1062–1074. [Google Scholar] [CrossRef] [Scilit]
  58. AlFaraj, J.; Popovici, E.; Leahy, P. Solar Irradiance Database Comparison for PV System Design: A Case Study. Sustainability 2024, 16, 6436. [Google Scholar] [CrossRef] [Scilit]
  59. Krawczak, E. A Comparative Analysis of Measured and Simulated Data of PV Rooftop Installations Located in Poland. Energies 2023, 16, 5975. [Google Scholar] [CrossRef] [Scilit]
  60. Younas, M. Performance Assessment and Statistical Validation of PVGIS-Simulated Solar PV Generation Against Measured Output in Sweden; Halmstad University: Halmstad, Sweden, 2025; Available online: https://urn.kb.se/resolve?urn=urn:nbn:se:hh:diva-57862 (accessed on 22 February 2026).
  61. NASA POWER|Data Access Viewer (DAV). Available online: https://power.larc.nasa.gov/data-access-viewer/ (accessed on 24 February 2026).
  62. CBS Statistical Abstract of Israel 2023. Available online: https://www.cbs.gov.il/en/publications/Pages/2023/Statistical-Abstract-of-Israel-2023-No-74.aspx (accessed on 28 March 2025).
  63. Denholm, P.; Margolis, R.M. Evaluating the limits of solar photovoltaics (PV) in traditional electric power systems. Energy Policy 2007, 35, 2852–2861. [Google Scholar] [CrossRef] [Scilit]
  64. Rostami, E.; Nasrollahi, N. The impact of urban morphology on sunlight availability at urban and neighborhood scales: A systematic review. Sustain. Cities Soc. 2025, 121, 106194. [Google Scholar] [CrossRef] [Scilit]
  65. Li, G.; He, Q.; Lin, B.; Wang, M.; Ju, X.; Xu, S. Accelerated inverse urban design: A multi-objective optimization method to photovoltaic power generation potential, environmental performance and economic performance in urban blocks. Sustain. Cities Soc. 2025, 120, 106135. [Google Scholar] [CrossRef] [Scilit]
  66. Gholami, H. Technical potential of solar energy in buildings across Norway: Capacity and demand. Sol. Energy 2024, 278, 112758. [Google Scholar] [CrossRef] [Scilit]
  67. Oskouei, M.Z.; Şeker, A.A.; Tunçel, S.; Demirbaş, E.; Gözel, T.; Hocaoğlu, M.H.; Abapour, M.; Mohammadi-Ivatloo, B. A Critical Review on the Impacts of Energy Storage Systems and Demand-Side Management Strategies in the Economic Operation of Renewable-Based Distribution Network. Sustainability 2022, 14, 2110. [Google Scholar] [CrossRef] [Scilit]
  68. Soussi, A.; Zero, E.; Bozzi, A.; Sacile, R. Enhancing Energy Systems and Rural Communities through a System of Systems Approach: A Comprehensive Review. Energies 2024, 17, 4988. [Google Scholar] [CrossRef] [Scilit]
  69. Odoi-Yorke, F.; Baah, B.; Kissi-Boateng, R.; Opoku, R.; Effah, F. Unlocking the potential of redundant energy from solar photovoltaic systems: Navigating global research trends, innovations, and future directions. Energy Rep. 2025, 13, 6362–6383. [Google Scholar] [CrossRef] [Scilit]
  70. Zhong, Q.; Tong, D. Assessing Solar Photovoltaic Potential Using LiDAR and GIS Modeling. In Handbook of Climate Change Mitigation and Adaptation; Springer: Cham, Switzerland; Berlin, Germany, 2025; pp. 1615–1642. ISBN 978-3-031-84483-6. [Google Scholar]
  71. Shi, M.; Lu, X.; Craig, M.T. Unveiling deployable rooftop solar potential across Chinese cities. Nat. Cities 2025, 2, 650–661. [Google Scholar] [CrossRef] [Scilit]
  72. Qureshi, T.M.; Ullah, K.; Arentsen, M.J. Factors responsible for solar PV adoption at household level: A case of Lahore, Pakistan. Renew. Sustain. Energy Rev. 2017, 78, 754–763. [Google Scholar] [CrossRef] [Scilit]
  73. Kazem, H.A. Impact of long-term dust accumulation on photovoltaic module performance—A comprehensive review. Environ. Sci. Pollut. Res. 2023, 30, 119568–119593. [Google Scholar] [CrossRef] [Scilit]
  74. Durowoju, E.; Salaudeen, H. Advancing lifecycle-aware battery architectures with embedded self-healing and recyclability for sustainable high-density renewable energy storage applications. World J. Adv. Res. Rev. 2022, 14, 744–765. [Google Scholar] [CrossRef] [Scilit]
  75. McDonald, R.I.; Aronson, M.F.J.; Beatley, T.; Beller, E.; Bazo, M.; Grossinger, R.; Jessup, K.; Mansur, A.V.; Puppim de Oliveira, J.A.; Panlasigui, S.; et al. Denser and greener cities: Green interventions to achieve both urban density and nature. People Nat. 2023, 5, 84–102. [Google Scholar] [CrossRef] [Scilit]
  76. Ikuta, K.; Aki, H. Multi-timescale management models for distributed energy resources and a two-stage incentive design for demand-side grid flexibility provision. Sustain. Energy Grids Netw. 2025, 41, 101618. [Google Scholar] [CrossRef] [Scilit]
  77. Malach, G.; Cahaner, L. The Statistical Report on the Ultra-Orthodox Society in Israel: 2019; Israel Democracy Institute: Jerusalem, Israel, 2019; Available online: https://en.idi.org.il/media/13829/ultra-Orthodox-statistical-summary-2019-final.pdf (accessed on 22 February 2026).
  78. Chen, Y.; Li, Y. The evolving dynamics of Haredi Judaism in Israel: Ideological shifts and political influences. HTS Theol. Stud. 2024, 80, 10111. [Google Scholar] [CrossRef] [Scilit]
  79. Unterluggauer, T.; Rich, J.; Andersen, P.B.; Hashemi, S. Electric vehicle charging infrastructure planning for integrated transportation and power distribution networks: A review. eTransportation 2022, 12, 100163. [Google Scholar] [CrossRef] [Scilit]
Figure 1. Schematic overview of the modeling framework, showing the main data inputs, analytical steps, and outputs used to assess the feasibility of electrifying the private vehicle fleet using urban rooftop PV systems.
Inventions 11 00048 g001
Figure 2. Solar insolation as a function of the maximal elevation.
Inventions 11 00048 g002
Figure 3. Mean monthly photovoltaic electricity generation potential.
Inventions 11 00048 g003
Table 1. Comparative overview of previous studies on rooftop PV integration with EV charging.
StudyLocation/ContextConsideration of SeasonalityStorage ConsiderationRooftop/PV ConstraintsKey Notes
Urban-scale spatiotemporal optimization of rooftop PV for EV chargingGuangzhou, ChinaLimited focus; main focus on urban supply-demandDynamic dispatch at charging stationsPV integrated at selected charging stationsRooftop PV can supply >90% of real-time EV demand with smart dispatch [23].
Decarbonization potential of PV + EV systemsMultiple cities, JapanNot detailedEV as flexible storageResidential vs. commercial comparisonPV + EV can meet ~89% of urban demand and reduce CO2 emissions ~88% [24]
Framework for energy-environment-economic assessment of PV + EVShenzhen, ChinaSeasonal variability not centralYes—EV provides storage serviceRooftop PV + EV as a single unitPV + EV improves self-consumption from 78% to 95% and reduces emissions and costs [25].
Table 2. Parameter values for the solar irradiance model *.
Montha0
(10−1)
a1
(10−1)
a2
(10−2)
a3
(10−3)
a4
(10−4)
Jan2.54−5.4312.49−8.641.84
Feb−3.99−3.059.53−6.931.46
Mar−3.61−2.759.21−6.791.43
Apr−3.67−2.168.40−6.401.37
May−2.27−2.198.25−6.291.35
Jun−0.45−2.748.90−6.621.42
Jul−2.11−2.258.23−6.191.32
Aug−1.16−3.029.53−7.031.50
Sep−0.28−3.6410.49−7.661.64
Oct−4.23−2.438.90−6.851.50
Nov−6.02−1.937.98−6.231.35
Dec−7.32−1.617.37−5.781.25
* R2 > 0.999 for all fits.
Table 3. Absorption effect (fatm).
Month%
Jan0.33
Feb0.31
Mar0.26
Apr0.21
May0.19
Jun0.17
Jul0.17
Aug0.16
Sep0.23
Oct0.23
Nov0.32
Dec0.33
Table 4. Average monthly PV electricity yield per square meter.
MonthPV Generation (kWh⋅m−2⋅d−1)
Jan0.5
Feb0.7
Mar0.9
Apr1.2
May1.3
Jun1.4
Jul1.4
Aug1.3
Sep1.0
Oct0.8
Nov0.6
Dec0.5
Disclaimer/Publisher’s Note: The statements, opinions and data contained in all publications are solely those of the individual author(s) and contributor(s) and not of MDPI and/or the editor(s). MDPI and/or the editor(s) disclaim responsibility for any injury to people or property resulting from any ideas, methods, instructions or products referred to in the content.