Article

A Characterization of the RNA Modification Response to Starvation under Low Temperatures in Large Yellow Croaker (Larimichthys crocea)

1
East China Sea Fisheries Research Institute, Chinese Academy of Fishery Sciences, Shanghai 200090, China
2
Key Laboratory of Exploration and Utilization of Aquatic Genetic Resources, Ministry of Education, Shanghai Ocean University, Shanghai 201306, China
3
Fishery Machinery and Instrument Research Institute, Chinese Academy of Fishery Sciences, Shanghai 200090, China
*
Author to whom correspondence should be addressed.
Fishes 2024, 9(1), 41; https://doi.org/10.3390/fishes9010041
Submission received: 22 December 2023 / Revised: 18 January 2024 / Accepted: 19 January 2024 / Published: 21 January 2024
(This article belongs to the Special Issue Aquaculture and Reproduction of Marine Fishes)

Abstract

:
Emerging evidence shows that N6-methyladenosine (m6A) is a post-transcriptional RNA modification that plays a vital role in regulation of gene expression, fundamental biological processes, and physiological functions. To explore the effect of starvation on m6A methylation modification in the liver of Larimichthys crocea (L. crocea) under low temperatures, the livers of L. crocea from cold and cold + fasting groups were subjected to MeRIP-seq and RNA-seq using the NovaSeq 6000 platform. Compared to the cryogenic group, the expression of RNA methyltransferases mettl3 and mettl14 was upregulated, whereas that of demethylase fto and alkbh5 was downregulated in the starved cryogenic group. A Kyoto Encyclopedia of Genes and Genomes pathway enrichment analysis showed that the differentially m6A-modified genes were mainly enriched in steroid biosynthesis, DNA replication, ribosome biogenesis in eukaryotes, PPAR, ECM-receptor interaction, lysine degradation, phosphatidylinositol, and the MAPK signaling pathway, suggesting that L. crocea responds to starvation under low-temperature stress through m6A methylation modification-mediated cell growth, proliferation, innate immunity, and the maintenance of lipid homeostasis. This study advances understanding of the physiological response mechanism exerted by m6A methylation modification in starved L. crocea at low temperatures.
Key Contribution: The results demonstrated for the first time that m6A modification is an important RNA epigenetic modification involved in normal physiology in the liver of starved large yellow croaker at low temperature.

1. Introduction

Water temperature affects almost all the life activities of aquatic organisms, including growth, development, reproduction, metabolism, behavior, and geographical distribution [1]. The ability to cope with cold stress is critical for the survival of fish. Extremely low temperatures in winter have led to the massive mortality of cultured fish, seriously affecting the economic returns of farmers [2]. Studies have shown that Nile tilapia (Oreochromis niloticus) and Chanos chanos (Chanos chanos) are highly sensitive to cold stress and that low temperatures in winter frequently lead to massive mortality [3,4]. The ability of fish to tolerate low temperatures is related to their genetics and developmental stage, and juvenile fish are more sensitive to low-temperature stress than adult fish [5]. Therefore, exploring strategies and related mechanisms to better understanding of the cold tolerance of fish is necessary.
Large yellow croaker (Larimichthys crocea [L. crocea]) is a significant marine economic fish endemic to China; in marine fish farming, aquaculture production has ranked first for several years [6]. L. crocea is a warm-temperate fish, and its optimal growth temperature range is approximately 18–25 °C. It is less tolerant to low temperatures, will not feed below 8 °C, and cannot survive for a long time when it is lower than 5 °C [7]. Suitable starvation can increase the survival rate of zebrafish (Danio rerio) under cold stress and improve cold-stress resistance [8]. In our previous study, we reported that the cold + fasting group (CF) of L. crocea had significantly higher survival than the cold group (CC) [9]. Previous studies have shown that starvation stress helps L. crocea adapt to low temperature but is likely to affect their immune system [10]. However, the molecular mechanism by which starvation improves cold tolerance in L. crocea remains unclear.
RNA modification is critical for development and regeneration and has recently attracted attention [11]. With the advancement of RNA detection technology, there have been advances in the understanding of m6A methylation modification. Methyltransferases and demethylases including mettl3, mettl14, fto, and alkbh5 dynamically and reversibly regulate m6A methylation modification. mettl3 and mettl14 are methyltransferases, and fto and alkbh5 are two demethylases [12]. These RNA modification regulators play a significant role in several cellular processes, including mRNA splicing, translation, and degradation [13], and are involved in the regulation of various biological processes, including organismal development, cellular differentiation, and stress response [11,14,15]. Studies have shown that the expression of m6A methylation modification-related enzymes changes under heat stress in sheep, demonstrating that the m6A methylation modification of RNA is involved in heat-stress regulation [16]. Furthermore, it has been shown that m6A methylation modification can regulate the UV-induced DNA damage response in humans (Homo sapiens) [17]. Starvation stress can cause changes in epigenetic modifications that regulate differences in organismal phenotypes in zebrafish [18]. Studies related to m6A RNA methylation in starved L. crocea under low temperatures have not been reported. Therefore, this study aimed to investigate the expression pattern and biological role of m6A modification in starved and low-temperature exposed L. crocea using MeRIP-seq and RNA-seq techniques to understand the physiological response mechanism of L. crocea. The results of this study will provide a theoretical basis for enhancing the response mechanism of L. crocea to starvation stress at low temperatures.

2. Materials and Methods

2.1. Ethics Statement

All procedures for treating L. crocea were approved according to the relevant guidelines and regulations of the Committee for Laboratory Animal Research at the East China Sea Fisheries Research Institute of the Chinese Academy of Fisheries Sciences.

2.2. Animals and Sample Collection

The experimental juvenile L. crocea (mean body weight, 21.38 ± 2.46 g) were obtained from Fujian Fuding Research Center, East China Sea Fisheries Research Institute, Chinese Academy of Fisheries Sciences. The fish were temporarily reared in six tempered glass buckets with a 600 L volume for 2 weeks (30 fish/bucket). During the temporary rearing period, commercial feed was fed twice daily (08:00 and 16:00), and the residual feed was removed 1 h after feeding. The following were the mean water quality parameters: water temperature, 20 °C ± 0.42 °C; salinity, 24.78 ± 0.37; pH, 7.29 ± 0.34; dissolved oxygen, 7.31 ± 0.42 mg/L; and total ammonia nitrogen, 0.14 ± 0.02–0.19 ± 0.03 mg/L. At the end of the temporary rearing, the water temperature in the six buckets was reduced from 20 °C to 8 °C at a rate of 1.5 °C/day. To stop feeding, three buckets were randomly taken among the six buckets. At this time, the experimental fish were divided into a cold (CC) group and a cold + fasting (CF) group, with three replicates for each treatment group. Following 30-day cold exposure, the liver of one fish from each group was used for MeRIP-seq and RNA-seq.

2.3. qRT–PCR Analysis

methyltransferase-like 3 (mettl3), methyltransferase-like 14 (mettl14), fat mass and obesity-associated protein (fto), and alk b homolog 5 (alkbh5), which are genes related to m6A methylation modification regulation, were selected for real-time PCR. Total liver RNA was extracted using a TRIzol kit (Invitrogen, Carlsbad, CA, USA), and high-quality RNA was synthesized using a first-strand cDNA synthesis kit (Fermentas, Carlsbad, CA, USA). Real-time PCR primers were designed using Primer Premier 6.0 (Premier Biosoft International, Carlsbad, CA, USA) on the basis of the gene sequences in the L. crocea genome database (Table 1). A 2 × QuantiFast SYBRGreen Master Mix kit (Roche, Leverkusen, Germany) was used to perform qRT–PCR on a fluorescence quantitative PCR instrument (Applied Biosystems Prism 7500 Sequence Detection System, Foster City, CA, USA). Three biological and three technical replicates were performed for each gene in each individual using β-actin as the internal reference gene. The 2−ΔΔCt method was used to statistically analyze the expression levels of the target genes. One-way analysis of variance (ANOVA) (p < 0.05) was performed using Statistical Package for the Social Sciences (SPSS version 25, IBM, Armonk, NY, USA).

2.4. Total RNA Extraction, cDNA Library Construction, and Sequencing

Total RNA was extracted and assayed for quality using TRIzol reagent (Invitrogen) from liver samples of one fish from each of the CC and CF groups. Experiments were performed using 32 μg total RNA, and the fragmented mRNA was enriched with magnetic beads bearing anti-m6A, an antibody that captures mRNA fragments containing m6A methylation. Additionally, fragmented RNA was diluted 1:9 as the input control. Using the input data from MeRIP-seq, transcriptome analysis was performed. High-throughput sequencing was performed using the NovaSeq 6000 (Illumina, San Diego, CA, USA) platform.

2.5. MeRIP-seq Data Analysis

Splice removal and quality control were performed on raw data. FastQC [19] was used to analyze the quality of sequencing data to obtain information on the sequencing quality distribution, base content distribution, and proportion of duplicated sequencing fragments. HISAT2 software [20] was used to compare the filtered clean reads with the reference genomes to obtain unique-mapped reads for the next step of analysis (GCF_000972845.2). The enrichment of clean reads on the genome was determined using macs software [21], which is the classic ChIP-seq analysis software that can be used for Peak Calling for MeRIP-seq after some post-processing. Peak annotation analysis was performed after obtaining the peaks; subsequently, the peaks were analyzed for their location on the gene structure and overall distributional features. Motif analysis of the peaks was performed using DREME software [22] (https://meme-suite.org/meme/doc/dreme.html, accessed on 20 May 2023). The circlize package in the R software [23] (http://circos.ca/, accessed on 21 May 2023) was used for mapping the distribution of differential peaks across the genome. Moreover, the selected genes were visualized using integrated genomics viewer (IGV 2.17.0) software [24] (UC San Diego and the Broad Institute of MIT and Harvard, CA, USA) (http://software.broadinstitute.org/software/igv/, accessed on 22 May 2023).
Gene Ontology (GO) classification was applied to describe the function of genes, categorizing them into the following three main groups: biological process (BP), molecular function (MF), and cellular component (CC). The m6A differentially modified genes obtained from the analysis were based on the GO annotations from the database from the three levels of BP, MF, and CC, respectively. To calculate the significance level (p-value) of each GO, Fisher’s test was used and significant GO was associated with a p-value of <0.05. The top 20 terms were selected to draw the histogram [25]. The differential modified m6A genes were annotated on the basis of the Kyoto Encyclopedia of Genes and Genomes (KEGG) database [26]; the significance level (p-value) of the pathway was calculated using Fisher’s test, and the significant pathway term for m6A gene enrichment was screened at a p-value of <0.05. To draw the enrichment circle diagram, the top 10 upregulated and downregulated pathways and their associated gene names were selected.

2.6. RNA-seq Data Analysis

Gene expression values were normalized by RNA sequencing using Reads Per Kilo Base Million Reads. The DEseq algorithm [27] (http://bioconductor.org/packages/release/bioc/html/DESeq.html, accessed on 6 June 2023) was used for the differential screening of fragments with log2fold-Change >1 or <−1.

2.7. MeRIP-seq and RNA-seq Association Analysis

Plots were made using the annotation results of all peaks used for differential computation by MeRIP-seq and the differential analysis results of all genes by RNA-seq. log2FC was used as a variable in RNA-seq for the horizontal coordinate, and log10FC columns were used as a variable in MeRIP-seq for the vertical coordinate. The screening criteria considered only log2FC and log10FC values and did not consider the p-value from the two sequences. Where the criterion for RNA-seq was |log2FC| > 1, the screening criterion for MeRIP-seq was |log10FC| > 1. Four-quadrant plots show mRNA with differential m6A modification levels in the liver of L. crocea and their mRNA expression distribution. The following are the four types: the upper-left quadrant represents hypermethylated-down (hypermethylated-RNA level downregulation), the upper-right quadrant represents hypermethylated-up (hypermethylated-RNA level upregulation), the lower-left quadrant represents hypomethylated-down (demethylated-RNA level downregulation), and the lower-right quadrant represents hypomethylated-up (demethylated-RNA level upregulation). The number of transcripts in each quadrant was recorded.

2.8. Statistical Analysis

SPSS 25 software and Excel 2019 were used for statistical analysis, and one-way ANOVA was performed for comparison between groups. The results were expressed as means ± standard deviations, with p < 0.05 indicating a statistically significant difference.

3. Results

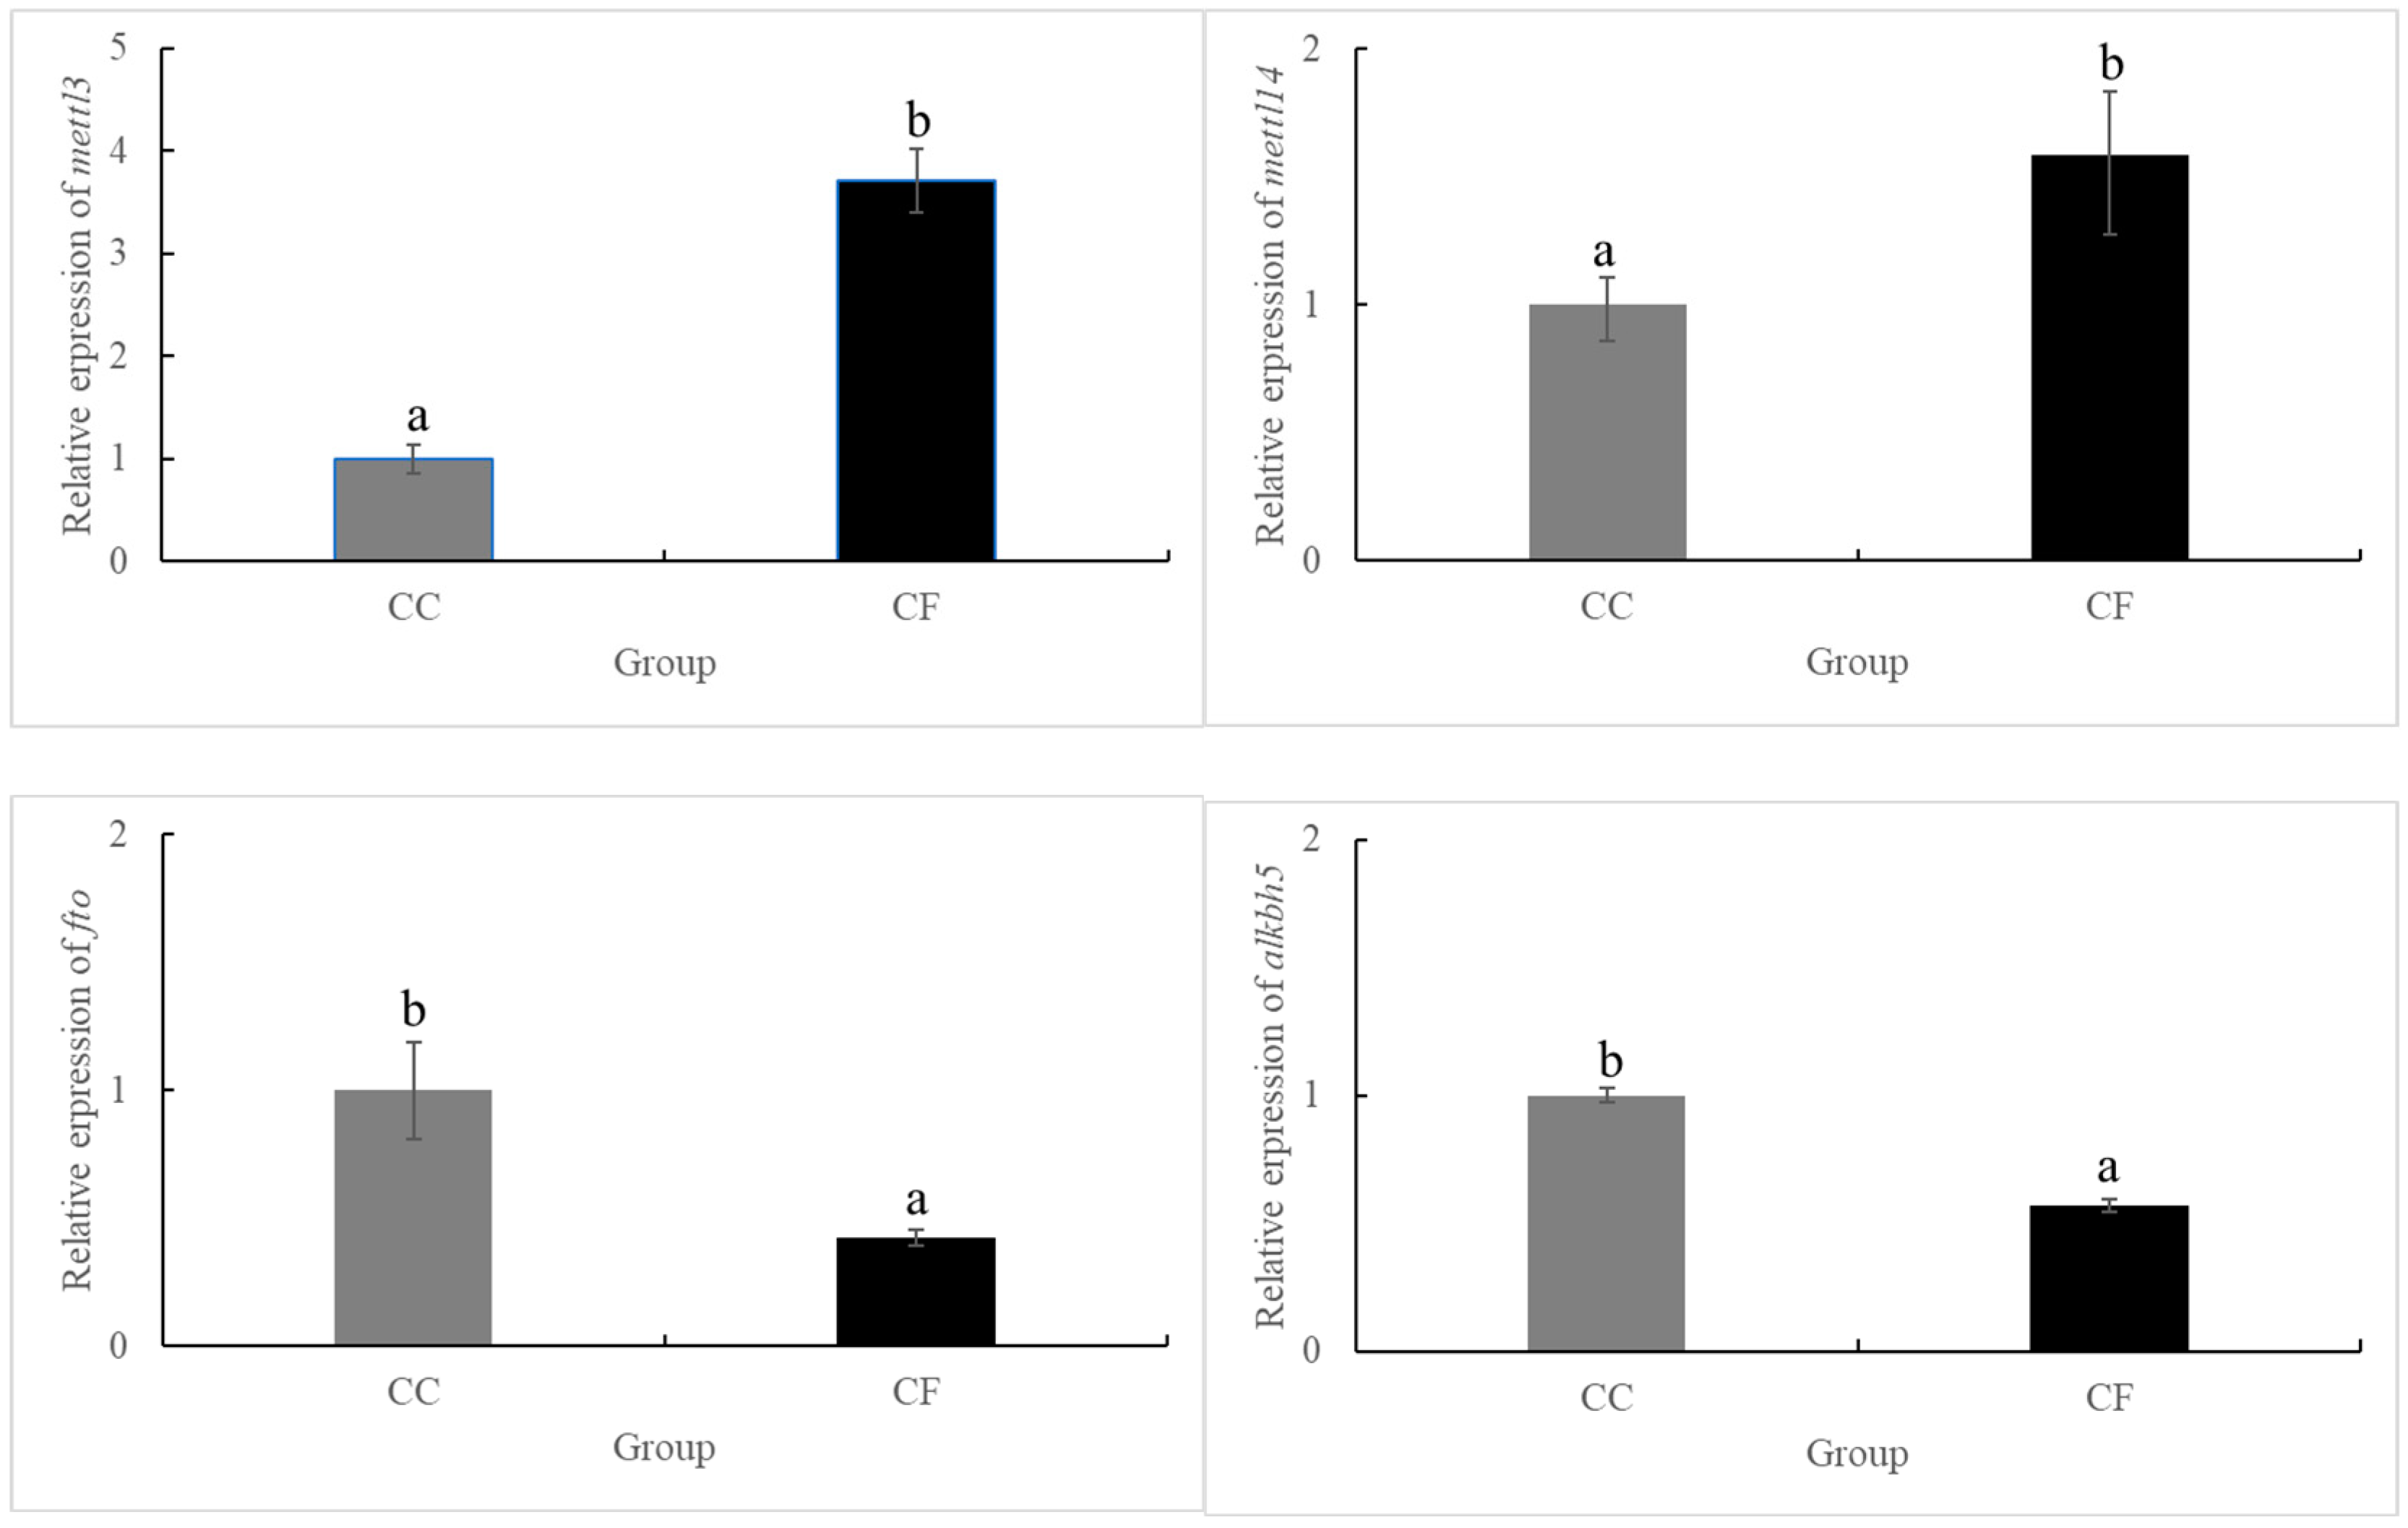
3.1. Starvation at Low Temperatures Enhanced the Expression of Genes Related to the Modification of m6A RNA Methylation

We first measured the expression of genes related to m6A modification by fluorescence quantitative PCR to explore whether m6A epigenetic modification is involved in the process of starvation mediating the enhancement of cold tolerance in L. crocea. The results (Figure 1, Table S1) showed that the expression of RNA methyltransferases mettl3 and mettl14 was upregulated in the CF group compared with that in the CC group (p < 0.05), whereas the expression of demethylases fto and alkbh5 was downregulated (p < 0.05). These results suggest that m6A RNA methylation modifications can be altered by starvation at low temperatures. Therefore, the MeRIP-seq technique was used for obtaining a specific modification landscape.

3.2. Statistics and Quality Assessment of MeRIP-seq

We determined the m6A data and the corresponding input data for two sets of liver samples using the MeRIP-seq technology. The results (Table 2) showed that for the immunoprecipitation library, approximately 4.30–4.77 × 10⁷ raw reads were obtained; for the input library, approximately 7.71–9.09 × 10⁷ raw reads were obtained. The Q30 values were all above 90.96%, indicating that the sequencing results are reliable and can be used for subsequent analysis. After filtering the raw reads, the clean reads obtained were more than 4.30 × 10⁷, which were all above 97.83% of the raw reads. The valid data were compared with the L. crocea genome sequence; it was noted that the number of mapped reads was between approximately 2.71 and 6.55 × 10⁷.

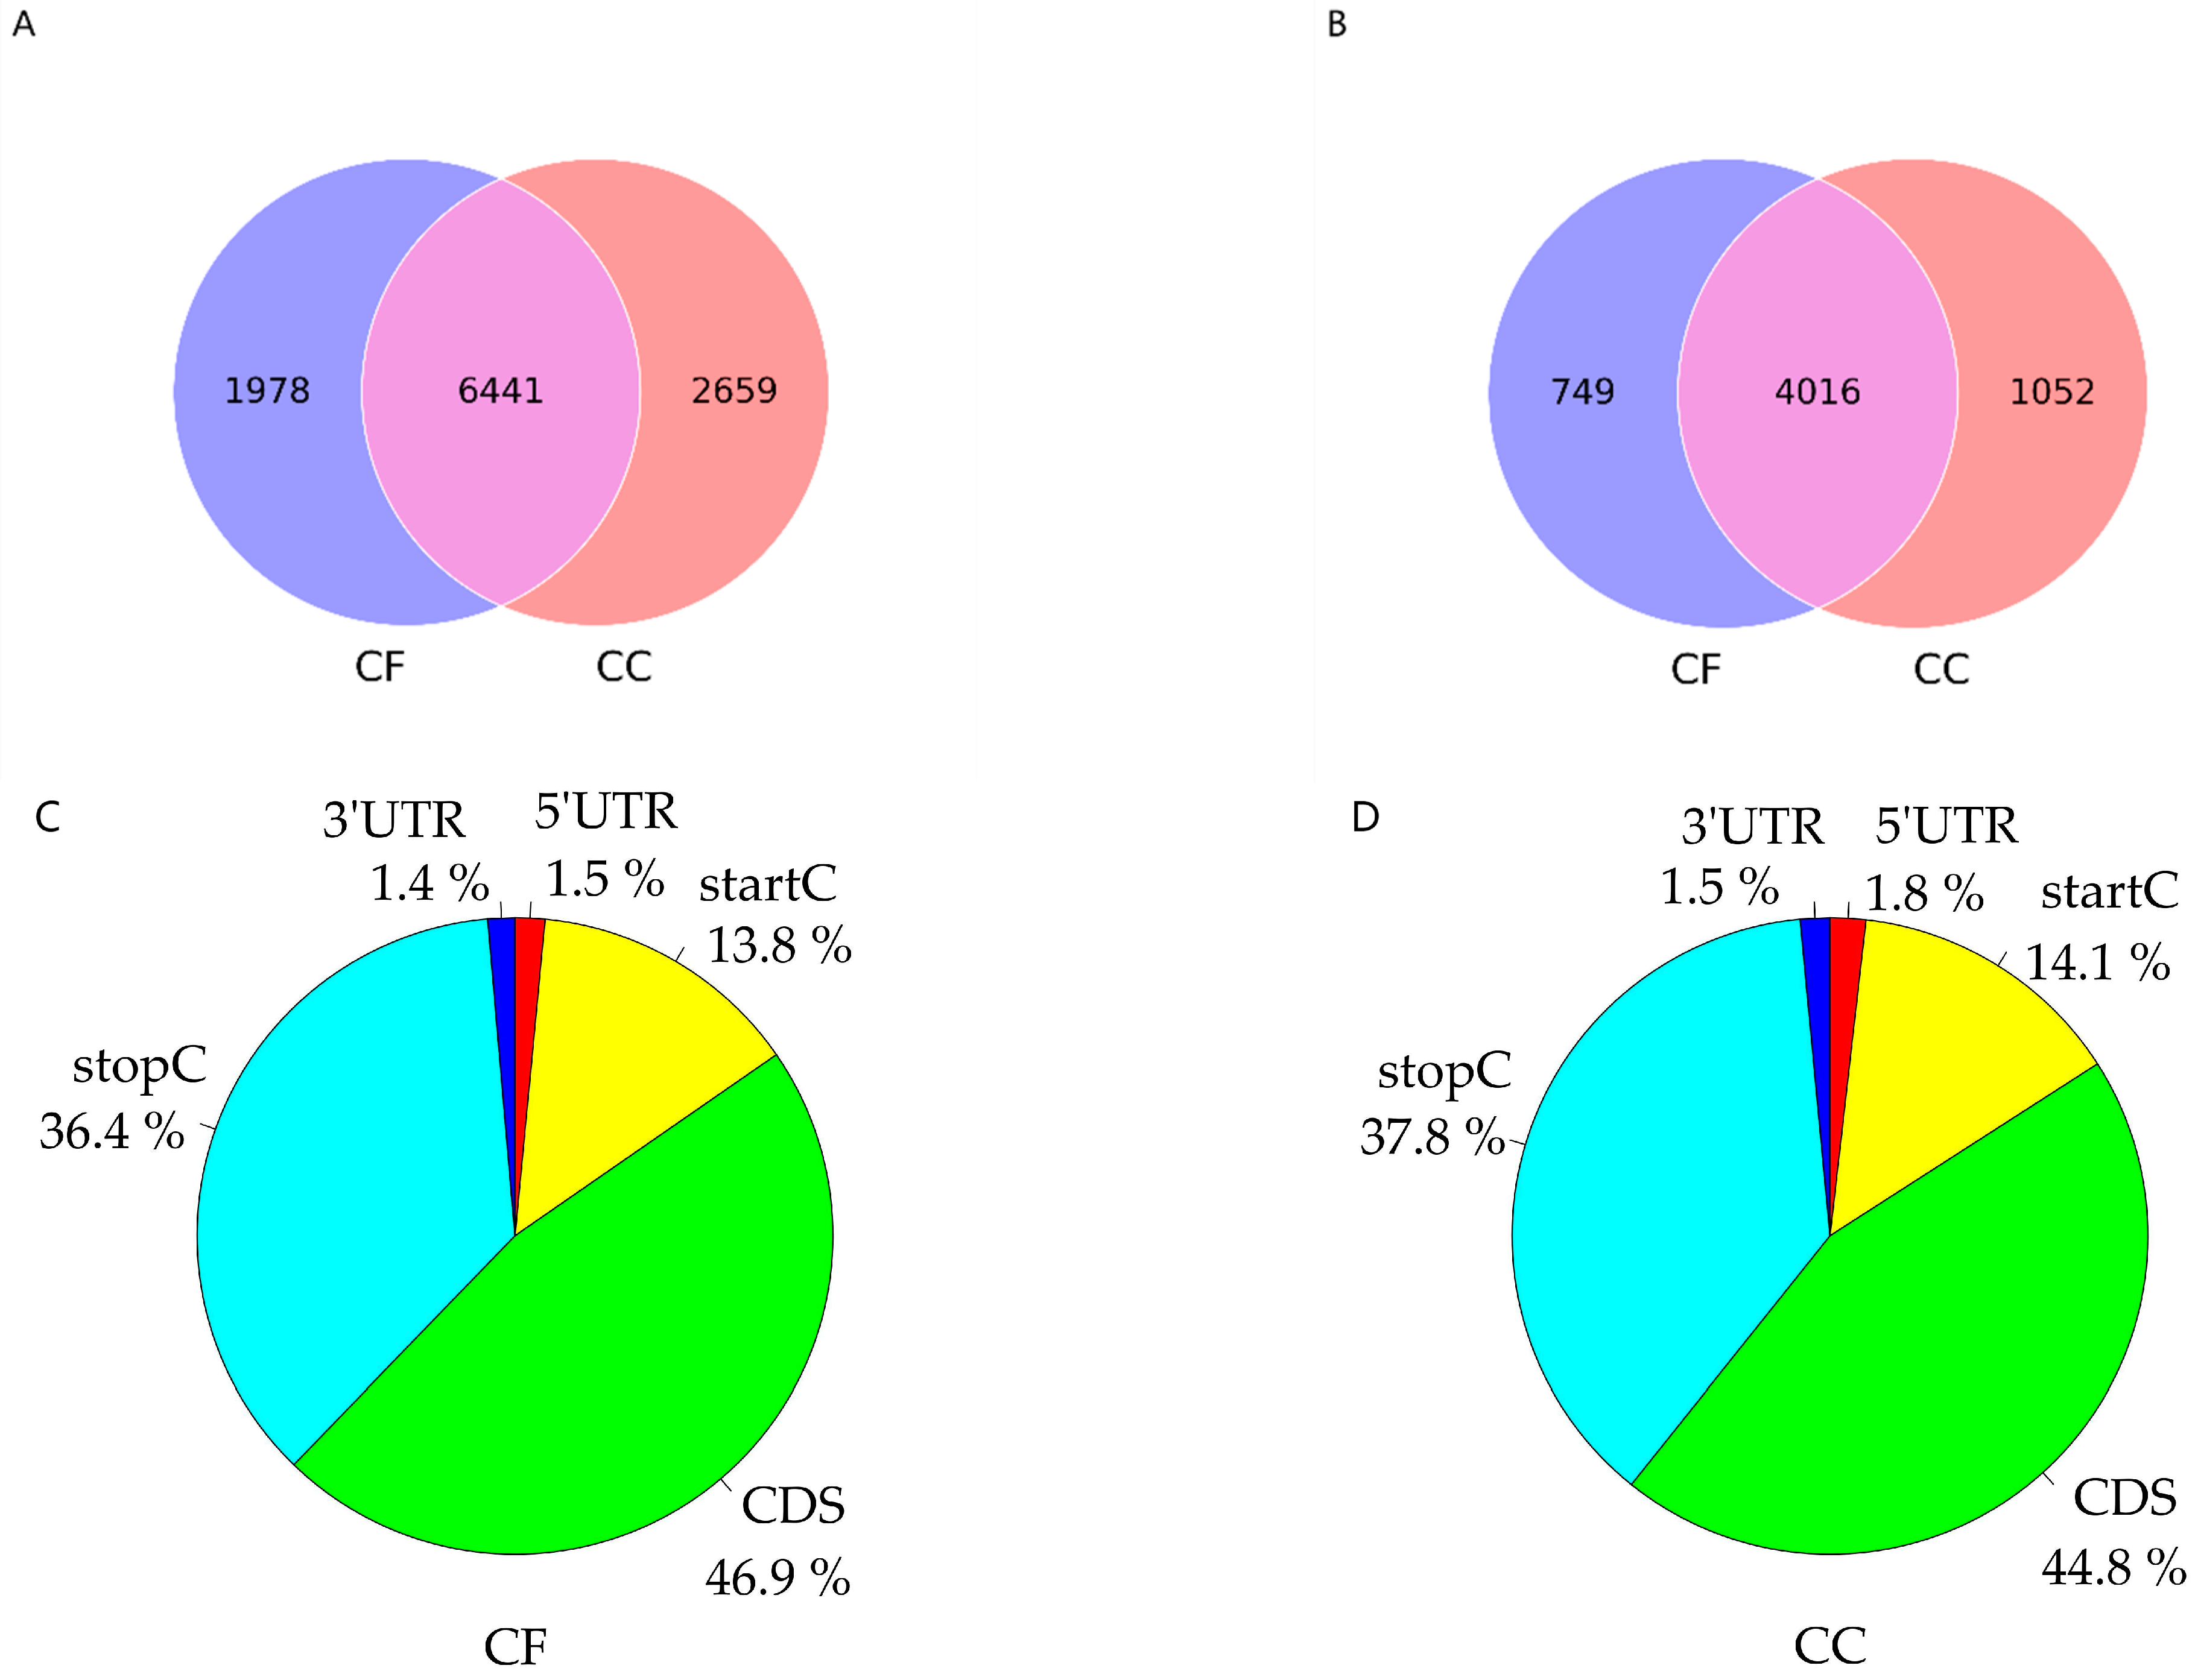
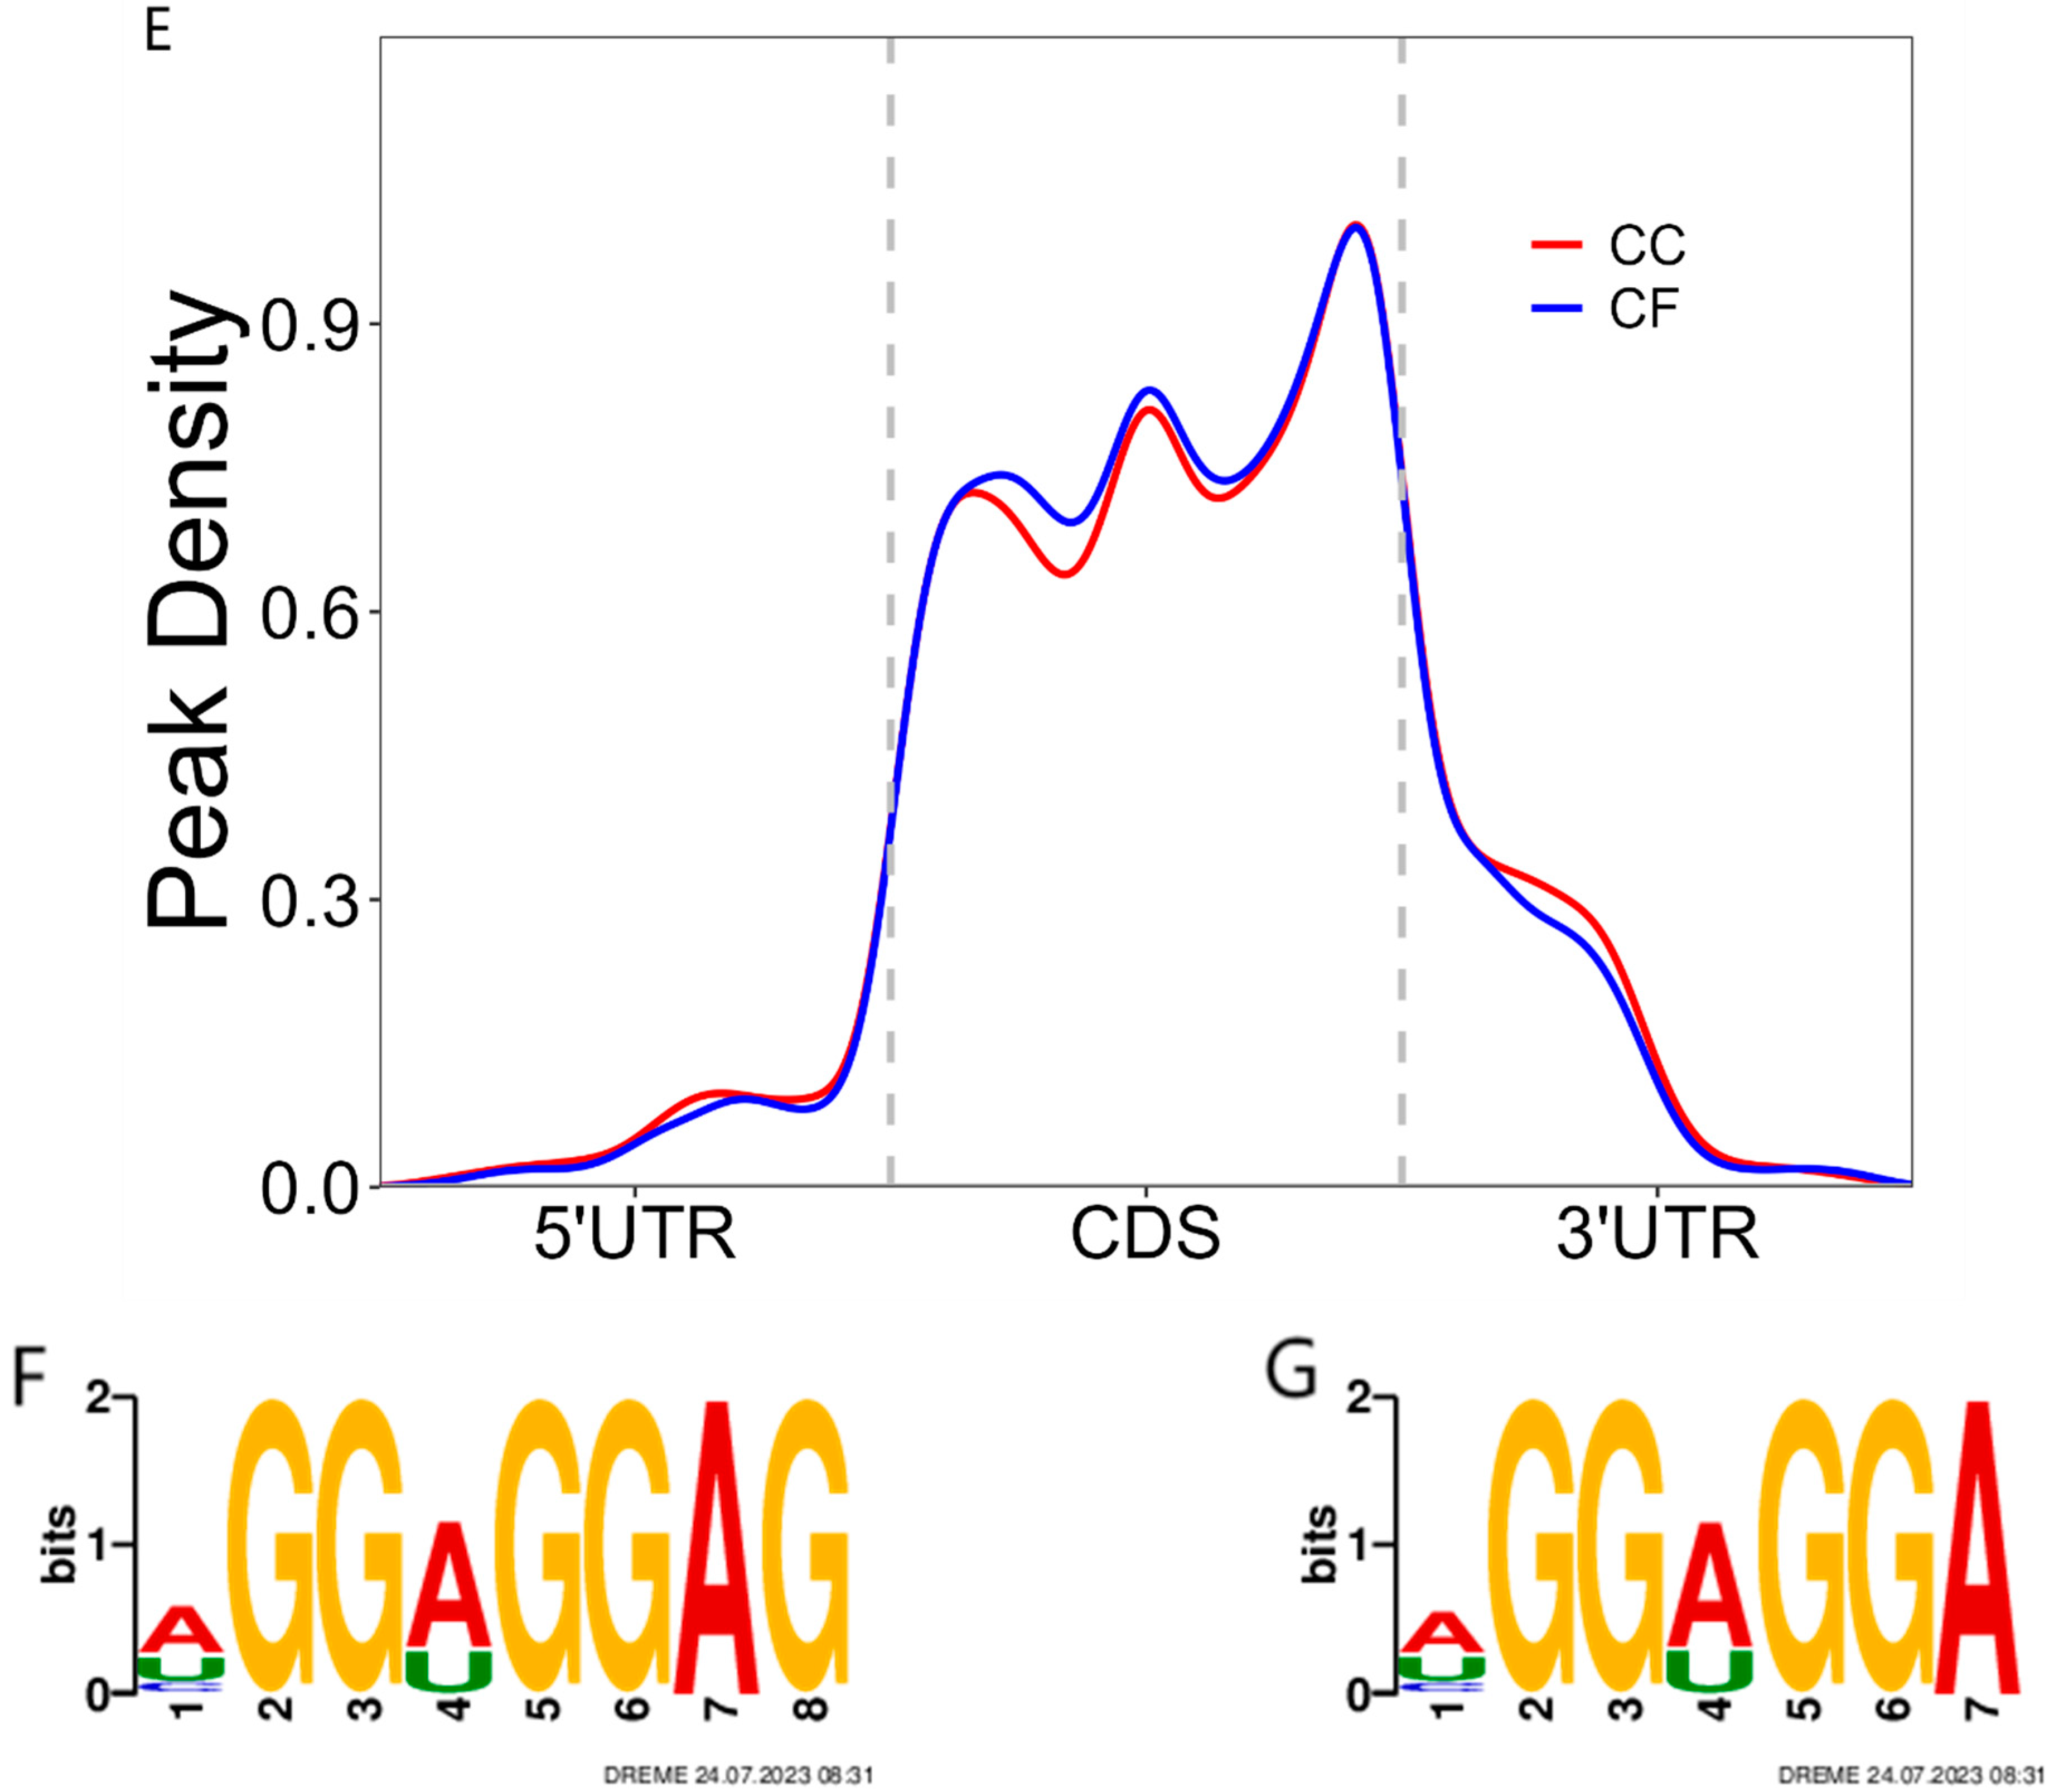
3.3. The Identification of the m6A Peak and Motif Analysis

As shown in Figure 2A,B (Table S2), 8419 and 9100 m6A peaks were screened in the CF and CC groups, corresponding to 4765 and 5068 genes, respectively, and 6441 (4016 genes) m6A peaks were the same in the two groups, accounting for more than 70% of all transcripts. The distribution of the m6A peak in different gene functional elements was analyzed, and the results are shown in Figure 2C,D. The m6A peaks in the CF and CC groups were mainly distributed in the protein-encoding (CDS) region, the start codon, and the stop codon region, with less distribution in the 5′-UTR and 3′-UTR regions. As can be observed in Figure 2E, the peak density in the CF and CC groups is significantly higher in the CDS region, near the start codon, and near the stop codon than in the 5′UTR and 3′UTR regions, verifying that the m6A peak is mainly distributed in these regions in both groups. An analysis of the motif features of m6A modifications in the CF and CC groups (Figure 2F,G) showed that the most significant m6A motif sequence in both groups comprised GGAGG.

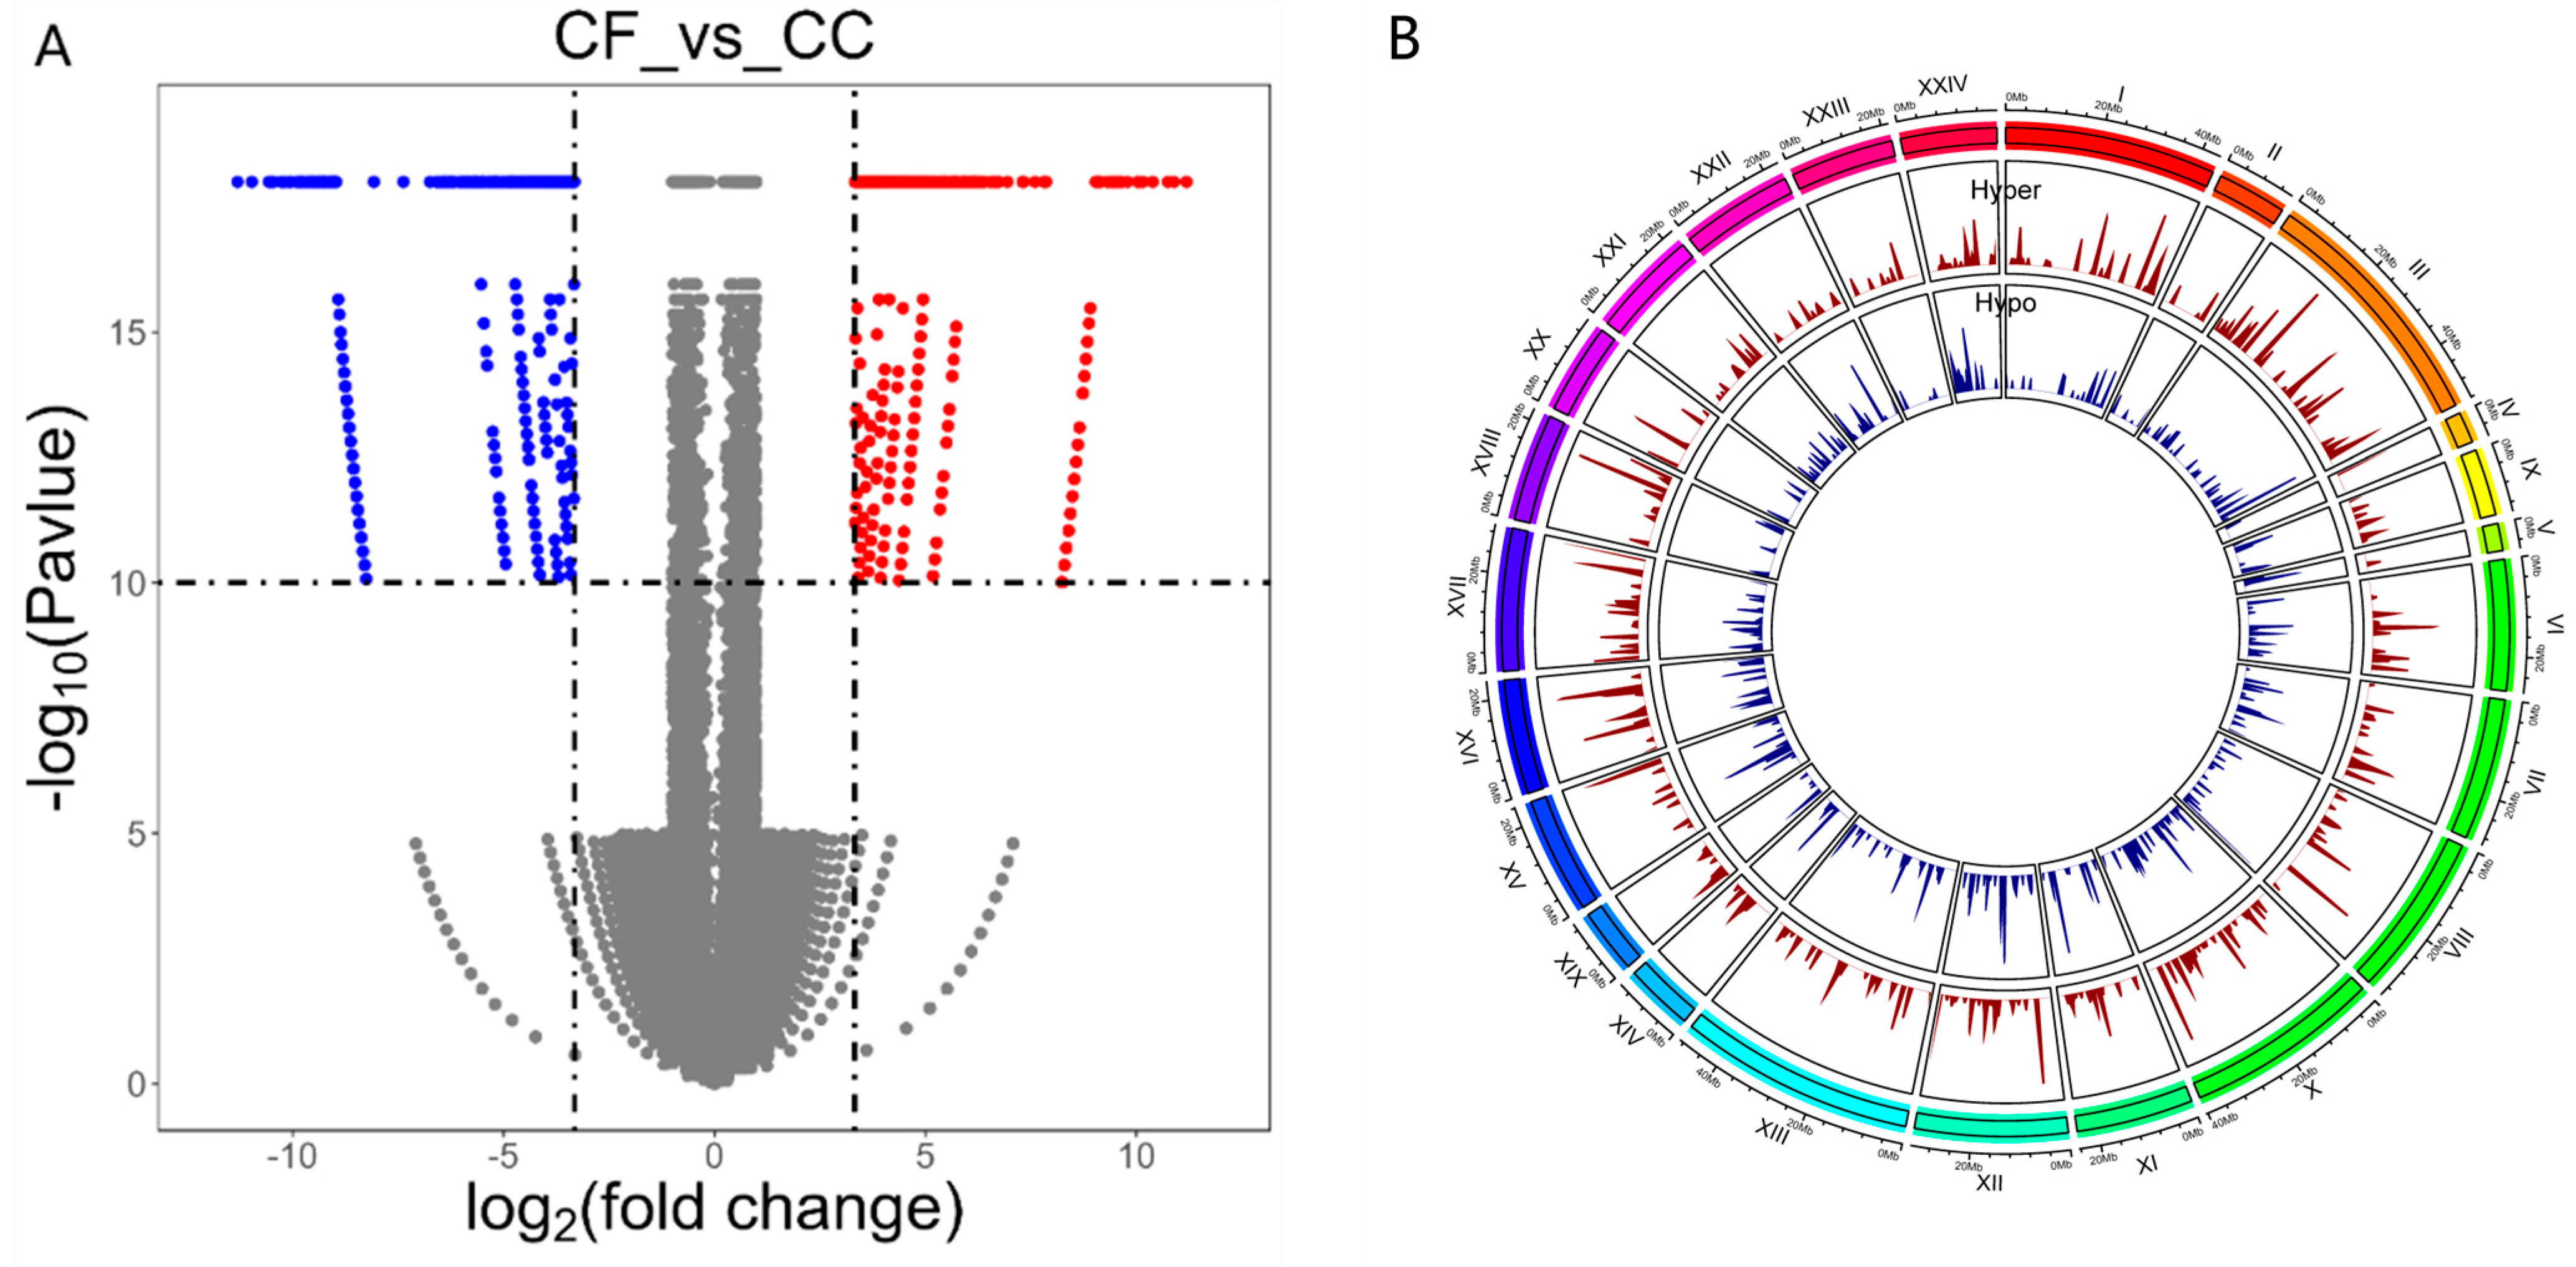
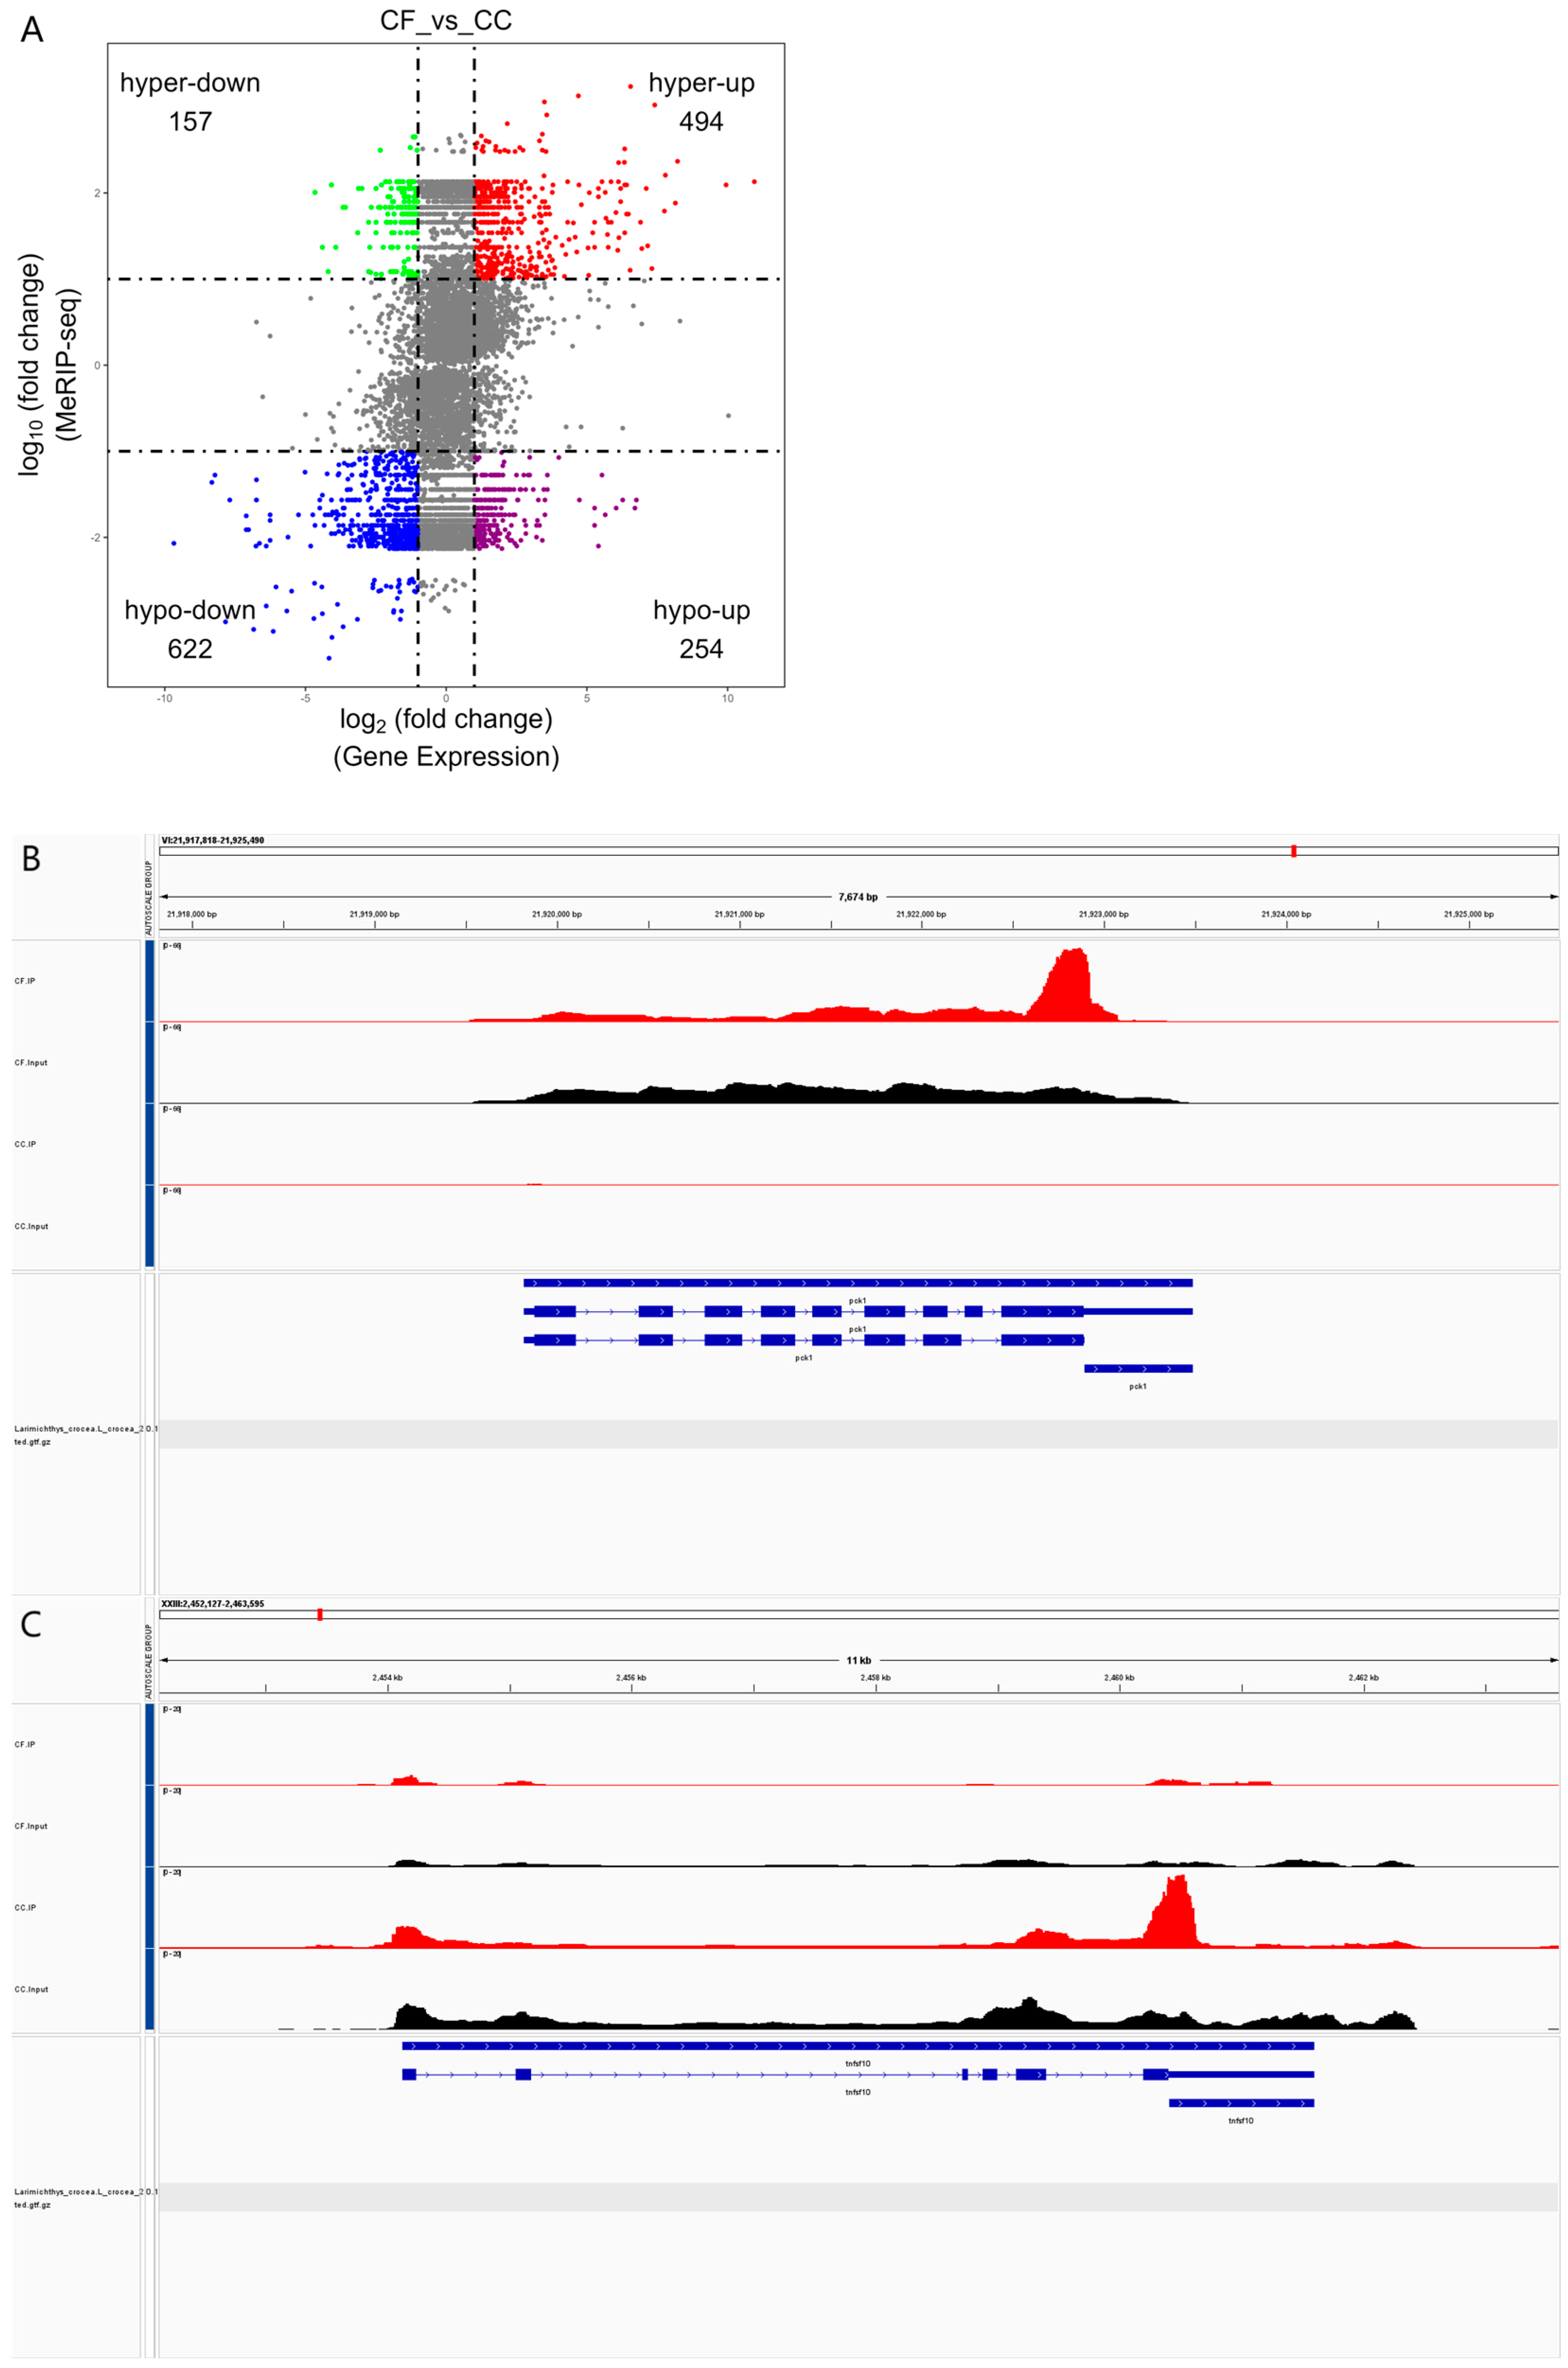
3.4. Difference in m6A Peak Analysis

Overall, 919 transcripts with differentially methylated sites (peaks) were observed among the CF and CC groups, corresponding to 765 genes (Figure 3A, Table S3), of which 442 and 477 peaks were significantly upregulated and downregulated (Fold Change > 10 and p < 0.05), respectively, corresponding to 358 and 407 genes (p < 0.05). Differential peaks were distributed on every chromosome, particularly on chromosomes 3, 10, 12, and 13 (Figure 3B).

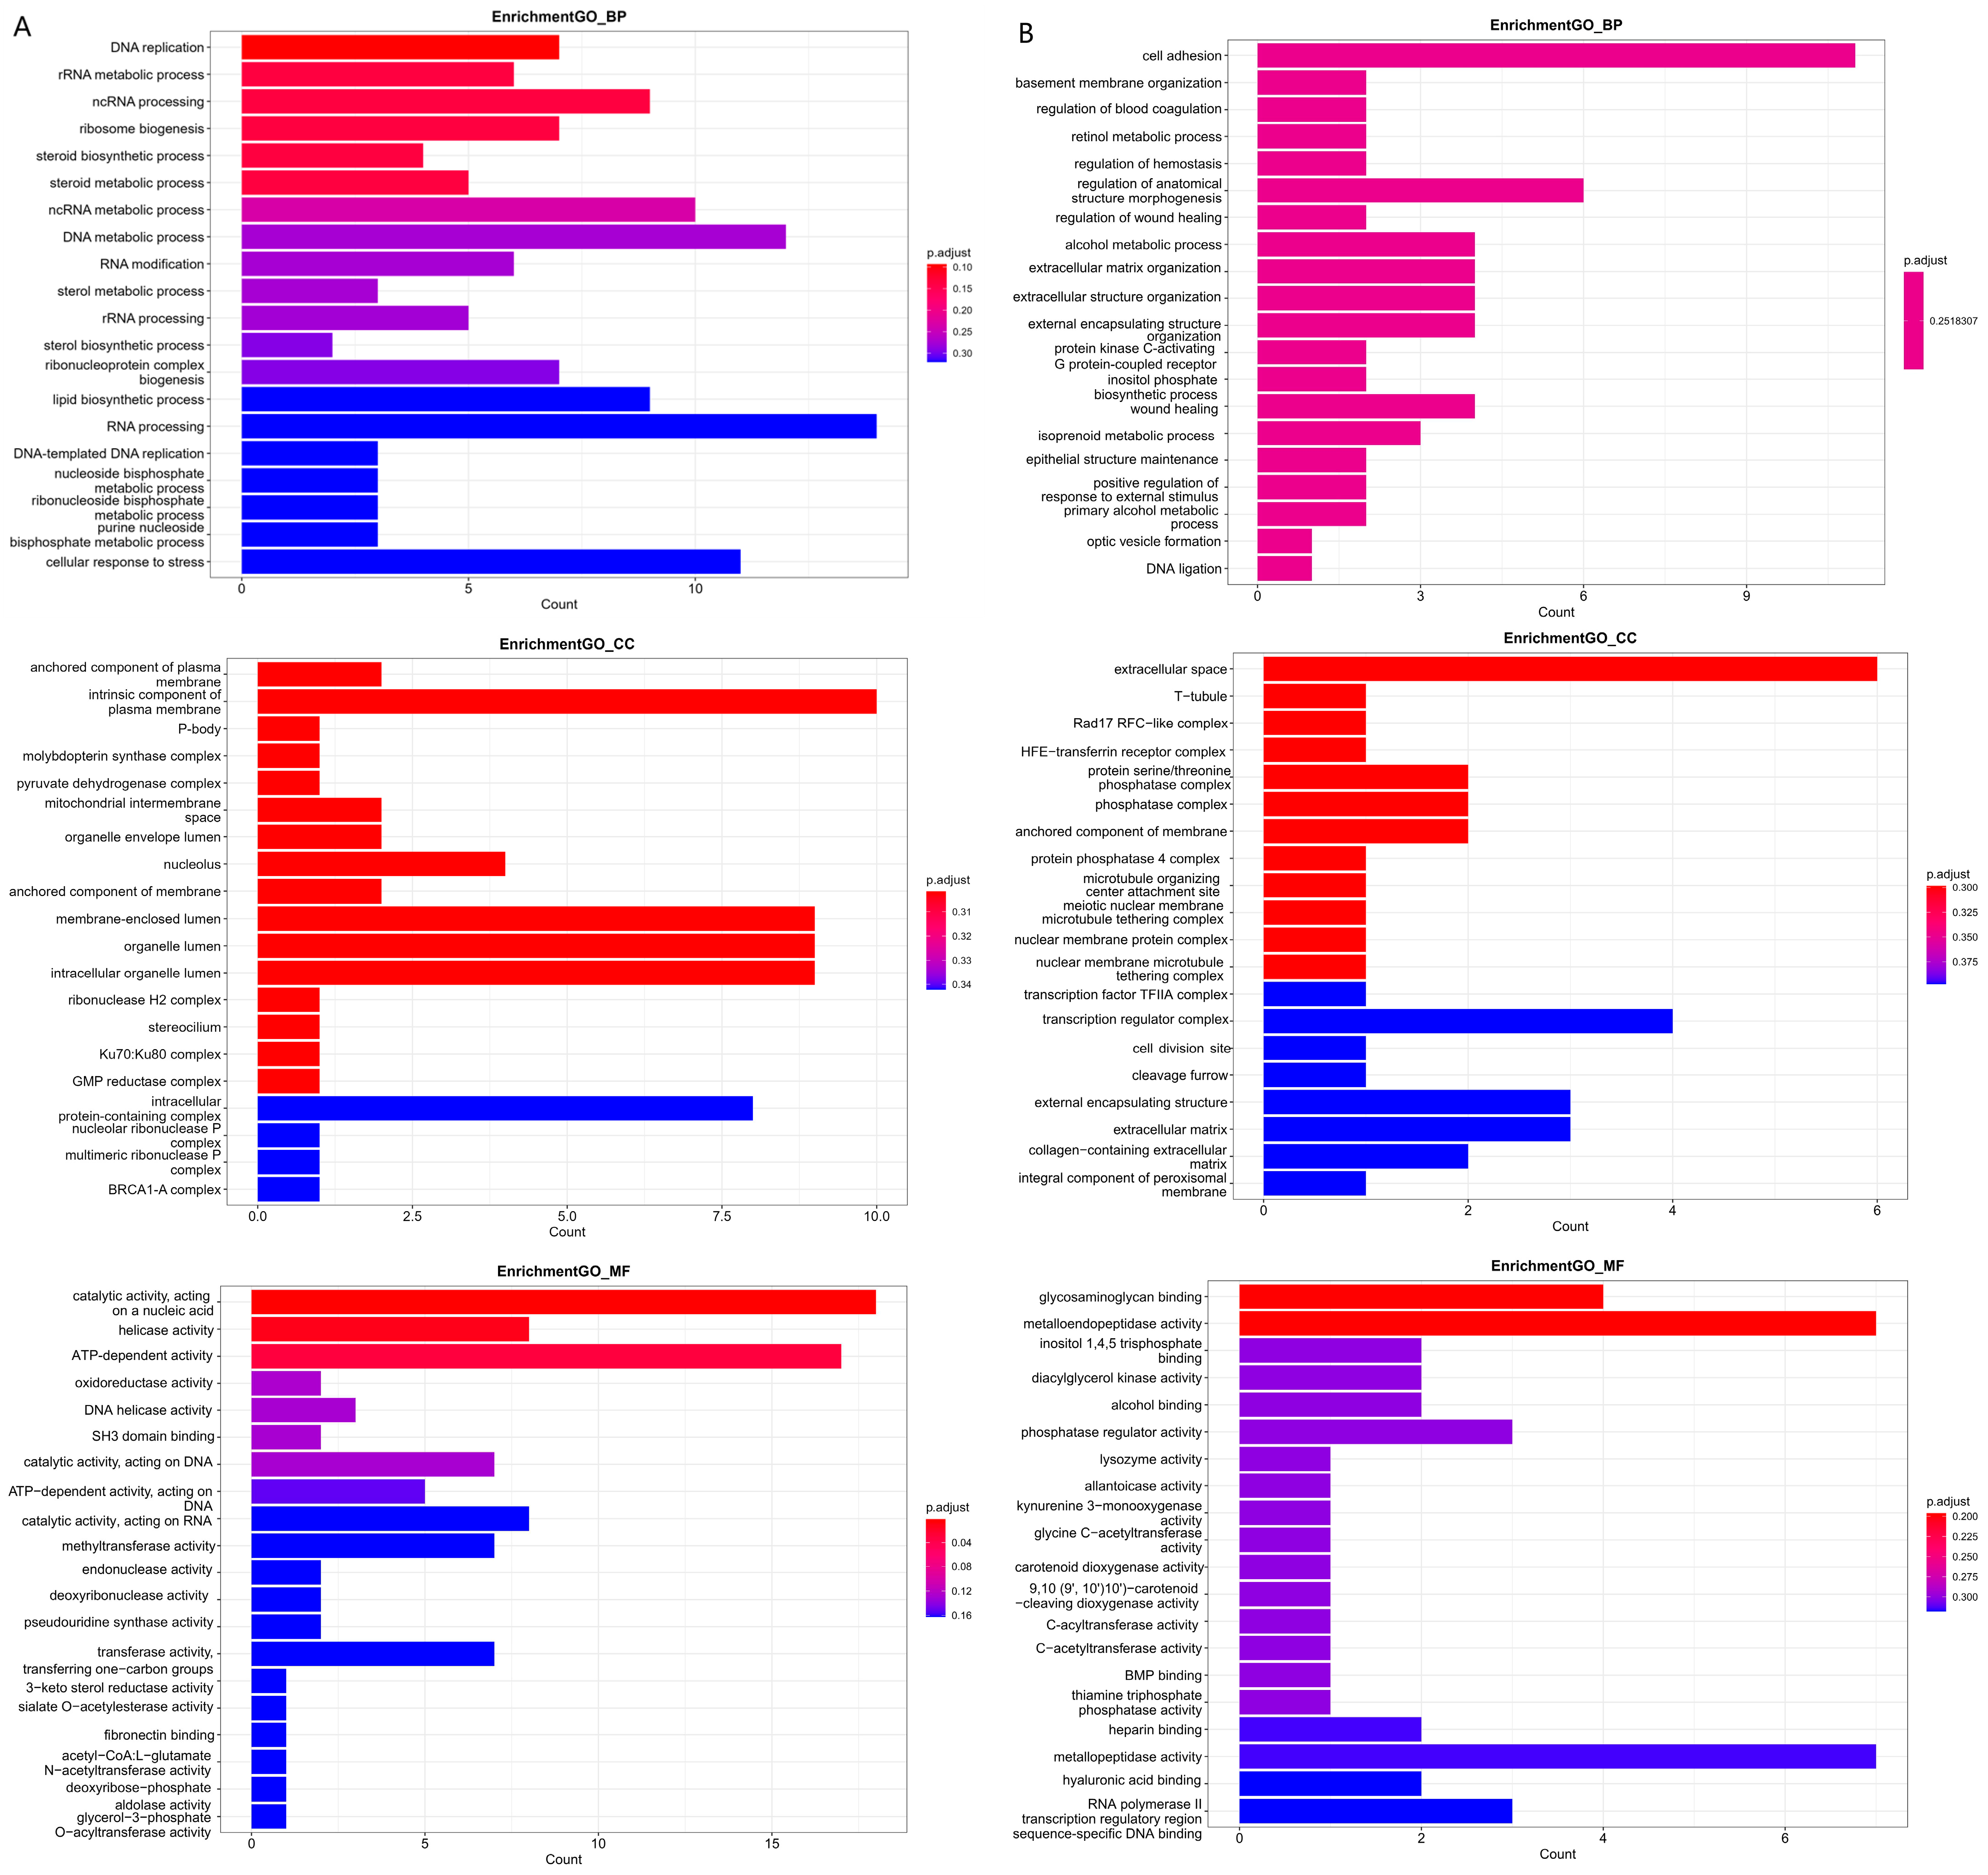
3.5. Differential m6A Methylation Gene GO Analysis

We performed functional enrichment analysis on all differential m6A modification genes from the BP, CC, and MF GO ontology functional groups to reveal further m6A modification epitranscriptomic information. The GO enrichment results (Table S4) showed that 358 significantly upregulated m6A modifier genes were significantly enriched in 300 GO entries (p < 0.05), including 128 BP, 97 CC, and 75 MF entries. Significantly upregulated m6A modifier genes were significantly enriched for DNA replication, rRNA metabolic process, and ncRNA processing in the BP category; the anchored component of the plasma membrane, the intrinsic component of the plasma membrane, and P-body in the CC category; and catalytic activity, acting on a nucleic acid, helicase activity, and ATP-dependent activity in the MF category (Figure 4A). A total of 407 significantly downregulated m6A-modified genes (Table S5) were significantly enriched in 248 GO entries (p < 0.05), including 130 BP entries, 74 CC entries, and 44 MF entries. Significantly downregulated m6A modifier genes were mainly enriched in the BP category, including cell adhesion, basement membrane organization, and blood coagulation regulation; extracellular space, T-tubules, and a Rad17 RFC-like complex in the CC category; and glycosaminoglycan binding, metalloendopeptidase activity, and inositol 1,4,5 trisphosphate binding in the MF category (Figure 4B).

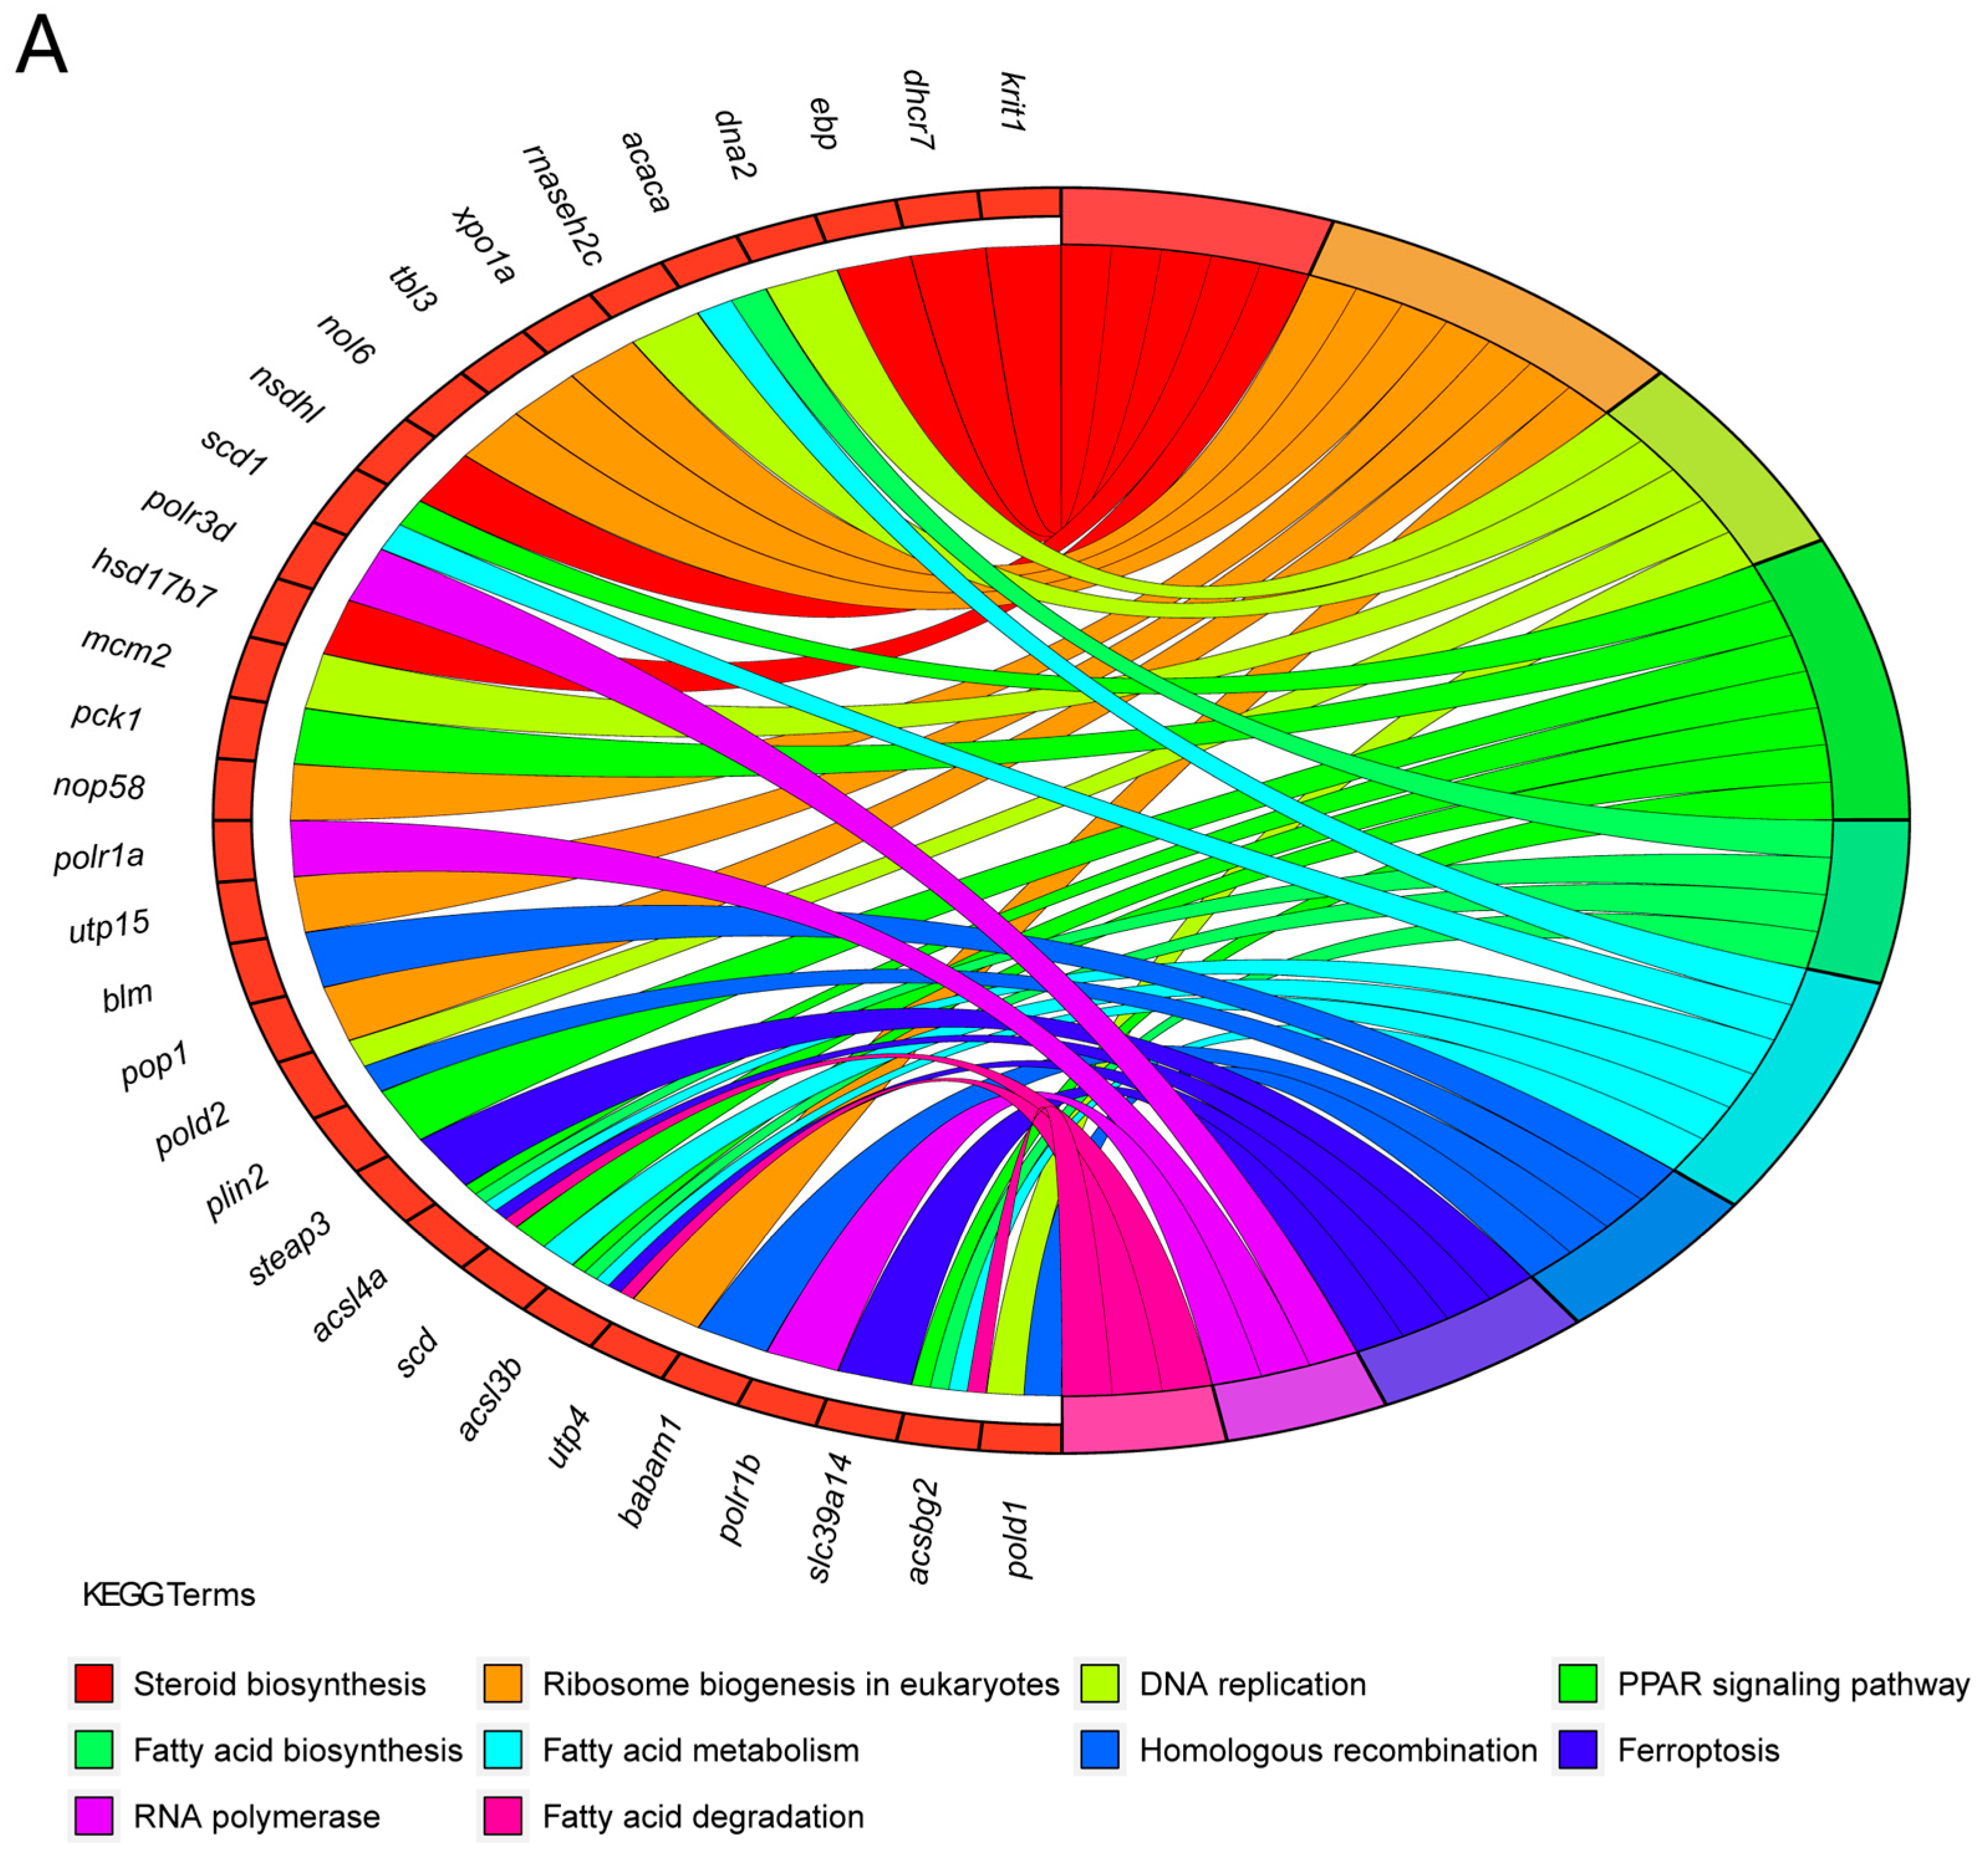
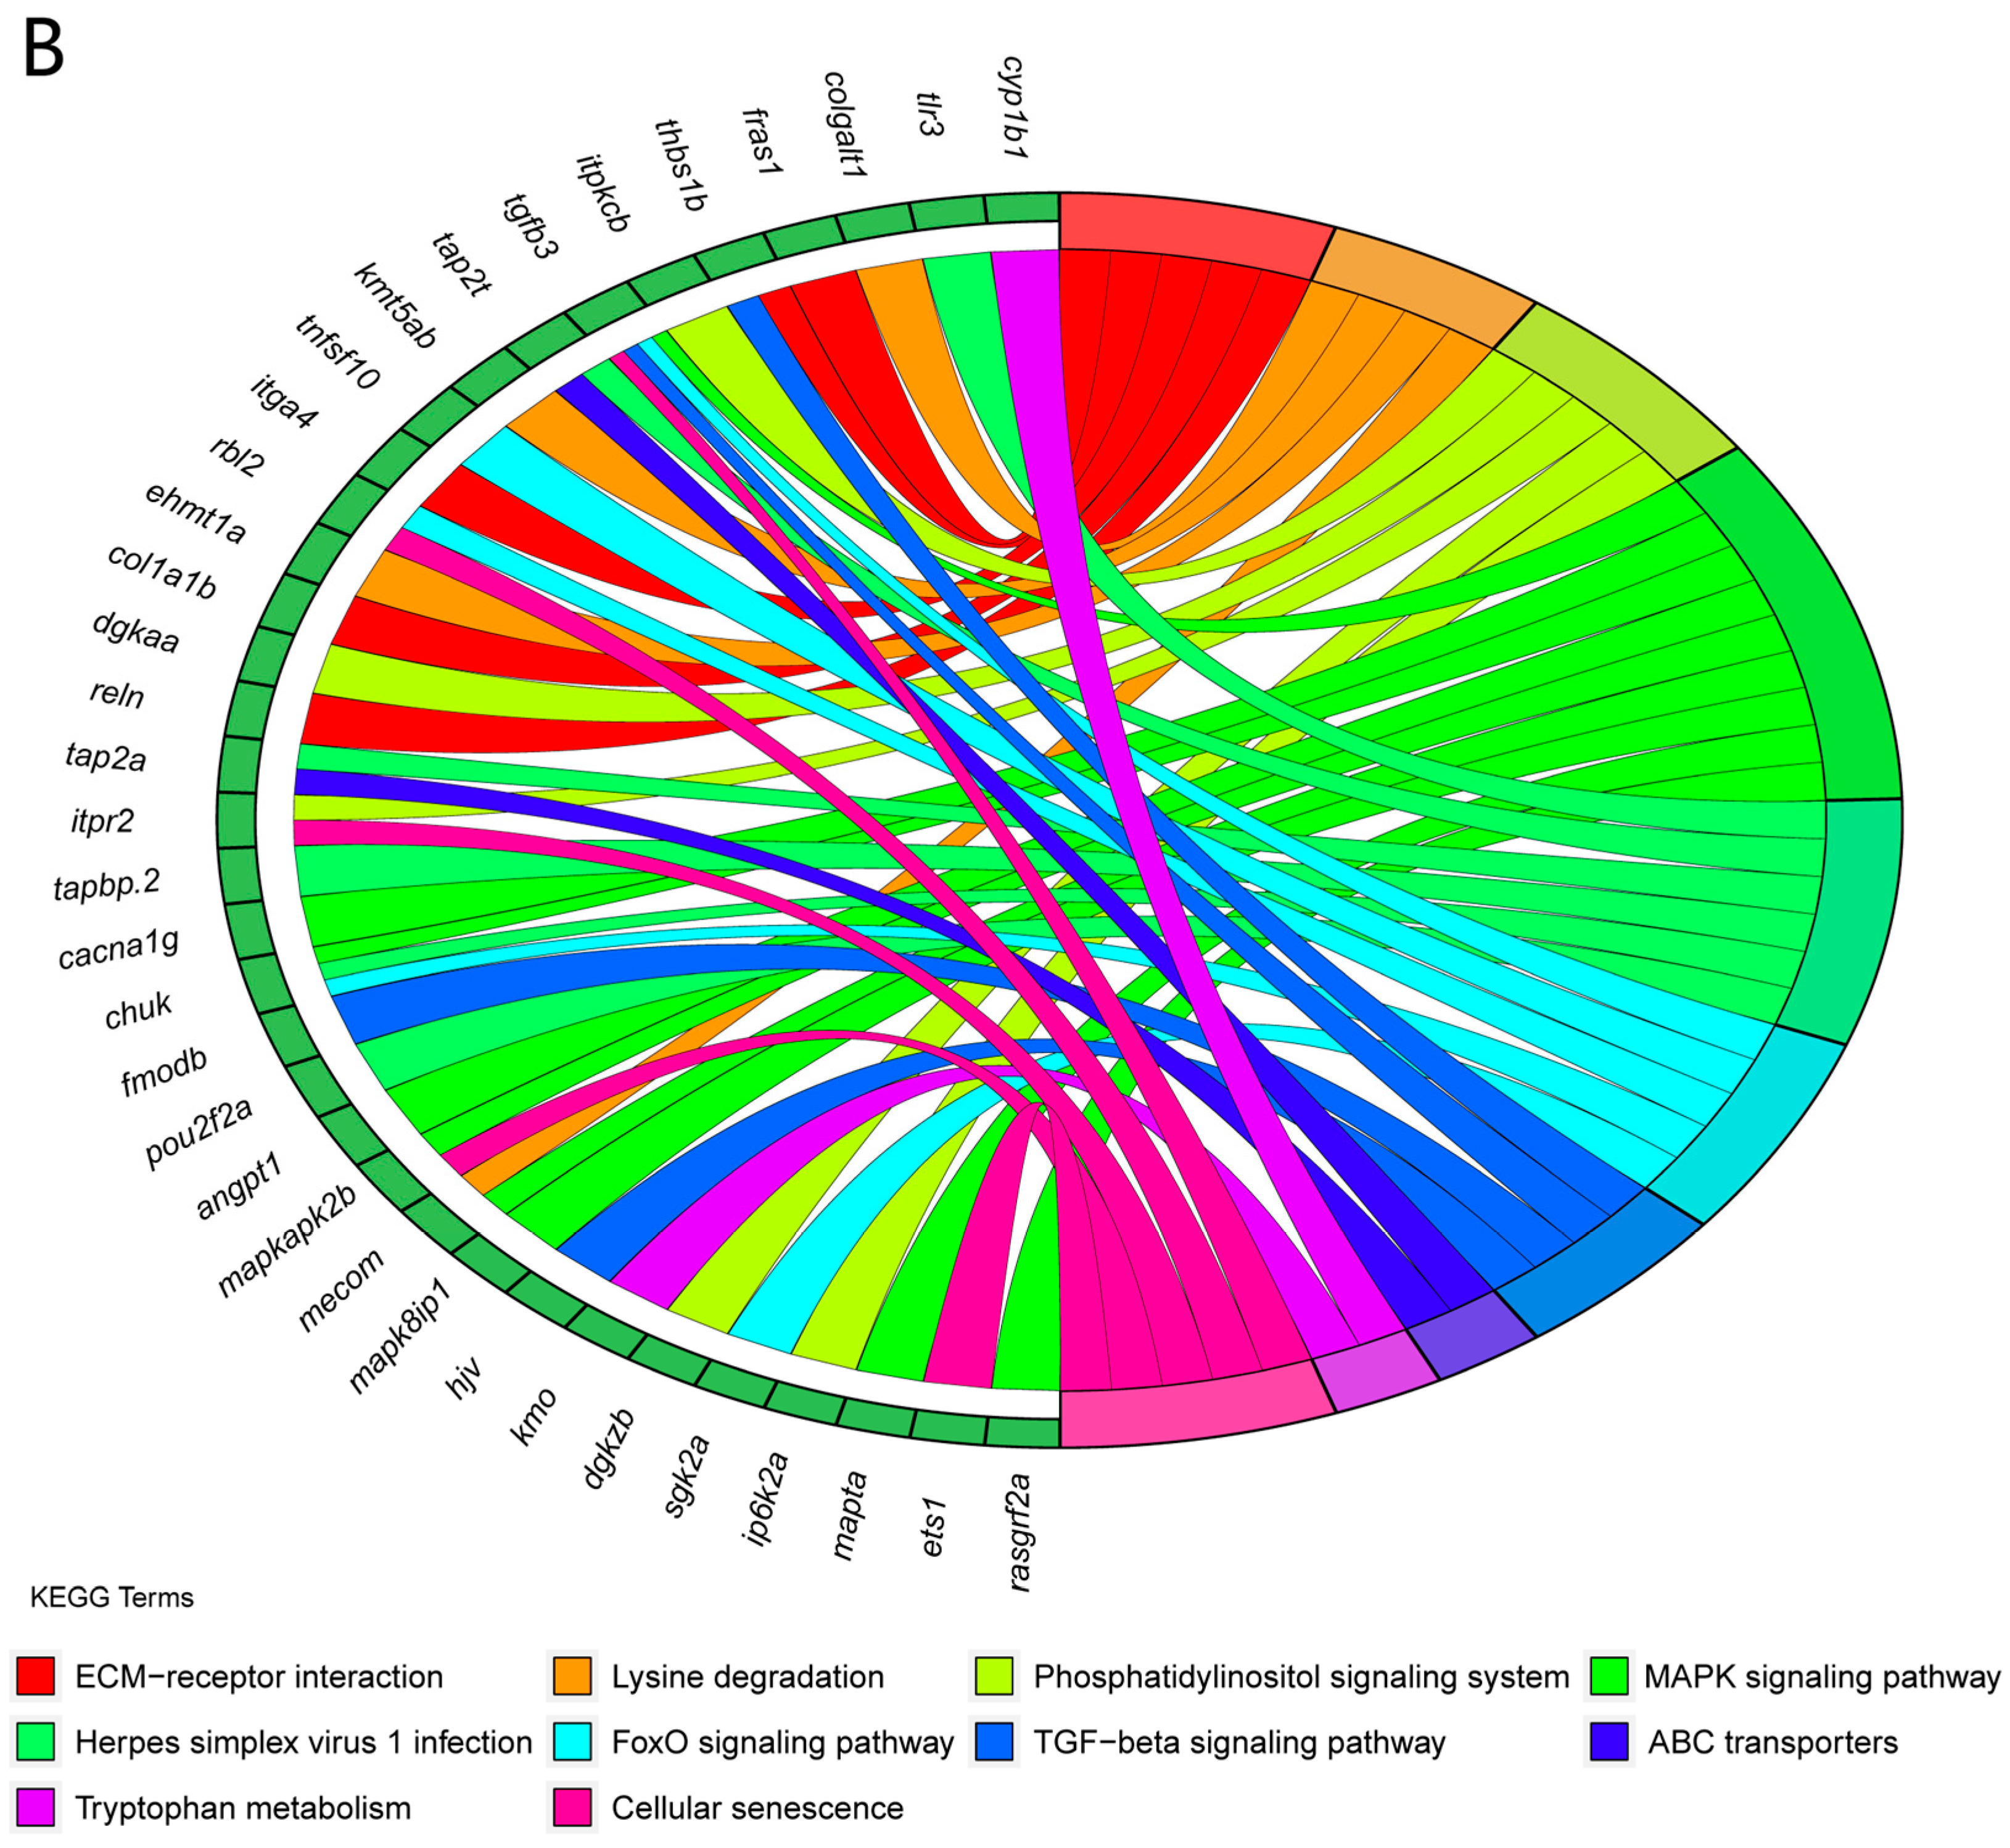
3.6. An Analysis of the KEGG Functional Enrichment Pathways

Enrichment analysis was performed for all differential modified genes; the pathway information, corresponding to gene enrichment and ranked in the top 10 for transcripts with significantly upregulated or downregulated m6A modifications, (p < 0.05) was identified. The results (Table S6) showed that significantly upregulated m6A modification genes were mainly enriched in signaling pathways, such as steroid biosynthesis (ebp, krit1, hsd17b7, nsdhl, msmo1, and dhcr7), ribosome biogenesis in eukaryotes (xpo1a, utp4, tbl3, utp15, nol6, POP1, and nop58), DNA replication (pold2, pold1, dna2, rnaseh2c, and mcm2), and the peroxisome proliferator-activated receptor (PPAR) signaling pathway (acsl3b, SCD, acsl4a, plin2, SCD1, acsbg2, and pck1) (Figure 5A). Significantly downregulated m6A modification genes (Table S7) were mainly enriched in signaling pathways, including the extracellular matrix (ECM)–receptor interaction (itga4, thbs1b, RELN, fras1, and col1a1b), lysine degradation (kmt5ab, ehmt1a, mecom, and COLGALT1), the phosphatidylinositol signaling system (itpkcb, dgkaa, dgkzb, itpr2, and ip6k2a), and the MAPK signaling pathway (rasgrf2a, angpt1, MAPK8IP1, CHUK, mapta, mecom, tgfb3, cacna1g, and mapkapk2b) (Figure 5B).

3.7. An Integrated Analysis of MeRIP and RNA Sequencing

We performed a correlation analysis of MeRIP-seq and RNA-seq data (Table S8) to reveal the potential regulatory role of m6A modifications upon gene expression during starvation and low-temperature stress. As shown in Figure 6A (Table S9), RNA-seq data were filtered by |log2FC| > 1, and MeRIP-seq is filtered by |log10FC| > 1; 1527 eligible differentially methylated peaks (DMGs) were noted, of which 651 and 876 differentially methylated peaks showed upregulated and downregulated methylation modifications, respectively. Of the 651 methylation modification upregulated differential methylation peaks, 494 and 157 genes were synchronously upregulated (hyper-up) and reverse downregulated (hyper-down), respectively. Of the 876 methylation modification downregulated differential methylation peaks, 622 and 254 genes were synchronously downregulated (hypo-down) and reverse upregulated (hypo-up), respectively. These results mainly indicated that the level of m6A methylation modification was positively correlated with gene expression in starved L. crocea under low-temperature stress. As shown by the KEGG enrichment results of MeRIP-seq, we inferred that pck1 plays a role in the insulin, PPAR, and FoxO signaling pathways, whereas tnfsf10 plays a role in the FoxO signaling pathway. Therefore, we used an Integrative Genomics Viewer (IGV) to examine the m6A peak profiles of the pck1 and tnfsf10 genes. The results showed that, compared with the low-temperature group, the m6A level of the pck1 gene in the starvation and low-temperature group increased, whereas the m6A level of the tnfsf10 gene decreased (Figure 6B,C). These results indicate that RNA methylation is reversible and plays a dynamic role in the response of starved L. crocea under low temperatures.

4. Discussion

m6A is one of the most common epigenetic modifications in eukaryotic RNA and plays a fundamental regulatory role for gene expression [28]. We performed MeRIP-seq on samples from the liver tissues of starved L. crocea under low-temperature stress: 8419 and 9100 m6A peaks were screened in the CF and CC groups, corresponding to 4765 and 5068 genes, respectively. An analysis of the distribution of m6A peaks in different gene functional elements revealed that m6A peaks were mainly distributed in the protein-encoding (CDS) region, start codon, and stop codon region in the CF and CC groups, implying that RNA methylation modifications in these regions play a significant role in gene expression regulation in starved L. crocea under low-temperature stress. The m6A modifications were particularly enriched and highly conserved near the termination codon of CDS and the first one-fourth of the 3′UTR region in humans and mice [29]. The results of this study are consistent with those of these studies. m6A modification has been shown to delay the extension of mRNA translation, prevent mRNA degradation, and regulate translation with the help of the mRNA secondary structure in the CDS region, in addition to regulating the expression of genes in the 5′-UTR and 3′-UTR regions [30]. The presence of more liver methylation sites in the CDS region under starvation and low-temperature stress in L. crocea is presumed to be because the methylation of the CDS region can increase the translation opportunity, which is beneficial for starved L. crocea to cope with the environmental stress caused by low temperatures. A motif analysis showed that the most significant m6A motif in both groups was GGAGG, which was similar to the RGACH motif (R = G/A; H = A/C/U) observed in zebrafish (D. rerio) [31], suggesting that the m6A methylation sequence motif has certain similarities and conservation among vertebrates.
Compared with the CC group, 765 m6A differentially methylated genes were observed in the CF group, which contained 358 and 407 m6A differentially modified genes with upregulated and downregulated expression, respectively (p < 0.05). During the process of temperature decrease, metabolic rate, the secretion of digestive enzymes, and the binding capacity of iron ions are downregulated to different degrees, which may indirectly inhibit gene expression [32]. Hence, we suggest that when starved L. crocea was faced with low-temperature stress, the expression of some genes would be upregulated or downregulated to adapt to the low-temperature condition, and the fact that there were more downregulated than upregulated genes may be because low temperatures inhibit some physiological functions of L. crocea, which in turn leads to the downregulation of the expression of some genes. A GO functional enrichment analysis of m6A differentially modified genes showed that significantly upregulated m6A-modified genes were mainly enriched in DNA replication, rRNA metabolic processes, and ncRNA processing, which was consistent with the extensive and critical role of m6A methylation in the mRNA life cycle [33]. Therefore, we hypothesize that m6A methylation modification plays a significant role in regulating the post-transcriptional levels of genes involved in key metabolic and biological processes in response to low-temperature stress in starved L. crocea. Significantly downregulated m6A-modified genes were mainly enriched in cell adhesion, glycosaminoglycan binding, and metalloendopeptidase activity. One of the most essential biological features of cells and a key step in cell survival or death, membrane homeostasis maintenance, and signaling/metabolic pathway induction is cell adhesion [34]. An important first step in bacterial pathogenesis is epithelial cell adhesion involving glycosaminoglycans; the involvement of glycosaminoglycans can facilitate host–pathogen interactions during infection [35]. Therefore, we hypothesize that the m6A-modified cell adhesion pathway plays a vital role in starved L. crocea under low-temperature stress.
A KEGG pathway enrichment analysis revealed that significantly upregulated m6A modified genes were mainly enriched in steroid biosynthesis, DNA replication, ribosome biogenesis in eukaryotes, and the PPAR signaling pathway. Steroid is a general term for a large group of cyclopentanoperhydro-phenanthrene fully hydrogenated phenanthrene derivatives; steroids are essential for fish to maintain growth and survival under harsh environmental conditions. Different environmental and physiological conditions can affect the steroid biosynthetic capacity of cultured fishes [36]. The most significant signaling pathway for KEGG enrichment under oxidative damage conditions in grass carp (Ctenopharyngodon idella) and yellow catfish (Pelteobagrus fulvidraco) is the steroid biosynthesis signaling pathway [37,38]. Therefore, we hypothesized that starved L. crocea would respond to low-temperature stress through the m6A-modified steroid biosynthesis pathway. Ribosome biogenesis in eukaryotes is directly related to gene expression and plays a significant role in biological processes, including cell growth and proliferation [39]. The PPAR signaling pathway is a class of pathways related to lipid metabolism; PPARs are steroid hormone receptors that belong to the steroid/thyroid/retinoic acid receptor superfamily of transducing proteins, which are lipid-activated transcription factors that play an important pivotal role in maintaining lipid homeostasis [40]. Therefore, we hypothesize that in starved L. crocea under low-temperature stress, the m6A-modified PPAR signaling pathway plays a significant role in maintenance of lipid homeostasis. A significant downregulation of m6A modifier genes was mainly enriched in the ECM–receptor interaction, lysine degradation, phosphatidylinositol signaling pathway, and MAPK signaling pathway. The ECM–receptor interaction is an essential process for maintaining cell survival and performing its functions; the ECM can affect cell proliferation, migration, and differentiation by regulating the receptor signaling pathways. Studies have shown that ECM–receptor interactions play a significant role in the gut regeneration process of sea cucumber (Apostichopus japonicus), which accelerates cell migration movements [41]. Therefore, we suggest that some genes in the m6A-modified ECM–receptor interaction signaling pathway in starved L. crocea may be involved in the regeneration process of body-wall tissues under low-temperature stress. Lysine is an important metabolite in organisms; lysine residues produced by lysine degradation affect the signaling pathway of innate immunity, thereby inhibiting and negatively regulating it [42]. Therefore, the m6A-modified lysine degradation signaling pathway in starved L. crocea may affect the innate immunity of the organism under low-temperature stress. In the phosphatidylinositol signaling pathway, two second messengers are generated, which can open calcium channels when combined with ligands on the endoplasmic reticulum, thereby resulting in an increase in the intracellular metal ion concentration [43]. We hypothesize that the starved L. crocea maintains the intracellular metal ion concentration through the m6A-modified phosphatidylinositol signaling pathway, thereby leading to normal cellular excitation in response to cold stress. The MAPK signaling pathway is one of the highly conserved signaling pathways in eukaryotic cells, which transduces extracellular signals to the cytoplasm and nucleus, thereby controlling physiological processes in the organism. In vertebrates, the MAPK signaling pathway plays a key role in stress resistance, reproduction, cell development, differentiation, and inflammation [44]. This pathway is activated in orange-spotted grouper (Epinephelus coioides), yellow drum (Nibea albiflora), and olive flounder (Paralichthys olivaceus), among other species, in response to low-temperature stress [45,46,47]. Therefore, we hypothesize that the m6A-modified MAPK signaling pathway plays a significant role in starved L. crocea under low-temperature stress.
We further investigated the relationship between m6A differentially methylated peaks and the expression levels of differentially expressed genes to assess the role of modified m6A methylation in starved L. crocea under low-temperature stress. We observed that the gene expression levels of most of the peaks with altered methylation modifications were positively correlated with the presence of their m6A peaks. The expression levels of most differentially expressed genes in A. japonicus are positively correlated with m6A methylation modifications during disease development [28]. Moreover, in human genes, the gene expression levels of transcription start site fragments are positively correlated with m6A modifications of methylation [48]. However, some studies have shown that the expression levels of differentially expressed genes in porcine liver and chicken ovaries are negatively correlated with m6A methylation modifications [49,50]. On the basis of these studies, we hypothesize that the regulatory mechanisms of m6A methylation on target genes vary among species.

5. Conclusions

Our results demonstrate that m6A modification is a significant RNA epigenetic modification involved in normal physiology in the liver of starved L. crocea, which was observed to respond to low-temperature stress through m6A-modified steroid biosynthesis, DNA replication, ribosome biogenesis in eukaryotes, PPAR, the ECM–receptor interaction, lysine degradation, phosphatidylinositol, and MAPK signaling pathways. Gene expression levels were positively correlated with the modification of m6A methylation in the liver of L. crocea starved at low temperatures. Our results provide a basis for understanding RNA modification in L. crocea and extend our knowledge of the function of RNA modification.

Supplementary Materials

The following supporting information can be downloaded at: https://www.mdpi.com/article/10.3390/fishes9010041/s1. Table S1: qRT-PCR; Table S2: Methylated_RNA_sites. mRNA; Table S3: Differentially_methylated_sites. mRNA; Table S4: GO analysis of the upregulated m6A differential genes. Table S5: GO analysis of the downregulated m6A differential genes. Table S6: KEGG analysis of the upregulated m6A differential modified genes. Table S7: KEGG analysis of the downregulated m6A differential modified genes Table S8: RNA-seq. CF vs. CC. All. Table S9: Four-quadrant analysis of differential m6A modification and differential mRNA expression.

Author Contributions

W.S. and Z.X.: Conceptualization, Funding acquisition, and original draft. Q.J.: Resources, Formal analysis, Data curation and original draft, Writing—review and editing. L.L. and X.H.: Formal analysis and Visualization. All authors have read and agreed to the published version of the manuscript.

Funding

This work was supported by Marine S&T Fund of Shandong Province for Qingdao Marine Science and Technology Center (2022QNLM30001); National Key R&D Program of China (2022YFD2401102); Central Public-interest Scientific Institution Basal Research Fund, CAFS (2020TD76).

Institutional Review Board Statement

The animal study protocol was approved by the Institutional Review Board of East China Sea Fisheries Research Institute of Chinese Academy of Fisheries Sciences (25 December 2022).

Data Availability Statement

Data are contained within the article and supplementary materials.

Conflicts of Interest

The authors declare no conflicts of interest.

References

  1. Donaldson, M.R.; Cooke, S.J.; Patterson, D.A.; Macdonald, J.S. Cold shock and fish. J. Fish Biol. 2010, 73, 1491–1530. [Google Scholar] [CrossRef]
  2. Beitinger, T.L.; Bennett, W.A.; Mccauley, R.W. Temperature tolerances of North American freshwater fishes exposed to dynamic changes in temperature. Environ. Biol. Fishes 2000, 58, 237–275. [Google Scholar] [CrossRef]
  3. Zerai, D.B.; Fitzsimmons, K.M.; Collier, R.J. Transcriptional response of delta-9-desaturase gene to acute and chronic cold stress in nile tilapia, Oreochromis niloticus. World Aquacult. Soc. 2010, 41, 800–806. [Google Scholar] [CrossRef]
  4. Kuo, C.M.; Hsieh, S.L. Comparisons of physiological and biochemical responses between milkfish (Chanos chanos) and grass carp (Ctenopharyngodon idella) to cold shock. Aquaculture 2006, 251, 525–536. [Google Scholar] [CrossRef]
  5. Green, B.S.; Fisher, R. Temperature influences swimming speed, growth and larval duration in coral reef fish larvae. J. Exp. Mar. Biol. Ecol. 2004, 299, 115–132. [Google Scholar] [CrossRef]
  6. Zeng, L.; Wang, Y.H.; Song, W.; Xie, Z.L.; Zhang, H. The effect of copper domestication on oxidative damage in large yellow croaker under low temperature stress based on transcriptome analysis. J. Fish. Sci. China 2022, 29, 1425–1436. [Google Scholar]
  7. Liu, J.F. Farming and Biology of Yellow Croaker; Xiamen University Press: Xiamen, China, 2013; pp. 8–14. [Google Scholar]
  8. Lu, D.L. The Mechanism of Hunger Enhancing Cold Stress Tolerance in Zebrafish (Danio rerio). Ph.D. Thesis, East China Normal University, Shanghai, China, 2019. [Google Scholar]
  9. Zeng, L.; Song, W.; Xie, Z.L.; Wang, Y.H.; Xiong, Y.F.; Zhang, H. Based on metabolomics analysis, the adaptation mechanism of yellow croaker to low temperature and hunger stress. J. Fish. China 2023, 47, 86–97. [Google Scholar]
  10. Xu, H. Preliminary Exploration of the Effect and Mechanism of Starvation Stress on the Low-Temperature Tolerance of Large Yellow Croaker. Master’s Thesis, Jimei University, Fujian, China, 2015. [Google Scholar]
  11. Frye, M.; Harada, B.T.; Behm, M.; He, C. RNA modifications modulate gene expression during development. Science 2018, 361, 1346–1349. [Google Scholar] [CrossRef]
  12. Zhu, L.; Zhang, H.; Zhang, X.; Xia, L. RNA m6A methylation regulators in sepsis. Mol. Cell. Biochem. 2023, 1–16. [Google Scholar] [CrossRef]
  13. Wang, X.; Zhao, B.S.; Roundtree, I.A.; Lu, Z.; Han, D.; Ma, H.; Weng, X.; Chen, K.; Shi, H.; He, C. N6-methyladenosine modulates messenger RNA translation efficiency. Cell 2015, 161, 1388–1399. [Google Scholar] [CrossRef]
  14. Geula, S.; Moshitch-Moshkovitz, S.; Dominissini, D.; Mansour, A.A.; Kol, N.; Salmon-Divon, M.; Hershkovitz, V.; Peer, E.; Mor, N.; Manor, Y.S. m6A mRNA methylation facilitates resolution of naïve pluripotency toward differentiation. Science 2015, 347, 1002–1006. [Google Scholar] [CrossRef]
  15. Zhou, J.; Wan, J.; Gao, X.; Zhang, S.; Jaffrey, S.R.; Qian, S.B. Dynamic m6A mRNA methylation directs translational control of heat shock response. Nature 2015, 526, 591–594. [Google Scholar] [CrossRef]
  16. Lu, Z.K. A Study on Heat Stress in Hu Sheep Based on RNA Seq and MeRIP Seq. Ph.D. Thesis, Gansu Agricultural University, Gansu, China, 2020. [Google Scholar]
  17. Xiang, Y.; Laurent, B.; Hsu, C.H.; Nachtergaele, S.; Lu, Z.; Sheng, W.; Xu, C.; Chen, H.; Ouyang, J.; Wang, S. RNA m(6)A methylation regulates the ultraviolet-induced DNA damage response. Nature 2017, 543, 573–576. [Google Scholar] [CrossRef]
  18. Fan, X.T. Studies on the Response Mechanism of Hunger Stress to Reproductive Development, Cell Growth, Autophagy and DNA Methylation in Zebrafish. Ph.D. Thesis, Northwest A&F University, Shanxi, China, 2021. [Google Scholar]
  19. Andrews, S. FastQC: A quality control tool for high throughput sequence data. Bioinformatics 2010, 26, 1968–1971. [Google Scholar]
  20. Kim, D.; Langmead, B.; Salzberg, S.L. HISAT: A fast spliced aligner with low memory requirements. Nat. Methods 2015, 12, 357–360. [Google Scholar] [CrossRef]
  21. Zhang, Y.; Liu, T.; Meyer, C.A.; Eeckhoute, J.; Johnson, D.S.; Bernstein, B.E.; Nusbaum, C.; Myers, R.M.; Brown, M.; Li, W. Model-based analysis of ChIP-Seq (MACS). Methods Mol. Biol. 2008, 1150, 81–95. [Google Scholar] [CrossRef]
  22. Bailey, T.L. DREME: Motif discovery in transcription factor ChIP-seq data. Bioinformatics 2011, 27, 1653–1659. [Google Scholar] [CrossRef]
  23. Krzywinski, M.; Schein, J.; Birol, I.; Connors, J.; Gascoyne, R.; Horsman, D.; Jones, S.J.; Marra, M.A. Circos: An information aesthetic for comparative genomics. Genome Res. 2009, 19, 1639–1645. [Google Scholar] [CrossRef]
  24. Thorvaldsdóttir, H.; Robinson, J.T.; Mesirov, J.P. Integrative Genomics Viewer (IGV): High-performance genomics data visualization and exploration. Brief. Bioinform. 2013, 14, 178–192. [Google Scholar] [CrossRef]
  25. Consortium, T.G.O. Gene ontology: Tool for the unification of biology. Nat. Genet. 2000, 25, 25–29. [Google Scholar]
  26. Draghici, S.; Khatri, P.; Tarca, A.L.; Amin, K.; Done, A.; Voichita, C.; Georgescu, C.; Romero, R. A systems biology approach for pathway level analysis. Genome Res. 2007, 17, 1537–1545. [Google Scholar] [CrossRef]
  27. Anders, S. Analysing RNA-Seq data with the DESeq package. Mol. Biol. 2010, 43, 1–17. [Google Scholar]
  28. Shao, Y.; Duan, X.; Zhao, X.; Lv, Z.; Li, C. Global N6-methyladenosine methylation analysis reveals the positive correlation between m6A modification and mRNA abundance during Apostichopus japonicus disease development. Dev. Comp. Immunol. 2022, 133, 104434. [Google Scholar] [CrossRef]
  29. Meyer, K.D.; Saletore, Y.; Zumbo, P.; Elemento, O.; Mason, C.E.; Jaffrey, S.R. Comprehensive analysis of mRNA methylation reveals enrichment in 3’ UTRs and near stop codons. Cell 2012, 149, 1635–1646. [Google Scholar] [CrossRef]
  30. Jaffrey, S.R.; Kharas, M.G. Emerging links between m6A and misregulated mRNA methylation in cancer. Genome Med. 2017, 9, 2. [Google Scholar] [CrossRef]
  31. Zhang, C.X.; Chen, Y.S.; Sun, B.F.; Wang, L.; Yang, Y.; Ma, D.Y.; Lv, J.H.; Heng, J.; Ding, Y.Y.; Xue, Y.Y. m6A modulates haematopoietic stem and progenitor cell specification. Nature 2017, 549, 273–276. [Google Scholar] [CrossRef]
  32. Sun, J.H. Differential Expression Analysis and Lineage Identification of Low-Temperature Transcriptome Genes in the Red Finned Pufferfish. Master’s Thesis, Shanghai Ocean University, Shanghai, China, 2018. [Google Scholar]
  33. Roundtree, I.A.; Evans, M.E.; Pan, T.; He, C. Dynamic RNA modifications in gene expression regulation. Cell 2017, 169, 1187. [Google Scholar] [CrossRef]
  34. Budna, J.; Celichowski, P.; Bryja, A.; Dyszkiewicz-Konwińska, M.; Jeseta, M.; Bukowska, D.; Antosik, P.; Brüssow, K.P.; Bruska, M.; Nowicki, M. Significant Down-regulation of “biological adhesion” genes in porcine oocytes after IVM. Int. J. Mol. Sci. 2017, 18, 2685. [Google Scholar] [CrossRef]
  35. Iozzo, R.V.; Schaefer, L. Proteoglycan form and function: A comprehensive nomenclature of proteoglycans. Matrix Biol. 2015, 42, 11–55. [Google Scholar] [CrossRef]
  36. Ye, Y.T.; Wu, P.; Cai, C.F.; Cao, X.M.; Cheng, Z.Q.; Wang, Y.L. Biological evolution based on steroid synthesis pathways and utilization of feed resources through their products. Feed Ind. 2023, 44, 1–10. [Google Scholar]
  37. Ye, Y.T.; Cai, C.F.; Xu, F.; Dong, J.J.; Zhang, B.T.; Xiao, P.Z. Feeding oxidized fish oil upregulates the expression of cholesterol and bile acid synthesis gene pathways in the intestinal mucosa of grass carp. J. Aquat. Biol. 2015, 39, 90–100. [Google Scholar]
  38. Gao, M.M.; Ye, Y.T.; Wu, P.; Cai, C.F.; Lin, X.X.; Wu, D.W.; He, J.; Zhang, B.T.; Xiao, P.Z. The effect of feeding oxidized fish oil on differential expression of genes involved in cholesterol and bile acid synthesis pathways in the gastrointestinal mucosa of yellow catfish. Genom. Appl. Biol. 2017, 36, 1912–1925. [Google Scholar]
  39. Long, Y.; Song, G.; Yan, J.; He, X.; Li, Q.; Cui, Z. Transcriptomic characterization of cold acclimation in larval zebrafish. BMC Genom. 2013, 14, 612. [Google Scholar] [CrossRef]
  40. Lemberger, T. Peroxisome proliferator-activated receptors: A nuclear receptor signaling pathway in lipid physiology. Annu. Rev. Cell Dev. Biol. 1996, 12, 335–363. [Google Scholar] [CrossRef]
  41. Miao, T.; Wan, Z.X.; Sun, L.N.; Li, X.N.; Xing, L.L.; Bai, Y.C.; Wang, F.; Yang, H.S. Extracellular matrix remodeling and matrix metalloproteinases (ajMMP-2 like and ajMMP-16 like) characterization during intestine regeneration of sea cucumber Apostichopus japonicus. Comp. Biochem. Physiol. Part B Biochem. Mol. Biol. 2017, 212, 12–23. [Google Scholar] [CrossRef]
  42. Chen, M.; Meng, Q.; Qin, Y.; Liang, P.; Tan, P.; He, L.; Zhou, Y.; Chen, Y.; Huang, J.; Wang, R.F.; et al. TRIM14 Inhibits cGAS degradation mediated by selective autophagy receptor p62 to promote innate immune responses. Mol. Cell 2016, 64, 105–119. [Google Scholar] [CrossRef]
  43. Yu, Y.Y.; Wang, D.; Xu, J.; Xu, B.; Ma, B.S.; Zhu, X.Y. Transcriptome analysis of the liver and pancreas of crayfish under hypoxic stress. Freshw. Fish. 2022, 52, 26–35. [Google Scholar]
  44. Li, X.; Cui, Z.; Liu, Y.; Song, C.; Shi, G.; Yue, G. H Transcriptome analysis and discovery of genes involved in immune pathways from hepatopancreas of microbial challenged mitten crab eriocheir sinensis. PLoS ONE 2013, 8, e68233. [Google Scholar] [CrossRef]
  45. Sun, Z.; Tan, X.; Xu, M.; Liu, Q.; Ye, H.; Zou, C.; Ye, C. Liver transcriptome analysis and de novo annotation of the orange-spotted groupers (Epinephelus coioides) under cold stress. Comparative biochemistry and physiology. Part D Genom. Proteom. 2019, 29, 264–273. [Google Scholar]
  46. Xu, D.; You, Q.; Chi, C.; Luo, S.; Song, H.; Luo, B.; Takeuchi, Y. Transcriptional response to low temperature in the yellow drum (Nibea albiflora) and identification of genes related to cold stress. Comparative Biochemistry and Physiology. Part D Genom. Proteom. 2018, 28, 80–89. [Google Scholar]
  47. Hu, J.W.; You, F.; Wang, Q.; Weng, S.D.; Liu, H.; Wang, L.J.; Zhang, P.J.; Tan, X.G.; Xu, P. Transcriptional responses of olive flounder (Paralichthys olivaceus) to low temperature. PLoS ONE 2014, 9, e108582. [Google Scholar] [CrossRef]
  48. Dominissini, D.; Moshitch-Moshkovitz, S.; Schwartz, S.; Salmon-Divon, M.; Ungar, L.; Osenberg, S.; Cesarkas, K.; Jacob-Hirsch, J.; Amariglio, N.; Kupiec, M. Topology of the human and mouse m6A RNA methylomes revealed by m6A-seq. Nature 2012, 485, 201–206. [Google Scholar] [CrossRef]
  49. He, S.; Wang, H.; Liu, R.; He, M.N.; Che, T.D.; Jin, L.; Deng, L.M.; Tian, S.L.; Li, Y.; Lu, H.F. mRNA N6-methyladenosine methylation of postnatal liver development in pig. PLoS ONE 2017, 12, e0173421. [Google Scholar] [CrossRef]
  50. Fan, Y.; Zhang, C.; Zhu, G. Profiling of RNA N6-methyladenosine methylation during follicle selection in chicken ovary. Poult. Sci. 2019, 98, 6117–6124. [Google Scholar] [CrossRef]
Figure 1. Effects of starvation and low temperature on the expression of m6A RNA methylation modification-related genes in the liver of L. crocea. CC, control group; CF, cold + fasting group. Different letters indicate significant differences (p < 0.05).
Fishes 09 00041 g001
Figure 2. Overview of the m6A methylation peaks. (A) Venn plots of methylation sites for both samples; (B) Venn plots of methylation genes for both samples; (C) pie charts showing m6A peak distribution of the CF group on RNA structure; (D) pie charts showing m6A peak distribution of the CC group on RNA structure; (E) Metageneplot of peak distribution on RNA structures, CDS = coding sequence; (F) motif analysis results for the CF group; (G) motif analysis results for the CC group; the larger the letter, the higher the probability of the nucleotide or amino acid appearing at that position, commonly represented by bits.
Fishes 09 00041 g002aFishes 09 00041 g002b
Figure 3. Differential peak analysis of m6A modifications following starvation stress in L. croceas. (A) Volcano plot of the m6A modification differences. The X-axis is the display of log2 Fold Change and the Y-axis is the display of log10 p-value. Red, blue, and gray indicate upregulated significant difference peaks, downregulated significant difference peaks, and nondifferential peaks, respectively. (B) Differential peak distribution on the respection chromosomes. The first, second, and third layers of the Circos plot indicate the genome length scale, the distribution of differentially upregulated peaks, and the distribution of differentially downregulated peaks, respectively.
Fishes 09 00041 g003
Figure 4. GO analysis of the m6A differential genes. (A) Histogram of GO enrichment analysis of significantly upregulated m6A differential genes; (B) histogram of GO enrichment analysis of significantly downregulated m6A differential genes. Red represents significantly enriched terms, and blue represents non-significantly enriched terms.
Fishes 09 00041 g004
Figure 5. KEGG analysis of the m6A differentially modified genes. (A) Circle plot of the KEGG enrichment analysis of significantly upregulated m6A differential genes; (B) circle plot of the KEGG enrichment analysis of significantly downregulated m6A differential genes.
Fishes 09 00041 g005aFishes 09 00041 g005b
Figure 6. Integrated analysis of MeRIP and RNA sequencing. (A) Four-quadrant analysis of differential m6A modification and differential mRNA expression. (B) IGV software revealed the expression profile of m6A methylation-modified differentially expressed genes (pck1). (C) IGV software revealed the expression profile of m6A methylation-modified differentially expressed genes (tnfsf10). Log2FC was used as a variable in RNA-seq for the horizontal axis. In MeRIP-seq, log10FC was used as a variable for vertical coordinates. The standard for RNA seq was |log2FC| > 1. The screening criterion for MeRIP-seq was |log10FC| > 1. The colored dots in the figure represent genes with differential expression and MeRIP results.
Fishes 09 00041 g006
Table 1. Primers used for real-time PCR analysis.
Primer NameForward PrimerReverse Primer
β-actinTCCTCGGTATGGAATCTTGCGAGTATTTACGCTCAGGTGGG
mettl3GCAGAGCAAGAAGGTGAGCAGAGTCCCGTGGTCGCAGAACTCC
mettl14TGCCCAACTCCCACCTATCCGCCTCTGTCTCCGCCTCTTCCTG
ftoCCTCATGCTGCCACTGGAATCTGTGAACTGAAGCGTGCGATGTCTC
alkbh5CGGTGTTTGTCCTGCCTGTGAGACGCCGCTGCTTGATGTCTTG
Table 2. Statistics for sequencing data.
SampleRaw ReadsQ30Clean ReadsClean RatioMapped Reads
CF.IP42,980,37290.97%42,939,50099.90%27,123,510
CC.IP47,704,92290.96%47,656,03899.90%32,767,664
CF.Input77,079,83293.42%75,403,70497.83%57,529,263
CC.Input90,898,26093.74%89,057,95297.98%65,467,101
Clean ratio refers to the ratio of clean reads to raw reads. Mapped reads refers to the number of reads matched to the genome.
Disclaimer/Publisher’s Note: The statements, opinions and data contained in all publications are solely those of the individual author(s) and contributor(s) and not of MDPI and/or the editor(s). MDPI and/or the editor(s) disclaim responsibility for any injury to people or property resulting from any ideas, methods, instructions or products referred to in the content.

