Abstract
The intracohort cannibalism present in tropical gar larvae (A. tropicus) generates great problems in its culture, as in other fish species around the world. The addition of tryptophan (Trp) (10, 20, and 30 g/kg) and a control diet (CD) without Trp were evaluated in A. tropicus larvae regarding growth, survival, cannibalism, behavior, digestive enzymatic activity, and genes related to aggressiveness and/or cannibalism in two stages: 0–13 days after hatching (DAH); and only cannibals (14–24 DAH). In the first stage, no differences were observed in growth parameters; cannibalism was lower with the use of Trp, with the lowest percentage being the 10 g/kg Trp treatment (56.75 ± 2.47%) compared to CD (64.75 ± 1.76%). In the second stage, survival was greater in 10 g/kg Trp (75.00 ± 7.07%) than in CD (23.33 ± 5.77%). Thus, cannibalism was lower with 10 g/kg Trp (20.0 ± 10.0%) compared to CD (76.66 ± 5.77%). Cannibal larvae fed with 10 g/kg Trp had a greater enzymatic activity in acid and alkaline proteases and leucine aminopeptidase, as well as the overexpression of avpi1, crh, and htr1a and the subexpression of tph1, th, sstr1, and hdc (p < 0.05). No aggressive behaviors were recorded in the larvae fed with the 10 g/kg Trp treatment, unlike those fed with CD. The use of 10 g/kg Trp improves survival and reduces cannibalism in A. tropicus larvae.
Key Contribution:
The use of 10 g/Kg of Trp in the diet improves survival and reduces cannibalism in A. tropicus larvae. Cannibal larvae of A. tropicus show a greater growth due to the “jumper” effect, unlike non-cannibal larvae.
1. Introduction
In fish, around 390 species have been documented that show some type of cannibalism, a behavior that occurs most of the time throughout their life or exclusively in the early stages of development (larvae and/or juvenile) [1]. Tropical gar (Atractosteus tropicus) shows cannibalism in the larvae stage (10 DAH (days after-hatching)) in captivity and in the wild [2,3]. This species is considered of importance; it has economic value due to its culture and fishing, as well as ecological and cultural value in Mexico and Central America [4,5]. However, the presence of cannibalism in the early stages of development limits the growth, survival, and profitability values of the production. For example, Frías-Quintana et al. [6] reported, for A. tropicus in laboratory conditions, survival and cannibalism values of 24% and 33%, respectively. In another study, Palma-Cancino et al. [7] used co-feeding (commercial diet and Artemia nauplii) on A. tropicus larvae; cannibalism was recorded with complete (11 DAH) and incomplete (21 DAH) ingestion, obtaining survival values ranging from 1 to 33%. The problem is magnified because the fish that are not consumed but are injured by the attacks die. When modifying the diet of A. tropicus larvae with a low concentration of polyunsaturated fatty acid, similar cannibalism values (40%) and survival values ranging from 15 to 30% continued to be found [8].
Because of this, different strategies have been evaluated in several species to mitigate cannibalism in fish, one of them being the incorporation of Tryptophan (Trp) in the diet. Trp is an essential amino acid, which is the precursor of 5-hydroxytryptamine (5-HT) (serotonin) [9], a neurotransmitter responsible for controlling appetite [10], reproduction [11], and physiological processes related to immunity and intestinal homeostasis [12]. It has been observed that the administration of Trp in the fish Aequidens pulcher and Apteronotus leptorhynchus reduced their aggressiveness [13,14]. Meanwhile, the administration of the inhibitor 5-HT (p-chlorophenylalanine) increased aggressiveness in Cichlasoma meeki [15]. Likewise, the incorporation of Trp at concentrations of 2, 4, and 6 ppm and 2 and 3% in the diet induced a significant decrease of 50% in the cannibalism of Pabda (Ompok bimaculatus) larvae [16,17].
Therefore, the objective of this work is to evaluate the effect of Trp administration in the diet of A. tropicus larvae, as a possible mitigant of cannibalistic behavior. The rate of cannibalism, survival, growth, enzymatic activity, and the expression of genes related to cannibalism and behavior are analyzed.
2. Materials and Methods
2.1. Biological Material
The A. tropicus larvae were obtained for this experiment by inducing a female (3.4 kg, 91 cm) to spawn using the hormone LHRHa (Sigma-Aldrich, Taufkirchen, Germany) (30 µg/kg fish−1) applied intramuscularly. Subsequently, the female and three males (1.6 kg, 35 cm, no hormone induction) were placed in a circular tank (2000 L) with raffia thread to simulate the natural spawning site. The above was conducted with the broodstock batch from the Laboratorio de Fisiología en Recursos Acuáticos (LAFIRA) from Division Academica de Ciencias Biologicas of the Universidad Juarez Autonoma de Tabasco.
2.2. Experimental Design
The present study consisted of two stages. In the first stage, three concentrations of Trp (10, 20, and 30 g/kg) and a control diet (CD; no Trp) were evaluated; this stage lasted from day 3 to 13 DAH of larvae. Larvae (n = 200, 0.018 ± 0.001 g; 1.28 ± 0.09 cm) were placed in circular-shaped 70 L tanks (2.8 larvae/L). Each treatment was carried out in triplicate. The feeding regime was as follows: after yolk sac absorption (3 DAH), co-feeding was supplied; treatment diet and Artemia nauplii were administered for additional five days. At the end of the co-feeding, fish were fed only with the formulated feed, four times per day (8:00, 12:00, 16:00, and 20:00 h) ad libitum. In the second stage, only cannibal larvae were selected and fed with Trp (10 g/kg) and CD. Treatments were carried out in triplicate with 10 fish per replicate (0.14 larvae/L). This stage lasted from 14 to 24 DAH. Fish were weighted and sized at the beginning and at the end of each stage and cannibalism was quantified. For both stages, the tanks were connected to a recirculation system powered by a 0.5 HP water pump (Jacuzzi, JWPA5D-230A, Delavan, WI, USA) and a 1500 L reservoir for solid deposition and a biological filter. A partial daily exchange of 10% water was carried out by siphoning feces and uneaten feed. The water quality parameters were daily monitored temperature (27.36 ± 0.6 °C), dissolved oxygen (4.8 ± 0.4 mg/L, oximeter YSI 85; Yellow Springs, OH, USA), and pH (7.1 ± 0.3, HANNA HI 991001, Nusfalau, Romania).
2.3. Formulation and Preparation of the Experimental Diets
The formulation of the diets was carried out using the software MIXITWIN v.5.0. (Microsoft Windows, Washington, DC, USA), following Álvarez-González et al. [18]. The macronutrients were weighed and mixed, followed by the incorporation of micronutrients. In this step, we added tryptophan (Sigma-Aldrich, Taufkirchen, Germany reagent grade, ≥98%) in the different concentrations mentioned. This was followed by the addition of liquid ingredients. To achieve an adequate mixture, water was added 400 mL/kg per diet and mixed 15 min with each addition (a total of 60 min of mixing time per diet). The mixture was passed through a meat grinder (Torrey, M-22RI, Nuevo Leon, Mexico) and pellets were oven dried at 55 °C for 12 h (Coriat, HC-35-D, Ciudad de Mexico, Mexico). Finally, the pellets were manually ground and sieved to particles smaller than 0.5 mm (used during co-feeding) and larger than 0.7 mm (used after co-feeding). Diets were stored in hermetic plastic bags at −20 °C for later use. For all diets, the proximal components (moisture, ash, lipids, and protein) were analyzed according to AOAC [19] (Table 1), lipids (Table 2), and amino acids (Table 3).

Table 1.
Composition of the experimental diets with different concentrations of Trp and CD.
Table 2.
Analysis of the total fatty acids in the experimental diets used for A. tropicus larvae.
Table 3.
Analysis of the total amino acids in the experimental diets used for A. tropicus larvae.
2.4. Growth Indexes and Feed Quality
Weight and length were measured as follows: At the beginning of the experiment (3 DAH) and at the end of the experiment (13 DAH) as well as in the second phase (14–24 DAH). The individual weight of each organism was determined by using an analytical balance (A&D Company, Limited mod.HR-250, Seoul, Republic of Korea). The total length was calculated by analyzing the photographs taken of the organisms, through a transparent container with a scale using the software ImageJ 1.51j8 (U.S. National Institutes of Health, Bethesda, MD, USA). The following biometrics were calculated as follows: Survival (S): (final fish number/initial fish number) × 100; feed intake (FI): total feed intake per experimental unit/number of rearing days; absolute weight gain (AWG): final weight (g)—initial weight (g); specific growth rate (SGR): [(ln final weight − ln initial weight)/days] × 100; feed conversion ratio (FCR): (feed intake, g dry matter)/(fish weight gain, g); condition factor (K): [(wet weight (g) × total length − 3 (cm)] × 100; and protein efficiency ratio (PER): fish live weight gain (g)/dry protein fed (g). Visually deformed organisms (scoliosis, crossbite, lower jaw reduction, and without eyes) were identified and counted by monitoring organisms with erratic swimming, high pigmentation, and visible malnutrition. These organisms were collected after death, and the deformity was confirmed visually using a stereomicroscope (Carl Zeiss mod. Stemi DV4, Göttingen, Germany). The percentage of deformed organisms was calculated using the following formula: Deformity (D) (fish with deformities/initial fish number) × 100. Also, the coefficient of variation (%) (CV) ((standard deviation of individual weight/mean individual weight) × 100) and the size heterogeneity (weight) (SH) ((final coefficient of variation/initial coefficient of variation)) were calculated.
2.5. Collection of Biological Samples
All procedures were performed according to the Official Mexican Norm (NOM-062-ZOO-1999) [20] of Animal Welfare and with the Declaration of Helsinki.
At the end of the experiment of the first stage, 15 larvae per treatment were euthanized with a cold temperature shock; larvae were in a tray and then placed in an ultra-freezer at −80 °C (Lexicon II ultra-low freezer, Singapore) for 3 min, and then dissected to determine the effect of Trp on growth, digestive enzymes, gene expression, and cannibalism. In the second stage, nine larvae per treatment were used, and the same euthanized protocol was used. For the analysis of the enzymatic activity, the larvae were preserved at −80 °C. Finally, to analyze the gene expression, the larvae were preserved in RNAlater buffer according to the manufacturer’s instructions (Invitrogen, Waltham, MA, USA) at −80 °C. Whole larvae were used in all analyses.
2.6. Cannibalism
In both stages, cannibalism was measured by monitoring larvae 30 min before and 60 min after each feeding. The criteria to determine cannibalism was the following: attack by bites (a fish attacks another fish by bites without the attacker ingesting the prey), partial cannibalism (one fish partially eats another fish), and complete cannibalism (one fish entirely eats another fish). These three behaviors are classified as cannibalism. The formula (fish with cannibalistic behavior/initial fish number) × 100) was used to quantify cannibalism in each treatment. The attacking larvae (cannibal) and the attacked larvae (non-cannibal) were counted with the weight and size being registered. Five larvae were sampled for molecular analysis and five for enzymatic activity, as described earlier.
2.7. Digestive Enzyme Activity
For the quantification of digestive enzymes, we followed the Shuangyao et al. [21] protocol: The larvae were manually macerated inside 1.5 mL tubes on ice. For this, 100 mg of tissue were placed in a total volume of 0.5 mL and centrifuged at 12,000× g at 4 °C for 15 min. The supernatant was recovered and stored at −80 °C in 30 µL aliquots. Soluble protein was determined using the Bradford assay [22]. For the quantification of acid proteases, 0.5% hemoglobin solubilized in 100 mM glycine-HCl pH 2 buffer was used as a substrate. Alkaline proteases were quantified using 0.5% casein solubilized in 50 mM Tris-HCl and 10 mM CaCl at pH 9 [23]. In both assays, the samples were incubated at 37 °C, and the reaction was stopped using 0.5 mL of 20% trichloroacetic acid and centrifuged at 16,000× g for five minutes. Absorbance was read at 280 nm. The extinction coefficient (ε) to calculate the activity of acid and alkaline proteases was 0.005 mL/μM cm. To quantify trypsin activity, 1 mM BAPNA (Nα-Benzoyl-DL-Arginine-P-nitroanilide) dissolved in 50 mM Tris-HCl was used as a substrate, in pH 8 at 37 °C. Trypsin was read at 410 nm using an ε of 8800 mL/μM cm [24]. The Maroux et al. [25] method was used to determine the activity of leucine aminopeptidase, where 0.1 M leucine p-nitroanilide dissolved in DMSO with 50 mM sodium phosphate was the substrate, at pH 7.2, and incubated at 37 °C. Absorbance was measured at 410 nm with an ε of 8800 mL/μM cm. Lipase activity was determined using β-naphthyl acetate (100 mM) dissolved in 50 mM Tris-HCl at as substrate, at pH 7.5, with sodium taurocholate (100 mM) at 37 °C. The reaction was stopped with 0.72 N TCA. Fast Blue (100 mM) and a 1:1 ethanol/ethyl acetate mixture was added, and the absorbance was quantified at 540 nm using ε d 0.02 mL/μM cm [26].
The enzyme activity was determined using the following equations: units by mL (U/mL) = [Δabs × final reaction volume (mL)]/[ε × time (min) × volume extracted (mL)] − 1; specific activity (U/mg protein) = U mL/mg of soluble protein; and the molar extinction coefficient (ε).
2.8. RNA Extraction and Quantitative Reverse Transcription PCR (RT-qPCR)
Total RNA was extracted from complete larvae samples using Trizol (Invitrogen, Waltham, MA, USA), according to the manufacturer’s protocol. The concentration and purity of RNA samples were assessed by the ratio between the absorbance at 260 and 280 nm in a spectrophotometer (Jenway GenovaNano, Cole-Parmer, Staffordshire, UK). RNA (1 μg) was reverse-transcribed (RT) using the SuperScript II kit (Invitrogen, Waltham, MA, USA), with a final volume of 20 μL. RT reactions were performed in a thermocycler (Mastercycler nexus GSX1, Eppendorf AG, Hamburg, Germany). The standard RT program used was as follows: 5 min at 65 °C, 10 min at 25 °C, 50 min at 42 °C (cDNA strand extension), 15 min at 70 °C (reverse transcriptase inactivation), and finally 20 min at 37 °C. Somatostatin receptor 1 (sstr1), tyrosine hydroxylase (th), histidine decarboxylase (hdc), corticotropin-releasing hormone (crh), 5-hydroxytryptamine (serotonin) receptor 1A, G protein-coupled (htr1a), gonadotropin releasing hormone 1 (gnrh1), arginine vasopressin-induced 1 (avpi1), and tryptophan hydroxylase 1 (tph1) for A. tropicus were designed from the species transcriptome (NCBI Accession: PRJNA395289) [27]. These genes were selected due to their influence on aggressive behaviors and interactions with specific neurotransmitters [28,29] (Table 4). The RT-qPCR was performed in a CFX96 Real-Time System (BioRad, Hercules, CA, USA) using 5 μL of EvaGreen Supermix (BioRad), 0.5 μL primers mix, and 4.5 μL of cDNA for a final volume of 10 μL. The RT-qPCR program was used at: 50 °C for 2 min, 95 °C 10 s, followed by 40 cycles at 95 °C 15 s, and 62 °C 1 min. β-actin was used as the reference gene [30]. The relative gene expression was calculated as the fold-change compared to the control and using the 2−ΔΔCt formula [31].
Table 4.
Oligonucleotide design for the real-time polymerase chain reaction (qPCR) of aggressive genes in A. tropicus larvae.
2.9. Effect of the Mitigants on the Ethology of Cannibal Larvae
We identified the effect of Trp (10 g/kg) on the cannibalistic behavior and/or ethology in the second stage experiment, comparing it to the larvae fed with the control diet (CD). Cannibal larvae were placed in 15 × 10 × 8 cm fish tanks. To reduce the effect of stress caused by the transference of the larvae to the experimental tanks, an acclimation time of 15 min was allowed. Subsequently, 15 min video recordings were made (Gopro Hero 7 Silver, Monterey, CA, USA). Two larvae per tank were evaluated under the following challenges: without shelter, with rocks, and with artificial vegetation. The videos were analyzed using Tracker 5.1.5 (Free Software Foundation, Inc., Franklin Street Boston, MA, USA) and BORIS 7.9.24 [32], which allow the identification and measurement of aggressive behavior and shelter preference (rocks and artificial vegetation). The same experiment was carried out on CD-fed larvae to determine the effects of Trp on cannibalism.
2.10. Statistics Analysis
Normality (Kolmogorov–Smirnov) and homoscedasticity (Bartlett) tests were performed. A one-way ANOVA was carried out for all the analysis, and in the case of finding differences, a posteriori test of unequal N HSD (Tukey) was used. A Student’s t-test was used to compare among treatments where applicable. To analyze the gene expression data, non-parametric Kruskal–Wallis and Nemenyi posteriori tests were used. All tests were performed using the software Prism V. 9.0 with a significance value of 0.05.
3. Results
3.1. Growth Indexes and Survival
In the first stage, no significant differences were observed in the weight and total length between A. tropicus larvae fed with the Trp diets and CD (Figure 1). Likewise, no significant differences were observed in survival; however, the larvae fed with Trp presented a slight tendency of better survival (Table 5). There were no differences in AWG, SGR, FCR, PER, K, CV, and SH (p < 0.05). At the end of this stage, the distribution of the weights and sizes of the fish did not show significant differences among the treatments (Figure 2).
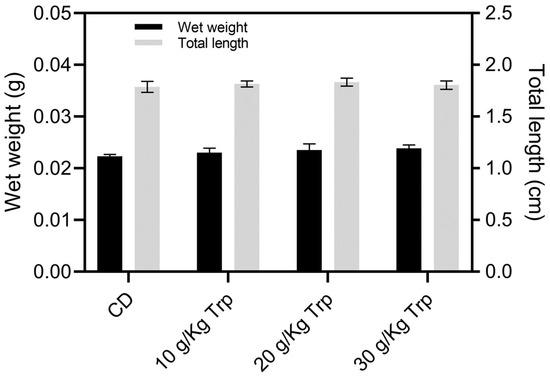
Figure 1.
Growth in the weight (g) and total length (cm) of A. tropicus larvae fed with different Trp concentrations and the control diet (CD). Values are mean ± SD.
Table 5.
Growth performance and feed utilization indexes of A. tropicus larve fed with different concentrations of Trp and the CD (mean ± standard deviation, SD).
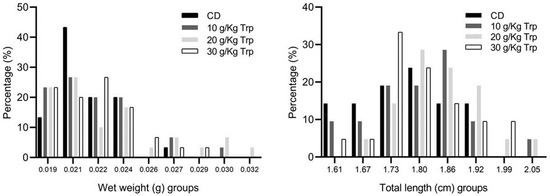
Figure 2.
Wet weight (g) and total length (cm) class distribution by cannibalism effect in A. tropicus larvae fed with Trp and CD.
3.2. Cannibalism and Deformities
In all treatments where Trp was administered, the percentage of cannibalism was lower (56.75–64.25%) compared to that where CD was administered. The lowest percentage of cannibalism was observed for 10 g/kg Trp (56.75 ± 2.47%) and the highest value occurred in the larvae of the CD treatment (64.75 ± 1.76%), presenting a significant difference (p < 0.05). The percentage of fish with deformities was 5.75 ± 0.43%, and no differences were observed between treatments (p > 0.05) (Figure 3).
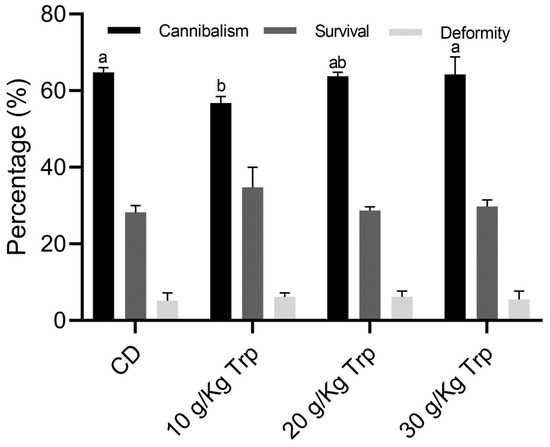
Figure 3.
Cannibalism, survival, and deformity percentages in A. tropicus larvae fed with different Trp concentrations. Values are mean ± SD. Significant differences among the diets are indicated by different letters (p < 0.05).
The larvae identified as cannibals and non-cannibals had an average weight of 0.025 ± 0.002 g and 0.023 ± 0.003 g, respectively (t-test, p = 0.007). The larvae identified as cannibals had a total size of 1.83 ± 0.09 cm, and the larvae identified as non-cannibals a total size of 1.72 ± 0.10 cm (Figure 4) (t-test, p < 0.0001). The average difference recorded between the weight of a cannibal fish and its prey was 0.003 ± 0.003 g (16.12 ± 13.44%). In total size, the average difference between the cannibal fish and its prey was 0.15 ± 0.06 cm (8.96 ± 3.72%).
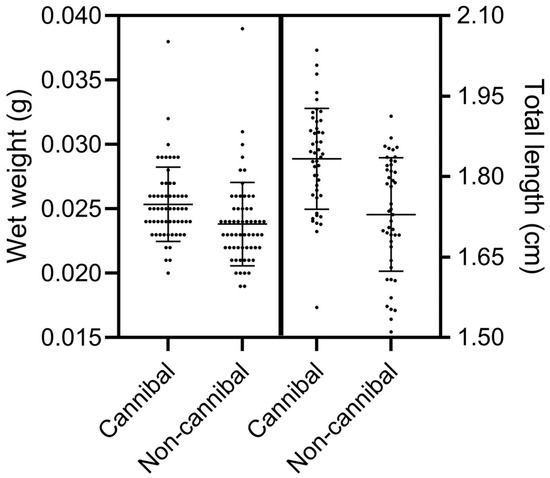
Figure 4.
Wet weight (g) (n = 60) and total length (cm) (n = 45) of A. tropicus cannibal and non-cannibal larvae. Values are mean ± SD.
To continue to stage two, based on the results obtained, the 10 g/kg Trp diet was selected in which the lowest percentage of cannibalism and the highest survival occurred. The administration of this feed was continued only to larvae identified as cannibals for 10 more days.
3.3. Growth Indexes and Survival of Cannibals
The cannibal larvae of the CD treatment obtained a greater final weight (0.179 ± 0.03 g), compared to those treated with 10 g/kg Trp (0.080 ± 0.01 g) (t-test, p = 0.0224). The same was observed for the total size (3.68 ± 0.34 cm in CD and 2.72 ± 0.18 cm in 10 g/kg Trp) (Figure 5) The highest survival was recorded in the 10 g/kg Trp group with 75.00 ± 7.07%, presenting significant differences compared to the CD group (30.00 ± 17. 32%) (t-test, p = 0.0044). The AWG (0.13 ± 0.03) (t-test, p = 0.019), SGR (14.62 ± 2.87) (t-test, p = 0.029), and PER (0.17 ± 0.01) (t-test, p = 0.041) were higher for CD. Also, the CD group showed a higher CV (55.64 ± 6.84) compared to the treatment of 10 g/kg Trp (26.74 ± 14.20) (t-test, p = 0.015) and SH (6.07 ± 0.75), showing significant differences compared to the 10 g/kg Trp group (t-test, p = 0.012). The FCR value for the 10 g/kg Trp treatment was 12.43 ± 1.60, showing a significant difference compared to the CD group (5.66 ± 0.62) (t-test, p = 0.030). FI and K did not show any differences (Table 6).
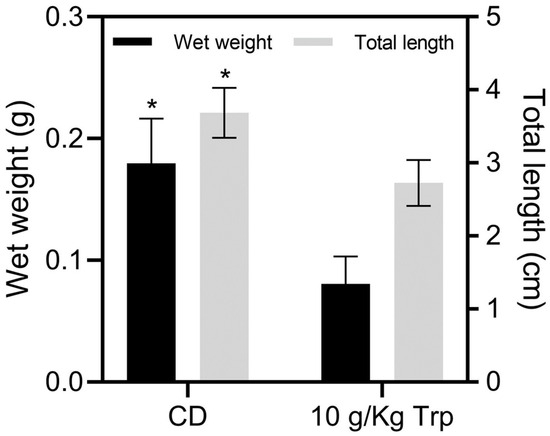
Figure 5.
Growth in the weight (g) and total length (cm) of A. tropicus cannibal larvae fed with 10 g/kg Trp and CD. Values are mean ± SD. Significant differences among the diets are indicated by an asterisk mark (p < 0.05).
Table 6.
Growth performance and feed utilization indexes of A. tropicus cannibal larvae fed with 10 g/kg Trp and CD (mean ± standard deviation, SD).
3.4. Cannibalism
The percentage of cannibalism was 20.0 ± 10.0% in the fish fed with 10 g/kg Trp, which was significantly different compared to the CD treatment (76.66 ± 5.77%) (t-test, p = 0.0011) (Figure 6). At the end of the bioassay, the modification of the distribution of the weights and sizes of the fish by treatment was observed, directly related to the results of cannibalism (Figure 7).
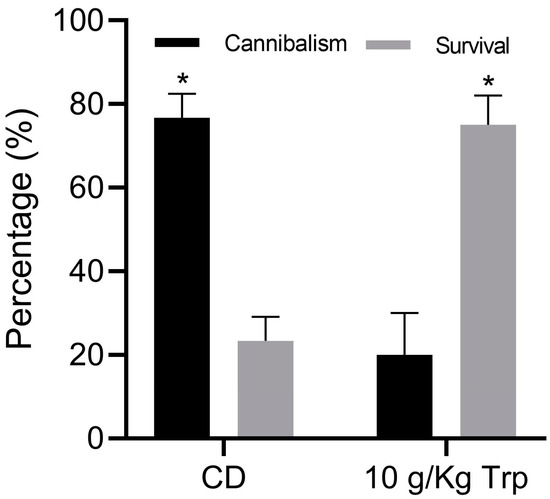
Figure 6.
Survival and cannibalism of A. tropicus cannibal larvae fed with 10 g/kg Trp and CD. Values are mean ± SD. Significant differences among the diets are indicated by an asterisk mark (p < 0.05).
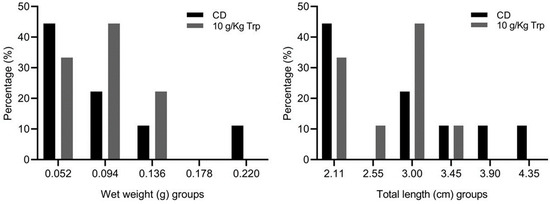
Figure 7.
Wet weight (g) and total length (cm) class distribution by cannibalism effect in A. tropicus cannibal larvae fed 10 g/kg Trp and CD. Values are mean ± SD.
3.5. Digestive Enzyme Activity
In the first stage, larvae from the CD treatment showed a greater activity in acid protease (p < 0.05) compared to those from the 10 and 20 g/kg Trp groups. Also, the CD treatment obtained a greater activity for alkaline protease, with a significant difference with all Trp treatments (p < 0.05). For trypsin, 20 g/kg Trp (p < 0.05) was statistically different compared to the CD treatment. The 10 and 20 g/kg Trp treatments showed the greatest activity for lipase compared to the other treatments (p < 0.05). Leucine aminopeptidase did not show any difference among treatments (p > 0.05).
When comparing the digestive enzyme activity between cannibals and non-cannibals, the acid protease activity was greater for cannibals and non-cannibals of the 10 g/kg Trp treatment (p < 0.05). CD cannibal and non-cannibal larvae presented a greater alkaline protease activity (p < 0.05). Trypsin enzymatic activity between cannibals and non-cannibals was higher in the cannibals of the CD treatment (p < 0.05). All treatments with Trp led to a greater leucine aminopeptidase activity than CD; however, no difference was recorded between cannibals and non-cannibals. The cannibal larvae from the 10 g/kg Trp treatment showed the greatest activity for lipase (t-test, p < 0.05).
In the second stage, the larvae treated with Trp recorded a greater activity in acidic and alkaline proteases and leucine aminopeptidase (t-test, p < 0.05). The larvae fed with CD recorded a higher trypsin activity (t-test, p < 0.05). No statistical differences were observed in lipase activity for CD and the 10 g/kg Trp treatment (Table 7).
Table 7.
Digestive enzymatic activities (mean ± standard deviation, SD) of A. tropicus larvae fed with different concentrations of Trp and CD.
3.6. Gene Expression
When comparing cannibal and non-cannibal larvae, all cannibals in the 20 g/kg Trp treatment showed overexpression in all genes, followed by 30 g/kg Trp with overexpression only in avpi1, crh, htr1a, sstr1, th, and t ph1 genes. In non-cannibal larvae, the 10 g/kg Trp treatment showed a greater expression, with statistical differences compared to the other treatments and with cannibal larvae from the same treatment (avpi1, crh, hdc, htr1a, sstr1, and th). tph1 was overexpressed in all treatments and was significantly different compared to non-cannibals (Figure 8).
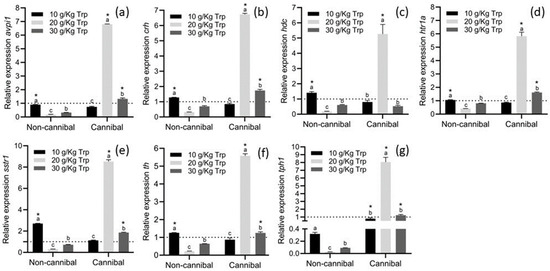
Figure 8.
Relative gene expression of avpi1 (a), crh (b), hdc (c), htr1a (d), sstr1 (e), th (f), and tph1 (g) in A. tropicus larvae fed with different Trp concentrations. Relative mRNA levels of the indicated genes were measured by RT-qPCR using β-actin as the reference gene. Data are presented as fold-changes in the mRNA levels, in comparison to the sample with CD (dotted line) (n = 3, mean ± SD). Significant differences with respect to the CD group (dotted line) are indicated by different letters (p < 0.05) Significant differences between the cannibal and non-cannibal larvae are indicated by * (p < 0.05).
In the second stage, larvae from the 10 g/kg group showed overexpression of avpi1, crh, and htr1a genes (p < 0.05) compared to those from the CD group. The same was observed for gnrh (p > 0.05). A subexpression was observed in the tph1, th, sstr1, and hdc genes (p < 0.05) of larvae fed with 10 g/kg Trp (Figure 9).
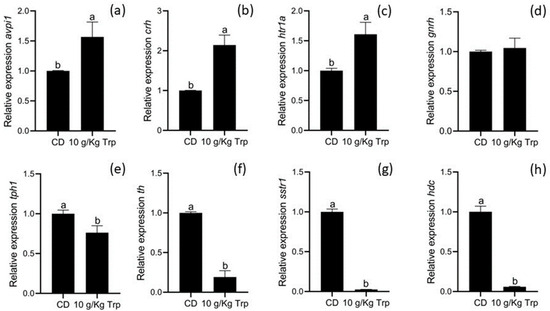
Figure 9.
Relative gene expression of avpi1 (a), crh (b), htr1a (c), gnrh (d), tph1 (e), th (f) sstr1 (g), and hdc (h) in A. tropicus cannibal larvae fed with 10 g/kg Trp. Relative mRNA levels of the indicated genes were measured by RT-qPCR using β-actin as the reference gene. Data are presented as fold-changes in the mRNA levels, in comparison to the sample with CD (n = 3, mean ± SD). Significant differences with respect to the CD group are indicated by different letters (p < 0.05).
3.7. Behavior
In total, 12 videos were obtained (185.8 min), and a total of 12 events were recorded, of which 9 were defensive behaviors (escapes), where there was no contact between fish. The remaining three events were direct attacks (with contact). The organisms with rocks as refuge were present in three events, followed by without refuge in six events; finally, only three events were recorded for the organisms with vegetation as refuge. Regarding the effect of diet, larvae fed with 10 g/kg Trp displayed 25% of aggressive behaviors and those fed with CD 75%. Regarding the number of attacks, cannibals fed with 10 g/kg Trp did not display aggressive behaviors, unlike those fed with CD. The use of artificial vegetation also led to zero aggressive behaviors in both treatments (Table 8).
Table 8.
Attack types and cannibalism behavior of A. tropicus larvae fed with 10 g/kg Trp and CD in combination with different shelters.
4. Discussion
4.1. Growth
Trp is an essential amino acid (AA) in fish; due to this, it is necessary to know the requirement in important species (Salmo gairdneri, Oncorhynchus mykiss, and Rhamdia quelen). This value ranges from around 0.1% to 0.5% [33]. In this sense, the formulation of the CD diet used contained 1.06% of Trp according to the total amino acid analysis carried out. The relationship of Trp functions in the development of fish larvae has been well studied; it has been demonstrated that a low Trp administration is related to the presence of deformities (scoliosis, lordosis, and eye cataracts) [34]. Furthermore, its administration has been related to the modulation of aggressiveness, feed intake, immune system, stress, oxidative damage, and feed efficiency ratio [35,36,37,38]. Administering a high concentration of Trp can activate the kynurenine pathway, thus increasing kynurenic acid concentrations, which have been linked to negative physiological effects, such as increased stress and a decreased immune system [39]. In coho salmon (Oncorhynchus kisutch), exposure to 50 µL/mg of Trp compared to 5 µL/mg for 3 h significantly increases the expression of kynurenine aminotransferase 2 (KIAT 2) [40]. Therefore, the administration of its optimal level must be sought for each species.
The effect of Trp administration on growth has been reported for Asian seabass juveniles (Lates calcarifer), in which Trp reduced growth and feed intake, although it increased serotonin levels in the brain [41]. In grouper juveniles (Epinephelus coioides), administering 0.25%, 0.5%, and 1% of tryptophan in the diet resulted in a lower height and weight than those in the control [37]. This same effect was observed in pikeperch (Sander lucioperca) larvae: using 5, 10, and 20 g Trp per kg, the weight and height were lower than those in the control treatment [42]; and in Pabda (Ompok bimaculatus) fry, the fish growth with Trp (2, 4, and 6 ppm) was lower than that in the control [17]. A similar result but only with high levels of Trp was found in Indian major carp (Cirrhinus mrigala), and in Indian catfish (Heteropneustes fossilis), a high concentration of Trp in the diet decreased growth [43,44]. The A. tropicus larvae did not show a significant difference in growth in the first stage of this study, only a slight tendency of improved growth in weight and size compared to those fed with CD. However, in the second stage, the cannibal larvae fed with Trp (10 g/kg) had a lower growth and final size than the CD larvae. This difference in growth between the two stages of the study can be attributed to cannibalism, due to the “jumper” effect. This effect consists of a rapid gain in weight and size when a cannibal larva consumes another larva [45]. This can lead to an increase in the differences between sizes and weights. This statement was proved in our study, in which the values of CV and SH were higher in the CD group, proving that the high cannibalism of this treatment (76.66 ± 5.77%) results in a low survival (23.33 ± 5.77%) and generating a great heterogeneity in size and weight of the fish fed with CD, unlike the larvae fed with Trp (cannibalism: 20.0 ± 10.0%; survival: 75.0 ± 7.07%). Similar results have been reported in Asian seabass larvae (Lates calcarifer), where the coefficient of size variation (%) and size heterogeneity decreased with the increase in the level of Trp supplementation [46]. This heterogeneity in size may also be a trigger for cannibalism, for example, in the Atlantic cod (Gadus morhua), African catfish (Heterobranchus longifili), giant grouper (Epinephelus lanceolatus), and black rockfish (Sebastes schlegelii) [47,48,49,50].
4.2. Cannibalism
Although a decreasing trend in cannibalism due to the administration of Trp was seen in the first stage, it was in the second where it was significantly clearer. These results coincide with those for Asian seabass (Lates calcarifer) fry, which when using 0.5, 1.0, 1.5, and 2% of Trp displayed a decreased cannibalism and increased survival compared to the control, with the lowest percentage (0.5) being the best treatment [46]. In grouper (Epinephelus coioides) juveniles, the use of 0.25%, 0.5%, and 1% of tryptophan in the diet decreased cannibalism, increasing the serotonin concentration (5-HT) in the brain [37]. In pikeperch (Sander lucioperca) larvae fed with 5, 10, and 20 g Trp per kilogram, the levels of 5-HT in fish tissue increased and cannibalism levels decreased [42]. Also, in Pabda (Ompok bimaculatus) fry, Trp (2, 4, and 6 ppm) decreased cannibalism and increased survival compared to the control treatment [17]. In Atlantic cod (Gadus morhua), Trp (28 g/kg) supplemented to juveniles decreased aggressivity [51]. In rainbow trout (Oncorhynchus mykiss), the increase in the concentration of Trp in the plasma and brain decreased the aggressive behavior in dominant fish [52,53], which is related to the action of the 5-HT neurotransmitter. Serotonin (5-HT) is a neurotransmitter that has been related to behaviors such as aggression, reaction to stress, feeding, maturation, and sexual behavior [54].
The synthesis of 5-HT takes place in serotonergic neurons, where Trp serves as a precursor. The enzyme tryptophan hydrolase hydroxylates tryptophan into L-5-hydroxytryptophan, which is subsequently decarboxylated by the enzyme L-amino acid decarboxylase, generating 5-hydroxytryptamine (5-HT). Continuing the process, 5-HT is degraded by the enzyme monoamine oxidase, transforming it into 5-hydroxyindole acetaldehyde. At the end of the reaction, the enzyme aldehyde dehydrogenase produces 5-hydroxyindoleacetic acid (5-HIAA) [54,55,56]. The bioavailability of Trp in the brain of organisms is important as it allows 5-HT synthesis to take place. In this sense, Trp competes with other amino acids (AAs) (valine, isoleucine, leucine, tyrosine, phenylalanine, and methionine) to enter the brain of organisms, which makes the balance between Trp, the other AAs, and carbohydrates important (since carbohydrates promote the uptake of AAs, except for Trp) and thus generates adequate concentrations of AAs in the plasma, allowing the flow of Trp to the brain [55] and thereby the synthesis of 5-HT. The use of Trp as a mitigator of cannibalism in fish is based on the principle of increasing the bioavailability of this amino acid, which functions as an essential substrate for the synthesis of 5-HT and, in turn, reduces aggressiveness in fish, promoting the reduction in cannibalism. On the other hand, the differences between the total weight and size of a cannibal fish and its prey were 16.39 ± 10.864% and 15.23 ± 5.68%, respectively, similar percentages to those reported by Sepúlveda-Quiroz et al. [57].
4.3. Digestive Enzymes
The interaction between Trp and digestive enzymes has been studied in several works; however, this interaction related to cannibalism has not yet been addressed. For A. tropicus larvae, it has been reported that the functionality of its digestive system and the differentiation of its organs are completely developed at 9 DAH [58] and, in addition to their anatomy (mouth width and depth, lengths of upper and lower jaw, and mouth depth angle), allow them to capture and ingest their own conspecifics (intracohort cannibalism) [57]. With the administration of Trp, the enzymes acid and alkaline proteases, trypsin, and leucine aminopeptidase registered a lower activity than with that of CD, except for lipases. It has been shown in vitro that Trp can be an activator of amylase, lipase, and trypsin [59]. An increase in the enzymatic activity is reflected in a greater hydrolysis of macronutrients, releasing a greater number of micronutrients [60], which are used by the body, generating a greater absorption of these microelements, resulting in optimal growth in fish [61]. In our study, cannibal and non-cannibal larvae presented significant differences in enzymatic activity; trypsin activity was higher in all cannibals, contrasting with the activity of lipase enzymes, which were more expressed in non-cannibal larvae. The function of trypsin is to hydrolyze proteins by breaking peptide bonds [62]. In turn, lipases promote the digestion of lipids, participating in the denaturation of triacylglycerol to diacylglycerol, subsequently converting it to monoacylglycerol [63].
In the second stage, cannibal larvae fed with Trp (10 g/kg) showed a greater enzymatic activity (acid and alkaline proteases and leucine aminopeptidase) than the CD cannibal larvae. The activity of trypsin was greater in the cannibal larvae of the CD treatment. In juveniles of Jian carp (Cyprinus carpio), when fed with a concentration of 3.8 g/kg of Trp in the diet, the organisms increased their growth and obtained a greater activity of digestive enzymes (trypsin, lipase, and α-amylase) and brush border enzymes and an increase in the height of the intestinal folds [64]. On the other hand, Trp has been considered as a component that can improve digestive enzymatic activity through two components, melatonin (a Trp metabolite) and cholecystokinin (a regulatory hormone), both of which act on the secretion of pancreatic enzymes [65,66], such as trypsin, chymotrypsin, lipase, and amylase [67]. In the case of the administration of Trp in juvenile silver catfish (Rhamdia quelen), there was no difference in trypsin and chymotrypsin; however, by performing a polynomial regression, an increase in acid protease activity was identified with respect to the increase in Trp (1–3.1 g/kg) [68]. Changes in the physiology of two salmon species (Salmo salar and Oncorhynchus kisutch) have been observed following Trp inclusion, with modifications in digestive enzymatic activity, increased 5-HT concentrations, and decreased cortisol levels [69,70].
4.4. Gene Expression
The gene expression results show a significant difference between the cannibal and non-cannibal larvae, where cannibals exposed to a high Trp treatment have a greater overexpression. Trp functions as a substrate in the synthesis of 5-HT, a neurotransmitter that regulates aggressive behavior, among other aspects [54,56]. In zebra fish (Danio rerio), seven neurological pathways were identified (hypothalamo-neurohypophysial system (HNS), serotonin (5-HT), somatostatin, dopamine, hypothalamo-pituitary-interrenal (HPI), hypothalamo-pituitary-gonadal (HPG), and histamine) in relation to the expressed genes for aggressiveness [28]. Among the genes that participate in these metabolic pathways are those used in this study (sstr1, th, hdc, crh, htr1a, gnrh1, avpi1, and tph1) and whose relation to aggressive behavior has already been reported in humans, mice, and fish [29].
In the second stage, the cannibal larvae of A. tropicus fed with Trp showed an overexpression of avpi1 (HNS), crh (HPI), and htr1a (5-HT), as well as a subexpression of tph1(5-HT), th (dopamine), sstr1 (somatostatin), and hdc (histamine) with respect to the cannibal larvae fed with CD. The expression of avpil (arginine vasopressin-like) is related to behaviors such as aggression and social interactions; in particular, overexpression has been detected in dominant male zebra fish (Danio rerio) [28,71]. On the other hand, the HPI pathway is responsible for different processes, such as stress response [39]; in this sense, the corticotropin-releasing hormone (CRH, or corticotropin-releasing factor (CRF)) works as an activator of this pathway [72]. In rainbow trout (Oncorhynchus mykiss), the use of CRF through injections decreased the number of attacks, increased locomotion and head movements, and increased the concentrations of serotonin, 5-HIAA, and dopamine [73,74]. When comparing dominant and subordinate males of Astatotilapia burtoni, the relative abundance of mRNA of 5-HT transporters, such as htr1a and htr2a, in the telencephalon was higher in subordinate than in dominant males, and was related to an increase in 5-HT production [75]. In this sense, the use of a specific agonist (8-OH-DPAT) in HTR1A receptors decreases aggression in fighting fish (Betta splendens) [76]. In male zebra fish (Danio rerio), a differentiation between dominants and subordinates was identified with respect to the genes involved in sexual behavior (cyp19a1b, cyp17, hsd11b2, hsd17b3, and ar) and aggressiveness (avplr1b, tph1b, htr1a, sst1, sstr1, th, and slc6a3), with the dominant males being the ones with the highest expression [77]. Although the social components have not yet been studied in A. tropicus larvae, the results obtained indicate that the HNS, 5-HT, and HPI pathways were modified using Trp, and thus a decrease in cannibalism was observed.
4.5. Behavior
The effect of Trp administration can be seen in the absence of aggressive behavior in the larvae of A. tropicus under the influence of refuge. Regardless of the presence or absence of any type of shelter (rocks and artificial vegetation), the larvae fed with Trp (10 g/kg) did not attack, unlike the larvae fed with CD. Of the three scenarios analyzed, the artificial vegetation did not lead to attacks among the larvae fed with CD, as reported by Sepúlveda-Quiroz et al. [57]. The use of enriched environments attempts to replicate the conditions of the natural environment in the culture ponds, improving stress levels by reducing aggression, cannibalism, energy expenditure, injuries, and diseases [78,79,80,81].
5. Conclusions
The use of 10 g/kg of Trp in the diet of A. tropicus larvae reduces cannibalism, improving survival, specifically proven in larvae with cannibalistic behavior. Both cannibal and non-cannibal larvae showed a difference in digestive enzyme activity and expression of aggressiveness genes. The inclusion of tryptophan generates the activation of the HNS, 5-HT, and HPI pathways, demonstrated by the overexpression of the avpi1, crh, and htr1a genes. Furthermore, cannibal behaviors did not occur with the use of Trp, regardless of the type of shelter, although artificial vegetation was better than other shelters. It is recommended that studies continue to focus on explaining other effects of Trp in A. tropicus.
Author Contributions
C.A.S.-Q., C.S.A.-V. and R.M.-G. designed and planned the bioassays; C.A.S.-Q., G.M.P.-J. and G.G.A.-A. conducted the experiment and sample collection; C.A.S.-Q., O.M.-P., L.D.J.-M. and G.M.P.-J. carried out the biochemical analyses; C.A.S.-Q., L.D.J.-M. and C.S.A.-V. conducted the molecular analyses; C.A.S.-Q., C.A.A.-G., M.A.G.-E. and D.T.-R. performed the statistical analysis; C.A.S.-Q., C.S.A.-V., C.A.A.-G. and R.M.-G. wrote the paper. All authors have read and agreed to the published version of the manuscript.
Funding
This work was supported by the National Council of Science and Technology of Mexico “Estudio de la fisiología digestiva en larvas y juveniles de pejelagarto (Atractosteus tropicus) con base en técnicas histológicas, bioquímicas y moleculares” CB-2016-01-282765. And for the thesis fellowship for Doctoral graduate studies (CVU 858306).
Institutional Review Board Statement
The study was conducted in accordance with the Declaration of Helsinki, and the protocol was approved by Secretaría de Agricultura, Ganadería, Desarrollo Rural, Pesca y Alimentación (NOM-062-ZOO-1999, 2001) [20].
Data Availability Statement
The data presented in this study are available upon request from the corresponding authors.
Acknowledgments
The authors thanks the technicians and lab members from DACBiol, DAMJM, UABC and CIBNOR for technical assistance.
Conflicts of Interest
The authors have no conflicts of interest to declare that are relevant to the content of this article.
References
- Pereira, L.S.; Agostinho, A.A.; Winemiller, K.O. Revisiting cannibalism in fishes. Rev. Fish Biol. Fish. 2017, 27, 499–513. [Google Scholar] [CrossRef]
- Aguilera, C.; Mendoza, R.; Iracheta, I.; Márquez, G. Digestive enzymatic activity on Tropical gar (Atractosteus tropicus) larvae fed different diets. Fish Physiol. Biochem. 2012, 38, 679–691. [Google Scholar] [CrossRef] [PubMed]
- Márquez, C.G. Biología y tecnología para el cultivo del pejelagarto Atractosteus tropicus en el sureste de México. In Redes nacionales de Investigación en Acuicultura. Memorias de la IV Reunión. Secretaría de Medio Ambiente Recursos Naturales y Pesca (SEMARNAP); Alvarez, P., Guzman, M., Contreras, S., Silva, A., Eds.; Instituto Nacional de la Pesca: México City, Mexico, 2000; pp. 265–267. [Google Scholar]
- Márquez-Couturier, G.; Vázquez-Navarrete, C.J. Estado del arte de la biología y cultivo de pejelagarto (Atractosteus tropicus). Agroproductividad 2015, 8, 44–51. [Google Scholar]
- Nelson, J.S. Fishes of the World, 4th ed.; John Wiley & Sons: Hoboken, NJ, USA, 2006; 601p, ISBN 978-0471250319. [Google Scholar]
- Frías-Quintana, C.; Álvarez-González, C.; Tovar-Ramírez, D.; Martínez-García, R.; Camarillo-Coop, S.; Peña, E.; Galaviz, M. Use of potato starch in diets of tropical gar (Atractosteus tropicus, Gill 1863) larvae. Fishes 2017, 2, 3. [Google Scholar] [CrossRef]
- Palma-Cancino, D.J.; Martínez-García, R.; Álvarez-González, C.A.; Camarillo-Coop, S.; Peña-Marín, E.S. Evaluation of feeding strategies in tropical gar (Atractosteus tropicus Gill) larvae: Growth, survival and cannibalism. Ecosist. Recur. Agropecu. 2019, 6, 273–281. [Google Scholar] [CrossRef]
- Jiménez-Martínez, L.D.; Tovar-Ramírez, D.; Álvarez-González, C.A.; Peña-Marín, E.; Camarillo-Coop, S.; Martínez-García, R.; Palacios-Mechetnov, E.; Martínez-Yáñez, R.; Concha-Frias, B. Assessment of dietary lipid sources in tropical gar, Atractosteus tropicus larvae: Growth parameters and intermediary lipogenic gene expression. Aquac. Res. 2020, 51, 2629–2640. [Google Scholar] [CrossRef]
- Leathwood, P.D. Tryptophan availability and serotonin synthesis. Proc. Nutr. Soc. 1987, 46, 143–156. [Google Scholar] [CrossRef]
- Smith, T.K.; Seddon, I.R. Synergism demonstrated between Fusarium mycotoxins. Feedstuffs 1998, 70, 12–17. [Google Scholar]
- Akiyama, T.; Shiraaishi, M.; Yamamoto, T.; Unuma, T. Effect of dietary tryptophan on maturation of ayu Plecoglossus altivelis. Fish. Sci. 1996, 62, 776–782. [Google Scholar] [CrossRef]
- Comai, S.; Bertazzo, A.; Brughera, M.; Crotti, S. Tryptophan in health and disease. Adv. Clin. Chem. 2020, 95, 165–218. [Google Scholar] [CrossRef]
- Maler, L.; Ellis, W.G. Inter-male aggressive signals in weakly electric fish are modulated by monoamines. Behav. Brain Res. 1987, 25, 75–81. [Google Scholar] [CrossRef] [PubMed]
- Munro, A.D. Effects of melatonin, serotonin, and naloxone on aggression in isolated cichlid fish (Aequiidens pulcher). J. Pineal Res. 1986, 3, 257–262. [Google Scholar] [CrossRef] [PubMed]
- Adams, C.F.; Liley, N.R.; Gorzalka, B.B. PCPA increases aggression in male firemouth Cichlids. Pharmacology 1996, 55, 328–330. [Google Scholar] [CrossRef] [PubMed]
- Biswas, P.; Rawat, P.; Patel, A.B.; Jena, A. Dietary supplementation of L-tryptophan: Effect on growth and survival of Pabda, Ompok bimaculatus (Bloch) fry. J. Appl. Aquac. 2018, 31, 322–336. [Google Scholar] [CrossRef]
- Biswas, P.; Rawat, P.; Jena, A.K.; Patel, A.B.; Pandey, P.K. Effect of L-tryptophan on growth and survival of Pabda Fry, Ompok bimaculatus (Bloch, 1794). Fish. Technol. Soc. Fish. Technol. 2019, 56, 29–33. [Google Scholar]
- Álvarez-González, C.A.; Civera-Cerecedo, R.; Ortiz-Galindo, J.L.; Dumas, S.; Moreno-Legorreta, M.; Grayeb-Del, A.T. Effect of dietary protein level on growth and body composition of juvenile spotted sand bass, Paralabrax maculatofasciatus, fed practical diets. Aquaculture 2001, 194, 151–159. [Google Scholar] [CrossRef]
- Association of Official Analytical Chemists (AOAC). Official Methods of Analysis, 17th ed.; Association of Official Analytical Chemists: Arlington, VA, USA, 2000. [Google Scholar]
- NOM-062-ZOO-1999, 2001. Norma Oficial Mexicana: Especificaciones técnicas para la producción, cuidado y uso de los animales de laboratorio. Available online: https://www.gob.mx/senasica/documentos/nom-062-zoo-1999 (accessed on 7 June 2022).
- Shuangyao, W.; Jiang, Z.; Mingguang, M.; Shoukang, M.; Yang, S.; Youzhen, S. Effects of seawater pH on survival, growth, energy budget and oxidative stress parameters of juvenile turbot scophthalmus maximus. Iran. J. Fish. Sci. 2018, 17, 675–689. [Google Scholar] [CrossRef]
- Bradford, M.M. A rapid and sensitive method for the quantization of microgram quantities of protein utilizing the principle of protein-dye binding. Anal. Biochem. 1976, 72, 248–254. [Google Scholar] [CrossRef]
- Sarath, G.; de La Motte, R.S.; Wagner, F.W. Protease assay methods. In Proteolytic Enzymes: A Practical Approach; Beynon, R.J., Bonde, J.S., Eds.; Oxford University Press: Oxford, UK, 1989; pp. 25–54. [Google Scholar]
- Erlanger, B.F.; Kokowsky, N.; Cohen, W. The preparation and properties of two new chromogenic substrates of trypsin. Arch. Biochem. Biophys. 1961, 95, 271–278. [Google Scholar] [CrossRef]
- Maroux, S.; Louvard, D.; Barath, J. The aminopeptidase from hog intestinal brush border. Biochim. Biophys Acta Enzymol. 1973, 321, 282–295. [Google Scholar] [CrossRef]
- Versaw, W.; Cuppett, S.L.; Winters, D.D.; Williams, L.E. An improved colorimetric assay for bacterial lipase in nonfat dry milk. J. Food Sci. 1989, 54, 232–254. [Google Scholar] [CrossRef]
- Martínez-Burguete, T.; Peña-Marin, E.S.; García-Gasca, A.; Alvarez-González, C.A.; Llera-Herrera, R. Nutrigenomic marker discovery by de novo transcriptomic sequencing during early development of the tropical gar (Atractosteus tropicus). Aquac. Res. 2021, 52, 3829–3842. [Google Scholar] [CrossRef]
- Filby, A.L.; Paull, G.C.; Hickmore, T.F.A.; Tyler, C.R. Unravelling the neurophysiological basis of aggression in a fish model. BMC Genom. 2010, 11, 498. [Google Scholar] [CrossRef]
- de Abreu, M.S.; Giacomini, A.C.; Genario, R.; dos Santos, B.E.; da Rosa, L.G.; Demin, K.A.; Wappler-Guzzetta, E.A.; Kalueff, A.V. Neuropharmacology, pharmacogenetics and pharmacogenomics of aggression: The zebrafish model. Pharmacol. Res. 2019, 141, 602–608. [Google Scholar] [CrossRef] [PubMed]
- Jiménez-Martínez, L.D.; Morales-Garcia, V.; Frias-Quintana, C.A.; Castillo-Collado, A.C.; Asencio-Alcudia, G.G.; Alvarez-Villagomez, C.S.; Peña-Marín, E.S.; Concha-Frias, B.; Alvarez-Gonzalez, C.A. Quality evaluation of reference gene expression on different tissues in adults of tropical gar Atractosteus tropicus. Pak. J. Zool. 2021, 54, 363–372. [Google Scholar] [CrossRef]
- Livak, K.J.; Schmittgen, T.D. Analysis of relative gene expression data using realtime quantitative PCR and the 2−ΔΔC(T) method. Methods 2001, 25, 402–408. [Google Scholar] [CrossRef] [PubMed]
- Friard, O.; Gamba, M. BORIS: A free, versatile open-source event-logging software for video/audio coding and live observations. Methods Ecol. Evol. 2016, 7, 1325–1330. [Google Scholar] [CrossRef]
- Mai, K.; Xue, M.; He, G.; Xie, S.; Kaushik, S.J. Protein and amino acids. In Fish Nutrition; Academic Press: Cambridge, MA, USA, 2022; pp. 181–302. [Google Scholar]
- Walton, M.J.; Coloso, R.M.; Cowey, C.B.; Adron, J.W.; Knox, D. The effects of dietary tryptophan levels on growth and metabolism of rainbow trout (Salmo gairdneri). Br. J. Nutr. 1984, 51, 279. [Google Scholar] [CrossRef]
- Coloso, R.M.; Murillo-Gurrea, D.P.; Borlongan, I.G.; Catacutan, M.R. Tryptophan requirement of juvenile Asian sea bass Lates calcarifer. J. Appl. Ichthyol. 2004, 20, 43–47. [Google Scholar] [CrossRef]
- Hoseini, S.M.; Mirghaed, A.T.; Mazandarani, M.; Zoheiri, F. Serum cortisol, glucose, thyroid hormones’ and non-specific immune responses of Persian sturgeon, Acipenser persicus to exogenous tryptophan and acute stress. Aquaculture 2016, 462, 17–23. [Google Scholar] [CrossRef]
- Hseu, J.; Lu, F.; Su, H.; Wang, L.; Tsai, C.; Hwang, P. Effect of exogenous tryptophan on cannibalism, survival and growth in juvenile grouper, Epinephelus coioides. Aquaculture 2003, 218, 251–263. [Google Scholar] [CrossRef]
- Jiang, W.D.; Wen, H.L.; Liu, Y.; Jiang, J.; Kuang, S.Y.; Wu, P.; Zhao, J.; Tang, L.; Tang, W.N.; Zhang, Y.A.; et al. The tight junction protein transcript abundance changes and oxidative damage by tryptophan deficiency or excess are related to the modulation of the signalling molecules, NF-κB p65, TOR, caspase-(3,8,9) and Nrf2 mRNA levels, in the gill of young grass carp (Ctenopharyngodon idellus). Fish Shellfish Immunol. 2015, 46, 168–180. [Google Scholar] [CrossRef] [PubMed]
- Wendelaar-Bonga, S.E. The stress response in fish. Physiol. Rev. 1997, 77, 591–625. [Google Scholar] [CrossRef] [PubMed]
- Vargas-Chacoff, L.; Nualart, D.; Vargas-Lagos, C.; Dann, F.; Muñoz, J.L.P.; Pontigo, J.P. Tryptophan and cortisol modulate the kynurenine and serotonin transcriptional pathway in the kidney of Oncorhynchus kisutch. Animals 2023, 13, 3562. [Google Scholar] [CrossRef] [PubMed]
- Chi, C.C.; Shiu, Y.L.; Lin, H.L.; Liu, C.H. Immune response and disease resistance of barramundi, Lates calcarifer (Bloch), offered diets supplemented with replete levels of tryptophan or whey. J. World Aquac. Soc. 2017, 49, 127–140. [Google Scholar] [CrossRef]
- Król, J.; Zakęś, Z. Effect of dietary l-tryptophan on cannibalism, survival and growth in pikeperch Sander lucioperca (L.) post-larvae. Aquac. Int. 2015, 24, 441–451. [Google Scholar] [CrossRef]
- Ahmed, I. Dietary amino acid l-tryptophan requirement of fingerling Indian catfish, Heteropneustes fossilis (Bloch), estimated by growth and haemato-biochemical parameters. Fish Physiol. Biochem. 2012, 38, 1195–1209. [Google Scholar] [CrossRef] [PubMed]
- Ahmed, I.; Khan, M.A. Dietary tryptophan requirement of fingerling Indian major carp, Cirrhinus mrigala (Hamilton). Aquac. Res. 2005, 36, 687–695. [Google Scholar] [CrossRef]
- Baras, E.; Silva Del Aguila, D.V.; Montalvan Naranjos, G.V.; Dugué, R.; Koo, F.C.; Duponchelle, F.; Renno, J.F.; Garcia-Dávila, C.; Nuñez, J. How many meals a day to minimize cannibalism when rearing larvae of the Amazonian catfish Pseudoplatystoma punctifer? The cannibal’s point of view. Aquat. Living Resour. 2011, 24, 379–390. [Google Scholar] [CrossRef]
- Kumar, P.; Kailasam, M.; Sethi, S.N.; Sukumaran, K.; Biswas, G.; Subburaj, R.; Thiagarajan, G.; Ghoshal, T.; Vijayan, K. Effect of dietary L-tryptophan on cannibalism, growth and survival of Asian seabass, Lates calcarifer (Bloch, 1790) fry. Indian J. Fish. 2017, 64, 28–32. [Google Scholar] [CrossRef]
- Baras, E.; Dugué, R.; Legendre, M. Do cannibalistic fish forage optimally? An experimental study of prey size preference, bioenergetics of cannibalism and their ontogenetic variations in the African catfish Heterobranchus longifilis. Aquat. Living Resour. 2014, 27, 51–62. [Google Scholar] [CrossRef][Green Version]
- Folkvord, A. Ontogeny of cannibalism in larval and juvenile fishes with special emphasis on Atlantic cod. In Early Life History and Recruitment in Fish Populations; Chambers, R.C., Edward, A., Trippel, E.A., Eds.; Chapman & Hall: London, UK, 1992. [Google Scholar] [CrossRef]
- Hseu, J.R.; Hwang, P.P.; Ting, Y.Y. Morphometric model and laboratory analysis of intracohort cannibalism in giant grouper Epinephelus lanceolatus fry. Fish. Sci. 2004, 70, 482–486. [Google Scholar] [CrossRef]
- Xi, D.; Zhang, X.; Lü, H.; Zhang, Z. Cannibalism in juvenile black rockfish, Sebastes schlegelii (Hilgendorf, 1880), reared under controlled conditions. Aquaculture 2017, 479, 682–689. [Google Scholar] [CrossRef]
- Höglund, E.; Bakke, M.J.; ØVerli, Y.; Winberg, S.; Nilsson, G.E. Suppression of aggressive behaviour in juvenile Atlantic cod (Gadus morhua) by l-tryptophan supplementation. Aquaculture 2005, 249, 525–531. [Google Scholar] [CrossRef]
- Lepage, O.; Vílchez, I.M.; Pottinger, T.G.; Winberg, S. Time-course of the effect of dietaryl-tryptophan on plasma cortisol levels in rainbow trout Oncorhynchus mykiss. J. Exp. Biol. 2003, 206, 3589–3599. [Google Scholar] [CrossRef]
- Lepage, O.; Larson, E.T.; Mayer, I.; Winberg, S. Serotonin, but not melatonin, plays a role in shaping dominant–subordinate relationships and aggression in rainbow trout. Horm. Behav. 2005, 48, 233–242. [Google Scholar] [CrossRef] [PubMed]
- Sahu, S.; Ngasotter, S.; Mog, M.; Tesia, S.; Sharma, S.; Dayakar, B.; Waikhom, D. A review on physiological, behavioral and metabolic role of dietary tryptophan in fish. Int. J. Chem. Stud. 2020, 8, 2411–2417. [Google Scholar] [CrossRef]
- Höglund, E.; ØVerli, Y.; Winberg, S. Tryptophan metabolic pathways and brain serotonergic activity: A comparative review. Front. Endocrinol. 2019, 10, 158. [Google Scholar] [CrossRef]
- Winberg, S.; Nilsson, G.E. Roles of brain monoamine neurotransmitters in agonistic behaviour and stress reactions, with particular reference to fish. Comp. Biochem. Physiol. Part C Toxicol. Pharmacol. 1993, 106, 597–614. [Google Scholar] [CrossRef]
- Sepúlveda-Quiroz, C.; Alvarez-Villagomez, C.; Mendoza-Porras, O.; Peña-Marín, E.; Maytorena-Verdugo, C.; Pérez-Jiménez, G.; Jesus-Contreras, R.; Álvarez-González, C.; Martínez-García, R. Attack behavior leading cannibalism in tropical gar (Atractosteus tropicus) larvae under different tank colors and shelter type. Aquaculture 2023, 563, 738991. [Google Scholar] [CrossRef]
- Frías-Quintana, C.A.; Márquez-Couturier, G.; Álvarez-González, C.A.; Tovar-Ramírez, D.; Nolasco-Soria, H.; Galaviz-Espinosa, M.A.; Gisbert, E. Development of digestive tract and enzyme activities during the early ontogeny of the tropical gar Atractosteus tropicus. Fish Physiol. Biochem. 2015, 41, 1075–1091. [Google Scholar] [CrossRef] [PubMed]
- Svatos, A. The effect of amino acids, sugars and fats on activation of pancreatic enzymes. Cas. Lek. Cesk. 1994, 133, 140–143. [Google Scholar] [PubMed]
- Bone, Q.; Moores, R.H. Biology of Fishes, 3rd ed.; Taylor & Francis: London, UK, 2008. [Google Scholar] [CrossRef]
- Hakim, Y.; Uni, Z.; Hulata, G.; Harpaz, S. Relationship between intestinal brush border enzymatic activity and growth rate in tilapias fed diets containing 30% or 48% protein. Aquaculture 2006, 257, 420–428. [Google Scholar] [CrossRef]
- Moyano, F.J.; Díaz, M.; Alarcón, F.J.; Sarasquete, M.C. Characterization of digestive enzyme activity during larval development of gilthead seabream (Sparus aurata). Fish Physiol. Biochem. 1996, 15, 121–130. [Google Scholar] [CrossRef] [PubMed]
- Cahu, C.; Zambonino Infante, J. Substitution of live food by formulated diets in marine fish larvae. Aquaculture 2001, 200, 161–180. [Google Scholar] [CrossRef]
- Tang, L.; Feng, L.; Sun, C.Y.; Chen, G.F.; Jiang, W.D.; Hu, K.; Liu, Y.; Jiang, J.; Li, S.H.; Kuang, S.Y.; et al. Effect of tryptophan on growth, intestinal enzyme activities and TOR gene expression in juvenile Jian carp (Cyprinus carpio var. Jian): Studies in vivo and in vitro. Aquaculture 2013, 412–413, 23–33. [Google Scholar] [CrossRef]
- Aldman, G.; Grove, D.; Holmgren, S. Duodenal acidification and intra-arterial injection of CCK8 increase gallbladder motility in the rainbow trout, Oncorhynchus mykiss. Gen. Comp. Endocrinol. 1992, 86, 20–25. [Google Scholar] [CrossRef]
- Jaworek, J. Ghrelin and metonin in the regulation of pancreatic exocrine secretion and maintaining of integrity. J. Physiol. Pharmacol. 2006, 57, 83–96. [Google Scholar]
- Zambonino-Infante, J.; Cahu, C. Ontogeny of the gastrointestinal tract of marine fish larvae. Comp. Biochem. Physiol. Part C Toxicol. Pharmacol. 2001, 130, 477–487. [Google Scholar] [CrossRef]
- Pianesso, D.; Radünz Neto, J.; da Silva, L.; Goulart, F.; Adorian, T.; Mombach, P.; Loureiro, B.; Dalcin, M.; Rotili, D.; Lazzari, R. Determination of tryptophan requirements for juvenile silver catfish (Rhamdia quelen) and its effects on growth performance, plasma and hepatic metabolites and digestive enzymes activity. Anim. Feed Sci. Technol. 2015, 210, 172–183. [Google Scholar] [CrossRef]
- Mardones, O.; Oyarzún-Salazar, R.; Labbé, B.; Míguez, J.M.; Vargas-Chacoff, L.; Muñoz, J. Intestinal variation of serotonin, melatonin, and digestive enzymes activities along food passage time through GIT in Salmo salar fed with supplemented diets with tryptophan and melatonin. Comp. Biochem. Physiol. Part A Mol. Integr. Physiol. 2022, 266, 111159. [Google Scholar] [CrossRef] [PubMed]
- Mardones, O.; Devia, E.; Labbé, B.; Oyarzún-Salazar, R.; Vargas-Chacoff, L.; Muñoz, J. Effect of L -tryptophan and melatonin supplementation on the serotonin gastrointestinal content and digestive enzymatic activity for Salmo salar and Oncorhynchus kisutch. Aquaculture 2018, 482, 203–210. [Google Scholar] [CrossRef]
- Caldwell, H.K.; Lee, H.J.; Macbeth, A.H.; Young, W.S. Vasopressin: Behavioral roles of an “original” neuropeptide. Prog. Neurobiol. 2008, 84, 1–24. [Google Scholar] [CrossRef] [PubMed]
- Conrad, J.L.; Weinersmith, K.L.; Brodin, T.; Saltz, J.B.; Sih, A. Behavioural syndromes in fishes: A review with implications for ecology and fisheries management. J. Fish Biol. 2011, 78, 395–435. [Google Scholar] [CrossRef] [PubMed]
- Carpenter, R.E.; Watt, M.J.; Forster, G.L.; Øverli, Y.; Bockholt, C.; Renner, K.J.; Summers, C.H. Corticotropin releasing factor induces anxiogenic locomotion in trout and alters serotonergic and dopaminergic activity. Horm. Behav. 2007, 52, 600–611. [Google Scholar] [CrossRef] [PubMed]
- Carpenter, R.; Korzan, W.; Bockholt, C.; Watt, M.; Forster, G.; Renner, K.; Summers, C. Corticotropin releasing factor influences aggression and monoamines: Modulation of attacks and retreats. Neuroscience 2009, 158, 412–425. [Google Scholar] [CrossRef] [PubMed][Green Version]
- Loveland, J.L.; Uy, N.; Maruska, K.P.; Carpenter, R.E.; Fernald, R.D. Social status differences regulate the serotonergic system of a cichlid fish, Astatotilapia burtoni. J. Exp. Biol. 2014, 217, 2680–2690. [Google Scholar] [CrossRef]
- Clotfelter, E.D.; O’Hare, E.P.; McNitt, M.M.; Carpenter, R.E.; Summers, C.H. Serotonin decreases aggression via 5-HT1A receptors in the fighting fish Betta splendens. Pharmacol. Biochem. Behav. 2007, 87, 222–231. [Google Scholar] [CrossRef]
- Filby, A.L.; Paull, G.C.; Searle, F.; Ortiz-Zarragoitia, M.; Tyler, C.R. Environmental estrogen-induced alterations of male aggression and dominance hierarchies in fish: A mechanistic analysis. Environ. Sci. Technol. 2012, 46, 3472–3479. [Google Scholar] [CrossRef]
- Hecht, T.; Appelbaum, S. Observations on intraspecific aggression and coeval sibling cannibalism by larval and juvenile Claias gariepinus (Clariidae: Pisces) under controlled conditions. J. Zool. 1988, 214, 21–44. [Google Scholar] [CrossRef]
- Näslund, J.; Johnsson, J.I. Environmental enrichment for fish in captive environments: Effects of physical structures and substrates. Fish Fish. 2014, 17, 1–30. [Google Scholar] [CrossRef]
- Qin, J.G.; Mittiga, L.; Ottolenghi, F. Cannibalism reduction in juvenile Barramundi Lates calcarifer by providing refuges and low light. J. World Aquac. Soc. 2004, 35, 113–118. [Google Scholar] [CrossRef]
- Zhang, Z.; Xu, X.; Wang, Y.; Zhang, X. Effects of environmental enrichment on growth performance, aggressive behavior and stress-induced changes in cortisol release and neurogenesis of black rockfish Sebastes schlegelii. Aquaculture 2020, 528, 735483. [Google Scholar] [CrossRef]
Disclaimer/Publisher’s Note: The statements, opinions and data contained in all publications are solely those of the individual author(s) and contributor(s) and not of MDPI and/or the editor(s). MDPI and/or the editor(s) disclaim responsibility for any injury to people or property resulting from any ideas, methods, instructions or products referred to in the content. |
© 2024 by the authors. Licensee MDPI, Basel, Switzerland. This article is an open access article distributed under the terms and conditions of the Creative Commons Attribution (CC BY) license (https://creativecommons.org/licenses/by/4.0/).