Article

Hypoxia Activates HIF-1α and Affects Gene Expression and Transcriptional Regulation of PHD in Tegillarca granosa

1
Key Laboratory of Aquatic Germplasm Resource of Zhejiang, College of Biological and Environmental Sciences, Zhejiang Wanli University, Ningbo 315100, China
2
Ninghai Institute of Mariculture Breeding and Seed Industry, Zhejiang Wanli University, Ningbo 315100, China
3
School of Fisheries and Life Science, Shanghai Ocean University, Shanghai 201306, China
4
Laboratory of Marine Biology Resource and Molecular Engineering, Marine Science and Technical College, Zhejiang Ocean University, Zhoushan 316022, China
*
Authors to whom correspondence should be addressed.
Fishes 2023, 8(7), 359; https://doi.org/10.3390/fishes8070359
Submission received: 28 May 2023 / Revised: 6 July 2023 / Accepted: 7 July 2023 / Published: 11 July 2023
(This article belongs to the Special Issue Mollusk Genetic Diversity and Breeding Technology)

Abstract

:
Hypoxia is a common challenge faced by mollusks, and the role of hypoxia-inducible factor-1α (HIF-1α) in regulating related target genes under hypoxia in Tegillarca granosa (Tg) remains unclear. In this study, we identified gene HIF-1α and further explored its function. qRT-PCR was performed to determine the mRNA expression of HIF-1α, prolyl 4-hydroxylases (PHD), hemoglobin (Hb), and myoglobin (Mb) in response to hypoxia. Dual-luciferase reporter analysis was used to assess the transcriptional activity of HIF-1α on the PHD and Hb genes during hypoxia. Results showed that the expression levels of HIF-1α and PHD mRNAs were highest in the gill and lowest in the adductor muscle. Under hypoxic conditions, HIF-1α and PHD mRNAs were both induced, and their expression levels increased significantly, peaking at 8 h and gradually decreasing thereafter. The transcription of Tg-PHD was induced by hypoxia and was Tg-HIF-1α dependent. Notably, the expression of Hb decreased in hemocytes (p < 0.01) after 8 h at 0.5 mg/L, while the expression of MbI and MbII increased (p < 0.01) in the hepatopancreas after 24 h and 120 h, respectively. Moreover, Tg-HIF-1α could transactivate the PHD promoter but not that of Hb. These findings provide valuable insights into the regulatory role of Tg-HIF-1α on Tg-PHD, safeguarding it from degradation by PHD and offering significant contributions to the understanding of HIF-1α’s function. Nonetheless, the expression of Tg-HIF-1α protein was not detected under hypoxic conditions, and additional investigations are required to quantify Tg-HIF-1α protein dynamics and establish the correlation between mRNA expression and protein levels.
Key Contribution: The expression levels of HIF-1α and PHD mRNAs were highest in the gill and lowest in the adductor muscle. Both HIF-1α and PHD mRNAs exhibited induction under hypoxic conditions. We also investigated the expression of Hb and Mb under hypoxic conditions. Moreover, Tg-HIF-1α demonstrated the ability to transactivate the PHD promoter but not that of Hb.

Graphical Abstract

1. Introduction

Hypoxia is a phenomenon characterized by dissolved oxygen (DO) concentration below 2.0 mg/L in aquatic environments [1], and it exerts significant physiological and biochemical impacts on various processes such as transport of oxygen, metabolism, signal transmission, proliferation of cells, and apoptosis [2,3]. A sophisticated physiological network is involved in oxygen capture, binding, transport, and delivery in mammals. Notably, the ability to sense and respond to low oxygen levels constitutes a crucial function of this network [4]. Hypoxia-inducible factor-1 (HIF-1), a transcription factor belonging to the Helix-Loop-Helix-Per-ARNT-Sim transcriptional factor family, regulates the expression of hypoxia-induced genes [5]; HIF-1 governs the expression of environmentally induced and developmental genes, thereby regulating a diverse range of processes such as the cell cycle and angiogenesis, as well as iron and glucose transport, glycolysis, and erythropoiesis [6]. HIF-1 comprises two subunits: HIF-1α and HIF-1β, of which HIF-1α is subjected to degradation by prolyl 4-hydroxylases (PHDs) under normoxic conditions [7,8]; subsequently, it undergoes ubiquitination and degradation [9,10]. However, hypoxic conditions stabilize HIF-1α, which in turn binds to hypoxia-response elements (HREs) located on enhancers and promoters, thereby inducing the transcription of hypoxia-inducible genes; thus, the process activates or silences the entire cascade of gene transcription [11]. Oxygen levels tightly regulate HIF-1 abundance and transcriptional activity, both of which are important to its biological function [12,13,14]. Notably, PHD enzymes covalently have two proline residues in the HIF-1α oxygen-dependent degradation (ODD) domain [15]. Most vertebrate genomes contain three functional duplicates of HIF-1α-3α, PHD1, PHD2, and PHD3 [6,16].
The HIF-1 pathway has garnered significant attention owing to its crucial role in regulating oxygen consumption and delivery [6]. It is well established that the oxygen-dependent turnover of HIF-1α in cells is orchestrated by the PHD family of proteins. Several studies have explored the HIF-1α gene in mammals and fishes, revealing its pivotal role in regulating hypoxia adaptation [17,18,19,20]. In addition, Mollusca have been shown to exhibit greater tolerance to hypoxia than other aquatic animals [21,22]. Notably, bivalves have demonstrated enhanced tolerance high temperatures, exposure, and hypoxia due to their occurrence on intertidal mudflats [23].
Numerous genes involved in oxygen transport have been found to be regulated and activated by HIF-1α, including Hb, erythropoietin (EPO), vascular endothelial growth factor (VEGF), and glucose transport protein [24]. Hb, a respiratory protein that is found not only in vertebrates but also in invertebrates, has been shown to participate in the restoration of oxygen delivery in crustacea (Cladoceran. Daphnia magna) under hypoxic conditions. This process involves the stimulation of Hb synthesis, which is mediated by the binding of HIF-1α to HREs present in the promoters of Hb genes [25].
The blood clam Tegillarca granosa, which is widely distributed along Asian coasts and estuaries, is a valuable source of Hb and plays important ecological roles [26]. The species predominantly inhabits intertidal mudflats characterized by pronounced hypoxic conditions during tidal cycles and has been shown to be highly adapted to such conditions. In previous studies conducted by our research team, the survival rates of T. granosa were 85.0%, 87.5%, and 100% under hypoxic conditions with DO concentrations of 0.5, 2.0, and 8.5 mg/L (control group), respectively, following a two-week exposure to hypoxic stress [27]. Notably, T. granosa exhibits a unique red blood phenotype, wherein Hb serves not only as an oxygen transporter but also as a mediator of the immune system [28,29]. Both Hb and Mb belong to the globin superfamily, fulfilling crucial roles in cellular oxygen transport and storage [30]. Nonetheless, the precise mechanisms by which HIF-1α regulates target genes to elicit adaptive responses to hypoxia in T. granosa remain poorly understood. Furthermore, the transcriptional activity of HIF-1α on PHD and Hb under hypoxia remains unclear. Thorough investigations are warranted to unravel these critical aspects and shed light on the underlying mechanisms.
The objective of this research was to investigate the sequence characteristics of the HIF-1α gene and evaluate the influence of hypoxic stress on the expression of HIF-1α, PHD, Hb, and Mb in T. granosa. Furthermore, the study aimed to explore the possibility of HIF-1α acting as a transcriptional regulator on PHD and Hb genes under hypoxia. Additionally, the dual-luciferase reporter assay was used to investigate the transcriptional activity of HIF-1α on the promoter regions of PHD and Hb genes in response to hypoxia. This study was conducted to provide better understanding of the regulatory mechanisms underlying the expression of HIF-1α, PHD, Hb, and Mb genes in T. granosa under hypoxia, with a particular focus on HIF-1α acting as a potential transcriptional regulator for the PHD and Hb genes. The findings of this study contribute to better understanding of the survival and adaptation of T. granosa in hypoxic environments, providing deeper insights into their physiological and ecological processes.

2. Materials and Methods

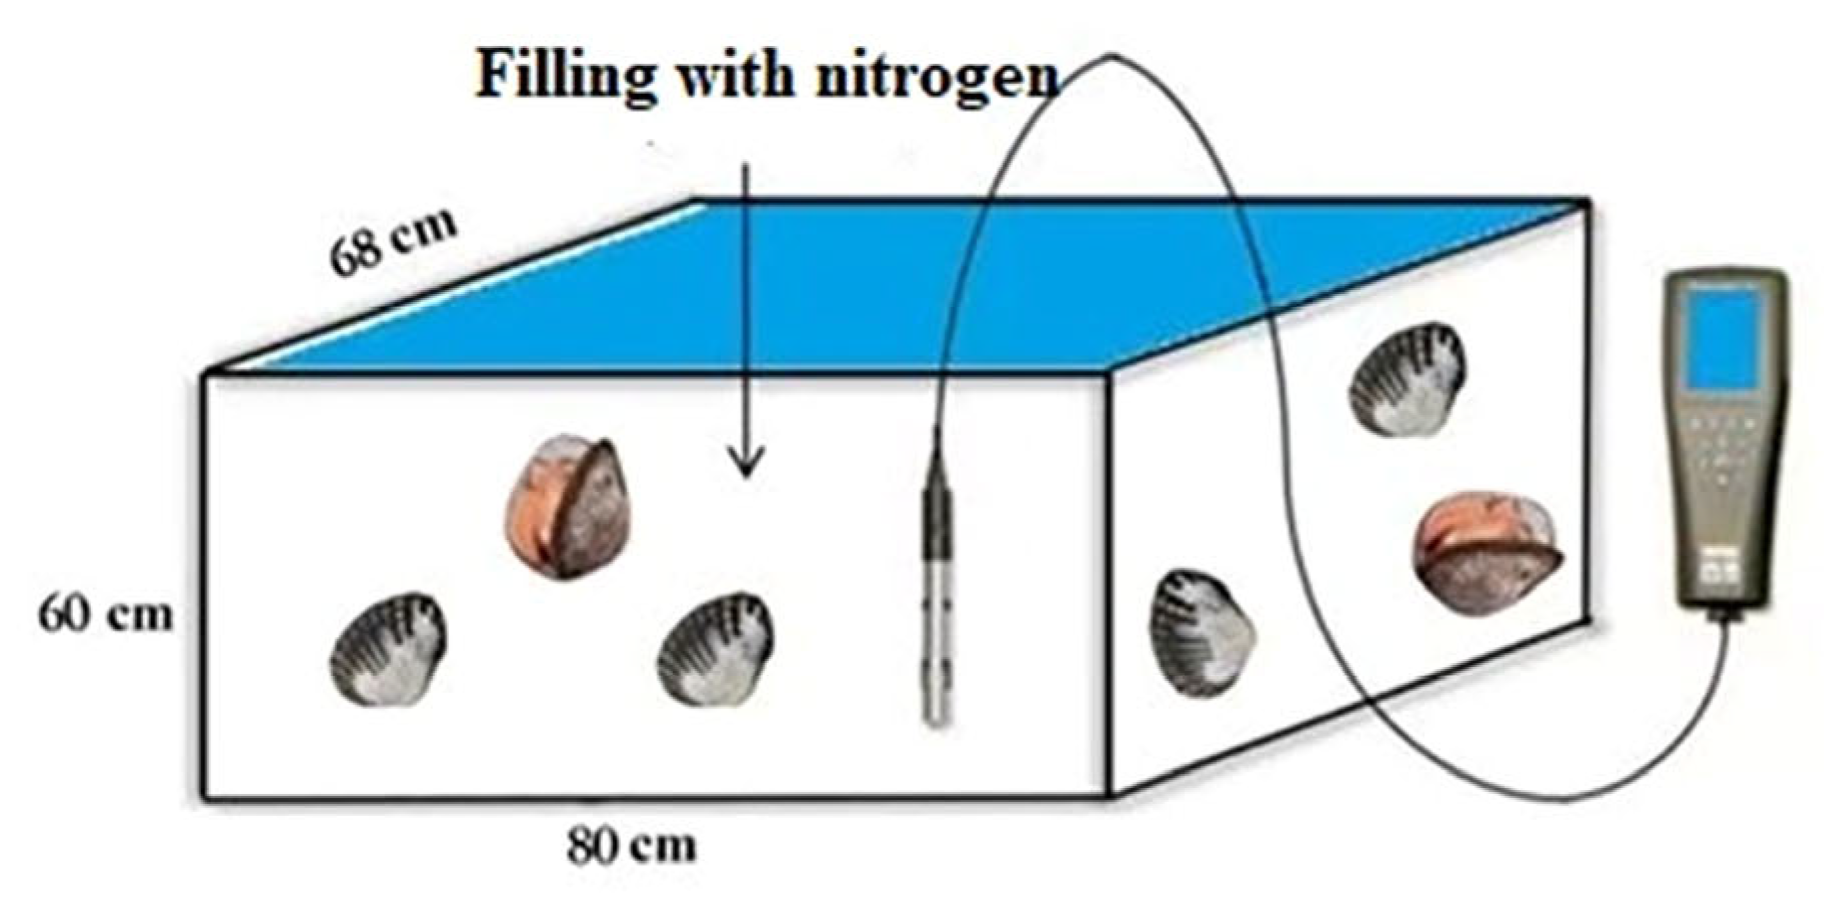
2.1. Hypoxia Stress Experiment

2.1.1. Experimental Samples Preparation

Four hundred adult blood clams T. granosa were collected with an average shell length of 30.82 ± 1.30 mm, in Xiangshan Bay, Ningbo, China (29°37′ N and 121°40′ E). T. granosa were acclimated in glass-reinforced plastic tanks with sand-filtered seawater (temperature 20.0 ± 1.0 °C, pH 8.1 ± 0.1, and salinity 21.5 ± 0.5‰) for one week prior to experiments. The daily maintenance for T. granosa included a water change and feeding with microalgae (Platymonas subcordiformis) during acclimation, as described in a previous study [31]. In this experiment, air was bubbled through air-stones in order to maintain an oxygen concentration at 8.5 mg/L.

2.1.2. Hypoxia Experiment and Tissue Collection

After one week of acclimation, 400 blood clams were randomly allocated to two treatment groups and one control group, with the DO concentrations of 0.5, 2.0, and 8.5 mg/L (control group), respectively, with each group having three replicates. Glass-reinforced plastic tanks (80 cm × 68 cm × 60 cm, L × W × H) (designed as in Figure A1) were filled with seawater, and nitrogen gas was bubbled into them. Real-time monitoring of DO was conducted using a portable DO monitor (HQ30D, HACH, Loveland, CO, USA) [32]. DO was measured every 2 h. To determine appropriate tissues for subsequent hypoxia research, we detected Tg-HIF-1α and Tg-PHD expression in six different tissues in normoxic conditions, including the gills, hemocytes, hepatopancreas, mantle, adductor muscle, and foot. Subsequently, a hypoxia tolerance test was conducted on clams, and the lowest DO concentration was at 0.5 mg/L for further experiments. The individuals were exposed to hypoxia set at 0.5 mg/L for 0, 8, 24, 72, and 120 h, and all of the samples were stored at −80 °C for extraction of DNA and RNA.

2.2. PCR Amplification of Tg-HIF-1α ORF and Sequence Analysis of Tg-HIF-1α

Total RNA was extracted from the T. granosa gill by using a marine animal tissue genomic RNA extraction kit (Tien Biochemical Technology, Beijing, China). The cloned sequence primers (Table 1) were designed according to the sequence of Tg-HIF-1α (Pec0025870.1, which is derived from the T. granosa genome, and the NCBI Bio Project: PRJNA593692). BamHI and XhoI restriction enzyme sites were added to the F and R primers according to restriction sites available on the pcDNA3.1 transcription factor vector. The sequence of Tg-HIF-1α ORF was amplified. Then, the amplified fragment was purified and inserted into a pMD19-T vector (Takara, Dalian, China), and was propagated in E. coli DH5α competent cells (Takara, Dalian, China). Positive clones were sequenced by Sangon Biotech (Shanghai, China). The sequence analysis of Tg-HIF-1α refers to Zhang and Mu [33,34].
ExPASy (http://web.expasy.org/protparam/, accessed on 8 December 2021) was used to predict the protein molecular weight and isoelectric point. In addition, its domains were predicted by SMART (http://smart.embl.de/, accessed on 8 December 2021). A prediction of the protein tertiary structure was made using SWISS-MODEL (https://swissmodel.expasy.org/, accessed on 8 December 2021). DNAMAN software version 9.0 (Lynnon Biosoft Corporation, San Ramon, CA, USA) was used for multiple sequence alignment and analysis. Based on 1000 bootstrap trials, a phylogenetic tree was drawn using MEGA7 software using the maximum likelihood method.

2.3. Quantitative Real-Time PCR

An EASYpin Plus RNA extraction kit (Aidlab, Beijing, China) was used to obtain total RNA from six tissues. Electrophoresis gels and Nanodrop spectrophotometers (Thermo Fisher Scientific, Waltham, MA, USA) were used to analyze RNA quality and concentration, respectively. Total RNA was reverse transcribed to cDNA with the HiScript III RT Super Mix kit for qRT-PCR (Vazyme, Nanjing, China). qRT-PCR was performed according to Zhan Yu’s method [27], which was carried out in triplicate using the Kubo Quanta gene q225 RT-PCR system (Kubo Technology, Beijing, China) with the ChamQ Universal SYBR qPCR master mix (Vazyme, Nanjing, China). The cycling parameters were as follows: initial denaturation at 95 °C for 5 s; followed by 40 cycles of denaturation at 95 °C for 10 s and annealing/extension at 60 °C for 30 s. The reaction mixtures contained 10 μL of ChamQ Universal SYBR qPCR Master Mix (Vazyme), 0.5 μL each of the forward and reverse primer (10 μM), 1 μL cDNA template, and 3 μL double distilled water. We examined the expression of four genes, including HIF-1α, PHD, Hb, and Mb. The 2−ΔΔCT method was used to analyze the relative levels of gene expression, with 18S rRNA as an internal control. Sangon Biotech (Shanghai, China) synthesized the primers, listed in Table 1.

2.4. Amplification of Tg-PHD and Tg-Hb Promoter and Construction of Recombinant Plasmid

The promoter sequences of Tg-PHD and Tg-Hb were isolated from the whole genome of T. granosa and cloned (NCBI Bio Project: PRJNA593692). A list of primers is presented in Table 1. SacI and XhoI restriction sites were added to the F and R primers of Tg-PHD, Tg-HbI, Tg-HbIIA, Tg-HbIIB, and Tg-HbIII to match the restriction enzyme sites available on the PGL3-basic promoter vector (Feng Fei, Hunan, China). The Tg-HIF-1α ORF was successfully cloned and inserted into the expression vector pcDNA3.1 to form pcDNA-TgHIF-1α. Sangon Biotech (Shanghai, China) carried out sequencing of the positive clones.
The constructed plasmids were transfected into human embryonic kidney (HEK) 293T cells in four groups of co-transfections, including an experimental group, control group, and two negative control groups.

2.5. HEK293T Cell Culture, Transient Transfection, and Transcriptional Regulation of Tg-PHD and Tg- Hb by Tg-HIF-1α under Hypoxia

HEK293T cells, obtained from the cell bank of the Chinese Academy of Sciences in Shanghai, China, were maintained in Dulbecco’s modified Eagle’s medium (DMEM), supplemented with 10% fetal bovine serum and antibiotics (100 U/mL penicillin and 100 U/mL streptomycin) in an incubator at 37 °C and 5% CO2. To induce hypoxia, an oxygen concentration of 1% was used in the hypoxia chamber. Prior to transfection, the cells were grown to 70–90% confluence prior to and subsequently transfected with the intended plasmid DNA using Opti-MEM and Lipofectamine 3000 (Thermo Fisher Scientific, Shanghai, China), as directed by the manufacturer’s instructions. To investigate the transcriptional regulation of Tg-PHD and Tg-Hb by Tg-HIF-1α under hypoxia, HEK293T cells containing the hypoxia-response element (HRE) reporter genes (PGL3-basic-HbI, PGL3-basic-HbIIA, PGL3-basic-HbIIB, and PGL3-basic-HbIII) were co-transfected with the pcDNA Tg-HIF-1α and pcDNA3.1 (as control) plasmids, respectively. Furthermore, an internal control was co-transfected with Renilla luciferase reporter plasmids.
Luciferase activity was determined using a multimode Varioskan Flash reader (Tecan, Männedorf, ZH, Switzerland) equipped with an assay system based on dual-luciferase reporter genes (Promega, GenePharma, Shanghai, China), as directed by the manufacturer.

2.6. Statistical Analysis

We present the mean ± standard deviation (SD) of the values obtained in each experiment. For testing whether tissues differed in their values, ANOVA was used to analyze the variance. A Student’s t-test was used to analyze the differences between normoxia and hypoxia using Origin 2021 software. A value of p < 0.05 shows statistical significance, while p < 0.01 shows extremely significant differences.

3. Results

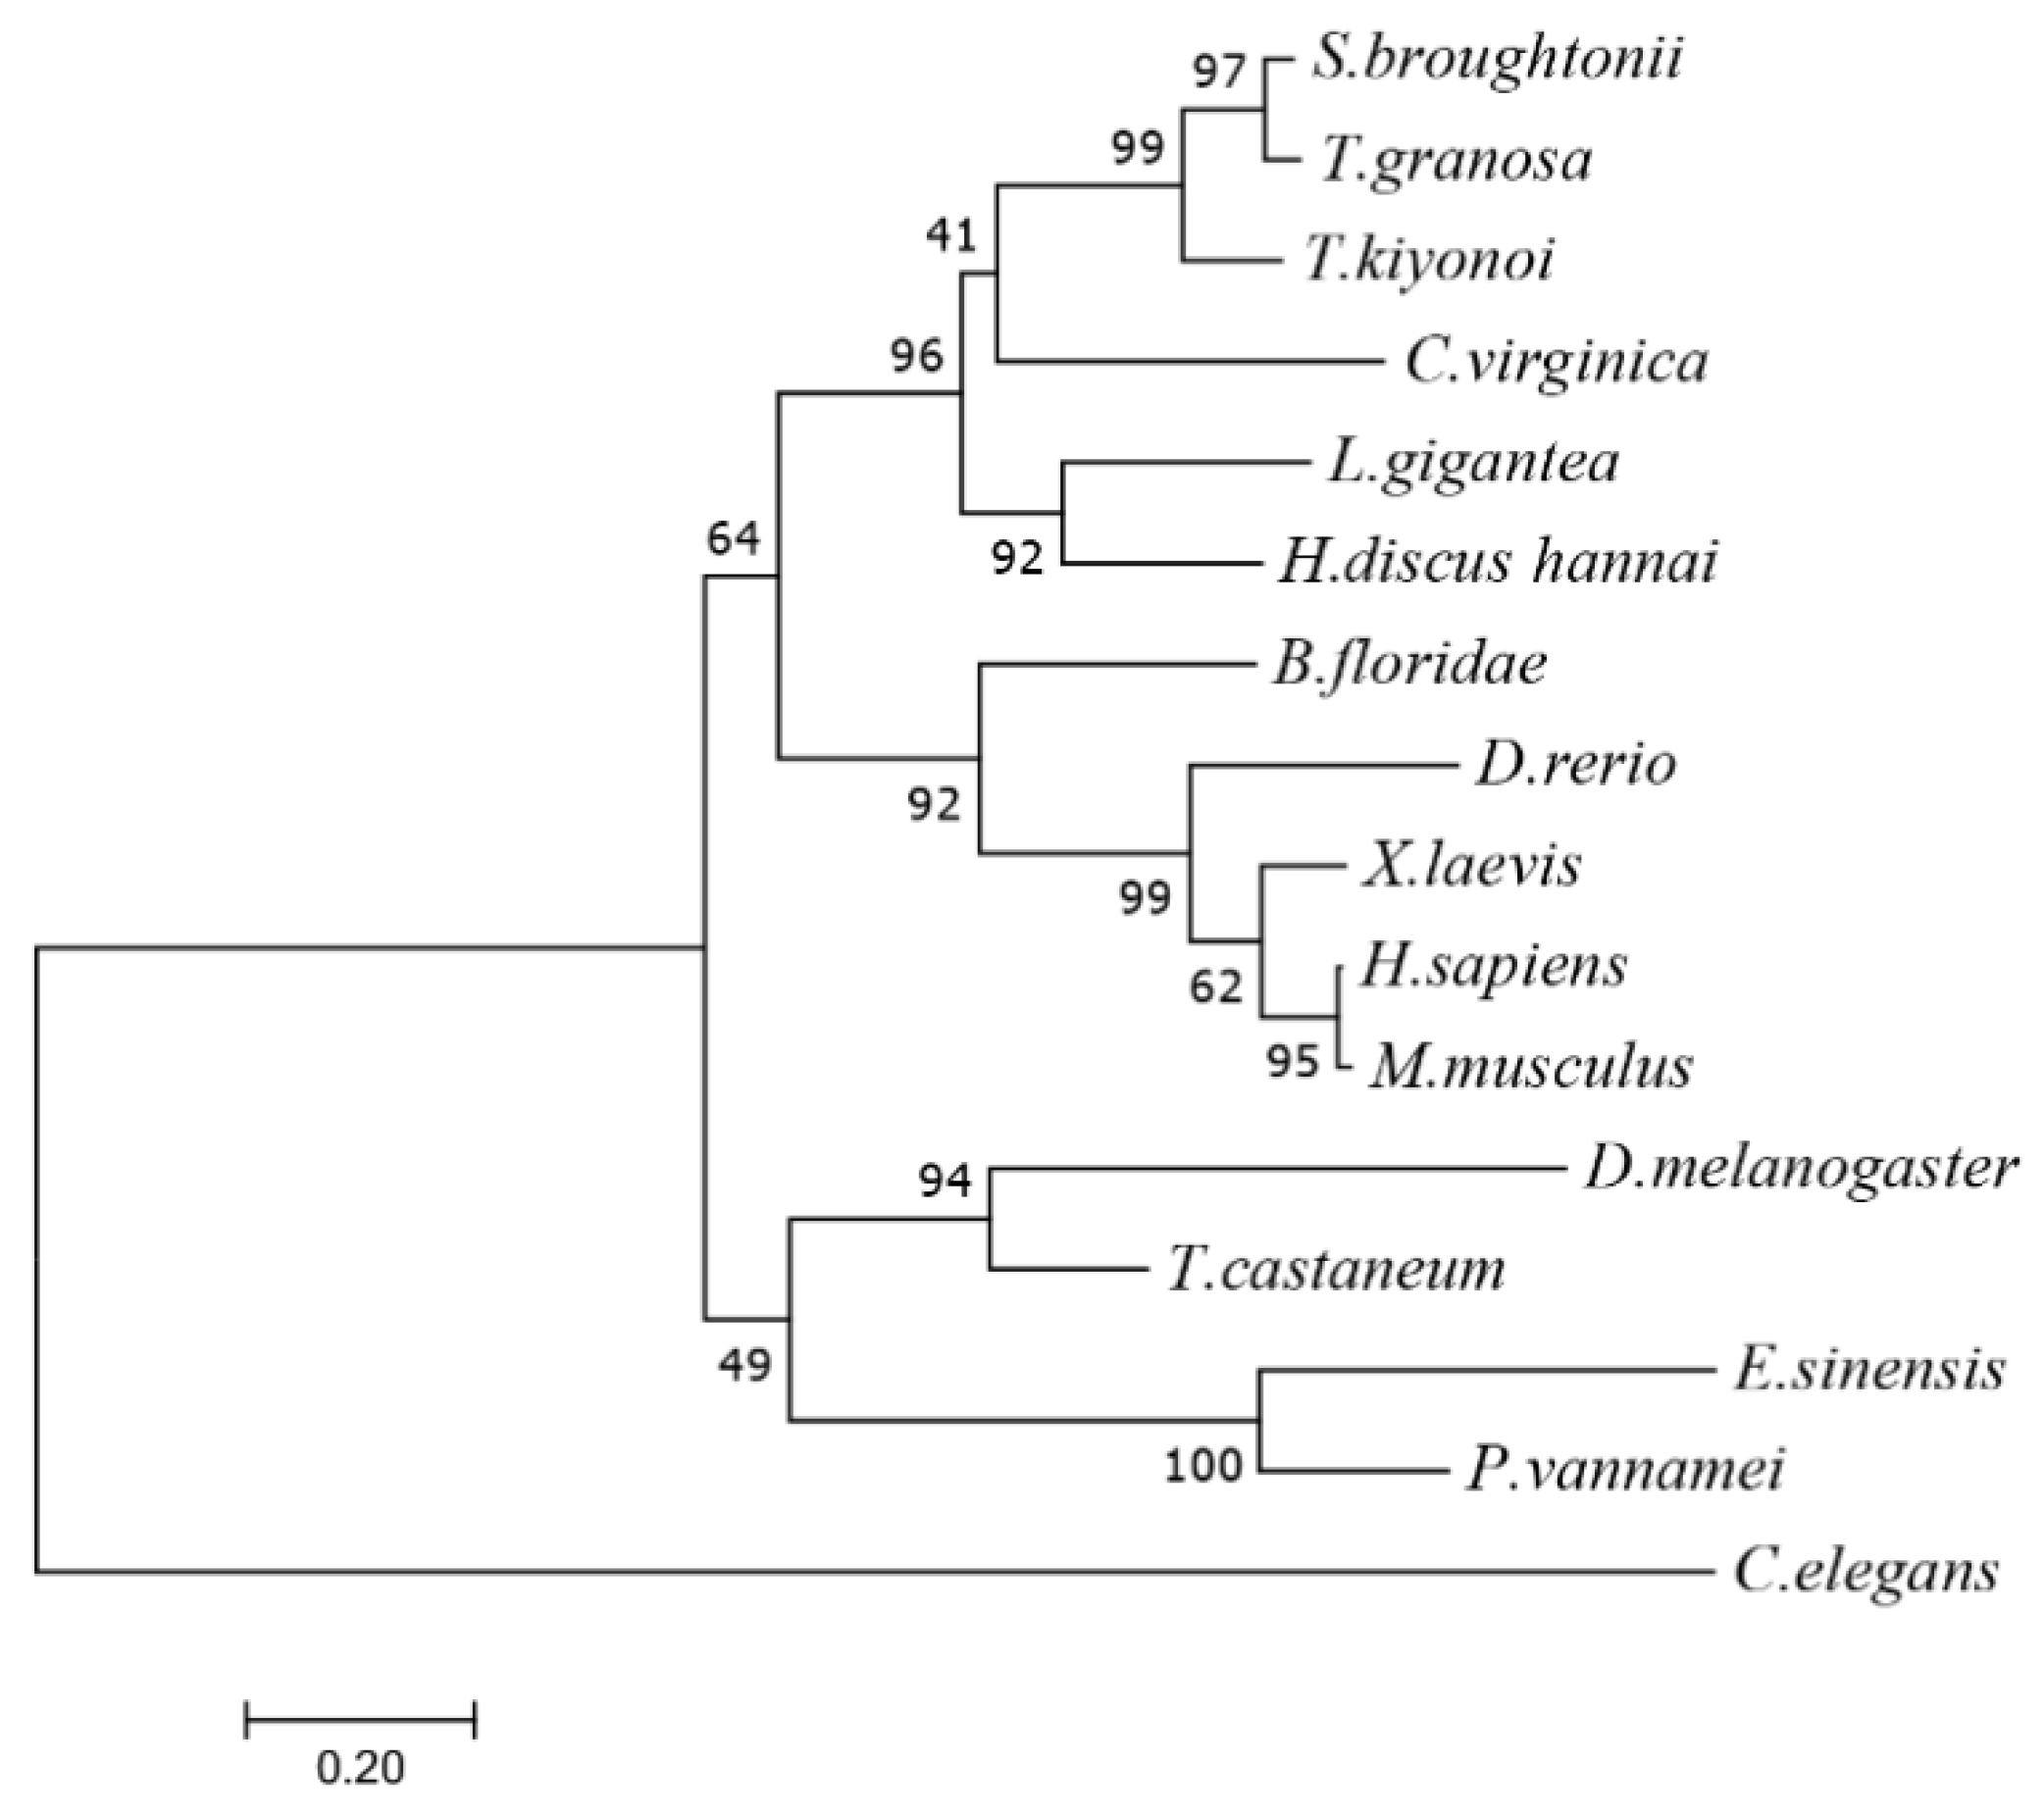
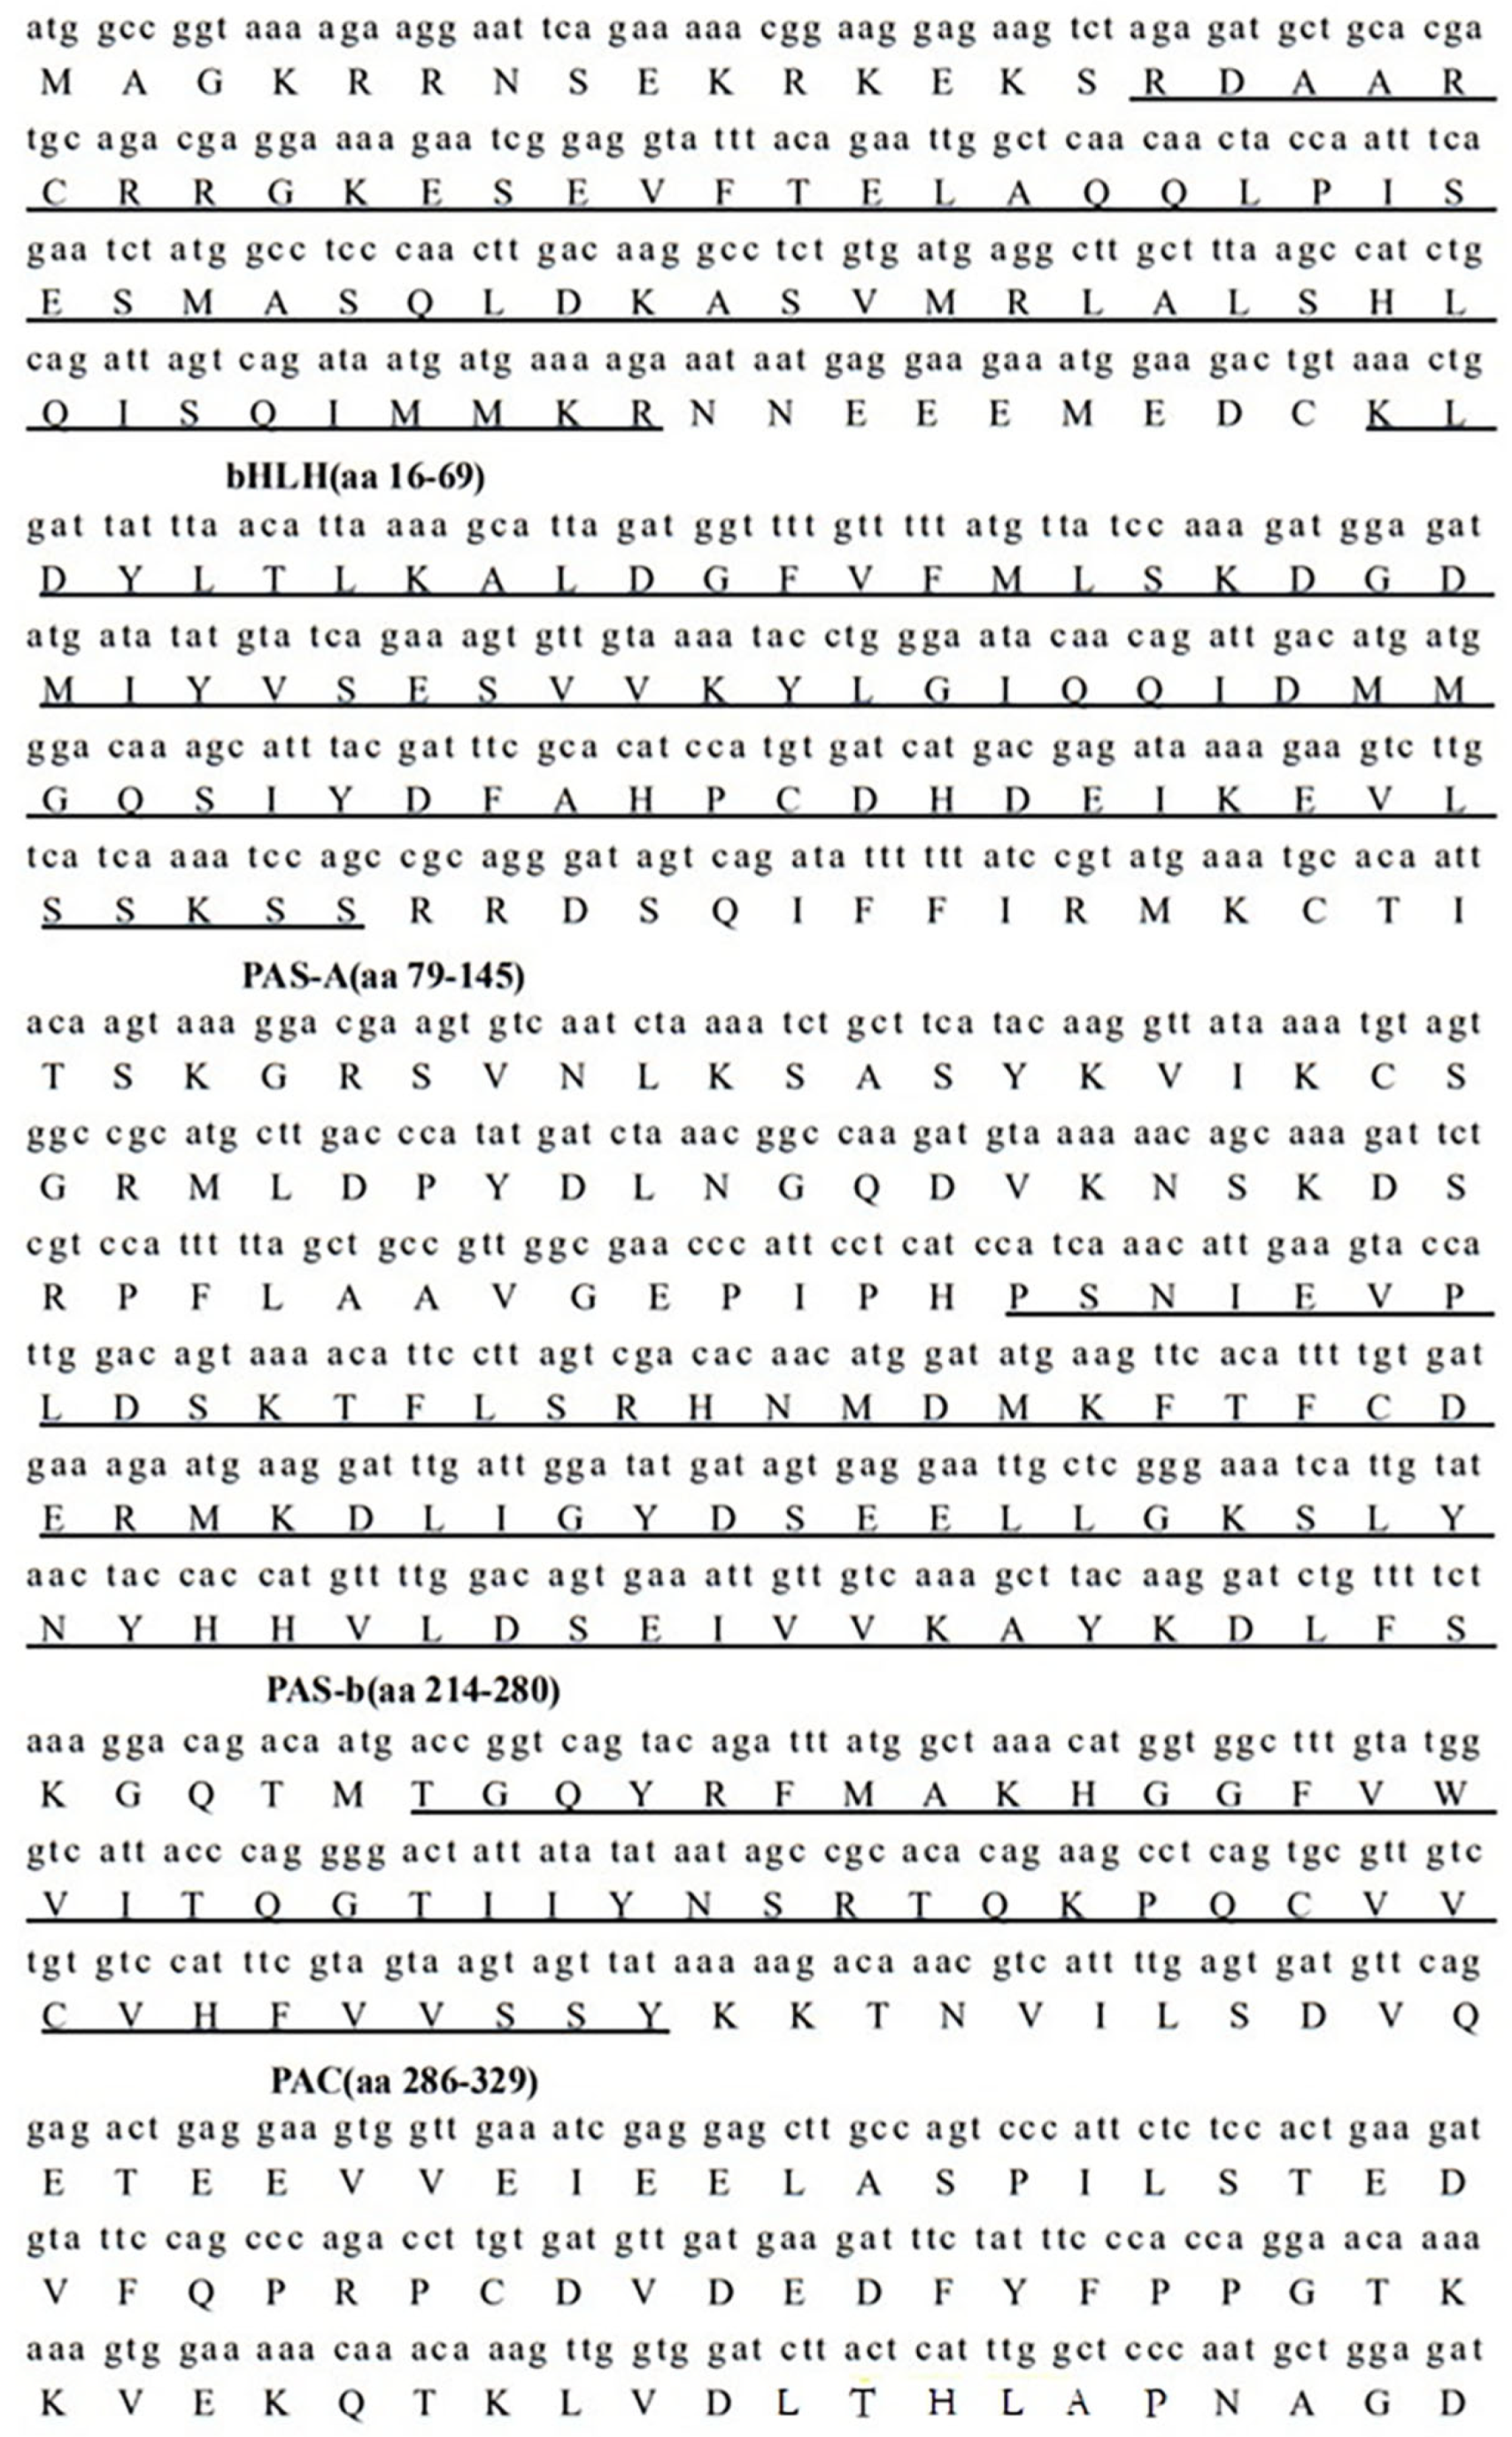
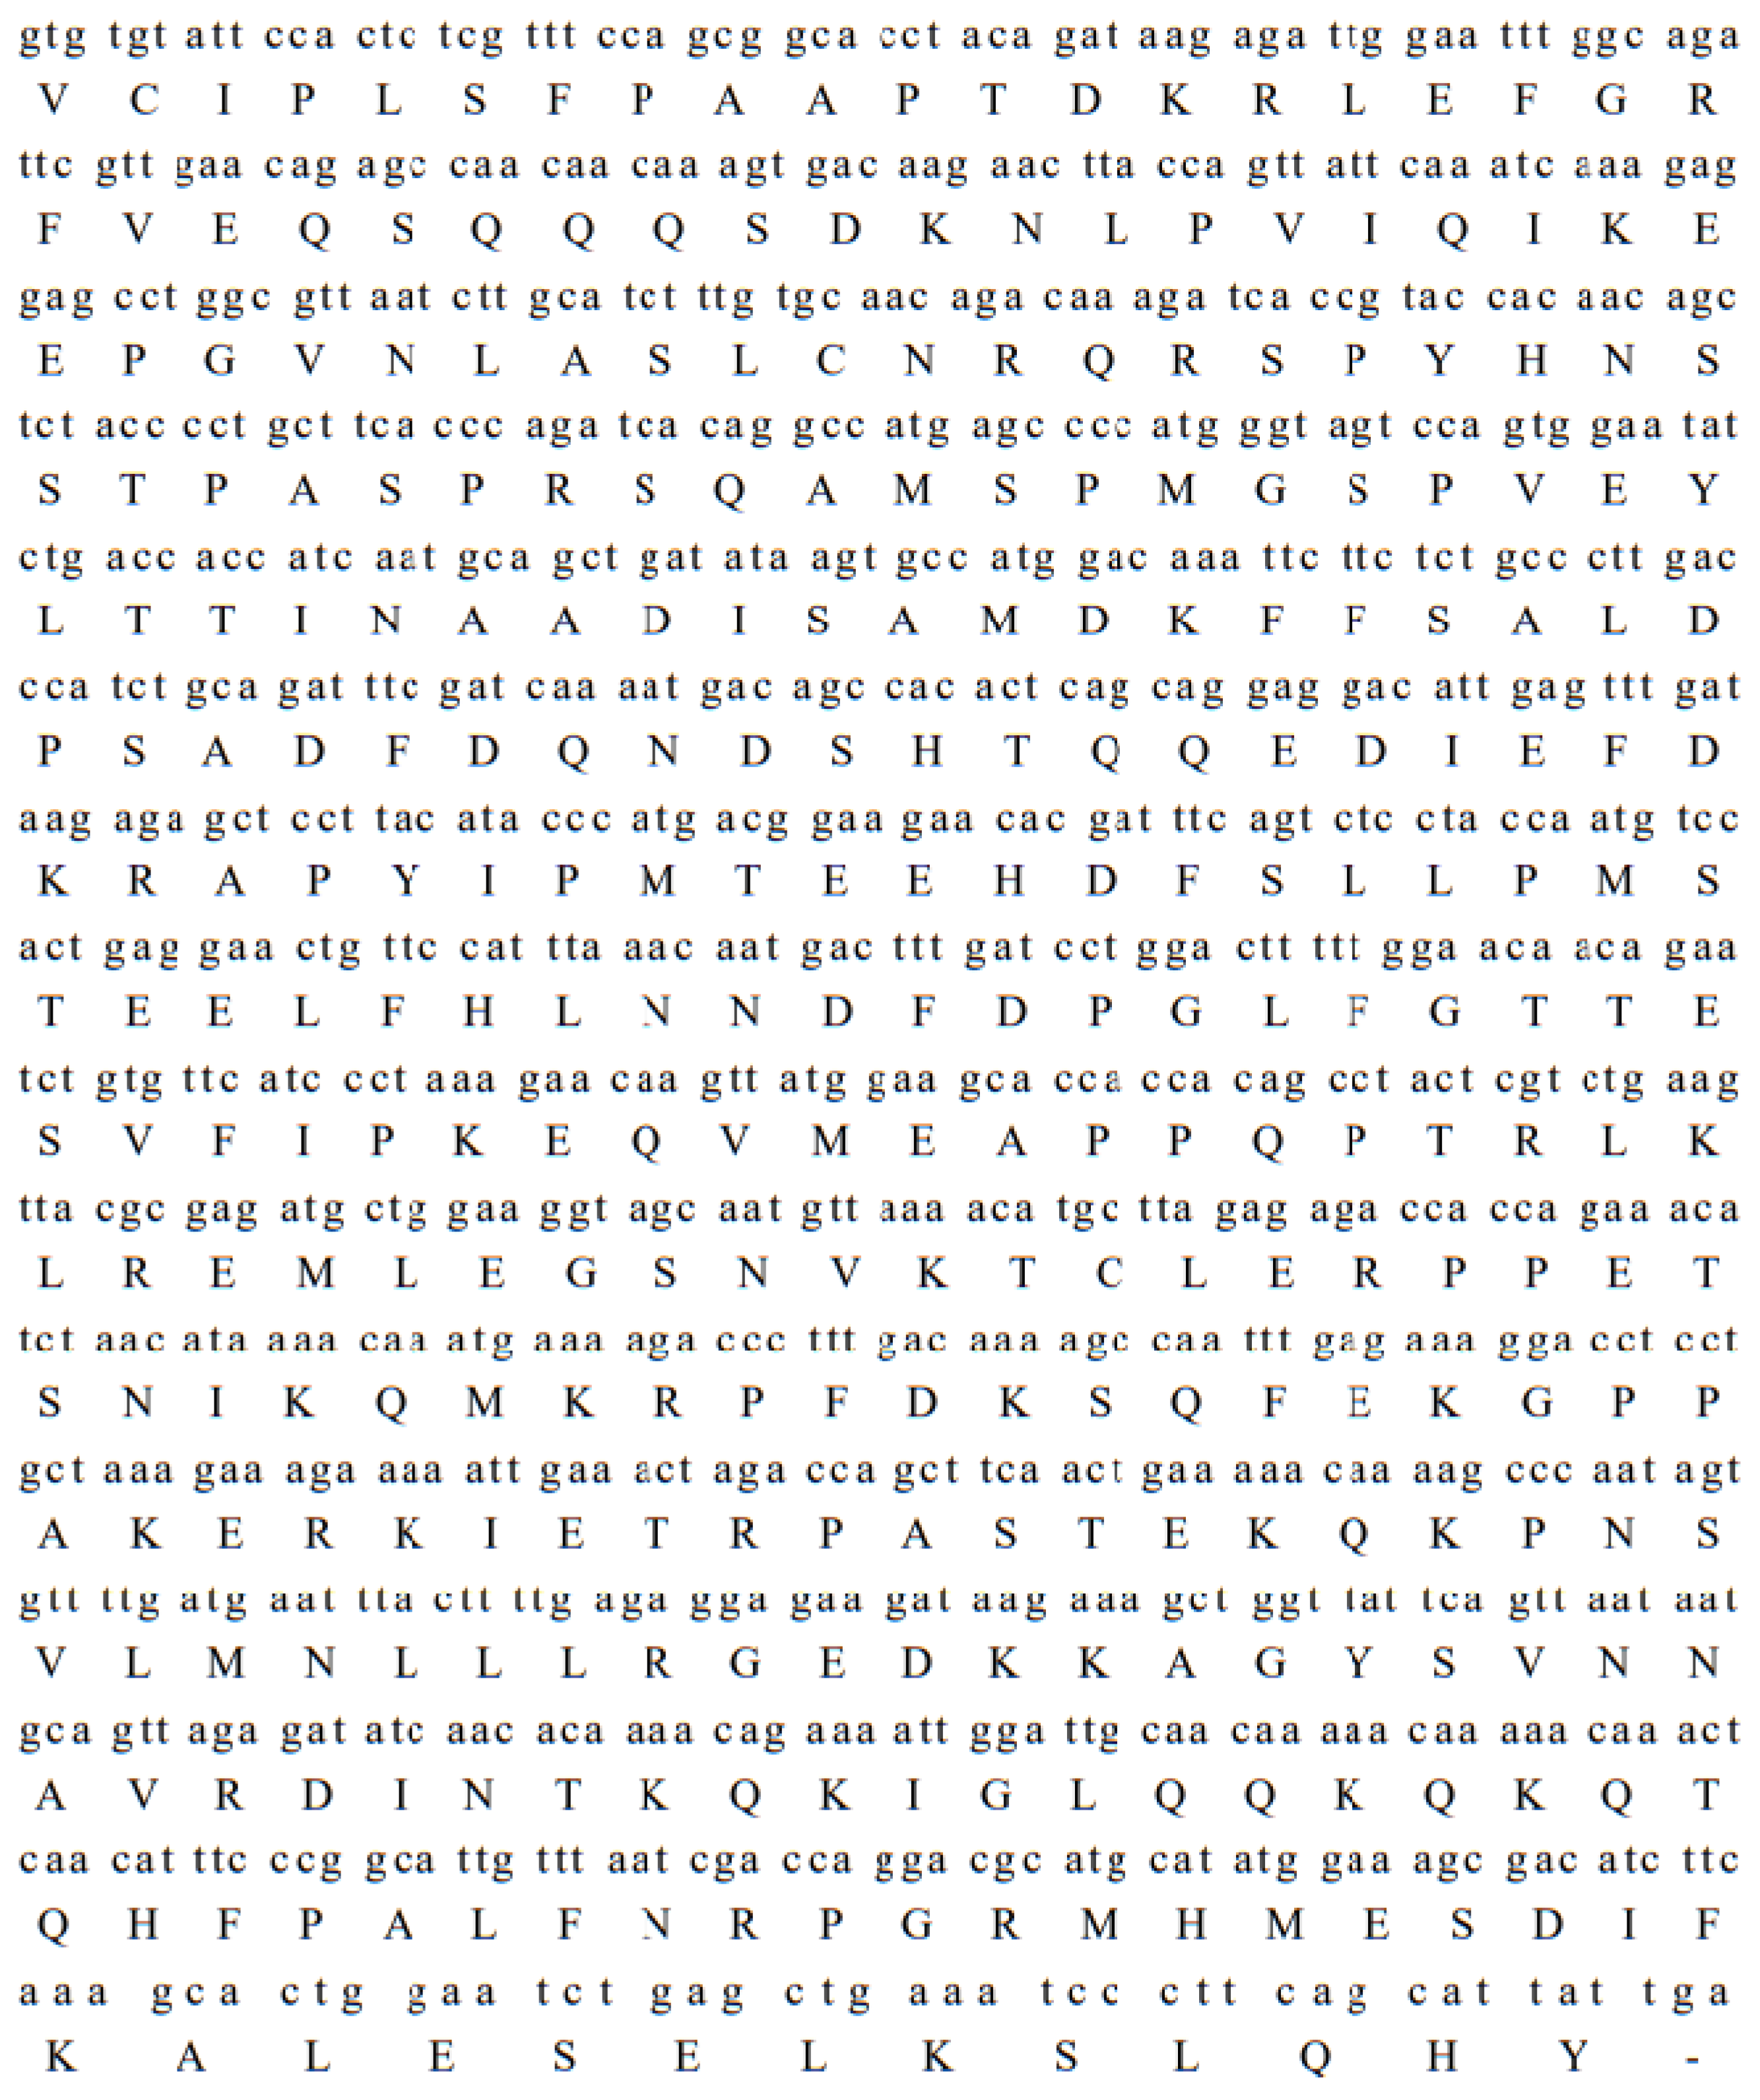
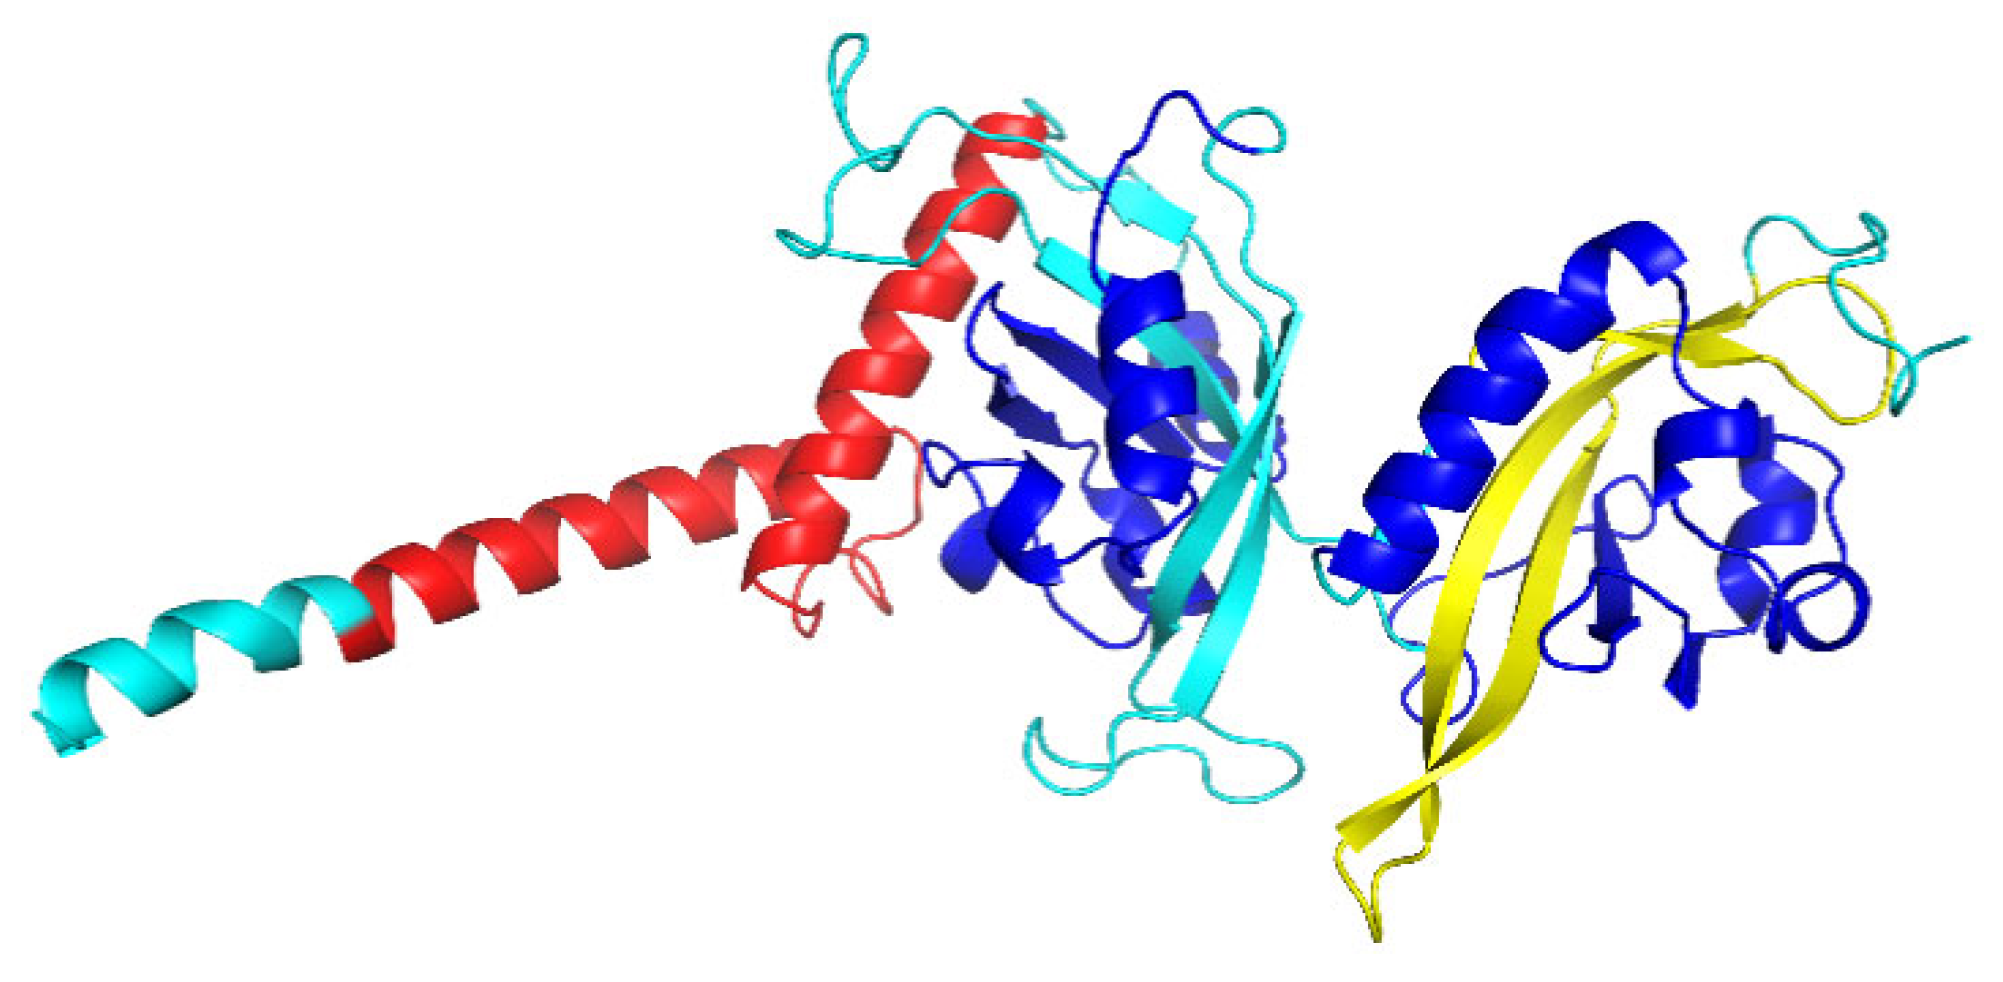
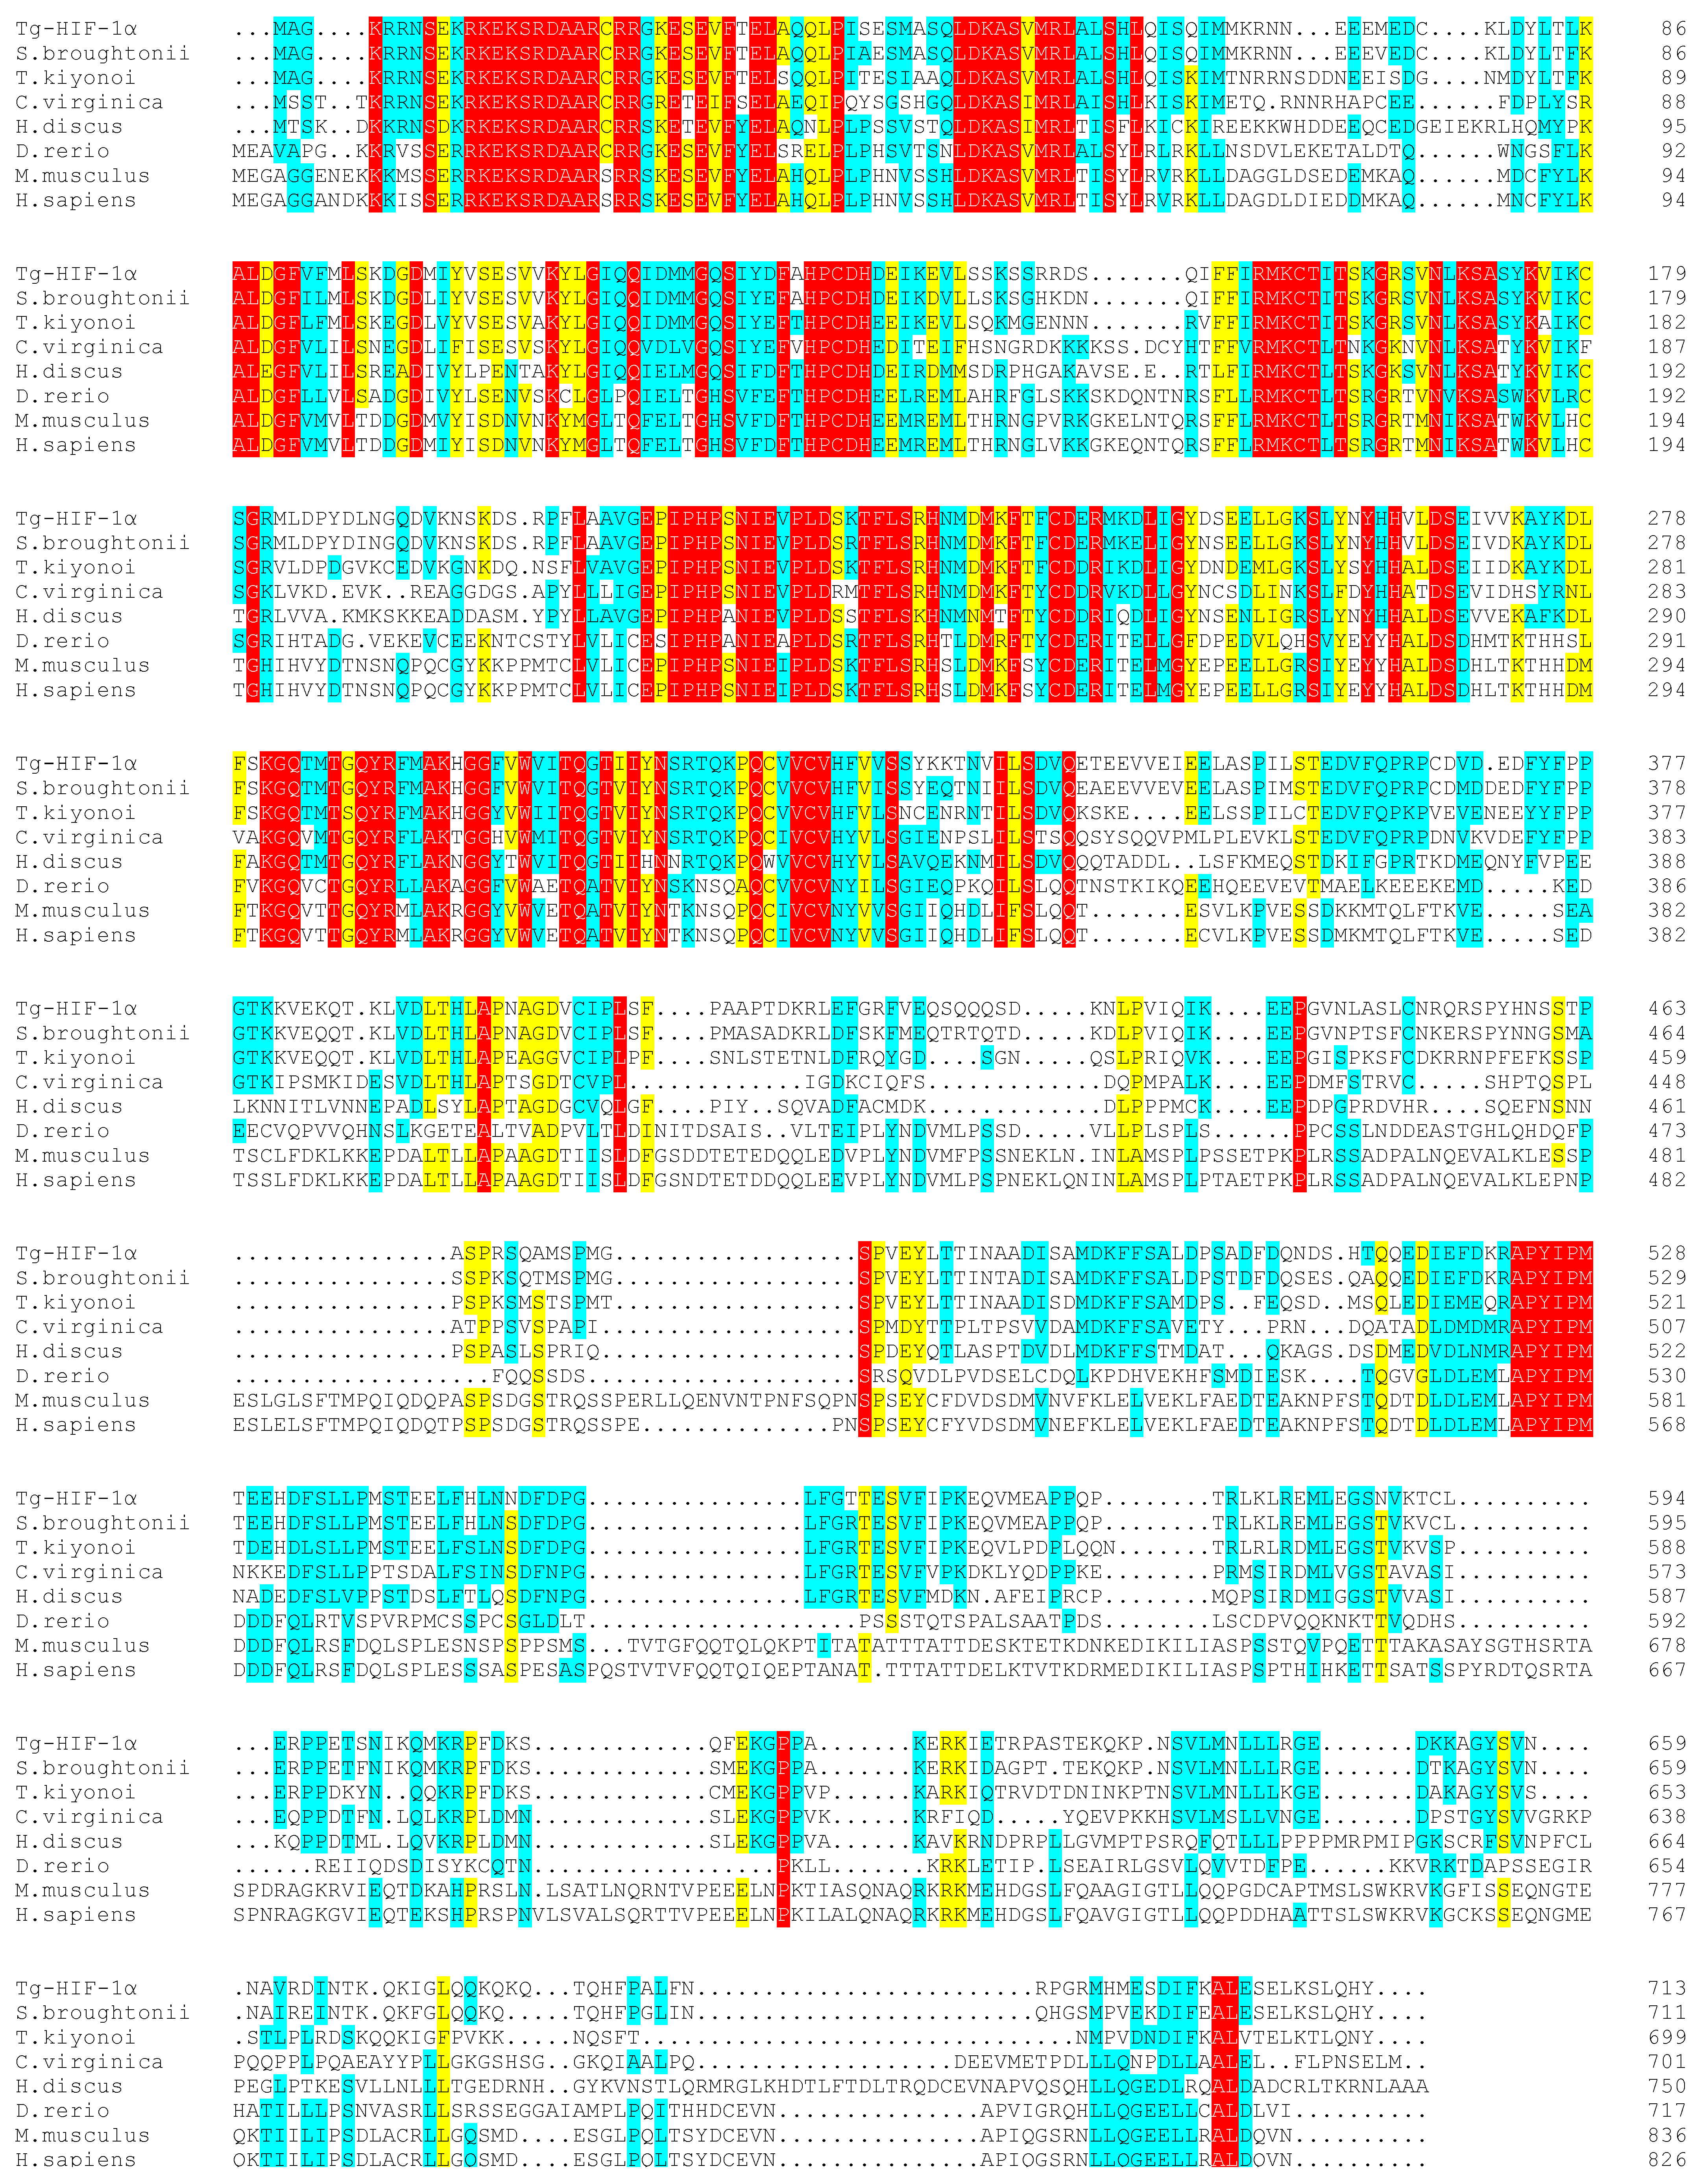
3.1. The Characterization of Tg-HIF-1α

Tg-HIF-1α encoded a 713 amino acids protein with a molecular weight of 81.2 kDa and pI of 6.33. Its homology with Scapharca broughtonii and Trisidos kiyonoi HIF-1α ORF was 87.96% and 69.49%, respectively (Table 2). It was found that Tg-HIF-1α displays structural features that are similar to the bHLH-PAS protein, including a DNA-binding domain for bHLH (amino acids 16–69), PAS-A (amino acids 79–145), PAS-B (amino acids 214–280), and PAC domains (Figure A2). The protein tertiary structure of Tg-HIF-1α is shown in Figure A3 and the region with high homology after comparison are from amino acids 4–341, which coincides with the result by SMART. The N-terminus of Tg-HIF-1α was relatively conserved based on sequence alignment results and predicted domains. Moreover, the HLH, PAS-A, PAS-B, and PAC domains were located in the region with high amino acid similarity in the sequence alignment results (as depicted in Figure A4). HIF-1α had a distant relationship with those from Drosophila melanogaster and Tribolium castaneum from the phylogenetic tree (Figure 1).

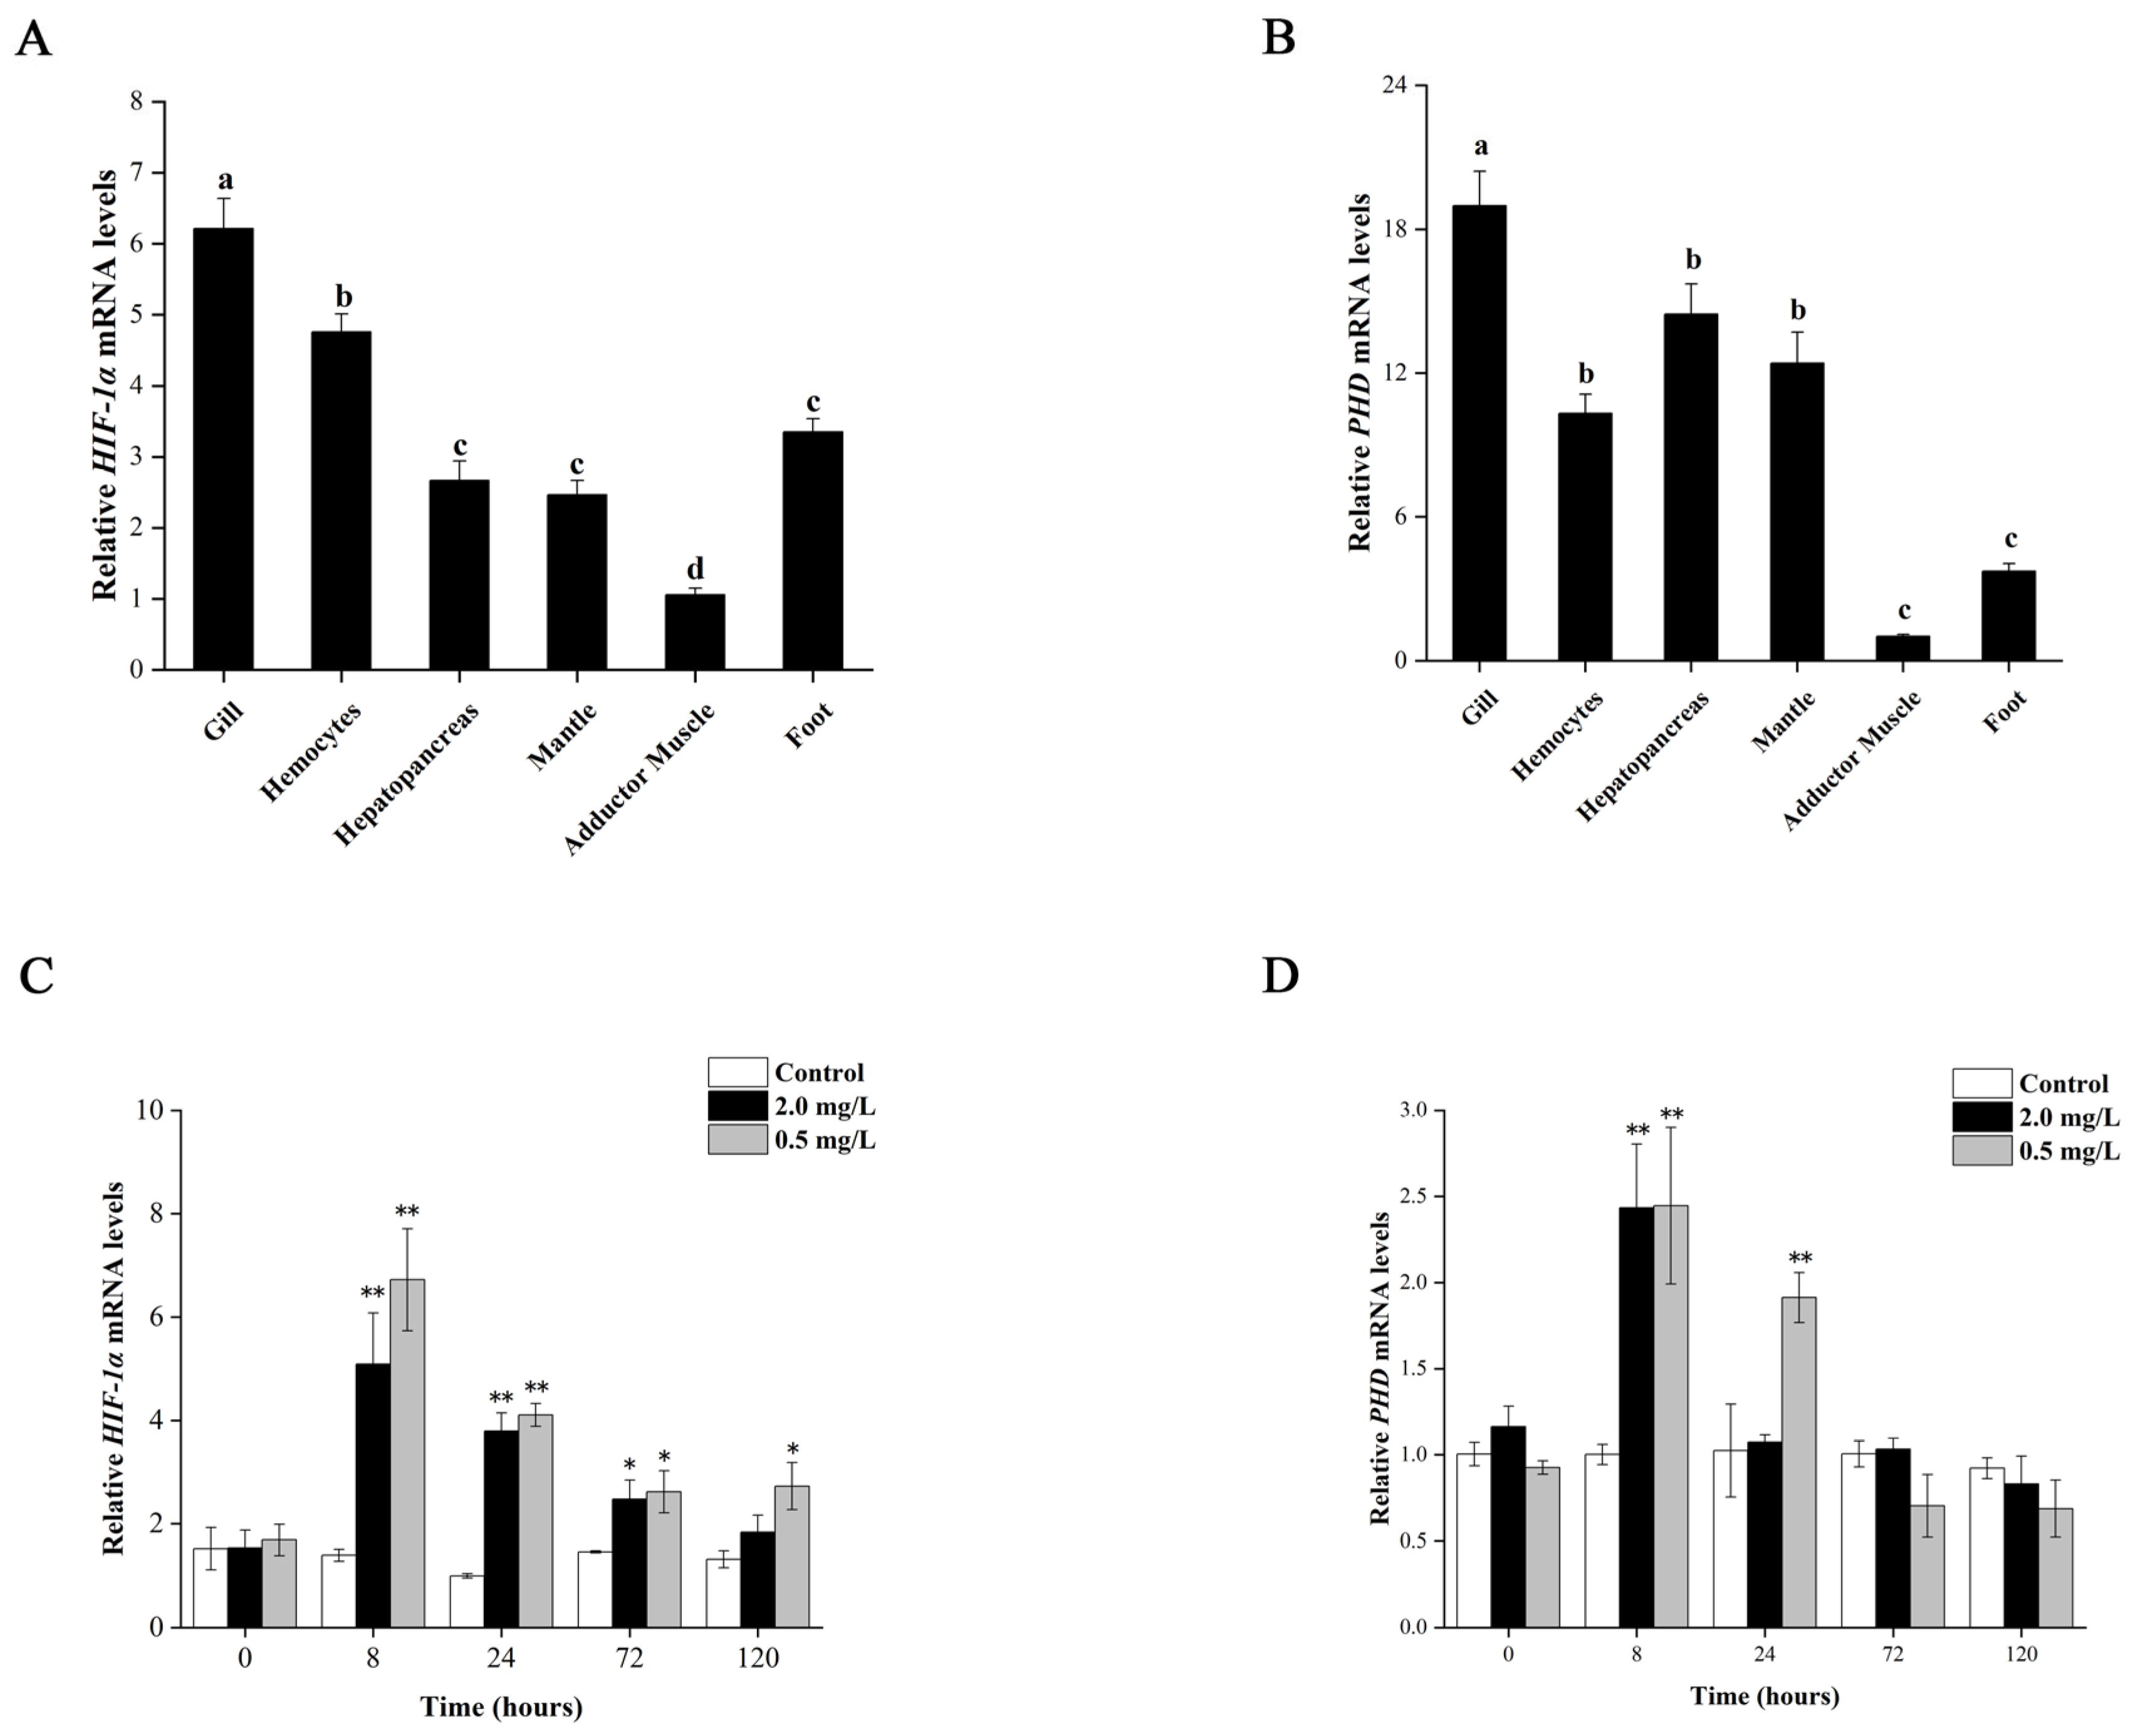
3.2. Differential Expression of Tg-HIF-1α and Tg-PHD in Different Tissues

The distribution and expression of Tg-HIF-1α and Tg-PHD in six different tissues were analyzed by qRT-PCR under normoxia. The results are shown in Figure 2A,B, which indicate that Tg-HIF-1α and Tg-PHD had the highest expression in gill and lowest in muscle, respectively, with a significant difference compared to other tissues (p < 0.05). However, there was no statistical significance in Tg-HIF-1α expression in hepatopancreas, mantle, and foot, nor in Tg-PHD expression in hemocytes, hepatopancreas, and mantle. Therefore, gill tissue was chosen for further analysis of Tg-HIF-1α and Tg-PHD expression under hypoxia.

3.3. Expression of Tg-HIF-1α and Tg-PHD under Different DO Concentrations

We examined the mRNA expression levels of Tg-HIF-1α and Tg-PHD under different DO concentrations. The results showed that hypoxia significantly increased the expression of Tg-HIF-1α mRNA in the gill compared to normoxia (Figure 2C). Specifically, after 8 h of hypoxia, Tg-HIF-1α mRNA expression levels significantly increased by 6.72-fold and 5.09-fold at DO concentrations of 0.5 mg/L and 2.0 mg/L, respectively (p < 0.01). However, after 24 h and beyond, until 120 h, Tg-HIF-1α mRNA expression levels were significantly lower, with only a 2.73-fold increase at 0.5 mg/L DO after 120 h (p < 0.05), and no significant differences were found at DO concentration 2.0 mg/L (p > 0.05). Overall, Tg-HIF-1α mRNA expression level initially increased and then slowly decreased with prolonged hypoxia. However, the overall expression level was higher than that of normoxia, with lower DO concentration, leading to the higher Tg-HIF-1α expression.
The expression levels of Tg-PHD mRNA (Figure 2D) displayed a similar trend to Tg-HIF-1α, and with a maximum value observed after 8 h of hypoxia (p < 0.01) at DO 0.5 mg/L, with no significant difference observed at other time points up to 72 h of hypoxia at DO 2.0 mg/L. These results suggest that both Tg-HIF-1α and Tg-PHD mRNA expression levels are influenced by DO concentrations and that hypoxia can significantly increase their expression levels.

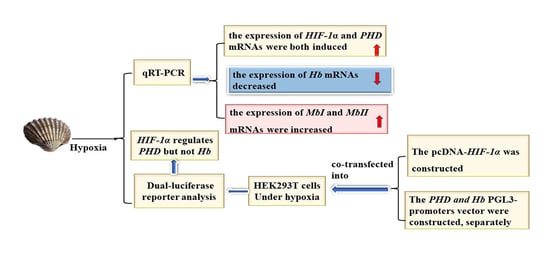
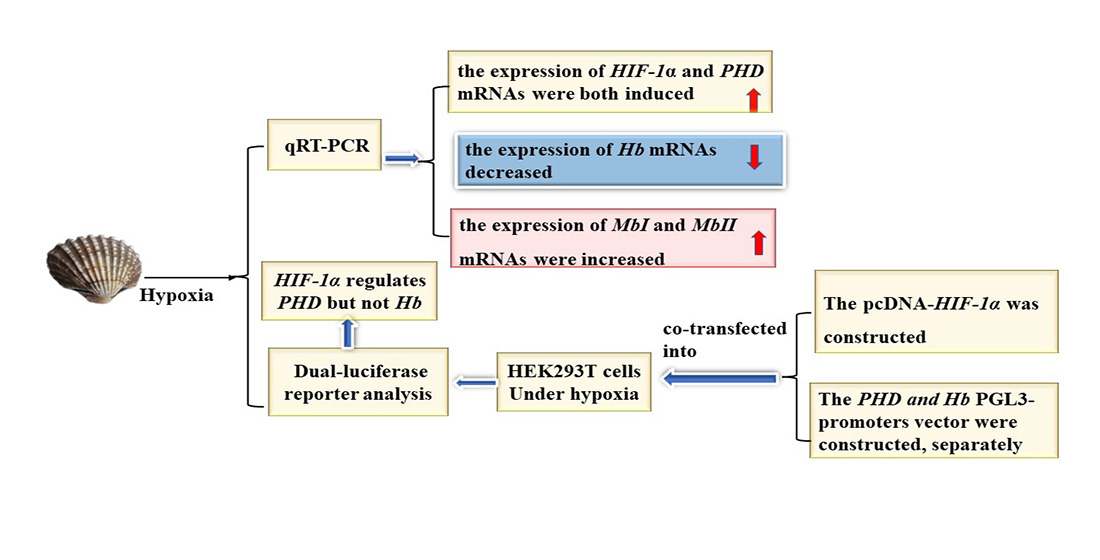
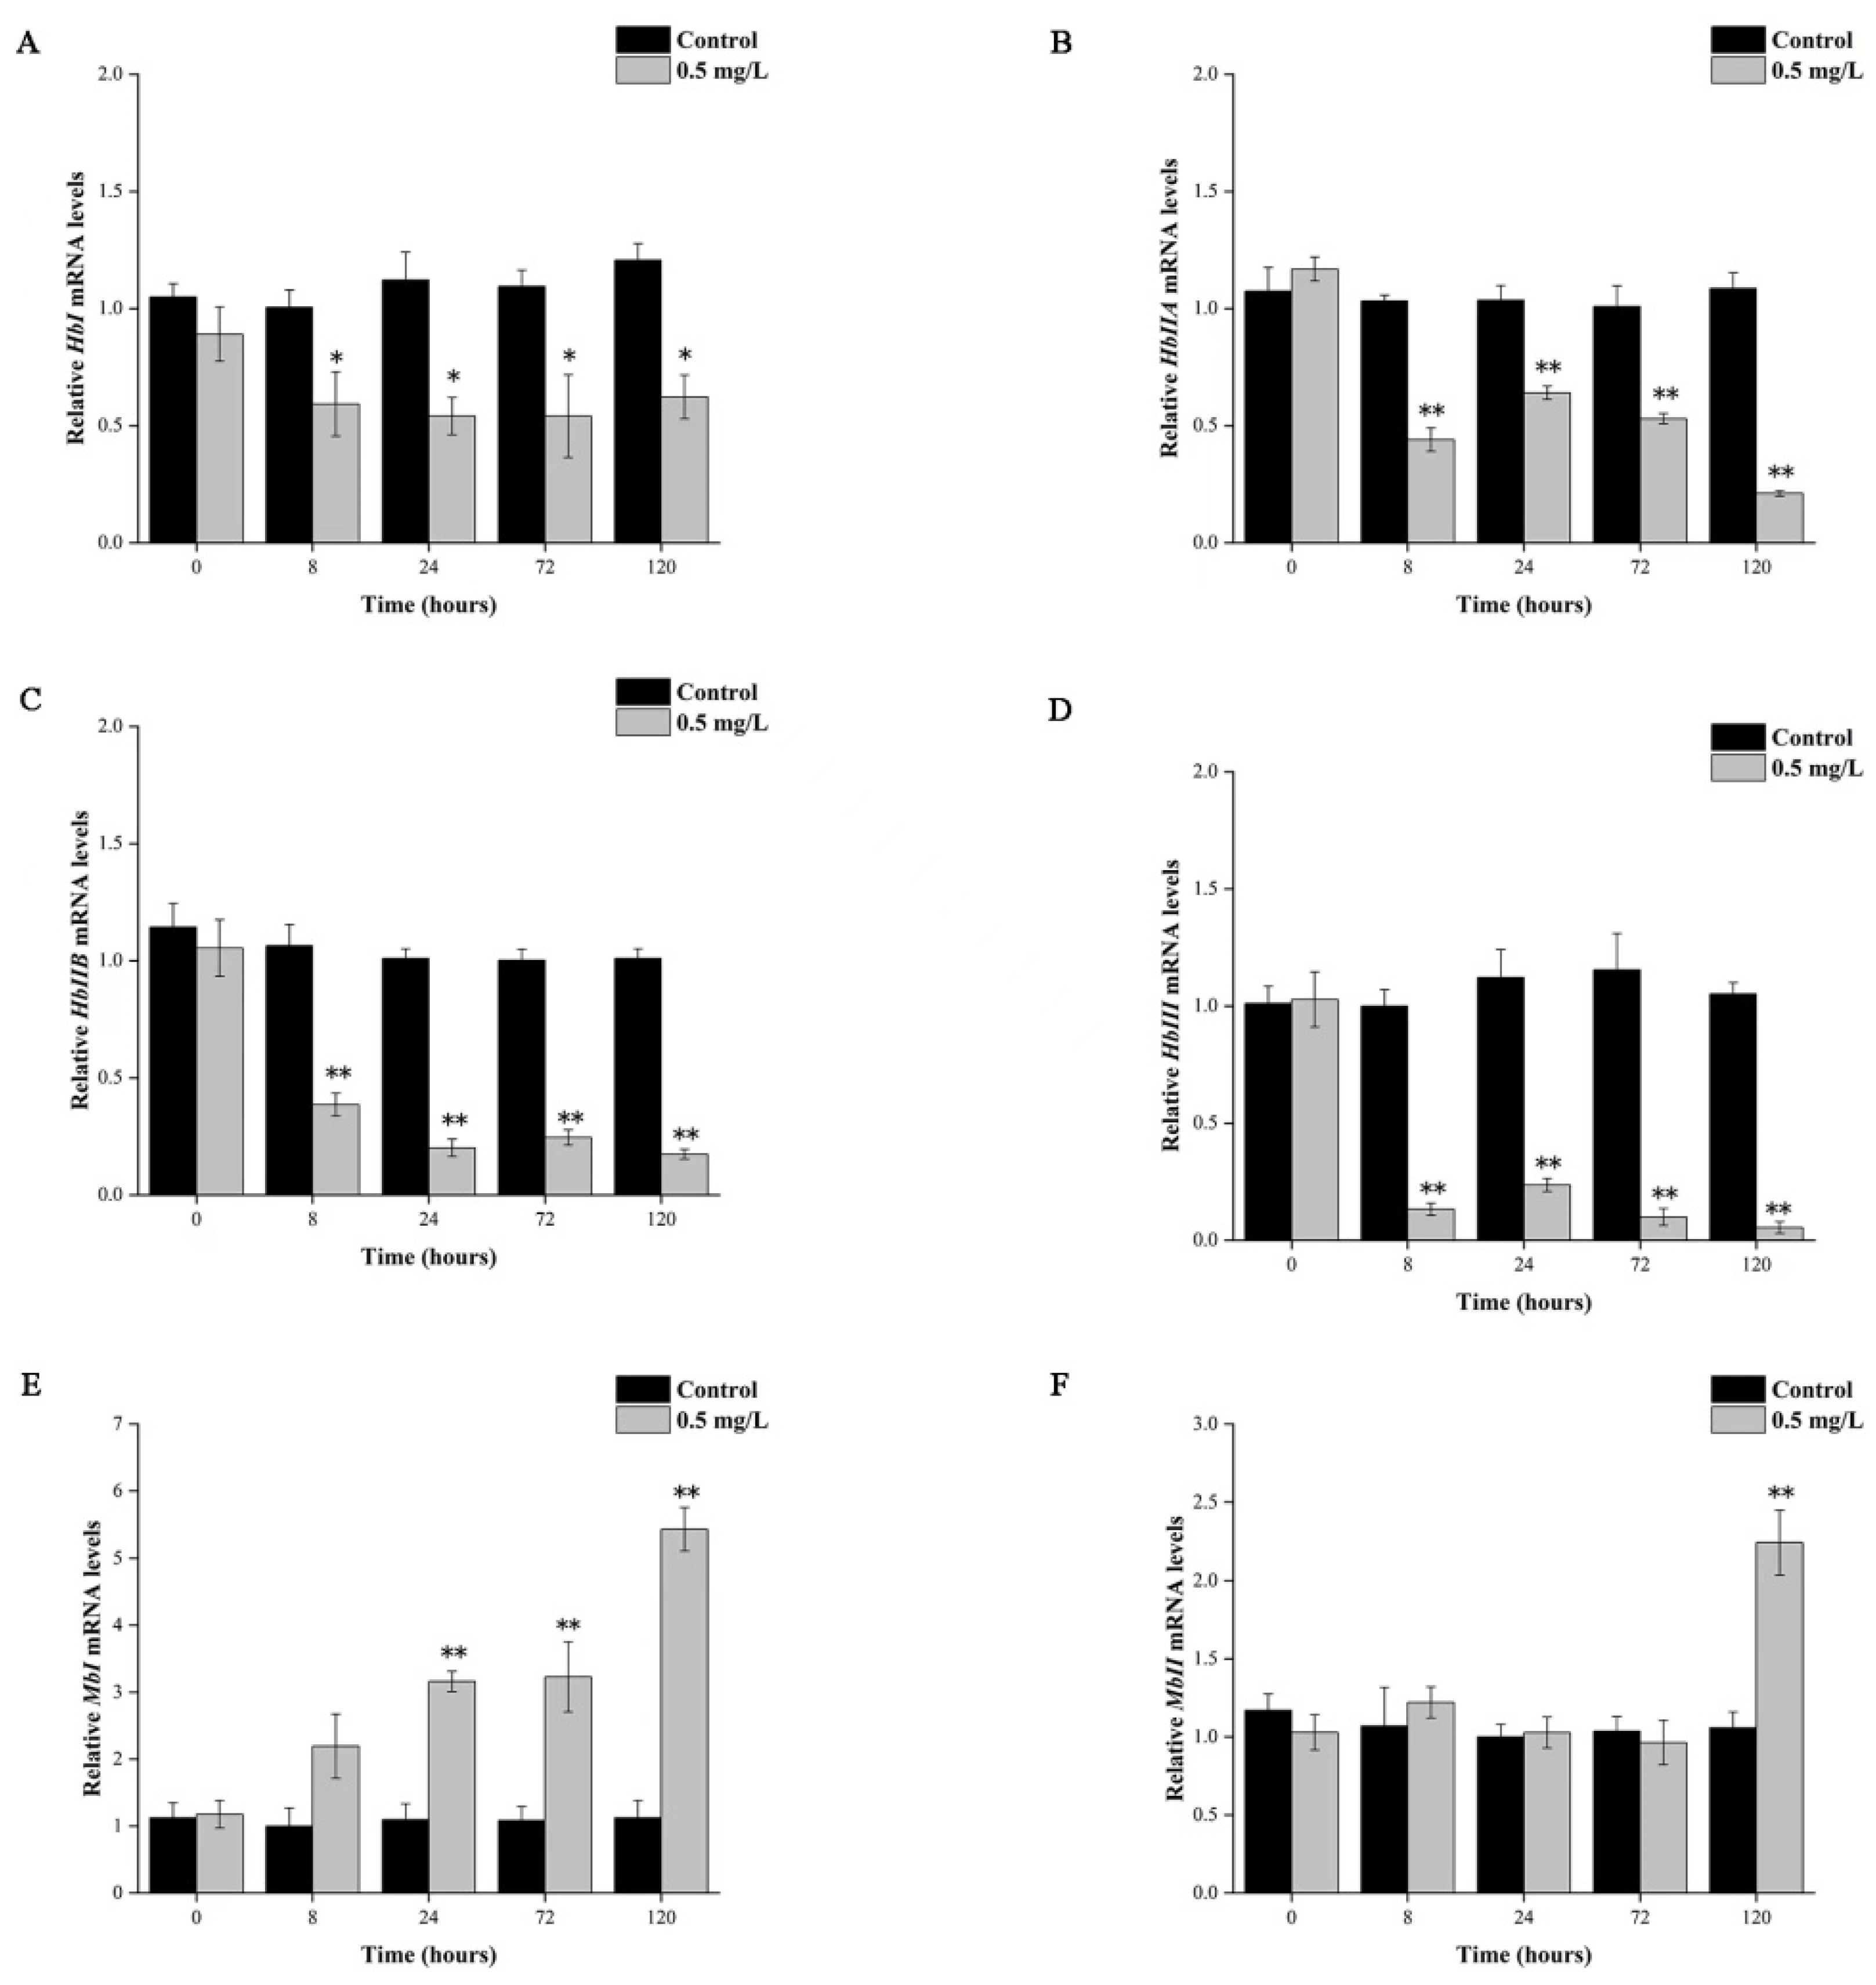
3.4. Hypoxia Affected mRNA Expression of Tg-Hb and Tg-Mb

Upon exposure to hypoxia, hemocytes exhibited a significant decrease in HbI, HbIIA, HbIIB, and HbIII after 8 h (Figure 3A–D). Notably, HbI mRNA expression was significantly different (p < 0.05), while expressions of HbIIA, HbIIB, and HbIII mRNA were extremely significantly different (p < 0.01) from those of the control group. In contrast, the mRNA expression levels of MbI and MbII in the hepatopancreas were found to increase upon hypoxia (Figure 3E,F). Specifically, MbI expression levels increased gradually with the duration of hypoxic stress, and after 24 h and 120 h hypoxia, there was a 3.16-fold and a 5.43-fold increase in mRNA levels of MbI, respectively, compared to the control group (p < 0.01). However, the expression level of MbII remained almost unchanged for 72 h of hypoxia and only showed a 2.24-fold increase compared to the control group after 120 h of hypoxia exposure (p < 0.01).

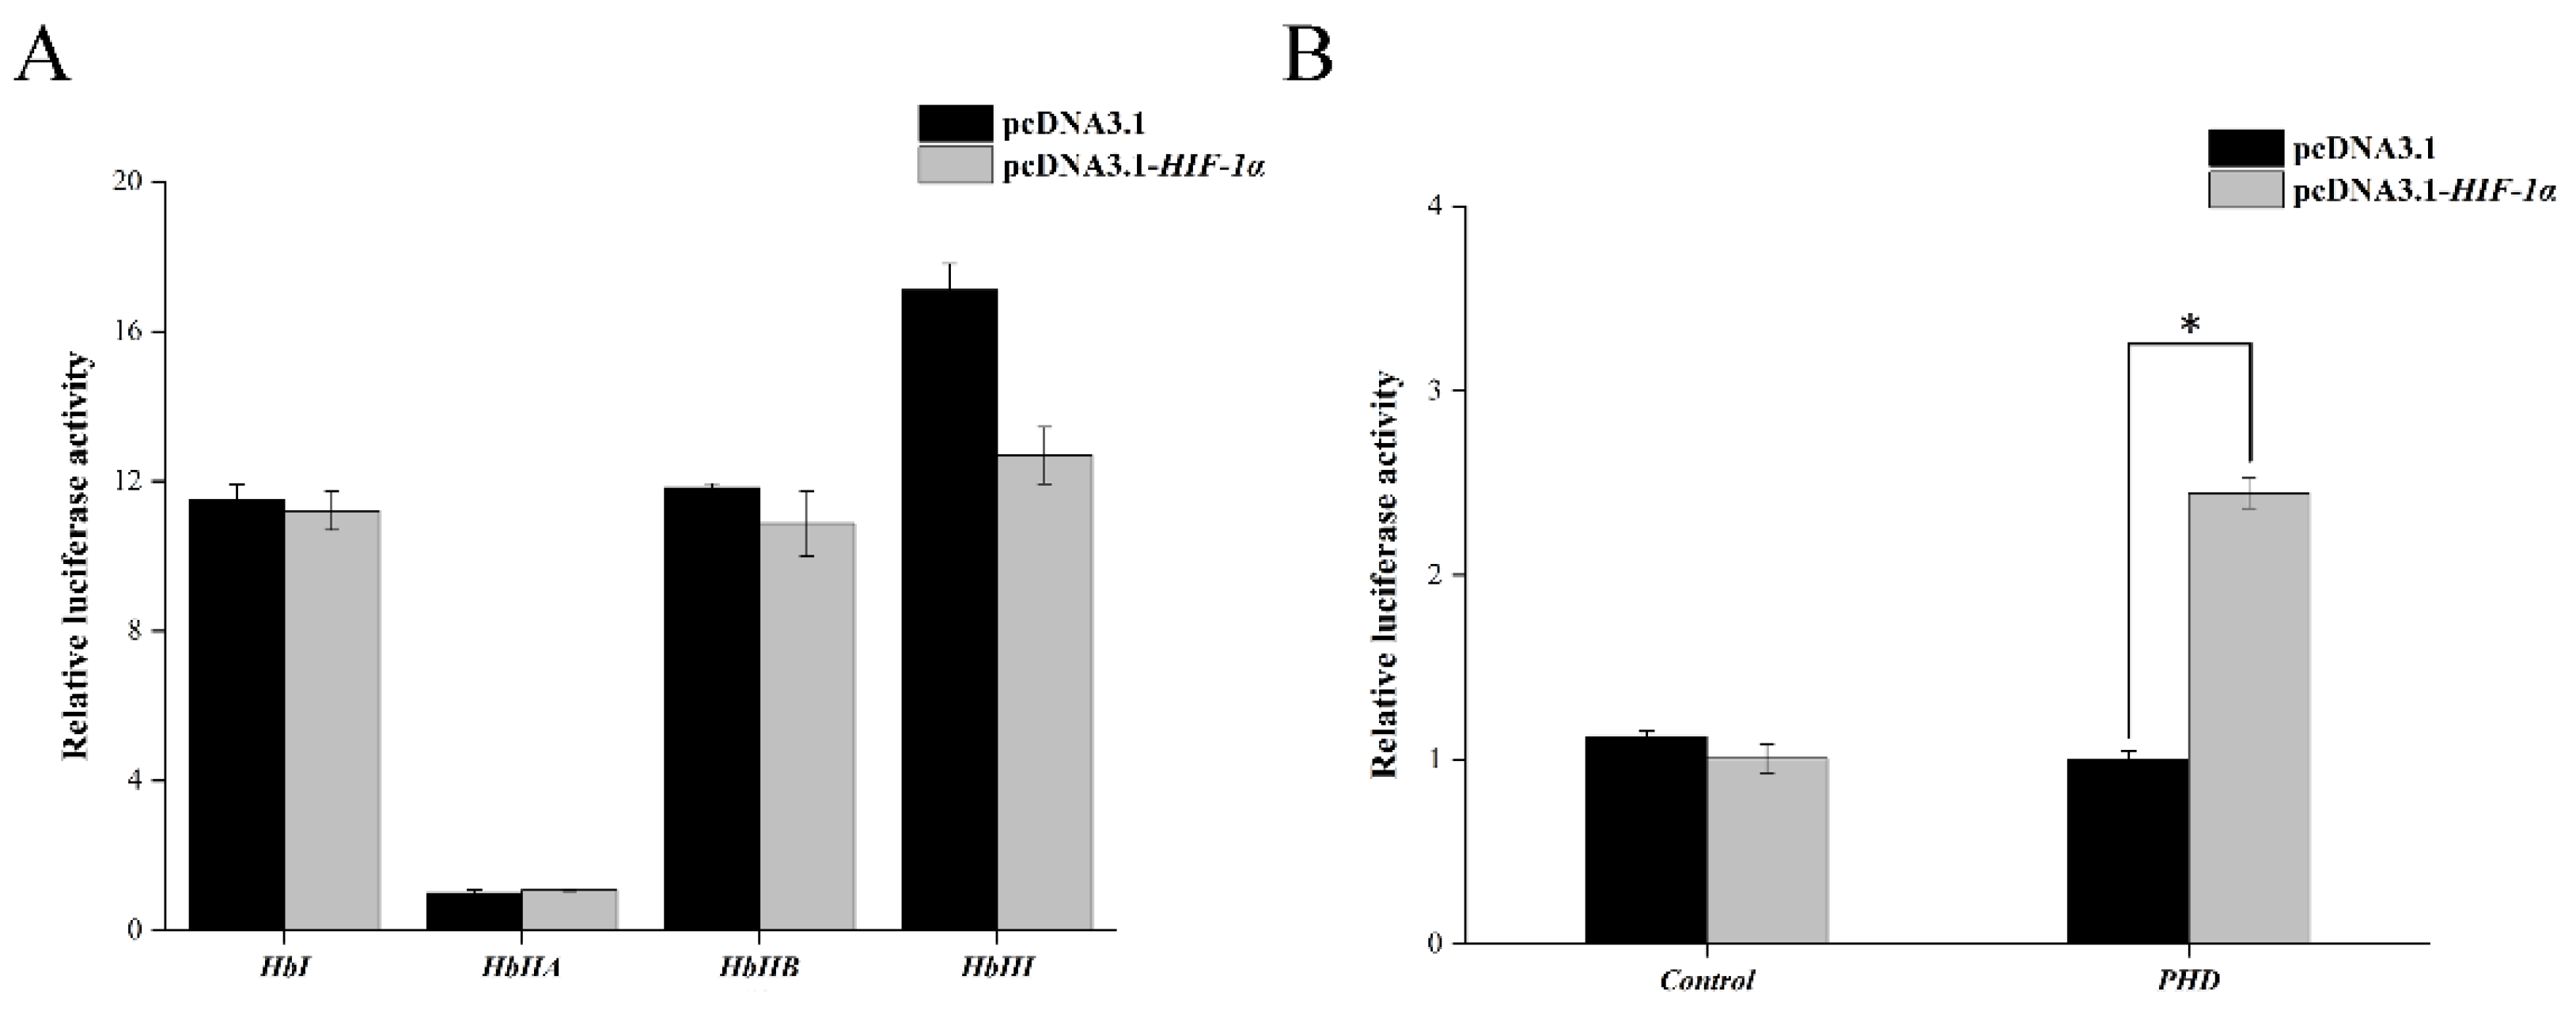
3.5. Transcription Activity Assay of Tg-HIF-1α on Tg-PHD and Tg-Hb

As shown in Figure 4A,B, co-transfecting of Tg-HIF-1α with PGL3-basic- HbI, PGL3-basic-HbIIA, PGL3-basic-HbIIB, and PGL3-basic HbIII did not result in a significant change in double luciferase activity compared to the two negative control groups. However, when Tg-HIF-1α was co-expressed with PGL3-basic-PHD, the double luciferase activity increased 2.44-fold compared to the two negative control groups (p < 0.01). These findings suggest that Tg-HIF-1α specifically regulates PHD but not Hb.

4. Discussion

The study revealed that Tg-HIF-1α has four main functional domains that are conserved and similar to those found in other species such as human, mouse, and zebrafish. The positions of the four conserved HIF-1α structural domains and the number of amino acids in each domain in T. granosa were consistent with the predicted results of the S. broughtonii structural domain [34] at the evolutionary level, which were also the closest relatives, although their degrees of hypoxia tolerance were different. The mortality rates of S. broughtonii and S. subcrenata at 0.5 mg/L of DO concentration in seven days were 44% and 74%, respectively [34], but the mortality rate of T. granosa was only 15% for hypoxia stress at 0.5 mg/L for 14 days in our previous results [27]. The difference may be associated with different habitats. S. broughtonii and S. subcrenata generally live in silt from a few meters to tens of meters underwater, while T. granosa inhabits intertidal mudflats, which are more susceptible to the influence of temperature and tidal changes, and this leads to periodic exposure to an environment of low oxygen. Wu [35] reported that when S. broughtonii was subjected to hypoxia again after hypoxia preadaptation, its oxygen consumption decreased, the feeding rate increased, enzyme activity was relatively stable and hypoxia tolerance was improved. Primary amino acid sequence analysis indicates a significant sequence similarity and shared key functional domains with the earlier described isoforms from vertebrates and invertebrates. Similarity in amino acid sequence between Tg-HIF-1α and other invertebrate and vertebrate species implies highly conserved functions of the gene throughout evolutionary history. The study found that Tg-HIF-1α and Tg-PHD were both expressed at high mRNA levels in the gill. In T. granosa, the gill is the primary organ responsible for gas exchange. Therefore, the gill might be sensitive to hypoxia and protect against hypoxic environments by accumulating HIF-1α mRNA accompanying the tidal cycle. The result was similar to the eastern oyster C. virginica, for which the mRNA expression level of HIF-1α was also higher in the gill; however, the expression of PHD mRNA tended to be higher in hepatopancreas compared to other tissues under all experimental conditions [36], which it is also similar to the Pacific oyster C. gigas HIF-1α and PHD mRNA expression, in which both were higher in the gill; furthermore, the HIF-1α protein was also induced by air exposure [37].
However, expression patterns of HIF-1α and PHD genes can vary among different species and tissues under hypoxic conditions. Studies have shown diverse responses across various organisms, including fishes, crustaceans, and bivalves. In Siberian Acipenser baeri, for example, the three HIF-1α, HIF-2α, HIF-3α genes exhibited different spatial expression patterns, with different abundance observed in the brain, heart, and liver tissues [18]. The expression of HIF-1α and PHD mRNA in this species increased significantly after 8 h hypoxia and gradually decreased thereafter, although it remained higher than the control group, and gradually decreased. This trend aligns with the finding from Pacific oyster [37], which also demonstrated a similar pattern of HIF-1α mRNA expression levels after 48 h of hypoxia exposure. On the other hand, crustaceans, such as the white shrimp Litopenaeus vannamei and the Atlantic blue crab Callinectes sapidus, demonstrated significant mRNA suppression following short-term hypoxia [38,39]. However, the grass shrimp Palaemonetes pugio exhibited constitutive expression of HIF-1α even under moderate (2.5 mg/L) and severe (1.5 mg/L) hypoxia [2]. In rainbow trout gonad cells, HIF-1α expression did not show significant changes under hypoxic stress [40], whereas in the small abalone Haliotis diversicolor, HIF-1α was upregulated by hypoxia at 2.0 mg/L [41]. In bivalves, such as Pacific oyster, the expression of PHD2A increased during short-term hypoxia but returned to normal levels following prolonged exposure [42], which is similar to our results. These results collectively suggest that the expression of HIF-1α and PHD genes can be both upregulated or downregulated under hypoxic conditions, depending on the species and specific circumstances. The duration and intensity of hypoxia exposure can also influence gene expression patterns, However, the degradation of Tg-HIF-1α may be associated with re-activation of PHD [43], suggesting a potential regulatory relationship between these factors. These findings emphasize the importance of studying the specific physiological responses of different species to hypoxia and understanding the underlying mechanisms. They also highlight the need for careful consideration and further investigation when designing breeding programs based on HIF-1α expression or other related factors in different species.
The mRNA expression levels of HbI, HbIIA, HbIIB, and HbIII were examined in hemocytes under hypoxic stress, and it was found that the expression levels of all isoforms decreased after 8 h, which is consistent with previous findings in zebrafish. However, this result differs from that observed in goldfish (Carassius auratus), where Hb expression levels did not significantly change under hypoxic stress [44]. Additionally, CsHb-α1 mRNA expression significantly increased under short-term hypoxia in most tissues compared to the control in the half-smooth tongue sole (Cynoglossus semilaevis) [45]. Hb mRNA levels in medaka (Oryzias latipes) and a few crustaceans increased under hypoxic conditions, and the Hb promoter of the cladocera (Daphnia magna) was found to contain HREs, which can be bound by HIF-1α and with a core sequence of 5′-RCGTG-3′ [25]. However, our study only found that Tg-HIF-1α bound to the HRE of Tg-PHD promoter, but not to the HREs of Hb; this result suggested that Tg-PHD is a potential target gene of Tg-HIF-1α and negative feedback regulation of Tg-HIF-1α on Tg-PHD, which can prevent over-expression of HIF-1α, similar to the findings in Pacific oyster [42]. Although HbI, HbIIA, HbIIB, and HbIII contain potential HRE binding sites, they may be inactive HRE sites or are not directly regulated by Tg-HIF-1α, as evidenced by the decrease in mRNA expression levels of various Hb isoforms on hypoxia. Thus, the response of Hb to hypoxia may be species specific, which showed there are HREs on the promoter regions of PHD not only in other species but also in T. granosa and revealed the mechanism of transcriptional control for Tg-HIF-1α under hypoxic conditions. During hypoxia, the translation of mammalian HIF-1α is maintained by a 5′cap/eukaryotic initiation factor 4E-independent mechanism, which is recruited for the translation initiation complex by internal ribosome entry site (IRES) in the large 5′ and 3′ untranslated regions of mRNAs [46]. In Pacific oyster, the 5′UTR of HIF-1α mRNA contains IRES, and HIF-1α translation was maintained during hypoxic conditions [37]. Nonetheless, the induction of Tg-HIF-1α protein dynamics in response to hypoxia has not been elucidated. Therefore, it is imperative to develop and assess appropriate antibodies for this purpose, and additional investigations are required to quantify the Tg-HIF-1α protein dynamics and establish the correlation between mRNA expression and protein levels.

5. Conclusions

HIF-1α is known to be induced by hypoxia and acts as a key regulator of hypoxic stress response. Similarity in the domain structure, amino acid sequence, and transcriptional responses of HIF-1α from T. granosa and other invertebrate and vertebrate species implies highly conserved functions of these genes throughout evolutionary history, in accordance with their critical role in oxygen sensing and homeostasis. The expression levels of HIF-1α and PHD mRNAs were highest in the gill and lowest in the adductor muscle. Both HIF-1α and PHD mRNAs exhibited induction under hypoxia conditions. Moreover, the Tg-HIF-1α demonstrated the ability to transactivate the PHD promoter but not that of Hb. These findings have significant implications as they suggest that the regulation of Tg-HIF-1α transcript levels could serve as a potential biomarker for exposure to ambient hypoxia. Hence, it is imperative to determine the expression of Tg-HIF-1α protein under hypoxic conditions for future study. Through the quantitative assessment of protein dynamics, we can acquire a more comprehensive understanding of its involvement in hypoxia tolerance.

Author Contributions

Y.B. and M.L. conceived and designed the experiments. X.L., M.J. and Y.Z. performed the experiments under the support of Z.P. and X.Z.; Y.Z. analyzed the data. Z.P. wrote together with M.J. and X.Z.; M.L. revised the manuscript. All authors have read and agreed to the published version of the manuscript.

Funding

This work was supported by Zhejiang Province Public Welfare Technology Application Research Project (LGN21C190012); Zhejiang Major Program of Science and Technology (2021C02069-7); Ningbo Public Benefit Research Key Project (2021S014); Zhejiang Provincial Top Discipline of Biological Engineering Level A (ZS2020005); Open Foundation from Marine Sciences in the First-Class Subjects of Zhejiang (OFMS007).

Institutional Review Board Statement

The animal study was reviewed and approved by the Institutional Animal Care and Use Committee (IACUC) of Zhejiang Wanli University, China (Approval code: 20221003001).

Data Availability Statement

Data are contained within the article.

Conflicts of Interest

The authors declare no conflict of interest.

Appendix A

Figure A1. Hypoxia experimental tank.
Fishes 08 00359 g0a1
Figure A2. Sequence structure analysis of T. granosa HIF-1α.
Fishes 08 00359 g0a2aFishes 08 00359 g0a2b
Figure A3. Tertiary protein structure of HIF-1α of T. granosa.
Fishes 08 00359 g0a3
Figure A4. Amino acid sequence comparison of hypoxia-inducible factor-1α between T. granosa and other species. Amino acid sequence Genebank number used for sequence alignment: T. granosa (Pec0025870.1); S. broughtonii (EVM0013350.1); C. virginica (AED87588.1); H. discus (MH135278.1); D. rerio (NP_001295488.1); M. musculus (AAH26139.1); H. sapiens (NP_001521.1); Color is distinguished based on the degree of conservation of identical or similar amino acids in different sequences. Red: 100%, yellow: >75%, blue: >50%.
Fishes 08 00359 g0a4

References

  1. Chen, C.C.; Gong, G.C.; Shiah, F.K. Hypoxia in the East China Sea: One of the largest coastal low-oxygen areas in the world. Mar. Environ. Res. 2007, 64, 399–408. [Google Scholar] [CrossRef] [PubMed] [Green Version]
  2. Li, T.; Brouwer, M. Hypoxia-inducible factor, gsHIF, of the grass shrimp Palaemonetes Pugio: Molecular characterization and response to hypoxia. Comp. Biochem. Physiol. B Biochem. Mol. Biol. 2007, 147, 11–19. [Google Scholar] [CrossRef] [PubMed]
  3. Velislava, T.; Vadeboncoeur, C.; Ting, J.; Perr, S.F. Effects of hypoxia-induced gill remodeling on the innervation and distribution of ionocytes in the gill of goldfish, Carassius auratus. J. Comp. Neurol. 2014, 522, 118–130. [Google Scholar]
  4. Ledford, H.; Callaway, E. Biologists who decoded how cells sense oxygen win medicine Nobel. Nature 2019, 574, 161–162. [Google Scholar] [CrossRef] [PubMed] [Green Version]
  5. Kewley, R.J.; Whitelaw, M.L.; Chapman, S.A. The mammalian basic helix-loop-helix/PAS’ family of transcriptional regulators. Int. J. Biochem. Cell Biol. 2004, 36, 189–204. [Google Scholar] [CrossRef] [PubMed]
  6. Kaelin, W.G.; Ratcliffe, P.J. Oxygen sensing by metazoans: The central role of the HIF hydroxylase pathway. Mol. Cell. 2008, 30, 393–402. [Google Scholar] [CrossRef]
  7. Epstein, A.C.; Gleadle, J.M.; McNeill, L.A.; Hewitson, K.S. C. elegans EGL-9 and mammalian homologs define a family of dioxygenases that regulate HIF by prolyl hydroxylation. Cell 2001, 107, 43–54. [Google Scholar] [CrossRef] [Green Version]
  8. Appelhoff, R.J.; Tian, Y.M.; Raval, R.R. Differential function of the prolyl hydroxylases PHD1, PHD2, and PHD3 in the regulation of hypoxia-inducible factor. J. Biol. Chem. 2004, 279, 38458–38465. [Google Scholar] [CrossRef] [Green Version]
  9. Yu, F.; White, S.B.; Zhao, Q.; Lee, F.S. HIF-1alpha binding to VHL is regulated by stimulus-sensitive proline hydroxylation. Proc. Natl. Acad. Sci. USA. 2001, 98, 9630–9635. [Google Scholar] [CrossRef]
  10. Hon, W.C.; Wilson, M.I.; Harlos, K.; Claridge, T.W.; Schofield, C.J.; Pugh, C.W.; Maxwell, P.H.; Ratcliffe, P.J.; Stuart, D.I.; Jones, E.Y. Structural basis for the recognition of hydroxyproline in HIF-1 alpha by pVHL. Nature 2002, 417, 975–978. [Google Scholar] [CrossRef]
  11. Semenza, G.L. The genomics and genetics of oxygen homeostasis. Annu. Rev. Genom. Hum. Genet. 2020, 21, 183–204. [Google Scholar] [CrossRef] [PubMed] [Green Version]
  12. Pugh, C.W.; O’Rourke, J.F.; Nagao, M.; Gleadle, J.M.; Ratcliffe, P.J. Activation of hypoxia-inducible factor-1; Definition of regulatory domains within the alpha subunit. J. Bio. Chem. 1997, 272, 11205–11214. [Google Scholar] [CrossRef] [Green Version]
  13. Yu, A.; Frid, M.G.; Shimoda, L.A.; Wiener, C.M.; Stenmark, K.; Semenza, G.L. Temporal, spatial, and oxygen-regulated expression of hypoxia-inducible Factor-1 in the lung. Am. J. Physiol. 1998, 275, L818–L826. [Google Scholar] [CrossRef] [PubMed]
  14. Kallio, P.J.; Okamoto, K.; O’Brien, S.; Carrero, P.; Makino, Y.; Tanaka, H.; Poellinger, L. Signal transduction in hypoxic cells: Inducible nuclear translocation and recruitment of the CBP/p300 coactivator by the hypoxia-inducible factor-1 alpha. EMBO J. 1998, 17, 6573–6586. [Google Scholar] [CrossRef]
  15. Wenger, R.H.; Camenisch, G.; Stiehl, D.P.; Katschinski, D.M. HIF prolyl-4-hydroxylase interacting proteins: Consequences for drug targeting. Curr. Pharm. Des. 2009, 15, 3886–3894. [Google Scholar] [CrossRef] [Green Version]
  16. Rytkönen, K.T.; Williams, T.A.; Renshaw, G.M.; Primmer, C.R.; Nikinmaa, M. Molecular evolution of the metazoan PHD-HIF oxygen-sensing system. Mol. Biol. Evol. 2011, 28, 1913–1926. [Google Scholar] [CrossRef] [PubMed]
  17. Roesner, A.; Mitz, S.A.; Hankeln, T.; Burmester, T. Globins and hypoxia adaptation in the goldfish, Carassius auratus. FEBS J. 2008, 275, 3633–3643. [Google Scholar] [CrossRef] [PubMed]
  18. Wang, X.W.; Xiao, S.S.; Zhang, R.; Liu, L.L.; Zhu, H. Physiological changes and transcriptional modulation of HIF-αs in Siberian sturgeon in response to hypoxia. Aquaculture 2021, 545, 737219. [Google Scholar] [CrossRef]
  19. Xiao, W.H. The hypoxia signaling pathway and hypoxic adaptation in fishes. Sci. China Life Sci. 2015, 58, 148–155. [Google Scholar] [CrossRef] [Green Version]
  20. Dunwoodie, S.L. The role of hypoxia in development of the mammalian embryo. Dev. Cell. 2009, 17, 755–773. [Google Scholar] [CrossRef] [Green Version]
  21. Gary, J.S.; Wu, R.S.; Ying, Y. Effects of hypoxia and organic enrichment on the coastal marine environment. Mar. Ecol. Prog. Ser. 2002, 238, 249–279. [Google Scholar] [CrossRef]
  22. Wang, T.; Meng, J.; Li, L.; Zhang, G.F. Characterization of CgHIFα-Like, a novel bHLH-PAS transcription factor family member, and its role under hypoxia stress in the Pacific oyster Crassostrea gigas. PLoS ONE. 2016, 11, e0166057. [Google Scholar] [CrossRef] [Green Version]
  23. Shen, G.Y.; Huang, L.F.; Guo, F. Marine Ecology, 3rd ed.; Science Press China: Beijing, China, 2010; pp. 100–125. [Google Scholar]
  24. Lappin, T.R.; Lee, F.S. Update on mutations in the HIF: EPO pathway and their role in erythrocytosis. Blood Rev. 2019, 37, 100590. [Google Scholar] [CrossRef] [PubMed]
  25. Gorr, T.A.; Cahn, J.D.; Yamagata, H.F. Hypoxia-induced synthesis of hemoglobin in the crustacean Daphnia magna is hypoxia-inducible factor-dependent. J. Biol. Chem. 2004, 279, 36038–36047. [Google Scholar] [CrossRef] [PubMed] [Green Version]
  26. Bao, Y.B.; Wang, J.; Li, C.; Li, P.; Wang, S.; Lin, Z. A preliminary study on the antibacterial mechanism of Tegillarca granosa hemoglobin by derived peptides and peroxidase activity. Fish Shellfish Immunol. 2016, 51, 9–16. [Google Scholar] [CrossRef] [PubMed]
  27. Zhan, Y.; Zha, S.J.; Peng, Z.L.; Lin, Z.H.; Bao, Y.B. Hypoxia-mediated immunotoxicity in the blood clam Tegillarca granosa. Mar. Environ. Res. 2022, 177, 105632. [Google Scholar] [CrossRef] [PubMed]
  28. Bao, Y.B.; Wang, Q.; Lin, Z.H. Hemoglobin of the blood clam Tegillarca granosa (Tg-HbI) is involved in the immune response against bacterial infection. Fish Shellfish Immunol. 2011, 31, 517–523. [Google Scholar] [CrossRef]
  29. Bao, Y.B.; Zeng, Q.F.; Wang, J.; Zhang, Z.L.; Zhang, Y.; Wang, S.F.; Wong, N.K.; Yuan, W.B.; Huang, Y.Y.; Zhang, W.F.; et al. Genomic insights into the origin and evolution of molluscan red-bloodedness in the blood clam Tegillarca granosa. Mol. Biol. Evol. 2021, 38, 2351–2365. [Google Scholar] [CrossRef]
  30. Riggs, A.F.; Gorr, T.A. A globin in every cell. Proc. Natl. Acad. Sci USA. 2006, 103, 2469–2470. [Google Scholar] [CrossRef]
  31. Zha, S.J.; Rong, J.H.; Guan, X.F.; Tang, Y.; Han, Y.; Liu, G.X. Immunotoxicity of four nanoparticles to a marine bivalve species, Tegillarca granosa. J. Hazard. Mater. 2019, 377, 237–248. [Google Scholar] [CrossRef]
  32. Zhang, W. Influence of hypoxia stress on physiological metabolism of Ruditapes philippinarum. Chin. J. Ecol. 2014, 33, 2448–2453. [Google Scholar]
  33. Mu, Y.N.; Li, W.R.; He, L.H.; Chen, J.; Chen, X.H. Transcriptome analysis reveals new insights into immune response to hypoxia challenge of large yellow croaker (larimichthys crocea). Fish. Shellfish Immun. 2020, 98, 738–747. [Google Scholar] [CrossRef] [PubMed]
  34. Zhang, G.W.; Wu, B.; Liu, Z.L.; Zhou, L.Q.; Sun, X.J.; Zhao, Q.; Yang, A.G. Structural characteristics of HIF-1α from Scapharca broughtonii and expression analysis under hypoxia. J. Fish. Sci. China. 2019, 26, 646–656. [Google Scholar]
  35. Wu, L. Effects of hypoxic preconditioning on the physiological and biochemical characteristics of Scapharca broughtonii under hypoxia stress. Prog. Fish. Sci. 2022, 43, 1–10. [Google Scholar]
  36. Piontkivska, H.; Chung, J.S.; Ivanina, A.V.; Sokolov, E.P.; Techa, S.; Sokolova, I.M. Molecular characterization and mRNA expression of two key enzymes of hypoxia-sensing pathways in eastern oysters Crassostrea virginica (Gmelin): Hypoxia-inducible factor α (HIF-α) and HIF-prolyl hydroxylase (PHD). Comp. Biochem. Physiol. Part D Genom. Proteom. 2011, 6, 103–114. [Google Scholar] [CrossRef] [Green Version]
  37. Kawabe, S.; Yokoyama, Y. Role of hypoxia-inducible factor alpha in response to hypoxia and heat shock in the Pacific oyster Crassostrea gigas. Mar. Biotechnol. 2012, 14, 106–119. [Google Scholar] [CrossRef]
  38. Soñanez, O.J.G.; Peregrino, A.B.; Gómez, J.S.; López, Z.A.; Forman, H.J.; Plascencia, Y.G. Molecular characterization of hypoxia inducible factor-1 (HIF-1) from the white shrimp Litopenaeus vannamei and tissue-specific expression under hypoxia. Comp. Biochem. Physiol. C Toxicol. Pharmacol. 2009, 150, 395–405. [Google Scholar] [CrossRef] [PubMed]
  39. Hardy, K.M.; Follett, C.R.; Burnett, L.E.; Lema, S.C. Gene transcripts encoding hypoxia-inducible factor (HIF) exhibit tissue and muscle fiber type-dependent responses to hypoxia and hypercapnic hypoxia in the Atlantic blue crab, Callinectes sapidus. Comp. Biochem. Physiol. A Mol. Integr. Physiol. 2012, 163, 137–146. [Google Scholar] [CrossRef] [Green Version]
  40. Soitamo, A.J.; Rabergh, C.M.; Gassmann, M.; Sistonen, L.; Nikinmaa, M. Characterization of a hypoxia-inducible factor (HIF-1a) from rainbow trout accumulation of protein occurs at normal venous oxygen tension. J. Biol. Chem. 2001, 276, 19699–19705. [Google Scholar] [CrossRef] [Green Version]
  41. Cai, X.H.; Huang, Y.T.; Zhang, X.; Wang, S.; Zou, Z.H.; Wang, G.D.; Wang, Y.L.; Zhang, Z.P. Cloning, characterization, hypoxia, and heat shock response of hypoxia inducible factor-1 (HIF-1) from the small abalone Haliotis diversicolor. Gene 2014, 534, 256–264. [Google Scholar] [CrossRef]
  42. Wang, T. The Molecular Mechanism of Hypoxia Signal Pathway in the Pacific Oyster (Crassostrea gigas). Ph.D. Thesis, University of Chinese Academy of Science, Beijing, China, 2017; pp. 1–135, (In Chinese with an English abstract). [Google Scholar]
  43. Berra, E.; Ginouvés, A.; Pouysségur, J. The hypoxia-inducible factor hydroxylases bring fresh air into hypoxia signaling. EMBO Rep. 2006, 7, 41–45. [Google Scholar] [CrossRef] [PubMed] [Green Version]
  44. Rosner, A.; Hankeln, T.; Burmester, T. Hypoxia induces a complex response of globin expression in zebrafish (Danio rerio). Exp. Biol. 2006, 209, 2129–2137. [Google Scholar] [CrossRef] [PubMed] [Green Version]
  45. Wang, Z.S.; Qi, Z.T.; Tian, J.Y.; Qiu, M.; Zhao, W.H.; Wang, A.M.; Huang, J.T.; Guo, X.J. Cloning of hemoglobin-α1 from half-smooth tongue sole (Cynoglossus semilaevis) and its expression under short-term hypoxia. Zool. Res. 2011, 32, 641–646. [Google Scholar]
  46. Spriggs, K.A.; Bushell, M.; Willis, A.E. Translational regulation of gene expression during conditions of cell stress. Mol. Cell 2010, 40, 228–237. [Google Scholar] [CrossRef] [PubMed]
Figure 1. Phylogenetic tree of HIF-1α in T. granosa and other species constructed by MEGA7 software using the maximum likelihood method and based on 1000 bootstrap trials. The amino acid sequence Genebank numbers used in phylogenetic tree construction: T. granosa (Pec0025870.1); S. broughtonii (EVM0013350.1); C. virginica (AED87588.1); L. gigantea (XP_009065767.1); H. discus (MH135278.1); B. floridae (AGX25238.1); D. rerio (NP_001295488.1); X. laevis (NP_001080449.1); M. musculus (AAH26139.1); H. sapiens (NP_001521.1); D. melanogaster (NP_001287599.1); T. castaneum (EFA04586.1); E. sinensis (KF825558.1); P. vannamei (ACU30154.1) and C. elegans (NP_001023893.1). The number of nodes is usually the bootstrap value, while the number on the branch is the evolutionary distance.
Fishes 08 00359 g001
Figure 2. Expression analysis of HIF-1α and PHD genes under normoxia and hypoxia stress. Relative expression in six different tissues under normoxia: (A) HIF-1α and (B) PHD. The letter a, b, c, d represent significant differences between tissues. Data are means ± SD (n = 3). qRT-PCR analysis of (C) HIF-1α and (D) PHD in gill under hypoxia stress at DO 0.5 mg/L and 2.0 mg/L. Columns and bars show mean ± SD. Asterisks indicate significant differences at * p < 0.05 and ** p < 0.01.
Fishes 08 00359 g002
Figure 3. Expression analysis of HbI, HbIIA, HbIIB, HbIII (AD) and Mb (E,F) genes in T. granosa at 0.5 mg/L DO. Columns and bars show mean ±SD (n = 3); asterisks indicate significant differences at * p < 0.05 and ** p < 0.01.
Fishes 08 00359 g003
Figure 4. Relative luciferase activity of Tg-HIF-1α on Tg-Hb (A) and Tg-PHD (B). Columns and bars show mean ± SD (n = 3); asterisks indicate significant differences at * p < 0.05.
Fishes 08 00359 g004
Table 1. Primers used in this study for PCR analysis of T. granosa genes.
Primer NamePrimer Sequence (5′-3′)ApplicationLength (bp)
qPCR-Tg-HIF-1α-FATTCCAGCCCAGACCTTqRT-PCR106
qPCR-Tg-HIF-1α-RGGGAGCCAAATGAGTAAGA
qPCR-Tg-PHD-FGACGTGCCAGAAGGAATqRT-PCR134
qPCR-Tg-PHD-RCGATAATAAGAGGCTTTACACT
qPCR-Tg-HbI-FTACTTCAAGCGTTTGGGAGAqRT-PCR116
qPCR-Tg-HbI-RGCTGGGCTGTCGAGATGA
qPCR-Tg-HbIIA-FGACATACGCACTCAACAACTTqRT-PCR114
qPCR-Tg-HbIIA-RAATGCTTCGGCACTGAT
qPCR-Tg-HbIIB-FGGACACGCCATCACCTTqRT-PCR172
qPCR-Tg-HbIIB-RTTGCCTTCAATACTGCTCTAA
qPCR-Tg-HbIII-FAAATGGCGTAGCTCTAATGqRT-PCR195
qPCR-Tg-HbIII-RTTTCGTGCAACATCTTCTA
qPCR-Tg-MbI-FAGCATGGCGTTGAACTAqRT-PCR141
qPCR-Tg-MbI-RCATACATAAATGTGGTGGC
qPCR-Tg-MbII-FGTTGGGCATATCTTGAATCqRT-PCR150
qPCR-Tg-MbII-RGACCACGCATACTACGG
qPCR-Tg-18S rRNA-FCTTTCAAATGTCTGCCCTATCAACTqRT-PCR148
qPCR-Tg-18S rRNA-RTCCCGTATTGTTATTTTTCGTCACTqRT-PCR
PGL3-Tg-HbI-FCGAGCTCTTACCCTTCCCGTCTTCHbI1745
PGL3-Tg-HbI-RCCCTCGAGTTAGCCCAACCTCACAA
PGL3-Tg-HbIIA-FCGAGCTCAGGTCAGATGTACCAGCACHbIIA2071
PGL3-Tg-HbIIA-RCCCTCGAGTTCCGCAACAGAAAGAG
PGL3-Tg-HbIIB-FCGAGCTCATTTGTGGCAGCGTTCAHbIIB1593
PGL3-Tg-HbIIB-RCCCTCGAGAAAGGGCGTCTGTAGCA
PGL3-Tg-HbIII-FCGAGCTCCTTTAAGGCTTGTCACTCHbIII1655
PGL3-Tg-HbIII-RCCCTCGAGCAACCTCTGGGTCTGTG
PGL3-Tg-PHD-FCGAGCTCTTGCCTTTGTCTTTCTCPHD1844
PGL3-Tg-PHD-RCCCTCGAGTTCTTCAGGACCTATGC
pcDNA3.1-Tg-HIF-1α-FCGGGATCCAAATGGCCGGTAAAAGAAGHIF-1α2142
pcDNA3.1-Tg-HIF-1α-RCCCTCGAGCTTTTTTCCTCAATAATGCTG
Table 2. Deduced amino acid sequence comparison of T. granosa HIF-1α. with other HIF-1αs (%).
HLHPAS-APAS-BPACORF
S. broughtoniiHIF-1α98.1588.0694.0395.4587.96
T. kiyonoi HIF-1α87.0479.1086.5784.0969.49
C. virginica HIF-1α60.7158.2162.9677.2747.55
H. discusi HIF-1α58.9353.7373.1375.0043.69
D. rerio HIF-1α62.9647.7655.2259.0929.77
M. musculus HIF-1α55.3649.2562.6961.3628.43
H. sapiensHIF-1α55.3649.2562.6961.3628.40
Disclaimer/Publisher’s Note: The statements, opinions and data contained in all publications are solely those of the individual author(s) and contributor(s) and not of MDPI and/or the editor(s). MDPI and/or the editor(s) disclaim responsibility for any injury to people or property resulting from any ideas, methods, instructions or products referred to in the content.

