Article

Effects of Dietary Lentinus edodes Fermentation Supplementation on Digestive Enzyme Activity, Antioxidant Capacity and Morphology of the Liver and Intestine in Largemouth Bass (Micropterus salmoides) Fed High Plant Protein Diets

1
Innovative Institute of Animal Healthy Breeding, College of Animal Sciences and Technology, Zhongkai University of Agriculture and Engineering, Guangzhou 510225, China
2
YueHao Biotechnology (Guangzhou) Co., Ltd., Guangzhou 510663, China
3
Guangdong Provincial Key Laboratory of Lingnan Specialty Food Science and Technology, Guangzhou 510225, China
4
Key Laboratory of Green Processing and Intelligent Manufacturing of Lingnan Specialty Food, Ministry of Agriculture, Guangzhou 510225, China
*
Authors to whom correspondence should be addressed.
Fishes 2023, 8(6), 329; https://doi.org/10.3390/fishes8060329
Submission received: 5 June 2023 / Revised: 16 June 2023 / Accepted: 16 June 2023 / Published: 20 June 2023

Abstract

:
This study evaluated the effect of Lentinus edodes fermentation (LEF) on digestive enzyme activity, antioxidant capacity and morphology of the liver and intestine in largemouth bass (Micropterus salmoides) fed high plant protein diets (HPPD). LEF was supplemented in HPPD with 0 g kg−1 (LEF0), 10 g kg−1 (LEF1), 20 g kg−1 (LEF2), 30 g kg−1 (LEF3), 40 g kg−1 (LEF4), 50 g kg−1 (LEF5), respectively, and then the six diets were fed to largemouth bass with a body weight of 28.8 ± 0.05 g for eight weeks. Juvenile fish were randomized into 6 groups and each group had 4 replicates with 40 fish. Dietary LEF supplementation alleviated the liver inflammatory reaction of largemouth bass caused by HPPD and improved liver morphology. Goblet cells multiplied and the gut muscle layer thickened after LEF supplementation. The LEF significantly increased amylase activity in the liver and intestine of largemouth bass in individual experimental groups. The LEF could increase the activity of catalase in the liver and intestine of largemouth bass (p < 0.05). The content of malondialdehyde was significantly lower than that in the control group (p < 0.05). Dietary LEF supplementation had no significant effect on the intestinal flora of largemouth bass. These findings imply that LEF supplementation can reduce liver inflammation, enhance intestinal tissue morphology, and eventually benefit largemouth bass health.
Key Contribution: A. Low dose of LEF supplementation in high plant protein diet can reduce liver inflammatory infiltration. B. LEF supplementation has a potential future in liver protection as a new functional feed addition.

1. Introduction

The largemouth bass is an important freshwater economic fish in China, with good meat quality, rich nutrition and strong adaptability [1]. The normal growth of carnivorous fish requires feed containing 30~55% crude protein. As a result, fishmeal is often chosen as the main protein source for carnivorous economic fish feeds such as largemouth bass. As one of the main raw materials for terrestrial and aquatic animal feed, fishmeal has the advantages of good palatability, balanced amino acid composition, and ease of animal digestion and absorption [2,3]. While the demand for fishmeal has increased due to the global aquaculture industry’s quick development, other factors such as declining fishmeal production and rising prices have forced people to look for high-yield, low-cost protein alternatives to fishmeal [3,4,5,6], and plant protein has received widespread attention as an ideal alternative to fishmeal.
Certain plant proteins are more advantageous in terms of amino acid composition and nutrient content, so they are widely used in aquaculture [7,8,9]. However, numerous studies have also noted that using plant protein as the main protein might have a detrimental effect on fish development, liver function, and gastrointestinal health. Studies on Japanese sea bass (Lateolabrax japonicus), Florida pompano (Trachinotus carolinus), and carp (Carassius auratus gibelio) have inflammation occurs in both the liver and intestines of fish found that after ingesting a high proportion of soy protein feed [10,11,12]. These negative effects are mainly caused by anti-nutritional factors (ANFs) in plant proteins [1]. The study demonstrates that high plant protein diets are difficult to meet the nutritional needs of largemouth bass [13,14], and have a negative impact on the growth and development of largemouth bass, liver and intestinal health [15,16,17,18,19].
Lentinus edodes (L. edodes) belongs to the basidiomycetes order, which grows naturally in warm and humid environments, and is one of the most popular large edible fungi [20]. Mycelium and fruiting bodies of L. edodes are sources of a variety of nutrients and bioactive compounds with numerous positive health effects. [21]. As a highly nutritious functional food, various studies have confirmed that Lentinus edodes have anti-inflammatory and liver protection, anti-tumor, hypoglycemic and hypolipidemic effects, and antibacterial and other pharmacological effects [22,23,24]. At present, few studies have been related to the effects of L. edodes on the growth and health of aquatic animals, and the research on L. edodes first fermented and treated as an economic fish feed additive has rarely been reported. Based on the above results, LEF can be used as a functional additive in commercial fish culture to reduce the liver damage induced by HPPD.

2. Materials and Methods

2.1. Preparation of Experimental Diet

Six experimental diets were formulated to contain graded levels of LEF (YueHao Biotechnology (Guangzhou) Co., Ltd., Guangzhou, China). Fish meal, soybean meal, corn gluten meal and peanut bran are the protein sources of the experimental base diet (LEF0). The other five diets (LEF1, LEF2, LEF3, LEF4, LEF5) were supplemented with 10 g kg−1 (LEF1), 20 g kg−1 (LEF2), 30 g kg−1 (LEF3), 40 g kg−1 (LEF4), 50 g kg−1 (LEF5) LEF, respectively. The formulation and composition of experimental diets are presented in Table 1. All the ingredients in the experimental diet were ground into a powder and mixed, then separately mixed with fish oil and water to make a dough, which was then extruded into a 3-mm granulator (F-26, South China University of Technology, Guangzhou, China). After drying, all diets were stored at −20 °C until use.
According to AOAC (Association of Official Analytical Chemists, 2005), the composition of feed nutrients was analyzed. Moisture was determined using the 105 °C drying constant weight method (for 24 h); crude protein was determined using the Kjeldahl method; crude fat was determined using the Soxhlet extraction method and the ash determination used the chamber resistance furnace burning method.

2.2. Experimental Fish and Samples Collection

This experiment was conducted at Baiyun Base of Guangdong Academy of Agricultural Sciences (Guangzhou, China). Experimental fish were provided by the base and domesticated for two weeks using basic feed under experimental conditions. After domestication, fish were fasted for 24 h, then weighed and grouped. Experimental fish were assigned to six treatments with four replicates per treatment and released 40 fish with an average weight of 28.8 g ± 0.2 g into cages (1 m × 1 m × 1.5 m). Experimental fish were fed twice a day at 8:00 and 16:00 until significant satiety was observed. Experimental fish were fed for 8 weeks under a natural light cycle. During the experiment, dissolved oxygen was higher than 6.0 mg L−1, ammonia nitrogen was lower than 0.05 mg L−1, and the water temperature was between 28 °C and 33 °C.
After the 8-week feeding experiment, experimental fish were fasted for 24 h first, then weighed according to experimental groups. In each replicate, 8 fish were randomly selected for anesthesia with eugenol in dosage 150 mL/L, and 5 fish were selected to be weighed the body weight, visceral weight and liver weight respectively. The liver and part of the intestine were removed and then stored at −80 °C for subsequent analysis; the Caudal vein of the fish was punctured, blood samples were obtained, centrifuged (3000 rpm, 15 min, 4 °C), separated and stored at −80 °C.

2.3. Growth Performance

At the end (after 8 weeks) of the feeding trial, fish of each cage were weighed and growth parameters including weight gain rate (WGR, %), specific growth rate (SGR, % day−1), feed conversion ratio (FCR), hepatosomatic index (HSI, %), viscerosomatic index (VSI, %), condition factor (CF, g cm−3) and survival rate (SR, %) were calculated.
WGR = (final body weight (g) − initial body weight (g))/initial body weight (g) × 100%;
SGR = (ln final body weight (g) − ln initial body weight (g))/experimental period (d) × 100%;
FCR = feed consumption (g)/(final body weight (g) − initial body weight (g));
HSI = liver weight (g)/whole body weight (g) × 100%;
VSI = viscera weight (g)/whole body weight (g) × 100%;
CF = body weight (g)/(body length (cm))3 × 100%;
SR = final number of the fish/initial number of the fish × 100%.

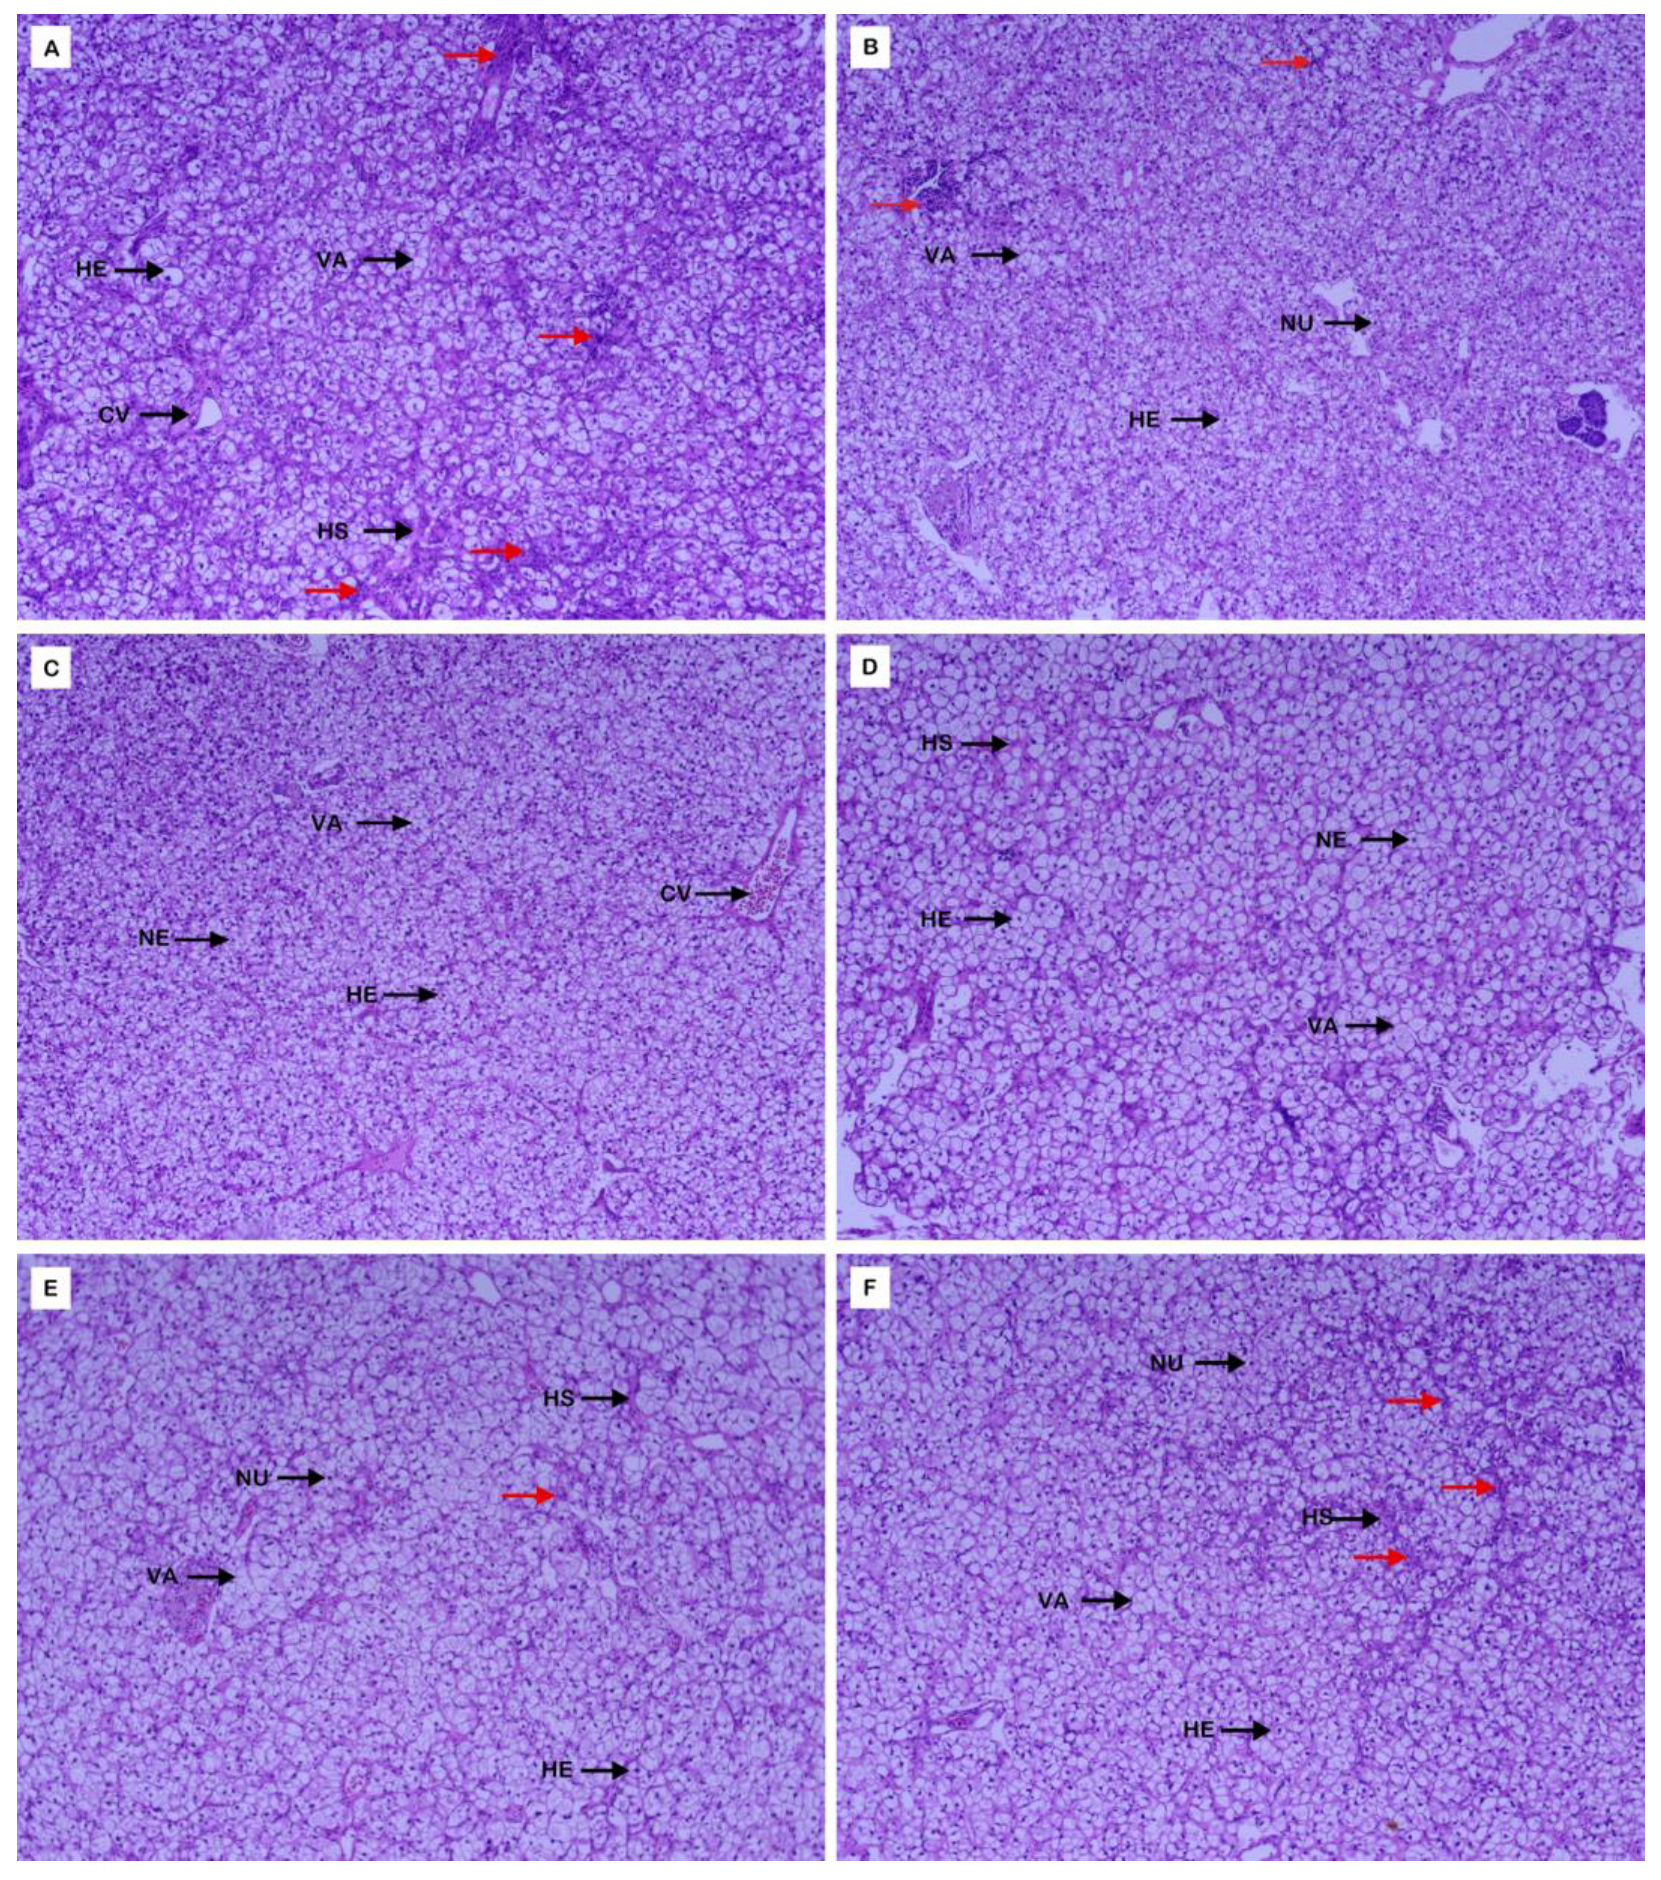
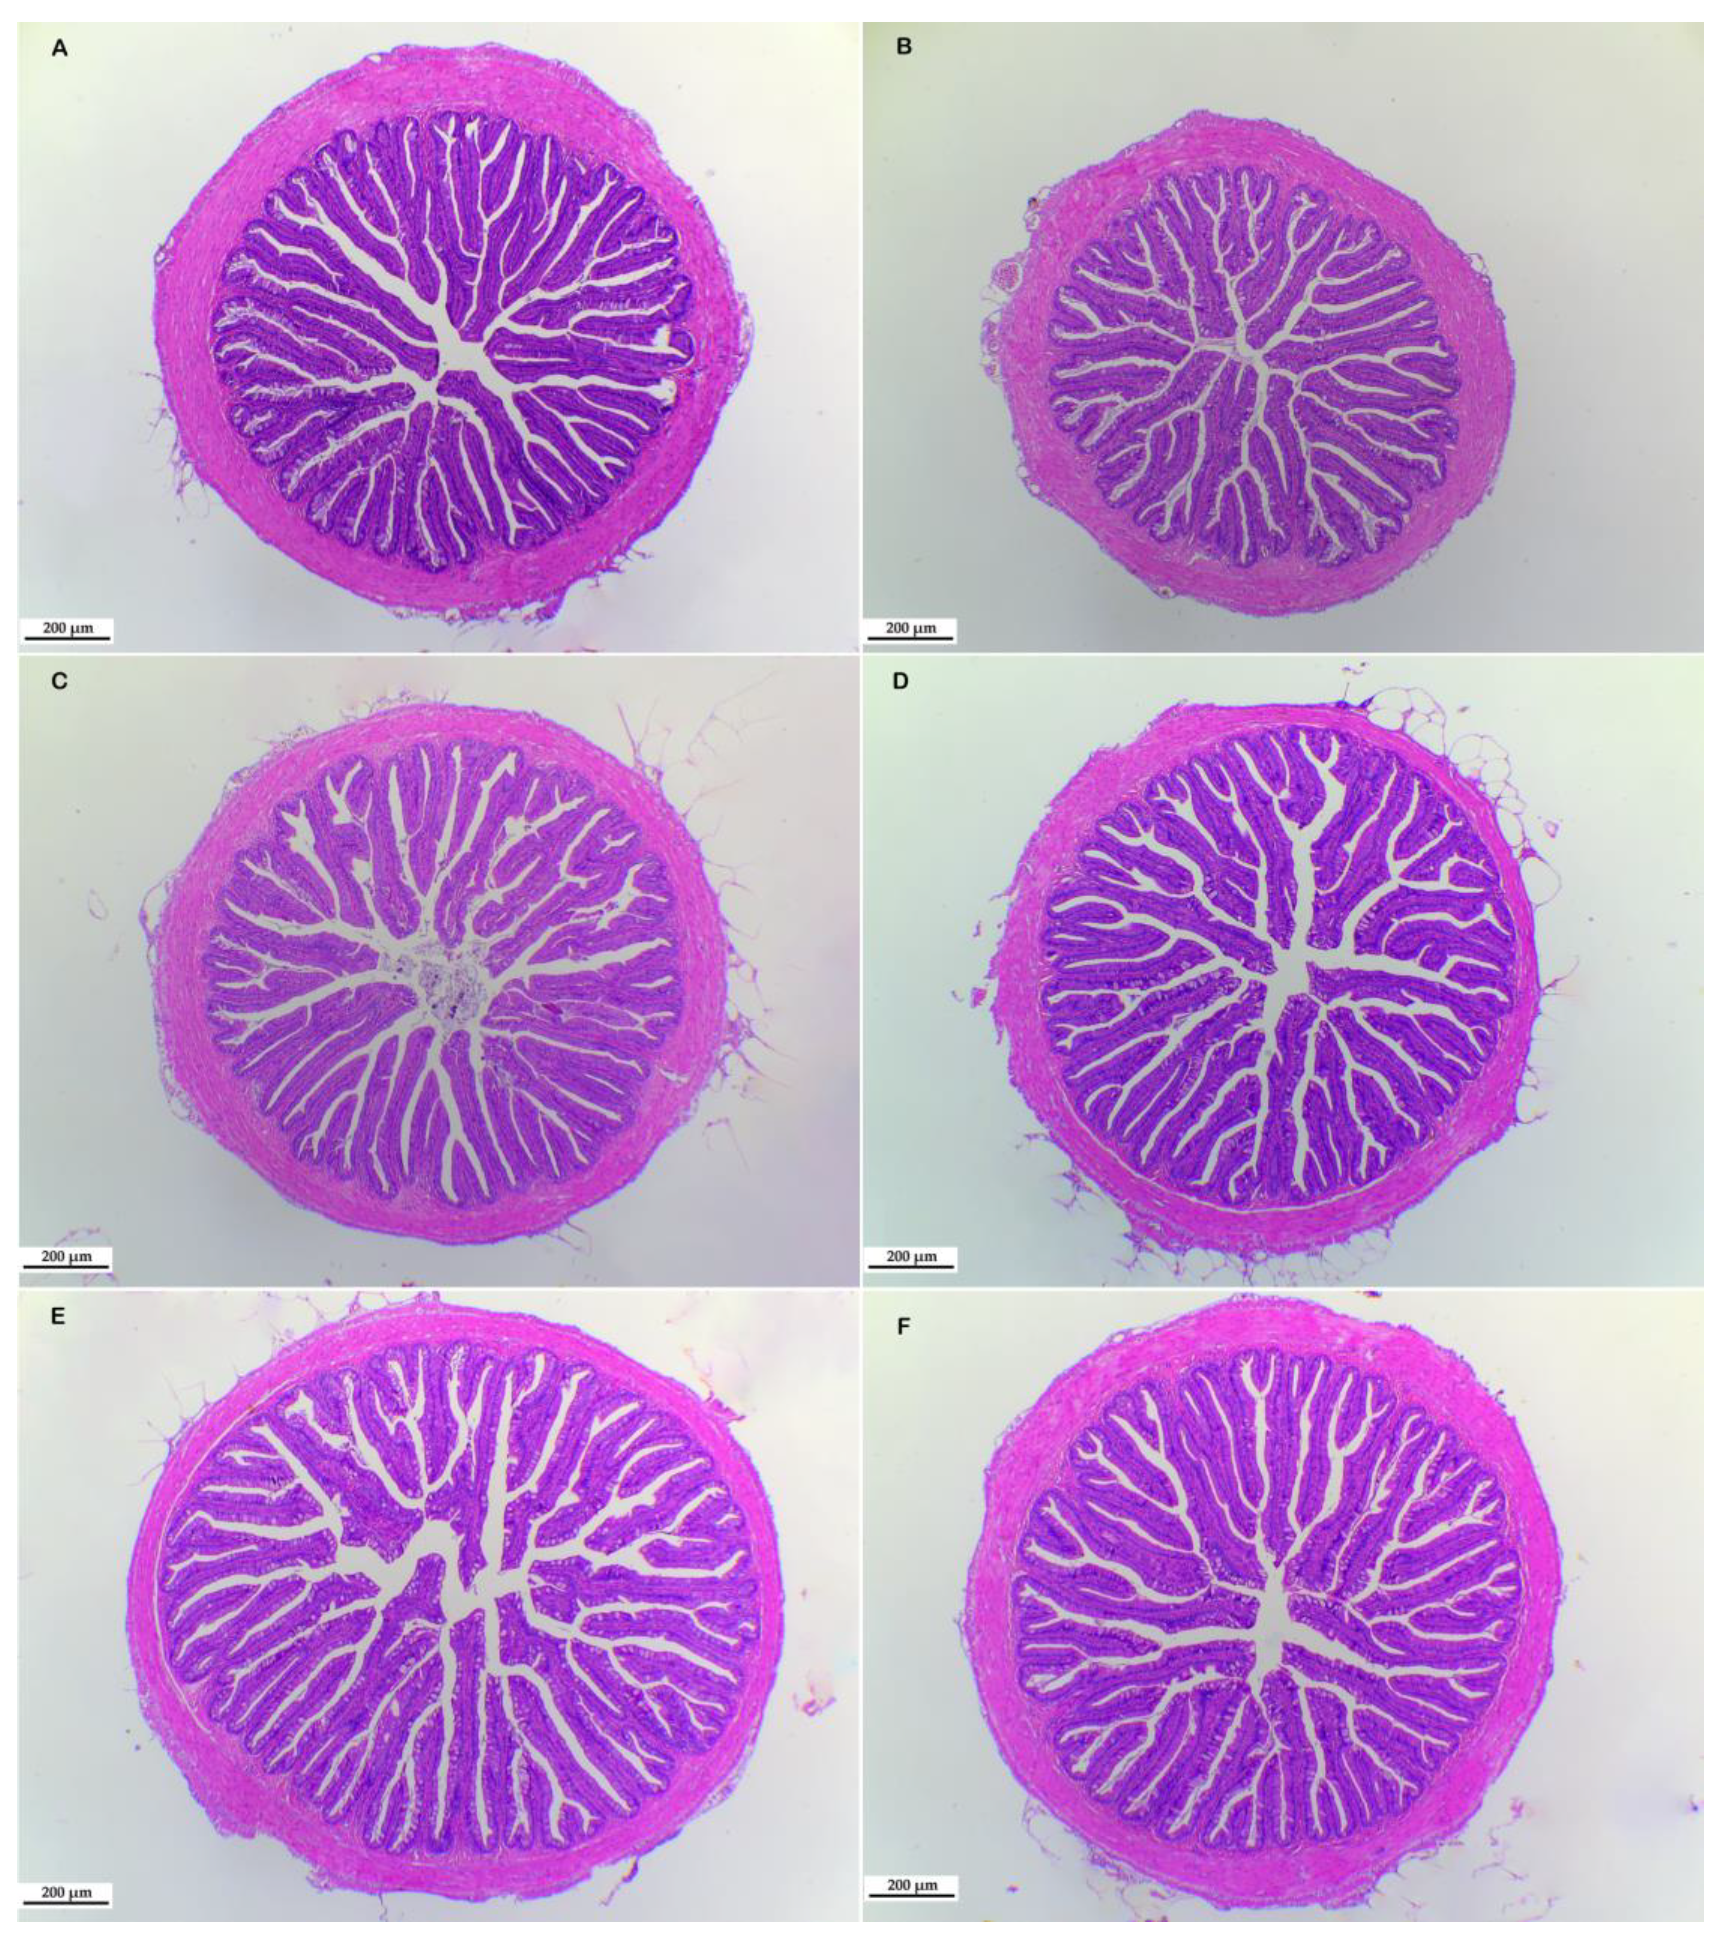
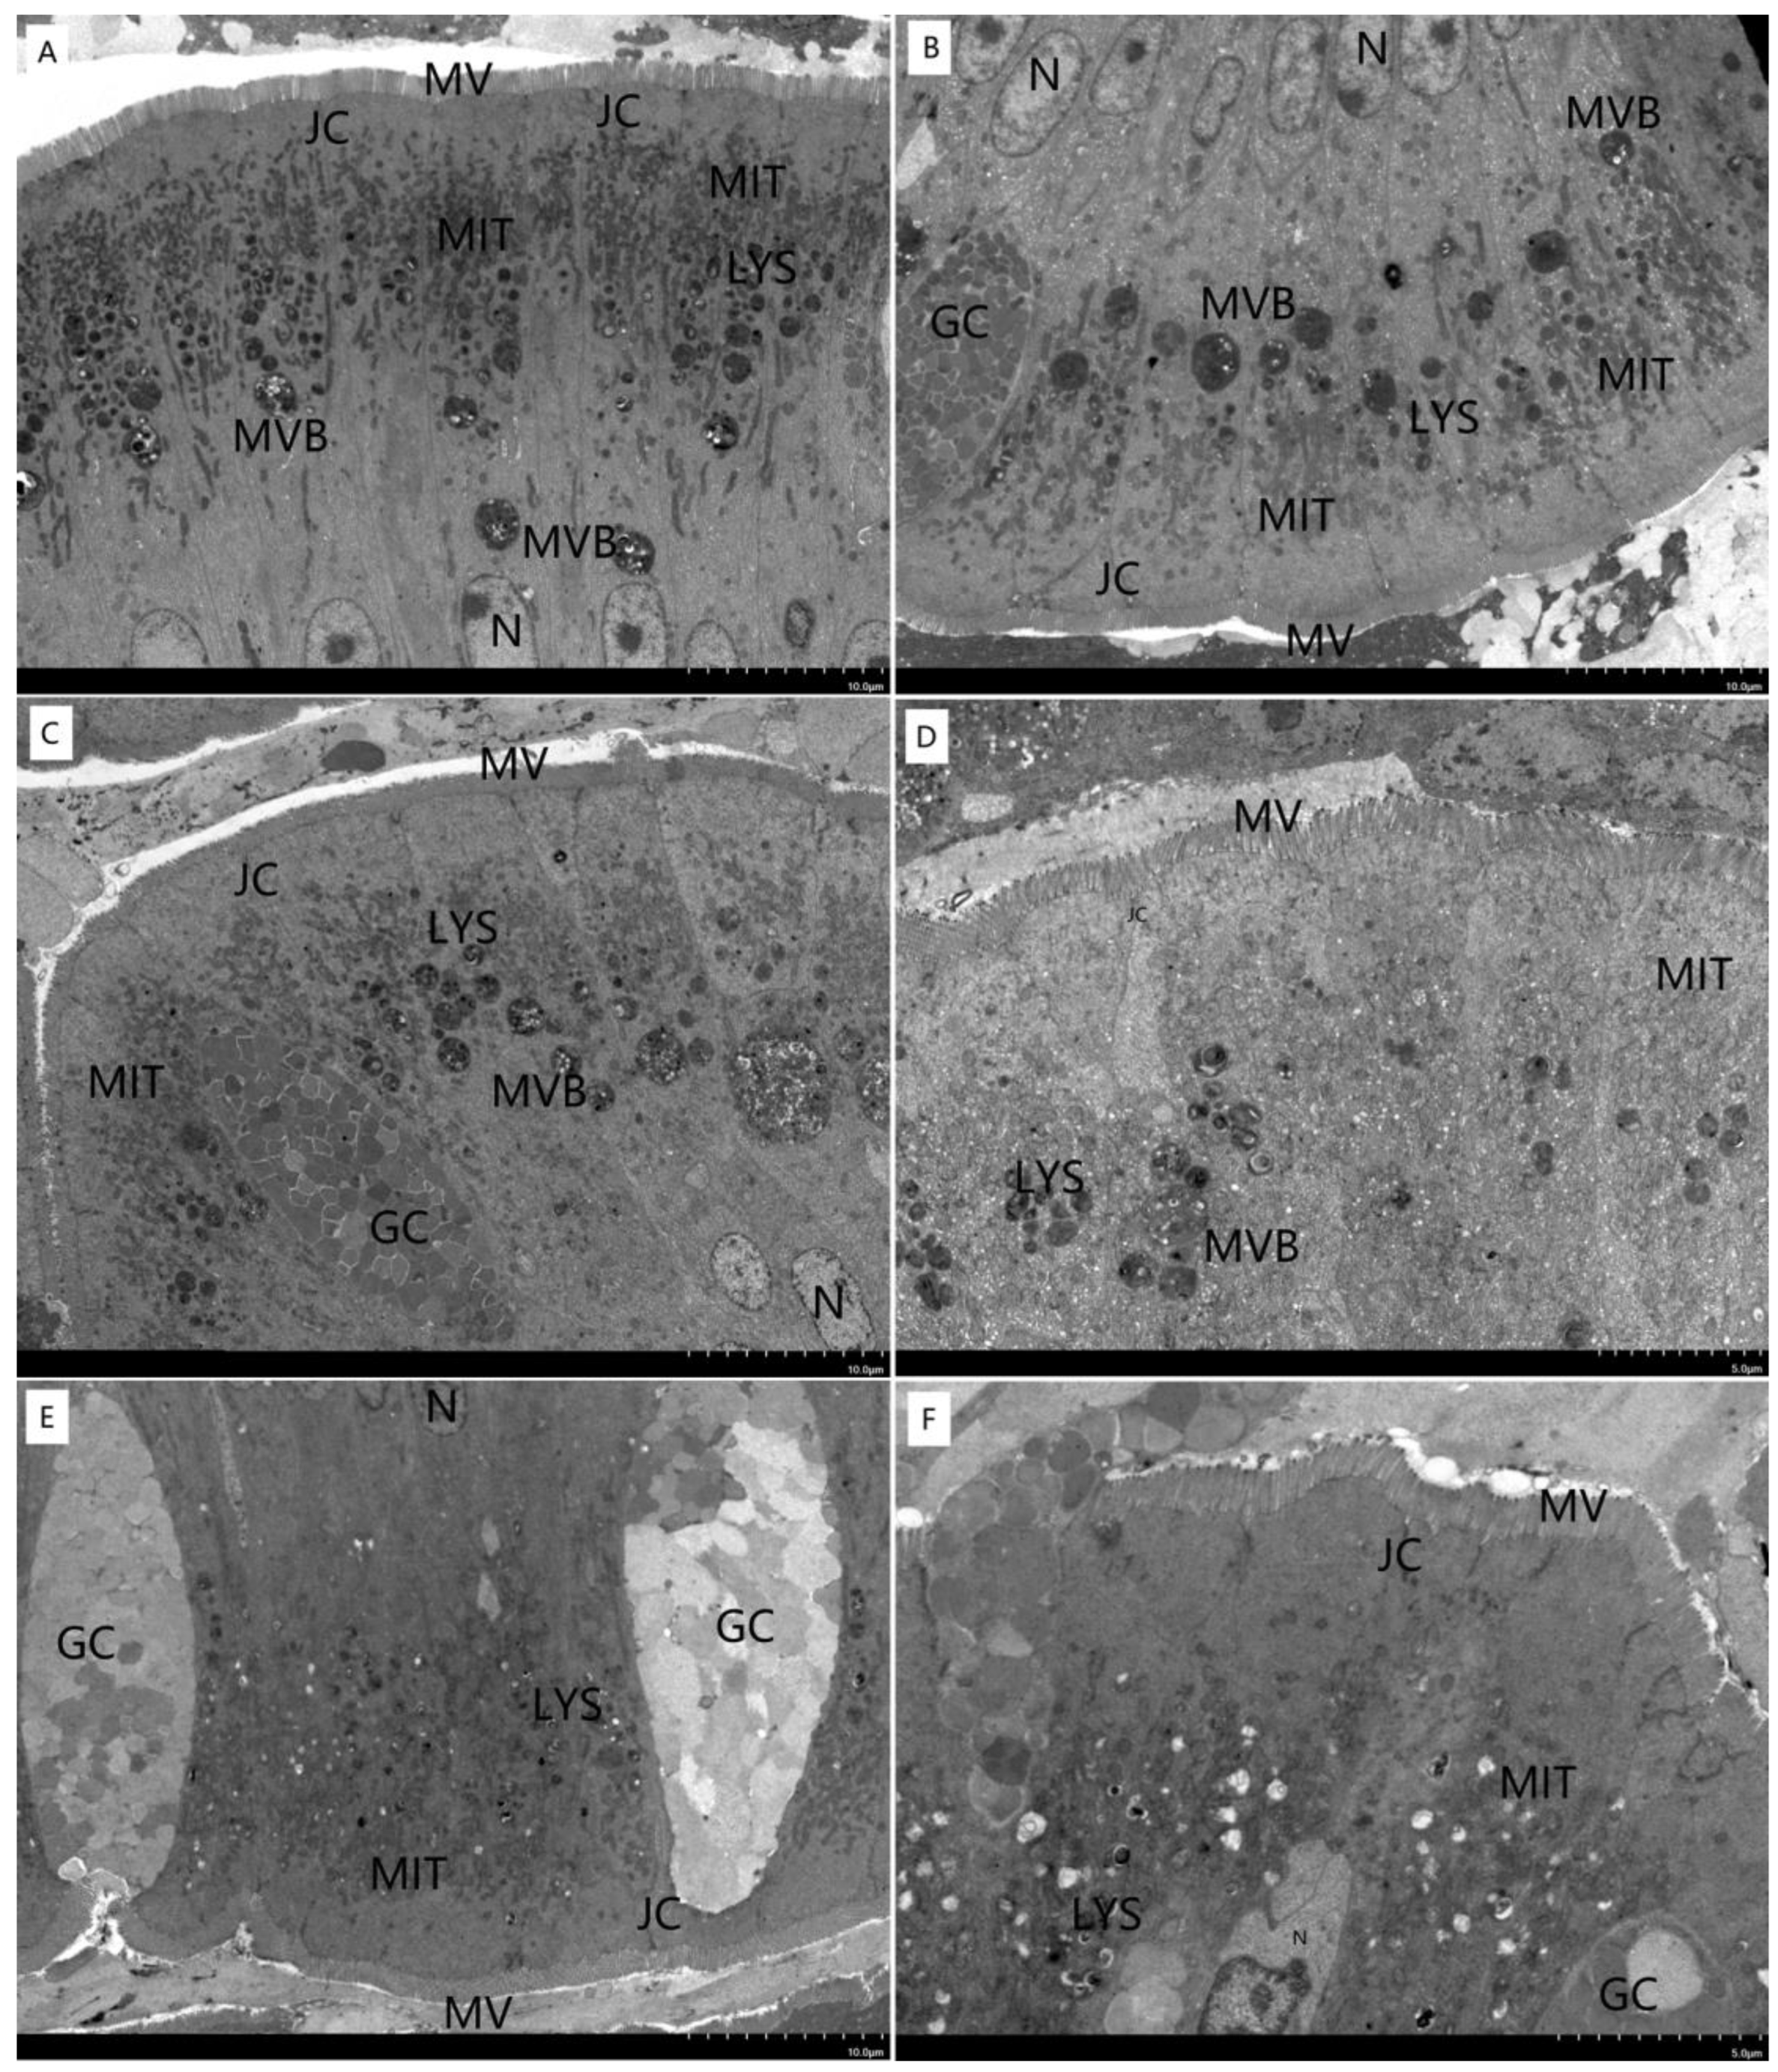
2.4. Morphology of Liver and Intestine

Hematoxylin eosin staining: the liver and intestinal tissue samples of three experimental fish in each group were cut, washed in pre-cooled PBS solution, fixed in 4% paraformaldehyde solution for 24~48 h, dehydrated with gradient alcohol, transparent in xylene, embedded in paraffin, sliced with a microtome (5 µm), stained with hematoxylin and eosin, and sealed with neutral gum. The liver and intestinal tissues were observed and photographed with a microscope. The height, width and thickness of the muscularis of the intestinal were measured with a micrometer.
Ultrastection: the intestinal samples of fish in each replicate were cut into small pieces less than 1 mm3, fixed with 2.5% glutaraldehyde and 1% osmium tetroxide, dehydrated with gradient alcohol, embedded with resin, sliced with an ultrathin microtome, stained with uranyl acetate and lead citrate, observed and photographed with a transmission electron microscope.

2.5. Activities of Digestive Enzymes and Antioxidant Enzymes

The tissues of the liver and intestinal were cut and the blood was washed with pre-cooled normal saline, the surface water was absorbed with filter paper, weighed, cut with scissors, and transferred into the homogenizing tube. Nine times the volume of normal saline was added to the tube for homogenization and then centrifuged at 2000 rpm for 15 min, and the supernatant was collected for standby.
The activities of amylase (AMS), lipase (LPS) and trypsin (TRY) were measured by enzyme labeling instrument, and the detection was carried out through the assay kit with strict instructions (Nanjing Jiancheng Bioengineering Institute, Wuhan, China).
Total antioxidant capacity (T-AOC), the activities of peroxidase (CAT) and superoxide dismutase (SOD), and the amounts of malondialdehyde (MDA) of liver and intestinal homogenates were measured in strict accordance with the operating instructions of the kit (Nanjing Jiancheng Bioengineering Institute, Wuhan, China).

2.6. Intestinal Microbiota Analysis

Gut contents were collected from 5 fish in each cage, these samples were sent for sequencing (OmicShare Co., Ltd., Guangzhou, China). According to the commercial DNA kit instructions, the total DNA of bacterial communities was extracted from the gut contents of experimental fish using the TIANamp Stool DNA Kit (Omega Biotek, Norcross, GA, USA). After DNA extraction, DNA concentration was measured using a NanoDrop 8000 spectrophotometer and integrity was detected by electrophoresis of a 1% agarose gel. Then, a pair of universal primes F341 (5-CCTAYGGRBGCASCAG-3) and R806 (5-GGACTACNNGGGTATCTAAT-3), designed based on the V3 + V4 region of 16s rDNA, were used for DNA amplification of gut bacteria. Qualification and sequencing of amplicons using illumine Hiseq2500, then raw sequences were analyzed according to Dong [25].

2.7. Statistical Analysis

The experimental data were statistically analyzed using Excel 2016 and SPSS 26.0 software. All data results were expressed as “mean ± SD”. The normality assumption of the data was tested using Kolmogorov–Smirnov test. One-way analysis of variance (ANOVA) was performed on the test data. Duncan’s method was used for multiple comparisons to test the difference between groups. p < 0.05 meant a significant difference.

3. Results

3.1. Growth Properties

The SR, WGR, FCR, VSI and HSI of largemouth bass are shown in Table 2. There were no significant differences in WGR and SGR between any of the groups (p > 0.05). Fish in Group LEF2 had the highest WGR and SGR. Nonetheless, the FCR of the five treatments was lower than that of the control group, even though there was no statistically significant difference between the groups (p > 0.05). In addition, the VSI, HSI, and SR of the six treatments were not significantly different from each other (p > 0.05).

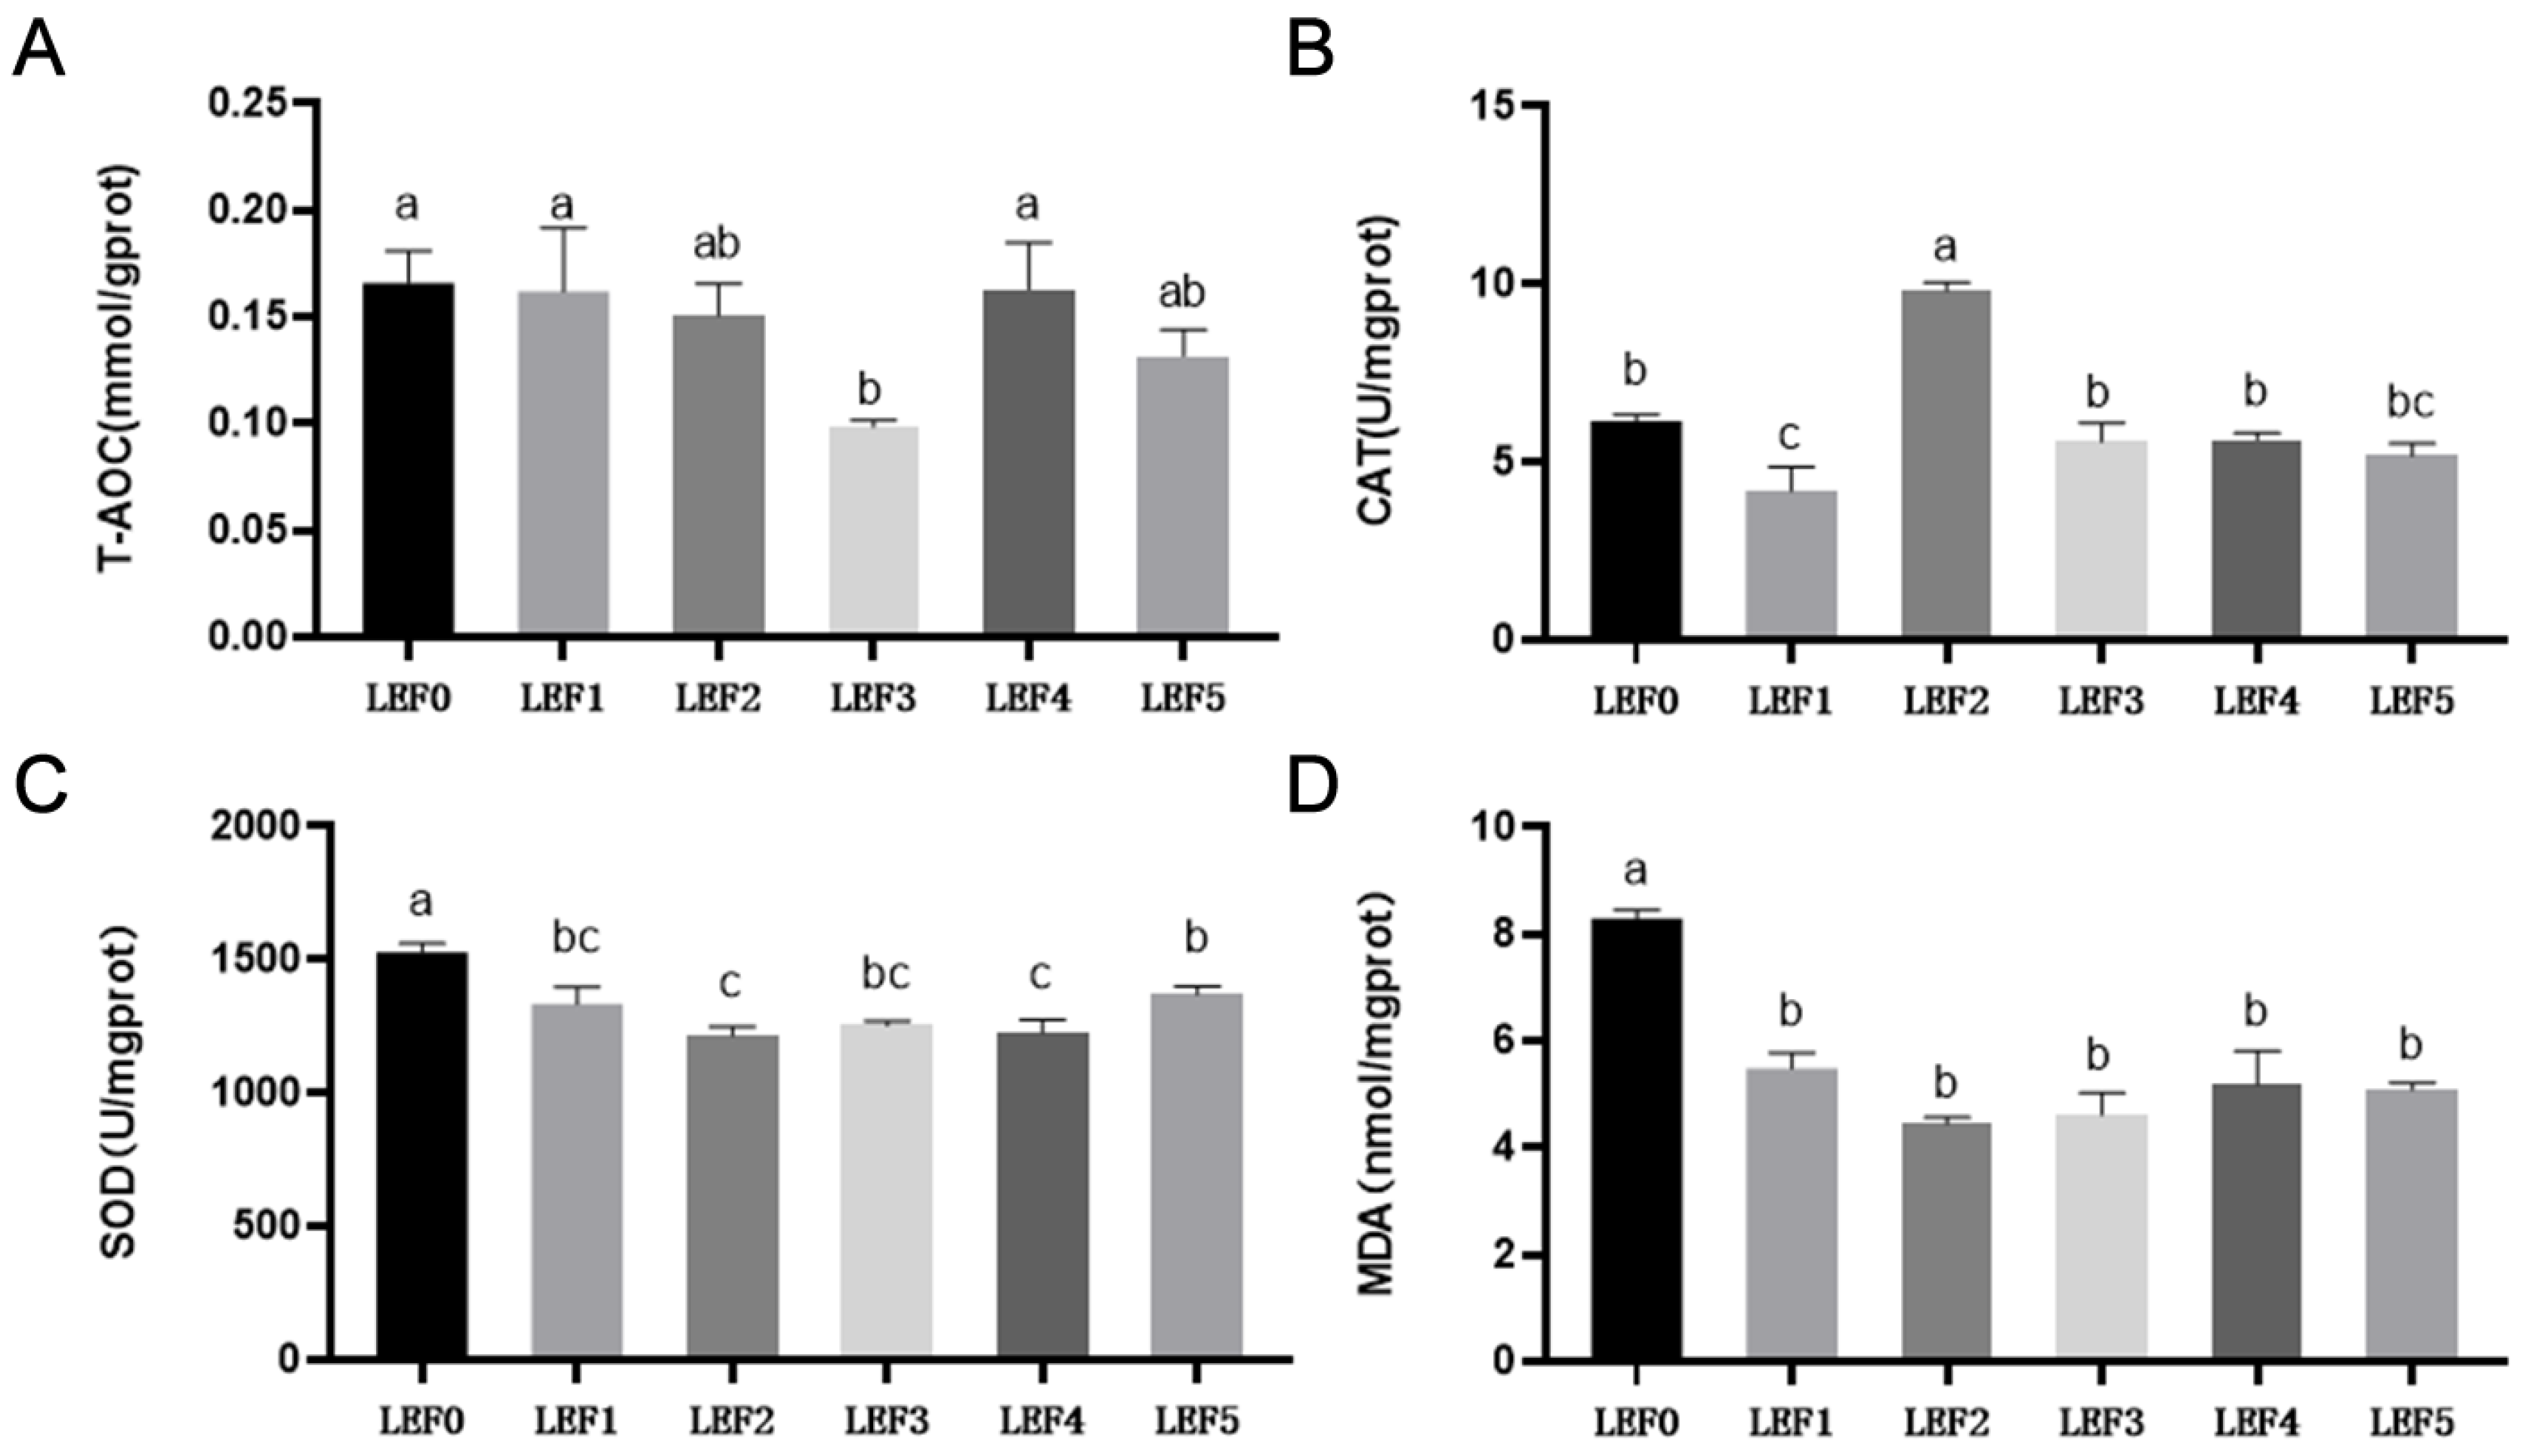
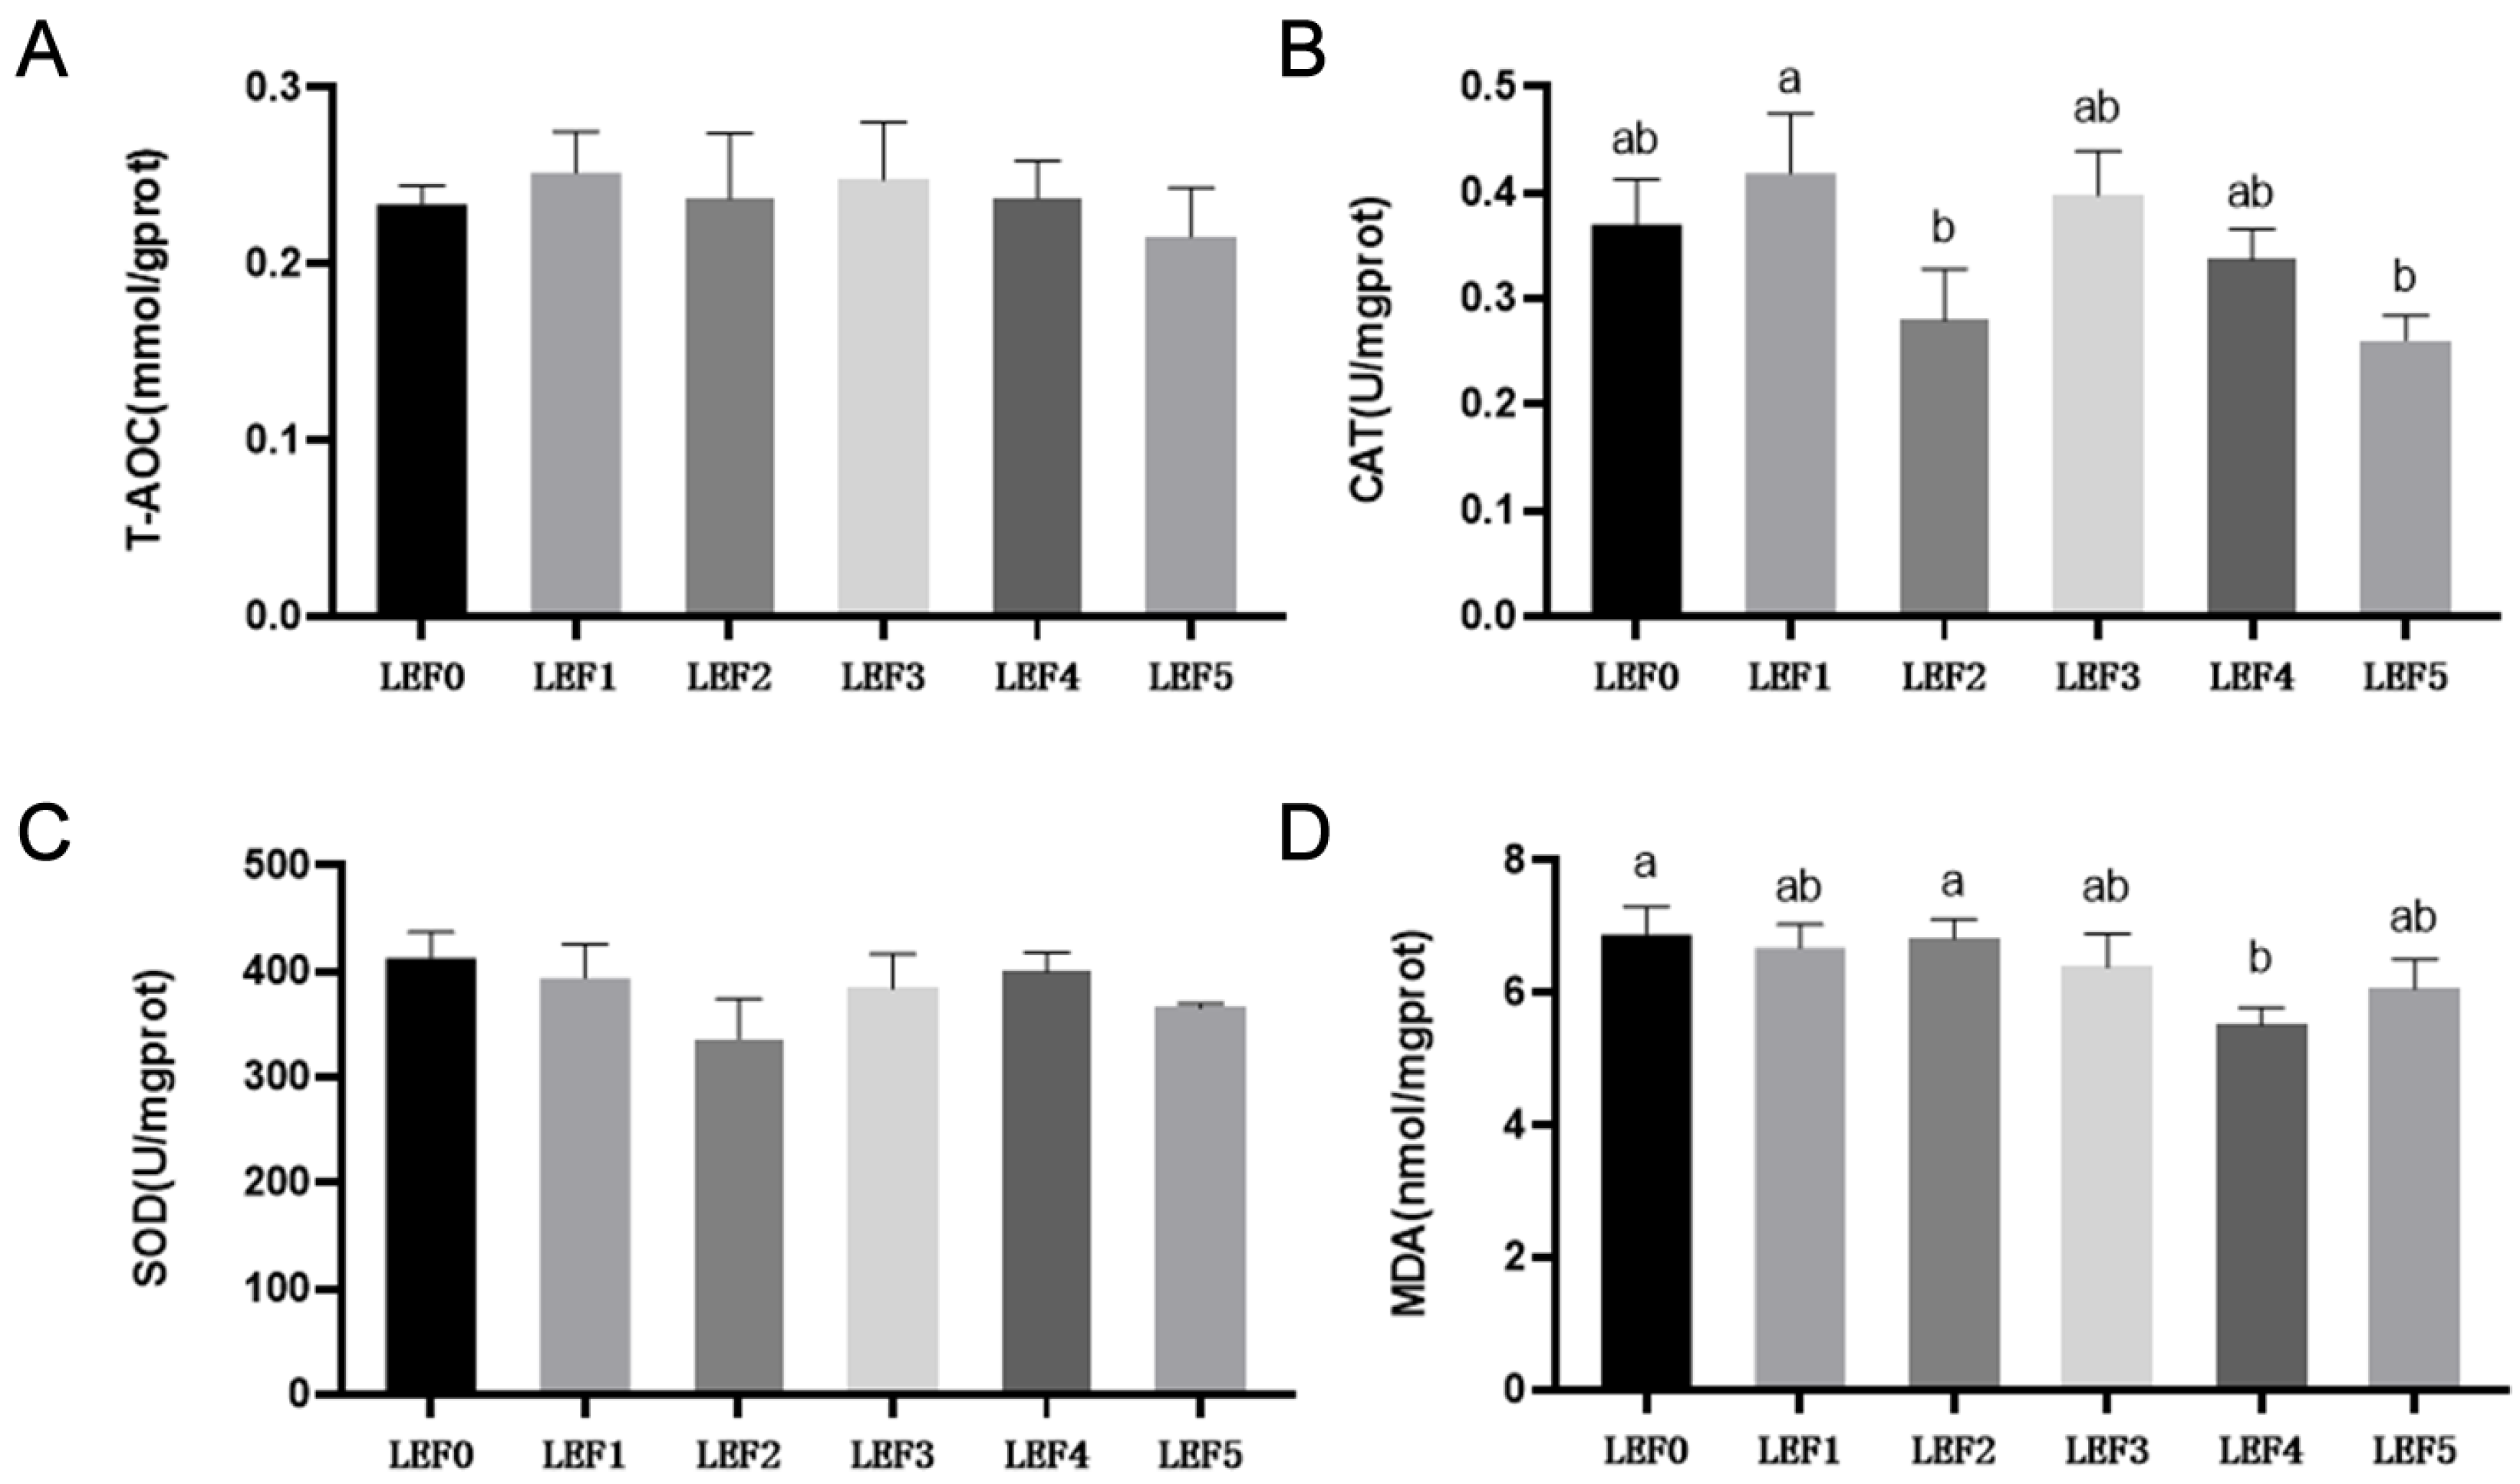
3.2. Antioxidant Capacity

As shown in Figure 1, largemouth bass had the lowest liver T-AOC in the LEF3 group, with no discernible difference in liver T-AOC amongst the other groups (p > 0.05). The fish of LEF2 treatment had considerably higher liver CAT activity compared with others (p < 0.05). The MDA levels of the LEF0 treatment were significantly higher than other treatments (p < 0.05).
As is shown in Figure 2, no significant difference in intestinal T-AOC and SOD activity between all diets was found (p > 0.05). Compared with the LEF1 treatment, the activity of CAT was notably higher in the fish of the LEF2 and LEF5 groups (p < 0.05). However, gut MDA levels did not differ significantly across groups (p > 0.05).

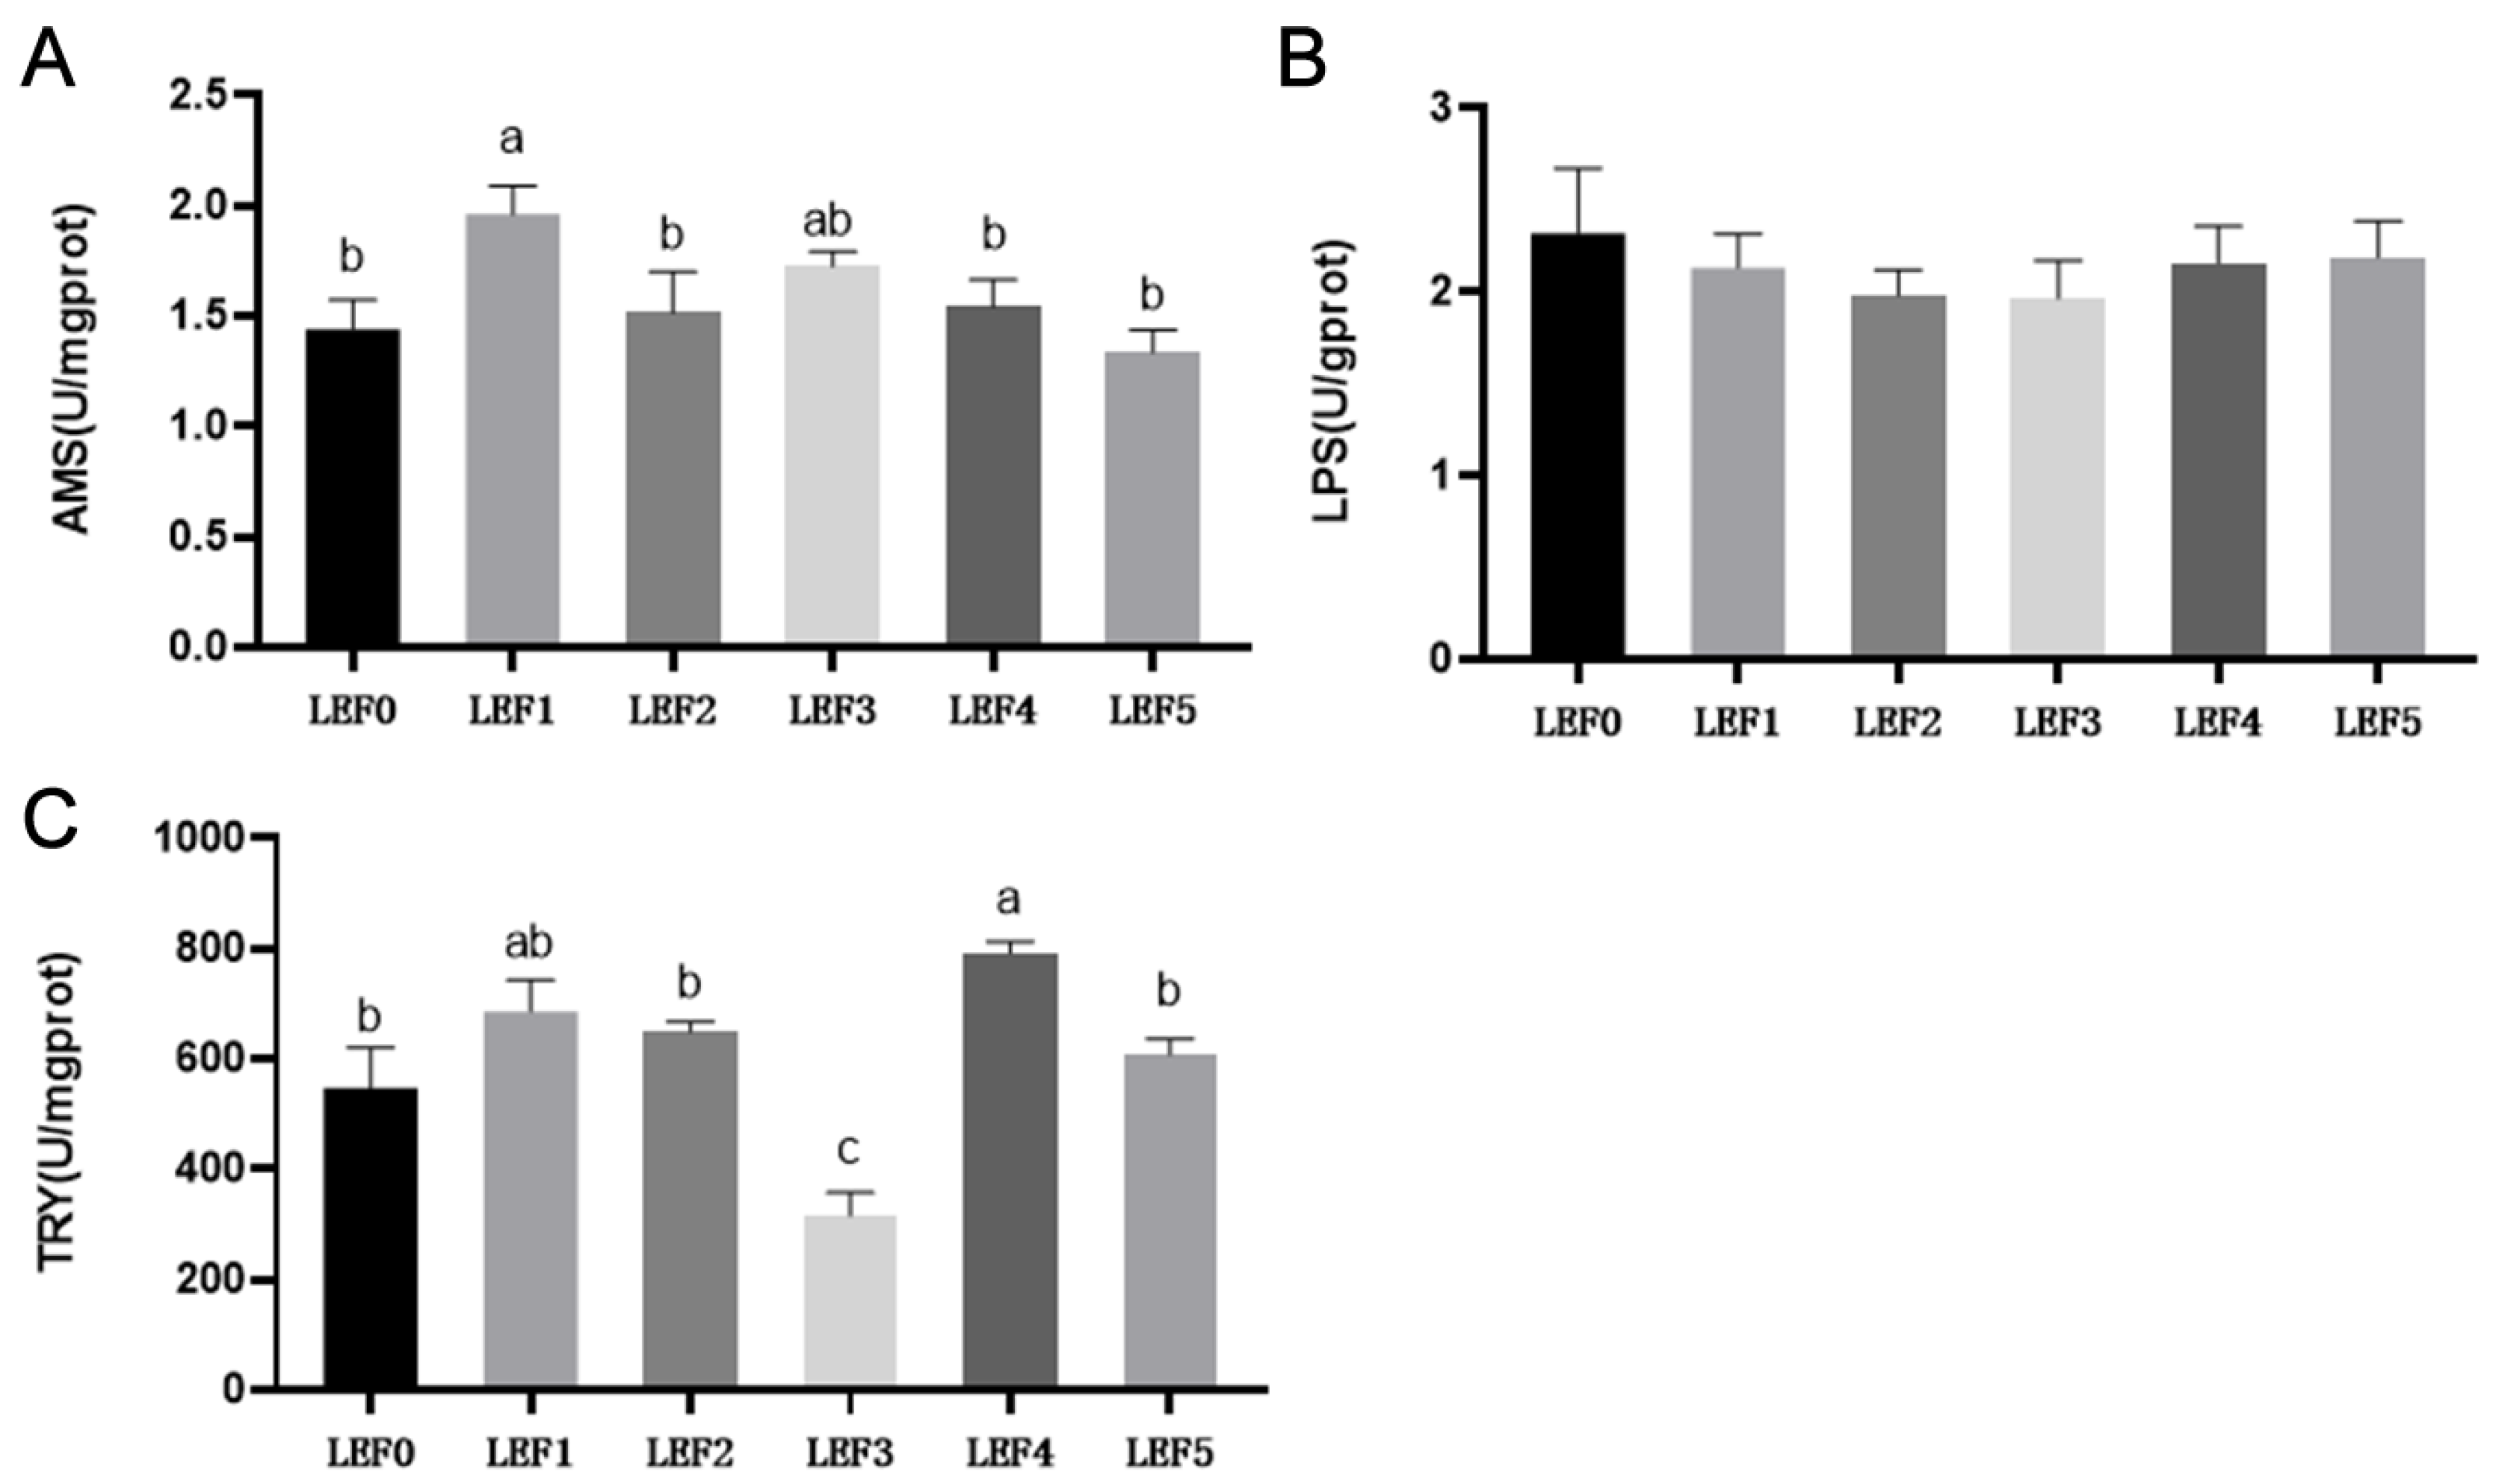
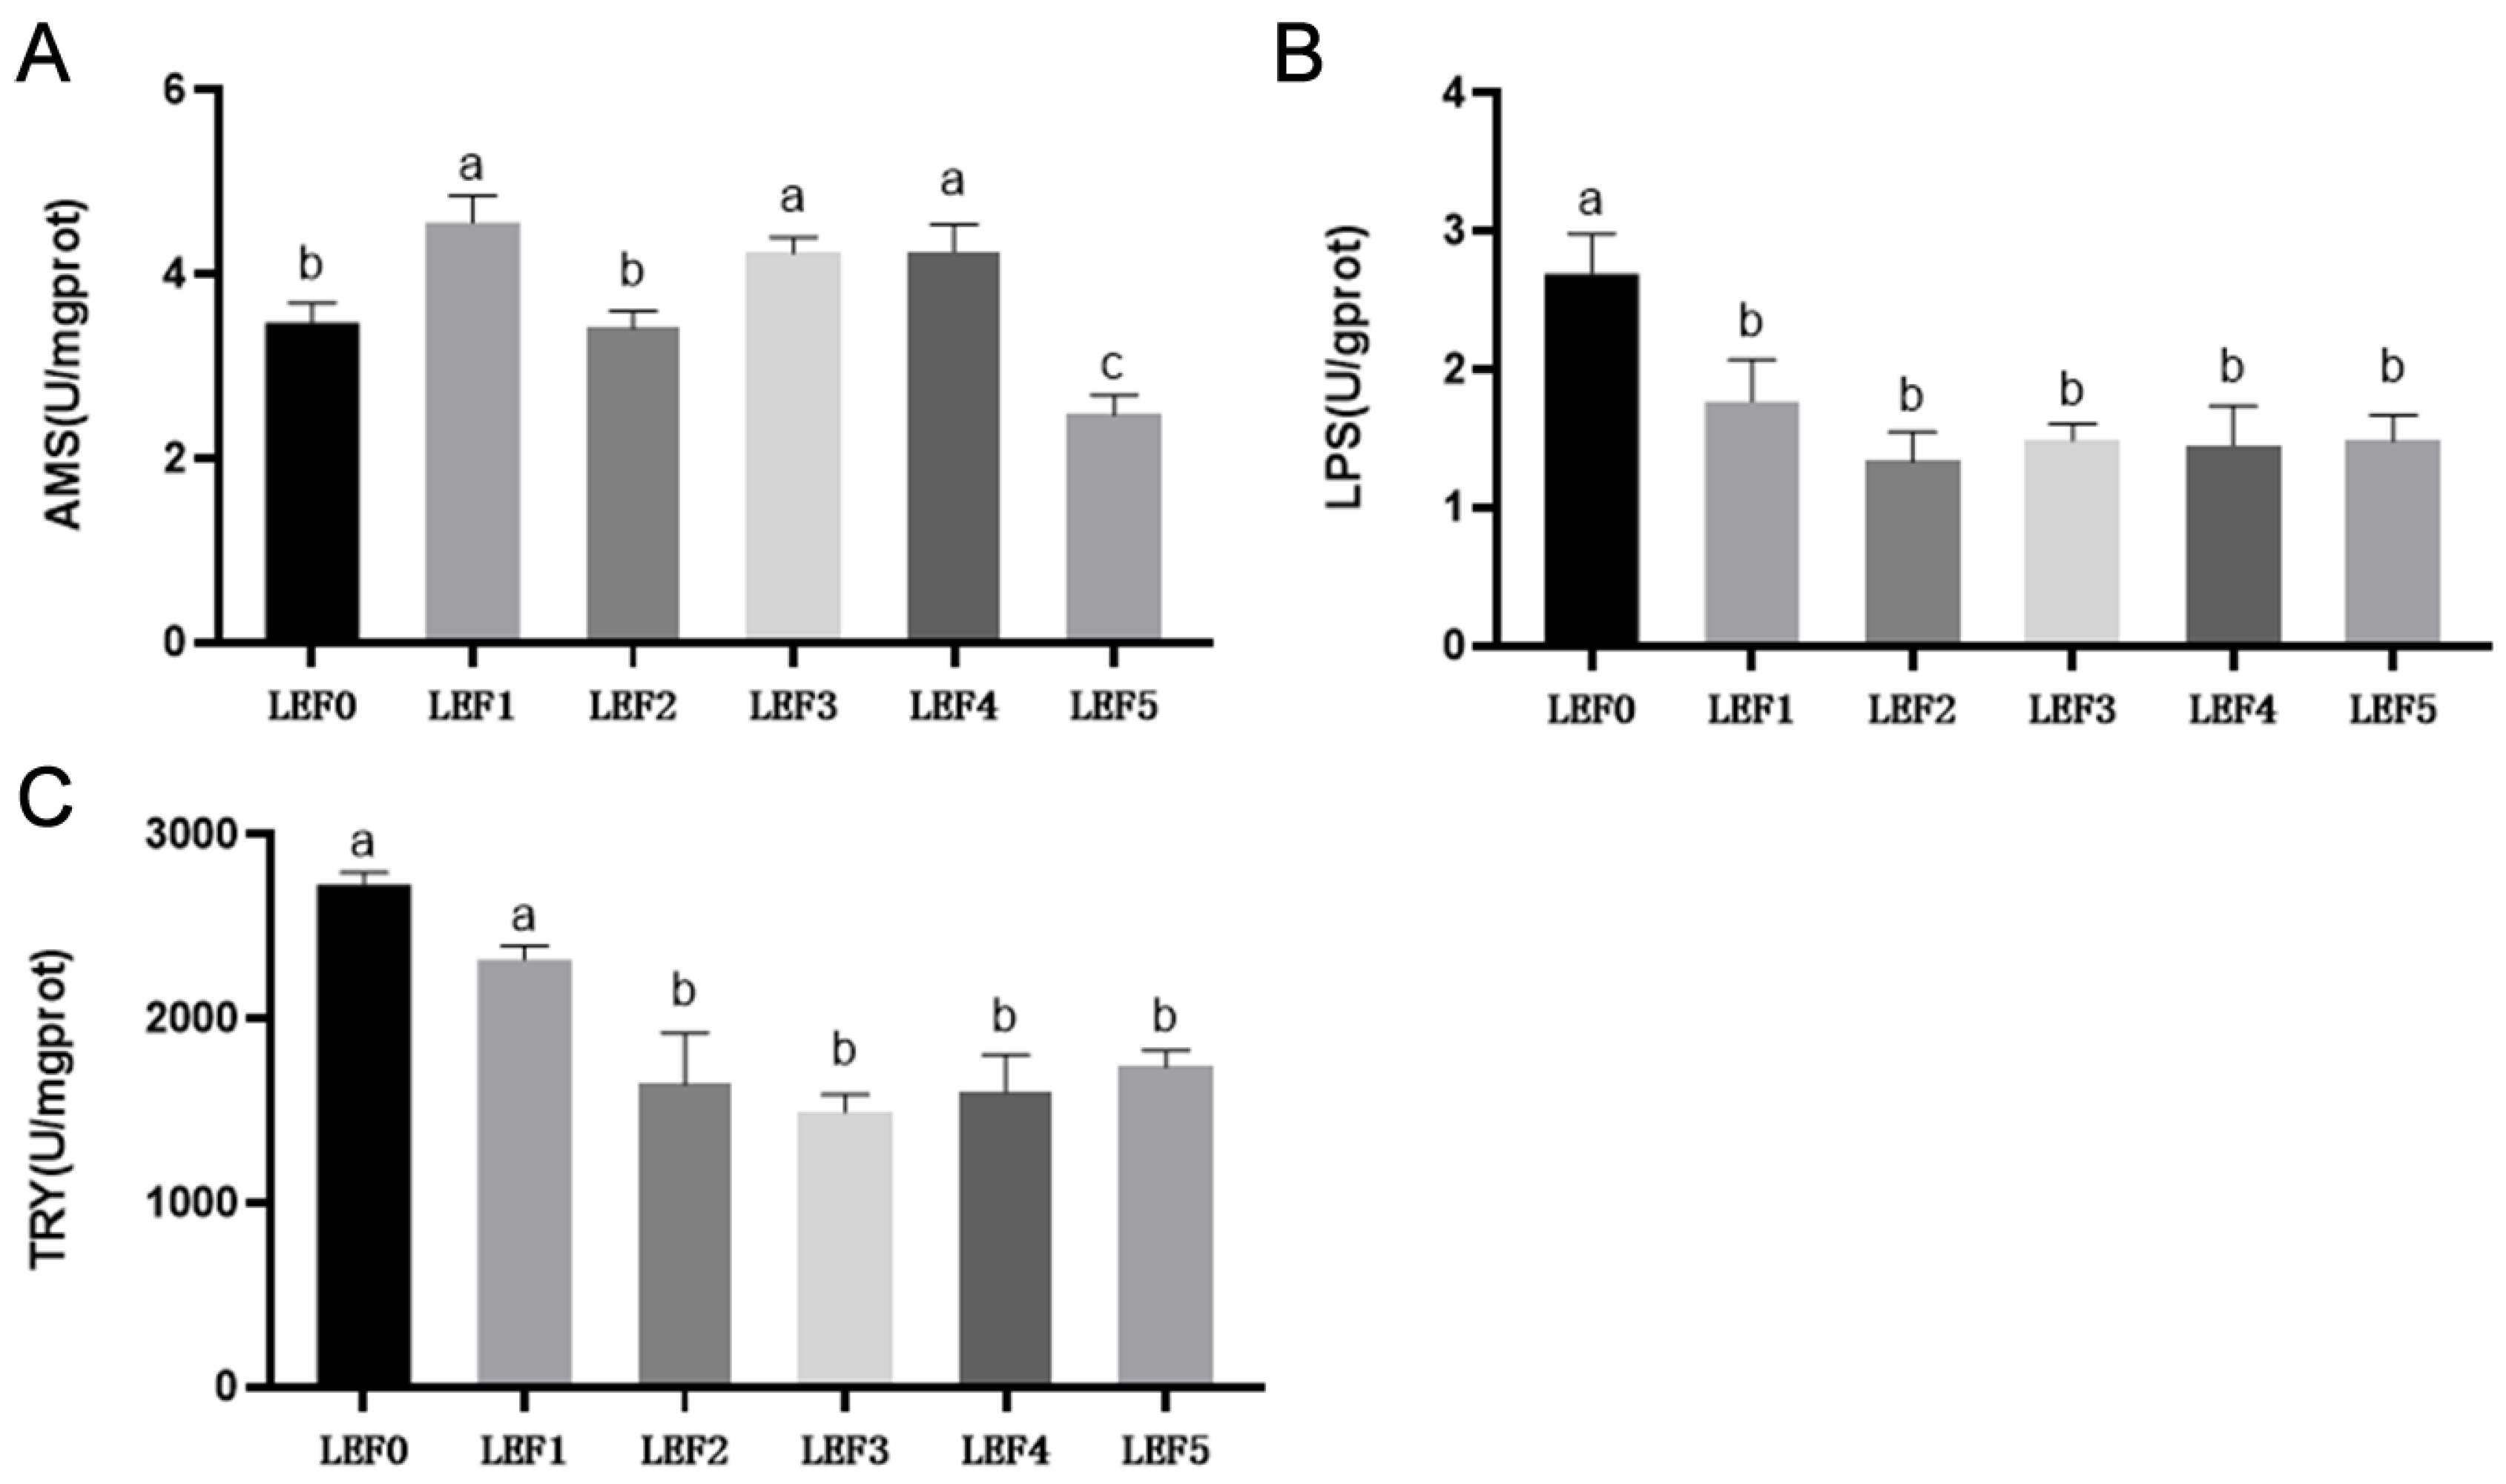
3.3. Digestive Enzyme Activity

The liver AMS activity of the LEF1 group was considerably higher with the exception of the LEF3 group (p < 0.05). No discernible effect was found in the LPS activity of the liver among all treatments (p > 0.05). The LEF4 group had the highest trypsin activity, but there was no statistically significant difference in TRY activity between groups LEF0, LEF1, LEF2, LEF4 and LEF5 (p > 0.05, Figure 3).
The intestinal AMS activity of groups LEF1, LEF3 and LEF4 increased significantly (p > 0.05). The intestinal LPS activity of group LEF0 was significantly higher than that of the other groups (p < 0.05); the activity of TRY in the intestine of largemouth bass in groups LEF0 and LEF1 had no statistically significant difference, but it was significantly higher than that of the other groups (p < 0.05, Figure 4).

3.4. Morphological Structure of Liver and Intestine

The effects of LEF on the liver and intestinal morphology of largemouth bass were analyzed by H&E staining. The liver morphology is shown in Figure 5. In LEF0 treatment, widened hepatic sinus space, and leukocyte infiltration was observed, while in the LEF1, LEF2 and LEF3 groups, the situation improved. In the LEF5 group, however, leukocyte infiltration reoccurred.
Figure 6 depicts the morphological structure of the intestine. No significant pathological changes were observed in the midgut tissue in any of the dietary treatments, and no significant pathological changes were observed in the midgut group. The ultrastructure of the intestine is shown in Figure 7. There were microvilli closely arranged on the top of absorption cells in each group. There were abundant mitochondria and tubular systems near the top of the cells. The structure of mitochondria was normal, the ultrastructure of cells was normal, and the boundary was clear. It can be seen from Table 3 that there was no significant difference in the statistical results of the number of villi in each group (p > 0.05). Compared with the LEF5 group, the muscularis of fish in the LEF0, LEF1 and LEF3 groups decreased significantly (p < 0.05). In addition, the number of goblet cells and the height of the villus in the intestine of largemouth bass in the LEF5 group were also higher than those in other groups.

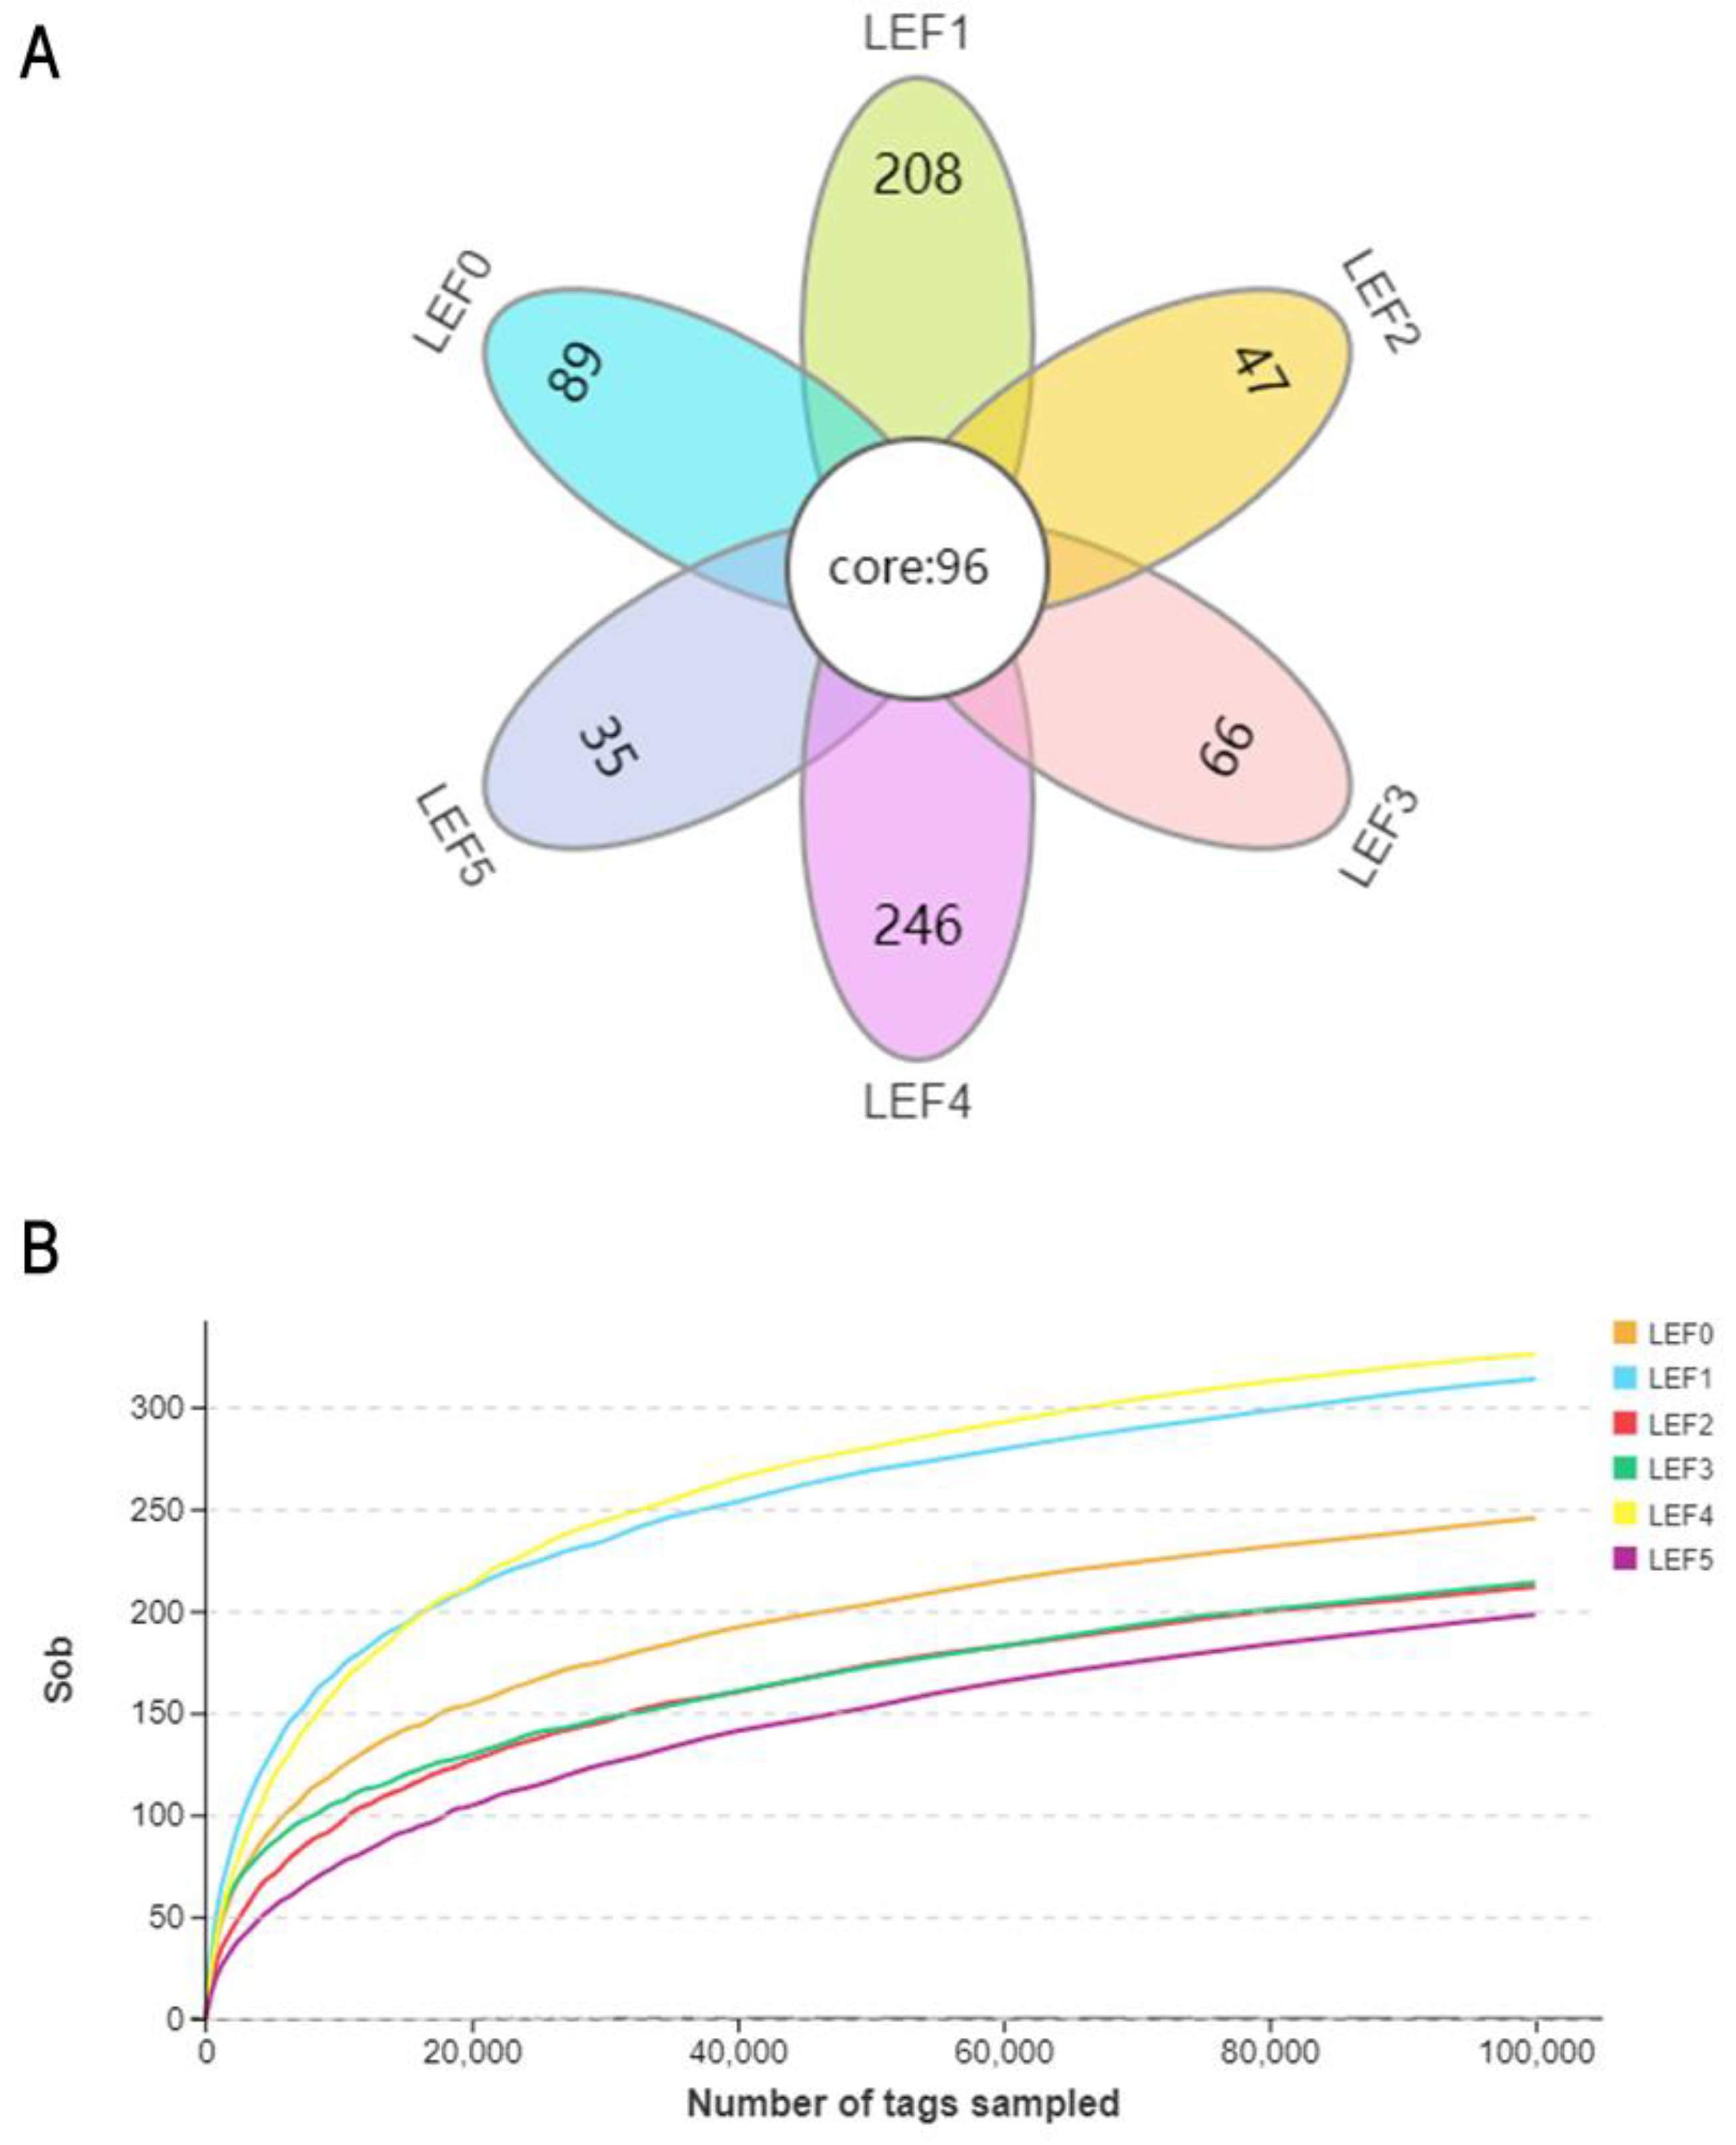
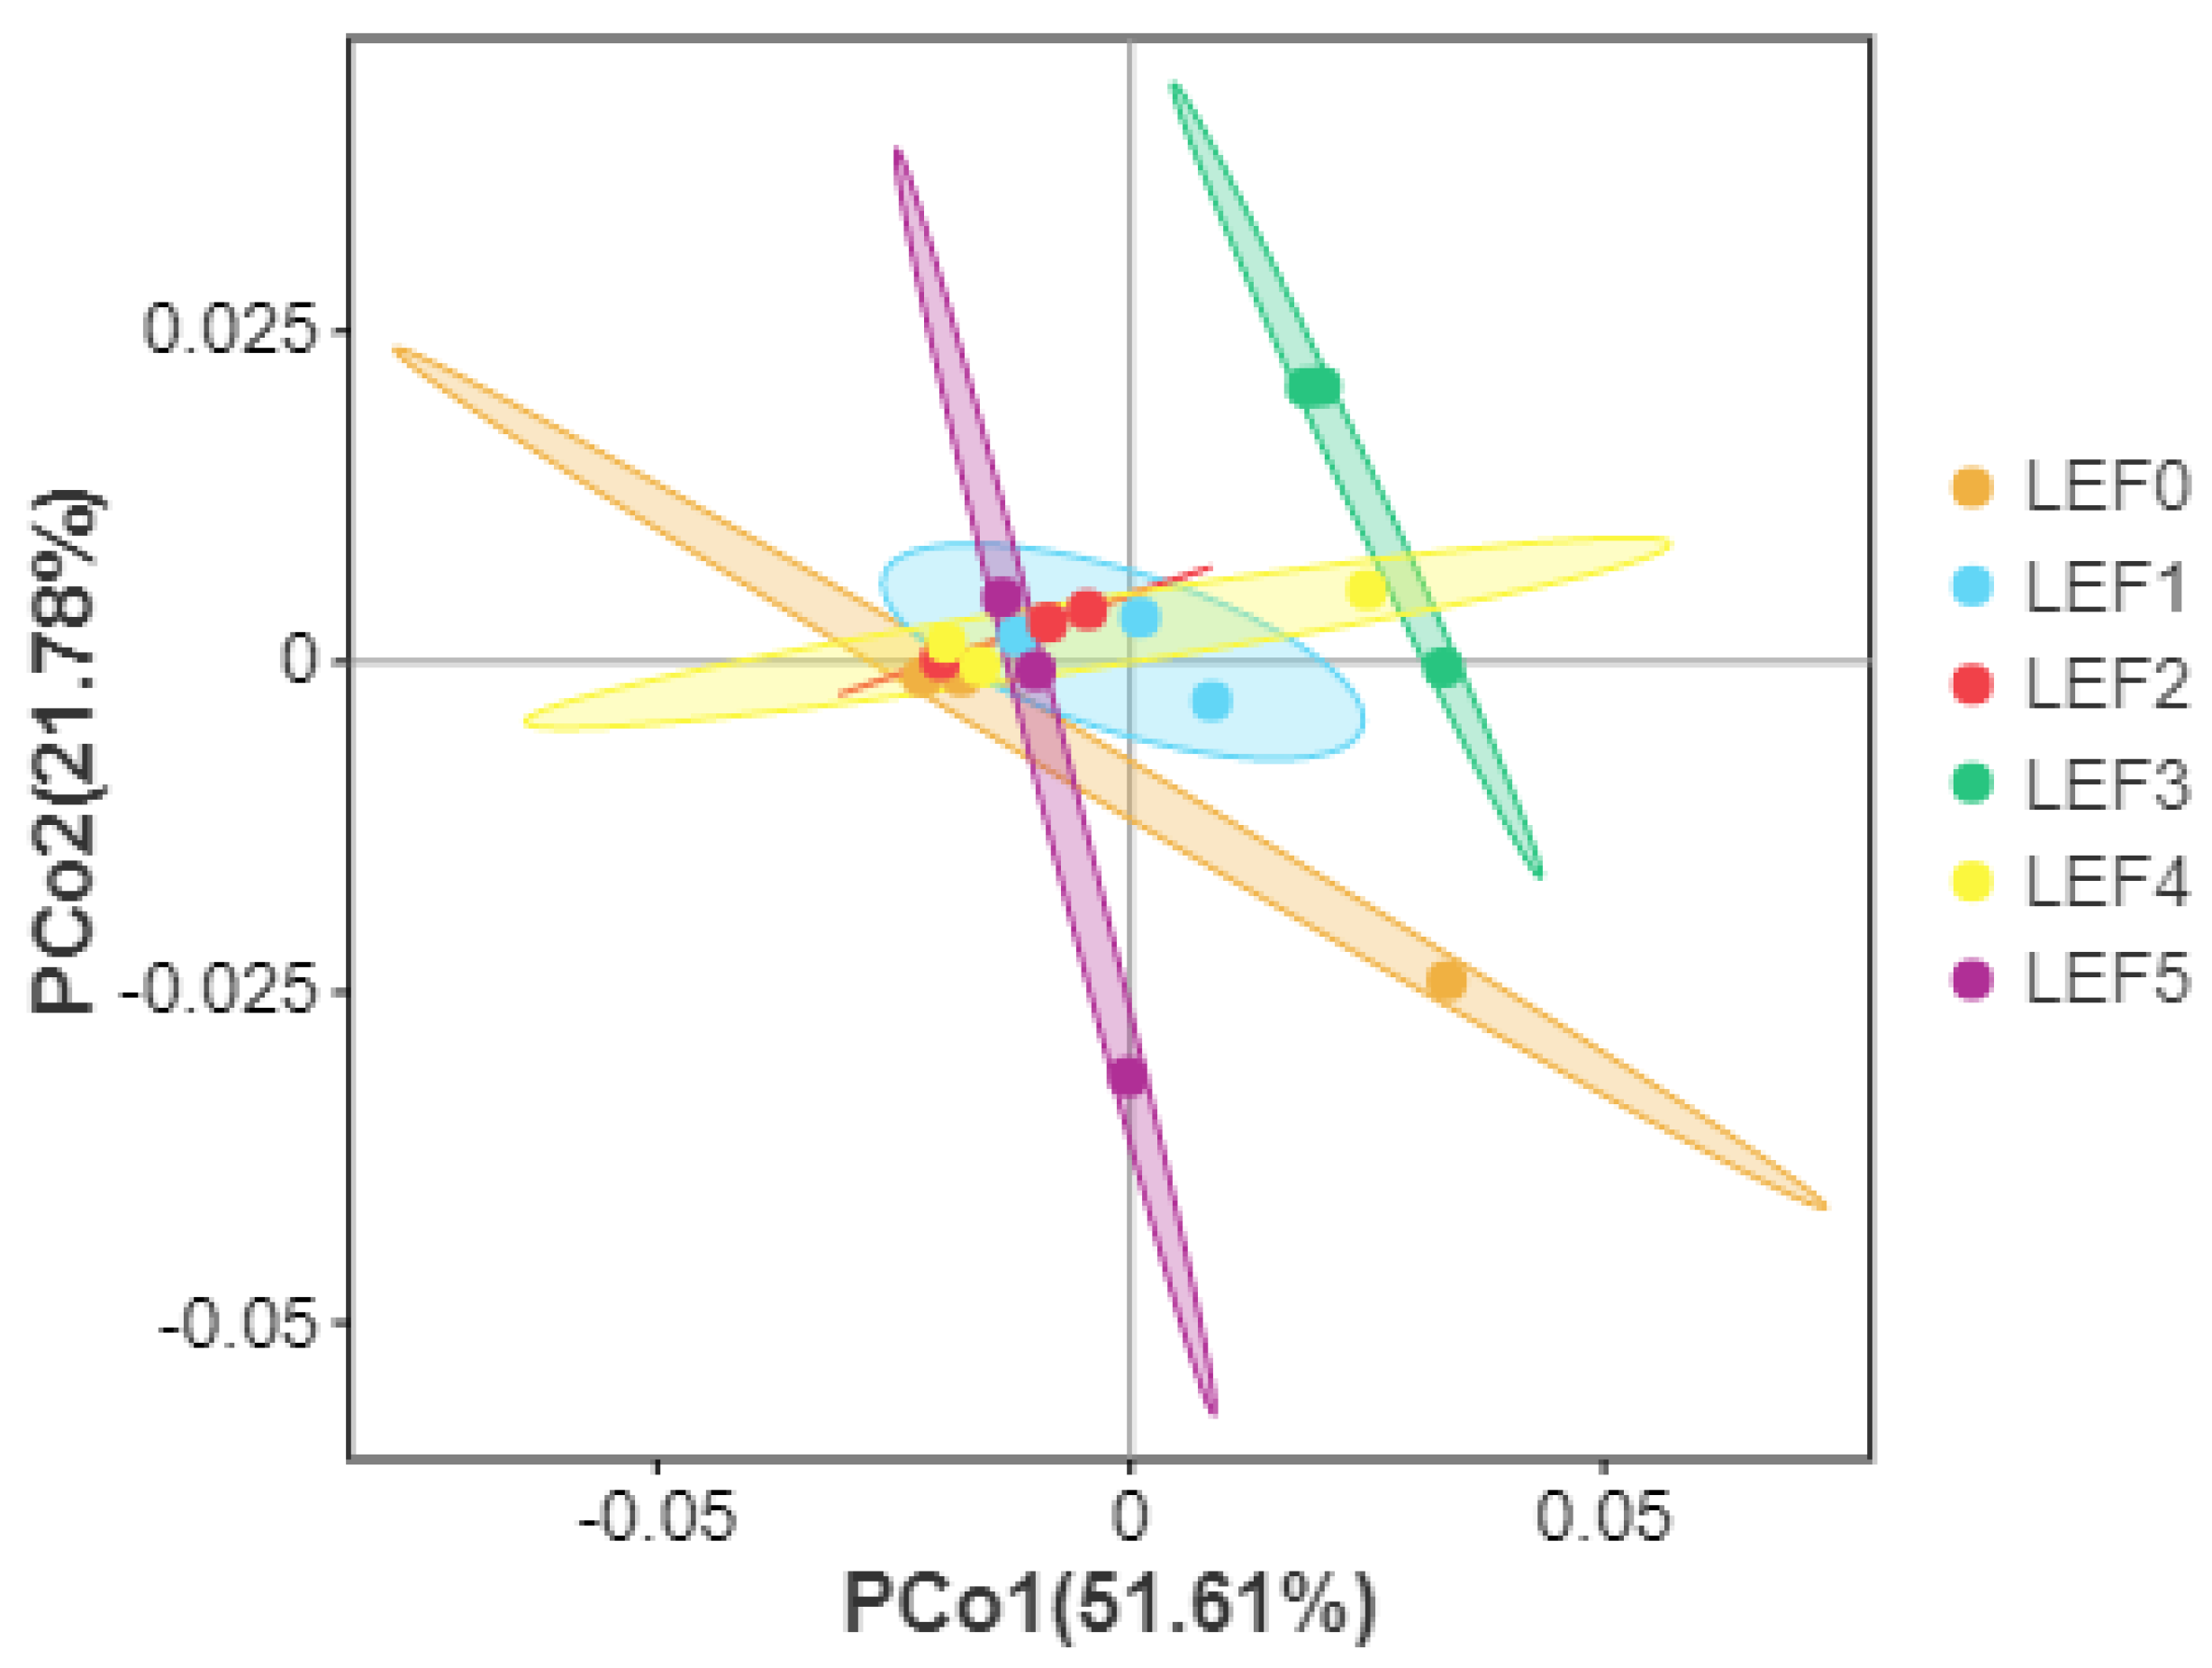
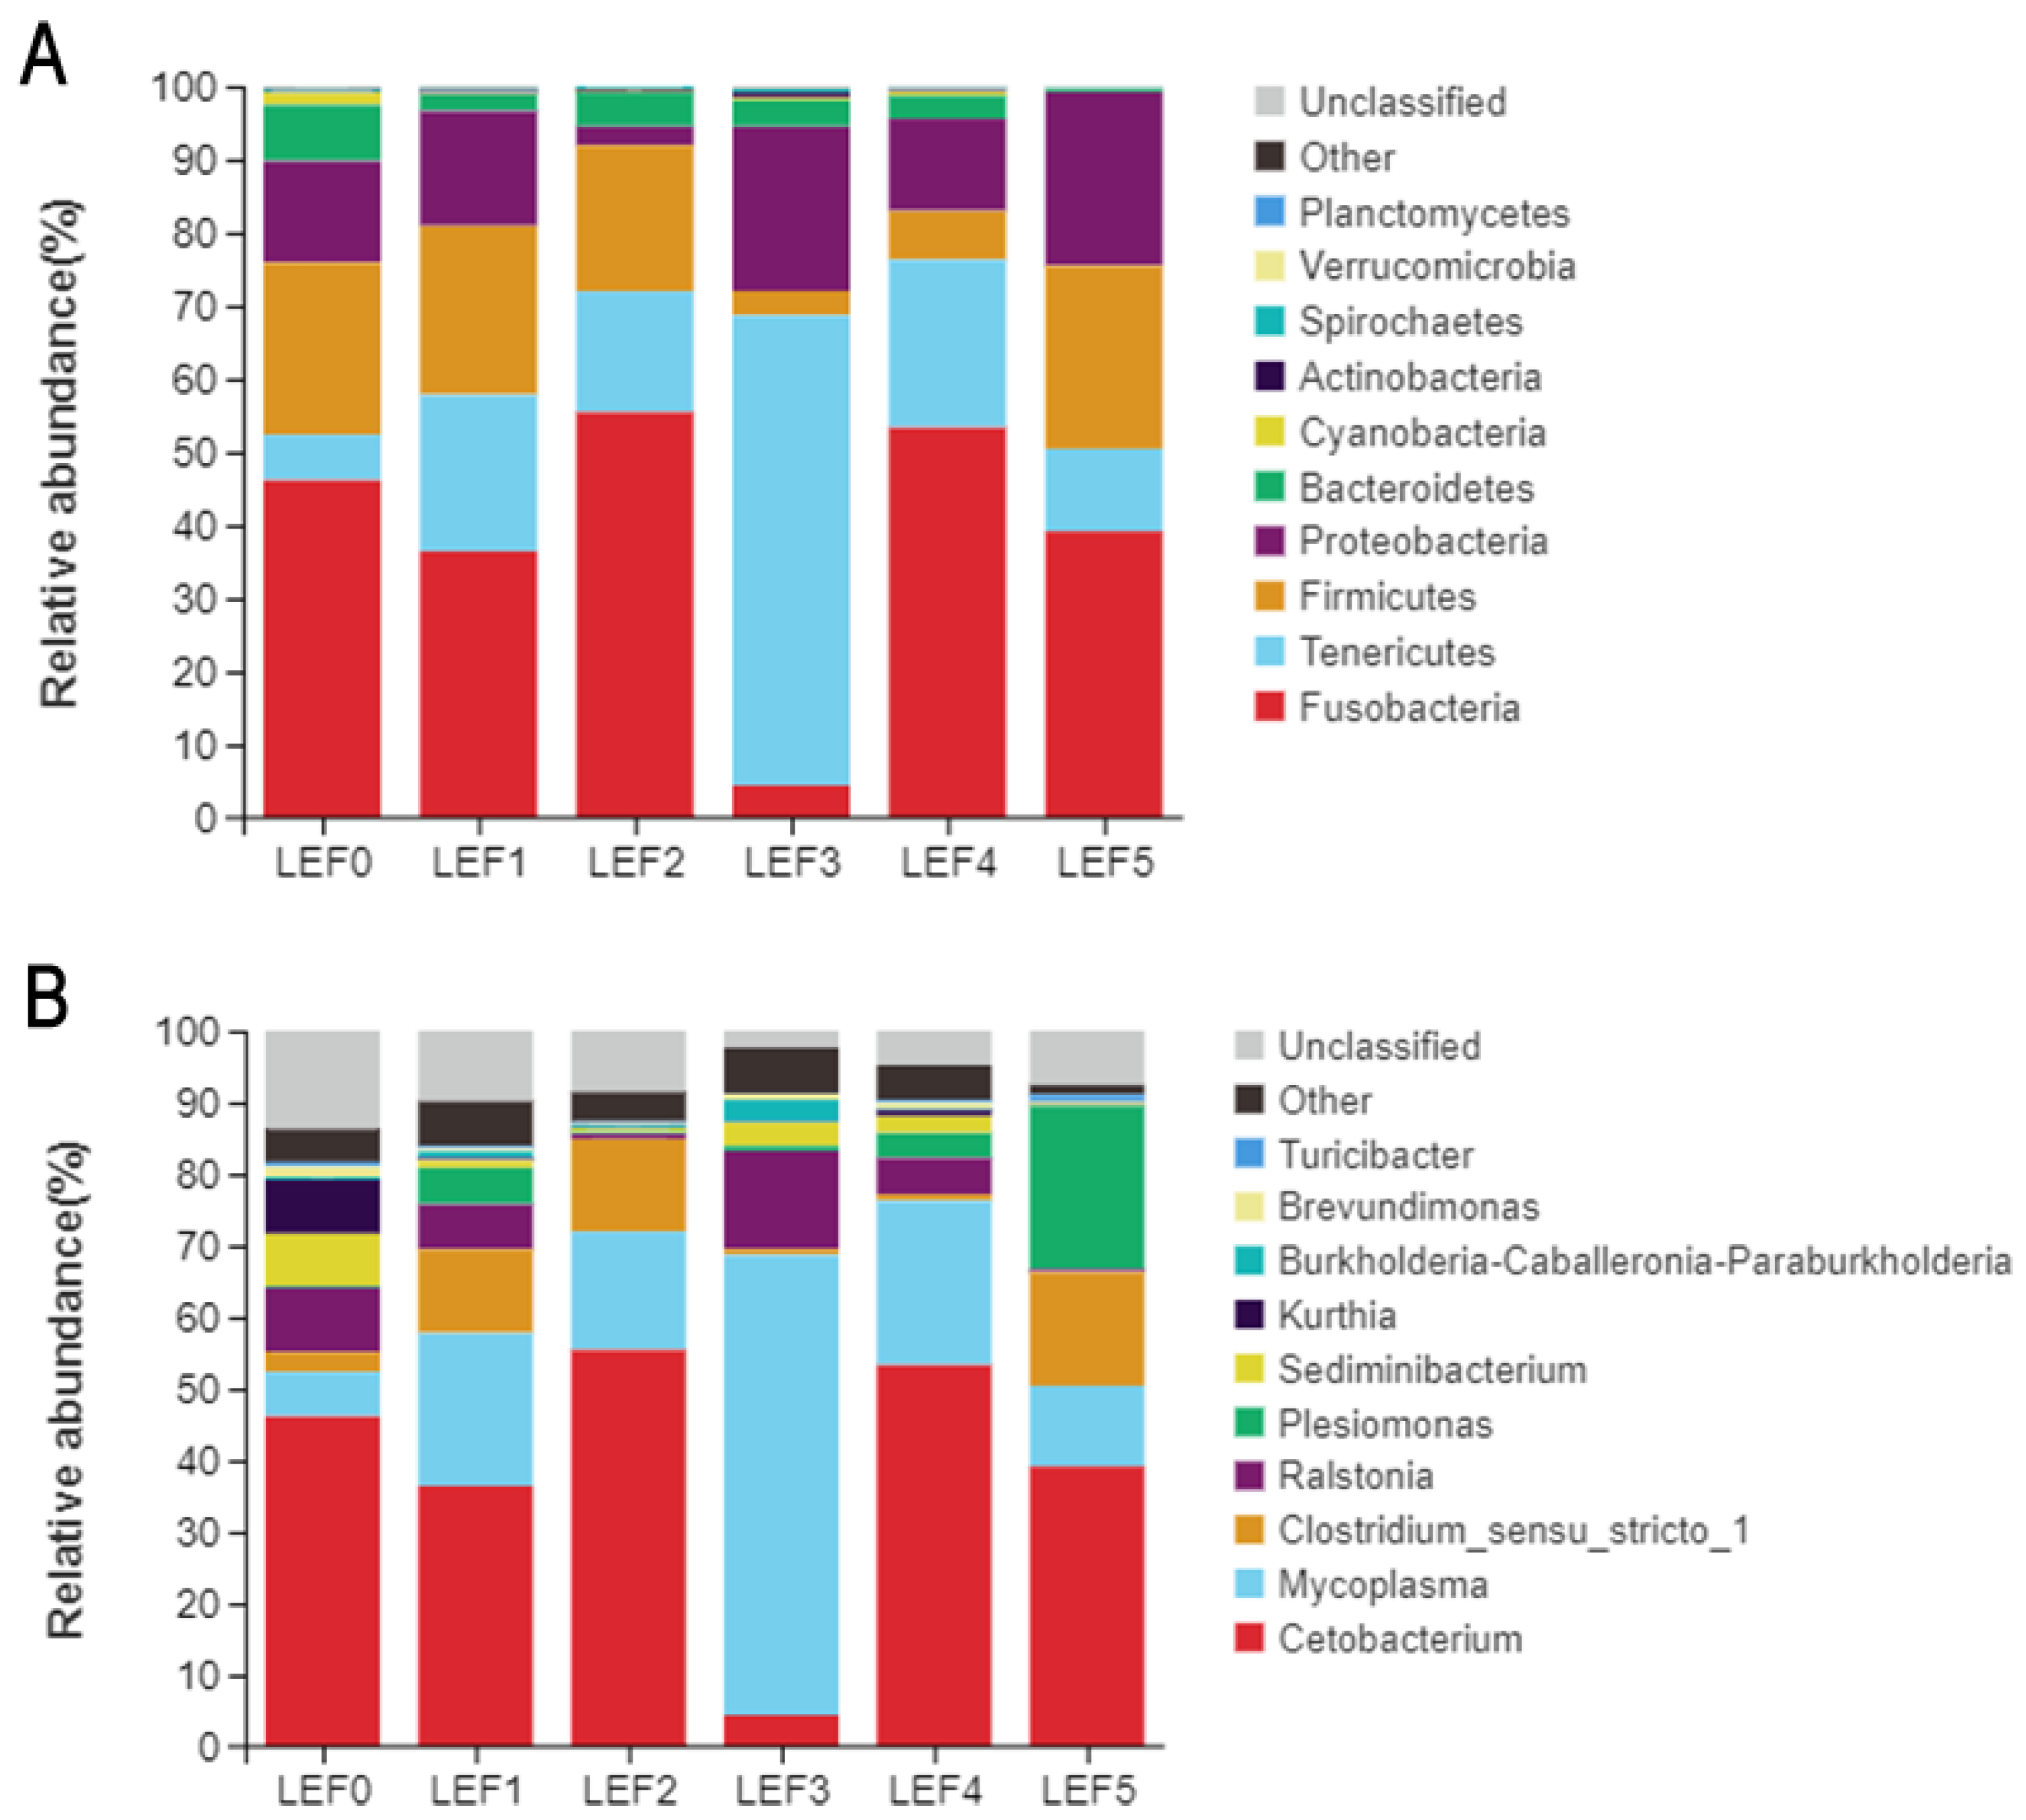
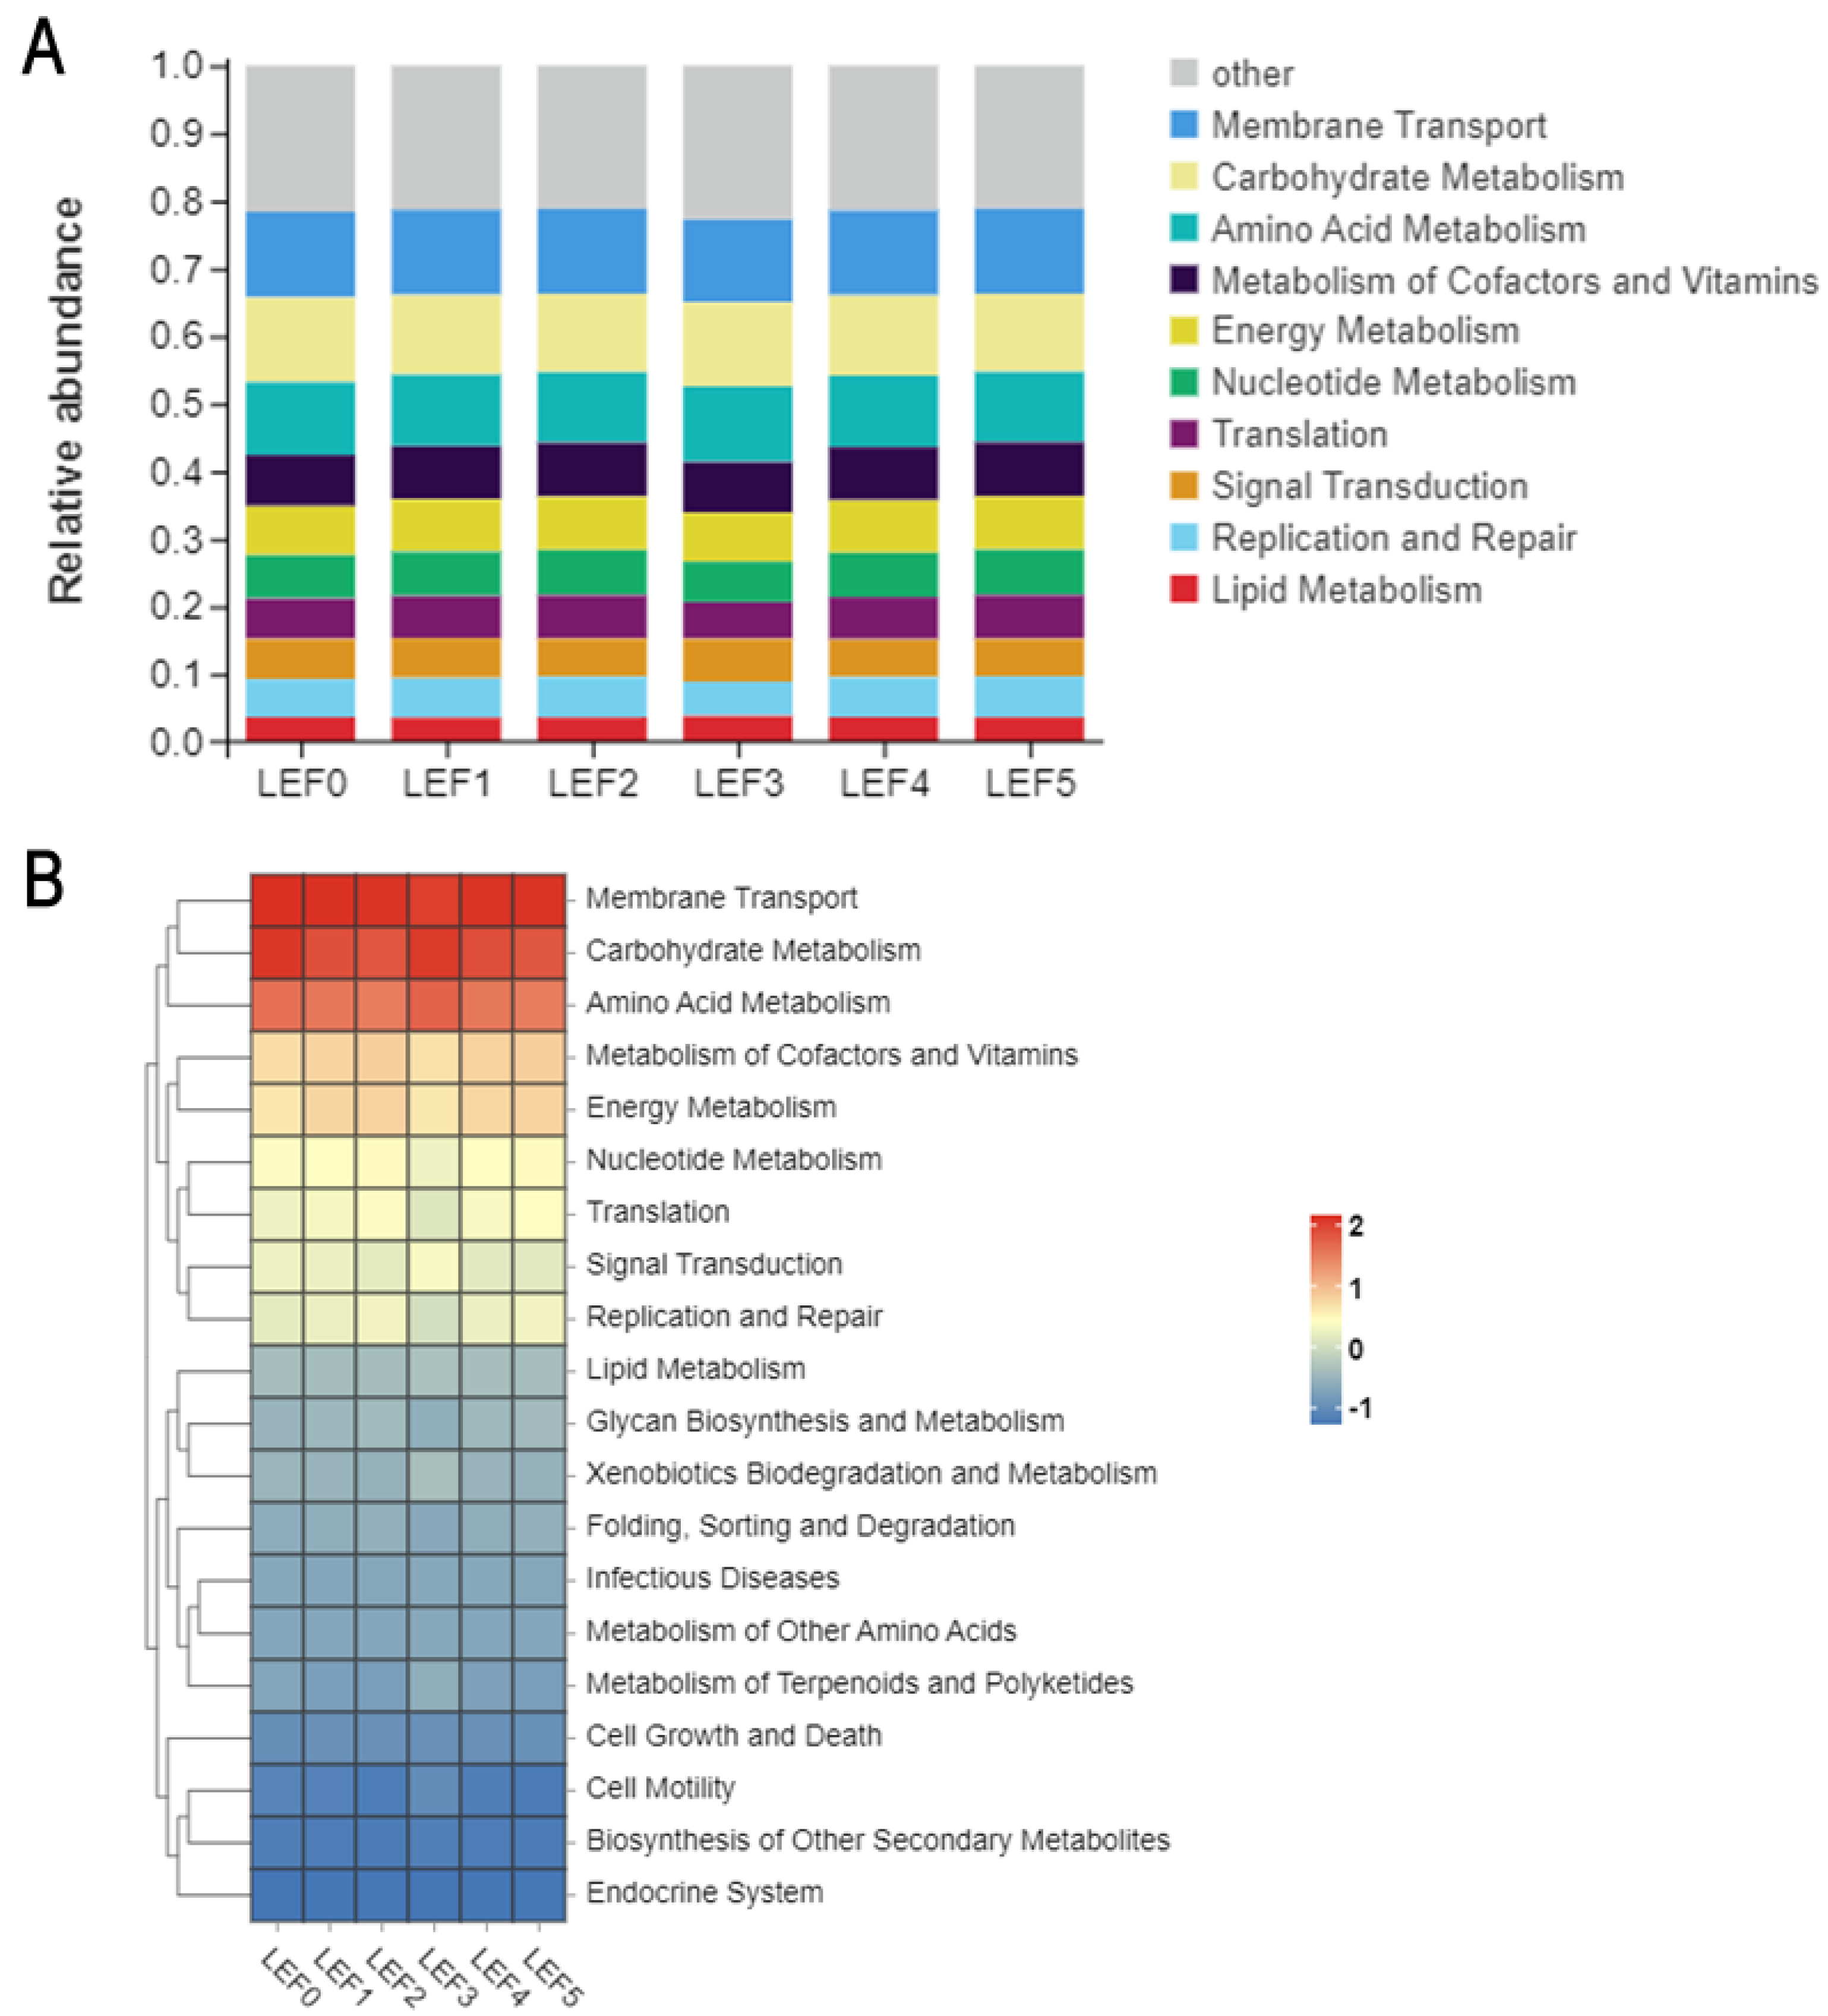
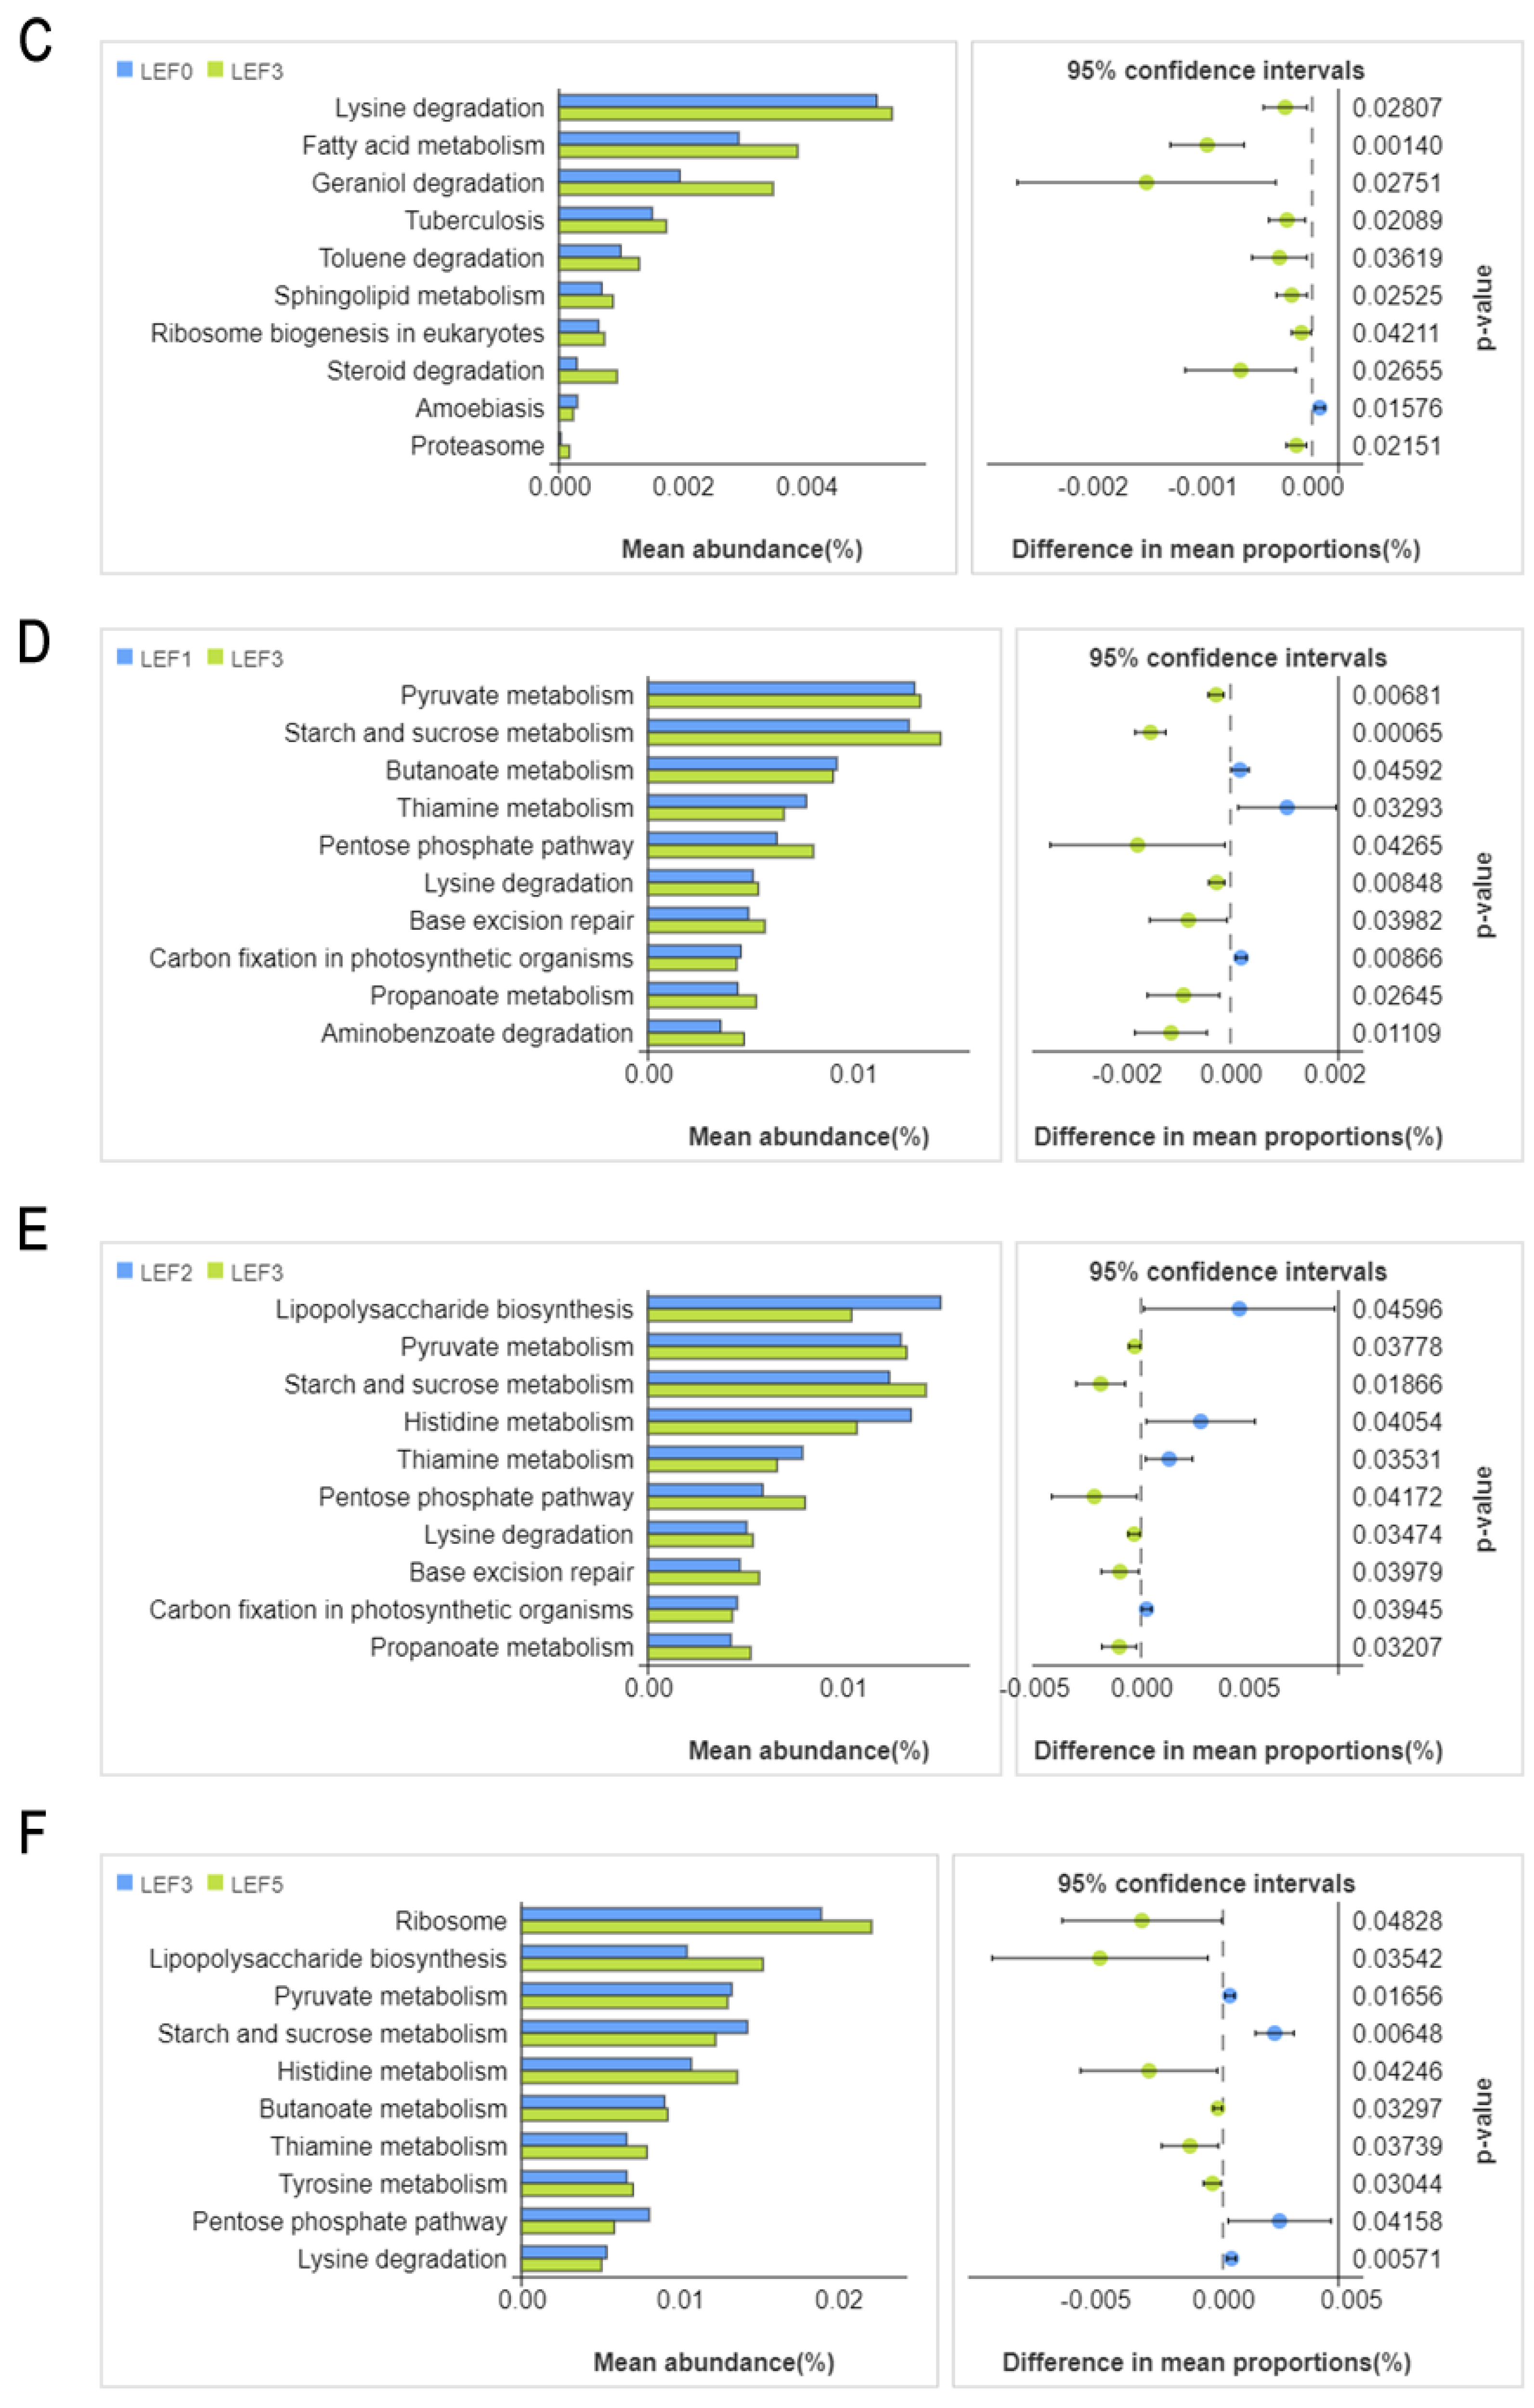
3.5. Intestinal Microbiota

The OTU VENN diagram visually showed the number of unique and common OTUs in each group. The number of OTUs in each group was 185, 304, 143, 162, 342 and 131, respectively. The total number of OTUs was highest in group LEF4. The rarefaction curve indicated that each sample had reached a sufficiently deep sampling depth (Figure 8). The α-diversity indexes were investigated to explore the bacterial community diversity of all groups (Table 4). The result showed that the microbial richness of group LEF4 significantly increased (p < 0.05), but there were no significant differences in Chao1, ACE, Shannon and Simpsons indices among all groups (p > 0.05).
Principal coordinates analysis (PCoA) plots were generated from weighted-UniFrac distances to assess community composition (Figure 9). The contribution rates for the first and second principal components are 51.61% and 21.78%, respectively. The figure showed that there was no clear dissimilarity among groups LEF0, LEF1, LEF2, LEF4, LEF5, which meant that the composition of bacterial communities in these groups was similar. However, the samples of LEF3 were mainly centered in the first quadrants, while samples of other groups were near the second quadrant.
The OTUs were identified into 12 phyla. At the phylum level, Fusobacteria was the predominant microflora in group LEF0 (46.13%), LEF1 (36.43%), LEF2 (55.43%), LEF4 (53.31%), LEF5 (39.14%), followed by Tenericutes, Firmicutes, Proteobacteria, Bacteroidetes, while the predominant microflora of group LEF3 (64.25%) was Tenericutes (Table 5; Figure 10A). At the genus level, the percentage of Clostridium increased in groups LEF1, LEF2, LEF5, and the percentage of Cetobacterium also increased in groups LEF2, LEF4 (Figure 10B).
Tax4Fun functional prediction analysis showed that KEGG related to membrane transport, carbohydrate metabolism, amino acid metabolism, cofactor and vitamin metabolism, energy metabolism, nucleotide metabolism, signal transduction, transcription, replication and repair, and lipid metabolism were enriched in all treatments, and there was no significant difference between all groups (p > 0.05; Figure 11). Welch’s t-test, on the other hand, revealed that certain predicted pathways between LEF0, LEF1, LEF3 and LEF4 were significantly different (p < 0.05). Several predicted pathways were significantly enriched in the LEF3 group versus the LEF0 and LEF1 groups (p < 0.05). In KEGG level 3 analysis, lysine degradation, fatty acid metabolism, geraniol degradation, tuberculosis and toluene degradation were significantly more abundant in group LEF3 compared with LEF0 (p < 0.05; Figure 11C); pyruvate metabolism, starch and sucrose metabolism and pentose phosphate pathway were more abundant in group LEF3 (p < 0.05; Figure 11D), while butanoate metabolism, thiamine metabolism enriched in group LEF1; pyruvate metabolism, starch and sucrose metabolism, lipopolysaccharide biosynthesis, thiamine metabolism enriched in group LEF2, while histidine metabolism, pyruvate metabolism, starch and sucrose metabolism were more abundant in group LEF3 (p < 0.05; Figure 11E); ribosome, lipopolysaccharide biosynthesis, histidine metabolism are more abundant in group LEF5 (p < 0.05; Figure 11F).

4. Discussion

Adopting plant protein as a substitute for fishmeal to save cost has been used in aquaculture commonly [3,4,5,6], but this is detrimental to the growth performance of carnivorous fish such as largemouth bass. The inclusion of LEF did not significantly improve the growth performance of largemouth bass fed HPPD diets, according to the current findings. Furthermore, there was a significant decrease in the activity of TRY and LPS in the intestine. The three main digestive enzymes in the intestine are AMS, LPS, and TRY, and measuring the activity of these enzymes can provide an indirect view of nutrient digestion and absorption in the intestine [26,27]. In this trial, HPPD was used as the basal diet for largemouth bass, therefore, the above findings may be related to factors such as poor palatability and anti-nutritional factors in HPPD. Amiri et al. [28] found no improvement in Rainbow Trout (Oncorhynchus mykiss) growth parameters compared to fish that fed non-supplemental feed after 8 weeks feeding of White Button Mushroom (Agaricus bisporus) Powder (WBMP). Similarly, a study on holothurian (Apostichopus japonicus) also showed that there was no significant effect on weight gain and specific growth rate after dietary administration of Pleurotus ostreatus polysaccharides (POPS) [29]. In contrast, Mohan et al. [30] found that dietary Ganoderma lucidum polysaccharides (GLPs) at 2.5 g kg−1 had a positive effect on the growth of freshwater shrimp. Additionally, Doan et al. [31] reported that SGR, WG, FW and FCR were remarkably improved in spent mushroom (cordyceps militaris) substrate treatment groups. Dietary mushrooms also have a positive effect on the growth performance of piglets. Research on the effect of dietary spent mushroom (cordyceps militaris) on the growth performance of weaning pigs showed that spent mushrooms at 1.5 g kg−1 improved the body weight, average daily weight gain and average daily feed [32]. Another, research on the impacts of fermented spent mushroom substrates on piglets also received similar results [33]. These results indicated that dietary supplementation of mushrooms had different effects on the growth performance of different animals, which may be related to the species, processing method and dosage of mushrooms.
The overproduction of free radicals can produce adverse reactions in different tissues [34,35,36]. The liver is one of the susceptible tissues to oxidative stress [37]. Supplementation of LEF in the present study significantly reduced the hepatic MDA level. Previous research discovered that supplementing Agaricus bisporus mushrooms increased GSH-Px, GR and GST activity while decreasing MDA production in turkey poult liver [38]. Liu et al. [39] also reported that the application of the deep root mushroom reduced the lipid peroxidation of the liver in mice. The CAT is an important antioxidant enzyme that removes the reactive oxygen species (ROS) intermediate H2O2 and protects the body from ROS [40,41,42]. In the present study, significantly increased CAT activity was observed in the LEF2 group. This result agreed with Liu et al. [39] and Mahfuz et al. [43], who found that the CAT activity of animal liver increased after the administration of mushrooms. Furthermore, a significant improvement in liver morphology was also observed in the LEF2 treatment. This study showed that the hepatic sinusoidal space decreased and the infiltration of macrophages and neutrophils reduced, which indicated an improvement in the liver morphology of group LEF2. Drori et al. [44] also revealed a corresponding improvement of the immune-mediated liver injury of mice after feeding vitamin D-rich mushroom extract. In addition, Kuang et al. [45] reported that the injury degree of the liver in mice with gut-origin sepsis was improved with the increase in lentinan concentration. In addition, it was found that lentinan sulfate polysaccharide can improve the multiple organ dysfunction syndrome induced by yeast polysaccharides in mice and reduce the vacuolization of mouse liver 46]. The improvement in liver morphology can be attributed to the bioactive compounds in mushrooms such as B vitamins, minerals, polysaccharides, lentinan and so on, which have the effect of liver protection and enhancing the antioxidant capacity of the liver [43,46,47,48,49,50,51,52,53,54]. The present study showed that LEF can reduce hepatic MDA levels and enhance the ability of hepatocytes to remove hydrogen peroxide.
The composition of gut microbial communities is closely related to the health of the host. Parasitic microbial communities in the host are involved in many physiological processes [55]. Many reports suggested that mushroom supplementation in diets changed the intestinal morphology and the composition of the microbiota. Nevel et al. [23] found that supplementation with Lentinus edodes affects the composition of hindgut microorganisms and change the intestinal morphology of piglet. Giannenas et al. [56] also found that Lactobacilli spp. were higher in the ileum of broiler chickens fed a diet containing Agaricus bisporus. Another study by Giannenas showed that mucosal architecture was influenced by mushroom consumption in terms of villus height [57]. Similar to the above findings, the present study found that the relative abundance of Clostridium, a member of Firmicutes, significantly increased in groups LEF1, LEF2 and LEF5. Besides, the muscularis thickness and goblet cell number increased significantly in group LEF5 compared to the control. Similar findings had also been reported for Rainbow Trout (Oncorhynchus mykiss), crude lentinan significantly promoted the growth of short-chain fatty-acid-producing bacteria. In addition, Yang et al. [51] claimed that the application of lentinan supplementation can reduce Proteobacteria and increase the abundance of Actinomycetes to improve intestinal microflora imbalance in mice. In the gut, Clostridium digests polysaccharides, producing many short-chain fatty acids (SCFA) that are beneficial to animal health [58]. SCFA, and specifically butyrate, play an important role in mediating the effects of the gut microbiome on local and systemic immunity [59]. Alves jesus et al. [60] reported that adding sodium butyrate to the diet significantly reduced liver lymphocyte infiltration and improved intestinal integrity in tilapia. Similarly, the villus height (VH) to crypt depth (CD) ratio (VH:CD ratio) of the ileum were higher in piglet fed with butyrate [61]. Therefore, this study suggested that LEF may have a potential prebiotic effect and that the bioactive compounds in LEF may be fermented by gut microbes to produce short-chain fatty acids by substrate fermentation, thus affecting the composition of gut microbial communities, and this change ultimately affects the morphology of the intestine [62,63,64,65].

5. Conclusions

In conclusion, this study provided the experimental basis for HPPD to develop mushroom feed additives. Dietary LEF supplementation can improve antioxidant activity in the liver and gut of largemouth bass, relieve liver inflammation, improve intestinal tissue morphology, and ultimately have a positive effect on the health of largemouth bass. Dietary LEF is recommended at required at 20 g kg−1.

Author Contributions

Conceptualization, J.X. and G.L.; methodology, J.X., Z.Y., G.L., W.B. and S.L.; validation, G.Z., H.W. and Z.Y.; investigation, J.X., X.T., G.L., S.L., Y.D. and C.Y.; data curation, J.X.; writing—original draft preparation, J.X. and Z.Y.; writing—review and editing, J.X., X.T. and W.B.; visualization, J.X.; supervision and project administration, Y.H., X.T and M.Z.; funding acquisition, M.Z., X.T. and Y.H. All authors have read and agreed to the published version of the manuscript.

Funding

The research was supported by Research, development and application of quality assurance technology for Lingnan aquatic products prefabricated dishes (2022ZDJS022), Key Realm R&D Program of GuangDong Province (2021B0202050002), Innovative Team Projects of Ordinary Colleges and Universities in Guangdong Province (2020KCXTD019), Provincial Agricultural Science and Technology Development and Resources Environmental Protection Management Projects (2022KJ115) and Guangdong Maoming Binhai New Area Marine Fishery Industrial Park Project (0835-220FA8102621).

Institutional Review Board Statement

The experimental design was approved by the Animal Care Committee of Zhongkai University of Agriculture and Engineering (Ethical approval number: 20210726).

Informed Consent Statement

Not applicable, as there is no human involved in this study.

Data Availability Statement

The datasets of the current study are available from the corresponding author upon reasonable request.

Conflicts of Interest

The authors declare no conflict of interest.

References

  1. He, M.; Yu, Y.; Li, X.; Poolsawat, L.; Yang, P.; Bian, Y.; Guo, Z.; Leng, X. An evaluation of replacing fish meal with fermented soybean meal in the diets of largemouth bass (Micropterus salmoides): Growth, nutrition utilization and intestinal histology. Aquac. Res. 2020, 51, 4302–4314. [Google Scholar] [CrossRef]
  2. Ma, Z.; Hassan, M.; Allais, L.; He, T.; Leterme, S.; Ellis, A.V.; McGraw, B.; Qin, J.G. Replacement of fishmeal with commercial soybean meal and EnzoMeal in juvenile barramundi Lates calcarifer. Aquac. Res. 2018, 49, 3258–3269. [Google Scholar] [CrossRef]
  3. Jannathulla, R.; Rajaram, V.; Kalanjiam, R.; Ambasankar, K.; Muralidhar, M.; Dayal, J.S. Fishmeal availability in the scenarios of climate change: Inevitability of fishmeal replacement in aquafeeds and approaches for the utilization of plant protein sources. Aquac. Res. 2019, 50, 3493–3506. [Google Scholar] [CrossRef]
  4. Kobayashi, M.; Msangi, S.; Batka, M.; Vannuccini, S.; Dey, M.M.; Anderson, J.L. Fish to 2030: The role and opportunity for aquaculture. Aquac. Econ. Manag. 2015, 19, 282–300. [Google Scholar] [CrossRef] [Green Version]
  5. Dawood, M.A.O.; Koshio, S. Application of fermentation strategy in aquafeed for sustainable aquaculture. Rev. Aquac. 2020, 12, 987–1002. [Google Scholar] [CrossRef]
  6. Jha, R.; Fouhse, J.M.; Tiwari, U.P.; Li, L.; Willing, B.P. Dietary Fiber and Intestinal Health of Monogastric Animals. Front. Vet. Sci. 2019, 6, 48. [Google Scholar] [CrossRef] [Green Version]
  7. Parma, L.; Candela, M.; Soverini, M.; Turroni, S.; Consolandi, C.; Brigidi, P.; Mandrioli, L.; Sirri, R.; Fontanillas, R.; Gatta, P.P.; et al. Next-generation sequencing characterization of the gut bacterial community of gilthead sea bream (Sparus aurata, L.) fed low fishmeal based diets with increasing soybean meal levels. Anim. Feed. Sci. Technol. 2016, 222, 204–216. [Google Scholar] [CrossRef]
  8. Liang, X.; Han, J.; Xue, M.; Yu, H.; Huang, H.; Wu, X.; Zheng, Y.; Qin, Y.; Liang, X. Growth and feed intake regulation responses to anorexia, adaptation and fasting in Japanese seabss, Lateolabrax japonicas when fishmeal is totally replaced by plant protein. Aquaculture 2019, 498, 528–538. [Google Scholar] [CrossRef]
  9. Zhu, R.; Duan, J.; Li, L.; Li, M.; Yu, Z.; Wang, H.; Quan, Y.; Wu, L. Effects of Substituting Fish Meal with Two Types of Soybean Meal on Growth, Enzyme Activities, and Intestinal Morphology in Juvenile Rhynchocypris lagowskii. N. Am. J. Aquac. 2021, 83, 267–282. [Google Scholar] [CrossRef]
  10. Wang, J.; Mai, K.; Ai, Q. Conventional soybean meal as fishmeal alternative in diets of Japanese Seabass (Lateolabrax japonicus): Effects of functional additives on growth, immunity, antioxidant capacity and disease resistance. Antioxidants 2022, 11, 951. [Google Scholar] [CrossRef] [PubMed]
  11. Novriadi, R.; Rhodes, M.; Powell, M.; Hanson, T.; Davis, D.A. Effects of soybean meal replacement with fermented soybean meal on growth, serum biochemistry and morphological condition of liver and distal intestine of Florida pompano Trachinotus carolinus. Aquac. Nutr. 2018, 24, 1066–1075. [Google Scholar] [CrossRef]
  12. Liu, H.; Jin, J.; Zhu, X.; Han, D.; Yang, Y.; Xie, S. Effect of substitution of dietary fish meal by soybean meal on different sizes of gibel carp (Carassius auratus gibelio): Digestive enzyme gene expressions and activities, and intestinal and hepatic histology. Aquac. Nutr. 2017, 23, 129–147. [Google Scholar] [CrossRef]
  13. Huang, D.; Wu, Y.; Lin, Y.; Chen, J.; Karrow, N.; Ren, X.; Wang, Y. Dietary Protein and Lipid Requirements for Juvenile Largemouth Bass, Micropterus salmoides. J. World Aquac. Soc. 2017, 48, 782–790. [Google Scholar] [CrossRef]
  14. Sampaio-Oliveira, A.; Cyrino, J. Digestibility of plant protein-based diets by largemouth bass Micropterus salmoides. Aquac. Nutr. 2008, 14, 318–323. [Google Scholar] [CrossRef]
  15. Ma, D.; Fan, J.; Tian, Y.; Jiang, P.; Wang, J.; Zhu, H.; Bai, J. Selection of reference genes for quantitative real-time PCR normalisation in largemouth bass Micropterus salmoides fed on alternative diets. J. Fish Biol. 2019, 95, 393–400. [Google Scholar] [CrossRef] [PubMed]
  16. Amoah, A.; Coyle, S.D.; Webster, C.D.; Durborow, R.M.; Bright, L.A.; Tidwell, J.H. Effects of Graded Levels of Carbohydrate on Growth and Survival of Largemouth Bass, Micropterus salmoides. J. World Aquac. Soc. 2008, 39, 397–405. [Google Scholar] [CrossRef]
  17. Li, X.; Zheng, S.; Ma, X.; Cheng, K.; Wu, G. Use of alternative protein sources for fishmeal replacement in the diet of largemouth bass (Micropterus salmoides). Part I: Effects of poultry by-product meal and soybean meal on growth, feed utilization, and health. Amino Acids 2021, 53, 33–47. [Google Scholar] [CrossRef]
  18. Li, X.; Zheng, S.; Cheng, K.; Ma, X.; Wu, G. Use of alternative protein sources for fishmeal replacement in the diet of largemouth bass (Micropterus salmoides). Part II: Effects of supplementation with methionine or taurine on growth, feed utilization, and health. Amino Acids 2021, 53, 49–62. [Google Scholar] [CrossRef]
  19. Rossi, W., Jr.; Allen, K.M.; Habte-Tsion, H.-M.; Meesala, K.-M. Supplementation of glycine, prebiotic, and nucleotides in soybean meal-based diets for largemouth bass (Micropterus salmoides): Effects on production performance, whole-body nutrient composition and retention, and intestinal histopathology. Aquaculture 2021, 532, 736031. [Google Scholar] [CrossRef]
  20. Gaitán-Hernández, R.; López-Peña, D.; Esqueda, M.; Gutiérrez, A. Review of Bioactive Molecules Production, Biomass, and Basidiomata of Shiitake Culinary-Medicinal Mushrooms, Lentinus edodes (Agaricomycetes). Int. J. Med. Mushrooms 2019, 21, 841–850. [Google Scholar] [CrossRef]
  21. Bisen, P.; Baghel, R.; Sanodiya, B.; Thakur, G.; Prasad, G. Lentinus edodes: A Macrofungus with Pharmacological Activities. Curr. Med. Chem. 2010, 17, 2419–2430. [Google Scholar] [CrossRef] [PubMed]
  22. Conway, E.; Sweeney, T.; Dowley, A.; Maher, S.; Rajauria, G.; Yadav, S.; Wilson, J.; Gabrielli, W.; O’doherty, J.V. The effects of mushroom powder and vitamin D2-enriched mushroom powder supplementation on the growth performance and health of newly weaned pigs. J. Anim. Physiol. Anim. Nutr. 2022, 106, 517–527. [Google Scholar] [CrossRef]
  23. Van Nevel, C.J.; Decuypere, J.A.; Dierick, N.; Molly, K. The influence of Lentinus edodes (Shiitake mushroom) preparations on bacteriological and morphological aspects of the small intestine in piglets. Arch. Anim. Nutr. 2003, 57, 399–412. [Google Scholar] [CrossRef] [PubMed]
  24. Chen, H.; Li, D.; Chang, B.; Gong, L.; Piao, X.; Yi, G.; Zhang, J. Effects of lentinan on broiler splenocyte proliferation, interleukin-2 production, and signal transduction. Poult. Sci. 2003, 82, 760–766. [Google Scholar] [CrossRef]
  25. Dong, L.; Zhang, H.; Gao, Y.; Diao, Q. Dynamic profiles of fermentation characteristics and bacterial community composition of Broussonetia papyrifera ensiled with perennial ryegrass. Bioresour. Technol. 2020, 310, 123396. [Google Scholar] [CrossRef]
  26. Spim, S.R.V.; de Oliveira, B.G.C.C.; Leite, F.G.; Gerenutti, M.; Grotto, D. Effects of Lentinula edodes consumption on biochemical, hematologic and oxidative stress parameters in rats receiving high-fat diet. Eur. J. Nutr. 2017, 56, 2255–2264. [Google Scholar] [CrossRef] [PubMed]
  27. Cahu, C.; Rønnestad, I.; Grangier, V.; Infante, J.Z. Expression and activities of pancreatic enzymes in developing sea bass larvae (Dicentrarchus labrax) in relation to intact and hydrolyzed dietary protein; involvement of cholecystokinin. Aquaculture 2004, 238, 295–308. [Google Scholar] [CrossRef] [Green Version]
  28. Amiri, O.; Miandare, H.K.; Hoseinifar, S.H.; Shabni, A.; Safari, R. Skin mucus protein profile, immune parameters, immune-related gene expression, and growth performance of rainbow rrout (Oncorhynchus mykiss) fed white button mushroom (Agaricus bisporus) powder. Int. J. Med. Mushrooms 2018, 20, 337–347. [Google Scholar] [CrossRef]
  29. Song, X.; Feng, Z.; Tan, J.; Wang, Z.; Zhu, W. Dietary administration of Pleurotus ostreatus polysaccharides (POPS) modulates the non-specific immune response and gut microbiota diversity of Apostichopus japonicus. Aquac. Rep. 2021, 19, 100578. [Google Scholar] [CrossRef]
  30. Chang, S.-C.; Lin, M.-J.; Chao, Y.-P.; Chiang, C.-J.; Jea, Y.-S.; Lee, T.-T. Effects of spent mushroom compost meal on growth performance and meat characteristics of grower geese. Rev. Bras. de Zootec. 2016, 45, 281–287. [Google Scholar] [CrossRef] [Green Version]
  31. Mohan, K.; Padmanaban, A.; Uthayakumar, V.; Chandirasekar, R.; Muralisankar, T.; Santhanam, P. Effect of dietary Ganoderma lucidum polysaccharides on biological and physiological responses of the giant freshwater prawn Macrobrachium rosenbergii. Aquaculture 2016, 464, 42–49. [Google Scholar] [CrossRef]
  32. Van Doan, H.; Hoseinifar, S.H.; Tapingkae, W.; Chitmanat, C.; Mekchay, S. Effects of Cordyceps militaris spent mushroom substrate on mucosal and serum immune parameters, disease resistance and growth performance of Nile tilapia, (Oreochromis niloticus). Fish Shellfish. Immunol. 2017, 67, 78–85. [Google Scholar] [CrossRef]
  33. Boontiam, W.; Wachirapakorn, C.; Phaengphairee, P.; Wattanachai, S. Effect of spent mushroom (Cordyceps militaris) on growth performance, immunity, and intestinal microflora in weaning pigs. Animals 2020, 10, 2360. [Google Scholar] [CrossRef] [PubMed]
  34. Qi, Q.; Peng, Q.; Tang, M.; Chen, D.; Zhang, H. Microbiome Analysis Investigating the Impacts of Fermented Spent Mushroom Substrates on the Composition of Microbiota in Weaned Piglets Hindgut. Front. Veter-Sci. 2020, 7, 584243. [Google Scholar] [CrossRef] [PubMed]
  35. Klein, R.D.; Borges, V.D.; Rosa, C.E.; Colares, E.P.; Robaldo, R.B.; Martinez, P.E.; Bianchini, A. Effects of increasing temperature on antioxidant defense system and oxidative stress parameters in the Antarctic fish Notothenia coriiceps and Notothenia rossii. J. Therm. Biol. 2017, 68, 110–118. [Google Scholar] [CrossRef] [PubMed]
  36. Furukawa, S.; Fujita, T.; Shimabukuro, M.; Iwaki, M.; Yamada, Y.; Nakajima, Y.; Nakayama, O.; Makishima, M.; Matsuda, M.; Shimomura, I. Increased oxidative stress in obesity and its impact on metabolic syndrome. J. Clin. Investig. 2017, 114, 1752–1761. [Google Scholar] [CrossRef]
  37. Bosoi, C.R.; Rose, C.F. Oxidative stress: A systemic factor implicated in the pathogenesis of hepatic encephalopathy. Metab. Brain Dis. 2013, 28, 175–178. [Google Scholar] [CrossRef] [Green Version]
  38. Cichoż-Lach, H.; Michalak, A. Oxidative stress as a crucial factor in liver diseases. World J. Gastroenterol. WJG 2014, 20, 8082. [Google Scholar] [CrossRef]
  39. Liu, H.; Yang, Q.; Gao, Z.; Zhu, Y.; Zhang, J.; Jia, L. The Antioxidative, Anti-inflammatory, and Liver-Protective Effects of Mycelia Selenium Polysaccharides from the Deep Root Mushroom, Oudemansiella radicata (Agaricomycetes). Int. J. Med. Mushrooms 2019, 21, 1019–1031. [Google Scholar] [CrossRef]
  40. Miller, A.-F. Superoxide dismutases: Active sites that save, but a protein that kills. Curr. Opin. Chem. Biol. 2004, 8, 162–168. [Google Scholar] [CrossRef]
  41. Ezraty, B.; Gennaris, A.; Barras, F.; Collet, J.F. Oxidative stress, protein damage and repair in bacteria. Nat. Rev. Microbiol. 2017, 15, 385–396. [Google Scholar] [CrossRef] [PubMed]
  42. Kirkman, H.N.; Gaetani, G.F. Mammalian catalase: A venerable enzyme with new mysteries. Trends Biochem. Sci. 2007, 32, 44–50. [Google Scholar] [CrossRef] [PubMed]
  43. Mahfuz, S.; He, T.; Ma, J.; Liu, H.; Long, S.; Shang, Q.; Zhang, L.; Yin, J.; Piao, X. Mushroom (Flammulina velutipes) stem residue on growth performance, meat quality, antioxidant status and lipid metabolism of broilers. Ital. J. Anim. Sci. 2020, 19, 803–812. [Google Scholar] [CrossRef]
  44. Drori, A.; Shabat, Y.; Ben Ya’Acov, A.; Danay, O.; Levanon, D.; Zolotarov, L.; Ilan, Y. Extracts from Lentinula edodes (Shiitake) Edible Mushrooms Enriched with Vitamin D Exert an Anti-Inflammatory Hepatoprotective Effect. J. Med. Food 2016, 19, 383–389. [Google Scholar] [CrossRef]
  45. Kuang, Z.; Jin, T.; Wu, C.; Zong, Y.; Yin, P.; Dong, W.; Lin, X.; You, W.; Zhang, C.; Wang, L.; et al. Lentinan Attenuates Damage of the Small Intestinal Mucosa, Liver, and Lung in Mice with Gut-Origin Sepsis. J. Immunol. Res. 2021, 2021, 2052757. [Google Scholar] [CrossRef]
  46. Sun, W.; Feng, Y.; Zhang, M.; Song, X.; Jia, L. Protective effects of sulfated polysaccharides from Lentinula edodes on the lung and liver of MODS mice. Food Funct. 2021, 12, 6389–6402. [Google Scholar] [CrossRef] [PubMed]
  47. Hamza, R.G.; El Shahat, A.; Al-Seeni, M. Studying the antioxidant role of mushroom against hazards of gamma radiation exposure in male rats. Indian J. Anim. Res. 2018, 52, 226–231. [Google Scholar] [CrossRef]
  48. Dogan, A.; Dalar, A.; Sadullahoglu, C.; Battal, A.; Uzun, Y.; Celik, I.; Demirel, K. Investigation of the protective effects of horse mushroom (Agaricus arvensis Schaeff.) against carbon tetrachloride-induced oxidative stress in rats. Mol. Biol. Rep. 2018, 45, 787–797. [Google Scholar] [CrossRef] [PubMed]
  49. Chuang, W.Y.; Lin, L.J.; Der Shih, H.; Shy, Y.M.; Chang, S.C.; Lee, T.T. Intestinal Microbiota, Anti-Inflammatory, and Anti-Oxidative Status of Broiler Chickens Fed Diets Containing Mushroom Waste Compost By-Products. Animals 2021, 11, 2550. [Google Scholar] [CrossRef]
  50. Zhao, H.; Lan, Y.; Liu, H.; Zhu, Y.; Liu, W.; Zhang, J.; Jia, L. Antioxidant and Hepatoprotective Activities of Polysaccharides from Spent Mushroom Substrates (Laetiporus sulphureus) in Acute Alcohol-Induced Mice. Oxidative Med. Cell. Longev. 2017, 2017, 5863523. [Google Scholar] [CrossRef] [Green Version]
  51. Yang, X.; Zheng, M.; Zhou, M.; Zhou, L.; Ge, X.; Pang, N.; Li, H.; Li, X.; Li, M.; Zhang, J.; et al. Lentinan Supplementation Protects the Gut–Liver Axis and Prevents Steatohepatitis: The Role of Gut Microbiota Involved. Front. Nutr. 2022, 8, 803691. [Google Scholar] [CrossRef]
  52. Du, T.; Fang, Q.; Zhang, Z.; Zhu, C.; Xu, R.; Chen, G.; Wang, Y. Lentinan Protects against Nonalcoholic Fatty Liver Disease by Reducing Oxidative Stress and Apoptosis via the PPARα Pathway. Metabolites 2022, 12, 55. [Google Scholar] [CrossRef] [PubMed]
  53. Uluköy, G.; Baba, E.; Birincioğlu, S.S. Effects of dietary lentinula edodes extract on liver and gut histology of rainbow trout (Oncorhynchus mykiss, Walbaum 1792). Fish Shellfish. Immunol. 2016, 53, 106. [Google Scholar] [CrossRef]
  54. Song, X.; Cai, W.; Ren, Z.; Jia, L.; Zhang, J. Antioxidant and Hepatoprotective Effects of Acidic-Hydrolysis Residue Polysaccharides from Shiitake Culinary-Medicinal Mushroom Lentinus edodes (Agaricomycetes) in Mice. Int. J. Med. Mushrooms 2021, 23, 85–96. [Google Scholar] [CrossRef]
  55. Hertli, S.; Zimmermann, P. Molecular interactions between the intestinal microbiota and the host. Mol. Microbiol. 2022, 117, 1297–1307. [Google Scholar] [CrossRef] [PubMed]
  56. Giannenas, I.; Tontis, D.; Tsalie, E.; Chronis, E.; Doukas, D.; Kyriazakis, I. Influence of dietary mushroom Agaricus bisporus on intestinal morphology and microflora composition in broiler chickens. Res. Veter-Sci. 2010, 89, 78–84. [Google Scholar] [CrossRef]
  57. Giannenas, I.; Tsalie, E.; Chronis, E.; Mavridis, S.; Tontis, D.; Kyriazakis, I. Consumption of Agaricus bisporus mushroom affects the performance, intestinal microbiota composition and morphology, and antioxidant status of turkey poults. Anim. Feed. Sci. Technol. 2011, 165, 218–229. [Google Scholar] [CrossRef]
  58. Guo, P.; Zhang, K.; Ma, X.; He, P. Clostridium species as probiotics: Potentials and challenges. J. Anim. Sci. Biotechnol. 2020, 11, 1–10. [Google Scholar] [CrossRef]
  59. Siddiqui, M.T.; Cresci, G.A.M. The Immunomodulatory Functions of Butyrate. J. Inflamm. Res. 2021, 14, 6025–6041. [Google Scholar] [CrossRef]
  60. Jesus, G.F.A.; Owatari, M.S.; Pereira, S.A.; Silva, B.C.; Syracuse, N.M.; Lopes, G.R.; Addam, K.; Cardoso, L.; Mouriño, J.L.P.; Martins, M.L. Effects of sodium butyrate and Lippia origanoides essential oil blend on growth, intestinal microbiota, histology, and haemato-immunological response of Nile tilapia. Fish Shellfish. Immunol. 2021, 117, 62–69. [Google Scholar] [CrossRef]
  61. Zeng, X.; Yang, Y.; Wang, J.; Wang, Z.; Li, J.; Yin, Y.; Yang, H. Dietary butyrate, lauric acid and stearic acid improve gut morphology and epithelial cell turnover in weaned piglets. Anim. Nutr. 2022, 11, 276–282. [Google Scholar] [CrossRef] [PubMed]
  62. Gibson, G.R.; Roberfroid, M.B. Dietary Modulation of the Human Colonic Microbiota: Introducing the Concept of Prebiotics. J. Nutr. 1995, 125, 1401–1412. [Google Scholar] [CrossRef]
  63. Moreau, M.C.; Coste, M. Immune responses to dietary protein antigens. World Rev. Nutr. Diet. 1993, 74, 22–57. [Google Scholar] [PubMed]
  64. Sharma, R.; Schumacher, U.; Ronaasen, V.; Coates, M. Rat intestinal mucosal responses to a microbial flora and different diets. Gut 1995, 36, 209–214. [Google Scholar] [CrossRef] [PubMed] [Green Version]
  65. Hamann, L.; El-Samalouti, V.; Ulmer, A.J.; Flad, H.-D.; Rietschel, E.T. Components of gut bacteria as immunomodulators. Int. J. Food Microbiol. 1998, 41, 141–154. [Google Scholar] [CrossRef]
Figure 1. Effect of LEF on hepatic antioxidative activities of largemouth bass. Total antioxidant capacity (T-AOC, A), catalase (CAT, B), superoxide dismutase (SOD, C), malondialdehyde (MDA, D). Bars with different letters are significantly different (mean ± SD; ANOVA, p < 0.05; n = 4). LEF0 (0 g kg−1), LEF1 (10 g kg−1), LEF2 (20 g kg−1), LEF3 (30 g kg−1), LEF4 (40 g kg−1), LEF5 (50 g kg−1).
Fishes 08 00329 g001
Figure 2. Effect of LEF on intestinal antioxidative activities of largemouth bass. Total antioxidant capacity (T-AOC, A), catalase (CAT, B), superoxide dismutase (SOD, C), malondialdehyde (MDA, D). Bars with different letters are significantly different (mean ± SD; ANOVA, p < 0.05; n = 4). LEF0 (0 g kg−1), LEF1 (10 g kg−1), LEF2 (20 g kg−1), LEF3 (30 g kg−1), LEF4 (40 g kg−1), LEF5 (50 g kg−1).
Fishes 08 00329 g002
Figure 3. Effect of LEF on hepatic digestive activities of largemouth bass. Amylase (AMS, A), lipase (LPS, B), trypsin (TRY, C). Bars with different letters are significantly different (mean ± SD; ANOVA, p < 0.05; n = 4). LEF0 (0 g kg−1), LEF1 (10 g kg−1), LEF2 (20 g kg−1), LEF3 (30 g kg−1), LEF4 (40 g kg−1), LEF5 (50 g kg−1).
Fishes 08 00329 g003
Figure 4. Effect of LEF on intestinal digestive activities of largemouth bass. Amylase (AMS, A), lipase (LPS, B), trypsin (TRY, C). Bars with different letters are significantly different (mean ± SD; ANOVA, p < 0.05; n = 4). LEF0 (0 g kg−1), LEF1 (10 g kg−1), LEF2 (20 g kg−1), LEF3 (30 g kg−1), LEF4 (40 g kg−1), LEF5 (50 g kg−1).
Fishes 08 00329 g004
Figure 5. Effect of LEF on liver morphology of largemouth bass. (A): LEF0; (B): LEF1; (C): LEF2; (D): LEF3; (E): LEF4; (F): LEF5. (HE: hepatocytes; NU: nucleus; HS: hepatic sinusoid; CV: center vain; VA: vacuoles; Red Arrow: inflammatory infiltration). LEF0 (0 g kg−1, A), LEF1 (10 g kg−1, B), LEF2 (20 g kg−1, C), LEF3 (30 g kg−1, D), LEF4 (40 g kg−1, E), LEF5 (50 g kg−1, F).
Fishes 08 00329 g005
Figure 6. Effect of LEF on gut morphology of largemouth bass. LEF0 (0 g kg−1, A), LEF1 (10 g kg−1, B), LEF2 (20 g kg−1, C), LEF3 (30 g kg−1, D), LEF4 (40 g kg−1, E), LEF5 (50 g kg−1, F).
Fishes 08 00329 g006
Figure 7. Effect of LEF on intestinal ultrastructure of largemouth bass. MV: micro villi; MVB: Multi-vesicle; MIT: Mitochondrial; GC: goblet cells; LYS: Lysosomal; N: Nucleus. LEF0 (0 g kg−1, A), LEF1 (10 g kg−1, B), LEF2 (20 g kg−1, C), LEF3 (30 g kg−1, D), LEF4 (40 g kg−1, E), LEF5 (50 g kg−1, F).
Fishes 08 00329 g007
Figure 8. OTU VENN analysis and α Diversity dilution curve of gut microbiota in largemouth bass fed with different levels of LEF. (A): OTU Venn diagram; (B): rarefaction curve. LEF0 (0 g kg−1), LEF1 (10 g kg−1), LEF2 (20 g kg−1), LEF3 (30 g kg−1), LEF4 (40 g kg−1), LEF5 (50 g kg−1).
Fishes 08 00329 g008
Figure 9. Principal coordinates analysis (PCoA) analysis based on weighted-unifrac method.
Fishes 08 00329 g009
Figure 10. The relative abundance of bacteria in the intestine of largemouth bass. (A): phylum level; (B): genus level. LEF0 (0 g kg−1), LEF1 (10 g kg−1), LEF2 (20 g kg−1), LEF3 (30 g kg−1), LEF4 (40 g kg−1), LEF5 (50 g kg−1).
Fishes 08 00329 g010
Figure 11. Tax4fun function prediction of gut microbiota in largemouth bass. (A): Relative enrichment of KEGG level 1; (B): Corresponding heatmaps for KEGG Level 1 pathways; (CF): The top 10 pathways of predicted functions of intestinal microbiota in KEGG level 3. The Welch’s t-test was used in groups LEF0, LEF1, LEF2, LEF3, LEF5 (p < 0.05). LEF0 (0 g kg−1), LEF1 (10 g kg−1), LEF2 (20 g kg−1), LEF3 (30 g kg−1), LEF4 (40 g kg−1), LEF5 (50 g kg−1).
Fishes 08 00329 g011aFishes 08 00329 g011b
Table 1. Composition and nutrient levels of experimental diets (g kg−1).
MaterialLEF0LEF1LEF2LEF3LEF4LEF5
fish meal280.0280.0280.0280.0280.0280.0
Soybean protein concentrate100.0100.0100.0100.0100.0100.0
Corn gluten meal140.0140.0140.0140.0140.0140.0
Soybean meal78.078.078.078.078.078.0
Peanut bran60.060.060.060.060.060.0
flour205.9205.9205.9205.9205.9205.9
Beer yeast powder50.050.050.050.050.050.0
fish oil51.051.051.051.051.051.0
lecithin10.010.010.010.010.010.0
Vitamin and mineral premix 110.010.010.010.010.010.0
Choline chloride (50%)5.05.05.05.05.05.0
antioxidant0.10.10.10.10.10.1
Calcium dihydrogen phosphate10.010.010.010.010.010.0
Mushroom leftover fermentation product 201020304050
Proximate composition (% dry matter)
crude protein46.0546.1546.2646.3646.4646.57
crude lipid10.0810.0910.1010.1110.1310.14
Ash7.077.127.177.227.277.32
Gross energy (MJ kg−1) 318.4018.4318.4618.4818.5118.54
1 vitamin and mineral premix Provided by Shenzhen Jingji Zhinong Times Co., Ltd. (mg kg−1 diet): Vitamin A ≥ 450,000 IU/kg, Vitamin B1 ≥ 1000 mg/kg, Vitamin B2 ≥ 1000 mg/kg, Vitamin B6 ≥ 1500 mg/kg, Vitamin B12 ≥ 5 mg/kg, Vitamin K3 ≥ 800 mg/kg, inositol ≥ 12,000 mg/kg, D-Pantothenic acid ≥ 3500 mg/kg, nicotinic acid ≥ 2000 mg/kg, folic acid ≥ 500 mg/kg, D-Biotin ≥ 5 mg/kg, Vitamin D3 300,000~400,000 IU/kg, Vitamin E ≥ 8000 IU/kg, Na2SeO3 20 mg, CuSO4·5H2O 24 mg, FeSO4·H2O 266.65 mg, ZnSO4·H2O 100 mg, MnSO4·H2O 120 mg, Ca (IO3)2 50 mg, CoSO4·7H2O 10 mg, Mg 20g, zeolite 4380.55 mg. 2 YueHao Biotechnology (Guangzhou) Co., Ltd. 3 Energy equivalents of 23.64, 39.54, and 17.15 kJ g1 for protein, fat, and digestible carbohydrates, respectively, were used to compute gross energy. LEF0 (0 g kg−1), LEF1 (10 g kg−1), LEF2 (20 g kg−1), LEF3 (30 g kg−1), LEF4 (40 g kg−1), LEF5 (50 g kg−1).
Table 2. Effects of LEF on growth performance, feed utilization and morphological index of largemouth bass.
IndexesLEF0LEF1LEF2LEF3LEF4LEF5
IBW (g)28.8 ± 0.0428.8 ± 0.0428.8 ± 0.0428.8 ± 0.0428.8 ± 0.0428.8 ± 0.04
FBW (g)64.58 ± 3.09 ab62.99 ± 2.21 ab68.24 ± 2.44 a64.51 ± 1.45 ab59.82 ± 3.35 b64.04 ± 1.82 ab
WGR (%)123.99 ± 10.70 ab118.49 ± 7.65 ab136.74 ± 8.43 a123.77 ± 5.01 ab107.50 ± 11.63 b122.13 ± 6.32 ab
SGR (%day−1)1.34 ± 0.08 ab1.30 ± 0.06 ab1.43 ± 0.06 a1.34 ± 0.04 ab1.21 ± 0.09 b1.33 ± 0.05 ab
FCR1.45 ± 0.141.37 ± 0.061.42 ± 0.111.29 ± 0.021.40 ± 0.051.40 ± 0.06
CF (%)1.85 ± 0.03 ab1.84 ± 0.02 ab1.88 ± 0.03 ab1.93 ± 0.03 a1.84 ± 0.05 ab1.82 ± 0.03 b
VSI (%)5.57 ± 0.095.18 ± 0.175.37 ± 0.135.36 ± 0.175.31 ± 0.145.53 ± 0.11
HSI (%)1.48 ± 0.071.38 ± 0.071.52 ± 0.071.52 ± 0.091.52 ± 0.091.54 ± 0.06
SR (%)89.38 ± 2.7790.63 ± 0.6390.00 ± 5.2091.88 ± 1.5791.25 ± 2.3988.75 ± 2.39
IBW: initial body weight; FBW: final body weight; WGR: weight gain rate; SGR: specific growth rate; FCR: feed conversion coefficient; CF: conditional factor; VSI: viscerosomatic index; HSI: hepatosomatic index; SR: survival rate. Means in the same raw with different superscripts are significantly different (mean ± SD; ANOVA, p < 0.05; n = 4). LEF0 (0 g kg−1), LEF1 (10 g kg−1), LEF2 (20 g kg−1), LEF3 (30 g kg−1), LEF4 (40 g kg−1), LEF5 (50 g kg−1).
Table 3. Effect of LEF on intestinal morphology of largemouth bass.
IndexesLEF0LEF1LEF2LEF3LEF4LEF5
Villus number 27.75 ± 0.8528.25 ± 1.9729.00 ± 2.2728.25 ± 1.7129.75 ± 1.4930.25 ± 0.62
Muscularis (um)106.08 ± 4.12 b103.51 ± 8.93 b114.79 ± 7.27 ab104.18 ± 5.91 b116.48 ± 7.68 ab128.64 ± 5.15 a
Goblet cell number11.78 ± 1.42 b15.11 ± 1.23 ab13.89 ± 2.87 b14.72 ± 1.68 ab15.28 ± 2.252 ab20.25 ± 1.42 a
Villus length (um)613.75 ± 17.67 ab634.52 ± 30.79 a597.31 ± 24.78 ab583.57 ± 15.44 ab536.88 ± 32.68 b636.95 ± 23.53 a
Means in the same raw with different superscripts are significantly different (mean ± SD; ANOVA, p < 0.05; n = 4). LEF0 (0 g kg−1), LEF1 (10 g kg−1), LEF2 (20 g kg−1), LEF3 (30 g kg−1), LEF4 (40 g kg−1), LEF5 (50 g kg−1).
Table 4. Effect of LEF on intestinal microbiota α-diversity of largemouth bass.
DietsSobChao1ACEShannonSimpsonGoods-Coverage
LEF0255.00 abc341.48321.342.300.5999.94
LEF1321.00 ab376.04389.522.960.7499.94
LEF2217.67 bc285.29279.941.910.5599.94
LEF3226.00 abc297.42315.242.130.5299.94
LEF4334.67 a396.91381.502.140.5399.94
LEF5207.00 c283.75281.521.810.5999.94
Means in the same raw with different superscripts are significantly different (mean ± SD; ANOVA, p < 0.05; n = 4). Sob: Number of species observed in sample, Chao1: The number of OTU in the community was estimated by Chao1 algorithm, and the value of Chao1 was positively correlated with the total number of species], ACE: An index used to estimate the number of OTUs in a community and the ACE values positively correlated with the richness of the microbial community, Shannon: The index takes into account the abundance and evenness of the community, and its value is positively correlated with the richness and evenness of the community, Simpson: The index was used to estimate microbial diversity in samples, and the values were negatively correlated with community diversity. LEF0 (0 g kg−1), LEF1 (10 g kg−1), LEF2 (20 g kg−1), LEF3 (30 g kg−1), LEF4 (40 g kg−1), LEF5 (50 g kg−1).
Table 5. Relative abundance of intestinal microbiota (Phylum) of largemouth bass.
PhylumLEF0LEF1LEF2LEF3LEF4LEF5
Fusobacteria46.1336.4355.434.4153.3139.14
Tenericutes6.2121.3416.5364.2522.9511.27
Firmicutes23.5223.1019.943.336.6525.02
Proteobacteria13.8715.702.5722.4612.6423.76
Bacteroidetes7.692.284.653.583.110.34
LEF0 (0 g kg−1), LEF1 (10 g kg−1), LEF2 (20 g kg−1), LEF3 (30 g kg−1), LEF4 (40 g kg−1), LEF5 (50 g kg−1).
Disclaimer/Publisher’s Note: The statements, opinions and data contained in all publications are solely those of the individual author(s) and contributor(s) and not of MDPI and/or the editor(s). MDPI and/or the editor(s) disclaim responsibility for any injury to people or property resulting from any ideas, methods, instructions or products referred to in the content.

