Article

New Organic Raw Materials for Gilthead Seabream (Sparus aurata) Feeding and the Effects on Growth, Nutritive Parameters, Digestibility, and Histology

by
Eslam Tefal
1,2,*,
Ignacio Jauralde
1,
Ana Tomás-Vidal
1,
Silvia Martínez-Llorens
1,
David S. Peñaranda
1 and
Miguel Jover-Cerdá
1
1
Aquaculture and Biodiversity Research Group, Institute of Science and Animal Technology (ICTA), Universitat Politècnica de València, 46022 Valencia, Spain
2
Department of Animal and Poultry Production, Faculty of Agriculture, Damanhour University, Damanhour 22516, Egypt
*
Author to whom correspondence should be addressed.
Fishes 2023, 8(6), 330; https://doi.org/10.3390/fishes8060330
Submission received: 30 April 2023 / Revised: 13 June 2023 / Accepted: 17 June 2023 / Published: 20 June 2023

Abstract

:
A 120-day experiment investigated the new organic raw materials for Gilthead seabream (Sparus aurata) feeding on growth, nutritional parameters, digestibility, and histology. An organic control diet (CON) and three diets with 100% organic raw materials—the rest of rainbow trout, visceral Iberian pig, and insects as a protein source (TRO, IBE, and INS)—were tested. After the experiment, growth, nutritional parameters, digestibility, and histology were measured. The CON diet-fed seabream obtained the highest weight; there was no difference between the experimental diets. The crude protein content was the highest in seabream fed the TRO and INS diets. Crude fat was the highest value observed in the CON diet. High digestibility was observed in seabream-fed IBE and INS diets. Except for EAA methionine (Met), there were no static differences in retention efficiency. The diet with the highest hydrolysis rate was IBE. Diet differences were significant but had the typical healthy liver morphology of seabream. Seabream fed on the TRO and INS diets had shorter distal gut measurements. In conclusion, the full substitution of fishmeal with organic raw materials, including rainbow trout remains, Iberian pig viscera, and insects, offers several benefits in terms of digestibility, histology, and growth performance and may help improve sustainable and healthy aquaculture practices.
Key Contribution: Replacing fishmeal with organic raw materials such as rainbow trout remains, visceral Iberian pigs, and insects can improve the digestibility, histology, and growth performance of gilthead seabream. Valuable insights into the effects of different organic diets on digestibility and seabream liver and gut morphology, which can help enhance sustainable and healthy aquaculture practices.

Graphical Abstract

1. Introduction

Organic aquaculture is a rapidly growing sector that focuses on sustainability, animal welfare, and reducing environmental impact. Organic production involves a combination of traditional methods, modern technology, and scientific knowledge to protect the environment, support fair and equitable relationships, and improve quality of life. Organic fish farming aims to reduce antibiotics, pesticides, and synthetic fertilizers, among other things, and promote natural inputs [1]. In the 27 European Union (EU) countries, the organic production of European sea bass and gilthead seabream in 2020 was 2750 tons, representing only 1.5% of the total production of these species [2]. The European Market Observatory for Fisheries and Aquaculture (EUMOFA) states that the primary obstacles to organic aquaculture include the general lack of growth, insufficient innovation, and increased costs, particularly regarding organic feed [2]. To be considered organic certified production, the feed must be produced from: by-products of other organic aquaculture species; organic plant production; trimmings and by-products; fishmeal; and fish oil from certified fisheries, according to EU Regulation 1380/2013.
The demand for certified organic feed ingredients for aquaculture is much higher than the supply worldwide, leading to elevated prices and high production costs [3]. Although revised EU regulations now allow fishmeal and fish oil derived from sustainable fisheries, other alternative feed ingredients with high levels of essential amino acids (EAA) and lipids are still required. According to Gambelli et al. [4], it is suggested that enhanced research in aquafeed is necessary to improve the competitiveness of organic fish farming and foster the future growth of organic aquaculture. As such, replacing fishmeal with alternative protein sources in organic aquaculture feeds is particularly interesting. Alternative protein sources can totally or partially replace fishmeal (FM) in aquaculture diets, reducing feed costs and improving sustainability [5].
With various degrees of success, the replacement of FM in aquaculture diets with various soy products, such as soybean meal, soy protein concentrate, and soy protein isolate, has been described [6,7]. Animal protein by-products, such as poultry by-product meal (PBM), have been studied as a partial or total replacement for FM in aquaculture diets due to the increasing cost and limited availability of FM [8]. Aquaculture protein by-products are a cost-effective and sustainable alternative to traditional fishmeal-based feeds. In addition to reducing the environmental impact of fish processing, these by-products can also help reduce the pressure on wild fish stocks harvested for fishmeal production. A few studies have explored aquaculture protein by-products in aquaculture feed [9,10,11,12]. Li et al. [12] evaluated using a mixture of shrimp hydrolysate and plant proteins in diets for largemouth bass. The results showed that the combination could replace up to 30% of the FM in the diet without negatively impacting growth performance [12]. Similarly, a study by Gunathilaka et al. [11] investigated the use of shrimp protein hydrolysate and krill meal in the diets of red seabream (Pagrus major). The results showed that incorporating shrimp protein hydrolysate into the red seabream diet can decrease FM usage by up to 20% [11]. Previous studies evaluated the use of fish protein hydrolysate (FPH) in the diets of Nile tilapia. The results showed that the use of 10% FPH gave the highest growth performance, feed utilization, and protein utilization [10].
Gilthead seabream (Sparus aurata) is a notable species of farmed fish in the Mediterranean countries, with an annual global production of approximately 282.1 thousand metric tons in European countries [13]. Despite implementing new nutritional strategies that have reduced the use of fishmeal in seabream diets, it is still necessary to minimize fishmeal levels to improve aquaculture sustainability, and certified organic production continues to be a testimonial. Research on organic farming of gilthead seabream is scarce, and most studies focus on growth performance, welfare, and quality aspects compared to conventional farming [14,15,16]. A study on an industrial scale found differences in growth performance, metabolic status, and fillet composition between organically produced fish and conventional ones, indicating the need for more research to improve organic feed formulation [17]. On the other hand, it was reported by Estevez et al. [3] that to evaluate new organic ingredients, such as green pea protein and brown seaweed, to replace fish meals in feeds suitable for organic production. No adverse effects were observed on fish growth, their muscles’ composition, health, quality, or nutritional value [3].
Improving the sustainability of aquaculture through the organic substitution of fishmeal is an important goal that must be reached as soon as possible. Success in achieving this goal must ensure that such substitution does not harm the performance or efficiency of the growth of gilthead seabream.

2. Materials and Methods

2.1. Ethics Approval

Following Royal Decree 53/2013 and the European Directive 2010/63/EU on the protection of animals used for scientific research, the experimental protocol was reviewed and approved by the Ethics and Animal Welfare Committee of the Universitat Politècnica de València (Official Bulletin No. 80 of 06/2014) to minimize the suffering of animals.

2.2. Experimental Conditions

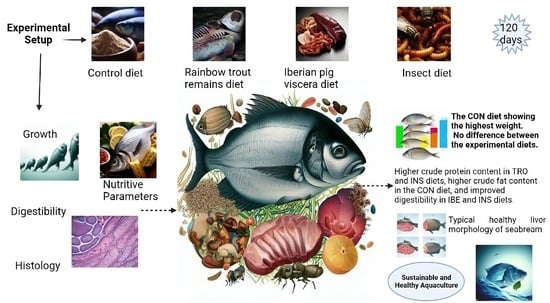
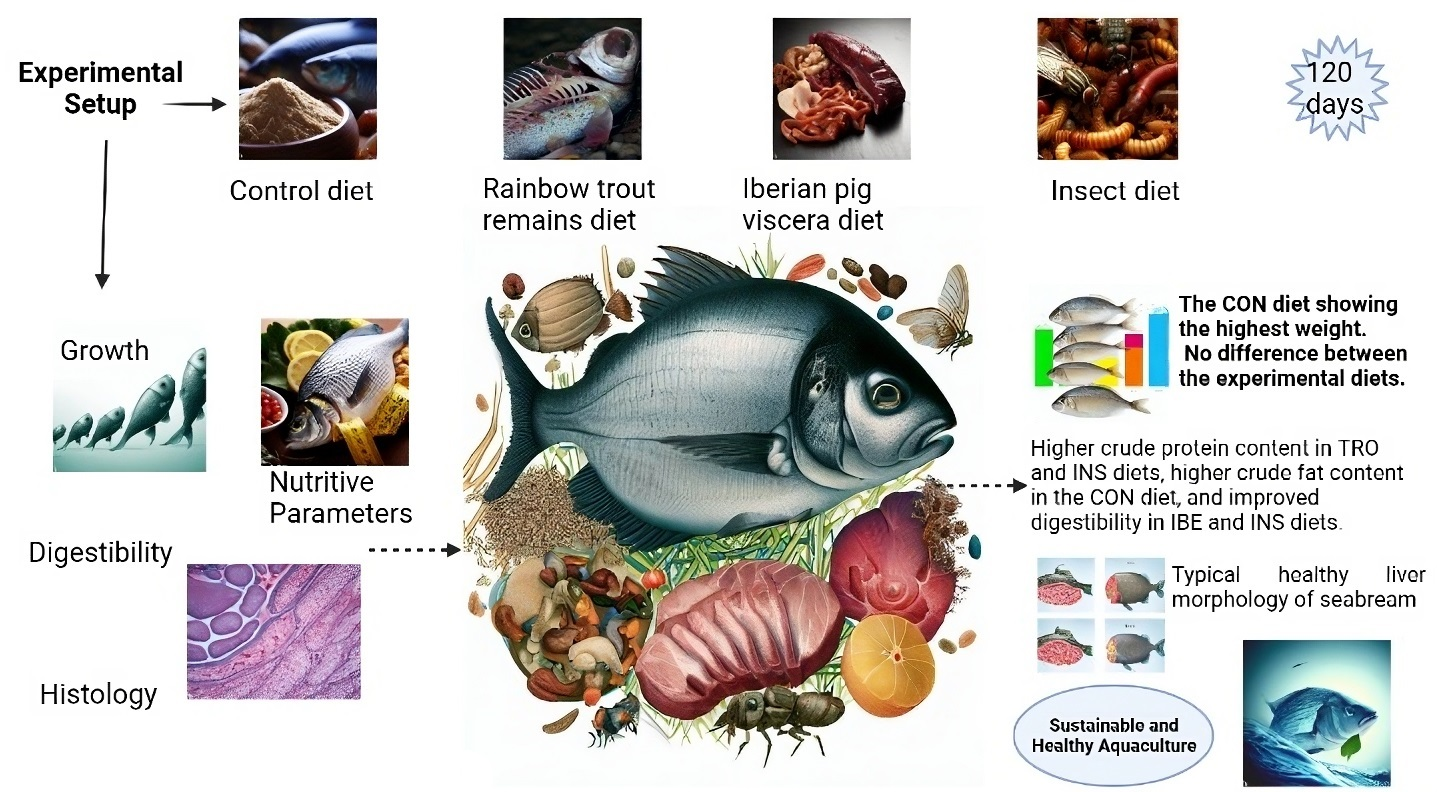
Four different diets were fed to the seabreams for 120 days. In total, 300 fish with an average mean weight of ~93 ± 3.82 g and an average mean length of 16 ± 1.6 were used and were distributed in 12 concrete tanks of 4000 L each with octagonal-shaped tanks.
The experiment was carried out on the Animal Science Department of the Polytechnic University of Valencia (UPV) farm from August to November 2021, after ten days of adaptation for the seabream, which weighed an average of ~93 ± 3.82 g. The trial was within a saltwater recirculating system of 75 m3 of capacity with a rotary mechanical filter and a 6 m3 capacity gravity biofilter, with 25 animals in each tank.
Feeding was done manually until apparent satiety, twice daily, at 09:00 and 16:00, six days a week, from Monday to Saturday. Additionally, throughout the experiment, the physical and chemical parameters of the tanks were monitored: dissolved oxygen 8.7 ± 1.6 mg L−1, temperature 21 ± 1 °C, ammonium level 0.22 mg L−1, nitrates 104.2 mg L−1, nitrites 0.38 mg L−1, salinity 33.3 ± 2.4 g L−1, and pH 7.49. The photoperiod was natural (~12.5 h) (August to November 2021), and the lighting in each tank was the same.

2.3. Experimental Diets

The diets were manufactured at the Universitat Politècnica de València (UPV) facilities using a Clextral BC45 semi-industrial extruder using the cooking-extrusion process (CLEXTRAL BC-45, St. Etienne, France). Four diets were tested in triplicate: the CON diet, with FM as a protein source; the TRO diet, with FM coming from organic trout remains after processing; the INS diet, which uses organic insect meal instead of FM; and the IBE diet, which contains organic Iberian pig viscera to replace FM (Table 1). The replacement of fishmeal was 100% in all experimental diets.
The following processing parameters were used: a screw speed of 100 rpm, a pressure range of 40–50 atm, and a temperature of 110 °C. Organic raw materials formulated the four extruded diets (Table 1). All the organic ingredients come from organically certified producers with the EU organic label. Trout was self-processed to extract the meat slices, and just the remaining parts were carefully cut, oven-dried, and ground into a suitable form for use in the feed. The remaining parts used for the Iberian pig meal were the liver, intestines, and heart, which were cut into small pieces. After oven drying, they were ground into a suitable form for incorporation into the feed. The insect component, larval insects, was utilized. They were already dried and then ground for inclusion in the diets. The level of inclusion of the TRO, IBE, and INS was sufficient to replace fishmeal and maintain the total protein constant. The diets were supplemented with sustainable supplies of vegetable methionine and calcium phosphate. Dietary formulation and processing using organic raw components labeled and approved following Regulation (EU) 2018/848 [18]. Once completed, they were packaged and stored in a commercial refrigerator at 4 °C.

2.4. Growth Control

The fish were monitored daily in tanks and weighed every 30 days while anesthetized with clove oil containing 87% eugenol (Guinama®, Valencia, Spain) in 150 mg L−1 of water. This was done to assess fish growth throughout the experiment, establish growth parameters, and determine the health of the fish. The fish were not fed the day before being weighed. Five fish were sampled at the beginning of the experiment and kept at −30 °C for further analysis of total body composition. At the end of the study, ten animals in each tank were sampled to evaluate biometric parameters. Three fish from each tank (to ensure we have representative samples for analysis) were randomly selected for sampling and pooling to determine the approximate composition and amino acids.

2.5. Analysis of Nutritional Composition and Amino Acids

The whole body of the fish and the composition of the diets were examined using the procedures outlined in AOAC (Association of Official Analytical Chemists) [19]: dry matter (105 °C to constant weight), ash (incinerated at 550 °C for five hours), crude protein (determined using the direct combustion method DUMAS using LECO CN628, Geleen, The Netherlands), and crude lipid. Diets are extracted with methyl ether using the ANKOMXT10 extractor (Macedon, NY, USA). Each analysis was carried out three times. The procedure previously described by Bosch et al. [20] was used to analyze the AA of diets and body fish. A Waters HPLC system (Waters 474, Waters, Milford, MA, USA) consisting of two pumps (Model 515, Waters), an autosampler (Model 717, Waters), a fluorescence detector (Model 474, Waters), and a temperature control module was used.
Aminobutyric acid was first introduced as a standard internal pattern prior to hydrolysis. The AA was derivatized using AQC (6-aminoquinolyl-N-hydroxysuccinimidyl carbamate). Methionine and cysteine were recognized as methionine sulphone and cystic acid, respectively, following oxidation with performic acid. After being separated with a reverse-phase C-18 column by Waters Acc, the tag AA was changed to methionine and cystine (150 mm, 3.9 mm). The EAA content of the experimental diets is indicated in Table 2. Amino acid tests were performed in duplicate on every sample.

2.6. Indices of Growth and Biometric Parameters

With the sampling carried out, it was possible to obtain data on the weight of the individuals, the number of fish in each tank, and their total biomass. Growth and nutrient efficiency indices, such as final weight (FW), specific growth rate (SGR), survival (S), feed intake (FI), and feed conversion ratio (FCR), were calculated at the end of the study, considering the tank as an experimental unit.
Ten fish were randomly selected from each tank to obtain the biometric parameters. The fish were anesthetized with clove oil containing 87% eugenol (Guinama®, Valencia, Spain) in 150 mg/L−1 of water. Total length (cm), total weight (g), liver weight (g), carcass weight (g), and visceral fat weight (g) were measured to obtain the visceromatic index (VSI), hepatosomatic index (HSI), visceral fat index (VFI), and condition factor (CF).

2.7. Digestibility Assay

After the growth experiment, another experiment was conducted in another system prepared to estimate the digestibility of different diets for gilthead seabream. The study was conducted at the Animal Science Department of the Polytechnic University of Valencia (UPV) farm using a semi-closed marine recirculating system with 190-L fiberglass tanks; each trial lasted 30 days. Faecal material was collected in a settling column, dried in an oven, and analyzed for its nutritional content and inert markers. Chromic oxide (5 g kg−1) was used as an indigestible marker to assess the apparent digestibility of the diets. Dry matter, crude protein, energy, calcium, and phosphorus were also analyzed using the same methods. The apparent digestibility coefficients (ADCs) were calculated for each diet, and the results were compared to determine the most digestible diet [21]. The following formulas were used to estimate the ADC of diets for dry matter (ADCdm, %):
ADCdm % = 1 − (% Cr2O3 in diet/% Cr2O3 in feces).
The following equations determined the percentage ADCs of every dietary nutrient, including calcium, phosphorus, protein, and energy:
ADCnut = 1 − (marker diet/marker feces) × (nutrient feces/nutrients).
In this equation, the variables “nutrient diet (g/kg)” and “nutrient feces (g/kg)” represent the relevant nutritional components of the diet and feces, such as protein or energy. Marker levels of the diet and feces are indicated by the measurements “marker diet” (g/kg) and “marker feces” (g/kg), respectively.

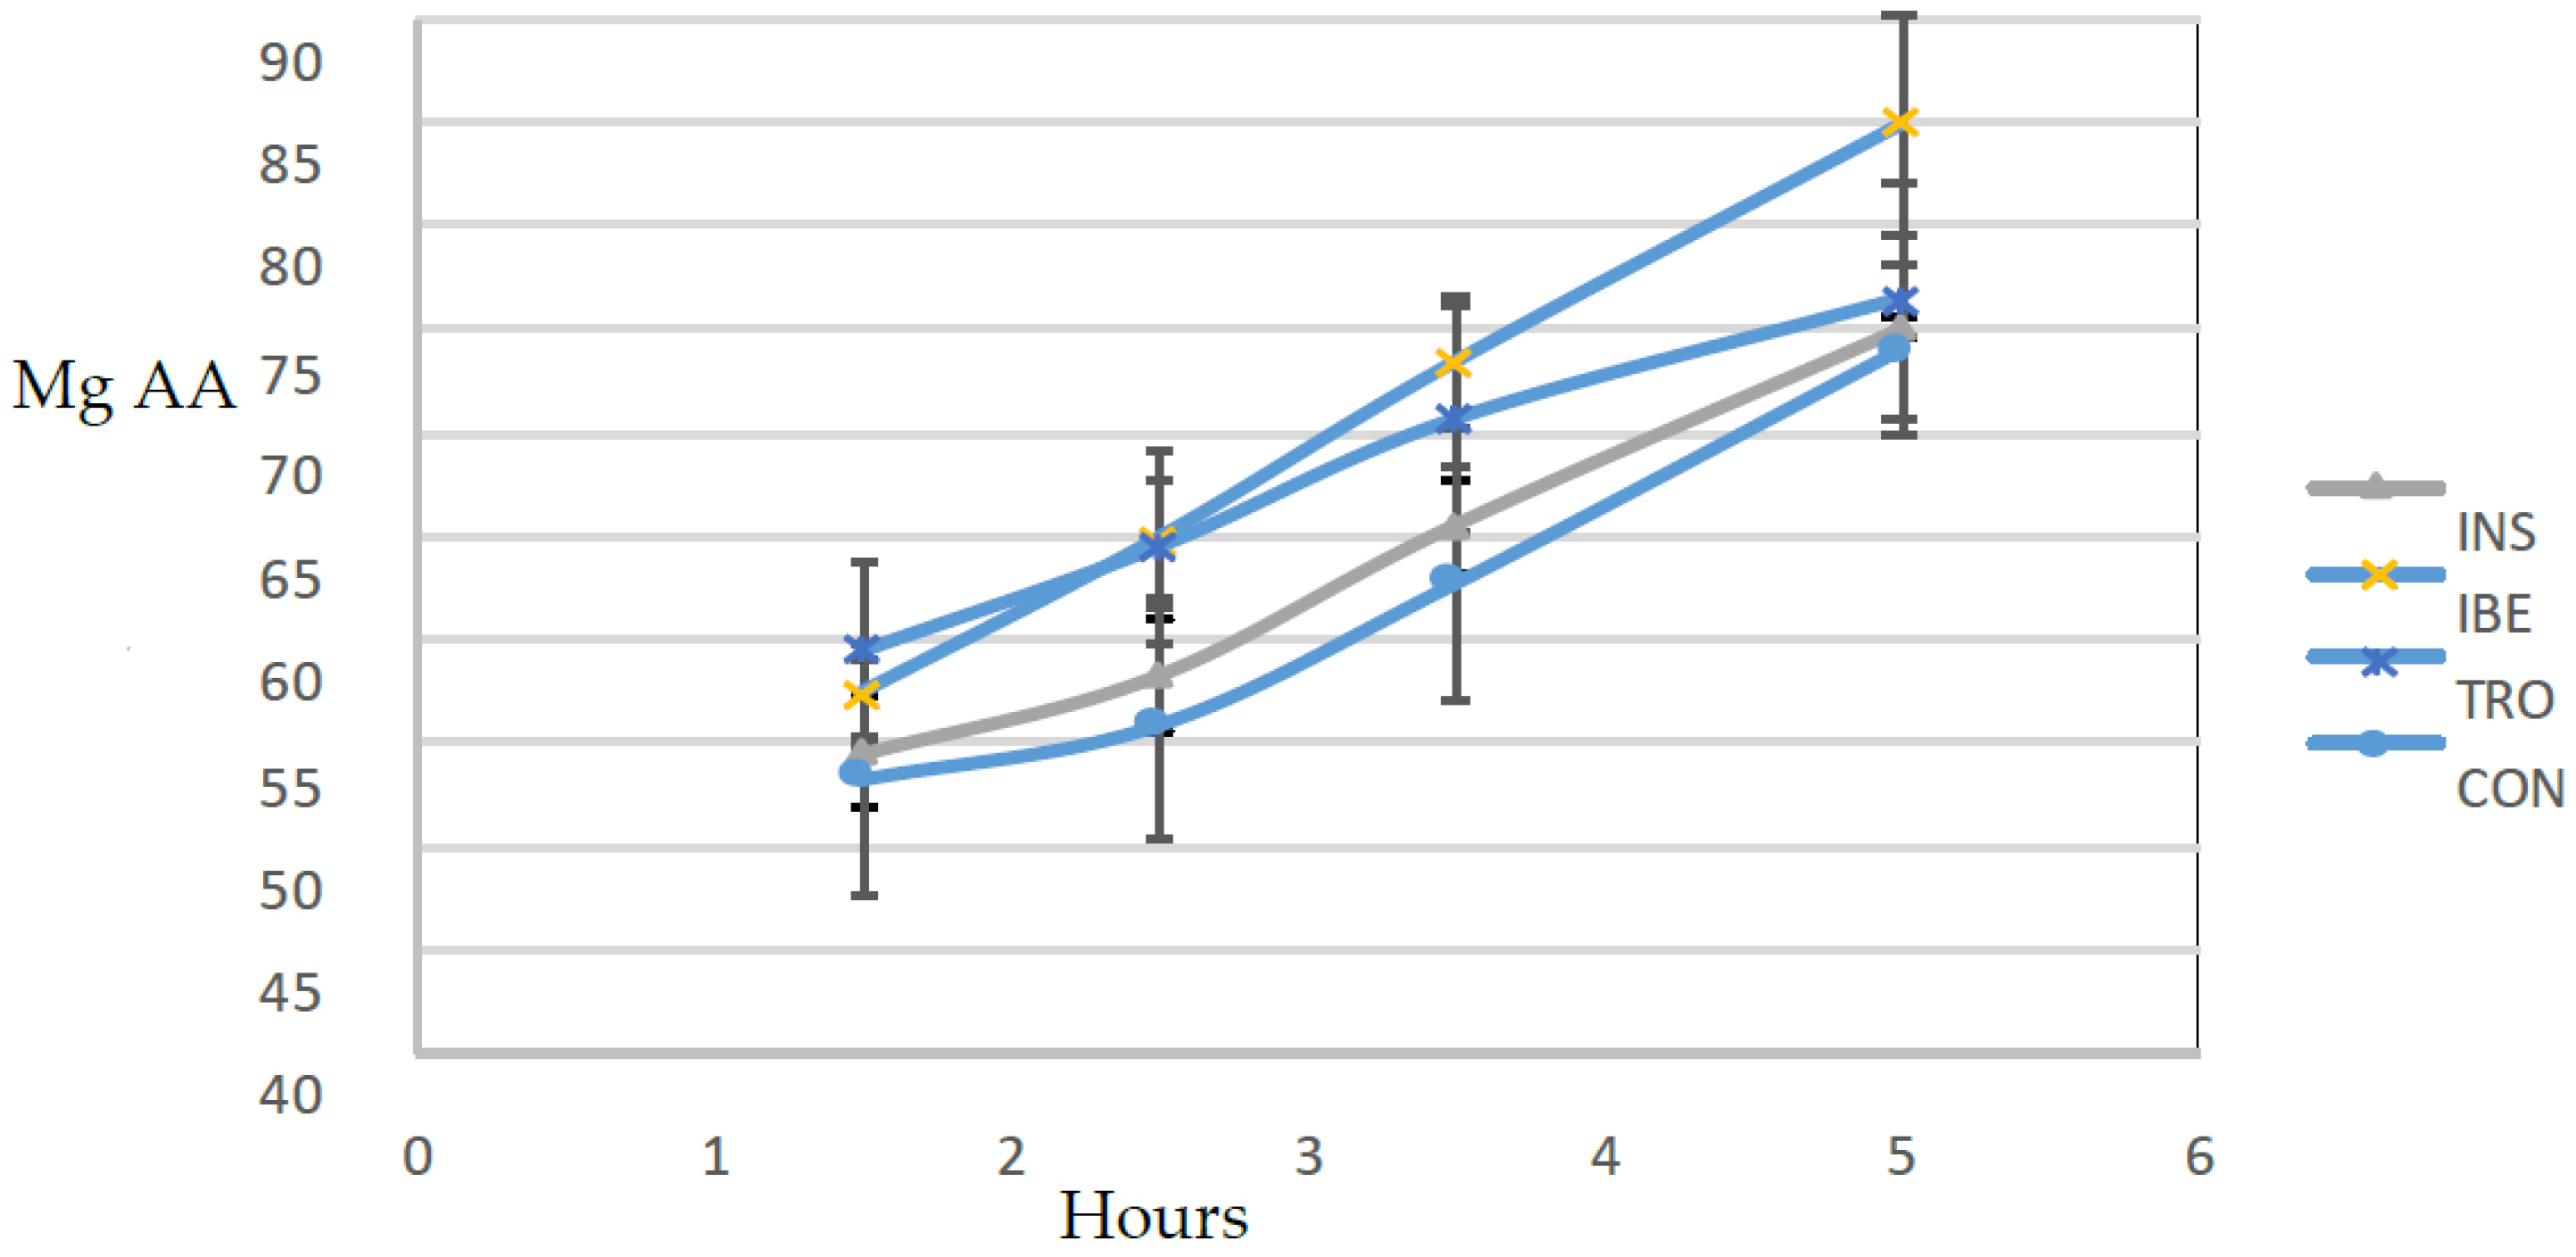
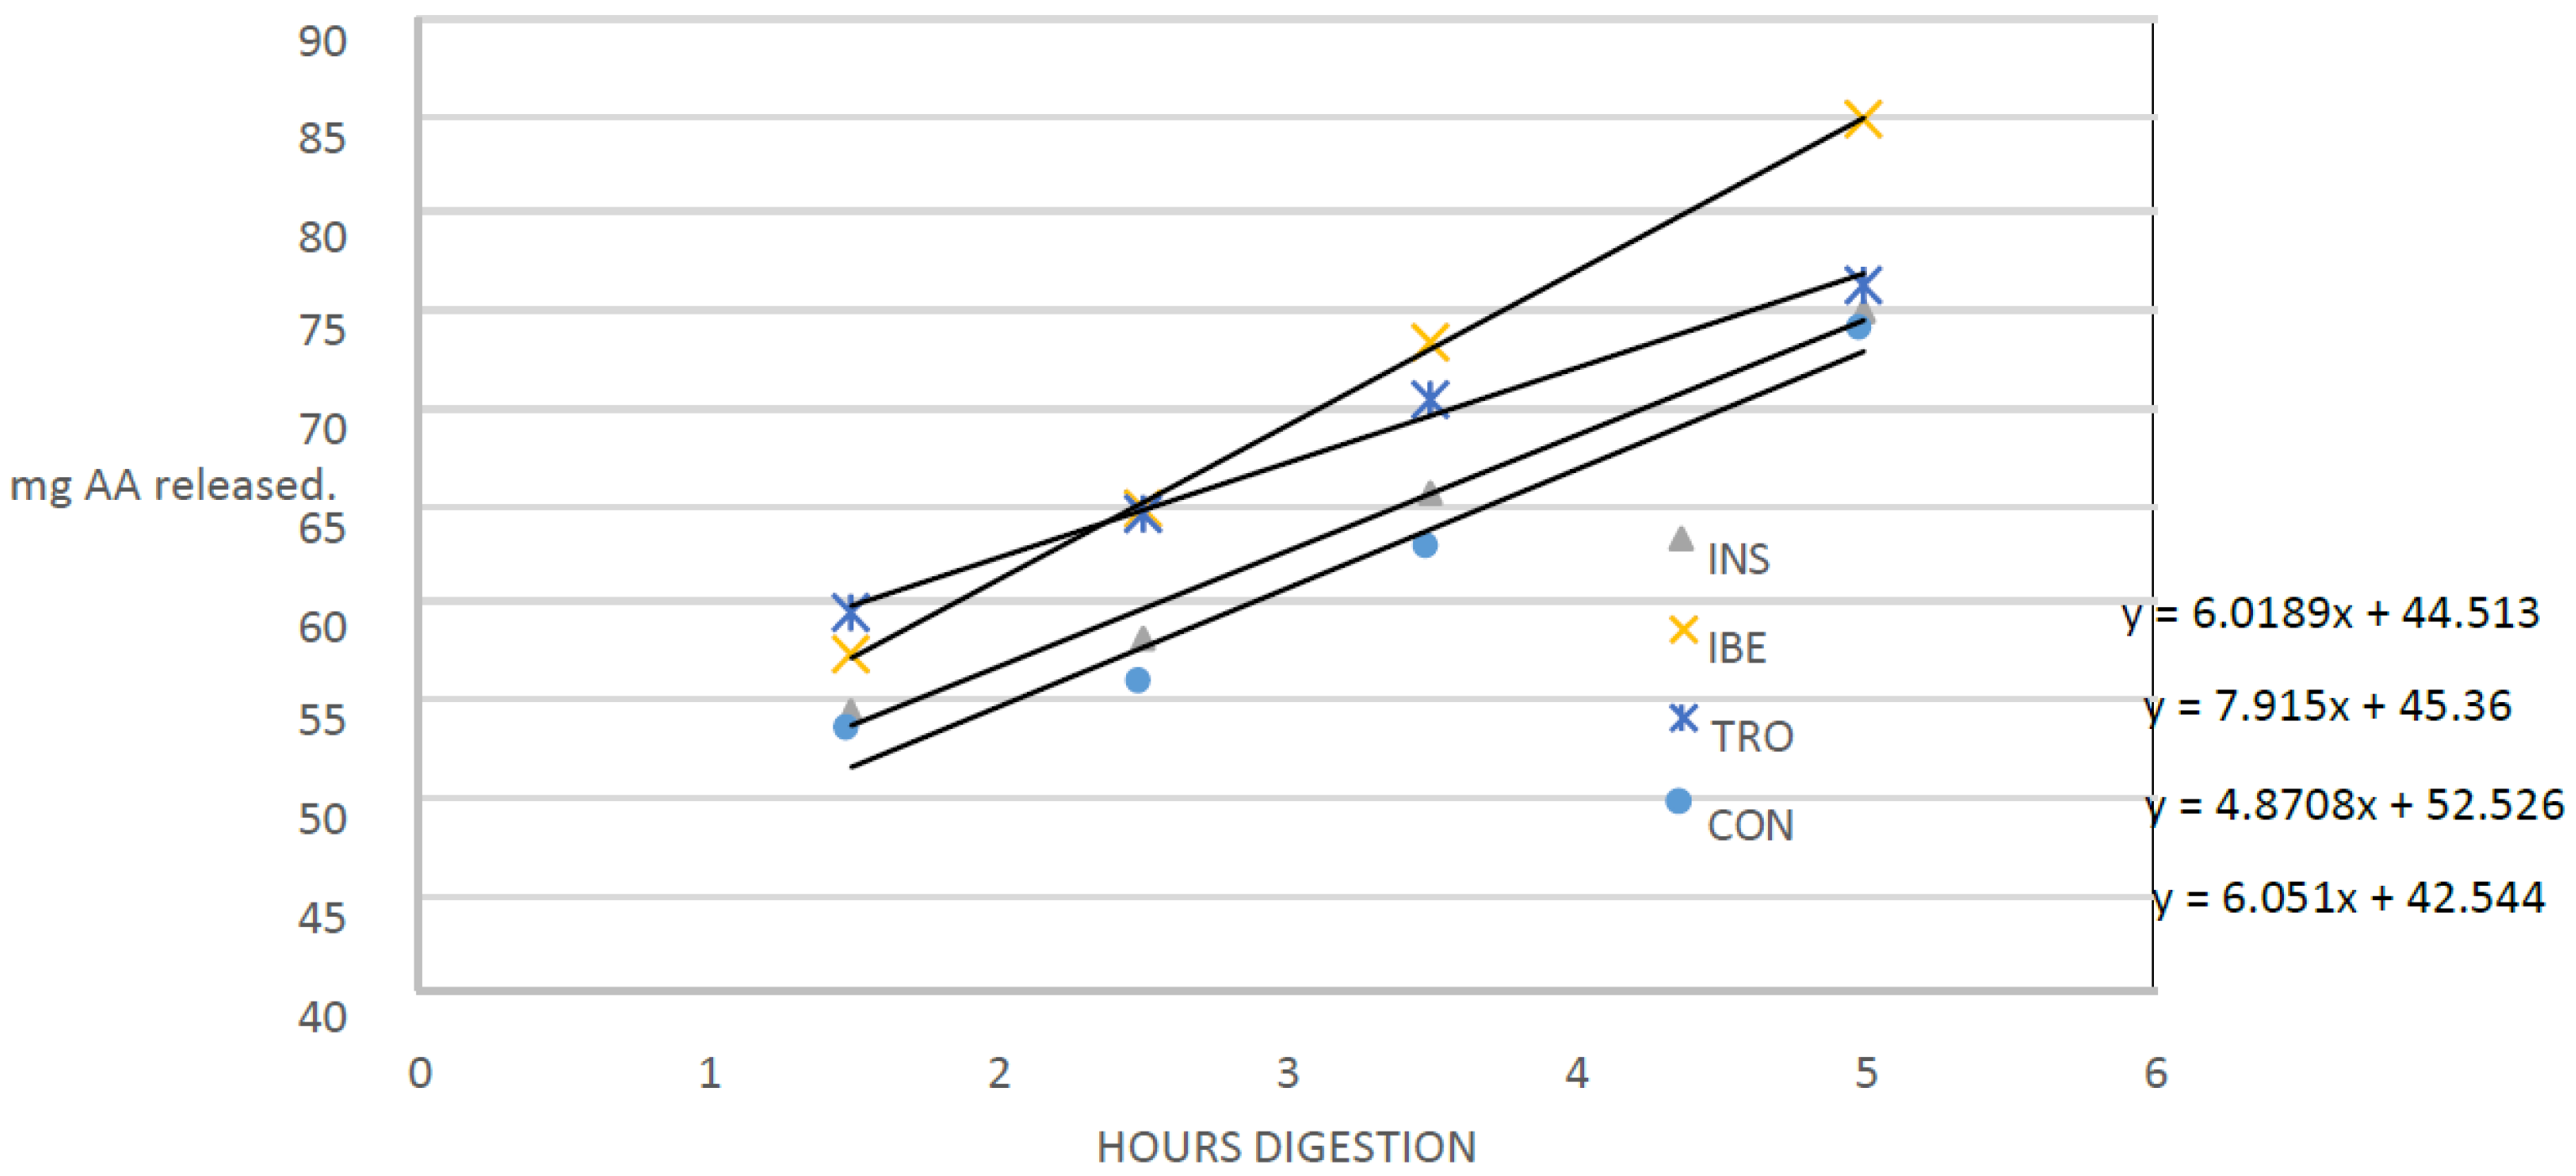
2.8. In Vitro Hydrolysis Assay

Conditions that simulated the digestive tract of juvenile gilthead seabream were used to conduct an in vitro hydrolysis test [22]. Six hours after feeding, samples of seven juvenile gilthead seabream were taken, each weighing an average of 256 g, to confirm the presence of digestive and intestinal-related enzymes. The fish were euthanized by immersing them in ice-cold water with a small amount of clove oil as an anesthetic. They were then promptly dissected to obtain the digestive tract. The digestive tract was divided into two sections: 1—the proximal intestine, which included the diffuse pancreas and the pyloric caecum; and 2—the stomach. The tissues were used to produce the extracts to measure proteases and amylase activities following the conditions shown in Table 3.
An assay was carried out for each diet in triplicate plus a blank. The blank was constructed by inactivating the enzymatic extracts with heat before their inclusion in the bioreactors. It allowed quantifying the amount of amino acids in the extracts and diet. That is released by solubilization and not by enzymatic hydrolysis.

2.9. Liver and Intestinal Histology

After the growth experiment, the liver and distal intestine (DI) were dissected from the guts of three fish; each tank was fed experimental diets. Samples were kept in formalin buffered with phosphate (4%, pH 7.4).
Following standard histological practices, all formalin-fixed tissues were systematically dehydrated in ethanol, equilibrated under ultra-clean conditions, and embedded in paraffin. Transverse sections of each paraffin block were cut using a Shandon hyper-cut microtome and then stained with hematoxylin and eosin for analysis. An Eclipse E400 Nikon light microscope from Izasa S.A. in Barcelona, Spain, was used to analyze 100 sections of the distal intestine and 400 sections of the liver. Hepatocytes and their nuclei were examined and their diameters measured to evaluate the effect of diet on the liver. We evaluated villus length (VL), villus thickness (VT), lamina propria (LP), muscle layer (ML), submucous layer (SML), and serous layer (SL).

2.10. Statistical Analysis

Using the Statgraphics® Plus 5.1 statistical program (Statistical Graphics Corp., Rockville, MO, USA), the results of various growth and nutrient indices, biometric indices, retention of AA, ADC, in vitro hydrolysis, and histological measurements were analyzed using an analysis of variance with a Newman-Keuls test for the comparison of means. Initial covariate weights were used for the study of growth indices. The findings are represented as the mean ± standard error (SEM). The significance level was established at p < 0.05.

3. Results

3.1. Growth and Nutritional Parameters

The final weight of fish (FW), the specific growth rate (SGR), the survival, feed intake (FI), and the FCR of gilthead seabream fed experimental diets are shown in Table 4. The initial weight of the gilthead seabream ranged from 89.1 to 96.5 g. At the end of the experiment, the CON diet reached a higher FW (328.4 g), whereas the rest of the diets reached a similar FW, around 250 g. The rest of the parameters did not present significant differences. The survival rate of sea bass ranged from 78.6% to 91.9%, and FI ranged from 1.65 to 2.0 g 100 g−1 fish day−1.

3.2. Body Composition, Retention Efficiency, and Biometric Indices

The nutritional composition of the whole body and the retention efficiency of protein and fat are shown in Table 5. The results show that the initial dry matter was 31.3, which increased after feeding with all experimental diets. The protein content decreased in all experimental groups. The protein content was the highest in gilthead seabream fed the TRO and INS diets (52.5 and 50.6%, respectively) and the lowest in the CON diet (47.2%). The fat content increased in all experimental diets, with the highest value observed in the CON diet (43.7%). No differences were found in the ash content.
Protein and fat retention efficiencies of gilthead seabream for protein and fat were also measured. Productive protein value (PPV) did not present a difference for the different diets, but productive fat value (PFV) was statistically higher for the CON and INS diets.
Regarding biometric parameters in Table 6, no differences were observed in VSI. HSI had the lowest value in the TRO group (1.4) and the highest in the CON and INS groups (2.1 and 2.0, respectively). The CF was highest in the CON diet (2.2) and lowest in the IBE diet (1.89). The VFI was high in the IBE diet (1.9).

3.3. Digestibility

The results indicate the ADC values of varied diets for dry matter, calcium, phosphorus, gross protein, and gross energy (Table 7). For dry matter, the highest ADC value was observed in the IBE diet (85.8%), followed by INS (83.0%) and TRO (74.7%), while the lowest value was recorded in the CON diet (63.8%). Calcium ADCs were the highest in the INS diet (55.5%), followed by the TRO and CON diets (51.5% and 37.8%, respectively), while the lowest value was recorded in the IBE diet (35.0%). For phosphorus, the ADC values ranged from 69.8% to 73.2%, with no significant differences between diets. For gross protein, the highest ADC value was observed in the INS diet (93.0%), followed by IBE (91.7%), TRO (88.5%), and CON (84.2%). Gross energy ADCs were the highest in the INS and IBE diets (90.2% and 90.0%, respectively), followed by TRO (84.6%) and CON (78.4%).

3.4. Retention Efficiency of Essential Amino Acids

Table 8 shows the ability of the fish to retain EAA. Except for EAA methionine (Met), there were no static differences in the retention efficiency of EAA in gilthead seabream-fed experimental diets. The retention efficiency of Met was highest in gilthead seabream fed the INS diet (36.8%), significantly higher than the diets of CON, TRO, and IBE (26.1%, 21.5%, and 20.3%, respectively).

3.5. In Vitro Hydrolysis Assay

The results depicted in Figure 1. demonstrate the release of amino acids through the membrane following protein hydrolysis in the experimental diets. Notably, the hydrolysis values were found to be remarkably similar across all four diets that were evaluated.
The study investigated the dynamics of protein hydrolysis in experimental diets, and the findings, including linear equations and corresponding time points, are presented in Figure 2. The linear equations illustrate the relationship between the degree of protein hydrolysis (y) and the time elapsed for each diet (x). The slope of the equation reflects the rate of protein hydrolysis, while the intercept indicates the initial degree of hydrolysis at time zero. Notably, the rate of protein hydrolysis varied among the experimental diets.
The diet exhibiting the highest hydrolysis rate was IBE, with a slope value of 7.91. CON and INS followed closely, with slopes of 6.051 and 6.02, respectively. On the other hand, the diet with the lowest hydrolysis rate was TRO, with a slope of 4.87. Furthermore, the time points at which the degree of hydrolysis was measured differed across the diets. The IBE diet had the shortest time of 6.91 h, while the TRO diet had the longest time of 9.75 h.
These results highlight the variations in protein hydrolysis rates and the different time frames required for achieving specific degrees of hydrolysis among the experimental diets.
The liver histology results (Table 9) show that the nucleus and diameter of the hepatocytes varied between experimental diets. Differences between diets were statistically significant. The diet with the largest nucleus diameter was CON, with a mean value of 4.72 μm, followed by the IBE diet, with a mean value of 3.50 μm, while the diet with the minor nucleus diameter was TRO, with a mean value of 3.19 μm. Similarly, the diet with the largest hepatocyte diameter was CON, with a mean value of 12.46 μm, followed by the IBE diet with a mean value of 9.73 μm. In contrast, diets with a small diameter of hepatocytes were TRO and INS, with a mean value of 8.48 and 8.52 μm, respectively.
Regarding the liver histology study of each treatment (Figure 3), small, slightly granular nuclei with homogeneous morphology were observed. There was hardly any accumulation of lipids or displacement of the nucleus due to the vacuoles, presenting the typical morphology of a healthy gilthead seabream in all the treatments.
Table 10 shows the results of the distal gut measurements. The results show that the experimental diets had differential effects on the distal measures of the intestinal tract in gilthead seabream. The differences between diets were statistically significant. The diet with the highest SL was CON, with a value of 106 μm, while the diet with the smallest SL was TRO, with a value of 53 μm. Similarly, the diet with the highest SML and VL was CON, while the diet with the lowest values for these measurements was TRO and IBE.
However, the diet with the most significant ML, VT, and LP was CON IBE, with mean values of 146 μm, 218, and 63 μm, respectively, while the diet with the smallest values for these measurements was TRO and INS.
Among diets, there was a similar morphology typical of the intestine of gilthead seabream. No mucosal alterations or highly vacuolated enterocytes were observed, and all treatments had goblet cells, mainly at the base of the villi, another indication of healthy intestines (Figure 4).

4. Discussion

Improving organic fish’s growth and value is a critical research area, particularly in developing suitable feeds for organic farming. However, the need for appropriate raw materials ideal for creating well-balanced diets and EU regulations have been significant obstacles to producing organic carnivorous fish feeds, which have limited the growth of organic aquaculture production [23]. The focus on feed formulation for organic production has shifted to the search for alternative raw materials that can serve as good protein sources due to the scarcity of fishmeal. This has become crucial in meeting the growing demand for protein sources [24]. However, the optimal ratio of marine and plant-origin proteins [25], marine and animal by-products, and insects in organic aquaculture feed has yet to be established.
Furthermore, while organic marine and animal by-products and insects can be incorporated into feed to some extent, the effect on growth, feed utilization, digestibility, retention efficiency, and histology must also be considered.
Organic diets can substitute fishmeal without affecting the growth performance of gilthead seabream. However, the highest final weight was observed on the CON diet.
These results are consistent with previous studies that show better growth performance in organically reared fish than in conventionally reared fish [17]. However, the survival rates of the organic groups in this study were not significantly different from those of the conventional group, which differs from some previous studies that reported higher survival rates in organic fish.
It should be noted that the specific ingredients (remains of trout, visceral Iberian pig, and insects) used in the organic diets can significantly impact the growth and composition of fish, as demonstrated by the differences observed between the different organic and control diets in this study.
According to Di Marco’s studies [17] on the organic farming of European sea bass and gilthead seabream, researchers found that organic fish exhibited better growth performance, as indicated by their lower feed conversion ratio and higher metabolic status, supported by their protein and energy profiles and higher hepatosomatic index (HSI), but a lower mesenteric fat index and higher lipid content in organic European sea bass fillets. These differences were attributed to the composition of the feeds provided to the different groups, as shown in a similar study by Trocino et al. [16] on European sea bass and Mente et al. [14] on gilthead seabream.
Only a few studies have examined the substitution of fishmeal in organic diets, and most of them have focused on freshwater species. Lunger et al. [26,27] used organic yeast (NuPro) to replace up to 25% of FM in the cobia and tilapia feeds, respectively, and found that it did not affect the growth or feed conversion rate.
The FCR values obtained in this study indicate that fish could probably be fed slightly less while maintaining the same growth at the trial temperature. However, FCR is consistent with the temperature, growth, and feed intake shown.
Aquaculture and animal by-product protein-based ingredients in organic aquaculture have yet to be well studied. More research is needed to determine their effects on product quality and other aspects, such as histology and digestibility, in organic aquaculture. Further research is required to optimize the formulation of organic feed and evaluate the long-term effects of organic farming on fish health and growth.
Experimental organic diets positively affected the digestibility of dry matter, calcium, gross protein, and gross energy in gilthead seabream (Table 7). Some organic diets had higher apparent digestibility coefficients (ADC) for these nutrients than the CON diet, indicating that fish could better digest and utilize them. Previous studies have had different results on the effect of organic feeds on digestibility. For example, the study conducted by Amirkolaie et al. [28] revealed that substituting fishmeal with poultry by-product meal (PBM) reduced the digestibility of dry matter, fat, and protein in rainbow trout. Other studies, instead, reported that aquafeeds formulated with alternative protein sources had higher ADCs for protein and energy in various fish species, such as tilapia and catfish [8]. In general, these studies suggest that organic raw materials have the potential to improve the digestibility and utilization of nutrients in aquafeeds, which can lead to improved growth and health in farmed fish. However, digestibility is influenced by the raw ingredients and must be studied separately.
Studying the dynamics of protein hydrolysis in experimental diets for gilthead seabream is essential to aquaculture nutrition. The results of this study show that the rate of protein hydrolysis varied between the experimental diets, which indicates that different organic raw materials may have other effects on protein hydrolysis and subsequent nutrient availability. The current study provides new information on the impact of different organic raw materials on protein hydrolysis in gilthead seabream diets. The study found that the diet with the highest hydrolysis rate was IBE, which contained visceral Iberian pig meal as a protein source. This finding is consistent with previous studies showing variations in protein hydrolysis rates among raw materials [29].
As is known, EAAs cannot be synthesized and must be obtained through the diet, making them essential for optimal growth and health. Retention efficiency can vary depending on the specific EAA and the composition of the diet.
The results did not indicate significant differences in the retention efficiency of EAA in the various diets except for methionine (Met). Met retention efficiency was significantly higher on the INS diet. Mente et al. [25] reported differences in the retention efficiency of essential amino acids in European sea bass fed with different organic diets. These findings differ from previous studies that have reported differences in the retention efficiency of EAA in fish fed a blend of animal and plant protein diets. Monge-Ortiz et al. [30] reported that the retention ratio of seven EAA in the whole-body profile of fish varied significantly between the diets of Seriola dumerili. Overall, the findings from the present study suggest that the retention efficiency of EAA in fish-fed organic diets can vary depending on the type and composition of the organic raw materials used. Methionine is a limited amino acid in fish, and its higher retention in CON and INS diets (Table 8) could affect the PPV value of Table 5.
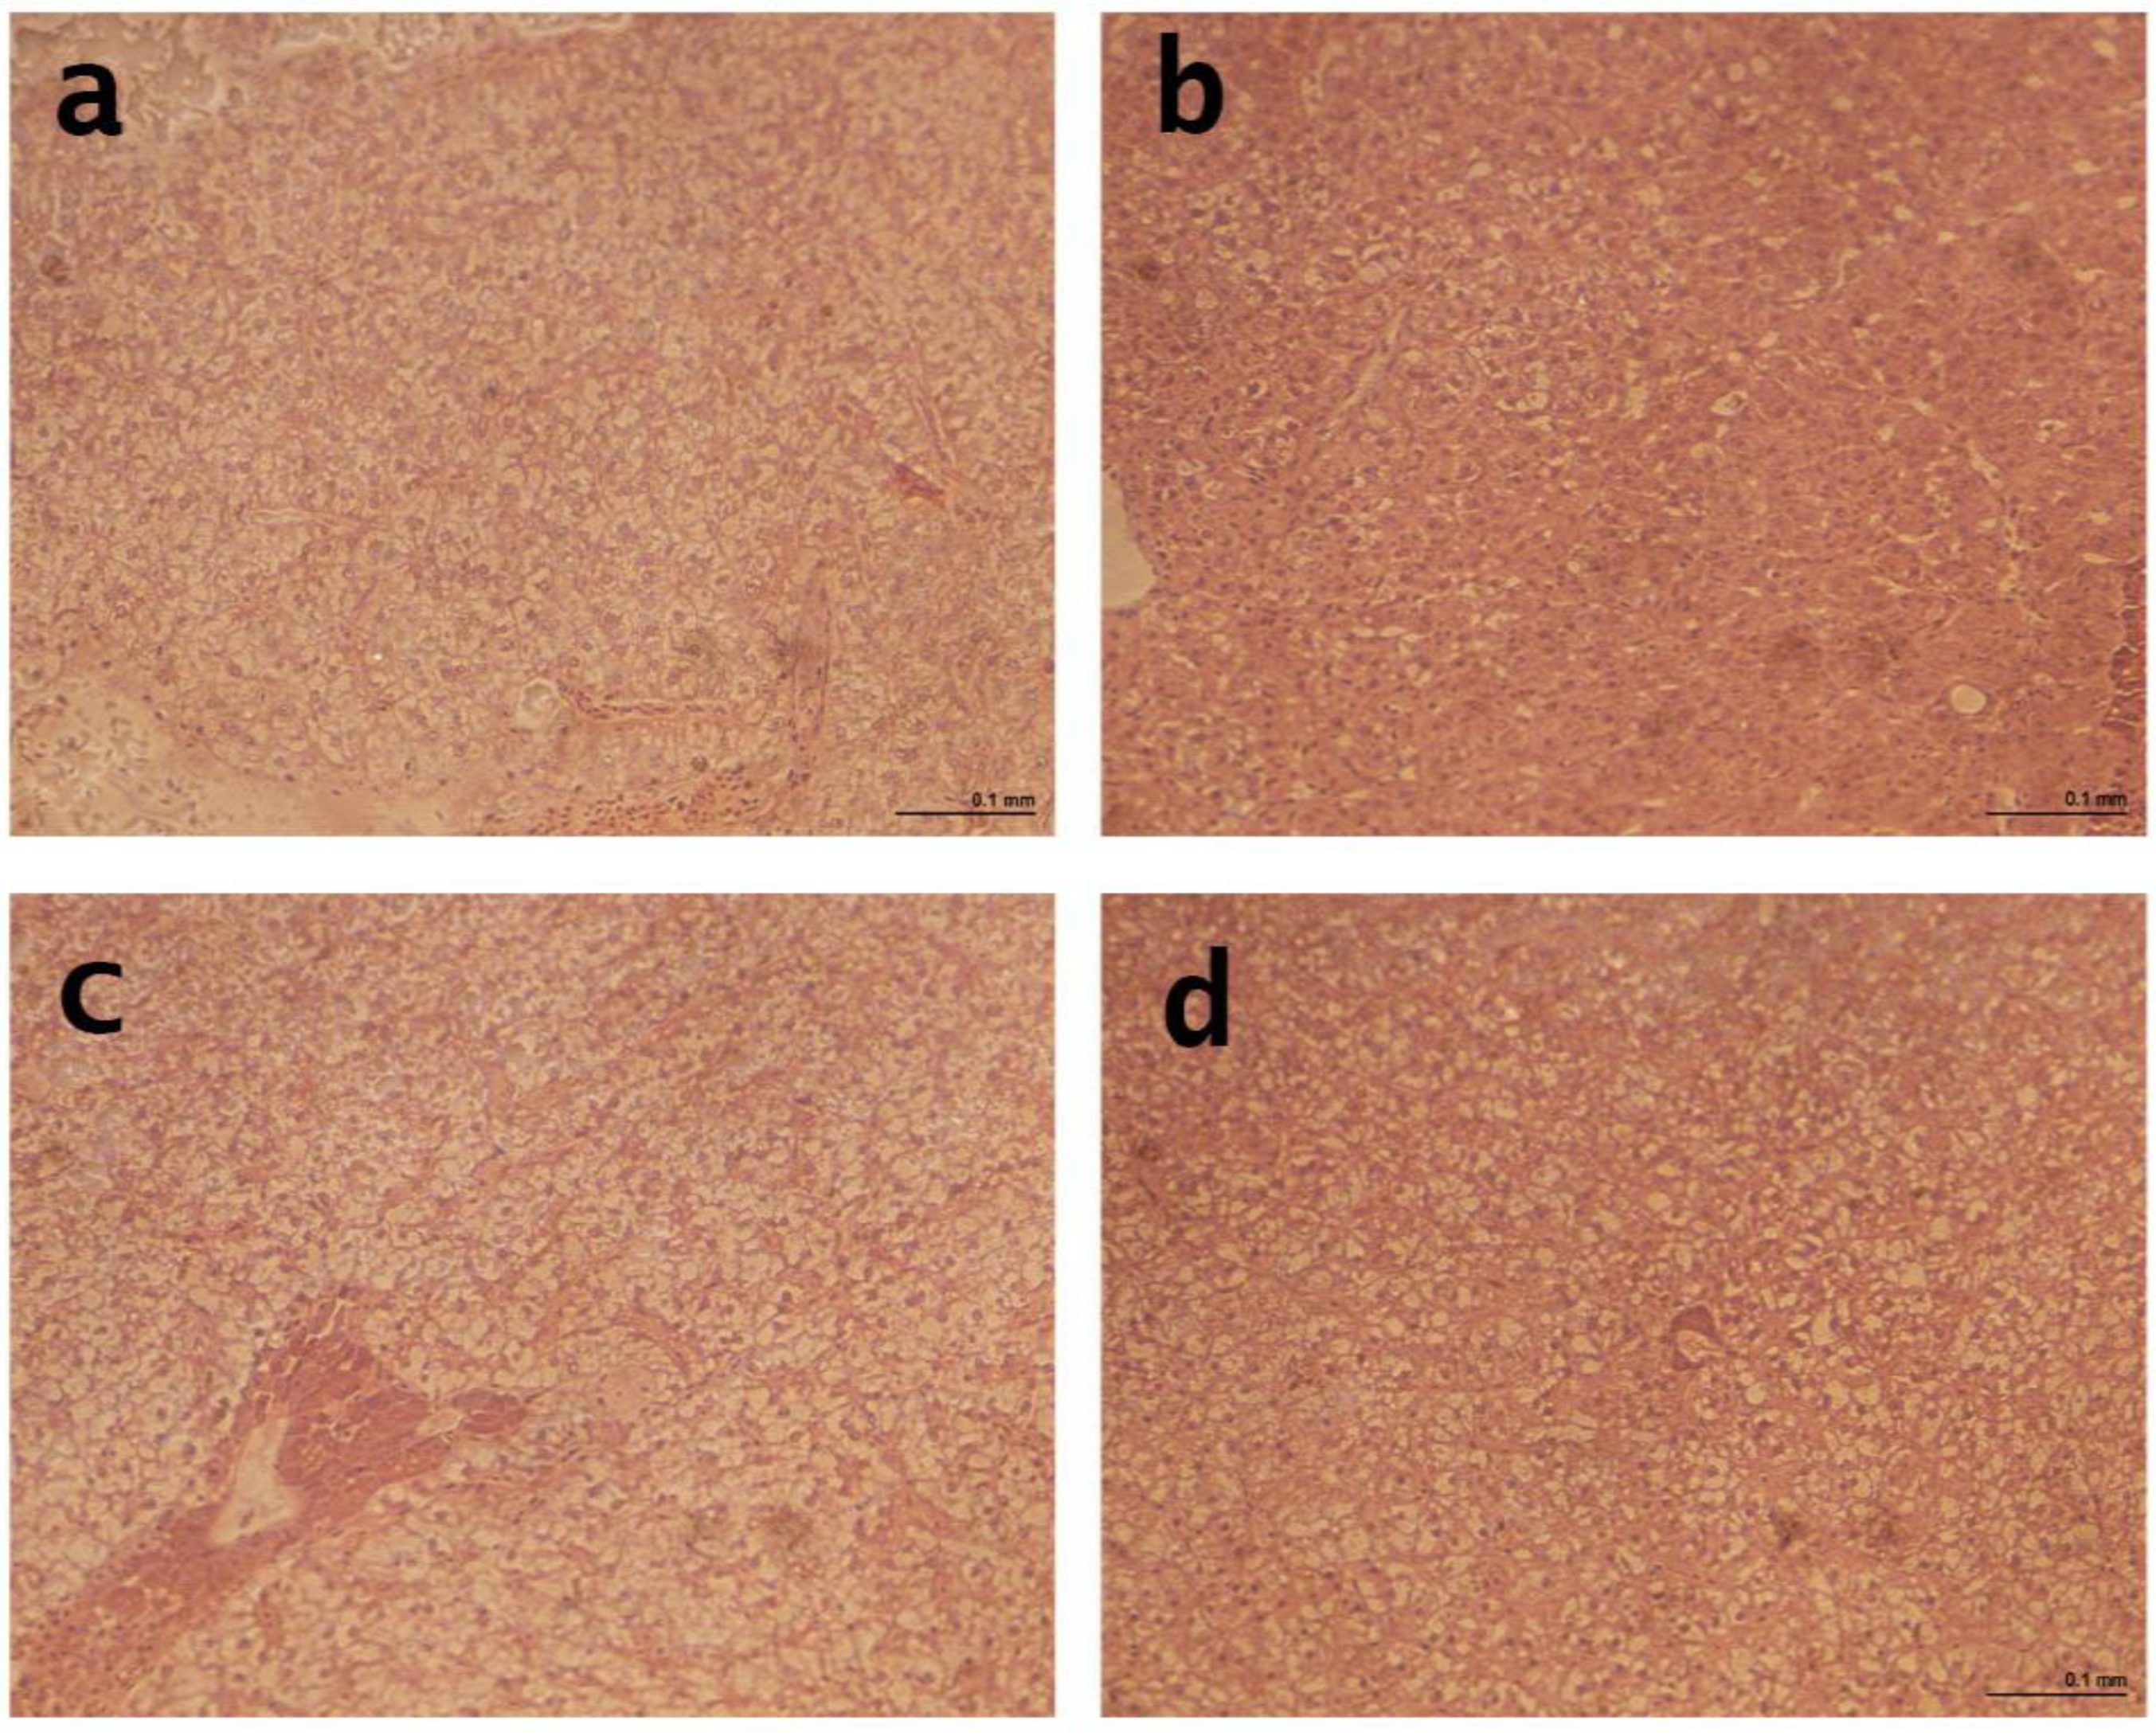
The gilthead seabream in the study did not show significant lipid accumulation or nucleus displacement caused by vacuoles, indicating a typical healthy morphology. The results indicated that the experimental organic diets significantly affected the histological measures of the liver in gilthead seabream. The diameter of the hepatocyte was significantly reduced in fish-fed organic diets compared to the CON diet. The reduced hepatocyte diameter in fish-fed organic diets may indicate decreased lipid accumulation and improved liver health. Furthermore, the diameter of the nuclei was significantly reduced in fish-fed organic diets compared to the control diet, which may indicate improved liver function. This finding is consistent with a study by Mourente et al. [31], which investigated the effects of plant-based diets on the liver morphology of sea bass and found that the diameter of the hepatocyte was significantly reduced in fish fed plant-based diets. These findings suggest that organic diets can positively affect gilthead seabreams’ liver health and morphology. To date, no studies have investigated the histological effects of organic diets on the fish liver.
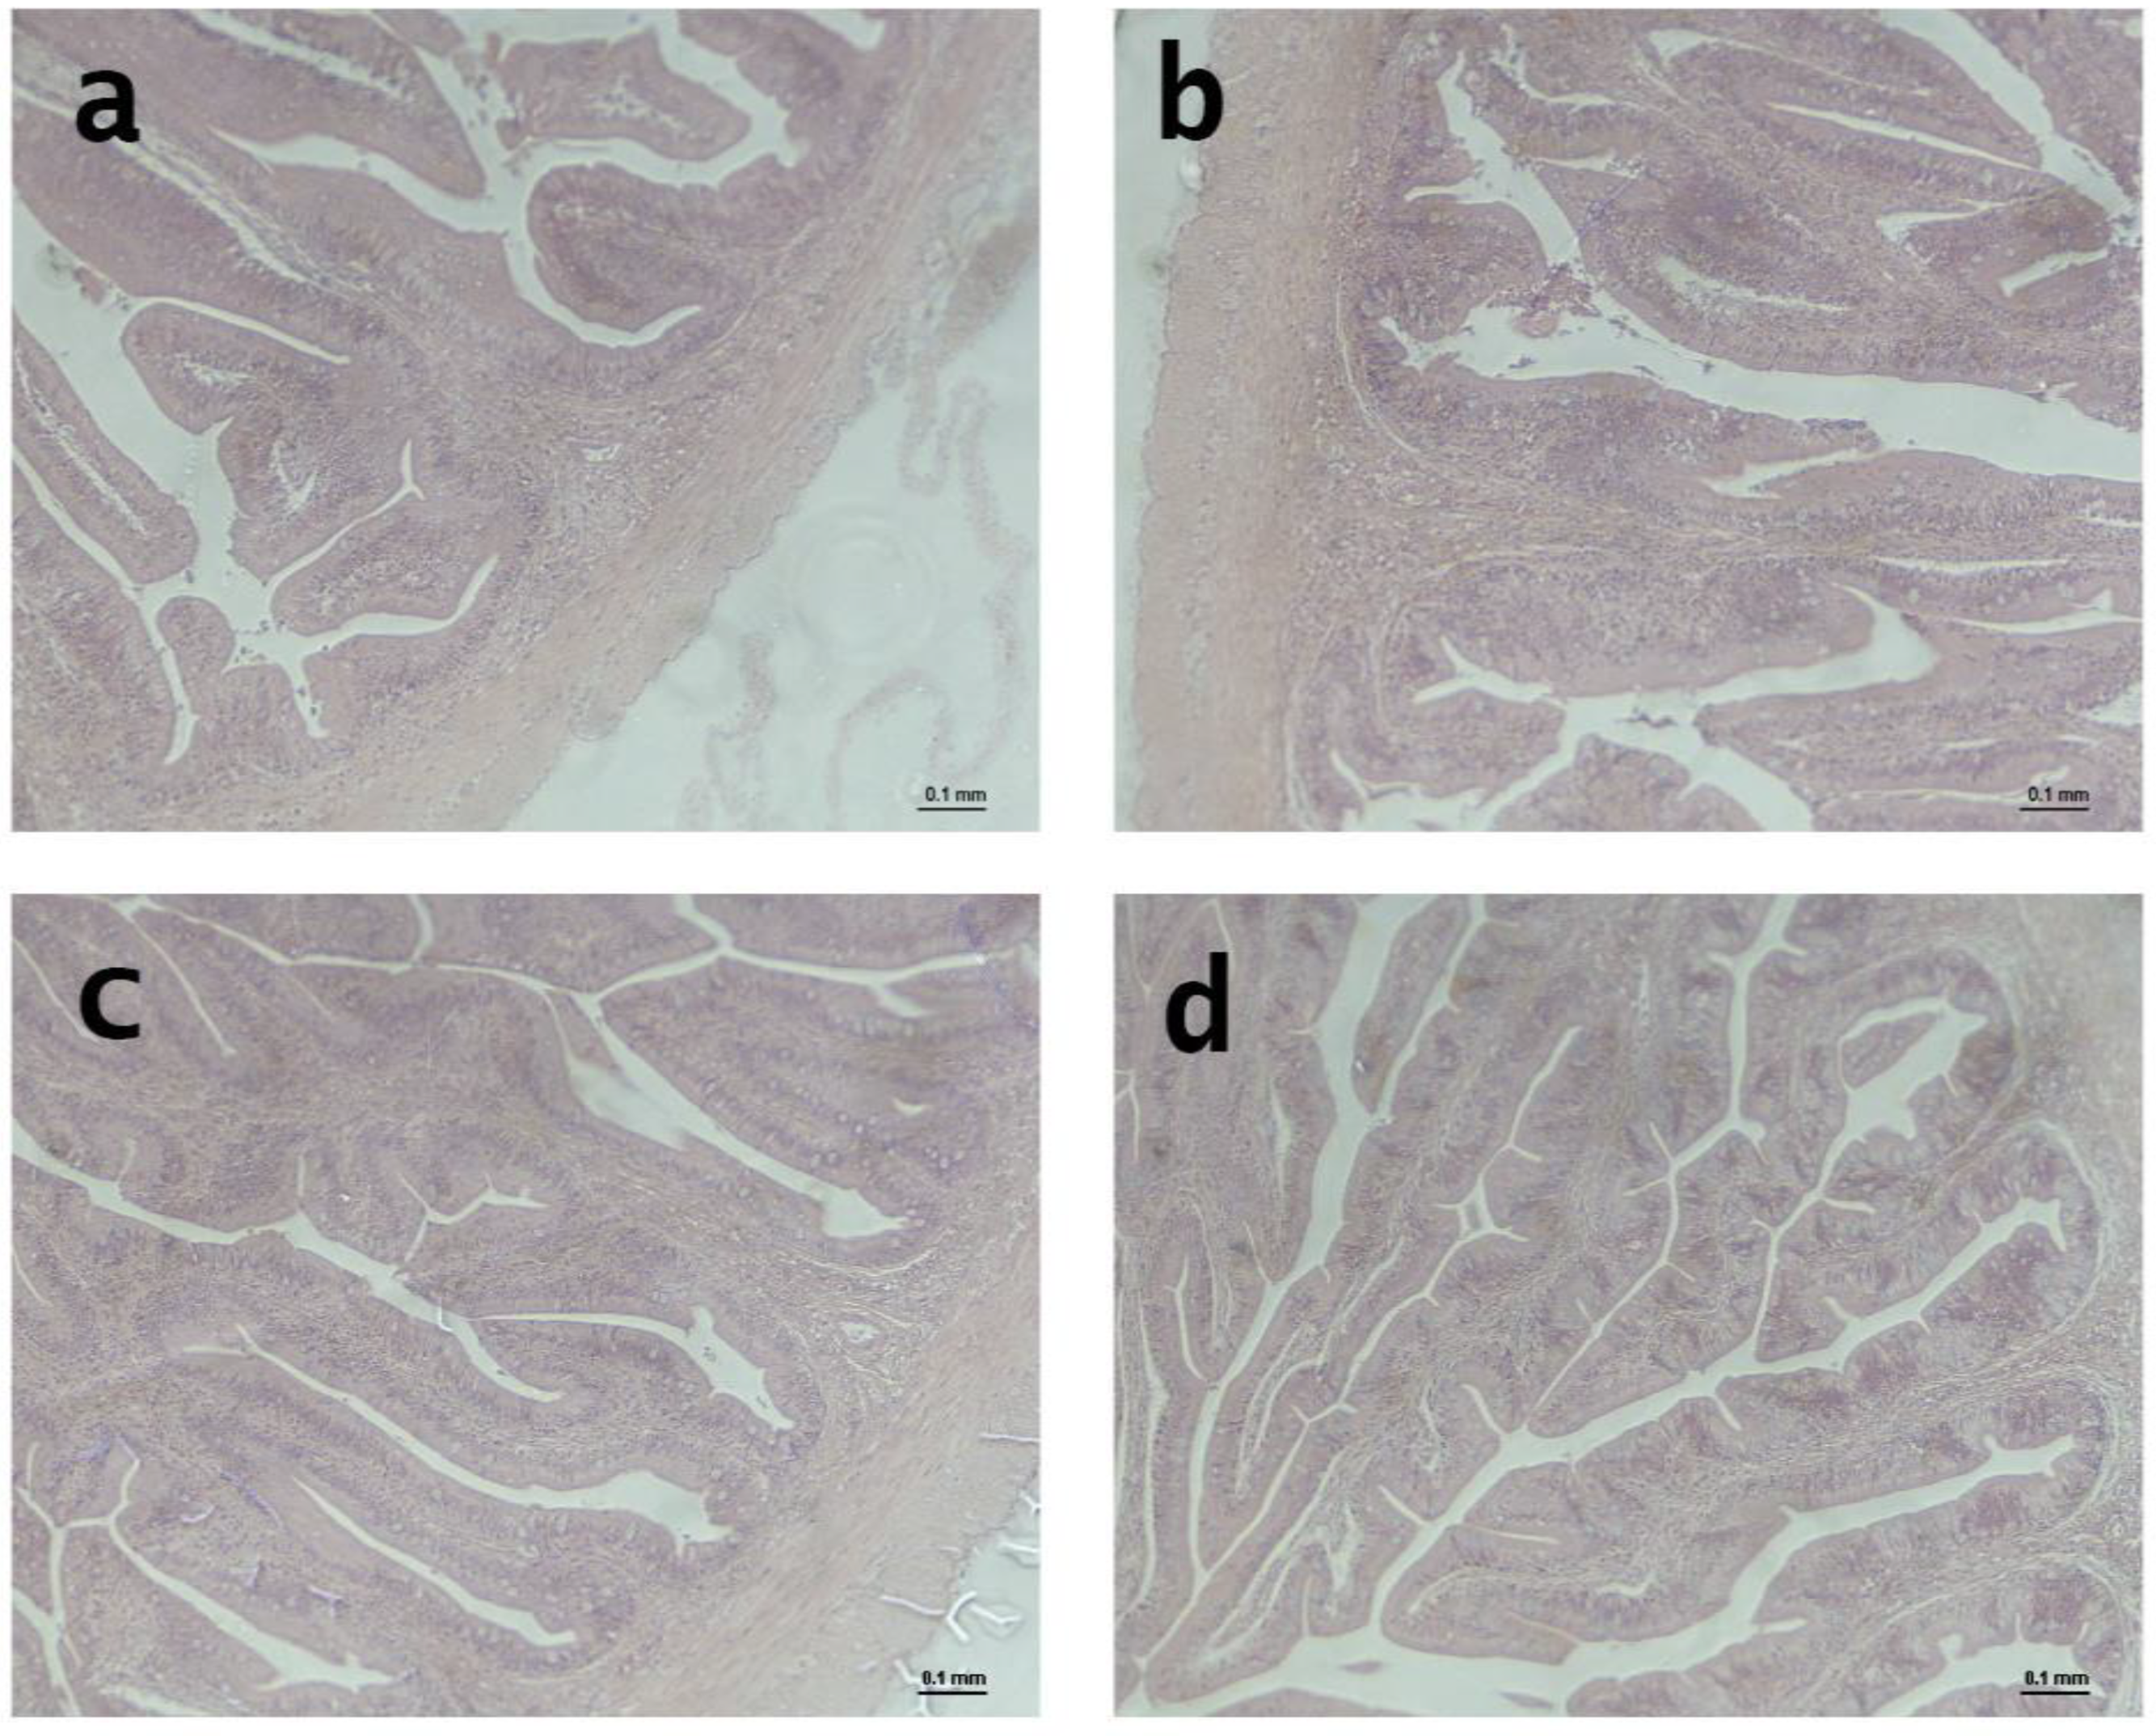
The study results showed that the different organic diets significantly affected the distal measurements of the gut in gilthead seabream. The diets affected the SL, ML, SML, VL, and VT. Specifically, gilthead seabream fed the CON and IBE diets had significantly longer SL and VL than those fed the TRO and INS diets. Regarding ML, SML, and VT, gilthead seabream fed the IBE diet had significantly longer measurements than those fed the TRO and INS diets. Finally, LP was considerably longer in gilthead seabream fed the CON and IBE diets than in those fed the TRO and INS diets.
Limited studies have investigated the effects of different organic diets on intestinal measurements in gilthead seabream. However, Fronte et al. [32] examined the impact of different nitrogen-rich ingredients, such as hydrolyzed fish protein and autolyzed yeast, on the histological intestinal morphology of gilthead seabream (Sparus aurata) and found that villi branching and thickening were significantly affected by diets.
Furthermore, according to Torrecillas et al. [33], who investigated the effects of a vegetable-based diet on the gut health of sea bass and found that villi height and epithelial thickness of the gut were significantly reduced in fish fed the vegetable-based diet compared to those fed a fishmeal-based diet. These findings suggest that different organic diets can dramatically affect the health and morphology of the intestinal tract of gilthead seabream.
Based on the results presented in the study, it can be reported that gilthead seabream fed the INS, TRO, and IBE diets had lower final weights than those fed the CON diet. However, survival rates were similar among all diets. Gilthead seabream fed the TRO, INS, and IBE diets had a lower protein content than those fed the CON diet. On the contrary, the fat content was higher in the TRO and IBE diets compared to the CON diet. The retention efficiencies of fat were also lower in the TRO and IBE diets than in the CON and INS diets. The apparent digestibility coefficients (ADC) of dry matter, gross protein, and gross energy were higher in the INS and IBE diets compared to the CON and TRO diets. The retention efficiency of EAA is mostly the same among diets except for Met. The IBE and TRO diets had lower retention efficiency for Met than the CON and INS diets. Gilthead seabream fed the TRO and INS diets had smaller nuclei and hepatocyte diameters in their livers than those fed the CON and IBE diets. Gilthead seabream fed the TRO and INS diets had shorter distal intestinal measurements than those fed the CON and IBE diets.

5. Conclusions

In summary, the results of this study suggest that the total replacement of fishmeal with organic raw materials, such as the remains of rainbow trout, the viscera of Iberian pigs, and insects, has some advantages in terms of digestibility, histology, and growth performance. However, the CON diet is still optimal regarding overall nutritional composition and amino acid retention. In practice, the results show that TRO, IBE, and INS meals can be used to replace fishmeal without harming growth performance, nutrient utilization, or intestinal health. Further research and optimization of organic diet formulations may be necessary to improve and maximize efficiency, but organic ingredients have a promising future in the aquaculture of seabream farming. These findings provide valuable information on the effects of different organic diets on digestibility and gilthead seabream liver and intestinal morphology. They could be used to improve sustainable and healthy aquaculture practices.

Author Contributions

Conceptualization, S.M.-L. and M.J.-C.; data curation, E.T., A.T.-V. and S.M.-L.; formal analysis, E.T. and I.J.; funding acquisition, M.J.-C.; investigation, E.T. and I.J.; methodology, S.M.-L. and M.J.-C.; supervision, A.T.-V. and D.S.P.; validation, A.T.-V. and D.S.P.; Writing—original draft, E.T.; Writing—review and editing, E.T. and I.J. All authors have read and agreed to the published version of the manuscript.

Funding

This project had been developed with the collaboration of the Biodiversity Foundation (Spanish Ministry for Ecological Transition and the Demographic Challenge), through the Pleamar Program, co-financed by the European Maritime and Fisheries Fund (EMFF). A full scholarship from the Ministry of Higher Education of the Arab Republic of Egypt funds the researcher Eslam Tefal.

Institutional Review Board Statement

Following Royal Decree 53/2013 and the European Directive 2010/63/EU on the protection of animals used for scientific research, the experimental protocol was reviewed and approved by the Ethics and Animal Welfare Committee of the Universitat Politècnica de València (Official Bulletin No. 80 of 06/2014).

Data Availability Statement

Data will be made available on request.

Acknowledgments

The first author was supported by a complete grant from the Ministry of Higher Education of the Arab Republic of Egypt and The research project had been developed with the collaboration of the Biodiversity Foundation (Spanish Ministry for Ecological Transition and the Demographic Challenge), through the Pleamar Program, co-financed by the European Maritime and Fisheries Fund (EMFF).

Conflicts of Interest

The authors declare no conflict of interest.

References

  1. Gamage, A.; Gangahagedara, R.; Gamage, J.; Jayasinghe, N.; Kodikara, N.; Suraweera, P.; Merah, O. Role of Organic Farming for Achieving Sustainability in Agriculture. Farming Syst. 2023, 1, 100005. [Google Scholar] [CrossRef]
  2. EUMOFA. Organic Aquaculture in the Eu. Current Situation, Drivers, Barriers, Potential For Growth; Publications Office of the European Union: Luxembourg, 2022; ISBN 9789276476221. [Google Scholar] [CrossRef]
  3. Estévez, A.; Vasilaki, P. Organic Production of Gilthead Sea Bream (Sparus aurata) Using Organic Certified Green Pea Protein and Seaweed. Effects on Growth, Feed Conversion and Final Product Quality. Aquaculture 2023, 571, 739490. [Google Scholar] [CrossRef]
  4. Gambelli, D.; Vairo, D.; Solfanelli, F.; Zanoli, R. Economic Performance of Organic Aquaculture: A Systematic Review. Mar. Policy 2019, 108, 103542. [Google Scholar] [CrossRef]
  5. Rawles, S.D.; Fuller, A.; Green, B.W.; Abernathy, J.W.; Straus, D.L.; Deshotel, M.B.; McEntire, M.E.; Huskey, G.; Rosentrater, K.A.; Beck, B.H.; et al. Growth, body composition, and survival of juvenile white bass (Morone chrysops) when dietary fish meal is partially or totally replaced by soybean meal, poultry by-product meal, an all-plant protein blend or a commercial plant-animal protein blend. Aquac. Rep. 2022, 26, 101307. [Google Scholar] [CrossRef]
  6. Yeşilayer, N.; Kaymak, I.E. Effect of partial replacement of dietary fish meal by soybean meal with betaine attractant supplementation on growth performance and fatty acid profiles of juvenile rainbow trout (O ncorhynchus mykiss). Aquac. Res. 2020, 51, 1533–1541. [Google Scholar] [CrossRef]
  7. Zhang, C.; Rahimnejad, S.; Wang, Y.-R.; Lu, K.; Song, K.; Wang, L.; Mai, K. Substituting fish meal with soybean meal in diets for Japanese seabass (Lateolabrax japonicus): Effects on growth, digestive enzymes activity, gut histology, and expression of gut inflammatory and transporter genes. Aquaculture 2018, 483, 173–182. [Google Scholar] [CrossRef]
  8. Tacon, A.G.J.; Metian, M. Feed Matters: Satisfying the Feed Demand of Aquaculture. Rev. Fish. Sci. Aquac. 2015, 23, 1–10. [Google Scholar] [CrossRef]
  9. LeDuc, A.; Zatylny-Gaudin, C.; Robert, M.; Corre, E.; Le Corguille, G.; Castel, H.; Lefevre-Scelles, A.; Fournier, V.; Gisbert, E.; Andree, K.B.; et al. Dietary aquaculture by-product hydrolysates: Impact on the transcriptomic response of the intestinal mucosa of European seabass (Dicentrarchus labrasx) fed low fish meal diets. BMC Genom. 2018, 19, 396. [Google Scholar] [CrossRef] [Green Version]
  10. Khieokhajonkhet, A.; Surapon, K. Effects of Fish Protein Hydrolysate on the Growth Performance, Feed and Protein Utilization of Nile Tilapia (Oreochromis niloticus). Int. J. Agric. Technol. 2020, 16, 419–428. [Google Scholar]
  11. Gunathilaka, B.E.; Khosravi, S.; Shin, J.; Shin, J.; Herault, M.; Fournier, V.; Lee, K.-J. Evaluation of shrimp protein hydrolysate and krill meal supplementation in low fish meal diet for red seabream (Pagrus major). Fish. Aquat. Sci. 2021, 24, 109–120. [Google Scholar] [CrossRef]
  12. Li, S.; Dai, M.; Qiu, H.; Chen, N. Effects of fishmeal replacement with composite mixture of shrimp hydrolysate and plant proteins on growth performance, feed utilization, and target of rapamycin pathway in largemouth bass, Micropterus salmoides. Aquaculture 2020, 533, 736185. [Google Scholar] [CrossRef]
  13. FAO. The State of World Fisheries and Aquaculture 2022. Towards Blue Transformation; FAO: Rome, Italy, 2022. [Google Scholar]
  14. Mente, E.; Stratakos, A.; Boziaris, I.S.; Kormas, K.A.; Karalazos, V.; Karapanagiotidis, I.T.; Catsiki, V.A.; Leondiadis, L. The effect of organic and conventional production methods on sea bream growth, health and body composition: A field experiment. Sci. Mar. 2012, 76, 549–560. [Google Scholar] [CrossRef] [Green Version]
  15. Pascoli, F.; Negrato, E.; De Lazzaro, P.; Poltronieri, C.; Radaelli, G.; Bertotto, D. Organic versus Conventional Sea Bass Aquaculture: Results from a Monitoring Study on Fish Welfare. In Proceedings of the EAS-WAS Conference-Aqua, Prague, Czech Republic, 1–5 September 2012. [Google Scholar]
  16. Trocino, A.; Xiccato, G.; Majolini, D.; Tazzoli, M.; Bertotto, D.; Pascoli, F.; Palazzi, R. Assessing the Quality of Organic and Conventionally-Farmed European Sea Bass (Dicentrarchus labrax). Food Chem. 2012, 131, 427–433. [Google Scholar] [CrossRef]
  17. Di Marco, P.; Petochi, T.; Marino, G.; Priori, A.; Finoia, M.G.; Tomassetti, P.; Porrello, S.; Giorgi, G.; Lupi, P.; Bonelli, A.; et al. Insights into Organic Farming of European Sea Bass Dicentrarchus labrax and Gilthead Sea Bream Sparus aurata through the Assessment of Environmental Impact, Growth Performance, Fish Welfare and Product Quality. Aquaculture 2017, 471, 92–105. [Google Scholar] [CrossRef]
  18. EU Regulation. Regulation (EU) 2018/848 of the European Parliament and of the Council. Official Journal of the European Union, 150/92. B Regulation (EU) 2018/848 of the European Parliament and of the Council of 30 May 2018 on Organic Production and Labelling of Organic Products and Repealing Council Regulation (EC) No 834/2007. 2018. Available online: https://eur-lex.europa.eu/legal-content/EN/TXT/?uri=CELEX:32018R0848 (accessed on 1 January 2023).
  19. Association of Official Analytical Chemists (AOAC). Official Methods of Analysis; AOAC: Arlington, VA, USA, 1990. [Google Scholar]
  20. Bosch, L.; Alegría, A.; Farré, R. Application of the 6-aminoquinolyl-N-hydroxysccinimidyl carbamate (AQC) reagent to the RP-HPLC determination of amino acids in infant foods. J. Chromatogr. B 2006, 831, 176–183. [Google Scholar] [CrossRef]
  21. Cho, C.Y.; Slinger, S.J.; Bayley, H.S. Bioenergetics of Salmonid Fishes: Energy Intake, Expenditure and Productivity. Comp. Biochem. Physiol. Part B Comp. Biochem. 1982, 73, 25–41. [Google Scholar] [CrossRef]
  22. Gilannejad, N.; Martínez-Rodríguez, G.; Yúfera, M.; Moyano, F.J. Estimating the Effect of Different Factors on the Digestive Bioaccessibility of Protein by the Senegalese Sole (Solea senegalensis); Combination of Response Surface Methodology and in Vitro Assays. Aquaculture 2017, 477, 28–34. [Google Scholar] [CrossRef]
  23. Berge, G.M.; Jokumsen, A.; Lembo, G.; Spedicato, M.T. Challenges in Sourcing of Feed Ingredients for Organic Production of Carnivorous Fish. In Proceedings of the Aquaculture Europe, Rotterdam, Europe, 20–23 October 2015. [Google Scholar]
  24. Hardy, R.W. Utilization of plant proteins in fish diets: Effects of global demand and supplies of fishmeal. Aquac. Res. 2010, 41, 770–776. [Google Scholar] [CrossRef]
  25. Mente, E.; Karalazos, V.; Karapanagiotidis, I.; Pita, C. Nutrition in organic aquaculture: An inquiry and a discourse. Aquac. Nutr. 2011, 17, e798–e817. [Google Scholar] [CrossRef]
  26. Lunger, A.N.; Craig, S.; McLean, E. Replacement of fish meal in cobia (Rachycentron canadum) diets using an organically certified protein. Aquaculture 2006, 257, 393–399. [Google Scholar] [CrossRef] [PubMed]
  27. Lunger, A.N.; McLean, E.; Craig, S. The effects of organic protein supplementation upon growth, feed conversion and texture quality parameters of juvenile cobia (Rachycentron canadum). Aquaculture 2007, 264, 342–352. [Google Scholar] [CrossRef]
  28. Amirkolaie, K.; Shahsavari, A.; Hedayatyfard, M. Full Replacement of Fishmeal by Poultry By-Product Meal in Rainbow Trout, Oncorhynchus mykiss (Walbaum, 1972) Diet. Iran. J. Fish. Sci. 2014, 13, 1069–1081. [Google Scholar]
  29. Glencross, B.D.; Carter, C.G.; Duijster, N.; Evans, D.R.; Dods, K.; McCafferty, P.; Hawkins, W.E.; Maas, R.; Sipsas, S. A comparison of the digestibility of a range of lupin and soybean protein products when fed to either Atlantic salmon (Salmo salar) or rainbow trout (Oncorhynchus mykiss). Aquaculture 2004, 237, 333–346. [Google Scholar] [CrossRef]
  30. Monge-Ortiz, R.; Tomás-Vidal, A.; Rodriguez-Barreto, D.; Martínez-Llorens, S.; Pérez, J.A.; Jover-Cerdá, M.; Lorenzo, A. Replacement of fish oil with vegetable oil blends in feeds for greater amberjack (Seriola dumerili) juveniles: Effect on growth performance, feed efficiency, tissue fatty acid composition and flesh nutritional value. Aquac. Nutr. 2018, 24, 605–615. [Google Scholar] [CrossRef]
  31. Mourente, G.; Good, J.; Bell, J. Partial substitution of fish oil with rapeseed, linseed and olive oils in diets for European sea bass (Dicentrarchus labrax L.): Effects on flesh fatty acid composition, plasma prostaglandins E2 and F2alpha, immune function and effectiveness of a fish oil finishing diet. Aquac. Nutr. 2005, 11, 25–40. [Google Scholar] [CrossRef]
  32. Fronte, B.; Abramo, F.; Brambilla, F.; De Zoysa, M.; Miragliotta, V. Effect of hydrolysed fish protein and autolysed yeast as alternative nitrogen sources on gilthead sea bream (Sparus aurata) growth performances and gut morphology. Ital. J. Anim. Sci. 2019, 18, 799–808. [Google Scholar] [CrossRef] [Green Version]
  33. Torrecillas, S.; Mompel, D.; Caballero, M.; Montero, D.; Merrifield, D.; Rodiles, A.; Robaina, L.; Zamorano, M.; Karalazos, V.; Kaushik, S.; et al. Effect of fishmeal and fish oil replacement by vegetable meals and oils on gut health of European sea bass (Dicentrarchus labrax). Aquaculture 2017, 468, 386–398. [Google Scholar] [CrossRef]
Figure 1. Release results of amino acids that cross the membrane after hydrolyzing from the protein of all experimental diets. CON: control; TRO: trout; IBE: Iberian; and INS: insect.
Fishes 08 00330 g001
Figure 2. Equations of linear adjustments to the protein hydrolysis dynamics of all experimental diets.3.6. Histology of the liver and intestinal. CON: control; TRO: trout; IBE: Iberian; and INS: insect.
Fishes 08 00330 g002
Figure 3. Histological detail of the liver (20×) of the gilthead seabream fed the experimental diet. CON (a): control; TRO: trout; (d) IBE (b): Iberian; and INS (c): insect. Hematoxylin-Eosin staining.
Fishes 08 00330 g003
Figure 4. Histological detail of the hindgut (10×) of gilthead seabream fed experimental diets. CON (a): control; TRO: trout; (d), IBE (b): Iberian; and INS (c): insect. Hematoxylin-Eosin staining.
Fishes 08 00330 g004
Table 1. Ingredients and nutritional composition of the experimental diet.
Ingredients (g Kg −1)CONTROINSIBE
Raw materials (g kg−1)
Fishmeal a300
Organic rest of rainbow trout b 400
Organic insect meal c 390
Organic Iberian pig viscera d 345
Organic wheat e20616873230
Organic wheat gluten f110110198110
Organic soybean meal g228251250220
Fish oil h20252525
Organic soybean oil i100261925
Calcium phosphate j23 2525
Vegetable methionine k3 101010
Vitamins l10 10 10 10
Nutritional composition
Dry matter88.593.088.9 85.5
Crude Protein43.043.144.244.0
Crude lipid18.620.318.520.6
Ash7.49.78.15.7
Calculated Gross Energy (kJ/g) m20.621.52020
CON: control; TRO: trout; IBE: Iberian; and INS: insect. a Fishmeal (91.9% DM, 73.9% CP, 11.2% CL, 14.3% Ash); CORPESCA SA. b Rest of rainbow trout (98.60% DM, 64.60% CP, 21.7% CL, 12.40% Ash). (Naturix, Valderrebollo, Guadalajara, Spain). c Insect meal (92.6% DM, 37.6% CP, 28.5% CL, 20% CHO, 13.9% Ash). d Visceral Iberian pig (92.6% DM, 53.0% CP, 28.6% CL, 14.6% CHO, 3.8% Ash). e Organic wheat (92.3% DM, 12.7% CP, 1.3% CL, 1.7% Ash, 19.7 kJ−1 energy); (PIENSOS ecoLUCAT, Barrax, Albacete, Spain). f Organic wheat gluten. g Organic soybean meal (94.6% DM, 43.1% CP, 9.3% CL, 6.3% Ash, 19.7 kJ−1 energy); (PIENSOS ecoLUCAT, Barrax, Albacete, Spain). h Fish oil (Industrias Afines, L.L. (Arpo), Polgono industrial A Veigadaa, Ra as Baloutas, de Abaixo, 24, 36416, Pontevedra). i Organic soybean oil (Clearspring Ltd., Acton Park Estate, London W3 7QE, UK). j Calcium phosphate. k Vegetable methionine (Adibio S.L.|Edificio Galileo, C/Enebros 74, 2a planta|44002 Teruel (Espaa). l Mix of vitamins and minerals (g kg−1): Premix: 25; Choline, 10; DL-a-tocopherol, 5; ascorbic acid, 5; (PO4)2Ca3, 5. Premix composition: retinol acetate, 1,000,000 IU kg−1; calciferol, 500 IU kg−1; DL-a-tocopherol, 10; menadione sodium bisulfite menadione, 0.8; thiamine hydrochloride, 2.3; riboflavin, 2.3; pyridoxine hydrochloride, 15; cyanocobalamine, 25; nicotinamide, 15; pantothenic acid, 6; folic acid, 0.65; biotin, 0.07; ascorbic acid, 75; inositol, 15; betaine, 100; polypeptides 12. m Calculated Gross Energy (kJ/g) = [51.8 × (%C/100) − (19.4 × (%N/100)].
Table 2. Composition of essential and non-essential amino acids in experimental diets.
DietsCONTROINSIBE
Essential amino acids (g 100 g−1) (EAA)
Arginine2.942.812.592.42
Histidine2.260.911.261.13
Isoleucine1.511.631.801.70
Leucine3.003.043.083.12
Lysine2.322.392.021.97
Methionine1.081.010.771.15
Phenylalanine1.841.782.122.06
Threonine2.281.501.511.46
Valine2.022.082.412.35
Non-essential amino acids (g 100 g−1) (NEAA)
Alanine2.072.112.142.06
Aspartic acid3.573.533.883.73
Cysteine0.510.480.560.52
Glutamic acid9.749.119.9610.24
Glycine2.623.062.462.25
Proline2.782.873.513.24
Serine2.101.972.252.22
Tyrosine1.341.331.941.66
CON: control; TRO: trout; IBE: Iberian; and INS: insect.
Table 3. Conditions were carried out in the protein hydrolysis assay.
Acid StageAlkaline Stage
E:S ratio (U/mg protein) *4.08.5
PH3.58.5
Time (hours)1.53.5
Temperature (°C)2525
* E:S ratio: enzyme/substrate ratio.
Table 4. Growth and nutritional parameters of gilthead seabream fed experimental organic diets.
DietsCONTROINSIBESEMp Value
Initial weight (g)90.389.196.596.01.340.1329
Final weight (g)328.4 a263.7 b270.8 b244.7 b12.040.0290
Survival (%)89.878.691.981.07.870.6013
SGR (% day−1) 11.150.950.90.850.040.4687
FI (g 100 g fish−1 day−1) 21.72.01.651.850.150.4593
FCR 32.051.92.251.70.310.6574
CON: control; TRO: trout; IBE: Iberian; and INS: insect. Values are represented as mean ± stander error (n = 3) for each treatment. Values that do not share the same letter differ significantly (p < 0.05). 1 Specific growth rate (SGR) = 100 × ln (final weight/initial weight)/days. 2 Feed intake (FI) (g 100 g fish − 1 day − 1) = 100 × feed consumption (g)/average biomass (g) × days. 3 Feed conversion ratio (FCR) = feed consumption (g)/weight gain (g).
Table 5. Body composition in dry matter and retention efficiencies of gilthead seabream at the beginning and after feeding with experimental diets (%).
InitialCONTROINSIBESEMp Value
Dry matter 31.334.735.536.635.21.000.2532
Protein 57.947.2 b52.5 a50.6 a49.6 ab0.80 0.0401
Fat 26.443.7 a37.1 b40.3 ab38.7 b1.060.0002
Ash10.19.17.77.510.30.960.3551
PPV 1 29.319.022.619.32.740.1507
PFV 2 62.6 a32.9 b52.6 a36.2 b3.830.0121
CON: control; TRO: trout; IBE: Iberian; and INS: insect. Values are represented as mean ± standard error (n = 3) for each treatment. Values that do not share the same letter differ significantly (p < 0.05). 1 Productive protein value (PPV%) = protein retained (final fish protein × final biomass (g)) × 100—initial fish protein × initial biomass (g)/protein ingested (kg of food ingested food × % crude protein). 2 Productive fat value (PFV%) = fat retained (final fish fat × final biomass (g)) × 100—initial fish fat × initial biomass (g)/fat ingested (kg of food ingested food ×% crude fat).
Table 6. Biometric indices at the end of the experiment.
DietsCONTROINSIBESEMp Value
VSI 1 (%)7.58.16.67.70.540.2879
HIS 2 (%)2.1 a1.4 b2.0 a1.7 ab0.140.0014
CF 3 (g/cm3) 2.2 a1.9 ab2.0 ab1.8 b0.100.0235
VFI 4 (%)1.5 ab1.1 ab0.86 b1.9 a0.250.0262
CON: control; TRO: trout; IBE: Iberian; and INS: insect. Values are represented as mean ± standard error (n = 9) for each treatment. Values that do not share the same letter differ significantly (p < 0.05). 1 Visceral index (VSI) (%) = (visceral weight (g)/total weight of fish. (g)) × 100. 2 Hepatosomatic index (HSI) (%) = (liver weight (g)/total fish weight (g)) × 100. 3 Condition factor (CF) (g/cm3) = (total weight of fish (g)/length3 (cm)) × 100. 4 Visceral fat index (VFI) (%) = (visceral fat weight (g)/total fish weight (g)) × 100.
Table 7. Apparent digestibility coefficients of dry matter and different nutrients of gilthead seabream fed experimental diets.
Diets
ADC (%) *CONTROINSIBESEMp Value
Dry matter63.8 b74.7 ab83.0 a85.8 a4.190.0114
Calcium37.8 ab51.5 ab55.5 a35.0 b3.320.0057
Phosphorus63.269.873.273.13.970.2669
Gross protein84.2 c88.5 b93.0 a91.7 a0.870.0000
Gross energy78.4 c84.6 b90.2 a90.0 a1.220.0000
CON: control; TRO: trout; IBE: Iberian; and INS: insect. Values are represented as mean ± standard error (n = 3) for each treatment. Values that do not share the same letter differ significantly (p < 0.05). * Apparent digestibility coefficients (ADC). ADCdm = 100 − (100 × (% Cr2O3 in diet/% Cr2O3 in feces)). ADCnut = 100 − (100 × (% feed marker/% feces marker) × (% nutrient. energy. amino acid. or fatty acid in urine/% of nutrient. energy. amino acid. or fatty acid in feed)).
Table 8. Retention efficiency of essential amino acids from gilthead seabream-fed experimental diets (%).
DietCONTROINSIBESEMp Value
Arginine32.3025.1527.5521.754.820.5354
Histidine36.2531.9522.0517.857.620.4019
Isoleucine34.4024.3524.0523.953.360.2140
Leucine31.7023.3023.9020.203.290.2297
Lysine44.2030.0540.5534.954.010.2082
Methionine26.1 ab21.5 b36.8 a20.3 b3.190.0554
Phenylalanine27.5019.6518.9516.252.670.1403
Threonine26.8027.4526.5020.506.130.8391
Valine31.7022.9521.7017.503.480.1623
CON: control; TRO: trout; IBE: Iberian; and INS: insect. Values are represented as mean ± standard error (n = 3). For each treatment. Values that do not share the same letter differ significantly (p < 0.05).
Table 9. Histological measures of the liver of gilthead seabream fed experimental diets.
DietsCONTROINSIBESEMp Value
Nuclei diameter (μm)4.72 a3.19 c3.28 bc3.51 b0.090.0021
Hepatocyte diameter (μm)12.46 a8.48 c8.52 c9.73 b0.200.0000
CON: control; TRO: trout; IBE: Iberian; and INS: insect. Different letters indicate significant statistical differences (p < 0.05)—Newman-Keuls test. Values are the mean ± SEM (standard error of the mean) (n = 100).
Table 10. Effect of the different diets on distal measurements of the gut in gilthead seabream.
CONTROINSIBESEMp Value
SL (μm)106 a53 b69 b95 a4.50.0182
ML (μm)146 a63 c74 c100 b6.60.0124
SML (μm)65 a36 b39 b66 a3.70.0257
VL (μm)1336 a741 b741 b1502 a81.70.0110
VT (μm)218 a91 c92 c174 b6.70.0000
LP (μm)63 a24 c24 c49 b2.80.0001
CON: control; TRO: trout; IBE: Iberian; and INS: insect. Equal letters in the same row do not indicate significant differences between the means (p < 0.05)—Newman-Keuls test. Values are the mean ± SEM (standard error of the mean) (n = 20). SL: serous layer. ML: muscular layer. SML: submucous layer. VL: villi length. VT: villi thickness. LP: lamina propria.
Disclaimer/Publisher’s Note: The statements, opinions and data contained in all publications are solely those of the individual author(s) and contributor(s) and not of MDPI and/or the editor(s). MDPI and/or the editor(s) disclaim responsibility for any injury to people or property resulting from any ideas, methods, instructions or products referred to in the content.

