Abstract
Understanding the diet of whale sharks (Rhincodon typus) is essential for the development of appropriate conservation strategies for the species. This study evaluated the use of the parasitic copepod (Pandarus rhincodonicus) as a proxy to infer short-term foraging habitats and trophic positions of whale shark hosts. To accomplish this, bulk stable carbon (δ13C) and nitrogen (δ15N) isotope compositions were analysed from 72 paired samples of whale shark skin (dermal) tissues and copepods collected across six years at the Ningaloo Reef aggregation site, Western Australia. This study found that δ15N from parasites and whale shark hosts were strongly correlated. As turn-over times of the parasite and whale shark differ (months vs. years, respectively), the ability of copepods to predict δ15N values indicates that the trophic positions of whale sharks remain consistent across these timeframes. Contrastingly, δ13C in the parasite and host were weakly correlated, likely reflecting differences in the physiology and lifecycle of the copepod parasite compared to the host. Our results suggest δ15N from parasitic copepods provides a reliable proxy of the trophic position of their whale shark hosts, but interpretation of δ13C values as a proxy for the host will require future studies on the lifecycle of P. rhincodonicus.
Keywords:
Pandarus rhincodonicus; diet; stable isotope; carbon; nitrogen; isotopic niche; dietary specialization; ontogenetic shifts Key Contribution:
Bulk-stable isotopes obtained from a host-specific parasitic copepod (Pandarus rhincodonicus) could provide insights into whale shark (Rhincodon typus) host trophic position and isotopic niches.
1. Introduction
The whale shark (Rhincodon typus Smith, 1828) [1] is the largest fish in the world, growing up to a maximum of 18 m [2]. The species is distributed globally across mid-latitude (30° N and 30° S) waters [3], and is currently listed as Endangered by the International Union for Conservation and Nature (IUCN) Red List [4]. To improve feeding efficiency and increase growth rates, juvenile whale sharks (mostly males) gather at coastal aggregation sites to take advantage of ephemeral bursts of productivity [5]. Whale sharks feed on a wide range of zooplankton, including krill [6], copepods [7], crab and fish larvae [8,9,10], and small nektonic fishes, such as anchovy [11,12,13]. More recently, biochemical analyses suggest that these are not the only items that these animals consume and that food sources can also include significant amounts of floating algal material [14,15]. Given that the nutrition provided in coastal aggregations is likely to be critical to individual growth and the demography of whale shark populations [5], understanding the diet and foraging habitats of whale sharks within these sites is important for strategies that aim to manage and conserve these populations.
The results from biochemical analyses clearly illustrate that direct observation may only reveal part of the diet of whale sharks [16,17], particularly because feeding can occur during the night and at depth in both coastal and open-ocean environments [18,19,20]. Biochemical analyses such as bulk stable isotope analysis of nitrogen (δ15N) and carbon (δ13C) can offer a means to overcome these issues, as they provide information about the trophic niche, diet, and foraging habitats integrated over both time and space [14,21]. Stable isotope analyses of carbon (δ13C) and nitrogen (δ15N) provide information about the isotopic niche of whale sharks because δ15N in the tissues of consumers is higher by +2 to 5‰relative to their diet [22,23,24]. This enrichment in 15N (also known as the trophic discrimination factor or diet-tissue fractionation) can be used to estimate the relative trophic position and potential diet. In contrast, δ13C values do not substantially increase with increasing trophic position (≤+1‰ per trophic level) [22,25,26], but can be used to identify carbon sources of diet and infer major foraging habitats. Pelagic-based carbon is typically depleted in 13C compared to carbon from benthic sources, resulting in lower δ13C values [27,28,29]. As this relationship is conserved through food webs [28], the relative contribution of carbon from pelagic and benthic-based sources to diet can be determined [30,31,32] and thus infer major foraging habitats [21].
Tissue turnover rates define the time scales at which stable isotopes can infer diet [14,33]. Previous studies using biochemical analysis to determine whale shark diets typically harvested dermal tissues due to the ease of collection and minimally invasive nature of biopsies [15,16,17,21]. However, whale shark dermal tissue is metabolically inactive, and its turnover is likely to be very slow (on the scale of several months to years) [14]. Given that whale sharks are highly mobile and are capable of moving thousands of kilometres within a few months [20,34,35], biochemical analyses using dermal tissues likely reflect an integrated diet across a broad range of habitats at a very large spatial scale. As whale shark aggregations typically last for a few weeks to several months [14,36], it is unknown how representative the results obtained from dermal tissues are of the diet of whale sharks while they reside at coastal aggregations.
Information about diet at time scales more relevant to aggregations (weeks to months) can be obtained from biochemical analyses of tissues that have faster turnover rates, such as blood or plasma [14]. Although this reduces the amount of temporal integration, it is both highly invasive and logistically challenging to collect blood from whale sharks in situ, as it either involves restraint of a shark or finding free-swimming animals that will tolerate the insertion of a collection apparatus [37]. Another possibility is the analysis of faecal DNA; however, as the passage of food through the gut occurs within a few days [14], multiple samples may be required over weeks or months to characterise the diet while a shark attends an aggregation [14]. This makes the approach impractical in most circumstances, as defaecation in whale sharks is an event that is relatively rare to witness [8] and requires considerable logistical support to collect samples [15].
Rather than a direct analysis of whale shark tissue or faeces, it may be possible to obtain insights into whale shark feeding at weekly to monthly time scales through the analysis of host-specific parasites. The potential of parasites to provide insights into elasmobranch biology has been recognised for many years [38], with the host-specific parasitic copepod Pandarus rhincodonicus Norman et al., 2020 [39] (Copepoda, Siphonostomatoida, Pandaridae) used to infer patterns of genetic connectivity of whale sharks at ocean-basin scales [40]. Meekan et al. (2017) [40] also revealed that copepods do not move between whale shark hosts, with compound specific isotope analyses (CSIA) showing that these copepods occupy a trophic level above their whale shark host [15], indicating that they are parasitic rather than commensal, as suggested by Norman et al. (2000) [39], and most likely feed on the blood and regenerating tissue from lesions on the host [41,42]. Tissue turnover of blood and damaged tissue is relatively quick, with blood being replaced at time scales between a few weeks and nine months [14], and recovery of damaged tissue typically occurs within a month [43]. Consequently, analyses of the copepods that feed on these tissues are likely to provide insights into the diet assimilation of individual whale sharks over comparable time periods, given the short life cycles of parasitic copepods [44].
Here, we evaluate the use of the parasitic copepod P. rhincodonicus as an indicator of whale shark diet and foraging habitats at the Ningaloo Reef aggregation site in Western Australia. To accomplish this aim, bulk isotopes of carbon (δ13C) and nitrogen (δ15N) were analysed from paired samples of P. rhincodonicus copepods and whale shark host dermal tissues collected across six seasons (years) of sampling at Ningaloo Reef. It was hypothesised that:
- If P. rhincodonicus were good biochemical indicators of whale shark foraging habitats and trophic positions, then values of δ13C and δ15N in P. rhincodonicus would reliably predict values of δ13C and δ15N in whale shark tissue;
- P. rhincodonicus feeding on whale shark blood and regenerating tissue would show trophic discrimination factors similar to the theoretical values of +3.4‰ and +≤1‰ for δ13C and δ15N values associated with the consumption of tissues [25].
2. Materials and Methods
Dermal tissue of whale sharks and Pandarus rhincodonicus were collected near Black Rock Passage (22°45′29.26″ S, 113°38′54.33″ E) and Norwegian Bay (22°36′17.81″ S, 113°38′4.16″ E) in the Ningaloo Marine Park, Western Australia, between 2016 and 2022 (Figure 1). Tissues were collected from host whale sharks using a modified hole-punch spear to remove an approximately three-centimetre-deep skin biopsy spear near the first dorsal fin on each shark. At the same time, a free diver scraped copepods off whale shark hosts using a plastic knife, which were subsequently collected with a hand net. The sex of each whale shark was determined by the observation of claspers, and the individual length was measured using EventMeasure (https://www.seagis.com.au, accessed on 16 June 2022) from a diver-operated stereo video (DOVS) system [45]. Where individual lengths could not be estimated using EventMeasure, lengths were estimated by eye at half-metre intervals by researchers swimming alongside the animals. All tissue samples were stored in liquid nitrogen until they were transported to the Oceans Institute in Perth, where they were stored at −80 °C.
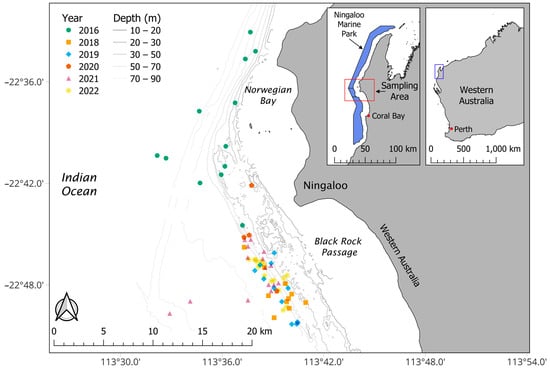
Figure 1.
Locations of whale sharks sampled between 2016 and 2022. Coastline boundaries were provided by Landgate and Natural Earth Data. The Commonwealth Ningaloo Marine Park boundaries were obtained from Australian Marine Parks. Bathymetry contour data were derived from the 50 m Multi-beam Dataset of Australia 2018 from Geoscience Australia. Map created in QGIS version 3.20.0, WGS 84, EPSG: 4326.
We analysed a total of 72 paired whale shark tissue and P. rhincodonicus samples collected between 2016 and 2022 (Table 1 and Table S1). Due to very low sample sizes, collections from 2017 were not included in this study.

Table 1.
Sample sizes of paired P. rhincodonicus and whale shark tissues collected between 2016 and 2022. The sexes of host whale sharks are shown.
Samples of harvested P. rhincodonicus and dermal tissue of whale sharks were oven dried at 50 °C for 24 h, subsequently subdivided into small flakes, and then homogenised using a mortar and pestle. Although previous isotope studies freeze-dried samples prior to homogenization [14,21], desiccation methods do not substantially alter tissue δ15N fractionation of fish and shark tissue in comparison to freeze-drying methods [46,47]. Thus, oven drying was deemed to be an appropriate method for desiccation.
Lipids and urea in whale shark dermal tissues can lower δ13C and δ15N values [48], leading to bias in analyses. To remove urea, dermal tissue samples were submerged in 1.4 mL of deionized water in 1.5 mL Eppendorf tubes, vortexed for 5 min, and placed in a 30 °C water bath for 24 h. Eppendorf tubes were then removed from the water bath, centrifuged at 2000 rpm for 10 min, and the excess water decanted. This process was repeated twice, and the samples were then dried at 50 °C for 24 h [48]. After urea extraction, lipids were then removed from the dermal samples. To remove lipids, dermal tissues were submerged in a 1.4 mL 2:1 v/v chloroform:methanol solution in a 1.5 mL Eppendorf tube, vortexed for 5 min, and placed in a 30 °C water bath for 24 h. Eppendorf tubes were then removed from the water bath, centrifuged at 2000 rpm for 10 min, and the excess solution decanted. This process was repeated three times, and samples were then dried at 50 °C for 24 h [48].
Inorganic carbonates within P. rhincodonicus exoskeletons are enriched in 13C and needed to be removed to avoid bias in analyses [49]. However, acidification procedures to remove these can markedly alter δ15N values in P. rhincodonicus tissues [49]. For this reason, P. rhincodonicus samples were subdivided into two aliquots prior to drying. One aliquot was acidified to remove inorganic carbonates for δ13C analysis, whereas the other aliquot remained untreated and was analysed for δ15N. To extract inorganic carbonates from P. rhincodonicus samples, they were submerged in 1.4 mL of 1 mol L−1 hydrogen chloride solution in 1.5 mL Eppendorf tubes until no degassing was observed, for up to a maximum of 18 h. The hydrogen chloride solution was then decanted, and P. rhincodonicus samples were washed with deionized water and centrifuged at 3600 rpm for 5 min. The deionized water solution was then decanted, and samples were dried at 50 °C for 24 h [50]. Acidification procedures were conducted on a sub-sample of 36 parasites collected from a total of eight whale shark hosts not used in this study (Table S2). The reported δ13C values for P. rhincodonicus in this study were adjusted to the acidification effect obtained using the parasite data from these eight sharks.
Around 0.5 mg of P. rhincodonicus and the dermal tissue of each whale shark were weighed into separate tin capsules (IVA Analysentechnik, Meerbusch, Germany). These were analysed for δ13C and δ15N values using a Thermo Flush 1112 via Conflo IV (Thermo-Finnigan, Bremer, Germany) elemental analyser connected to a Delta V Plus mass spectrometer at the Western Australia Biogeochemistry Centre (WABC) at The University of Western Australia. Samples were combusted at 1000 °C (chromium oxide and silvered oxides of cobalt, Thermo Fisher Scientific, MA, USA) to produce CO2 and NOx gases, and NOx gases were then reduced at 650 °C (electrolytic copper, Thermo Fisher Scientific, Waltham, MA, USA) to produce N2 gas [51]. The obtained N2 and CO2 gases were carried in a stream of helium (grade 99.999% purity; BOC, Australia, 100 mL/min) through water traps (magnesium perchlorate, Themo Fisher Scientific, MA, USA) and separated using gas chromatography. The stable carbon and nitrogen isotope compositions were expressed as 1000 × δ (delta) values in parts per thousand (permille, ‰) (Equation (1)) [52] using the instrumental software (Isodat 2.5, Thermo Scientific, Bremen, Germany) after application of the “SSH” 17O correction for CO2:
where X was either 13C or 15N, Rsample and Rstandard were the ratios of 13C/12C and 15N/14N in tissue and standard samples (AIR for 15N and VPDB for 13C), respectively. The results were normalised to the international stable isotope standard samples using reference materials (δ13C: NBS 22 −30.03‰, IAEA 603 +2.46‰, USGS 24 −16.05‰, and USGS 40 −26.39‰; δ15N: IAEA N1 +0.43‰, IAEA N2 +20.41‰, USGS 32 +180‰, and USGS 40 −4.52‰) provided by the International Atomic Energy Agency (IAEA) [53]. The combined analytical uncertainty for both δ13C and δ15N values was lower than ±0.10‰ (one standard deviation).
δX = (Rsample/Rstandard) − 1
Prior to statistical analyses comparing the isotopic composition of the copepod and host, the effect of acidification on P. rhincodonicus was examined using the change (Δ) in δ13C and δ15N values and C/N ratios across acidified and untreated samples (Equation (2)).
where X was either 13C, 15N, or the C/N ratio. A single-sample t-test compared Δ13Cacid-untr, Δ15Nacid-untr and ΔC/Nacid-untr ratios to an absent difference in means across acidified and untreated P. rhincodonicus samples (H0: Δ15Nacid-untr and Δ13Cacid-untr = 0).
ΔXacid-untr = δXacid − δXuntreated
A linear regression model using Pearson’s correlation coefficient was used to test for a correlation between P. rhincodonicus and whale shark dermal δ13C and δ15N values, respectively. As this study was interested in whether the isotopic composition of P. rhincodonicus could infer whale shark dermal δ13C and δ15N values, P. rhincodonicus δ13C and δ15N values were used as explanatory variables in respective linear regression models. To determine whether this trend remained consistent across male and female sharks, host sex was also included as an explanatory variable.
The trophic discrimination factors for parasite-host pairings were estimated for parasite-host tissues. The isotopic composition of P. rhincodonicus and the whale shark host was compared using the relative change (Δ) in δ13C and δ15N values (Equation (3)) [54].
where X was either 13C or 15N. As copepods were assumed to feed on the blood of whale sharks, parasite-host trophic discrimination factors were compared to estimated values of isotopes in the blood of sharks (Δ13CP-Bl(raw) and Δ15NP-Bl(raw)). Estimated isotope values for whale shark blood were calculated by subtracting the mean difference between δ13C and δ15N values of dermal tissue and plasma. On average, dermal tissues are higher by 0.9‰ (Δ13CDermal-Blood) and 1.5‰ (Δ15NDermal-Blood) in δ13C and δ15N, respectively, when compared to plasma isotopic composition [14], assuming that dermal tissue and plasma tissues were in isotopic equilibrium with their diets. Thus, to estimate blood isotopic composition, δ13C and δ15N values of dermal tissues were reduced by 0.9‰ and 1.5‰ for Δ13CP-Bl(raw) and Δ15NP-Bl(raw) calculations, respectively.
ΔXparasite-host = δXparasite − δXhost
Scaling of trophic discrimination factors has been shown to exist across parasite-host isotope values, with trophic discrimination factors declining with increasing values of δ13C and δ15N in hosts [54,55]. Pearson’s correlation coefficient was used to determine if this occurred between P. rhincodonicus and whale shark hosts. As parasite-host trophic discrimination factors were significantly reduced with increasing host isotope values (see Section 3), Δ13CP-Bl(raw) and Δ15NP-Bl(raw) were adjusted to account for this correlation, with the adjusted Δ13CP-Bl(adj) and Δ15NP-Bl(adj) values being the predicted values from the estimated isotope values of the blood of whale sharks (Equation (4)):
where δ13CBl and δ15NBl were the estimated isotope values of blood derived from whale shark dermal tissues.
Δ13CP-Bl(adj) = −0.64 × δ13CBl − 11.36
Δ15NP-Bl(adj) = −0.38 × δ13NBl + 4.98
Δ15NP-Bl(adj) = −0.38 × δ13NBl + 4.98
Unadjusted parasite-host trophic discrimination factors (Δ13CP-Bl(raw)/Δ15NP-Bl(raw)) and predicted parasite-host trophic discrimination factors (Δ13CP-Bl(adj)/Δ15NP-Bl(adj)) were both compared to the hypothesised +1‰ and +3.4‰ trophic discrimination factors for 13C and 15N [25], using a one-sample t-test.
An ensemble of generalised linear models (GLM) using a Gaussian distribution was used to determine the drivers of values of δ13C and δ15N in dermal tissues of whale sharks. As whale sharks segregate across foraging habitats according to sex and size [21,56], the standard length and sex of whale sharks were both included in the GLM. Furthermore, δ13C and δ15N values of primary producers can vary over time, reflecting yearly productivity [57], and thus shift the values of δ13C and δ15N in whale shark dermal tissues. For this reason, the sampling year was also included in the GLM. Model selection was conducted to determine which of these three variables had the most substantive effect on values of δ13C and δ15N in dermis tissue. Models were compared to a full subset of predictor variables with full interactions using the MUMIn package in R [58]. Akiake’s Information Criteria corrected for small sample sizes (AICc) and the Bayesian Information Criteria (BIC) were calculated for each run model. Models were then ranked based on the weight (wAICc/wBIC) and the difference between (ΔAICc/ΔBIC) each information criterion for each model, with top-ranking models having a weight (wAICc/wBIC) of ≥10 %. The model’s goodness-of-fit was determined using the adjusted R2 value. Partial dependence plots were produced for the top-ranked models for values of δ13C and δ15N in whale sharks using the visreg package in R [59].
To determine whether P. rhincodonicus could conserve the stable isotope niches of whale shark hosts, we compared niches of whale shark hosts using isotope values derived from whale shark dermal and P. rhincodonicus tissues. To estimate isotopic niches, we calculated point estimates of both standard ellipse areas (SEA) and standard ellipse areas corrected for small sample sizes (SEAc) using the SIBER package in R [60]. Standard ellipses determine the width (foraging habitats) and height (trophic position) of isotopic niches by assessing the bivariate variance in the isotopic values obtained from 40% of the observed data within each group. Here, standard ellipses account for the core isotopic (more central) niches of each assessed group [60]. Alongside point estimates of SEA and SEAc, Bayesian standard ellipses (SEAb) were also calculated to produce a posterior distribution to determine the accuracy of SEA estimates for each group. Posterior SEAb estimates were calculated from an Inverse Wishart prior [60], using two Makov Chain Monte Carlo (MCMC) chains with a length of 20,000 draws and a burn-in of 1000 draws. No thinning was applied to MCMC chains [61]. Isotopic niche overlap was calculated from the first 1000 SEAb draws. To determine the variance in SEAb and isotopic niche overlap estimates, 95 % credible intervals on posterior SEAb and isotopic niche overlap estimates were calculated using the Highest Density Interval (95 % HDI CI) in the bayestestR package in R [62]. Statistical significance was tested using α < 0.05. All statistical tests were conducted in R version 4.0.5 [63].
3. Results
The values of δ13C in the dermal tissue of whale sharks ranged between −16.3 and −14.5‰ (mean = −15.4‰, standard deviation (s.d.) = 0.4, Figure 2), with δ15N values ranging between 6.1 and 10.4‰ (mean = 8.7‰, s.d. = 0.8, Figure 2). The values of δ13C in Pandarus rhincodonicus ranged between −18.0 and −15.7‰ (mean = −16.8‰, s.d. = 0.4, Figure 2), whereas δ15N ranged between 6.9 and 10.7‰ (mean = 9.5‰, s.d. = 0.7, Figure 2). C/N ratios for dermal tissues ranged between 2.8 and 4.6 (mean = 2.9, s.d. = 0.2), whereas C/N ratios for P. rhincodonicus ranged between 3.9 and 5.5 (mean = 4.3, s.d. = 0.3). Acidification had a significant effect on both δ13C values and C/N ratios in P. rhincodonicus tissues, with acidified P. rhincodonicus tissues having significantly lower δ13C values (mean Δ13Cacid-untr = −0.3‰, s.d. = 0.2, p < 0.001, t = −9.86) and significantly higher C/N ratios (mean ΔC/Nacid-untr = 0.2, s.d. = 0.2, p < 0.001, t = 5.22) compared to untreated tissues. However, acidification did not have a significant effect on P. rhincodonicus δ15N values (mean Δ15Nacid-untr = 0.01‰, s.d. = 0.3, p = 0.84, t = 0.20, see Figure S1). To accommodate the effect of acidification on P. rhincodonicus δ13C values, untreated P. rhincodonicus δ13C values were adjusted by −0.3‰. All analyses reported here used these corrected δ13C values for P. rhincodonicus tissues.
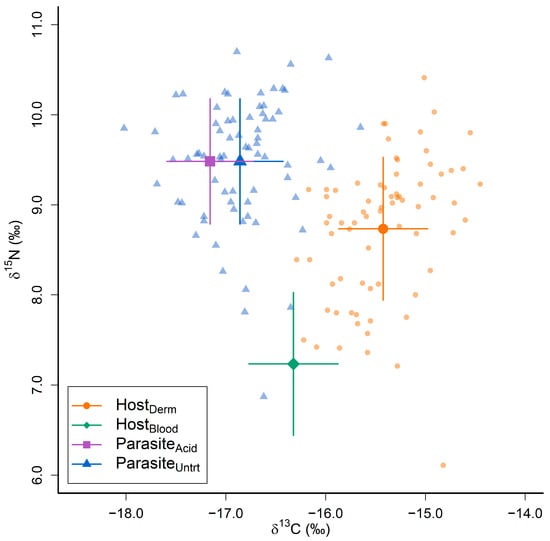
Figure 2.
Stable carbon (δ13C) and nitrogen (δ15N) isotope compositions of whale shark dermal (HostDerm) and estimated blood (HostBlood) tissues, alongside Pandarus rhincodonicus uncorrected (ParasiteUntrt) and corrected (ParasiteAcid) tissues. Large points and lines indicate the mean and standard deviation of δ13C and δ15N values for each tissue type. The smaller transparent points are the raw δ13C and δ15N values obtained from whale shark dermal tissues (HostDerm) and untreated P. rhincodonicus tissues collected for this study.
3.1. Comparing the Stable Carbon and Nitrogen Isotope Compositions of the Parasite and the Host
There were significant positive correlations between values of δ13C and δ15N in P. rhincodonicus and whale shark dermal tissue (r = 0.38, t = 3.31, degrees of freedom (d.f.) = 70, p < 0.01; Figure 3A, and r = 0.81, t = 8.42, d.f. = 70, p < 0.001; Figure 3B, respectively). These relationships did not differ significantly between male and female whale sharks (Table 2).
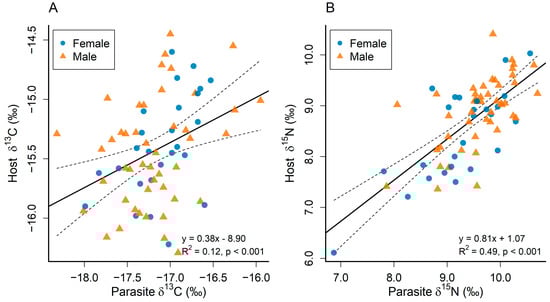
Figure 3.
Correlation between Pandarus rhincodonicus (Parasite) and whale shark host δ13C (A) and δ15N (B) values. The solid black line is the fitted regression, and the dotted lines are the 95% confidence intervals.
Table 2.
Summary of linear regressions analysing the relationship between values of δ13C and δ15N in Pandarus rhincodonicus and whale shark hosts. Asterisks are shown next to the model with the lowest Akiake’s Information Criteria corrected for small sample sizes (AICc); p values are shown in brackets.
P. rhincodonicus samples were depleted in 13C and enriched in 15N when compared to the estimated isotopic values of whale shark blood (mean Δ13CP-Bl(raw) = −0.84, s.d. = 0.49, and mean Δ15NP-Bl(raw) = 2.25, s.d. = 0.57; Figure 4C). There was a significant negative correlation between Δ13CP-Bl(raw) and the estimated δ13C values (r = −0.64, p < 0.001, t = −5.99, R2 = 0.33, d.f. = 70; Figure 4A) and between Δ15NP-Bl(raw) and the estimated δ15N values (r = −0.38, p < 0.001, t = −5.11, R2 = 0.26, d.f. = 50; Figure 4B) of whale shark blood. When accounting for the negative correlation between Δ13CP-Bl(raw)/Δ15NP-Bl(raw) values and host isotopic composition, both Δ13CP-Bl(adj) and Δ15NP-Bl(adj) reduced in variability (mean Δ13CP-Bl(adj) = −0.84, s.d. = 0.28; mean Δ15NP-Bl(adj) = 2.25, s.d. = 0.30; Figure 4C). Both Δ13CP-Bl(raw) and Δ13CP-Bl(adj) were significantly lower than the hypothesised trophic discrimination factor of +1‰for Δ13CP-Bl (p < 0.001, t = −31.50 and p < 0.001, t = −54.08, respectively). Additionally, both Δ15NP-Bl(raw) and Δ15NP-Bl(adj) were significantly lower than the hypothesised +3.4‰ for Δ15NP-Bl (p < 0.001, t = −16.99 and p < 0.001, t = −32.61, respectively; Figure 4C).
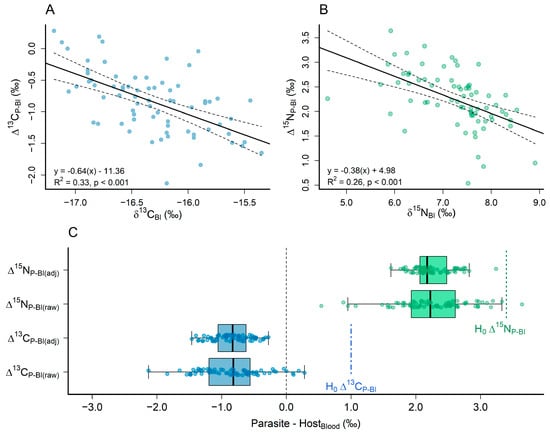
Figure 4.
Correlations between parasite-host trophic discrimination factors (Δ13CP-Bl/Δ15NP-Bl) and estimated (A) δ13CBl and (B) δ15NBl values of the blood of the whale shark hosts (Wyatt et al. 2019). Solid and dashed lines in plots (A,B) show the fitted regression line and 95% confidence intervals, respectively. (C) Boxplots showing the raw and adjusted trophic discrimination factors between P. rhincodonicus and estimated whale shark blood isotope values (Δ13CP-Bl(raw)/Δ15NP-Bl(raw) and Δ13CP-Bl(adj)/Δ15N(P-Bl(adj)). Dashed lines in plot (C) show hypothesised trophic discrimination factors of +1‰ (Δ13CP-Bl) and +3.4‰ (Δ15NP-Bl) for δ13C and δ15N [25]. Blue points, bars, and lines are the trophic discrimination factors for δ13C, whereas green points, bars, and lines are the trophic discrimination factors for δ15N.
3.2. Drivers of Stable Isotope Composition of Whale Sharks
The ensemble of GLMs indicated that length and year had the most influence on the isotopic composition of whale sharks, with all the best models from the ensemble (wAICc ≥ 10%) including body length and sampling year as predictor variables for host dermal δ13C and δ15N values (Table 3). Model selection based on AICc and BIC diverged in the selection of the best model for determining dermal δ13C values but converged in the selection of the best model for determining δ15N values, selecting only shark length and year (Table 3). Values of δ13C in dermal tissue were significantly positively correlated with whale shark length (r = 0.14, t = 3.83, p < 0.001; Figure 5A), and varied significantly across years (F(5, 64) = 5.52, p < 0.001, Figure 5B). Despite the inclusion of shark sex significantly improving model fit for dermal δ13C values (p = 0.02, F = 5.63), the slope intercept did not vary significantly between sexes (p = 0.12, t = −1.59; Figure 5C). Values of δ15N in dermal tissue also increased significantly with length (r = 0.29, t = 5.16, p < 0.001; Figure 5D), with the year of sampling also having a significant influence on shark isotopic compositions (F(5, 64) = 8.50, p < 0.001; Figure 5E).
Table 3.
Selection of the best linear models fitted to values of δ13C and δ15N of the dermal tissue of whale sharks. Akiake’s Information Criteria corrected for small sample sizes (AICc) and the Bayesian Information Criteria (BIC) are shown for each model. Weights and differences in AICc and BIC across run models were wAICc/wBIC and ΔAICc/ΔBIC, respectively. The presented models had a weight of ≥10% in AICc. The model with the lowest AICc is bracketed (). The model with the lowest BIC is asterisked *.
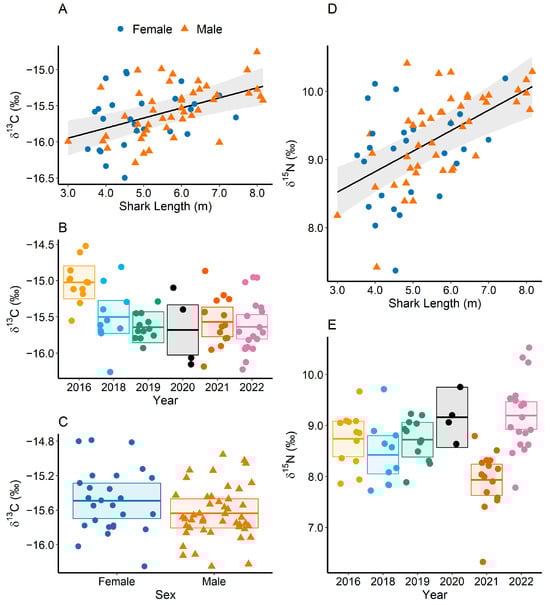
Figure 5.
Partial dependence plots of the best models selected using AICc to infer values of δ13C in dermal tissue of whale sharks according to length (A), year (B), and sex (C) and values of δ15N according to length (D) and year (E). Females are shown as solid blue circles and males as orange triangles in subplots (A,C,D). Partial linear regression and 95 % confidence intervals are shown with a black line and grey area in subplots (A,D). Boxes in subplots (B,C,E) show the mean, upper, and lower 95 % confidence intervals of partial residuals. Different colours in subplots (B,E) indicate different sample years.
3.3. Isotopic Niches of Whale Sharks and Parasites
In the analysis of dermal tissues of whale sharks, females had a relatively large niche size compared to males (Figure 6A,B), with the point estimates of SEA and SEAc being higher in females (SEA = 1.20‰2 and SEAc = 1.25‰2) than in males (SEA = 0.81‰2 and SEAc = 0.82‰2). Females also exhibited greater uncertainty in SEA estimates as reflected in posterior SEAb estimates (SEAb 95% HDI CI = [0.81, 1.77]‰2, median SEAb = 1.22‰2) than males (SEAb 95% HDI CI = [0.61, 1.09]‰2, median SEAb = 0.82‰2; Figure 6B). Both males and females had low to moderate amounts of overlap in isotopic niches (Bayesian 95 % HDI CI = [4.46, 55.76]%, median = 30.49%). Similarly, when isotopic niches were derived from P. rhincodonicus tissues, female whale shark hosts had a larger niche size and variance (SEA = 0.92‰2, SEAc = 0.96‰2, SEAb 95 % HDI CI = [0.63, 1.36]‰2, median SEAb = 0.94‰2) than male whale shark hosts (SEA = 0.87‰2, SEAc = 0.89‰2, SEAb 95% HDI CI = [0.64, 1.15]‰2, median SEAb = 0.87‰2; Figure 6C,D). Both male and female hosts had moderate overlap of niches (Bayesian 95% HDI CI = [5.69, 62.64]%, median = 32.28%).
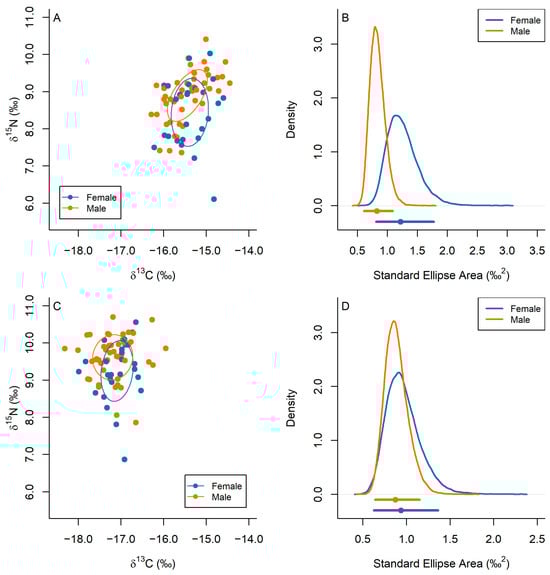
Figure 6.
Isotopic niches (A,C) and kernel density of posterior estimates of isotopic niche sizes (B,D) of female (blue) and male (orange) whale shark hosts, derived from δ13C and δ15N values from (A,B) whale shark dermal tissues and (C,D) P. rhincodoncius tissues. Ellipses in sub-plots (A,C) reflect the 40% variation in δ13C and δ15N across male and female whale sharks, respectively. Points and lines underneath kernel density curves indicate the median and 95 % highest density interval credible interval values.
4. Discussion
The δ15N values of the copepod parasite Pandarus rhincodonicus were closely correlated (R2 = 0.49, p < 0.001) with those of the dermal tissue of the whale shark host, suggesting that the parasite provides a good proxy of the trophic position of the whale shark. This correlation extended across a wide range of δ15N values, with one shark displaying a relatively low trophic position (δ15N of 6.1‰ vs. an average δ15N value of 8.7‰) that was closely matched by its parasite (Figure 3B). In contrast, there was more variance in the relationship between δ13C values in the copepod and dermal tissue of whale sharks (R2 = 0.12, p < 0.001; Figure 3A).
Whale sharks are highly migratory, moving between neritic and oceanic habitats over periods of days to months [20]. Given that the lifespan of P. rhincodonicus is likely to be very short (only a few months [44]) relative to the turnover time of the host dermis (possibly many months-years [14]), a close correlation between values of δ15N in the parasite and host implies that individual whale sharks feed at similar levels of the food chain both at Ningaloo Reef and at other neritic and oceanic locations. This correlation occurred despite a range in the trophic position of sharks, potentially implying some degree of specialisation in diet among individuals. In contrast, the greater degree of variation in the relationship between values of δ13C in the parasite and the host probably reflects differences in their respective lifecycles and tissue turnover times. Even if sharks target similar prey, the source of carbon for food chains will be 13C enriched in neritic habitats and 13C depleted in the open ocean [31]. Thus, the strength of the correlation between values of δ13C in the host and parasite could depend on the timing and duration of the shark’s occupation of different habitats and the location and timing of successful recruitment of copepods. Slow turnover of whale shark dermal tissue may result in δ13C values reflecting foraging habitats across a wide spatial and temporal range, including both open-ocean environments and other neritic regions beyond Ningaloo Reef [21], whereas δ13C values in P. rhincodonicus may only be representative of the foraging habitat where parasite attachment occurred. Consequently, a better understanding of the life history and ecology of P. rhincodonicus will be required to interpret relationships between values of δ13C in the parasite and the host. Despite this challenge, results from this study show that copepods offer an accurate and less invasive method than biopsies to assess the trophic status of whale sharks. Given that copepods feed on whale sharks [15], it was expected that they should display trophic discrimination factors of +1‰ and +3.4‰ of Δ13C and Δ15N, respectively, due to their higher trophic position [25] (Figure 4C). This was not the case, with copepods being depleted in 13C and only modestly enriched in 15N compared to the estimates for whale shark blood (Figure 4C). These results were consistent with earlier isotopic analyses by Marcus et al. (2017) [49] and imply that the generalised trophic discrimination factors typically used for food web reconstruction do not necessarily apply to this parasite-host pairing. Many other isotopic studies of host-parasite parings report similar findings, with previous research showing that δ13C and δ15N values in parasites can be higher, lower, or similar to the isotopic composition of hosts regardless of the parasitised tissue, feeding method, and species of host or parasite [55,64,65,66,67].
For P. rhincodonicus, this result could be due to the selective consumption and metabolism of lipids within the blood. Parasitic copepods have been shown to selectively utilise lipids from host tissues [68], leading to a lipid-rich diet [65]. As lipids are depleted in 13C [69], a lipid-rich diet resulting from the preferential uptake and assimilation of lipids by copepods would lower δ13C values in their tissues when compared to whale shark blood, resulting in negative Δ13CP-Bl(raw) and Δ13CP-Bl(adj) values [65].
In addition to differences in standard trophic discrimination factors, we found a significant negative correlation between Δ13CP-Bl and Δ15NP-Bl values with increasing host δ13C and δ15N values (Figure 4A,B). Although such observations have been reported in other studies [54,55], this result increases the evidence against the use of fixed trophic discrimination factors for food web reconstructions using isotopes [55,70]. The mechanism driving this scaling of Δ13CP-Bl and Δ15NP-Bl values is unknown, but it has been suggested that the scaling Δ15N values may occur as a result of an increase in the protein quality of tissues of the host as it grows and moves up the food chain [55]. High dietary protein quality (low amino acid imbalance between consumer and diet, usually occurring at higher trophic positions [71]) can reduce trophic discrimination factors of 15N by increasing the direct routing of essential amino acids from diet to consumer tissues [14,71]. For this reason, fewer non-essential amino acids are required to be metabolised during tissue synthesis, in turn reducing Δ15N fractionation between P. rhincodonicus and whale sharks at higher trophic positions [55]. Future comparisons of fatty acids between P. rhincodonicus and their whale shark hosts’ tissue may clarify whether this is the case.
It has also been argued that differences from standard trophic discrimination factors in parasite-host parings might be due to a mismatch between the host tissue selected by researchers for analysis and the tissue actually consumed by the parasite [55,72]. It was assumed that copepods fed on whale shark blood because removal of the parasite from the shark typically revealed an area of inflamed scar tissue where dermal denticles were not present that released small amounts of blood. However, due to logistical and ethical constraints [37], blood could not be directly sampled from sharks in situ, and we were forced to adjust values for δ13C and δ15N in dermal tissues to those of blood using data from an earlier study [14]. This assumed that whale shark blood was in equilibrium with their diet, and access to blood for analysis from wild-ranging animals [36] would allow this issue to be clarified in future studies.
Despite these complications in determining appropriate tissue discrimination factors, the parasitic copepod and dermal tissue provided very similar estimates of niche width and overlap between male and female whale shark hosts, showing that P. rhincodonicus was able to conserve the relative differences in isotopic niches between host male and female whale sharks (Figure 6). Interestingly, we found lower isotopic niche overlap between male and female whale sharks than compared to other studies at Ningaloo Reef [21], likely a result of our study constraining niche size estimates to the core isotopic niches (40% of observations versus 95% of observations in Marcus et al. (2019) [21]) of whale shark hosts [60]. Furthermore, low-to-moderate isotopic niche overlap between male and female whale sharks shown from both parasite and dermal tissue estimates can therefore indicate some amount of niche specialisation between male and female whale sharks as a result of ontogenetic variability in diet and sexual segregation across foraging habitats.
There were positive correlations between body size and values of both δ13C and δ15N in whale sharks. This implied that sharks had a stronger neritic signal in the carbon source of food chains as they grew and that they tended to move up the food chain with increasing size. This pattern was consistent across both sexes, with females displaying a smaller trend of increase of δ13C with size compared to males. The year of sampling was also significant, although plots showed that this was the result of a change in a single year for both δ13C and δ15N (2016 and 2021, respectively) and thus possibly an artefact of small sample sizes.
Increasing trophic levels with the size of whale sharks has now been reported by multiple studies both at Ningaloo [15,21] and across a number of localities in the Indo-Pacific [56,73]. It seems likely that as sharks grow, they can swim faster to access more mobile prey, such as small fish, rather than being more dependent on passive ram filter feeding. At Ningaloo, sharks have been observed feeding on schools of baitfish [13] that have been aggregated by small predatory fish such as tuna. Furthermore, adult whale sharks are often found in association with tuna schools in the open ocean, and it has been suggested that they feed on small schooling fish aggregated by tuna hunting behaviour [73].
The increase in δ13C with increasing size implies that these sharks may remain in neritic waters for longer periods as they grow towards maturity (around 8 m length for males at Ningaloo [5]). However, daytime observations of whale sharks show that juvenile males dominate aggregation sites at Ningaloo, with very few larger adults being present at the aggregation site [5]. Stable isotope enrichment could also occur due to larger animals being more able to access prey that is reliant on a neritic food web than smaller sharks, or larger sharks feeding more indiscriminately in surface waters and thus being more likely to ingest marine debris such as seaweed. Alternatively (or in addition), larger sharks may swim faster, reducing transit times between neritic feeding sites and leading to an increase in δ13C values with increasing size. At present, it is not possible to distinguish among these hypotheses, which will require dedicated sampling using video and accelerometer tags.
Our study provides the first observations of parasite-host isotope relationships for a pandarid copepod and a shark. The positive correlations that we observed between δ15N values of the parasite and the host concur with research across a range of studies, which have shown that parasites can trace changes in the isotopic values of their host [67,74,75]. Pandarid copepods are frequent ectoparasites of elasmobranchs; however, unlike the host-specific P. rhincodonicus, most have widespread distributions and limited host specificity, so that multiple species can infest a single species of host [76]. For example, seven species of pandarid copepod parasites have been found on an individual white shark (Carcharodon carcharias Linnaeus, 1758) [77] in New Zealand [78], and five species on a white shark captured in waters off California [79]. Benz et al. (2003) [79] suggested that the diverse infections by these parasites may reflect the large-scale movement of host sharks through habitats occupied by other elasmobranchs. The extent to which the isotopic composition of these other pandarids could mirror that of host sharks will depend on the life cycle and host fidelity after attachment of each species. At present, we know relatively little about these traits of pandarid copepods [76]. It seems unlikely that P. rhincodonicus undergoes major trophic changes after attachment to whale shark hosts, given the close correlation of δ15N values between the parasite and host across a range of copepod sizes. There is also good evidence P. rhincodonicus do not change whale shark hosts once attached [40]. The utility of other species of pandarid copepods as proxies for the trophic position of host sharks will depend on the extent to which such parasites share these key life history traits with P. rhincodonicus.
5. Conclusions
The values of δ15N isotopes in P. rhincodonicus were a good indicator of host trophic position, and comparison of parasite and host dermal tissue suggests that the trophic position of the host remains consistent over short (months) and long (years) time scales despite movement of the species across multiple foraging habitats. Given this pattern, variation in trophic levels and isotopic niches across whale sharks suggests the potential for some degree of dietary specialisation among individuals. This study also found evidence for ontogenetic dietary shifts for whale shark hosts, consistent with previous findings at Ningaloo Reef and in other regions across the Indo-Pacific. Although P. rhincodonicus can be used to track the tropic position of the host, uncertainties surrounding the life history and ecology of the parasite must be resolved to interpret how the δ13C values of the parasite relate to those of the host. Thus, for the moment, analysis of the foraging ecology of whale sharks will still require the collection of biopsy samples.
Supplementary Materials
The following supporting information can be downloaded at: https://www.mdpi.com/article/10.3390/fishes8050261/s1, Table S1: δ13C and δ15N values and C/N ratios of whale shark dermal tissue and their host-specific parasitic copepod, Pandarus rhincodonicus, collected at Ningaloo Reef between 2016 and 2022. δ13CU in P. rhincodonicus indicates the unacidified δ13C values obtained from P. rhincodonicus tissue, whereas δ13CA indicates the δ13C values adjusted for acidification to remove carbonates. C/NU indicates the C/N ratios obtained directly from P. rhincodonicus tissue. Latitude and longitude of sample collections are in degree decimals (WGS 84); NA are used where latitude and longitude values could not be recorded. Table S2: Isotope values of whale shark dermis and P. rhincodonicus used for acidification treatment. Untreated P. rhincodonicus δ13C, δ15N values, and C/N ratios are indicated as ParasiteUntrt, whereas acidified δ13C, δ15N values, and C/N ratios are indicated as ParasiteAcid. Samples from female (F) and male (M) whale sharks are identified. N/A values occurred where δ13C, δ15N or C/N ratios could not be obtained from P. rhincodonicus samples. P. rhincodonicus samples that contained missing δ13C, δ15N or C/N ratios in either ParasiteUntrt or ParasiteAcid were removed for Δ13CAcid-Untrt, Δ15NAcid-Untrt, and ΔC/NAcid-Untrt calculations. Figure S1: Differences between acidified (ParasiteAcid) and untreated (ParasiteUntreated) δ13C and δ15N values and C/N ratios of Pandarus rhincodonicus.
Author Contributions
Conceptualization, M.M. and G.S.; methodology, G.S.; software, B.J.O. and G.S.; validation, G.S. and M.M.; formal analysis, B.J.O. and G.S.; investigation, B.J.O. and G.S.; resources, M.M. and G.S.; data curation, B.J.O. and G.S.; writing—original draft preparation, B.J.O.; writing—review and editing, B.J.O., M.M., and G.S.; visualization, B.J.O.; supervision, M.M. and G.S.; project administration, M.M.; funding acquisition, M.M. All authors have read and agreed to the published version of the manuscript.
Funding
This project was funded by Santos Ltd. and the Australian Institute of Marine Science. B.J.O was supported by a research grant from The University of Western Australia.
Institutional Review Board Statement
Sampling for this project was conducted under an ethics permit (2019/RA/3/100/1715) granted by The University of Western Australia. Access to Ningaloo Reef and collection of biological material was licensed by the Western Australian Department of Biodiversity, Conservation, and Attractions.
Data Availability Statement
The data presented in this study are available in the supplementary materials. All data and code used for statistical analyses in this paper are available on a public GitHub repository: https://github.com/brendonosorio/Osorio_et_al_2023_parasite and in a public (accessed on 7 May 2023). Zenodo repository: https://doi.org/10.5281/zenodo.7927641 (accessed on 7 May 2023).
Acknowledgments
We would like to thank the numerous staff, students, and volunteers who collected biopsy and parasite samples from whale sharks at Ningaloo Reef, particularly Kim Brooks. We would also like to thank Douglas Ford and Ela Skrzypek from the Western Australian Biogeochemistry Centre for their laboratory assistance and Luciana Ferreira from the Australian Institute of Marine Science for their statistical advice.
Conflicts of Interest
The authors declare no conflict of interest.
References
- Smith, A. Descriptions of New, or Imperfectly Known Objects of the Animal Kingdom, Found in the South of Africa. Afr. Commer. Advert. 1828, 3, 2. [Google Scholar]
- McClain, C.R.; Balk, M.A.; Benfield, M.C.; Branch, T.A.; Chen, C.; Cosgrove, J.; Dove, A.M.; Gaskins, L.; Helm, R.R.; Hochberg, F.G.; et al. Sizing Ocean Giants: Patterns of Intraspecific Size Variation in Marine Megafauna. PeerJ 2015, 3, e715. [Google Scholar] [CrossRef] [PubMed]
- Compagno, L.J. Sharks of the World: An Annotated and Illustrated Catalogue of Shark Species Known to Date; Food & Agriculture Organization: Rome, Italy, 2001; Volume 2, ISBN 92-5-104543-7. [Google Scholar]
- Pierce, S.J.; Norman, B. Rhincodon typus. The IUCN Red List of Threatened Species 2016; IUCN Red List: London, UK, 2016; p. e.T19488A236529. [Google Scholar] [CrossRef]
- Meekan, M.G.; Taylor, B.M.; Lester, E.; Ferreira, L.C.; Sequeira, A.M.M.; Dove, A.D.M.; Birt, M.J.; Aspinall, A.; Brooks, K.; Thums, M. Asymptotic Growth of Whale Sharks Suggests Sex-Specific Life-History Strategies. Front. Mar. Sci. 2020, 7, 575683. [Google Scholar] [CrossRef]
- Jarman, S.N.; Wilson, S.G. DNA-Based Species Identification of Krill Consumed by Whale Sharks. J. Fish Biol. 2004, 65, 586–591. [Google Scholar] [CrossRef]
- Ketchum, J.T.; Galván-Magaña, F.; Klimley, A.P. Segregation and Foraging Ecology of Whale Sharks, Rhincodon Typus, in the Southwestern Gulf of California. Environ. Biol. Fishes 2013, 96, 779–795. [Google Scholar] [CrossRef]
- Meekan, M.G.; Jarman, S.N.; McLean, C.; Schultz, M.B. DNA Evidence of Whale Sharks (Rhincodon Typus) Feeding on Red Crab (Gecarcoidea Natalis) Larvae at Christmas Island, Australia. Mar. Freshw. Res. 2009, 60, 607–609. [Google Scholar] [CrossRef]
- Motta, P.J.; Maslanka, M.; Hueter, R.E.; Davis, R.L.; de la Parra, R.; Mulvany, S.L.; Habegger, M.L.; Strother, J.A.; Mara, K.R.; Gardiner, J.M.; et al. Feeding Anatomy, Filter-Feeding Rate, and Diet of Whale Sharks Rhincodon Typus during Surface Ram Filter Feeding off the Yucatan Peninsula, Mexico. Zoology 2010, 113, 199–212. [Google Scholar] [CrossRef]
- Sampaio, C.L.S.; Leite, L.; Reis-Filho, J.A.; Loiola, M.; Miranda, R.J.; de Anchieta, C.C.; Nunes, J.; Macena, B.C.L. New Insights into Whale Shark Rhincodon Typus Diet in Brazil: An Observation of Ram Filter-Feeding on Crab Larvae and Analysis of Stomach Contents from the First Stranding in Bahia State. Environ. Biol. Fishes 2018, 101, 1285–1293. [Google Scholar] [CrossRef]
- Boldrocchi, G.; Bettinetti, R. Whale Shark Foraging on Baitfish off Djibouti. Mar. Biodivers. 2019, 49, 2013–2016. [Google Scholar] [CrossRef]
- Montero-Quintana, A.N.; Ocampo-Valdez, C.F.; Vázquez-Haikin, J.A.; Sosa-Nishizaki, O.; Osorio-Beristain, M. Whale Shark (Rhincodon Typus) Predatory Flexible Feeding Behaviors on Schooling Fish. J. Ethol. 2021, 39, 399–410. [Google Scholar] [CrossRef]
- Lester, E.; Cannon, T.; Lawrence, S.; Wilton, J.; Araujo, G.; Chin, A.; Lester, E.; Cannon, T.; Lawrence, S.; Wilton, J.; et al. Whale Sharks (Rhincodon Typus) Feed on Baitfish with Other Predators at Ningaloo Reef. Pac. Conserv. Biol. 2022, 29, 86–87. [Google Scholar] [CrossRef]
- Wyatt, A.S.J.; Matsumoto, R.; Chikaraishi, Y.; Miyairi, Y.; Yokoyama, Y.; Sato, K.; Ohkouchi, N.; Nagata, T. Enhancing Insights into Foraging Specialization in the World’s Largest Fish Using a Multi-Tissue, Multi-Isotope Approach. Ecol. Monogr. 2019, 89, e01339. [Google Scholar] [CrossRef]
- Meekan, M.G.; Virtue, P.; Marcus, L.; Clements, K.D.; Nichols, P.D.; Revill, A.T. The World’s Largest Omnivore Is a Fish. Ecology 2022, 103, e3818. [Google Scholar] [CrossRef]
- Rohner, C.A.; Couturier, L.I.E.; Richardson, A.J.; Pierce, S.J.; Prebble, C.E.M.; Gibbons, M.J.; Nichols, P.D. Diet of Whale Sharks Rhincodon Typus Inferred from Stomach Content and Signature Fatty Acid Analyses. Mar. Ecol. Prog. Ser. 2013, 493, 219–235. [Google Scholar] [CrossRef]
- Marcus, L.; Virtue, P.; Pethybridge, H.R.; Meekan, M.G.; Thums, M.; Nichols, P.D. Intraspecific Variability in Diet and Implied Foraging Ranges of Whale Sharks at Ningaloo Reef, Western Australia, from Signature Fatty Acid Analysis. Mar. Ecol. Prog. Ser. 2016, 554, 115–128. [Google Scholar] [CrossRef]
- Gleiss, A.; Wright, S.; Liebsch, N.; Wilson, R.; Norman, B. Contrasting Diel Patterns in Vertical Movement and Locomotor Activity of Whale Sharks at Ningaloo Reef. Mar. Biol. 2013, 160, 2981–2992. [Google Scholar] [CrossRef]
- Meekan, M.; Fuiman, L.; Davis, R.; Berger, Y.; Thums, M. Swimming Strategy and Body Plan of the World’s Largest Fish: Implications for Foraging Efficiency and Thermoregulation. Front. Mar. Sci. 2015, 2, 64. [Google Scholar] [CrossRef]
- Norman, B.M.; Reynolds, S.; Morgan, D.L. Does the Whale Shark Aggregate along the Western Australian Coastline beyond Ningaloo Reef? Pac. Conserv. Biol. 2016, 22, 72–80. [Google Scholar] [CrossRef]
- Marcus, L.; Virtue, P.; Nichols, P.D.; Ferreira, L.C.; Pethybridge, H.; Meekan, M.G. Stable Isotope Analysis of Dermis and the Foraging Behavior of Whale Sharks at Ningaloo Reef, Western Australia. Front. Mar. Sci. 2019, 6, 546. [Google Scholar] [CrossRef]
- Hussey, N.E.; Brush, J.; McCarthy, I.D.; Fisk, A.T. Delta15N and Delta13C Diet-Tissue Discrimination Factors for Large Sharks under Semi-Controlled Conditions. Comp. Biochem. Physiol. A Mol. Integr. Physiol. 2010, 155, 445–453. [Google Scholar] [CrossRef]
- Olin, J.A.; Hussey, N.E.; Grgicak-Mannion, A.; Fritts, M.W.; Wintner, S.P.; Fisk, A.T. Variable Δ15N Diet-Tissue Discrimination Factors among Sharks: Implications for Trophic Position, Diet and Food Web Models. PLoS ONE 2013, 8, e77567. [Google Scholar] [CrossRef] [PubMed]
- Sánchez-Hernández, J.; Nunn, A.D.; Adams, C.E.; Amundsen, P.-A. Causes and Consequences of Ontogenetic Dietary Shifts: A Global Synthesis Using Fish Models. Biol. Rev. 2019, 94, 539–554. [Google Scholar] [CrossRef] [PubMed]
- Minagawa, M.; Wada, E. Stepwise Enrichment of 15N along Food Chains: Further Evidence and the Relation between Δ15N and Animal Age. Geochim. Cosmochim. Acta 1984, 48, 1135–1140. [Google Scholar] [CrossRef]
- Post, D.M. Using Stable Isotopes to Estimate Trophic Position: Models, Methods, and Assumptions. Ecology 2002, 83, 703–718. [Google Scholar] [CrossRef]
- Newsome, S.D.; Martinez del Rio, C.; Bearhop, S.; Phillips, D.L. A Niche for Isotopic Ecology. Front. Ecol. Environ. 2007, 5, 429–436. [Google Scholar] [CrossRef]
- Kopp, D.; Lefebvre, S.; Cachera, M.; Villanueva, M.C.; Ernande, B. Reorganization of a Marine Trophic Network along an Inshore–Offshore Gradient Due to Stronger Pelagic–Benthic Coupling in Coastal Areas. Prog. Oceanogr. 2015, 130, 157–171. [Google Scholar] [CrossRef]
- Christianen, M.J.A.; Middelburg, J.J.; Holthuijsen, S.J.; Jouta, J.; Compton, T.J.; van der Heide, T.; Piersma, T.; Sinninghe Damsté, J.S.; van der Veer, H.W.; Schouten, S.; et al. Benthic Primary Producers Are Key to Sustain the Wadden Sea Food Web: Stable Carbon Isotope Analysis at Landscape Scale. Ecology 2017, 98, 1498–1512. [Google Scholar] [CrossRef]
- von Biela, V.R.; Newsome, S.D.; Bodkin, J.L.; Kruse, G.H.; Zimmerman, C.E. Widespread Kelp-Derived Carbon in Pelagic and Benthic Nearshore Fishes Suggested by Stable Isotope Analysis. Estuar. Coast. Shelf Sci. 2016, 181, 364–374. [Google Scholar] [CrossRef]
- Duffill Telsnig, J.I.; Jennings, S.; Mill, A.C.; Walker, N.D.; Parnell, A.C.; Polunin, N.V.C. Estimating Contributions of Pelagic and Benthic Pathways to Consumer Production in Coupled Marine Food Webs. J. Anim. Ecol. 2019, 88, 405–415. [Google Scholar] [CrossRef]
- Skinner, C.; Newman, S.P.; Mill, A.C.; Newton, J.; Polunin, N.V.C. Prevalence of Pelagic Dependence among Coral Reef Predators across an Atoll Seascape. J. Anim. Ecol. 2019, 88, 1564–1574. [Google Scholar] [CrossRef]
- Carter, W.A.; Bauchinger, U.; McWilliams, S.R. The Importance of Isotopic Turnover for Understanding Key Aspects of Animal Ecology and Nutrition. Diversity 2019, 11, 84. [Google Scholar] [CrossRef]
- Wilson, S.G.; Polovina, J.J.; Stewart, B.S.; Meekan, M.G. Movements of Whale Sharks (Rhincodon Typus) Tagged at Ningaloo Reef, Western Australia. Mar. Biol. 2006, 148, 1157–1166. [Google Scholar] [CrossRef]
- Hearn, A.; Green, J.R.; Peñaherrera-Palma, C.; Reynolds, S.; Rohner, C.A.; Román, M.; Sequeira, A.M.M. Whale Shark Movements and Migrations. In Whale Sharks: Biology, Ecology and Conservation; Dove, A.D.M., Pierce, S.J., Eds.; CRC Press: Boca Raton, FL, USA, 2021; Volume 1, pp. 105–128. ISBN 978-1-03-204940-3. [Google Scholar]
- Pierce, S.J.; Pardo, S.A.; Rohner, C.A.; Matsumoto, R.; Murakumo, K.; Nozu, R.; Dove, A.D.M.; Perry, C.; Meekan, M.G. Whale Shark Reproduction, Growth, and Demography. In Whale Sharks: Biology, Ecology and Conservation; Dove, A.D.M., Pierce, S.J., Eds.; CRC Press: Boca Raton, FL, USA, 2021; Volume 1, pp. 13–46. ISBN 978-1-03-204940-3. [Google Scholar]
- Ueda, K.; Yanagisawa, M.; Murakumo, K.; Matsumoto, Y.; Sato, K.; Uchida, S. Physical Examination, Blood Sampling and Sedation of Large Elasmobranchs. In The Elasmobranch Husbandry Manual II: Recent Advances in the Care of Sharks, Rays and their Relatives; Smith, M., Warmolts, D., Thoney, D., Hueter, R., Murray, M., Ezcurra, J., Eds.; Ohio Biological Survey, Inc.: Columbus, OH, USA, 2017; pp. 255–262. ISBN 978-0-86727-166-9. [Google Scholar]
- Caira, J.N.; Jensen, K. A Digest of Elasmobranch Tapeworms. J. Parasitol. 2014, 100, 373–391. [Google Scholar] [CrossRef]
- Norman, B.M.; Newbound, D.R.; Knott, B. A New Species of Pandaridae (Copepoda), from the Whale Shark Rhincodon Typus (Smith). J. Nat. Hist. 2000, 34, 355–366. [Google Scholar] [CrossRef]
- Meekan, M.; Austin, C.M.; Tan, M.H.; Wei, N.-W.V.; Miller, A.; Pierce, S.J.; Rowat, D.; Stevens, G.; Davies, T.K.; Ponzo, A.; et al. IDNA at Sea: Recovery of Whale Shark (Rhincodon Typus) Mitochondrial DNA Sequences from the Whale Shark Copepod (Pandarus Rhincodonicus) Confirms Global Population Structure. Front. Mar. Sci. 2017, 4, 420. [Google Scholar] [CrossRef]
- Borucinska, J.D.; Benz, G.W. Lesions Associated with Attachment of the Parasitic Copepod Phyllothyreus Cornutus (Pandaridae: Siphonostomatoida) to Interbranchial Septa of Blue Sharks. J. Aquat. Anim. Health 1999, 11, 290–295. [Google Scholar] [CrossRef]
- Dippenaar, S.M.; Jordaan, A. How Females of Achtheinus Spp. (Pandaridae: Siphonostomatoida) Attach to Their Elasmobranch Hosts with Notes on Their Effects on the Hosts’ Fins. Folia Parasitol. 2015, 62, 005. [Google Scholar] [CrossRef]
- Womersley, F.; Hancock, J.; Perry, C.T.; Rowat, D. Wound-Healing Capabilities of Whale Sharks (Rhincodon Typus) and Implications for Conservation Management. Conserv. Physiol. 2021, 9, coaa120. [Google Scholar] [CrossRef]
- Williams, E.H.; Bunkley-Williams, L. Life Cycle and Life History Strategies of Parasitic Crustacea. In Parasitic Crustacea: State of Knowledge and Future Trends; Smit, N.J., Bruce, N.L., Hadfield, K.A., Eds.; Springer International Publishing: Cham, Switzerland, 2019; pp. 179–266. ISBN 978-3-030-17385-2. [Google Scholar]
- Sequeira, A.M.M.; Thums, M.; Brooks, K.; Meekan, M.G. Error and Bias in Size Estimates of Whale Sharks: Implications for Understanding Demography. R. Soc. Open Sci. 2016, 3, 150668. [Google Scholar] [CrossRef]
- Bessey, C.; Vanderklift, M.A. Drying Method Has No Substantial Effect on Δ15N or Δ13C Values of Muscle Tissue from Teleost Fishes. Rapid Commun. Mass Spectrom. 2014, 28, 265–273. [Google Scholar] [CrossRef]
- Zalina, B.; Maizah, M.A.; Mohd Uzair, R. Comparisons between Tissues, Preservation, and Desiccation Methods on Stable Isotopes Δ13C and Δ15N of Spot-Tail Sharks (Carcharhinus Sorrah) from the South China Sea. Turk. J. Fish. Aquat. Sci. 2020, 20, 711–716. [Google Scholar] [CrossRef]
- Bennett-Williams, J.; Skinner, C.; Wyatt, A.S.J.; McGill, R.A.R.; Willis, T.J. A Multi-Tissue, Multi-Species Assessment of Lipid and Urea Stable Isotope Biases in Mesopredator Elasmobranchs. Front. Mar. Sci. 2022, 9, 821478. [Google Scholar] [CrossRef]
- Marcus, L.; Virtue, P.; Nichols, P.D.; Meekan, M.G.; Pethybridge, H. Effects of Sample Treatment on the Analysis of Stable Isotopes of Carbon and Nitrogen in Zooplankton, Micronekton and a Filter-Feeding Shark. Mar. Biol. 2017, 164, 124. [Google Scholar] [CrossRef]
- Kolasinski, J.; Rogers, K.M.; Frouin, P. Effects of Acidification on Carbon and Nitrogen Stable Isotopes of Benthic Macrofauna from a Tropical Coral Reef. Rapid Commun. Mass Spectrom. 2008, 22, 2955–2960. [Google Scholar] [CrossRef]
- Skrzypek, G.; Paul, D. Delta13C Analyses of Calcium Carbonate: Comparison between the GasBench and Elemental Analyzer Techniques. Rapid Commun. Mass. Spectrom. 2006, 20, 2915–2920. [Google Scholar] [CrossRef]
- Coplen, T.B. Guidelines and Recommended Terms for Expression of Stable-Isotope-Ratio and Gas-Ratio Measurement Results. Rapid Commun. Mass. Spectrom. 2011, 25, 2538–2560. [Google Scholar] [CrossRef]
- Skrzypek, G. Normalization Procedures and Reference Material Selection in Stable HCNOS Isotope Analyses: An Overview. Anal. Bioanal. Chem. 2013, 405, 2815–2823. [Google Scholar] [CrossRef]
- Riekenberg, P.M.; Briand, M.J.; Moléana, T.; Sasal, P.; van der Meer Marcel, T.J.; Thieltges, D.W.; Letourneur, Y. Isotopic Discrimination in Helminths Infecting Coral Reef Fishes Depends on Parasite Group, Habitat within Host, and Host Stable Isotope Value. Sci. Rep. 2021, 11, 4638. [Google Scholar] [CrossRef]
- Thieltges, D.W.; Goedknegt, M.A.; O’Dwyer, K.; Senior, A.M.; Kamiya, T. Parasites and Stable Isotopes: A Comparative Analysis of Isotopic Discrimination in Parasitic Trophic Interactions. Oikos 2019, 128, 1329–1339. [Google Scholar] [CrossRef]
- Borrell, A.; Aguilar, A.; Gazo, M.; Kumarran, R.P.; Cardona, L. Stable Isotope Profiles in Whale Shark (Rhincodon Typus) Suggest Segregation and Dissimilarities in the Diet Depending on Sex and Size. Environ. Biol. Fishes 2011, 92, 559–567. [Google Scholar] [CrossRef]
- Young, J.N.; Bruggeman, J.; Rickaby, R.E.M.; Erez, J.; Conte, M. Evidence for Changes in Carbon Isotopic Fractionation by Phytoplankton between 1960 and 2010. Glob. Biogeochem. Cycles 2013, 27, 505–515. [Google Scholar] [CrossRef]
- Barton, K. MuMIn: Multi-Model Inference. R Package Version 1.46.0. 2022. Available online: https://CRAN.R-project.org/package=MuMIn (accessed on 18 September 2022).
- Breheny, P.; Burchett, W. Visualization of Regression Models Using Visreg. R J. 2017, 9, 56–71. [Google Scholar] [CrossRef]
- Jackson, A.L.; Parnell, A.C.; Inger, R.; Bearhop, S. Comparing Isotopic Niche Widths among and within Communities: SIBER—Stable Isotope Bayesian Ellipses in R. J. Anim. Ecol. 2011, 80, 595–602. [Google Scholar] [CrossRef]
- Link, W.A.; Eaton, M.J. On Thinning of Chains in MCMC. Methods Ecol. Evol. 2012, 3, 112–115. [Google Scholar] [CrossRef]
- Makowski, D.; Ben-Shachar, M.S.; Lüdecke, D. BayestestR: Describing Effects and Their Uncertainty, Existance and Significance within the Bayesian Framework. J. Open Source Softw. 2019, 4, 1541. [Google Scholar] [CrossRef]
- R Core Team. R: A Language and Environment for Statistical Computing; R Core Team: Vienna, Austria, 2021. [Google Scholar]
- Pinnegar, J.K.; Campbell, N.; Polunin, N.V.C. REGULAR PAPERS Unusual Stable Isotope Fractionation Patterns Observed for Fish Host—Parasite Trophic Relationships. J. Fish Biol. 2001, 59, 494–503. [Google Scholar] [CrossRef]
- Deudero, S.; Pinnegar, J.K.; Polunin, N.V.C. Insights into Fish Host-Parasite Trophic Relationships Revealed by Stable Isotope Analysis. Dis. Aquat. Org. 2002, 52, 77–86. [Google Scholar] [CrossRef]
- Lafferty, K.D.; Allesina, S.; Arim, M.; Briggs, C.J.; De Leo, G.; Dobson, A.P.; Dunne, J.A.; Johnson, P.T.J.; Kuris, A.M.; Marcogliese, D.J.; et al. Parasites in Food Webs: The Ultimate Missing Links. Ecol. Lett. 2008, 11, 533–546. [Google Scholar] [CrossRef]
- Nachev, M.; Jochmann, M.A.; Walter, F.; Wolbert, J.B.; Schulte, S.M.; Schmidt, T.C.; Sures, B. Understanding Trophic Interactions in Host-Parasite Associations Using Stable Isotopes of Carbon and Nitrogen. Parasites Vectors 2017, 10, 90. [Google Scholar] [CrossRef]
- Hajji, T.; Telahigue, K.; Rabeh, I.; Ben Ammar, R.; Mdaini, Z.; El Cafsi, M.; Ghali, R. Polar and Neutral Lipid Composition of the Copepod Lernaeocera Lusci and Its Host Merluccius Merluccius in Relationship with the Parasite Intensity. Parasitol. Res. 2021, 120, 1979–1991. [Google Scholar] [CrossRef] [PubMed]
- Post, D.M.; Layman, C.A.; Arrington, D.A.; Takimoto, G.; Quattrochi, J.; Montaña, C.G. Getting to the Fat of the Matter: Models, Methods and Assumptions for Dealing with Lipids in Stable Isotope Analyses. Oecologia 2007, 152, 179–189. [Google Scholar] [CrossRef] [PubMed]
- Hussey, N.E.; MacNeil, M.A.; McMeans, B.C.; Olin, J.A.; Dudley, S.F.J.; Cliff, G.; Wintner, S.P.; Fennessy, S.T.; Fisk, A.T. Rescaling the Trophic Structure of Marine Food Webs. Ecol. Lett. 2014, 17, 239–250. [Google Scholar] [CrossRef] [PubMed]
- McMahon, K.W.; McCarthy, M.D. Embracing Variability in Amino Acid Δ15N Fractionation: Mechanisms, Implications, and Applications for Trophic Ecology. Ecosphere 2016, 7, e01511. [Google Scholar] [CrossRef]
- Jenkins, W.G.; Demopoulos, A.W.J.; Nicholson, M.D.; Sikkel, P.C. Stable Isotope Dynamics of Herbivorous Reef Fishes and Their Ectoparasites. Diversity 2020, 12, 429. [Google Scholar] [CrossRef]
- Rohner, C.A.; Prebble, C.E.M. Whale Shark Foraging, Feeding and Diet. In Whale Sharks: Biology, Ecology and Conservation; Dove, A.D.M., Pierce, S.J., Eds.; CRC Press: Boca Raton, FL, USA, 2021; pp. 153–180. ISBN 978-1-03-204940-3. [Google Scholar]
- Demopoulos, A.W.J.; Sikkel, P.C. Enhanced Understanding of Ectoparasite–Host Trophic Linkages on Coral Reefs through Stable Isotope Analysis. Int. J. Parasitol. Parasites Wildl. 2015, 4, 125–134. [Google Scholar] [CrossRef]
- Gilbert, B.M.; Nachev, M.; Jochmann, M.A.; Schmidt, T.C.; Köster, D.; Sures, B.; Avenant-Oldewage, A. Stable Isotope Analysis Spills the Beans about Spatial Variance in Trophic Structure in a Fish Host—Parasite System from the Vaal River System, South Africa. Int. J. Parasitol. Parasites Wildl. 2020, 12, 134–141. [Google Scholar] [CrossRef]
- Pegoraro de Macedo, M.R.; Palomba, M.; Santoro, M. The Current State of Knowledge on Parasitic Copepods (Siphonostomatoida: Pandaridae) of Elasmobranchs. Vet. Clin. N. Am. Exot. Anim. Pract. 2023, 26, 475–509. [Google Scholar] [CrossRef]
- Linnaeus, C. Systema Naturae per Regna Tria Naturae, Secundum Classes, Ordines, Genera, Species, Cum Characteribus, Differentiis, Synonymis, Locis, 10th ed.; Impensis Direct: Stockholm, Sweden, 1758. [Google Scholar] [CrossRef]
- Hewitt, G.C. Eight Species of Parasitic Copepoda on a White Shark. N. Z. J. Mar. Freshw. Res. 1979, 13, 171. [Google Scholar] [CrossRef]
- Benz, G.W.; Mollet, H.F.; Ebert, D.A.; Davis, C.R.; Van Sommeran, S.R. Five Species of Parasitic Copepods (Siphonostomatoida: Pandaridae) from the Body Surface of a White Shark Captured in Morro Bay, California. Pac. Sci. 2003, 57, 39–43. [Google Scholar] [CrossRef]


Disclaimer/Publisher’s Note: The statements, opinions and data contained in all publications are solely those of the individual author(s) and contributor(s) and not of MDPI and/or the editor(s). MDPI and/or the editor(s) disclaim responsibility for any injury to people or property resulting from any ideas, methods, instructions or products referred to in the content. |
© 2023 by the authors. Licensee MDPI, Basel, Switzerland. This article is an open access article distributed under the terms and conditions of the Creative Commons Attribution (CC BY) license (https://creativecommons.org/licenses/by/4.0/).