Article

Genome-Wide Identification, Phylogenetic Analysis and Expression Pattern Profiling of the Aquaporin Family Genes in Leuciscus waleckii

1
College of Fisheries and Life Science, Shanghai Ocean University, Shanghai 200000, China
2
National and Local Joint Engineering Laboratory for Freshwater Fish Breeding, Key Laboratory of Freshwater Aquatic Biotechnology and Genetic Breeding, Ministry of Agriculture, Heilongjiang Province’s Key Laboratory of Fish Stress Resistance Breeding and Germplasm Characteristics on Special Habitats, Heilongjiang River Fisheries Research Institute, Chinese Academy of Fishery Sciences, Harbin 150070, China
3
Higher Institution Center of Excellence (HICoE), Faculty of Fisheries and Food Science, Institute of Tropical Aquaculture and Fisheries, University of Malaysia Terengganu, Kuala Nerus 21030, Terengganu, Malaysia
*
Author to whom correspondence should be addressed.
Fishes 2023, 8(2), 107; https://doi.org/10.3390/fishes8020107
Submission received: 13 December 2022 / Revised: 6 February 2023 / Accepted: 9 February 2023 / Published: 11 February 2023
(This article belongs to the Special Issue The Applications of Genome Editing and Genomics in Aquaculture)

Abstract

:
Aquaporin (Aqp) is a transmembrane-specific channel for small molecules that help in regulating homeostasis in fishes when adapting to changing environments, but its role in Amur ide’s response to alkaline stress is yet to be revealed. Therefore, the purpose of this study is to investigate the response of the Aqp gene exposed to alkaline water in Amur ide (Leuciscus waleckii) using a genome-transcriptional assay. Based on the results, we classified the Aqps of the L. waleckii (LwAqps) genome and analyzed its transcriptional expression profile and genetic evolution under carbonate alkalinity stress. A total of 18 Aqp genes were identified in four grades in L. waleckii. The highest Aqp gene expression was found in the gill and kidney of L. waleckii from the Wusuli River (WSL) in comparison to those in the Dali Lake (DL), whereas aqp3a, -3ap1, -7, and -9a expressions were found at intensively higher levels in the gill rather than in the kidneys and livers. The experiment of L. waleckii under alkalinity stress (carbonate alkalinity 50 mmol·L−1) and its recovery showed that the expressions of aqp0a, -3a, -3ap1, -7, -8aa, and -9a were upregulated in alkaline water and downregulated in freshwater. We identified 1460 single nucleotide polymorphism (SNP) markers in the Aqp genes. The average value of Fst of SNP markers in the CDS region was 0.177 ± 0.256, and the first 5% SNPs were identified at aqp3a and -11b. Residue Ser66 does not bring about an overall change in the three-dimensional structure of Aqp3a, but may change the penetration of solutes across the membrane. This indicates that Aqp genes are involved in the response of L. waleckii to alkaline stress, and aqp3a is one of the key genes involved in regulating L. waleckii’s adaptation to alkaline environments.

Graphical Abstract

1. Introduction

Aquaporin (Aqp) is a channel that facilitates the transmembrane transport of water and other small molecules. The water transport activity of the “28 kDa” integral membrane protein purified from the human (Homo sapiens) erythrocytes [1] was first demonstrated in 1992 and named AQP1 [2]. To date, the aquaporin has been found to consist of 17 family members (Aqp0–16). They are classified as follows [3]: classical aquaporins (AQP0, -1, -2, -4, -5, -6, -14, and -15), which mainly transport water [4]; aquaglyceroporins (AQP3, -7, -9, -10, and -13), which mainly transport water, urea, and glycerol [5,6]; ammoniaporins (AQP8 and -16), which mainly transport water, urea, ammonia, and H2O2 [5,7,8]; and unorthodox aquaporins (AQP11 and -12).
Because of two additional rounds of whole-genome duplication (WGD), the number of Aqp genes in fish increases. With the third round of WGD in teleost, the number of Aqp genes found in zebrafish (Danio rerio) reaches 20 [3]. Additionally, the fourth round of WDG in tetraploid teleost discovered that the Aqp genes of common carp (Cyprinus carpio) and Atlantic salmon (Salmo salar) were increased to 38 [9] and 42 [3], respectively. Aquaporin consists of four monomers with an independent water transport capacity and each monomer contains of six transmembrane helices (from H1 to H6) [10]. Loops B and E are, respectively, connected with a short helix (HB and HE) and an asparagine–proline–alanine motif (NPA), which fold into a narrow channel at the center of the monomer. It is believed that the NPA motif mainly determines the quantity of solute permeation in a single channel, while the aromatic/arginine selectivity filter (Ar/R: F58-H182-C191-R197 in human AQP1, also known as H2, H5, LE1, LE2 [11]) region mainly determines the solute specificity [12].
As a transmembrane protein, aquaporin is an indispensable protein for an organism to maintain homeostasis. Several studies on the transport substrates of Aqp from fish have been published. In zebrafish, Aqp3a, -3b, -9a, -9b, and -10a are permeable to As; Aqp9a, -9b, and -10a facilitate the penetration of Sb [13]. The Aqp8aa, Aqp8ab, and -8b of Atlantic salmon are permeable to both water and urea, and Aqp8ab and -8b are also permeable to glycerol [7]. Atlantic salmon’s Aqp14 promotes water permeation and is also slightly permeable to glycerol, urea, hydrogen peroxide, and the ammonia analogue methylamine [4]. In gilthead seabream (Sparus aurata), Aqp8b promotes H2O2 permeation [5]. The transport properties of Aqp14 are similar to those of the Atlantic salmon [4]. It plays an important physiological function, such as participating in the osmotic regulation of organisms, immunity, maturation, excretion of germ cells, and maintenance of ion homeostasis [14,15]. Aquaporin participates in the response of organisms to stress environments and immune stimulation, which is conducive to the adaptation of organisms to extreme conditions, such as drought, salinity, alkalinity, high temperature, low temperature, metal, and other stress environments, as well as the immune stimulation of pathogenic bacteria and immune stimulators in fishes [16,17,18,19,20,21]. Nevertheless, the Aqp expression profiling in Amur ide under alkaline stress has still not been revealed.
Amur ide (Leuciscus waleckii) is a cyprinid fish widely distributed in North Asia. At first, L. waleckii was a freshwater fish that lived in freshwater areas, such as the Heilongjiang River and Wusuli River. Dali Lake is in Inner Mongolia, China (116°25′–116°45′ E, 43°13′–43°23′ N), a high carbonate (HCO3/CO32− type) saline–alkaline lake. Due to differential structural movement and climate drought, DL has gradually formed the current highly saline inland closed lake [22]. Thereby, L. waleckii in the DL developed an adaptive mechanism [23] and became an alkaline water population that can withstand the extreme environment of the lake, with an alkalinity of 53.57 and pH of 9.6 [24]. Because of the existence of freshwater and alkaline water populations and the extremely strong alkaline resistance of the L. waleckii in the DL, L. waleckii has become an important experimental model for studying the mechanism of salt and alkaline resistance.
Considerable effort is being devoted to the study of adaptation to saline–alkaline waters, and physiological plasticity is essential for fish survival. The ammonia metabolism, acid–base balance, and ion regulation of fish are seriously disturbed in a high-alkaline environment [25]. Ammonia is a toxic substance constantly produced during metabolism, but its excretion is hampered in high-alkaline environments [26]. Therefore, how does L. waleckii achieve ammonia excretion in DL? It is currently speculated that the arrowhead of L. waleckii in the DL employs two strategies to excrete ammonia: (I) reverse concentration gradient transport of ammonia achieved with the aid of transporters [26] and (Ⅱ) the conversion of ammonia into non-toxic urea [27] and glutamine [28]. Aqp, as a transmembrane transporter, is thought to facilitate ammonia permeation [29]. Relevant studies have also shown that Aqp is involved in the response of fish to alkalinity stress [30,31]. Transcriptome studies of L. waleckii [32], carp [31], tilapia [33], medaka [34], and ridgetail white shrimp [35] under alkalinity stress have been conducted, but the identification of the Aqp gene family and the response to alkalinity stress in L. waleckii has not been reported.
The study is divided into three aspects. Firstly, members of the Aqp gene family were identified from the L. waleckii genome, followed by phylogenetic and motif analyses. Secondly, the Aqp gene expression differences in different populations and tissues were compared under different alkaline conditions. Finally, the genetic evolutionary relationships and the selected gene aqp3a were examined between the alkaline (DL L. waleckii) and freshwater populations (WSL L. waleckii). From this study, a complete picture of LwAqp gene, classification, different spatiotemporal expression patterns of LwAqp genes, and the genetic evolution of the DL and WSL L. waleckii populations obtained from this study can provide a theoretical basis to understand the biological functions of LwAqp genes in alkaline water environments.

2. Materials and Methods

2.1. DNA Sequence and Aquaporin Sequence Retrieval

The 56 Aqp gene sequences of human, mouse (Mus musculus), African claw frog, and zebrafish were from Finn et al. [3]. The corresponding protein sequences of the above species were downloaded from the National Center for Biotechnology Information (https://www.ncbi.nlm.nih.gov/, accessed on 30 November 2021) and Ensembl (https://asia.ensembl.org/index.html, accessed on 30 November 2021) databases, and the specific sequence information is listed in Table S1. A total of 37 Aqp gene sequences of common carp (Cyprinus carpio) came from Dong et al. [36]. TBLASTN and BLASTP were used to query the whole L. waleckii genome with zebrafish aquaporin gene (e value was truncated to 1e−5) and the results were obtained as candidate genes. The Simple Modular Architecture Research Tool (SMART) tool was used to build a hidden Markov model of protein-specific conservative domains and search the whole genome of L. waleckii again based on this model. The genes were queried from the two steps were merged to acquire the candidate Aqp genes. The alignment of amino acid sequences was conducted by the MEGA-X with clustalW, and the alignment result was beautified by Gene Doc v 2.7.0. The genomic structure analysis is performed with the help of GSDS 2.0 (http://gsds.cbi.pku.edu.cn/, accessed on 15 July 2022).

2.2. Aqp Gene Nomenclature

The Aqp genes were named according to the phylogenetic relationship between L. waleckii and its homologous species. Whereas Aqp homologous genes (aqp0, -1, etc.) were named according to different phylogenetic branches, and if multiple distinct subfamily exist, an alphabetical suffix was added after the homologous genes, as in (aqp0a, -0b, etc.). The pseudogene was added with a suffix “p”, and the subfamily with more than one pseudogene was added with a numeric suffix after “p”, such as (aqp3ap1 and -3ap2).

2.3. Construction of Phylogenetic Tree Aqp Genes in Six Species

To better identify the Aqp gene in L. waleckii, a phylogenetic analysis was performed using amino acid sequences from the zebrafish and several representative species. The construction of phylogenetic tree was developed using MEGA-X. Aqp amino acid sequences from human, mouse, African Clawed Frog (Xenopus laevis), zebrafish, common carp, and Amur ide, were aligned with MUSCLE. The phylogenetic tree was built by the maximum likelihood method (ML). In addition, the model was WAG+G+F with 1000 replications.

2.4. Analysis of Phylogenetic Relationships, Gene Structure, and Motifs of LwAqps

The phylogenetic tree was built using MEGA-X with the ML method based on the LG+G+I model, and 1000 bootstrap test replicates were used during the construction. Motif analysis of Aqp genes in L. waleckii was performed using the online tool MEME v 5.4.1 (http://meme-suite.org/tools/meme, accessed on 15 December 2021). The amino acid sequence of the Aqp gene of L. waleckii was submitted for motif analysis with a motif width of 6–200 and a motif number of 13. Gene structure was analyzed with GSDS 2.0 (http://gsds.cbi.pku.edu.cn/, accessed on 5 February 2023).

2.5. Differential Expression Calculation

2.5.1. Differential Expression Analysis between DL and WSL L. waleckii

Transcriptome sequencing data files (SRR2891298-SRR2891303) of the DL (18 samples, alkaline water population) and WSL (10 samples, freshwater population) L. waleckii, re-sequenced by the Illumina HiSeq 2000 platform with 10.9× depth, came from Xu et al. [37]. The quality of raw data was assessed with FastQC v 0.11.7, and quality control and preprocessing were performed by using fastp V 0.12.4 software. Alignment was performed using Hisat2 v 2.2.1, followed by calculation of FPKM values with htseq-count v 0.6.1, and finally heat maps were created with heatmapper. The darker the color, the higher the differential expression fold, with red representing higher expression and green representing lower expression.

2.5.2. Indoor Experiment of Alkaline Stress and Post Alkaline-Stress Recovery in DL L. waleckii

In addition to performing differential expression analysis between wild DL and WSL L. waleckii, we conducted an indoor alkaline stress experiment of DL L. waleckii to figure out the role of Aqp genes in an alkaline environment.
The wild L. waleckii was collected from Dali Lake in Inner Mongolia and raised in the Hulan Experimental Station of the Heilongjiang River Fisheries Research Institute. F2 was obtained through artificial propagation and cultivation in the breeding base. A total of 120 three-month-old F2 (mean body length and weight were 17.12 ± 4.96 cm and 75.78 ± 9.14 g, respectively) were used in our experiment. All fish were acclimated in a 650-L recirculating aquarium (96.5 cm × 52.5 cm × 45.5 cm) for 1 week and feeding was stopped 48 h before the experiment. The 50% solution in the aquarium was changed twice a day.
The fish in the treatment group were exposed to alkaline water (carbonate alkalinity 50 mmol·L−1) for 10 days and then transferred to fresh water (carbonate alkalinity 0 mmol·L−1) for cultivation for 10 days. Fish that were reared under freshwater (0 mmol·L−1) for 30 days were used as the control group. We carried out 3 replicates per group, and 3 experimental fish per replicate. The water quality of alkaline water (alkalinity = 49.40 ± 1.6 mM, temperature = 22.35 ± 0.78 °C, dissolved oxygen = 8.12 ± 0.26 mg·L−1, pH = 9.01 ± 0.14, salinity = 2.45 ± 0.09 mg·L−1) and fresh water (alkalinity = 0.23 ± 0.02 mM, temperature = 22.31 ± 0.50 °C, dissolved oxygen level = 8.10 ± 0.50 mg·L−1, pH = 7.17 ± 0.05, salinity = 0.09 ± 0.04 mg·L−1) were monitored by YSI multiple water quality meter (YSI, Yellow Springs, OH, USA). The alkaline solution required for the experiments was in the bicarbonate AW (Tianjin Kemiou Chemical Reagent Co Ltd., Tianjin, China) configuration. The brain, gill, intestine, kidney, liver, muscle, skin and spleen were sampled on the 7th days of alkaline water exposure. The gill was sampled on the 1st, 5th and 10th days of exposure to alkaline water (ALK-1d, ALK-5d, ALK-10d), as well as on the 1st, 5th and 10th days of fresh water culture (FW-1d, FW-5d, FW-10d). The control group was sampled at the beginning of the experiment (FC).
Total RNA was extracted with the TRIzol® Reagent (Invitrogen, Grand Island, NY, USA). The integrity of total RNA was checked by NanoDrop 8000 (Thermo Fisher Scientific, Waltham, MA, USA) and 1.5% agarose gel electrophoresis. Three identical quantities of RNA from the same group were pooled together for library construction. Sequencing was carried out using the Illumina Hiseq platform (Illumina, San Diego, CA, USA), and ultimately 150 bp paired-end reads were acquired. The analysis of the transcriptome sequencing data (SRR23117839-SRR23117846) was performed in accordance with Section 2.5.1 above.

2.6. Statistics of SNPs and Fixation Index (Fst) of Aqp Gene

First, the reference genome was indexed, and then the reads were aligned to the reference genome; finally, the alignment files were sorted, marked with duplicates, and the index files were created. The rox alignment file was filtered on the condition that the depth was 10× and the quality was greater than 5. SNP calling and preliminary filtering were performed using gatk v. 4.2.6.0. We first created the GVCF files for each sample using the haplotypecaller module, and then we merged all of the GVCF files to create the VCF files using GenotypeGVCFs. SNPs were selected using SelectVariants after filtering criteria of “QUAL < 30.0||QD < 2.0||MQ < 40.0||FS > 60.0||SOR > 3.0||MQRankSum < −12.5||ReadPosRankSum < −8.0” were met using the variantfiltration. Further filtering was carried out by utilizing the “-i” parameter in the view module of bcftools, and the bi-allelic SNPs with MAF > 0.05 and missing rates < 0.15 were kept. Thus, a VCF file containing SNPs variation data was obtained. The Ped/Map format file was generated with the help of the “--vcf “ parameter of vcftools v 1.098685, and then the Fst was calculated with the “--weir-fst “ parameter. The top 5% of the Fst were counted and the genotypes corresponding to these sites were found in the VCF file.

2.7. Comparison of Bases and Amino Acids at the Top 5% Site of Fst Value of Aqp Gene in DL and WSL L. waleckii

A single base mutation may lead to an amino acid mutation, which in turn affects protein function. Sites with Fst values that were in the top 5% of all sites in CDS region underwent amino acid mutation analysis. The gene structure was then mapped, and the bases and amino acids corresponding to the SNP markers of the two populations were shown in correspondence to CDS regions to highlight their relative locus in the genes as well as the bases and amino acids differences between DL and WS L. waleckii. Mapping of the gene structure was performed using TBtools v 1.098685. Alignments of base sequences from DL and WSL L. waleckii were performed using clustalW from MEGA-X. Statistics were also calculated on the other mutation sites on the CDS region because of the special significance of aqp3a.

2.8. Amino Acid Sequence Alignment of aqp3 in Multiple Species

In order to determine the amino acids substitution caused by SNP in alkaline and fresh water environment, Aqp3 amino acid sequences of multiple species were aligned. The aqp3a.4 with the highest Fst value among nonsynonymous mutations was selected for further study. The amino acid sequence of aqp3a of fathead minnow (Pimephales promelas), common carp, zebrafish, blunt snout bream (Megalobrama amblycephala), and the amino acid sequence of aqp3a of Sinocyclocheilus anshuiensis, Sinocyclocheilus rhinocerous and crucian carp (Carassius auratus) were referred as reference from NCBI. The clustalW of MEGA-X was used for amino acid sequence alignment.

2.9. Aqp3a Three-Dimensional Structure Prediction

The three-dimensional structure of the Aqp3a-1 was predicted in order to investigate whether the 66th amino acid may cause a potential difference in protein function. The mutated amino acid (except for Aqp3a.5 and -3a.6) were replaced to obtain the amino acid sequence of Aqp3a of the DL and WSL L. waleckii. The online software I-TASSER (https://seq2fun.dcmb.med.umich.edu//I-TASSER/, accessed on 7 July 2022) was used to construct the 3D structures, followed by PyMol v2.6.0a0 open-source software for visualization. At the same time, the 66th amino acid was amplified to show its location and chemical bond in the protein.

2.10. Quantitative Reverse-Transcription PCR (qRT-PCR)

qRT-PCR was performed to further analyze aquaglyceroporin aqp7, -9aa and ammoniaporin aqp8 that were initially upregulated in alkaline water and later downregulated in freshwater. The gill tissue used came from the experiment described in Section 2.5.2 above, sampled on days 1, 3, 5, and 7 in alkaline water, and the sampling of the control group was consistent with that of 2.5.2. The PrimeScriptTMRT reagent Kit with gDNA Eraser (Code No. RR047A) kit of TaKaRa company was used for reverse transcription to synthesize cDNA. Primers were designed using Primer 3 online software, and primer sequence information is provided in Table 1. TB Green Premix Ex TaqⅡ (Tli RNaseH Plus) (Code No. RR820A/B) was selected and Applied Biosystems 7500 Real Time PCR System was applied for real time PCR reaction. The reaction volume was 20 µL as follows: TB Green Premix Ex TaqⅡ (Tli RNaseH Plus) (2×) for 10 µL, PCR forward primer for 1 µL, PCR reverse primer for 1ul, cDNA solution for 2 µL, sterilized water for 6 µL. The three-step PCR amplification reaction was performed using the following protocol: first step, 95 °C, 30 s; second step (40 cycles), 95 °C for 5 s, 60 °C for 34 s; and the third, 95 °C for 15 s, 60 °C for 1 min, followed by 95 °C for 15 s. The internal reference gene was 18S. The 2−ΔΔCT method was used to calculate the relative expression of genes. Results were expressed as mean ± standard deviation (S.D.) of three replicates.

3. Results

3.1. Identification of Aqp Genes

A total of 20 putative members of the Aqp genes were identified in the L. waleckii genome. Due to the complex heritage of aqp10, orthologs of aqp10 identified previously in diploid teleosts, such as zebrafish, etc., were renamed (aqp10a were named aqp10aa, and aqp10b were named aqp10bb) [38]. The two orthologs of aqp10 were renamed for their homology to these diploid teleost sequences. Two aqp3a-encoding partial aquaporin-like sequences were classified as a pseudogene (aqp3ap1-truncated C-ter region of 52 amino acids, aqp3ap2-truncated N-ter of 36 amino acids, and 19 amino acids in the middle) (Figure S1a). The analysis of the genomic structure revealed that aqp3ap2, and aqp3a lacked several exons, suggesting a loss of their original function (Figure S1b). The name, chromosome location, gene length, CDS length, and amino acid number are listed in Table 2. The Aqp gene was located on different chromosomes with a large gene length span in the range of 783–14,964, but its CDS length span was small, in the range of 711–996. The LwAqp genomic, CDS, and protein sequences and its number in GenBank are detailed in Table S2. The conserved NPA and Ar/R selection filters, which are critical for the substrate molecular transport of Aqp, were also analyzed (Figure 1). Most putative LwAqps contain two typical NPAs. However, Aqp3b, -8ab, -11b, -12, and -15 showed a variable third residue of an NPA motif in which A was replaced by either V/P/T/S. Additionally, the NPA motifs of Aqp7 were NAA and NPT. Sequences with higher homology also have a similar composition of Ar/R residues. The pseudogene Aqp3ap1 and -3ap2 both had two NPA and share the same Ar/R as aqp3a.

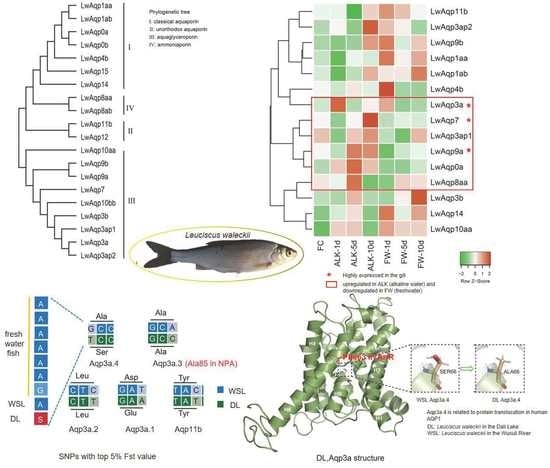
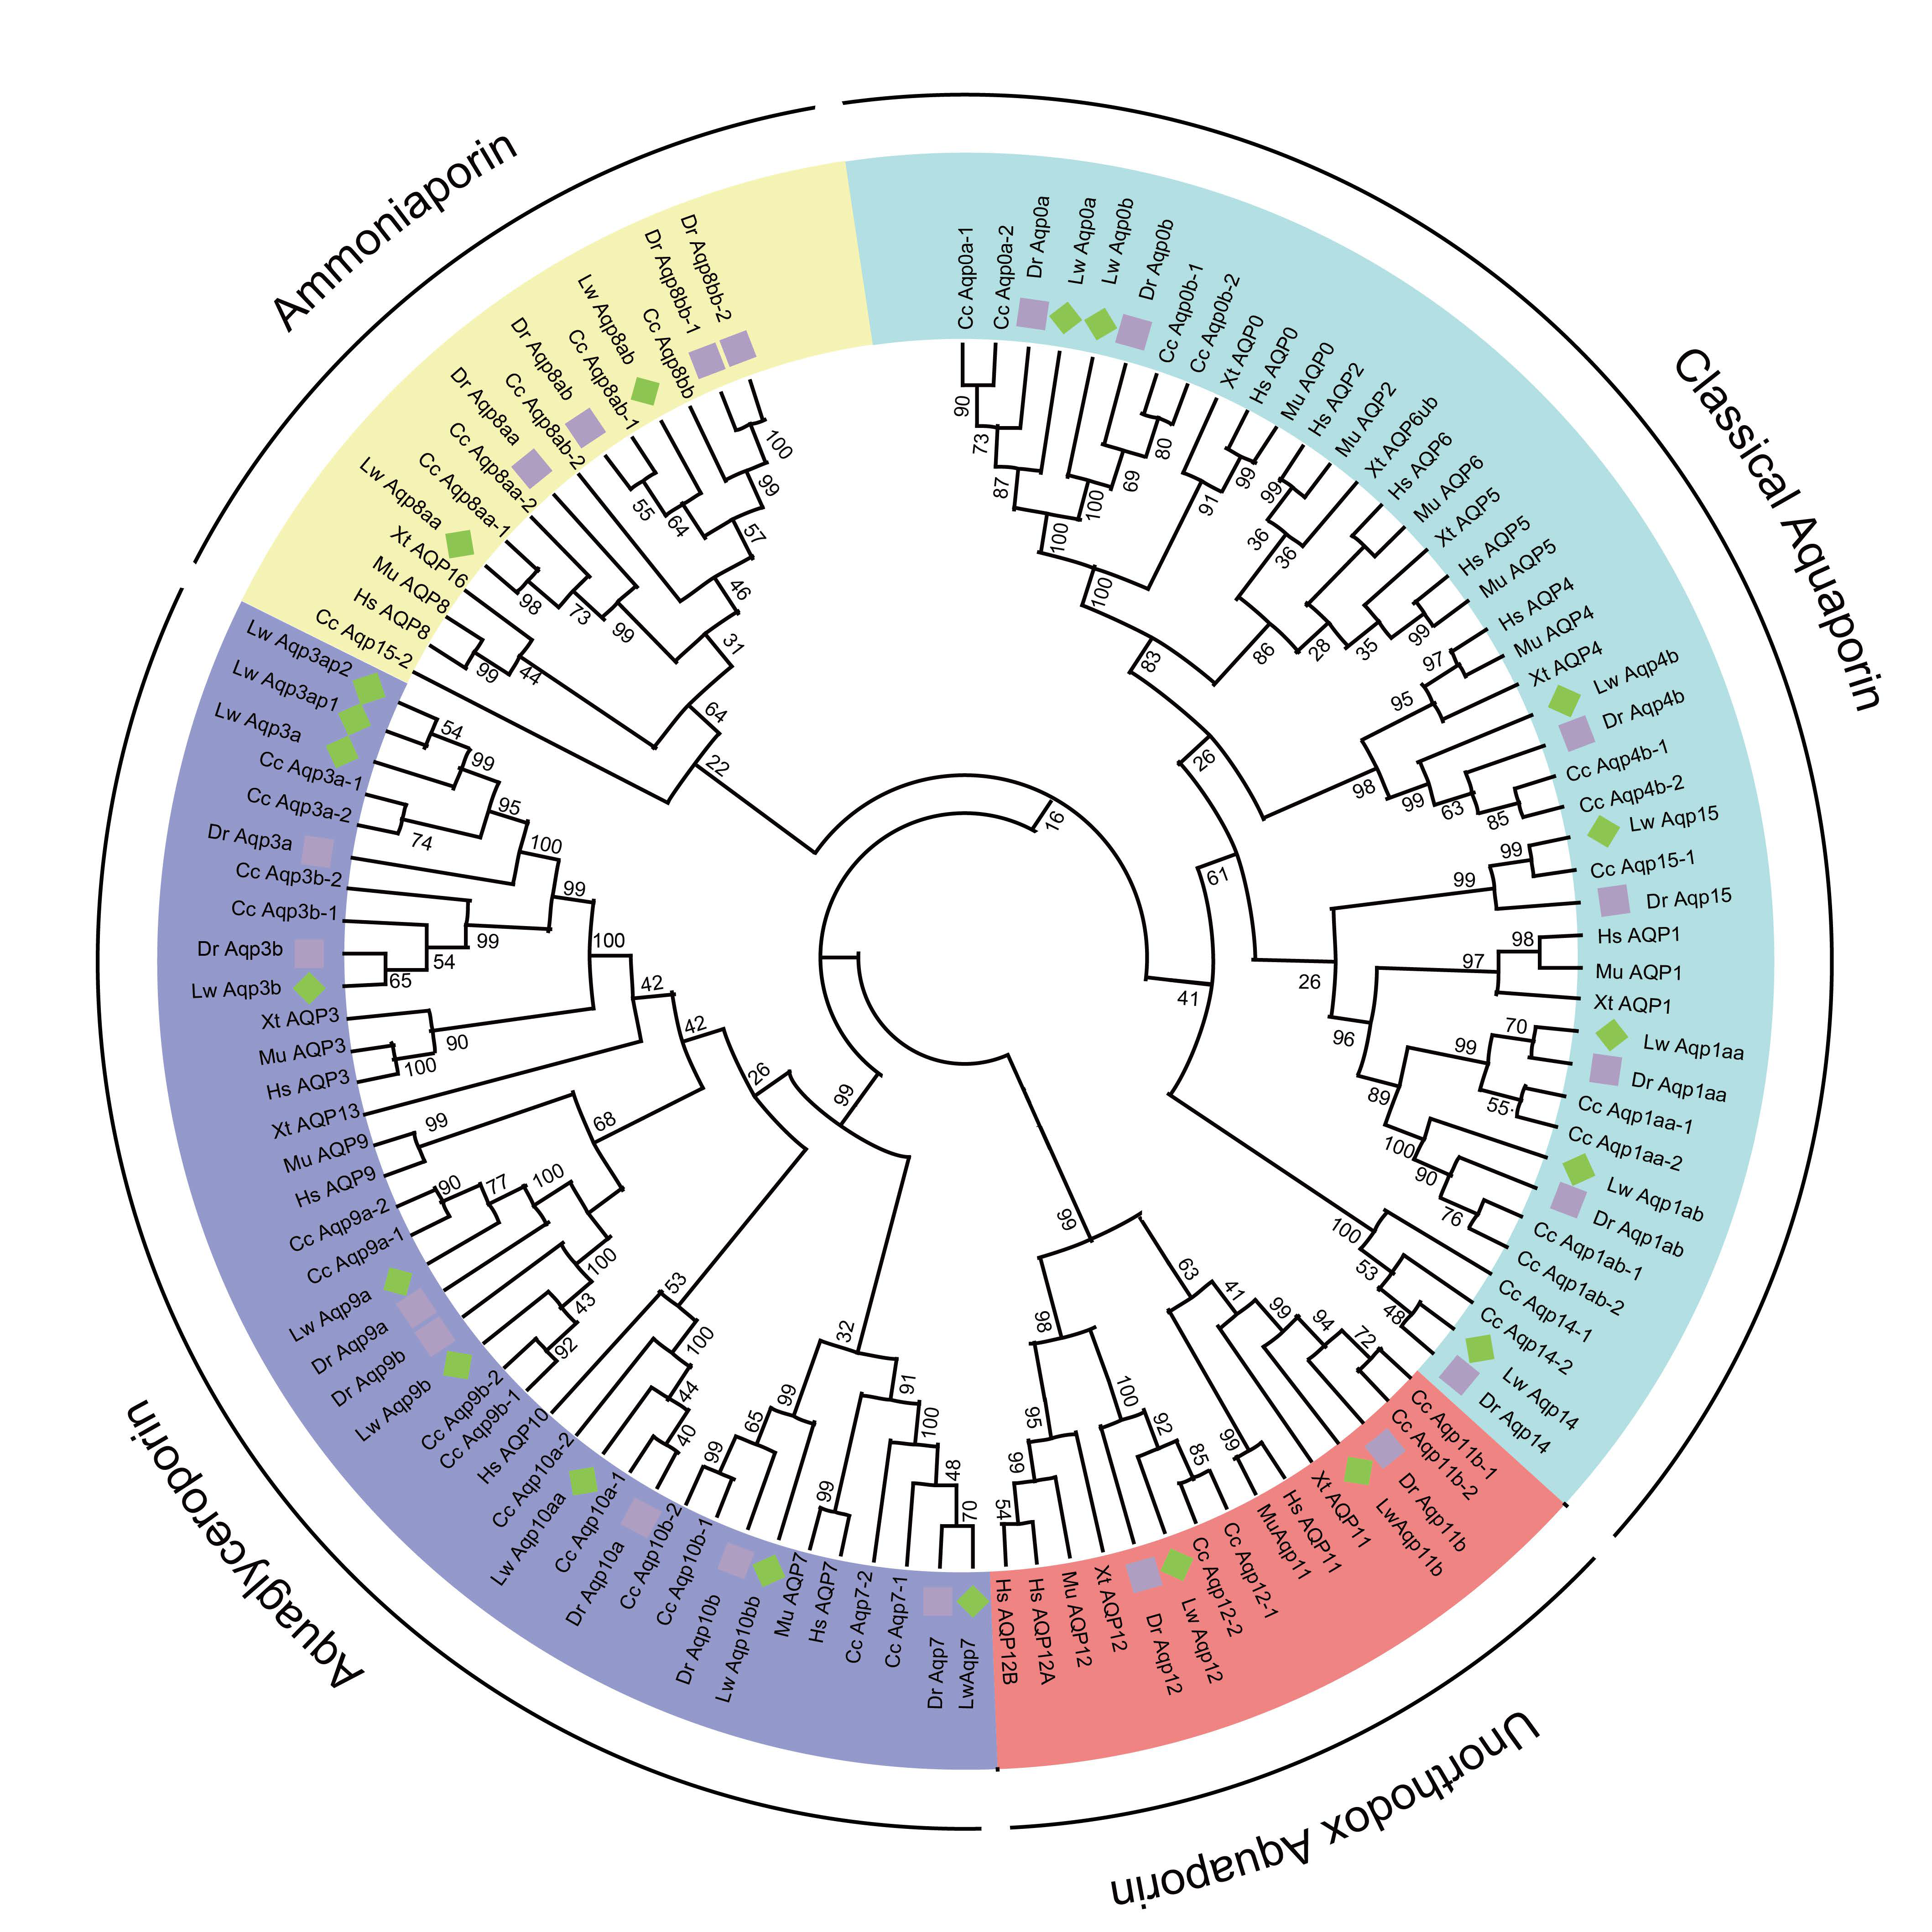
3.2. Evolution and Classification of the Aqp Gene Family

To comprehend the phylogenetic relationship of the Aqp gene among various species, a phylogenetic tree for the Aqp genes was constructed. (Figure 2). The Aqp amino acid sequence alignment in six species is shown in Figure S2. According to the results of the phylogenetic tree analysis and topological structure, Aqp genes were divided into four grades: (I) classical aquaporin (Aqp0, -1, -2, -4, -5, -6, -14, and -15); (II) unorthodox aquaporin (Aqp11 and -12); (III) aquaglyceroporin (Aqp3, -7, -9, and -10); and (Ⅳ) ammoniaporin (Aqp8 and -16).

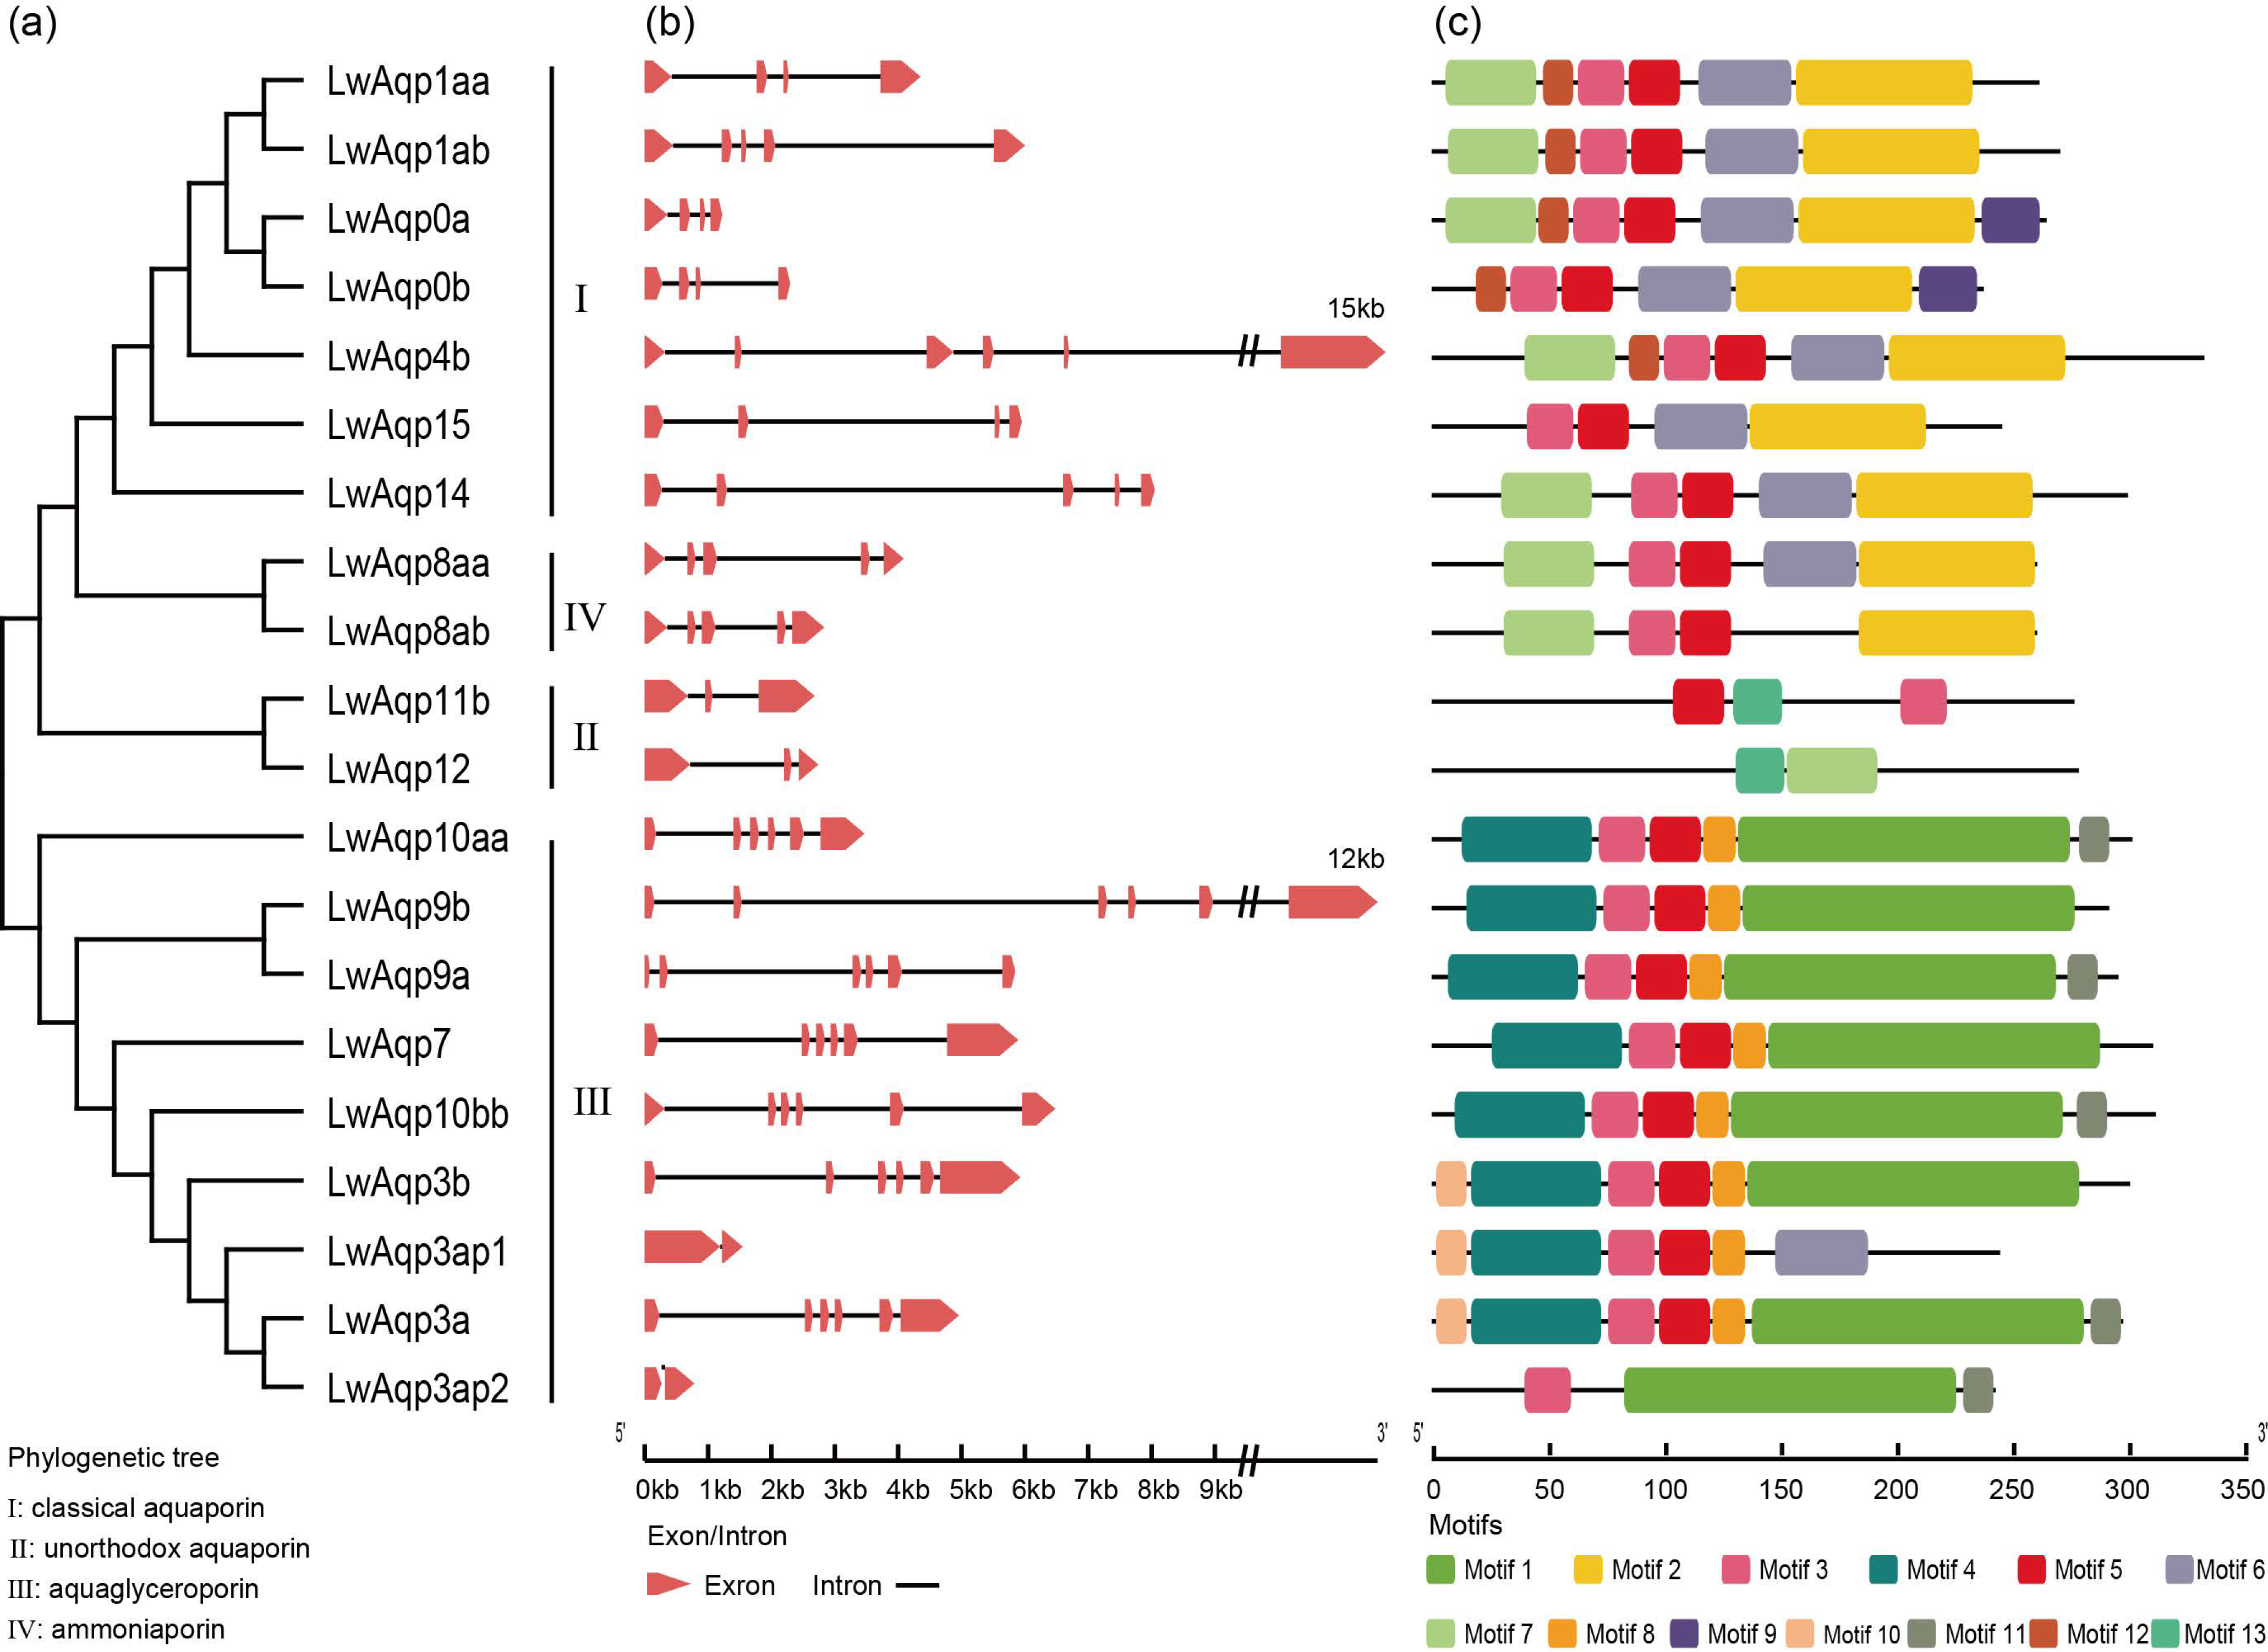
3.3. Analysis of Phylogenetic Relationships, Gene Structure, and Motifs

In order to understand how the members of the Aqp gene family in L. waleckii were related to one another, phylogenetic relationships, gene structure, and motifs were examined (Figure 3). The Aqp genes of L. waleckii were classified into four grades: (I) classical aquaporin (Aqp0a, -0b, -4b, -14, and -15); (Ⅱ) unorthodox aquaporin (Aqp11b and -12); (III) aquaglyceroporin (Aqp3a, -3ap1, -3ap2, -3b, -7, -9a, -9b, -10aa, and -10bb); and (IV) ammoniaporin (Aqp8aa and Aqp8ab). Each gene of Aqp in all species was highly clustered in the phylogenetic tree, showing that they are highly conservative. The number of introns is comparable among aquaporins of the same grade. The number of introns was three to five for classical aquaporins, four for ammonia channel proteins, two for unorthodox aquaporins, and five for aquaglyceroporins (except for Aqp3ap1 and Aqp3ap2). Aquaporins of the same grade have similar intron numbers. The number of introns in classical aquaporins is 3–5, the number of introns in ammonia channel proteins is 4, the number of introns in unorthodox aquaporins is 2, and the number of introns in aquaporins is 5 (except for Aqp3ap1 and Aqp3ap2). The results obtained showed that 4 types of genes were identified, and the motif of each composition was relatively similar. A total of 13 conservative motifs (motif 1–13) were identified. The motif composition of Aqps of the same grade were similar. Except aqp12, all LwAqp contained motif 3. Whereas, except aqp12 and aqp3ap2, the Aqp gene of all LwAqp contained motif 5. Furthermore, motifs 3 and 5 are in the middle of the Aqp genes. The Aqp3ap1 gained motif 6, which was only possessed by classical aquaporins and ammonia channel proteins, and lost motif 1 and 11, which were shared by aqp3a. The Aqp3ap2 lost motifs 4, 5, 8 and 10, which were shared by aqp3a. The reliability of the phylogenetic tree was further confirmed by both gene structure and motif analysis.

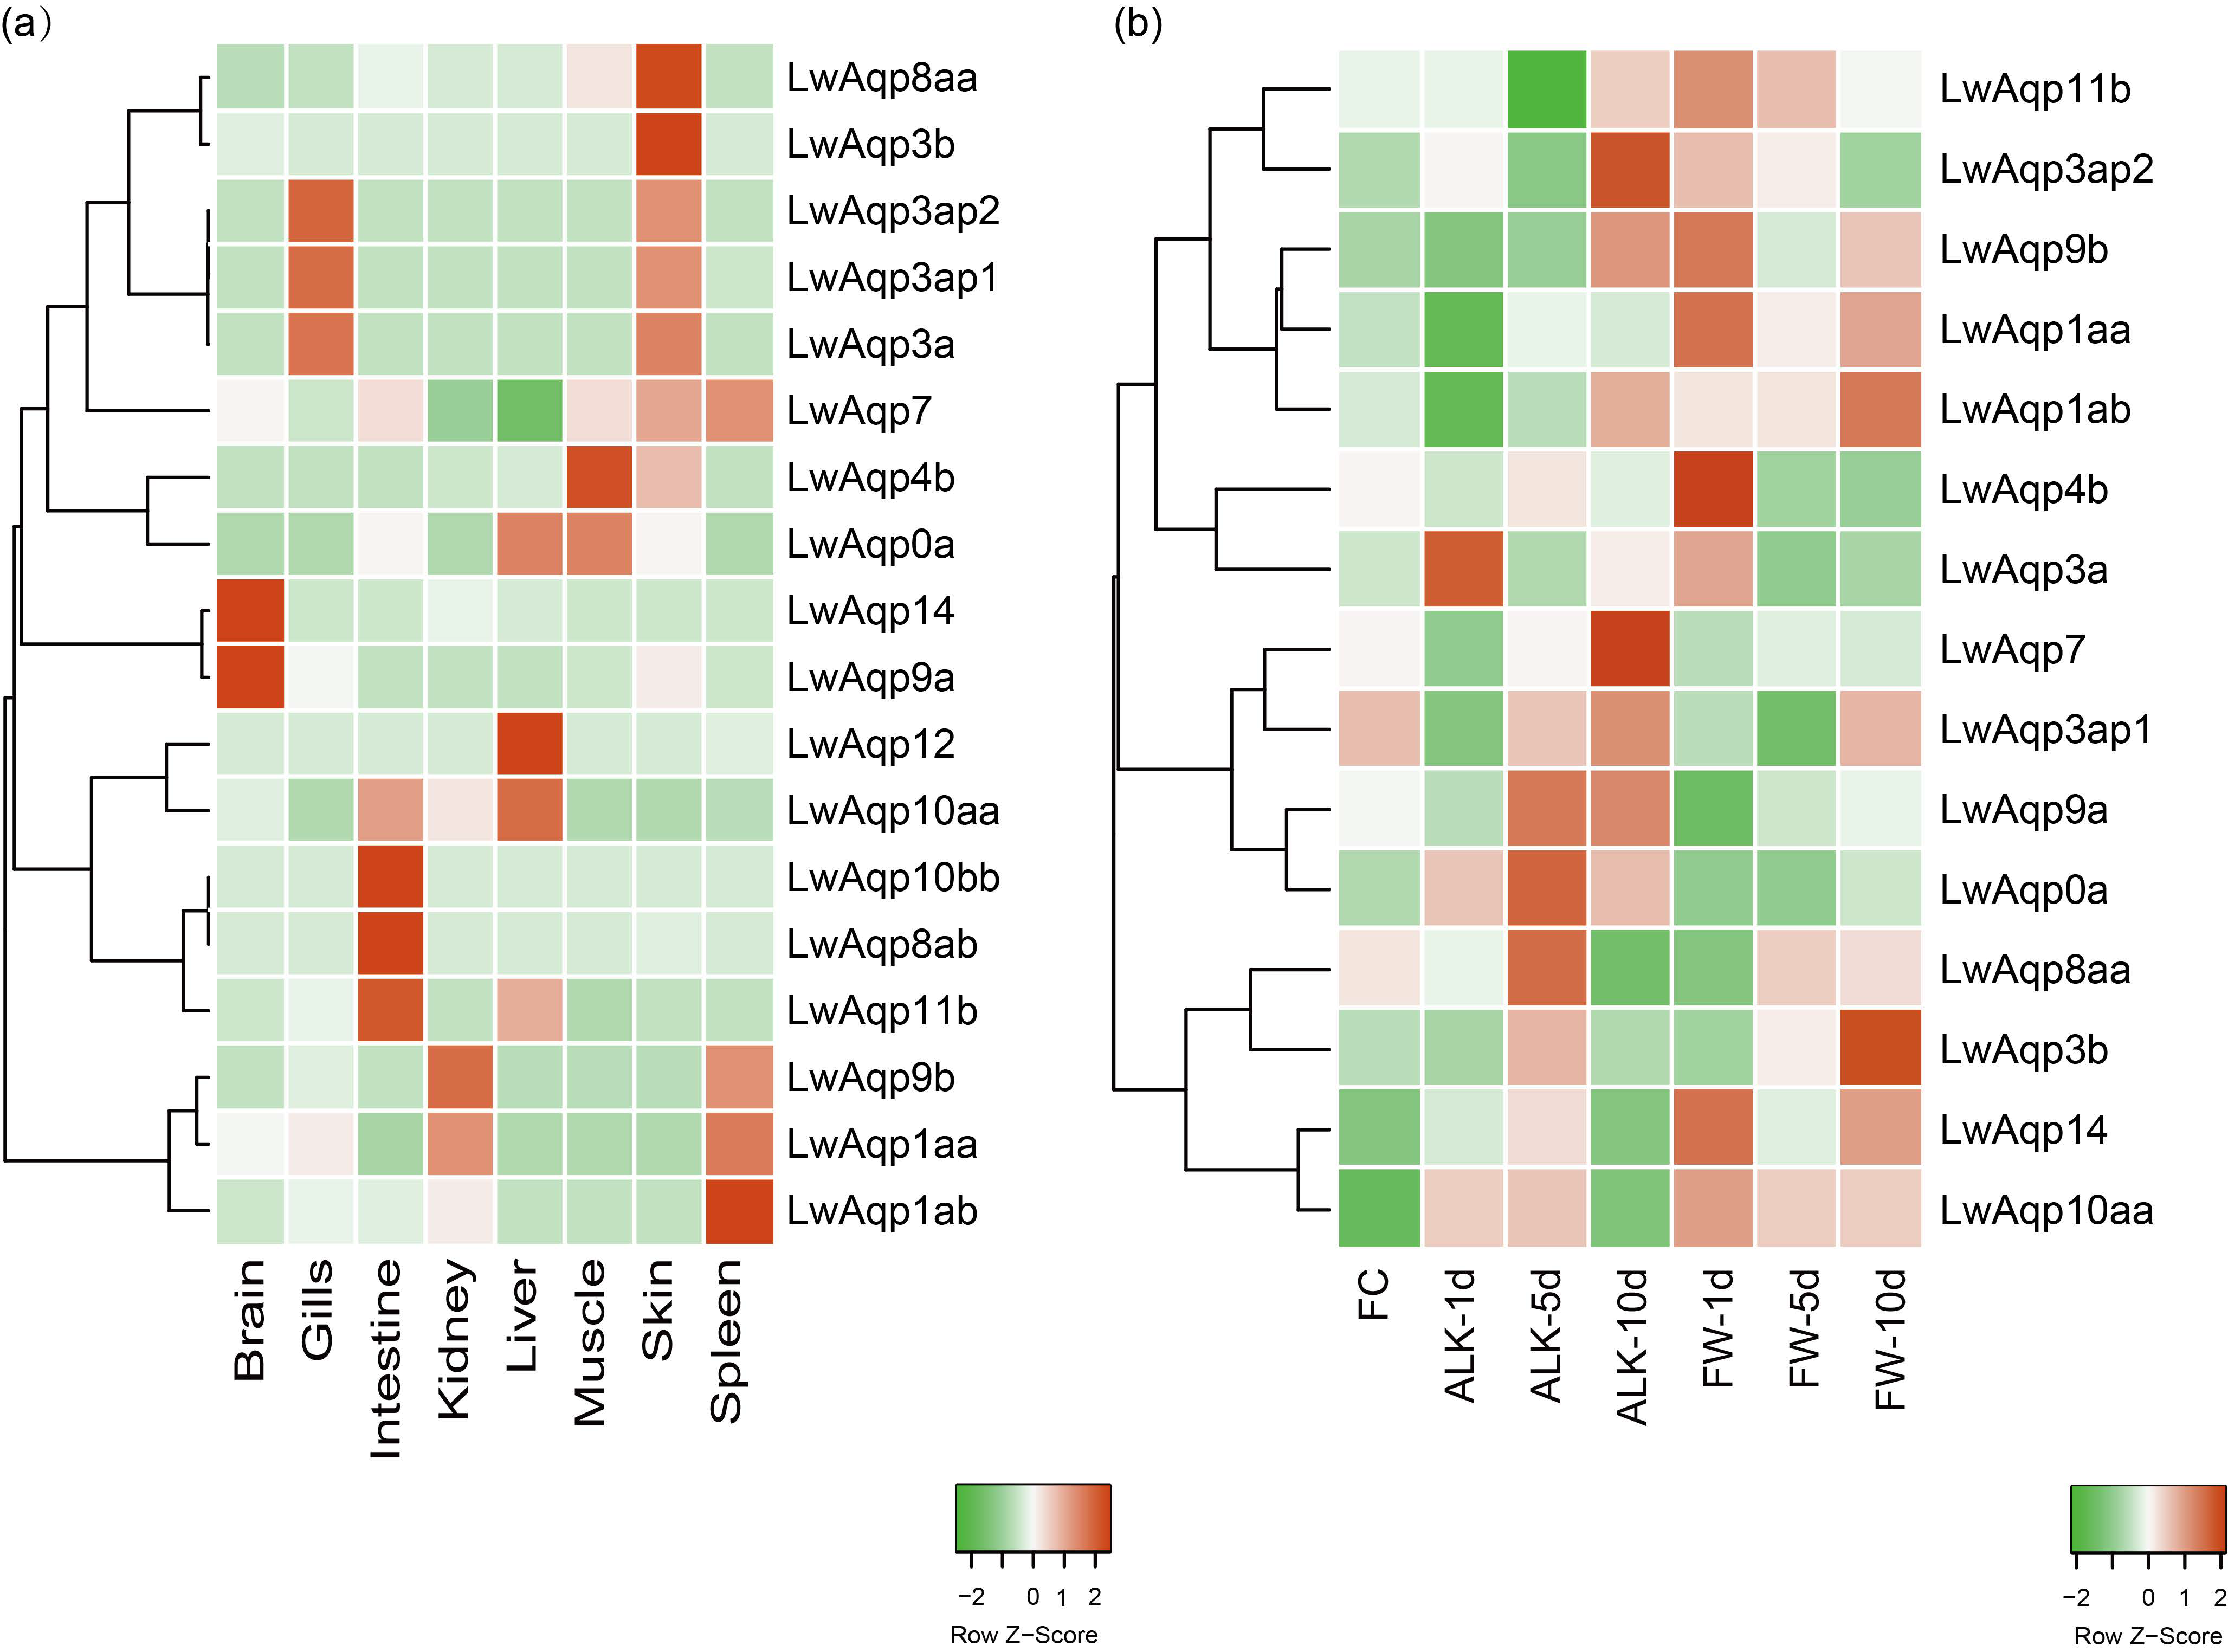
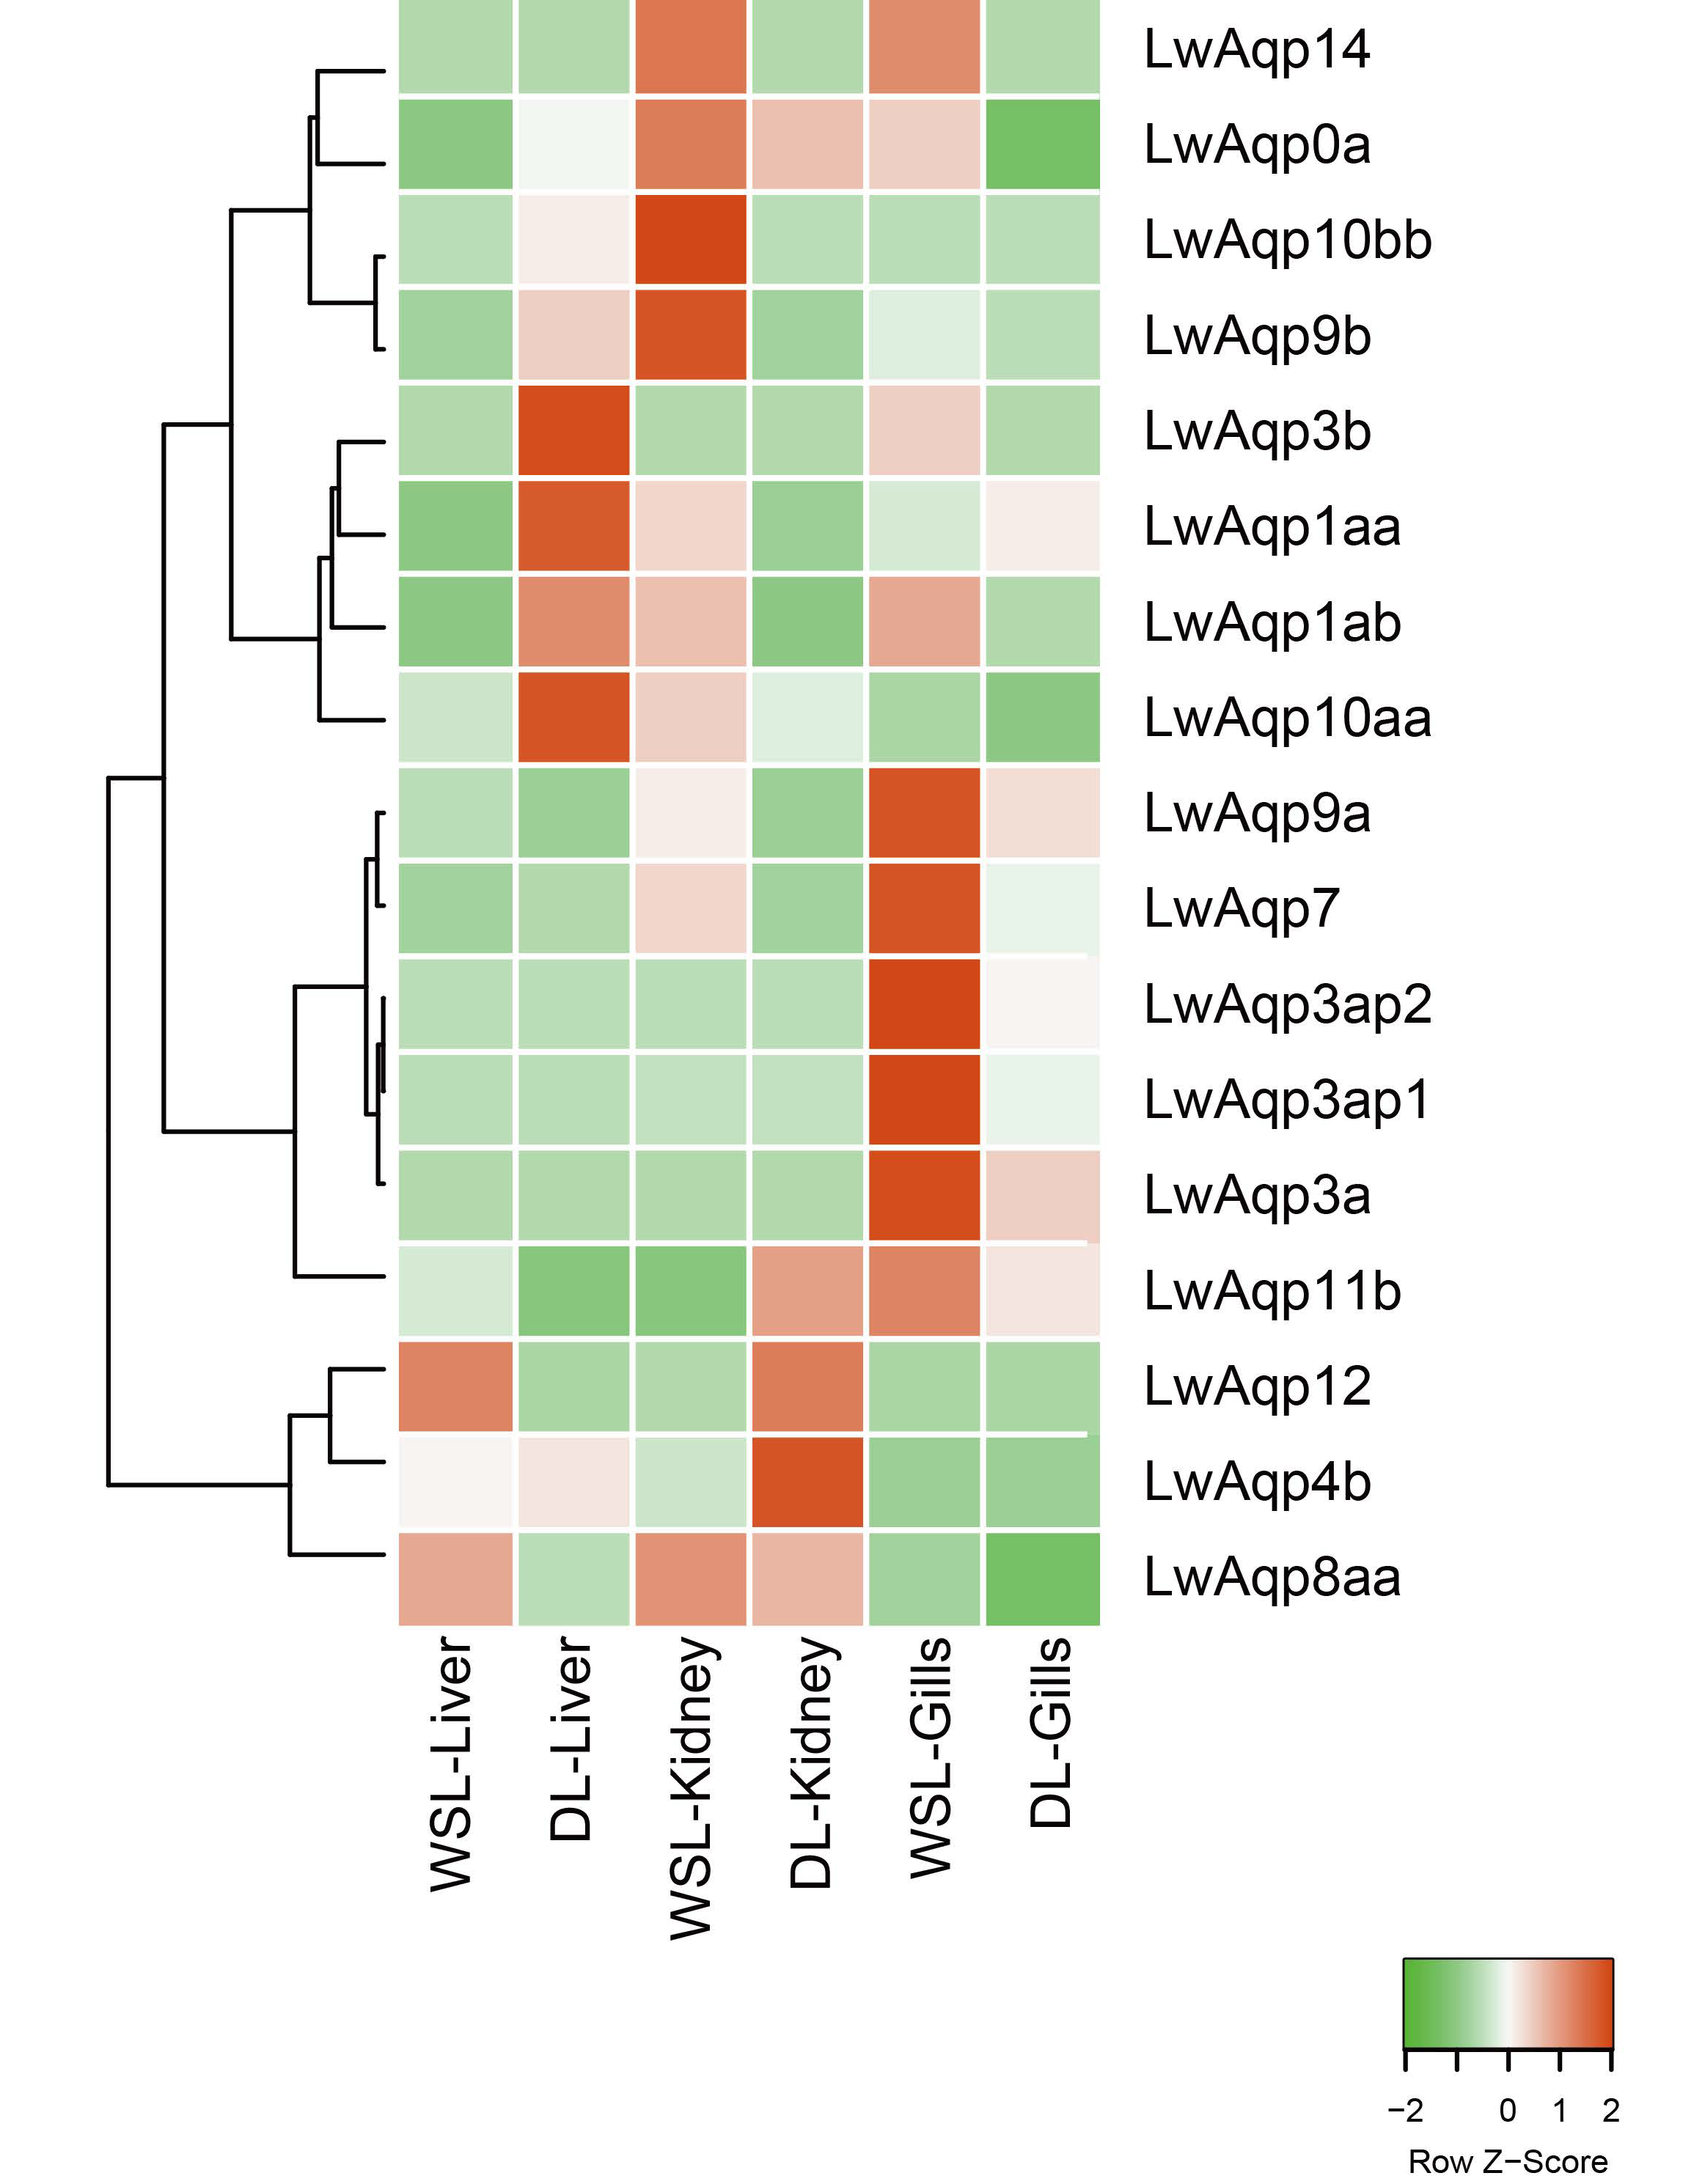
3.4. Analysis of the Aqp Gene Tissue Expression Profile

To understand the role of LwAqps under alkalinity stress, the Aqp expressions of different populations (DL and WSL) and different tissues and environments (ALK and FW) of DL L. waleckii were analyzed.
The LwAqps showed differential expression in the gill, kidney, and liver of the DL and WSL populations (Figure 4). The expression of LwAqps was tissue-specific. Some aquaglyceroporins (aqp3a, -3ap1, -3ap2, -7, and -9) were highly expressed in the gill. In addition to these genes, aqp11b was also highly expressed in the gill. Aqp4b, -8aa, and -12 were highly expressed in the kidney and liver. The expression level of LwAqps was also different in DL L. waleckii and WSL L. waleckii, with the exception of aqp1aa. The LwAqps expression in the gill of WSL L. waleckii was higher than that of DL L. waleckii. The aqp1aa expression in the gill of DL L. waleckii was higher than that of WSL L. waleckii. The expressions of aqp1ab, -9b, -10aa, and -10bb in the liver of DL L. waleckii was higher than that of WSL L. waleckii.
To investigate the Aqp gene function of alkaline species of L. waleckii, we focused on the Aqp expression of DL L. waleckii. We analyzed the Aqp gene expression profile in eight tissues of DL L. waleckii under alkalinity stress (carbonate alkalinity of 50 mmol·L−1) for 7 days (Figure 5a) to gather information on the potential physiological role of LwAqp. The aqp3a, -3ap1, -3ap2, -3b, -4b, -7, and -8aa were highly expressed in the skin. Aqp3a, -3ap1, and -3ap2 were also highly expressed in the gill. Aqp0a was highly expressed in the liver and muscle. Aqp9a and -14 were mainly found in the brain. For aqp8ab, -10aa, -10bb, and -11b, we observed a high expression level in the intestine. The aqp1aa, -1ab, and -9b exhibited high transcript levels in the spleen and kidney.
We also analyzed the LwAqp expression profile on different days (1 d, 3 d, and 10 d) of alkalinity stress and different days (1 d, 3 d, and 10 d) of transferring DL L. waleckii to fresh water after stress (Figure 5b). The results show that the expressions of aqp0a, -7, and -9a were generally upregulated in the alkaline water environment and then downregulated in the freshwater environment. Conversely, aqp1aa, -1ab, -3ap2, and -11 were downregulated initially, followed by being upregulated in fresh water. Aqp3ap1 and -8aa were upregulated in the alkaline water environment, and then downregulated at 5d, but again upregulated in fresh water. Meanwhile, aqp3a was upregulated on ALK-1d and then downregulated on ALK-5d, followed by being upregulated on FW-1D and then downregulated on FW-5d and 10d. Interestingly, these genes with a high expression in alkaline water, but low expression in fresh water, such as aqp0a, -3ap1, -4b, -7, -8aa, and -9a, showed an increasing trend on ALK-5d compared with ALK-1d.

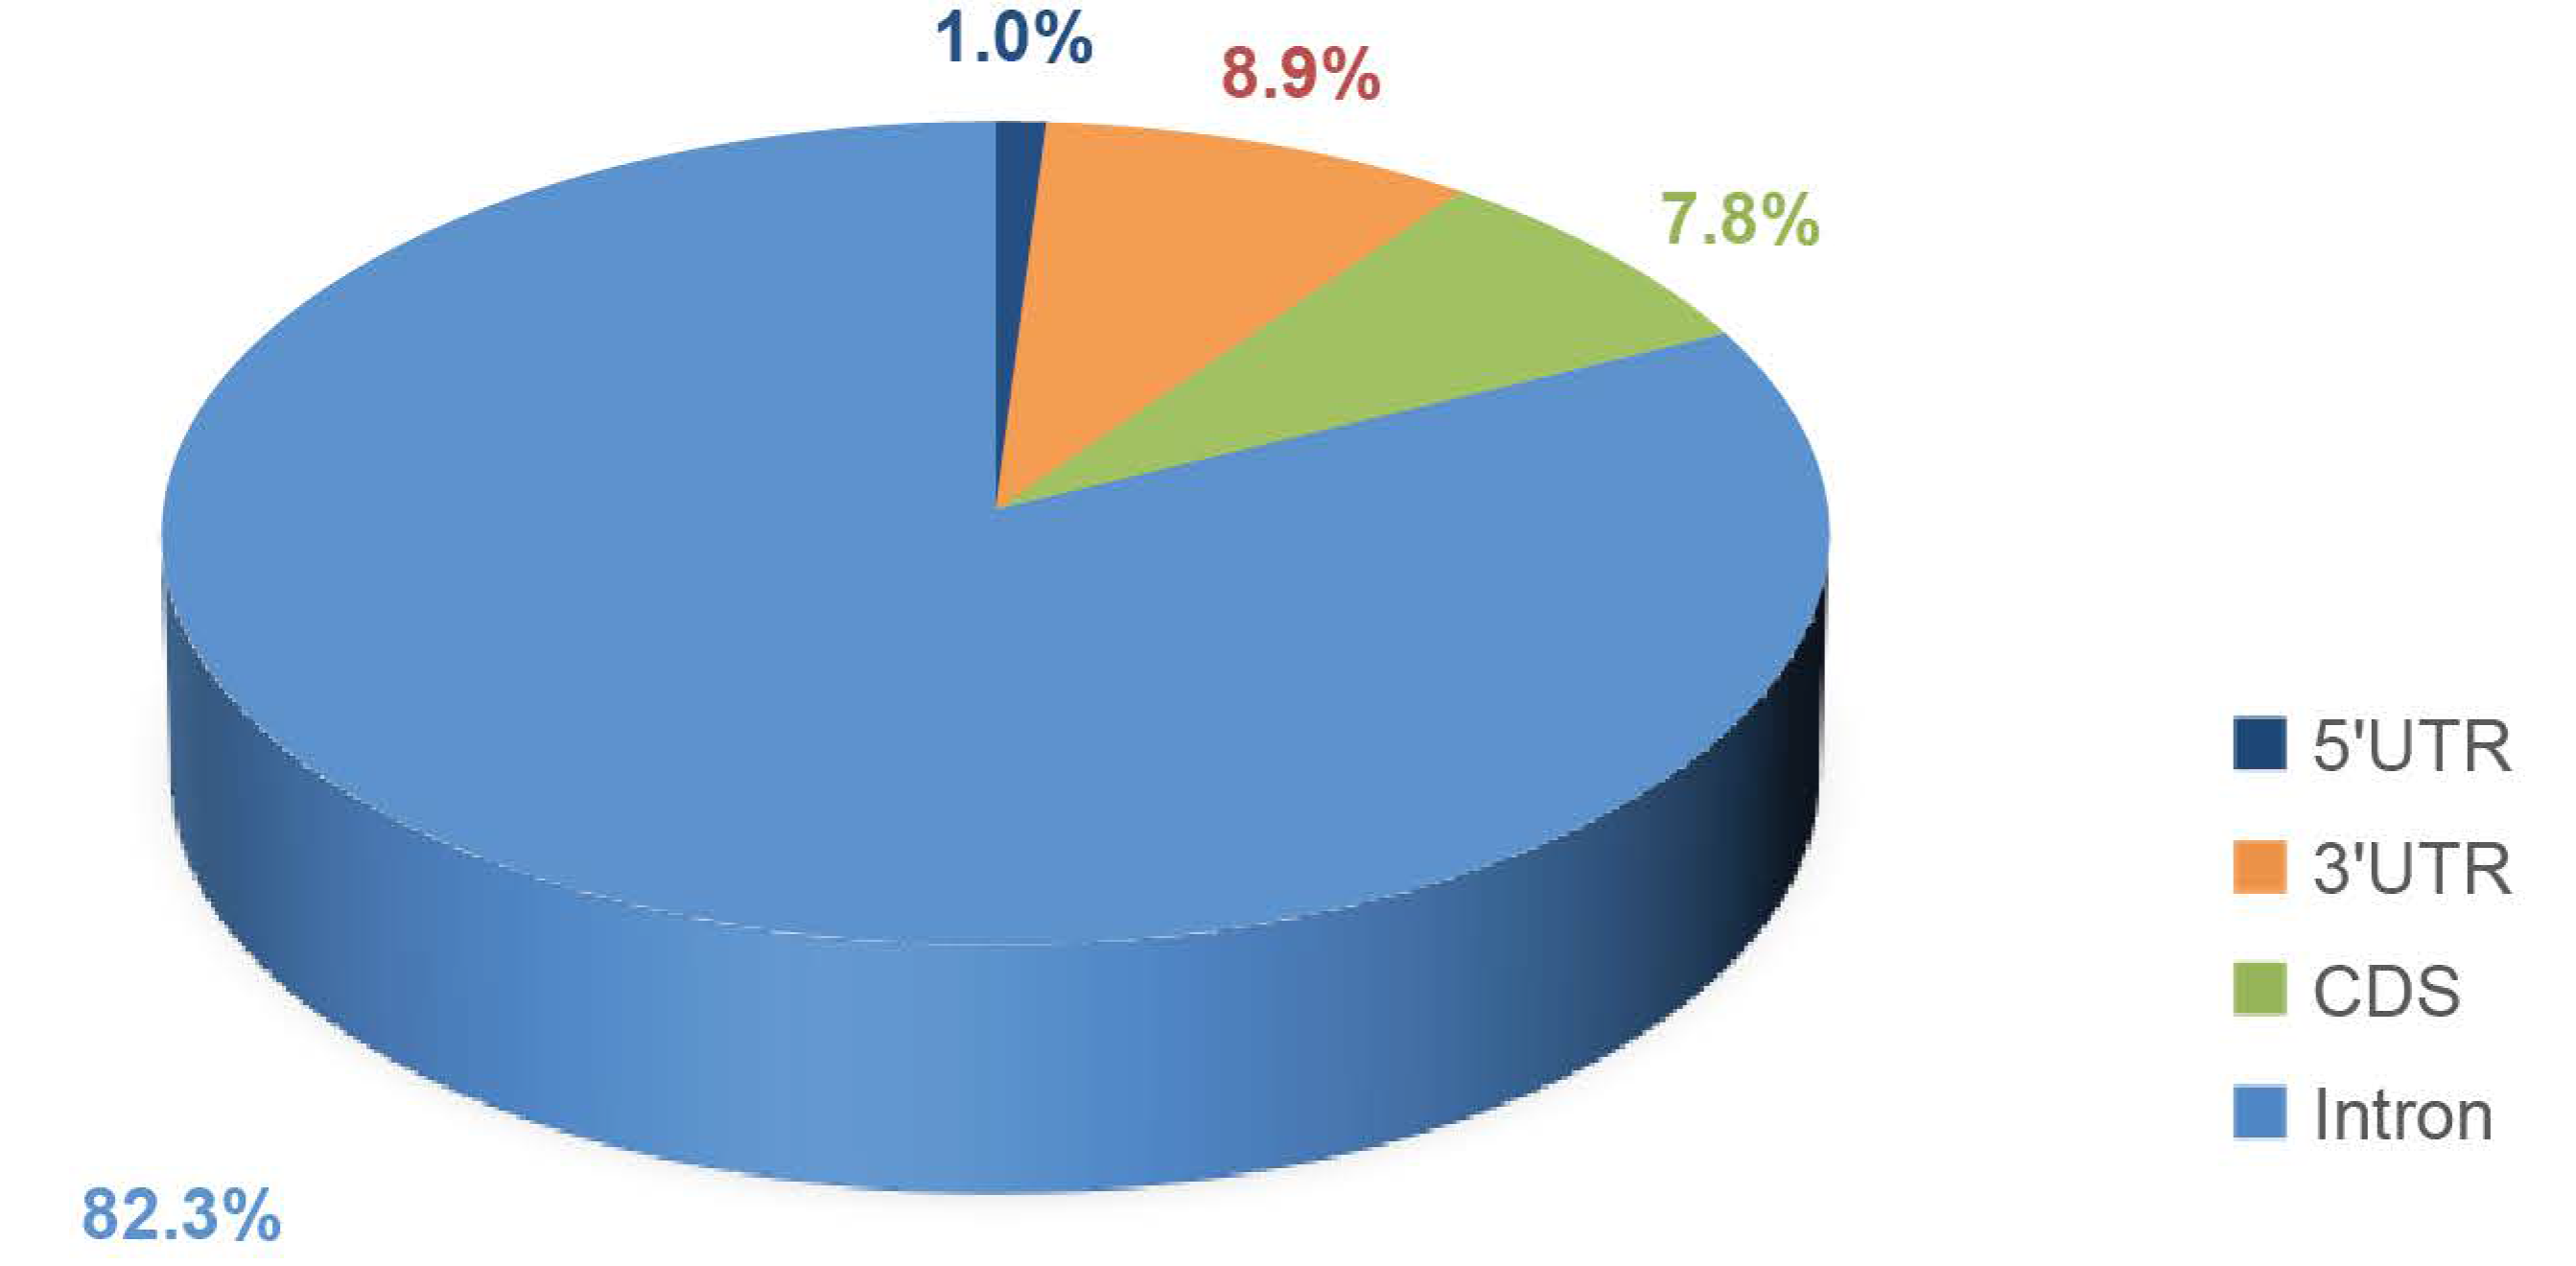
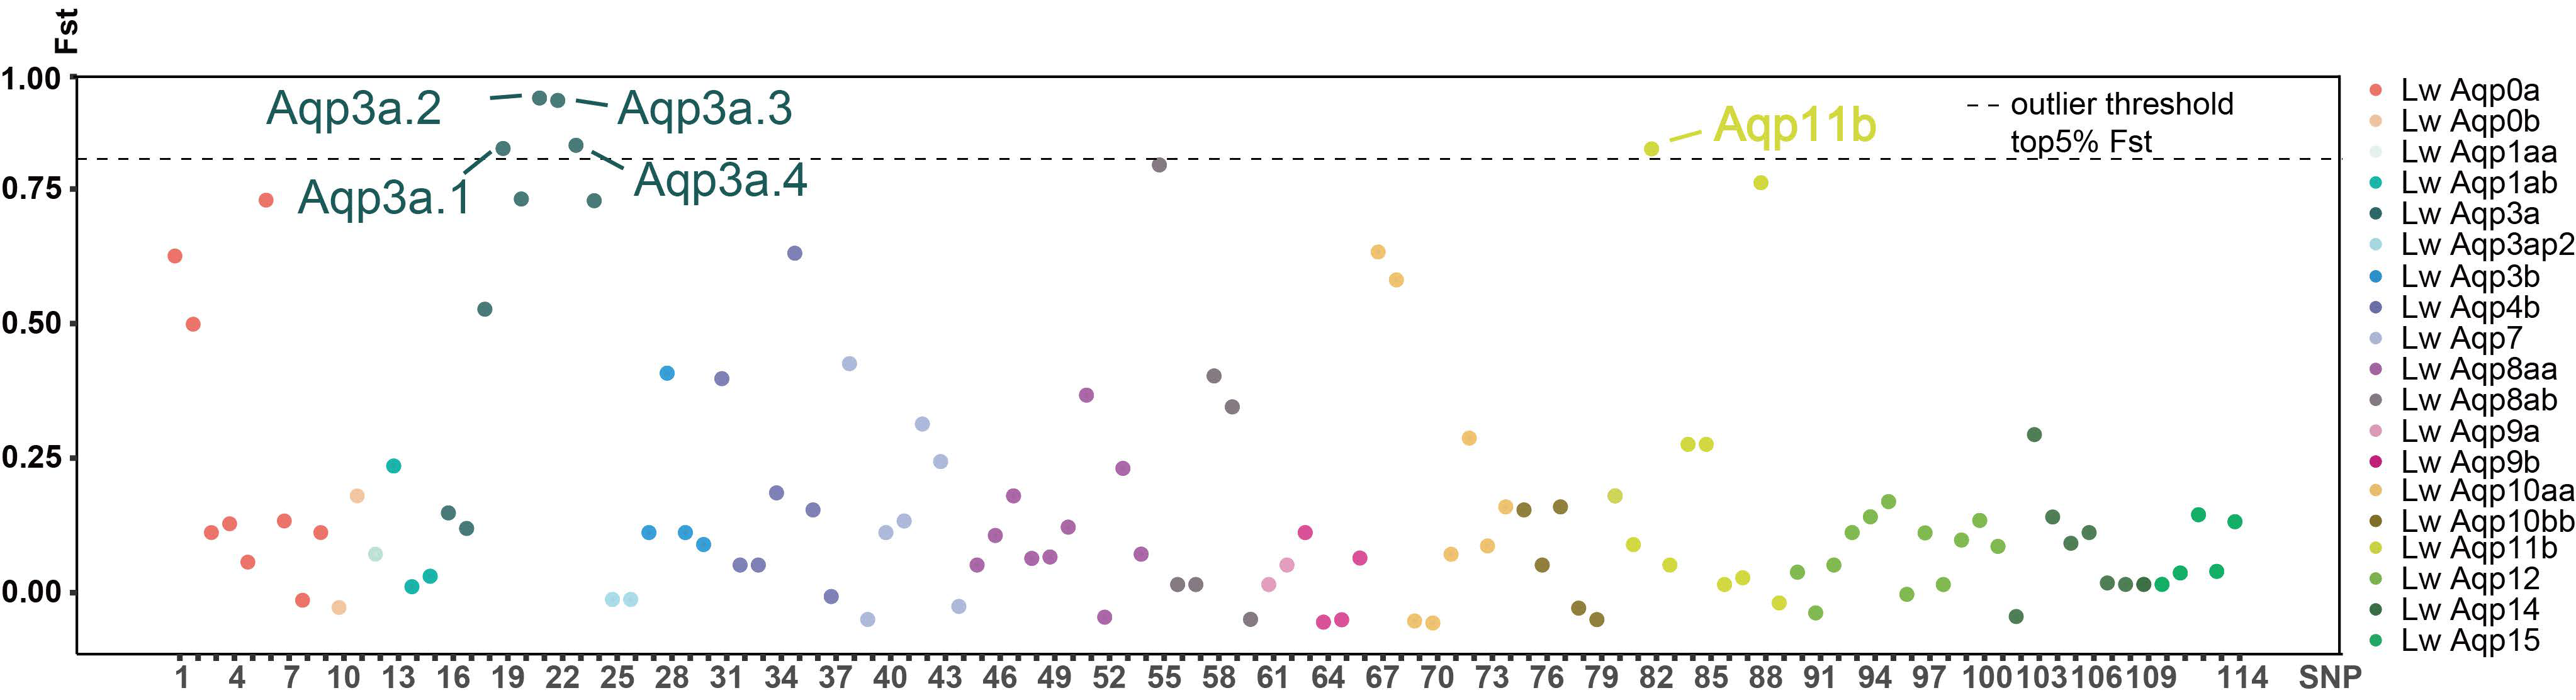
3.5. Classification of the SNP Markers of Aqp Gene and Statistics of the Fst Value in CDS Region

The SNPs of the Aqp gene in the DL and WSL populations were classified and counted in order to understand the distribution of SNPs in different regions of the gene (Figure 6). A total of 1460 SNPs were found in the intron, 3′-untranslated region (3′UTR), 5′ untranslated region (5′UTR), and CDS of the Aqp genes. SNPs in intron regions accounted for the largest proportion (82.3%), and its number was 1201. The SNPs in 3′UTR and 5′UTR accounted for 8.9% and 1.0%, and their numbers were 130 and 15, respectively. The SNPs in the CDS region accounted for 7.8%, with a number of 114.
The coding region of the gene guides protein synthesis and determines the function of the protein. Therefore, we focused on the SNPs in the CDS region of the gene. All SNPs in the CDS region were counted and displayed in a scatter chart (Figure 7). A total of 114 SNPs were found in the CDS region of LwAqps, with an average Fst value of 0.177 ± 0.256, indicating a large genetic differentiation in the gene family between the two populations. Superior numbers of SNP markers were found in aqp3a, -8aa, -11b, and -12: respectively, 9, 10, 10 and 12. Five SNPs were ultimately obtained by selecting the SNP markers with the top 5% of the Fst value in the CDS region. The five sites were aqp3a.1, -3a.2, -3a.3, -3a.4, and -11b, and their Fst values were 0.816, 0.910, 0.906, 0.822, and 0.816, respectively. The Fst value of these loci was close to 1, which showed highly genetic differentiation between two species. Of all, four SNPs were found in aqp3a, and the -3a.2 of the gene was the SNP marker with the highest Fst value.
The genotypes of the five SNPs in the genome of the DL and WSL L. waleckii were counted. We found that aqp3a.1 was mostly A/A in WSL and T/T in DL; aqp3a.2 was mostly G/G in WSL and A/A in DL; aqp3a.3 was mostly T/T in WSL and G/G in DL; aqp3a.4 was mostly C/C in WSL and A/A in DL; and aqp11b was mostly G/G in WSL and A/A in DL.

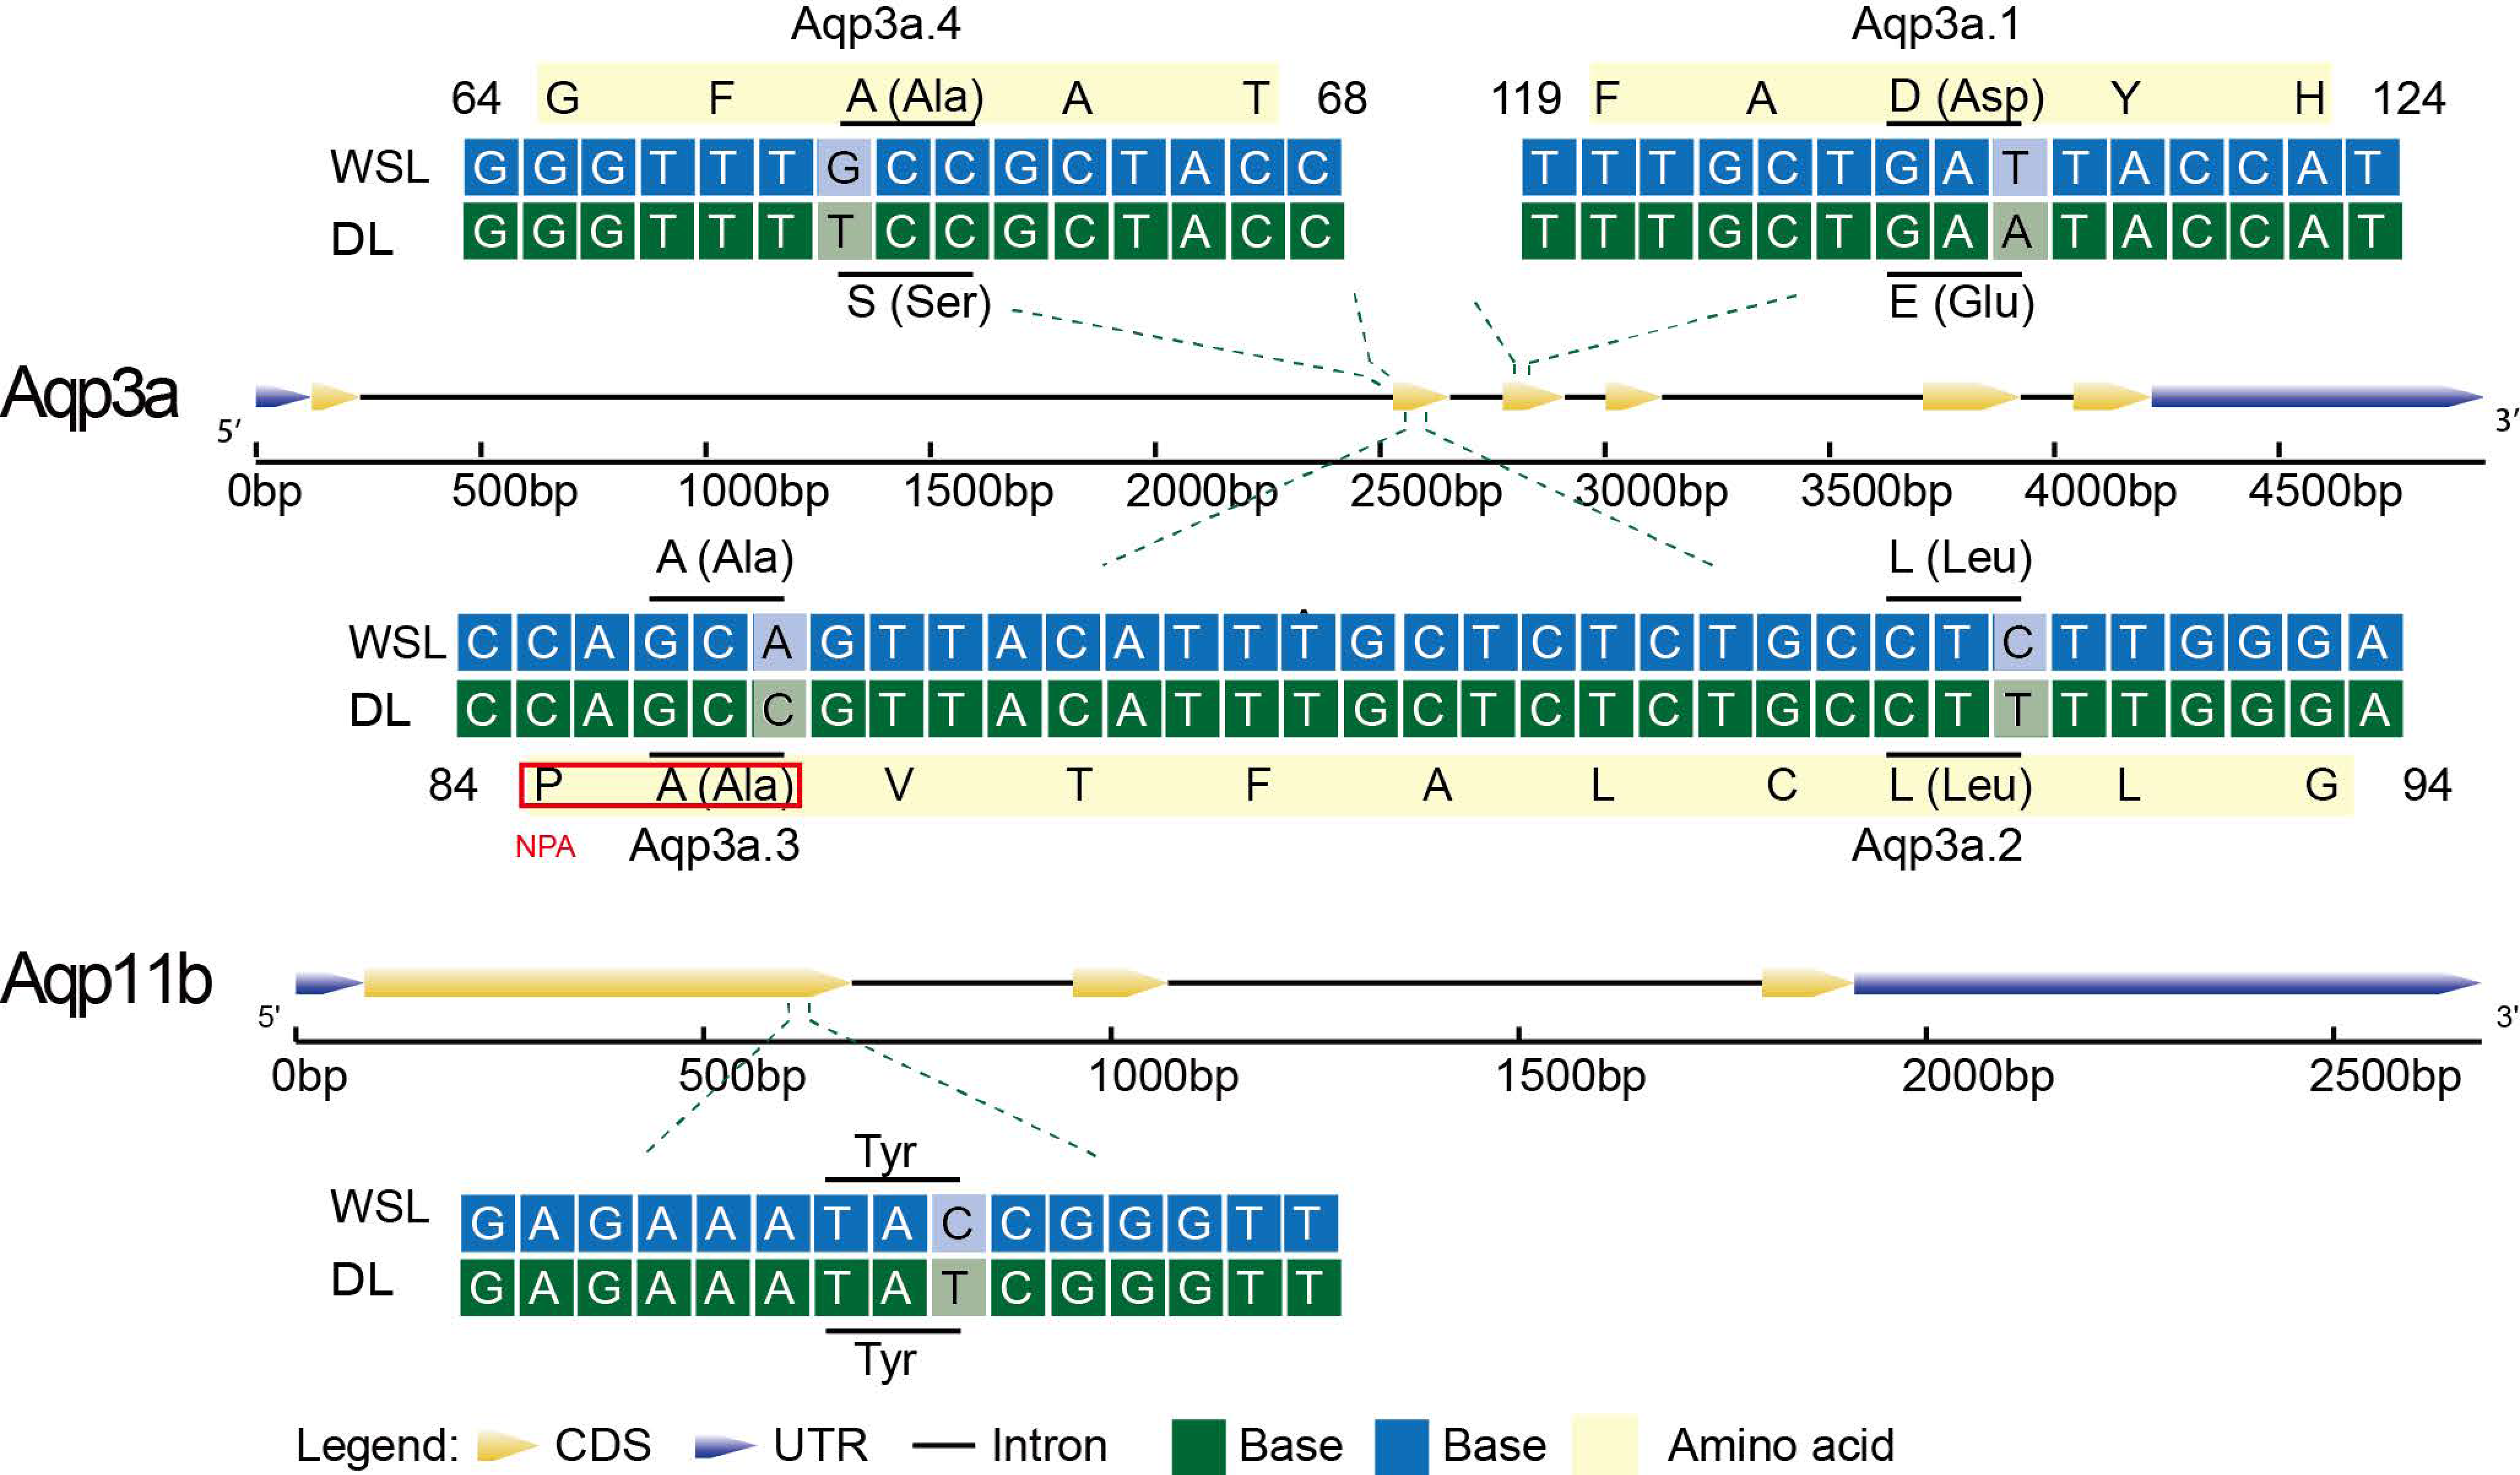
3.6. Base and Amino Acid Mutation Analysis of the Aqp Gene

The base mutation of SNP markers may bring about the amino acid mutation of the corresponding site and, finally, affect the function of proteins. The amino acid substitutes and their relative loci in the gene of these five SNPs is shown in Figure 8. The amino acids corresponding to these five sites were found. The aqp3a.1 is a nonsynonymous SNP that caused the substitution of glutamicacid for asparticacid. The aqp3a.2 and -3a.3 were both synonymous SNPs, and the amino acids in these sites were leucine and alanine, respectively. A nonsynonymous substitution occurred at aqp3a.4, replacing alanine with serine. Aqp11b was a synonymous SNP with amino acid tyrosine. There were synonymous mutations in aqp3a.7 and -3a.8, which correspond to leucine and serine, respectively. However, a non-synonymous mutation occurred in aqp3a.9, which changed histidine to lysine. The amino acid of aqp3a.3 was alanine in the first NPA. In addition to the above four SNPs in the Aqp3a gene, there were five SNPs in the CDS, including aqp3a.5, -3a.6, -3a.7, -3a.8, and -3a.9. Aqp3a.6 was mostly A/A in WSL and A/A in DL, and the Fst values of these five sites were 0.11, 0.14, 0.52, 0.72, and 0.72, respectively. Because the Fst values of aqp3a.5 and -3a.6 were too low and the genetic differentiation between the two populations was small as well, no further examination was conducted. Aqp3a.7 was mostly G/G in WSL and A/A in DL; aqp3a.8 was mostly C/C in WSL and T/T in DL; and aqp3a.9 was mostly A/A in WSL and G/G in DL. Aqp3a.7 and -3a.8 were both synonymous SNPs, and the amino acids in theses site were leucine and serine, respectively. A nonsynonymous substitution occurred in aqp3a.9 replaced histidine with lysine.

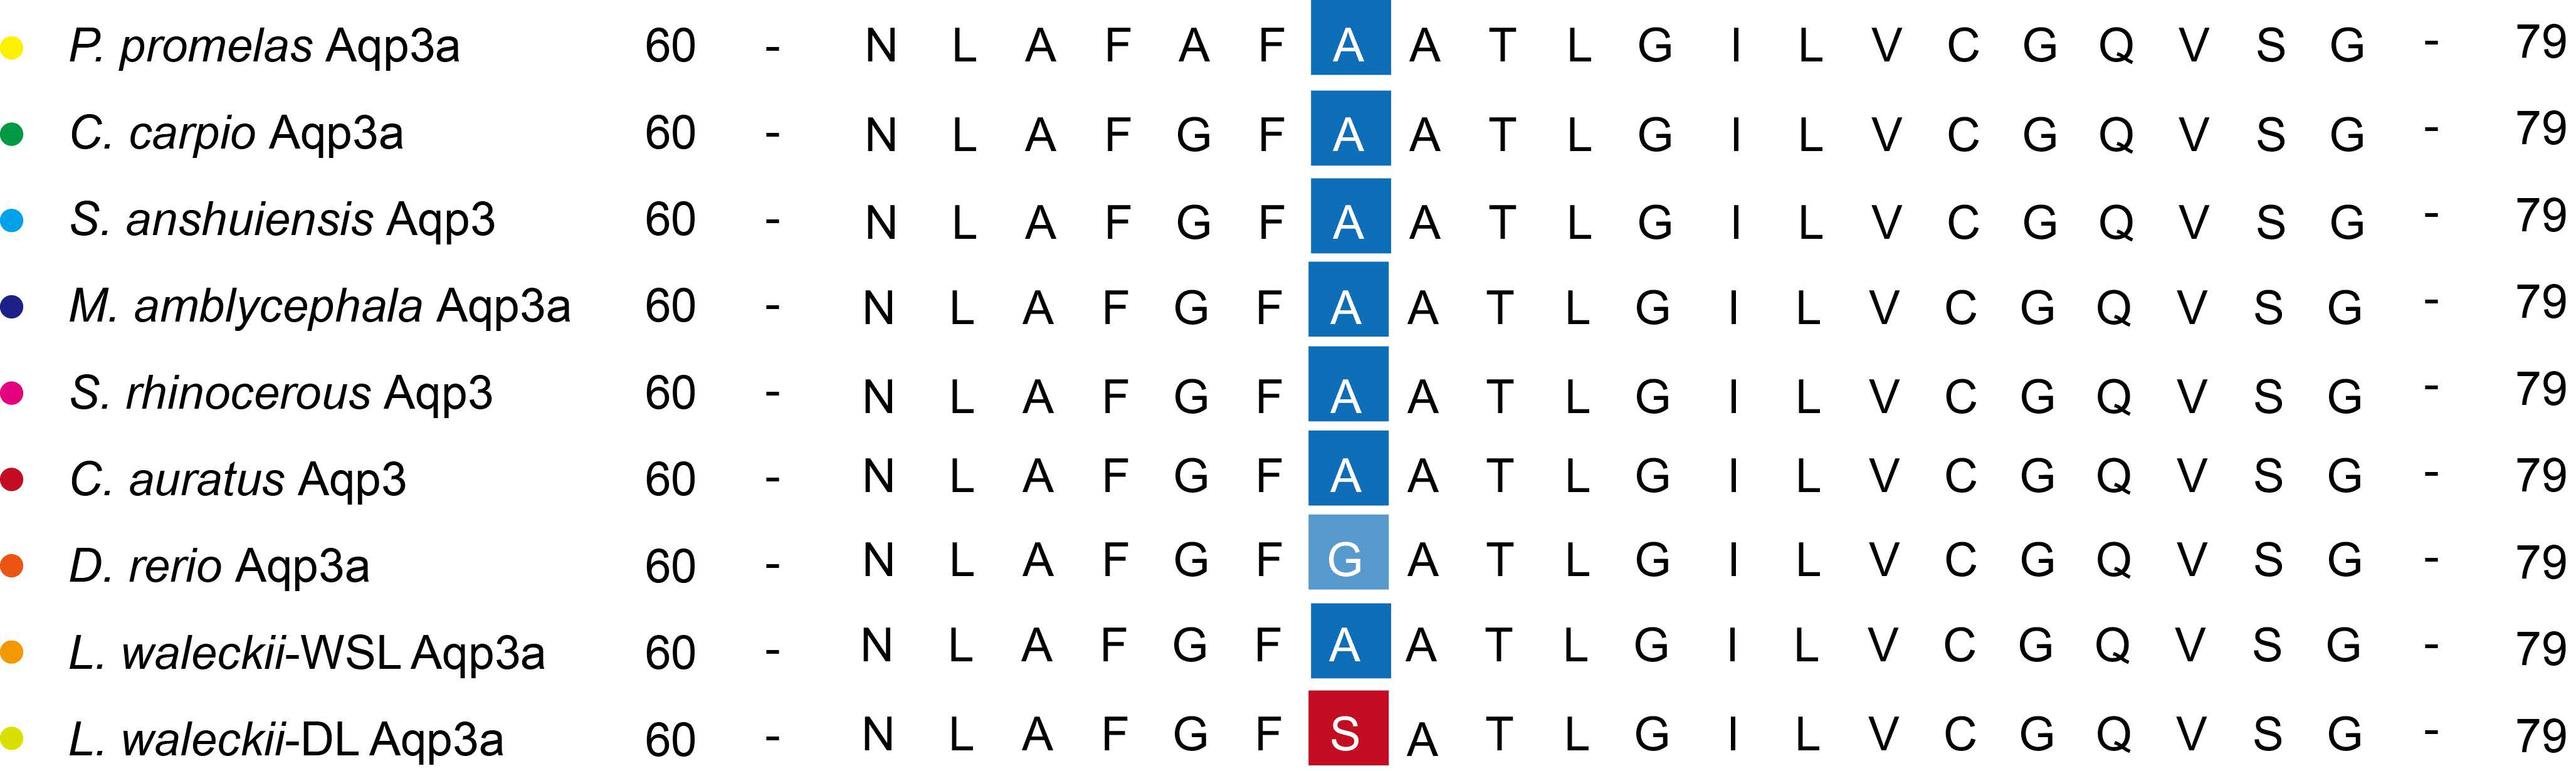
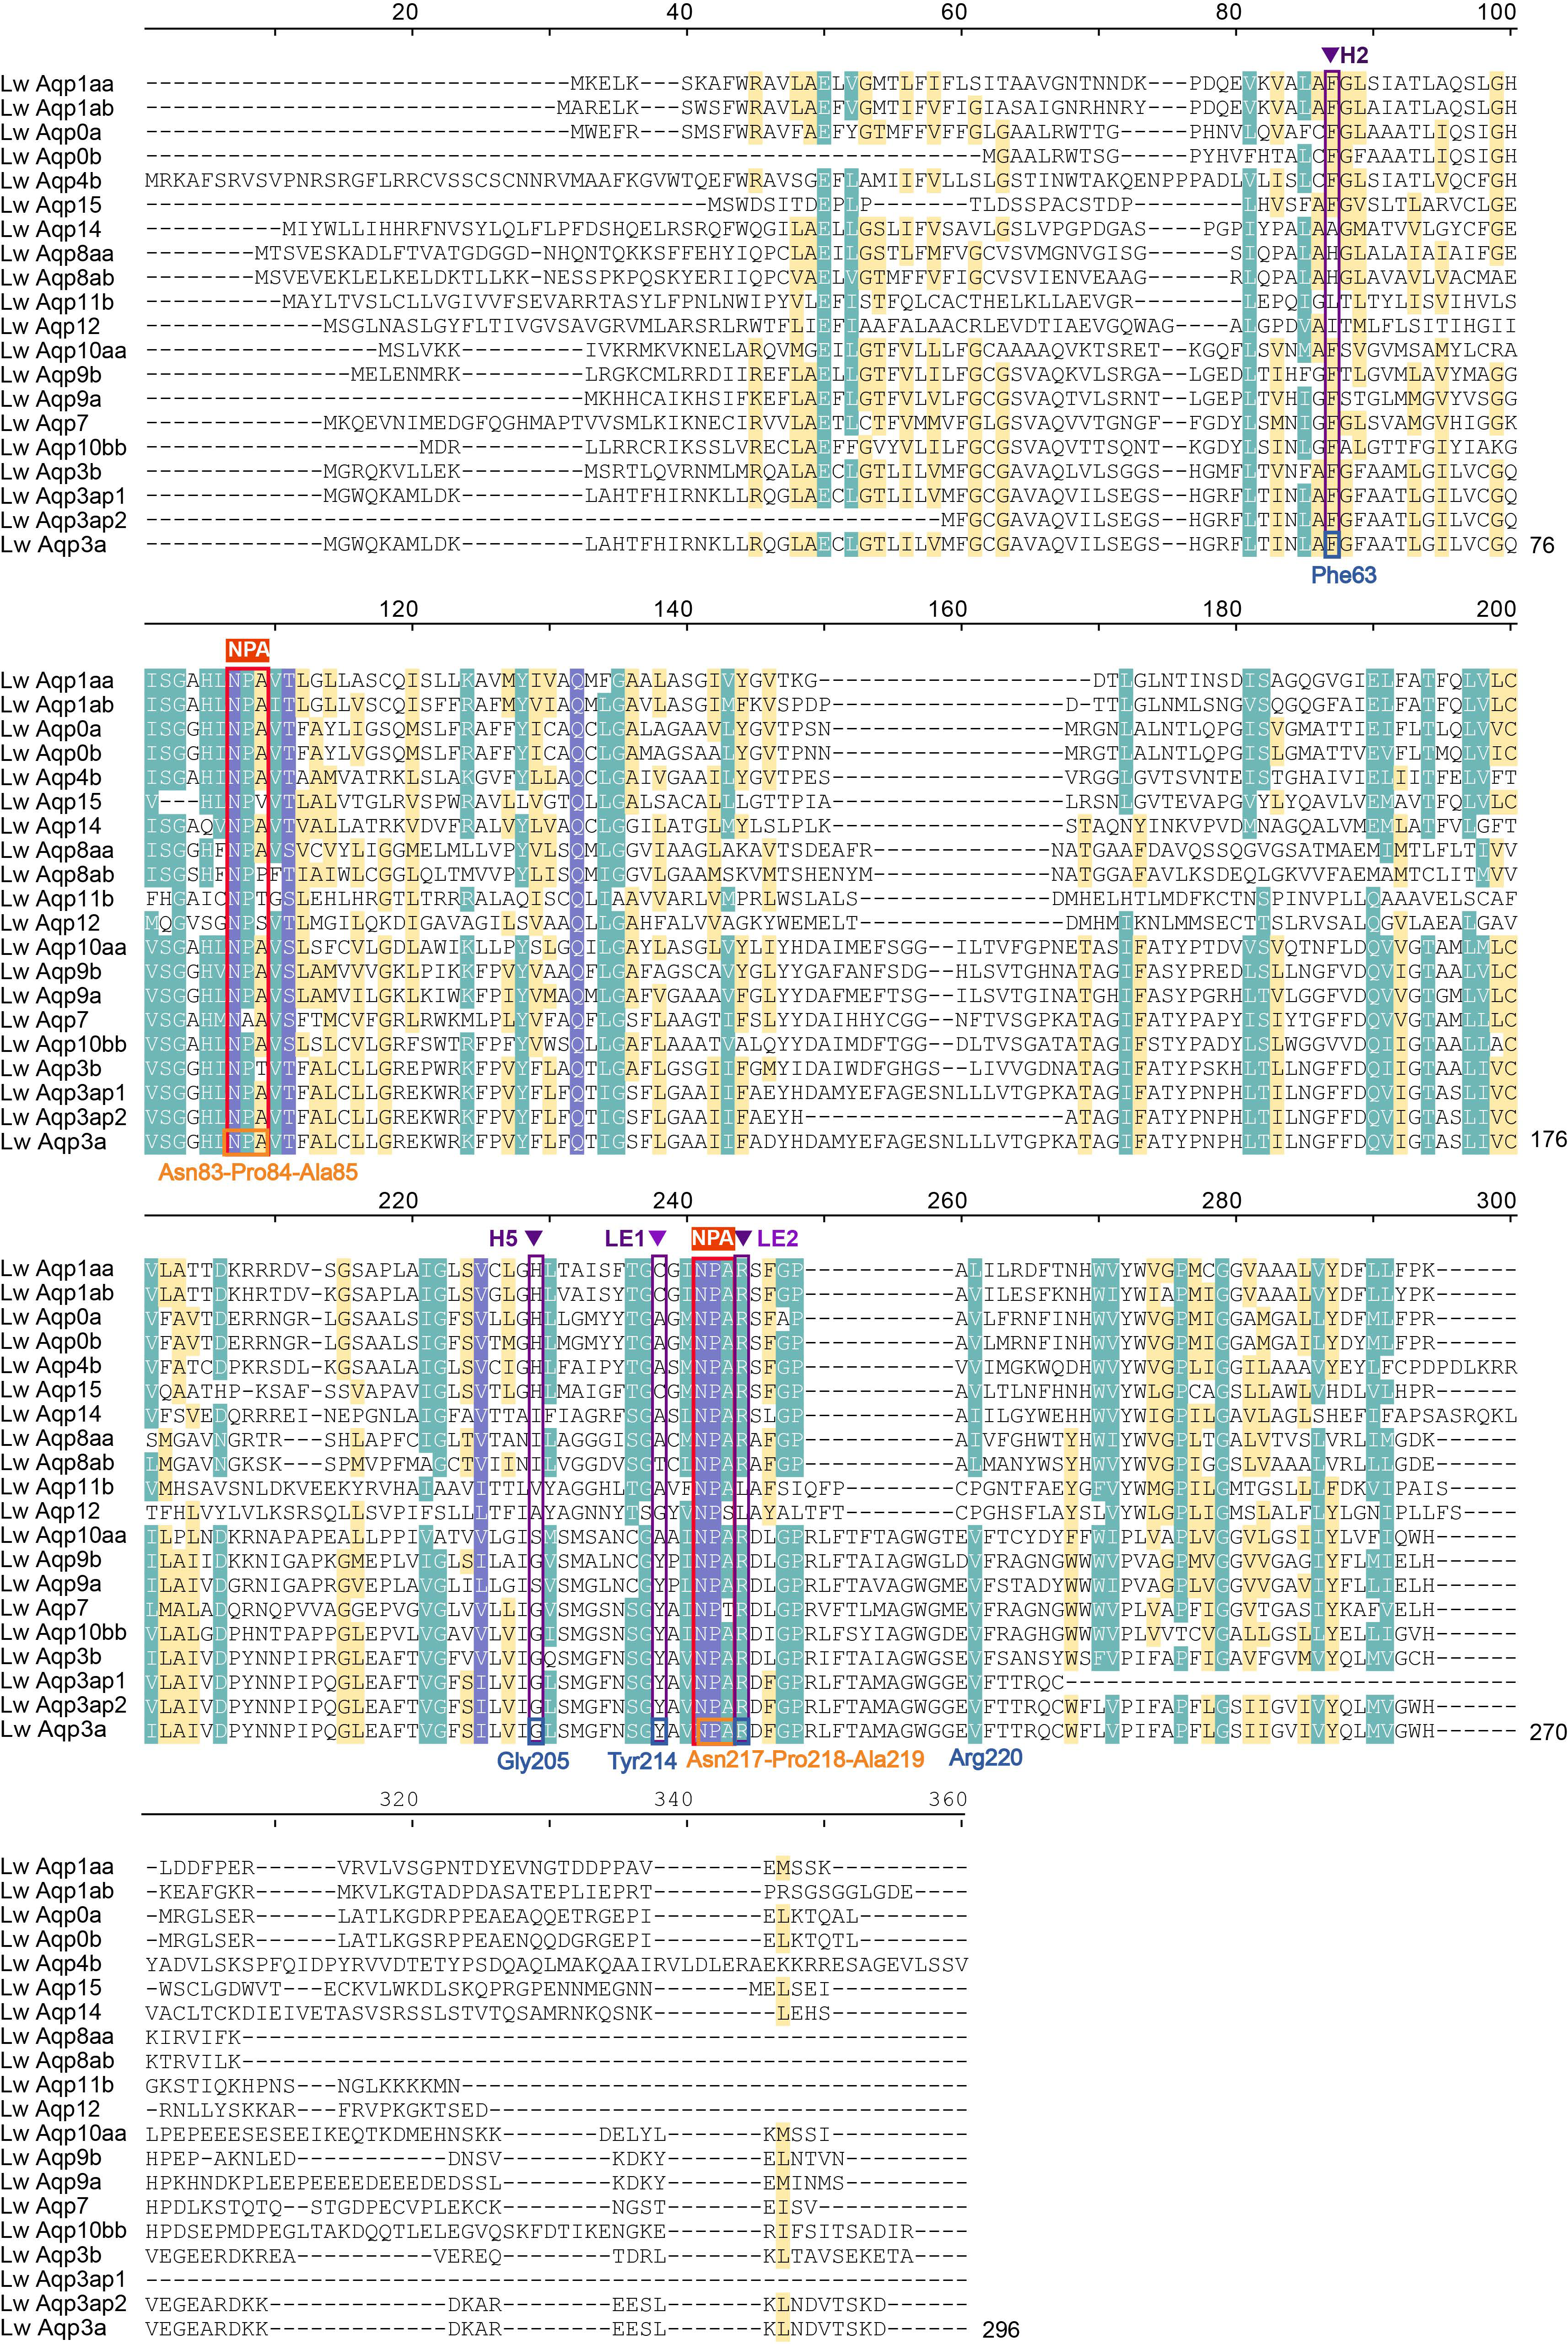
3.7. Amino Acid Sequence Alignment of Aqp3 in Multiple Species

Multiple sequencing of the amino acid sequences of L. waleckii and other freshwater species was used to further determine the differences in amino acids between alkaline and freshwater species. (Figure 9). We selected aqp3a.4, with the highest Fst value among non-synonymous mutations and being the 66th amino acid in the amino acid sequence. The amino acid sequences of Aqp3 in different alkaline and fresh water species were compared and analyzed. The comparison results show that, with the exception of zebrafish, the 66th amino acid of Aqp3a of freshwater fish, such as WSL L. waleckii, fathead minnow, common carp, blunt-snout bream, Sinocyclocheilus anshuiensis, Sinocyclocheilus rhinocerous, and crucian carp, was alanine, while that of the Aqp3a of DL L. waleckii (alkaline water fish) was serine.

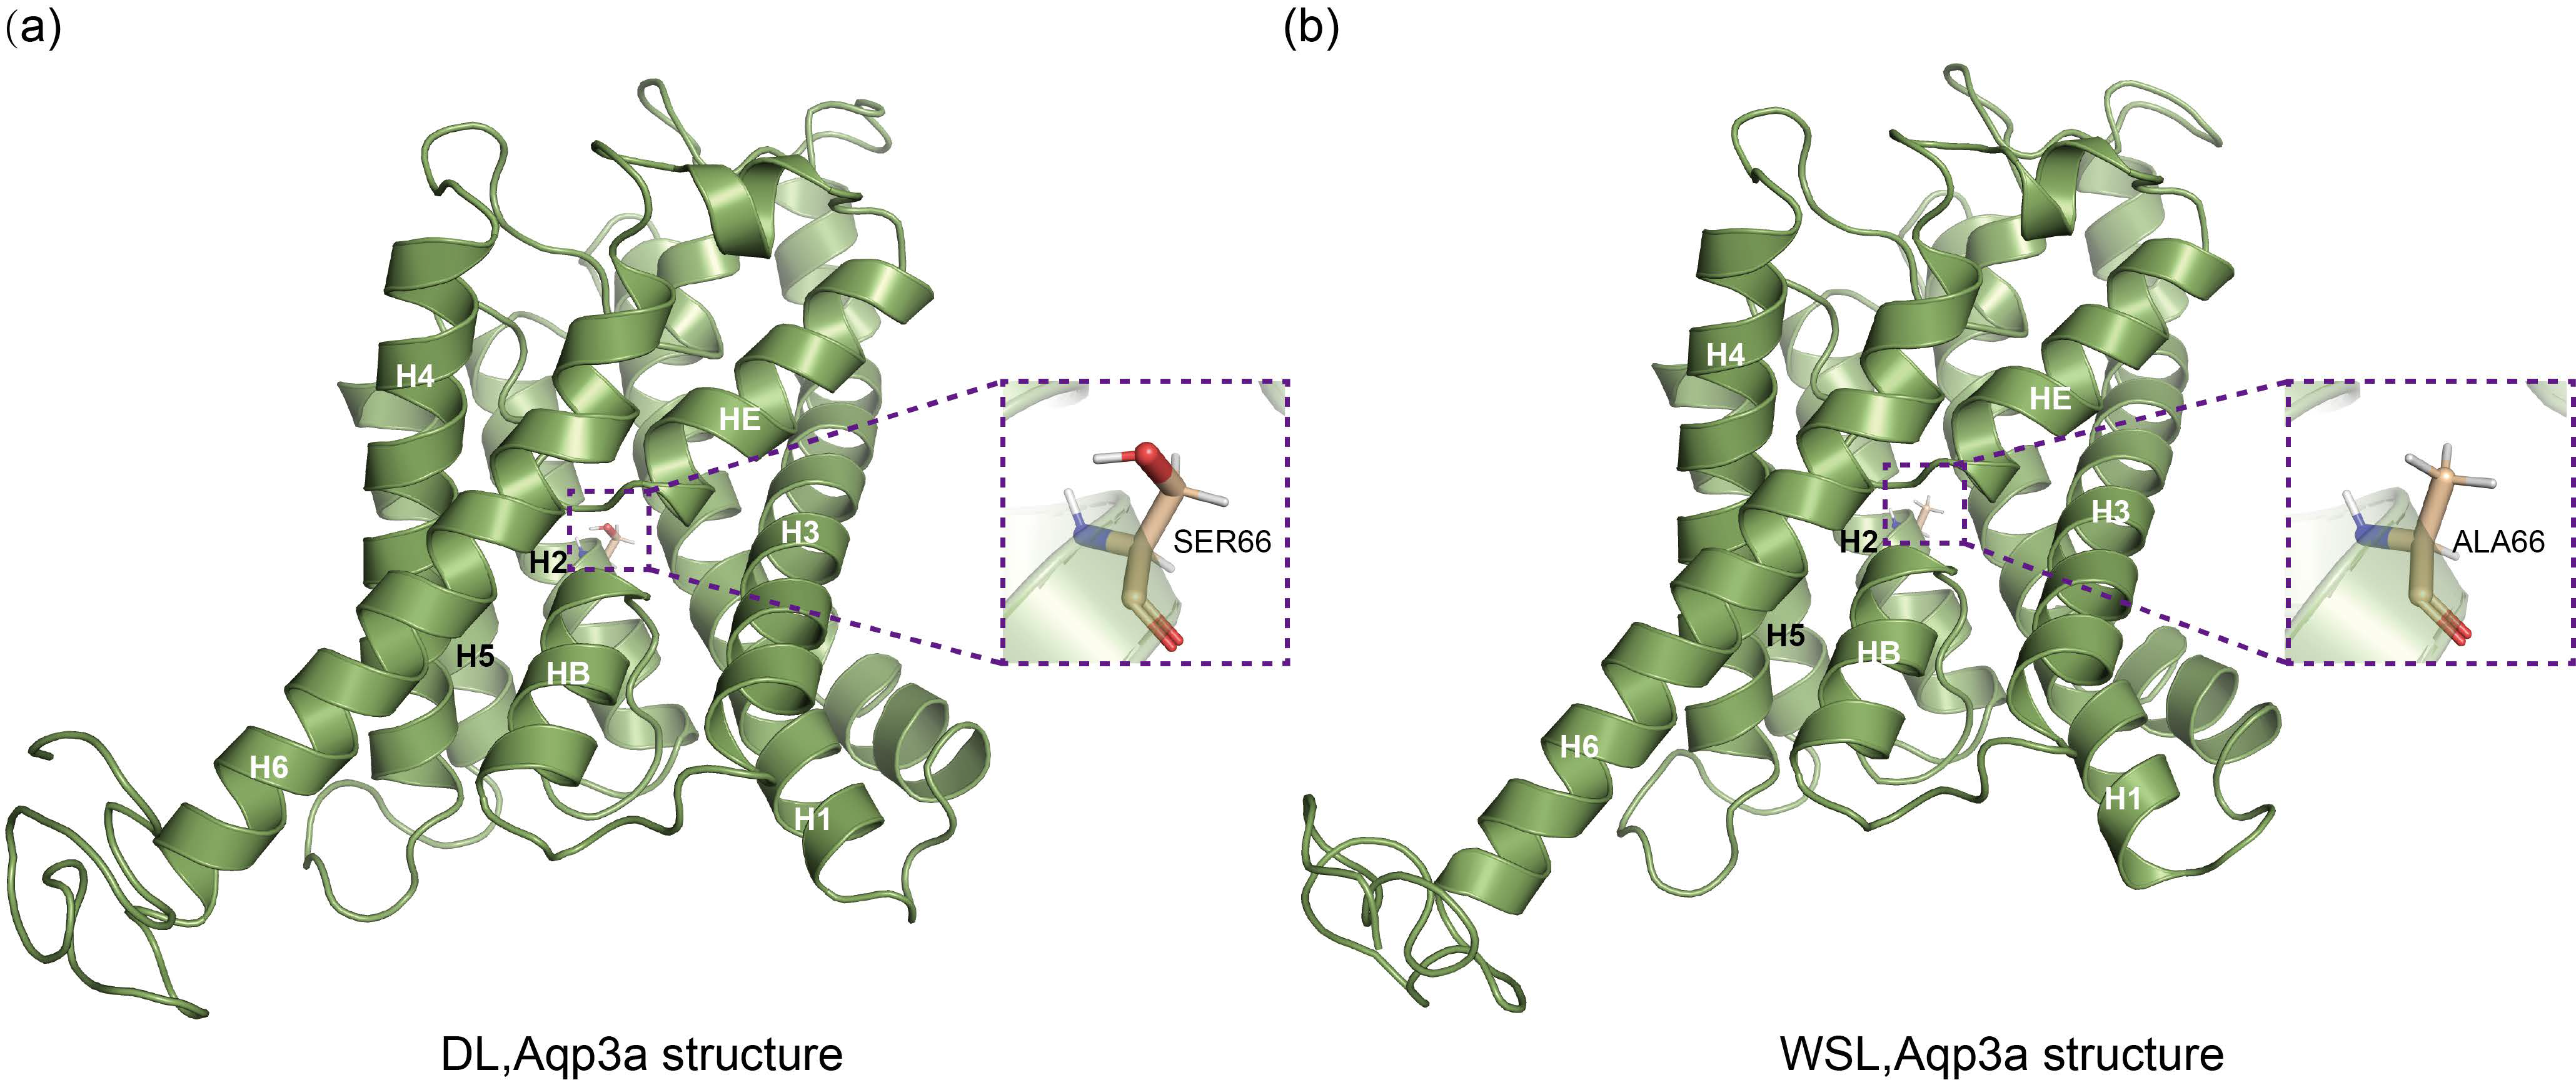
3.8. Prediction of the Three-Dimensional Structure of Aqp3a
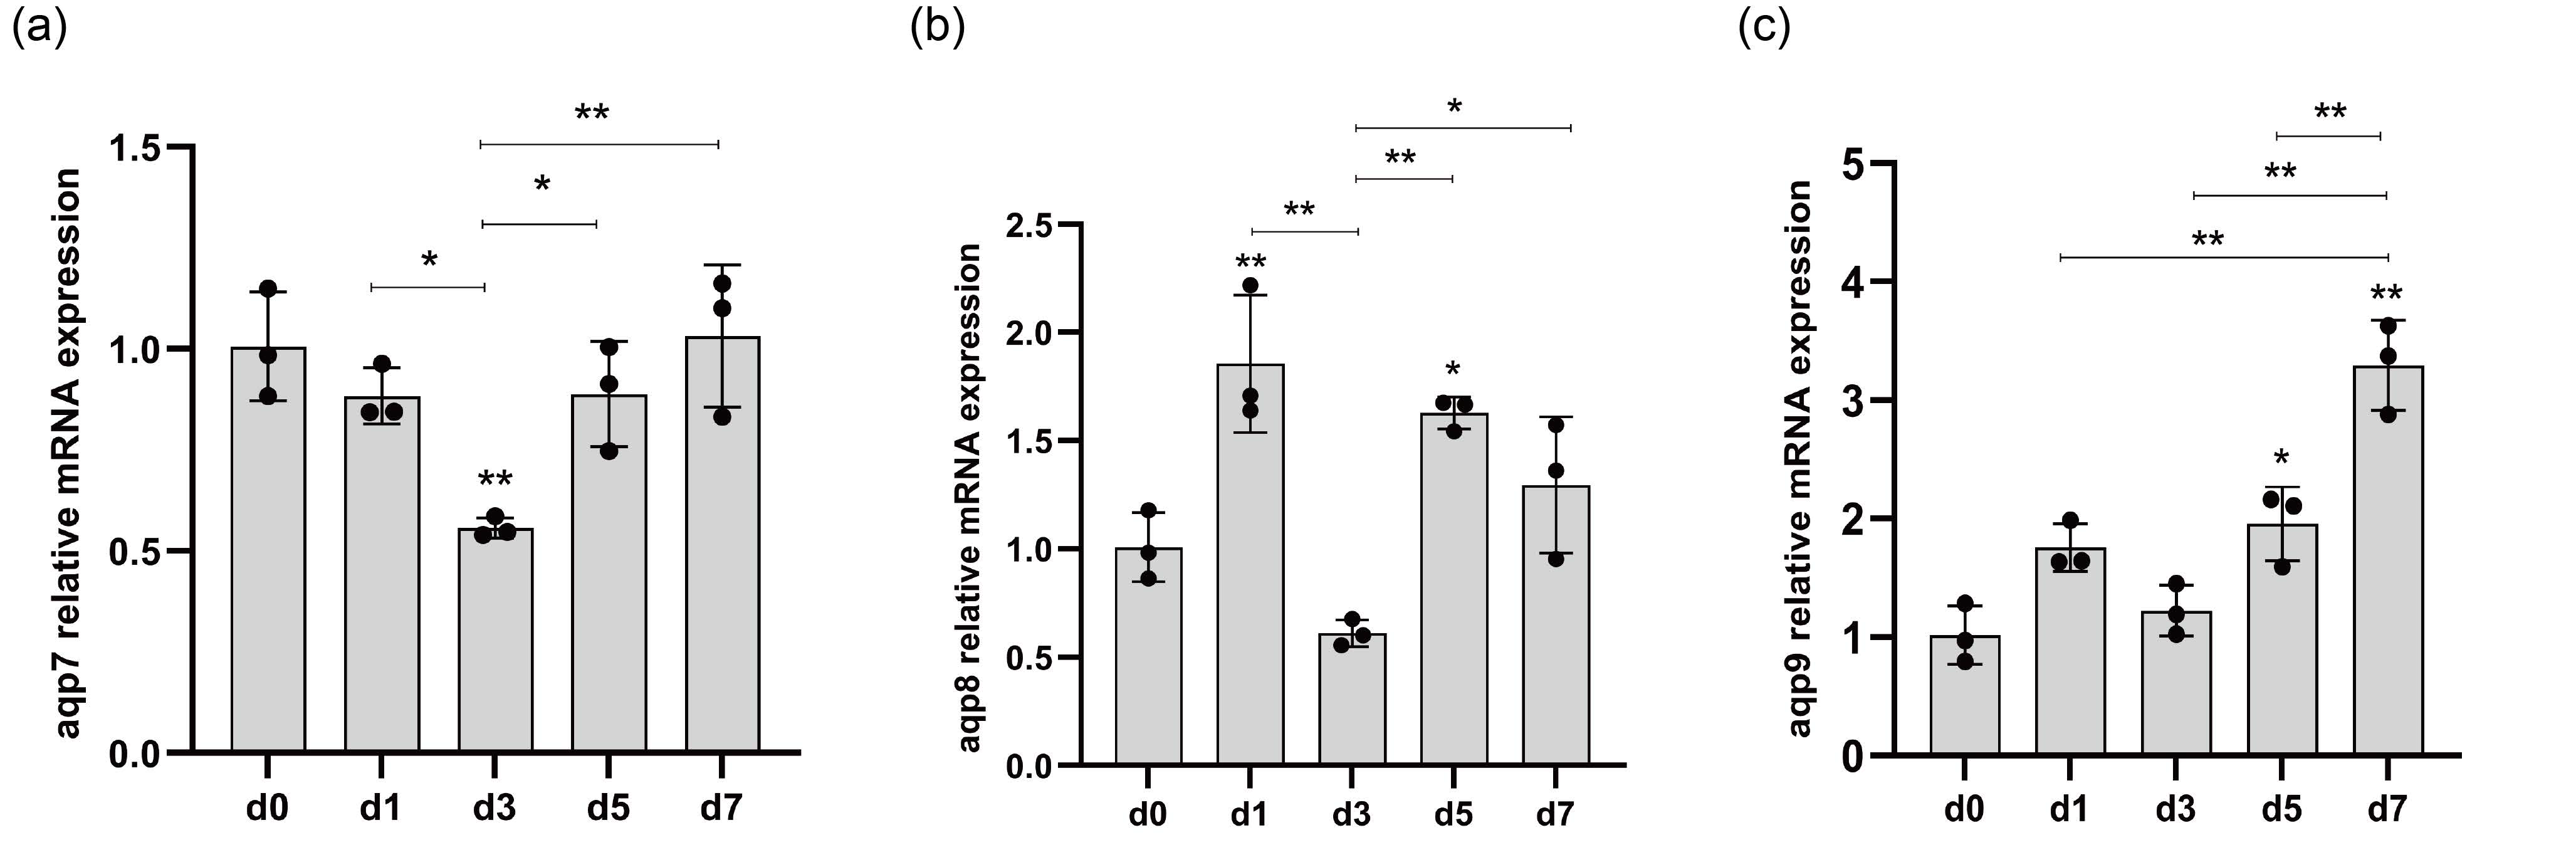
The Aqp3a was mainly composed of six transmembrane α-helices and two short helices, with the helices being connected by loops (Figure 10a,b). The other SNPs are detailed in Figure S3. Its secondary structure mainly includes α-helical and random coils. The three-dimensional structure of the Aqp3a of DL and WSL L. waleckii was practically similar (Figure 10a,b). The mutation of the amino acid at position 66 did not cause many changes in the three-dimensional structure of Aqp3a, and only caused a change in the structure of the valence bond at this site. All SNPs within the top 5% fst value are detailed in Figure S3. From this picture, we learnt that the 66th amino acid of Aqp3a.4 (Ser66) was in the center of H2 and near the Ar/R residue phenylalanine (Phe63).

3.9. qRT-PCR

To understand the potential role of aquaporin in ammonia excretion, the expression profiles of aqp7, -8aa, and -9a in the gill on day 0, 1, 3, 5, and 7 under a carbonate alkalinity condition of 50 mmol·L−1 were analyzed (Figure 11). The expression of these three genes significantly changed compared to that of the control group (carbonate alkalinity of 0 mmol·L−1). After 3 d of stress, the expression of aqp7 decreased to 0.56-fold. After 3 d and 5 d of stress, the expression of aqp8aa increased to 1.86-fold and 1.63-fold, respectively. After 5 d and 7 d of stress, the expression of aqp8aa increased to 1.95-fold and 3.29-fold, respectively. The expression of these three genes fluctuated on different days. The expression of each gene on d 3 was downregulated relative to d 1 (significant for aqp7, p < 0.05; extremely significant for aqp8aa, p < 0.01; insignificant for aqp9). The expression of aqp8aa was upregulated on d 1, downregulated on d 3, upregulated on d 5, and downregulated on d 7. However, the gene expression of aqp9a showed an overall upward trend. It is noteworthy that the expression trend of aqp7, -8aa, and -9a of qRT-qPCR was consistent with that of the RNA-seq, which confirmed the reliability of side RNA-seq data.

4. Discussion

Aquaporins are a group of proteins that assist in the transport of small molecules on the cell membrane to regulate homoeostasis under various stress environments, such as alkalinity. The cultivation of saline-tolerant and alkaline-tolerant fish is an effective practice to utilize saline–alkaline water resources for aquaculture purposes. Alkaline adaptation is one of the key factors for fish to adapt to a saline–alkaline environment via adjusting the acid–base balance and other forms of ion-osmoregulation. Previous studies have proven that the acid–base balance, osmotic pressure regulation, and ammonia excretion of fish experience severe disturbances in high-alkaline conditions. Nevertheless, there are some species that are able to cope with different levels of water hardness and pH environments. The DL L. waleckii is a fish that is able to survive in extreme alkaline environments. Understanding their alkaline adaptation mechanism is conducive to the cultivation of salt-tolerant varieties. Previous studies have suggested that Aqp genes play an important role in the regulation of these physiological processes. Therefore, the study on the role of Aqp genes under the alkalinity stress condition is able to reveal the role and the genes involved in regulating homeostasis.
In this study, we identified a total of 18 LwAqp genes and classified them into four grades: (I) classical aquaporins; (II) aquaglyceroporins; (III) ammoniaporins; and (IV) unorthodox aquaporins. However, there are only 13 AQP genes in the human genome [3]. This increase in the number of Aqp genes in fish is likely a result of a whole gene replication event. As shown in previous studies, the number of common carp Aqp genes increased to 38 because of the third round WGD (teleost-specific) [36], and Aqp genes in Atlantic salmon increased to 42 under the action of the fourth round WGD occurring in the tetraploid teleost [3]. The number of Aqp genes in L. waleckii was recorded at 18, while 20 Aqps were found in zebrafish [3].
It is interesting that aqp3a was found to have one intact gene and two truncated pseudogenes, despite the fact that diploid teleosts only have one copy of the gene (such as zebrafish [3]). There were dual NPAs in both truncated pseudogenes (aqp3ap1 and aqp3ap2) and the composition of the Ar/R region was similar to that of aqp3a complete sequence. Pseudogenes containing double NPA are rare in previous studies. Since aqp3a and -3ap1 both highly expressed in the gills and have a similar expression pattern in alkaline water and its recovery studies, we hypothesize that aqp3ap1 might have some sort of regulatory function. This result is similar to the study by Yilmaz et al., who found that the aqp9a1_v2 exon 3 deletion variant was widely expressed in the same tissue as its complete version, but did not function in permeating water and glycerol as the complete version did in Xenopus oocytes when expressed alone [38].
The evidence from this study suggests that LwAqps plays an important role in the response to alkalinity stress. In the continuous experiment of transferring the fish from alkaline water to fresh water, the gene expressions of aqp0a, -3a, -3ap1, -7, -8aa, and -9a were upregulated in alkaline water compared with the control group, and then downregulated in the fresh water environment. The average value of Fst of SNP markers in CDS region was 0.177 ± 0.256, which indicates that there is significant genetic differentiation in the DL and WSL populations. The divergence of Aqp genes in these two populations might have relieved the alkalinity pressure of DL L. waleckii. According to these data, we can infer that Aqp is involved in the adaptation of DL L. waleckii to alkaline stress. Similarly, studies have shown that Aqp genes are involved in the response of ridgetail white prawn [35] and common carp [31] to alkalinity stress.
Our results indicate that aqp3a is one of the key genes that modulates the adaptation of L. waleckii to a high-alkaline environment. Four of the five coding SNPs with a top 5% Fst value were identified at aqp3a and their Fst value was close to 1, which indicates a high differentiation between the DL and WSL population. This suggests that the aqp3a of the DL species may have a unique function that favors the survival of L. waleckii in the high-alkaline environment of the DL. Aqp3a was highly expressed in the gill, an important tissue for alkaline adaptation, after 7 days of alkalinity stress. This is consistent with a previously study in L. waleckii that found more genes were differentially expressed (the threshold is 2-fold) in the gill than in the kidney and intestine when exposed to alkaline water (sodium bicarbonate was 50–55 mmol·L−1) for 30 d [32], which suggests that aqp3a was involved in alkaline adaptation. The aqp3a expression was upregulated on the first and tenth day after being exposed to alkaline water [31]. A similar upregulation of expression has also been seen in other species. Aqp3a expression was significantly upregulated on the second day after 15 mmol·L−1 alkali treatment and on the first day after 30 mmol·L−1 alkali treatment in common carp [31]; aqp3 expression in the gill was significantly upregulated with increasing carbonate alkalinities (p < 0.05) in Songpu mirror carp (Cyprinus carpio Songpu) [30]. This further illustrates the role of aqp3a in the alkaline tolerance of L. waleckii at the genetic level.
Aqp3a may be a potential osmoregulation gene under hypotonic conditions. Aqp3a was expressed higher in WSL L. waleckii than in the DL population. The expression of aqp3a was upregulated on the first day after entering fresh water. Water is a polar molecule that can pass directly through the cell membrane along a concentration gradient. Under the conditions of an inverse concentration gradient, it depends on transporters to achieve permeation across the cell membrane [39]. A possible explanation for the above results is that L. waleckii’s excretion of water is hampered under a hypotonic environment, relying on aqp3a for osmoregulation. Similar responses were noticed in other euryhaline species, such as aqp3 expression being over eight-fold higher in the freshwater group than that of a seawater-acclimated group in sea bass (Dicentrarchus labrax) [14] and aqp3 expression in the gill of freshwater cultured fish being higher than that in mariculture fish (p < 0.05) in Asian sea bass (Lateolabrax maculatus) [40].
Some members of the AQP family may have a function in ammonia excretion during the progression of DL L. waleckii from freshwater to alkaline water. In the process of alkaline water to fresh water recovery, some family members of AQP may have a function in osmoregulation. As mentioned above, L. waleckii is stressed by ammonia excretion when faced with a high-alkaline environment during the passage from alkaline water to freshwater. Some aquaglyceroporin genes (aqp3a, -3ap1, -7, and -9a), as well as the ammonia channel protein gene aqp8aa, had an overall trend of upregulation in alkaline water and downregulation in freshwater recovery. These genes are closely related to the process of ammonia excretion. Numerous studies have confirmed that these genes are involved in the transportation of ammonia. For example, the AQP3, -8, and -9 significantly favored the permeation of ammonia in Xenopus oocytes [29]. Our results imply that Aqps contributes to ammonia excretion. Similar results were found in proteins that also act as ammonia channel proteins, and the expression of L. waleckii’s Rh gene was upregulated to facilitate ammonia excretion in our previous study [26]. Furthermore, aqp3a, -3ap1, and -9a were highly expressed in the gill, and aqp8aa was highly expressed in the intestine. Some classical aquaporin genes (aqp1aa and -1ab) and the unorthodox aquaporin gene aqp11b had an overall trend of downregulation in alkaline water but were upregulated in freshwater recovery during the process of alkaline water to fresh water recovery. Aqp1aa and -1ab have been considered to be closely related to water transport in previous studies [41,42]. Additionally, Aqp1aa was considered to be water-specific in a gilthead seabream study [41]. Aqp11 appears to be involved in the transport of water [43]. This implicated Aqp genes plays an osmoregulatory role in fresh water.
L. waleckii is a type of migratory fish. Under freshwater conditions, L. waleckii needs to excrete excess water, while in an alkaline water environment, it needs to excrete excess salt. In the freshwater environment, the external hypotonic state hinders water excretion, so the L. waleckii may achieve water excretion with the help of Aqp3a, which is a transporter. However, water is transported by simple diffusion against its concentration gradient in alkaline water, with concentration-gradient-driven diffusion. However, the expression of Aqp3a remained upregulated in alkaline water, and a possible explanation for this is that Aqp3a aids in the excretion of ammonia. The reason for this difference of osmotic substances is not clear, and it may rely on a pH-dependent gating effect [44].
Serine was substituted for alanine in position 66 of the Aqp3a amino acid sequence, which may have implications for solute permeability. The aquaporin family shows high homology among its members; this implies that its side-chain residues may be intimately related to the functional difference. Although the mutation of this amino acid does not change the overall protein structure, it may still cause changes in protein function. We will discuss the potential functional significance from two aspects. First, from the studies already available, we speculate that residue 66 is involved in the translocation of the gene. Prior research showing that, during the process of AQP1 synthesis in the endoplasmic reticulum, only TM1, TM3, TM5, and TM6 co-translate across the ER membrane, while TM2 accesses the endoplasmic reticulum lumen through a translocon [45,46,47,48]. The function of SER66 on the corresponding site of human AQP1 (SER59) is related to the translocation of TM2 in this process [49]. There is an emerging consensus that aquaporins can rapidly regulate membrane permeability through translocation [50]. In this process, aquaporins translocate from intracellular vesicles to the plasma membrane, thus changing the permeability of the membrane to promote the rapid penetration of solute. At the same time, osmotic stress will also lead to the occurrence of AQP3 translocation [51]. However, whether this site is involved in the post-translational translocation process has not been investigated. We speculate that the translocation process involved at this site may favor its solute specificity [12]. Residue 66 is located near Phe63 in the Ar/R, and several residues have been found to be involved in solute permeation [45]. In conclusion, although the residue 66 did not bring about an overall change in the three-dimensional structure of Aqp3a from the alkaline and freshwater species, the subtle differences it caused may be conducive to adaptation in its alkaline aqueous environment.

5. Conclusions

In this paper, 18 Aqp genes from four grades were identified in the genome of L. waleckii through genome-wide identification. The Aqp genes were highly expressed in osmoregulation-related organs and alkaline water environments, and they were highly differentiated between the DL and WSL populations. Five SNPs with Fst values close to 1 were identified in the analysis of the genetic evolution between alkaline and fresh water populations. The Aqp3a gene, which is closely related to alkaline adaptation in L. waleckii, was unique in the alkaline water environment. Through this study, we revealed the Aqp gene expression pattern under different conditions, which is helpful to understand the role of the Aqp gene under alkalinity stress. Further evolutionary perspective analysis discovered that changes occurred in Aqp genes under alkalinity habitats, which may result in alkaline resistance. Overall, this study strengthened our knowledge of the mechanisms of alkaline adaptation in L. waleckii and provided a theoretical basis for breeding alkaline-tolerant fish for aquaculture development.

Supplementary Materials

The following supporting information can be downloaded at: https://www.mdpi.com/article/10.3390/fishes8020107/s1, Table S1: Detailed information of sequences used in phylogenetic tree construction. Table S2: Detailed LwAqp sequences (genomic, CDS and protein sequences) from Leuciscus waleckii. Figure S1. Manual analysis of the aqp3a leading to the theoretical redefinition of aqp3a used in this work. Figure S2: Amino acid sequence alignment of Aqp of six species. Figure S3: The front view (a) and top view (b) of three-dimensional structure and high Fst value amino acid mutation sites of Aqp3a in the DL L. waleckii.

Author Contributions

Conceptualization, L.L., Y.C., F.Z. and S.W.; methodology, F.Z. and S.W.; software, F.Z. and S.W.; formal analysis, F.Z. and S.W.; investigation, F.Z. and S.W.; resources, L.L., Y.C. and L.Z.; data curation, S.W.; writing—original draft, F.Z. and L.L.; writing—review and editing, L.L., H.L. and F.Z.; visualization, F.Z.; supervision, L.L.; project administration, L.L.; funding acquisition, L.L. All authors have read and agreed to the published version of the manuscript.

Funding

This research was funded by the National Key R&D Program of China, grant number 2019YFD0900405.

Institutional Review Board Statement

The animal study protocol was approved by the Institutional Review Board of the Animal Care and Use Committee of Heilongjiang River Fisheries Research Institute of Chinese Academy of Fishery Sciences (HRFRI).

Data Availability Statement

Raw data and final assembly for this project were submitted to NCBI under BioProject PRJNA929316; sample is described in BioSample SAMN32957118.

Conflicts of Interest

The authors declare no conflict of interest.

References

  1. Denker, B.M.; Smith, B.L.; Kuhajda, F.P.; Agre, P. Identification, purification, and partial characterization of a novel Mr 28,000 integral membrane protein from erythrocytes and renal tubules. J. Biol. Chem. 1988, 263, 15634–15642. [Google Scholar] [CrossRef]
  2. Preston, G.M.; Carroll, T.P.; Guggino, W.B.; Agre, P. Appearance of water channels in Xenopus oocytes expressing red cell CHIP28 protein. Science 1992, 256, 385–387. [Google Scholar] [CrossRef]
  3. Finn, R.N.; Chauvigné, F.; Hlidberg, J.B.; Cutler, C.P.; Cerdà, J. The lineage-specific evolution of aquaporin gene clusters facilitated tetrapod terrestrial adaptation. PLoS ONE 2014, 9, e113686. [Google Scholar] [CrossRef]
  4. Chauvigné, F.; Yilmaz, O.; Ferré, A.; Fjelldal, P.G.; Finn, R.N.; Cerdà, J. The vertebrate Aqp14 water channel is a neuropeptide-regulated polytransporter. Commun. Biol. 2019, 2, 462. [Google Scholar] [CrossRef]
  5. Chauvigné, F.; Boj, M.; Finn, R.N.; Cerda, J. Mitochondrial aquaporin-8-mediated hydrogen peroxide transport is essential for teleost spermatozoon motility. Sci. Rep. 2015, 5, 7789. [Google Scholar] [CrossRef]
  6. MacIver, B.; Cutler, C.P.; Yin, J.; Hill, M.G.; Zeidel, M.L.; Hill, W.G. Expression and functional characterization of four aquaporin water channels from the European eel (Anguilla anguilla). J. Exp. Biol. 2009, 212, 2856–2863. [Google Scholar] [CrossRef]
  7. Engelund, M.B.; Chauvigné, F.; Christensen, B.M.; Finn, R.N.; Cerdà, J.; Madsen, S.S. Differential expression and novel permeability properties of three aquaporin 8 paralogs from seawater-challenged Atlantic salmon smolts. J. Exp. Biol. 2013, 216, 3873–3885. [Google Scholar] [CrossRef]
  8. Saparov, S.M.; Liu, K.; Agre, P.; Pohl, P. Fast and selective ammonia transport by aquaporin-8. J. Biol. Chem. 2007, 282, 5296–5301. [Google Scholar] [CrossRef]
  9. Cerdà, J.; Chauvigné, F.; Finn, R.N. The physiological role and regulation of aquaporins in teleost germ cells. In Aquaporins; Springer: Berlin/Heidelberg, Germany, 2017; pp. 149–171. [Google Scholar] [CrossRef]
  10. Fujiyoshi, Y.; Mitsuoka, K.; De Groot, B.L.; Philippsen, A.; Grubmüller, H.; Agre, P.; Engel, A. Structure and function of water channels. Curr. Opin. Struct. Biol. 2002, 12, 509–515. [Google Scholar] [CrossRef]
  11. Sui, H.; Han, B.-G.; Lee, J.K.; Walian, P.; Jap, B.K. Structural basis of water-specific transport through the AQP1 water channel. Nature 2001, 414, 872–878. [Google Scholar] [CrossRef]
  12. Kitchen, P.; Salman, M.M.; Pickel, S.U.; Jennings, J.; Törnroth-Horsefield, S.; Conner, M.T.; Bill, R.M.; Conner, A.C. Water channel pore size determines exclusion properties but not solute selectivity. Sci. Rep. 2019, 9, 20369. [Google Scholar] [CrossRef]
  13. Hamdi, M.; Sanchez, M.A.; Beene, L.C.; Liu, Q.; Landfear, S.M.; Rosen, B.P.; Liu, Z. Arsenic transport by zebrafish aquaglyceroporins. BMC Mol. Biol. 2009, 10, 104. [Google Scholar] [CrossRef]
  14. Giffard-Mena, I.; Boulo, V.; Aujoulat, F.; Fowden, H.; Castille, R.; Charmantier, G.; Cramb, G. Aquaporin molecular characterization in the sea-bass (Dicentrarchus labrax): The effect of salinity on Aqp1 and Aqp3 expression. Comp. Biochem. Physiol. A Mol. Integr. Physiol. 2007, 148, 430–444. [Google Scholar] [CrossRef]
  15. Fabra, M.; Raldúa, D.; Power, D.M.; Deen, P.M.; Cerda, J. Marine fish egg hydration is aquaporin-mediated. Science 2005, 307, 545. [Google Scholar] [CrossRef]
  16. Shen, Y.; Li, H.; Zhao, J.; Tang, S.; Zhao, Y.; Gu, Y.; Chen, X. Genomic and expression characterization of aquaporin genes from Siniperca chuatsi. Comp. Biochem. Physiol. Part D Genom. Proteom. 2021, 38, 100819. [Google Scholar] [CrossRef]
  17. Lee, S.Y.; Nam, Y.K.; Kim, Y.K. Characterization of aquaporin-1ab (Aqp1ab) mRNA in mud loach (Misgurnus mizolepis) exposed to heavy metal and immunostimulant stimuli. Comp. Biochem. Physiol. A Mol. Integr. Physiol. 2022, 270, 111226. [Google Scholar] [CrossRef]
  18. Ip, Y.K.; Soh, M.M.; Chen, X.L.; Ong, J.L.; Chng, Y.R.; Ching, B.; Wong, W.P.; Lam, S.H.; Chew, S.F. Molecular characterization of branchial aquaporin 1aa and effects of seawater acclimation, emersion or ammonia exposure on its mRNA expression in the gill, gut, kidney and skin of the freshwater climbing perch, Anabas testudineus. PLoS ONE 2013, 8, e61163. [Google Scholar] [CrossRef]
  19. Huang, M.; Zhang, L.-J.; Wu, M.-X.; Peng, G.-F.; Zhang, Y.-L. Aquaporins1 and 3 in the tissues of Paramisgurnus dabryanus and their expression profiles in response to ammonia and drought. Front. Mar. Sci. 2022, 9, 1776. [Google Scholar] [CrossRef]
  20. Zhang, W.; Xu, X.; Li, J.; Shen, Y. Transcriptomic Analysis of the Liver and Brain in Grass Carp (Ctenopharyngodon idella) Under Heat Stress. Mar. Biotechnol. 2022, 34, 856–870. [Google Scholar] [CrossRef]
  21. Parisi, M.G.; Maisano, M.; Cappello, T.; Oliva, S.; Mauceri, A.; Toubiana, M.; Cammarata, M. Responses of marine mussel Mytilus galloprovincialis (Bivalvia: Mytilidae) after infection with the pathogen Vibrio splendidus. Comp. Biochem. Physiol. C Toxicol. Pharmacol. 2019, 221, 1–9. [Google Scholar] [CrossRef]
  22. Geng, K.; Zhang, Z. The geomorphic characteristics and evolution of the lakes in Dalairuoer area of Neimenggu Plateau during the Holocene. J. Beijing Norm. Univ. Nat. Sci. 1988, 4, 94–101. (In Chinese) [Google Scholar]
  23. Wang, S.; Kuang, Y.; Liang, L.; Sun, B.; Zhao, X.; Zhang, L.; Chang, Y. Resequencing and SNP discovery of Amur ide (Leuciscus waleckii) provides insights into local adaptations to extreme environments. Sci. Rep. 2021, 11, 5064. [Google Scholar] [CrossRef] [PubMed]
  24. Chang, Y.; Tang, R.; Sun, X.; Liang, L.; Chen, J.; Huang, J.; Dou, X.; Tao, R. Genetic analysis of population differentiation and adaptation in Leuciscus waleckii. Genetica 2013, 141, 417–429. [Google Scholar] [CrossRef] [PubMed]
  25. Wilkie, M.P.; Wright, P.A.; Iwama, G.K.; Wood, C.M. The physiological adaptations of the Lahontan cutthroat trout (Oncorhynchus clarki henshawi) following transfer from well water to the highly alkaline waters of Pyramid Lake, Nevada (pH 9.4). Physiol. Zool. 1994, 67, 355–380. [Google Scholar] [CrossRef]
  26. He, Q.; Chang, Y.; Su, B.; Sun, B.; Sun, X.; Liang, L. Effects of carbonate alkalinities on oxygen consumption, ammonia excretion and ammonia excretion gene expression in Leuciscus waleckii Dybowski. J. Shanghai Ocean Univ. 2016, 25, 551–558. (In Chinese) [Google Scholar] [CrossRef]
  27. Xu, J.; Li, J.T.; Jiang, Y.; Peng, W.; Yao, Z.; Chen, B.; Jiang, L.; Feng, J.; Ji, P.; Liu, G.; et al. Genomic basis of adaptive evolution: The survival of Amur Ide (Leuciscus waleckii) in an extremely alkaline environment. Mol. Biol. Evol. 2017, 34, 145–159. [Google Scholar] [CrossRef]
  28. Wang, S.; Huang, J.; Liang, L.; Su, B.; Zhang, Y.; LIEW, H.J.; Sun, B.; Zhang, L.; Chang, Y. Distinctive metabolite profiles in migrating Amur ide (Leuciscus waleckii) reveal changes in osmotic pressure, gonadal development, and energy allocation strategies. Front. Environ. Sci. 2022, 10, 997827. [Google Scholar] [CrossRef]
  29. Holm, L.M.; Jahn, T.P.; Møller, A.L.; Schjoerring, J.K.; Ferri, D.; Klaerke, D.A.; Zeuthen, T. NH3 and NH4+ permeability in aquaporin-expressing Xenopus oocytes. Pflügers. Archiv. 2005, 450, 415–428. [Google Scholar] [CrossRef]
  30. Fan, Z.; Peng, F.; Li, J.; Wu, D.; Zhang, Y.; Wang, C.a.; Wang, L.; Xu, Q. Effects of α-ketoglutarate on growth performance, antioxidant capacity and ammonia metabolization against chronic carbonate alkalinity stress in Songpu mirror carp (Cyprinus carpio Songpu). Aquacult. Res. 2020, 51, 2029–2040. [Google Scholar] [CrossRef]
  31. Zhao, L.; Xu, P.; Sun, X. Ammonia Eexcretion Related Genes Expression of Common Carp Under the Stress of Carbonate Alkalinity. Biotechnol. Bull. 2013, 4, 185. (In Chinese) [Google Scholar]
  32. Chang, Y.-M.; Tang, R.; Dou, X.-J.; Tao, R.; Sun, X.-W.; Liang, L.-Q. Transcriptome and expression profiling analysis of Leuciscus waleckii: An exploration of the alkali-adapted mechanisms of a freshwater teleost. Mol. Biosyst. 2014, 10, 491–504. [Google Scholar] [CrossRef] [PubMed]
  33. Su, H.; Ma, D.; Zhu, H.; Liu, Z.; Gao, F. Transcriptomic response to three osmotic stresses in gill of hybrid tilapia (Oreochromis mossambicus female× O. urolepis hornorum male). BMC Genom. 2020, 21, 110. [Google Scholar] [CrossRef] [PubMed]
  34. Yao, Z.; Wang, H.; Chen, L.; Zhou, K.; Ying, C.; Lai, Q. Transcriptomic profiles of Japanese medaka (Oryzias latipes) in response to alkalinity stress. Genet. Mol. Res. 2012, 11, 2200–2246. [Google Scholar] [CrossRef] [PubMed]
  35. Qin, Z.; Ge, Q.; Wang, J.; Li, M.; Liu, P.; Li, J.; Li, J. Comparative Transcriptomic and Proteomic Analysis of Exopalaemon carinicauda in Response to Alkalinity Stress. Front. Mar. Sci. 2021, 8, 1523. [Google Scholar] [CrossRef]
  36. Dong, C.; Chen, L.; Feng, J.; Xu, J.; Mahboob, S.; Al-Ghanim, K.; Li, X.; Xu, P. Genome wide identification, phylogeny, and expression of aquaporin genes in common carp (Cyprinus carpio). PLoS ONE 2016, 11, e0166160. [Google Scholar] [CrossRef]
  37. Xu, J.; Li, Q.; Xu, L.; Wang, S.; Jiang, Y.; Zhao, Z.; Zhang, Y.; Li, J.; Dong, C.; Xu, P.; et al. Gene expression changes leading extreme alkaline tolerance in Amur ide (Leuciscus waleckii) inhabiting soda lake. BMC Genom. 2013, 14, 682. [Google Scholar] [CrossRef]
  38. Yilmaz, O.; Chauvigné, F.; Ferré, A.; Nilsen, F.; Fjelldal, P.G.; Cerdà, J.; Finn, R.N. Unravelling the complex duplication history of deuterostome glycerol transporters. Cells 2020, 9, 1663. [Google Scholar] [CrossRef]
  39. Zeuthen, T.; MacAulay, N. Transport of water against its concentration gradient: Fact or fiction? Wiley Interdiscip. Rev. Membr. Transp. Signal. 2012, 1, 373–381. [Google Scholar] [CrossRef]
  40. Shen, Y.; He, Y.; Bi, Y.; Chen, J.; Zhao, Z.; Li, J.; Chen, X. Transcriptome analysis of gill from Lateolabrax maculatus and aqp3 gene expression. Aquac. Fish. 2019, 4, 247–254. [Google Scholar] [CrossRef]
  41. Boj, M.; Chauvigné, F.; Ribes, E.; Cerdà, J. AQUAPORIN-1aa and-8b are differentially localized in gilthead sea bream (Sparus aurata) spermatozoa and play distinct roles during the activation of sperm motility. In Proceedings of the 10th International Symposium on Reproductive Physiology of Fish, Expanding the Khowledge Base of Reproductive Success: From Genes to the Environment, Olhao, Portugal, 25–30 May 2014. [Google Scholar]
  42. Madsen, S.S.; Olesen, J.H.; Bedal, K.; Engelund, M.B.; Velasco-Santamaría, Y.M.; Tipsmark, C.K. Functional characterization of water transport and cellular localization of three aquaporin paralogs in the salmonid intestine. Front. Physiol. 2011, 2, 56. [Google Scholar] [CrossRef]
  43. Yakata, K.; Hiroaki, Y.; Ishibashi, K.; Sohara, E.; Sasaki, S.; Mitsuoka, K.; Fujiyoshi, Y. Aquaporin-11 containing a divergent NPA motif has normal water channel activity. Biochim. Biophys. Acta 2007, 1768, 688–693. [Google Scholar] [CrossRef] [PubMed]
  44. De Almeida, A.; Martins, A.; Mósca, A.; Wijma, H.; Prista, C.; Soveral, G.; Casini, A. Exploring the gating mechanisms of aquaporin-3: New clues for the design of inhibitors? Mol. BioSyst. 2016, 12, 1564–1573. [Google Scholar] [CrossRef] [PubMed]
  45. Smolin, N.; Li, B.; Beck, D.A.; Daggett, V. Side-chain dynamics are critical for water permeation through aquaporin-1. Biophys. J. 2008, 95, 1089–1098. [Google Scholar] [CrossRef] [PubMed]
  46. Foster, W.; Helm, A.; Turnbull, I.; Gulati, H.; Yang, B.; Verkman, A.S.; Skach, W.R. Identification of sequence determinants that direct different intracellular folding pathways for aquaporin-1 and aquaporin-4. J. Biol. Chem. 2000, 275, 34157–34165. [Google Scholar] [CrossRef]
  47. Lu, Y.; Turnbull, I.R.; Bragin, A.; Carveth, K.; Verkman, A.; Skach, W.R. Reorientation of aquaporin-1 topology during maturation in the endoplasmic reticulum. Mol. Biol. Cell 2000, 11, 2973–2985. [Google Scholar] [CrossRef]
  48. Buck, T.M.; Skach, W.R. Differential stability of biogenesis intermediates reveals a common pathway for aquaporin-1 topological maturation. J. Biol. Chem. 2005, 280, 261–269. [Google Scholar] [CrossRef]
  49. Daniel, C.J.; Conti, B.; Johnson, A.E.; Skach, W.R. Control of Translocation through the Sec61 Translocon by Nascent Polypeptide Structure within the Ribosome*♦. J. Biol. Chem. 2008, 283, 20864–20873. [Google Scholar] [CrossRef]
  50. Conner, A.C.; Bill, R.M.; Conner, M.T. An emerging consensus on aquaporin translocation as a regulatory mechanism. Mol. Membr. Biol. 2013, 30, 101–112. [Google Scholar] [CrossRef]
  51. Garcia, N.; Gondran, C.; Menon, G.; Mur, L.; Oberto, G.; Guerif, Y.; Dal Farra, C.; Domloge, N. Impact of AQP3 inducer treatment on cultured human keratinocytes, ex vivo human skin and volunteers. Int. J. Cosmet. Sci. 2011, 33, 432–442. [Google Scholar] [CrossRef]
Figure 1. Amino acid sequence alignment of the Aqps of Leuciscus waleckii (L. waleckii). The residue similarity was divided into four levels (purple: 100%; green: 80–100%; yellow: 60–80%). The two NPA motifs and Ar/R selectivity filter (H2, H5, LE1, and LE2) are highlighted in red and purple, respectively. The NPA motifs of LwAqp3a is highlighted in orange and the Ar/R selectivity filter in blue.
Fishes 08 00107 g001
Figure 2. Phylogenetic analysis of the aquaporin genes of six species. The amino acid sequences were aligned using MUSCLE. It is a maximum likelihood tree (1000 replicates) based on the WAG+G+F model. Different colors represent different aquaporin grades. The Aqps of Amur ide are highlighted with a green diamond, and the Aqps of zebrafish are highlighted with a purple square. The number on the node is the bootstrap value and the lower the value, the lower the credibility of the branch. Note: Hs: human; Mu: mouse; Xt: African clawed frog; Dr: zebrafish; Cc: common carp; Lw: Amur ide.
Fishes 08 00107 g002
Figure 3. Analysis of phylogenetic relationships (a), gene structure (b), motifs (c) of the Aqp gene family in L. waleckii. (a) The maximum likelihood method was used to build the phylogenetic tree after the amino acid sequences were aligned using ClustalW. (b) Red wedge represents exons and black lines represent introns. (c) Different colors represent different motifs.
Fishes 08 00107 g003
Figure 4. The expression profile of the Aqp genes of DL and WSL L. waleckii. The Dali Lake is an alkaline water environment, represented by DL, and the Wusuli River is a freshwater environment, represented by WSL. Red denotes a higher expression whereas green denotes a lower expression; the darker the color, the larger the differential expression fold.
Fishes 08 00107 g004
Figure 5. Analysis of the Aqp gene expression profile in DL L. waleckii. ALK: alkaline water (50 mmol·L−1, made by sodium bicarbonate), FW: fresh water. (a). Expression pattern of the Aqp gene in different tissues of DL L. waleckii under the condition of 50 mmol/L carbonate alkalinity stress for 7 days (b). Expression pattern of the Aqp gene in the gill of DL L. waleckii during continuous experiment of transferring fish from alkaline water to fresh water. Control: FC, which is the DL L. waleckii temporarily raised in fresh water for 30 days. The setting of the group is 1, 5, and 10 days (ALK-1d, ALK-5d, and ALK-10d, respectively) in alkaline water and 1, 5, and 10 days (FW-1d, FW-3d, and FW-10d, respectively) in fresh water (after alkaline water stress).
Fishes 08 00107 g005
Figure 6. Distribution of the SNPs of Aqp genes in different regions of the gene. Note: UTR: untranslated region; CDS: coding region.
Fishes 08 00107 g006
Figure 7. Distribution of the Fst values of SNPs in the CDS region of Aqp genes. The dots with different colors represent the Fst values of the different genes. The threshold value of the top 5% of Fst values is represented by a dashed line. The range of Fst values is 0–1. The greater the Fst value, the lager the differentiation between two populations.
Fishes 08 00107 g007
Figure 8. Amino acid mutation of SNPs with top 5% Fst values. Ala: alanine; Ser: serine; Asp: aspartic acid; Glu: glutamic acid; Leu: leucine; Tyr: tyrosine. UTR is represented by a blue wedge, CDS is represented by a yellow wedge, and introns are represented by black lines. The yellow area represents the amino acid sequence and the number next to it corresponds to the position in the amino acid sequence. The NPA is highlighted with a red box.
Fishes 08 00107 g008
Figure 9. Comparison of the 66th amino acid of aqp3 in multiple species. With the exception of L. waleckii-ALK, all fish are freshwater species. Note: P. promelas: Pimephales promelas; S. anshuiensis: Sinocyclocheilus anshuiensis; M. amblycephala: blunt snout bream; S. rhinocerous: Sinocyclocheilus rhinocerous; C. auratus: crucian carp; L. waleckii: Amur ide; A: alanine; G: glycine; S: serine.
Fishes 08 00107 g009
Figure 10. Prediction of the three-dimensional structure of Aqp3a of DL (a) and WSL (b) L. waleckii.
Fishes 08 00107 g010
Figure 11. The effect of alkaline water on aqp7, -8aa, and -9a expression. The data are presented as the mean ± SD of three replicates. The three dots represent three replicates. “*”and “**” above the bar demonstrate a significant relationship between the treatment and the control groups. “*” and “**” above line demonstrate a significance relationship between the treatments at both ends of the line. * p < 0.05, ** p < 0.01.
Fishes 08 00107 g011
Table 1. Primers used in this study.
Primer NameSequence (5′–3′)
aqp7-FTGTTGCTGTGTCTGATGGCT
aqp7-RCATTGCCTGCCCTGAAAACC
aqp8aa-FGACTCACCGTGACTGCAAATA
aqp8aa-RAAGGCTGACAGTGACCAAAG
aqp9a-FGGAATGCTGGTTCTCTGTATTCTG
aqp9a-RAGGGATCCACCACCAGTAATC
Table 2. Specific information of the Aqp genes in L. waleckii.
Gene NameChromosome LocalizationGene Length/bpCDS Sequence Length/bpAmino Acid Number/aa
aqp0aChr191225792264
aqp0bChr192297711237
aqp1aaChr74353783261
aqp1abChr76001810270
aqp3aChr44958891296
aqp3ap1Chr71546732244
aqp3ap2Chr1783727242
aqp3bChr145929900299
aqp4bChr1614,964996331
aqp7Chr145896930309
aqp8aaChr184088781260
aqp8abChr182832781259
aqp9aChr245851886294
aqp9bChr311,935873290
aqp10aaChr153468903301
aqp10bbChr116481933310
aqp11bChr82681828276
aqp12Chr52739834277
aqp14Chr198051897299
aqp15Chr15951735245
Disclaimer/Publisher’s Note: The statements, opinions and data contained in all publications are solely those of the individual author(s) and contributor(s) and not of MDPI and/or the editor(s). MDPI and/or the editor(s) disclaim responsibility for any injury to people or property resulting from any ideas, methods, instructions or products referred to in the content.

