Article

Genomic Analysis of the Proteasome Subunit Gene Family and Their Response to High Density and Saline-Alkali Stresses in Grass Carp

1
Key Laboratory of Freshwater Aquatic Biotechnology and Breeding, Ministry of Agriculture and Rural Affairs, Heilongjiang River Fisheries Research Institute of Chinese Academy of Fishery Sciences, Harbin 150070, China
2
Key Laboratory of Molecular Cytogenetics and Genetic Breeding of Heilongjiang Province, College of Life Science and Technology, Harbin Normal University, Harbin 150025, China
*
Author to whom correspondence should be addressed.
Fishes 2022, 7(6), 350; https://doi.org/10.3390/fishes7060350
Submission received: 25 October 2022 / Revised: 23 November 2022 / Accepted: 24 November 2022 / Published: 26 November 2022
(This article belongs to the Special Issue The Applications of Genome Editing and Genomics in Aquaculture)

Abstract

:
The proteasome is a highly conserved polycatalytic enzyme that is required for cellular processes and is widely present in the nucleus and cytoplasm of archaea, as well as all eukaryotes. A total of 22 members of the proteasome subunit (CiPS) gene family were identified and characterized by scanning the grass carp (Ctenopharyngodon idella) genome. These genes were classified into two subfamilies, CiPSA and CiPSB, based on phylogenetic analysis, which was consistent with the results from other species. We examined the response of this gene family to high density and saline-alkali stresses in aquaculture using publicly available transcriptome data resources. In grass carp, CiPS member transcripts were detected in all tested tissues, with the highest expression level in the head kidney and the lowest in the liver. According to transcriptome-based expression analysis, CiPS genes play a role in response to environmental stresses in grass carp, mainly in the form of negative regulation. Interestingly, a cluster of members belonging to the CiPSB subfamily on a 15 kb region on chromosome segment CI01000319, including CiPSB8, 9, 9b, and 10, showed marked responses to high density and saline-alkali stress. It appears that CiPS genes confer stress tolerance through the regulation of common genes, as well as specific genes. In summary, our genome-wide characterization, evolutionary, and transcriptomic analysis of CiPS genes in grass carp provides valuable information for characterizing the molecular functions of these genes and utilizing them to improve stress tolerance in aquaculture.

1. Introduction

Grass carp (Ctenopharyngodon idella) are a cyprinid fish native to China and are the only species in the genus Ctenopharyngodon. It is distributed from the Pearl River Basin in southern China to the Heilongjiang Basin in northern China, and is the most farmed fish in China, with an annual production of 5.7 million tons [1]. The cultivation mode of grass carp is very diverse and mainly includes two modes: grazing farming and intensive aquaculture, in which intensive aquaculture can significantly improve the stocking density. In addition, with the increasing demand for grass carp products, the stocking density and saline-alkali conditions of water bodies have gradually expanded [2]. At present, high stocking density and high saline-alkali have become the most critical environmental stresses in grass carp cultivation. In the grass carp industry, these environmental stresses could lead to reduced yield and declining germplasm quality [3]. Further studies on the molecular mechanisms of stress resistance and the development of stress resistance gene resources may provide new ideas and a basis for the genetic engineering and molecular improvement of stress resistance in grass carp.
The stress response itself (i.e., the physiological response caused by the stressor) is a complex series of biochemical, physiological, and behavioral adjustments to adapt to environmental changes, thereby maintaining internal homeostasis and survival under certain conditions [4]. Depending on the level, duration, and number of stressors, stress responses can also have long-term negative consequences. Some stress responses are mediated by changes in the levels of stress hormones (catecholamines and glucocorticoids, especially cortisol), while others are directly mediated by the stressor itself, such as temperature-induced molecular changes in heat shock proteins (HSP) or stress-induced epigenetic changes [5]. Similar or identical stress resistance genes and molecular mechanisms have been identified under different stress conditions, indicating that some stress tolerance processes express similar gene clusters [6]. Therefore, it is of practical interest to explore the correlation between gene families that maintain important cellular functions and diverse environmental stresses in aquaculture.
The 26S proteasome, commonly referred to as the “proteasome” is a multicatalytic enzyme complex expressed in the nucleus and cytoplasm of archaea and all eukaryotic cells [7]. Because of its fundamental role in the cell, the proteasome complex has been highly conserved during evolution, consisting of a central catalytic machine (20S proteasome) and two terminal regulatory subcomplexes 19S (PA700) or PA28. The proteasome consists of four stacked heptamer loops consisting of genetically and structurally similar two A-type and two B-type subunits with the pattern α7β7β7α7 [8]. The proteasome was originally thought to be a recycler of damaged or misfolded proteins, but in the last decade, the function of this enzyme has been discovered to be critical for the cell cycle, cell survival, and cellular homeostasis [9]. In addition to maintaining protein balance in the organism, the proteasome also plays a key role in regulating many physiological processes, including nuclear factor kb (NF-kB) activation, neuronal function, and endoplasmic reticulum (ER)—associated protein degradation [10]. Both type A and type B members of the grass carp proteasome subunit (PS) gene family have been found to be involved in some important physiological functions [11], but this gene family member has not been systematically studied at the genomic level. It is feasible to identify and study the PS gene family at the genome scale, which has theoretical and practical significance.
In the present study, we performed phylogenetic analysis, chromosomal localization, gene replication analysis, and expression profiling of the PS gene family in grass carp, as well as investigated the role of these genes in response to environmental stresses by transcriptome analysis. The results will help further study the functional characteristics of this gene family and their application in the genetic improvement of grass carp.

2. Materials and Methods

2.1. Identification and Classification of the PS Genes in Grass Carp

Grass carp genome information, as well as the annotation information, including grass carp genomic DNA, CDS, protein, gene structure, and function annotation information were downloaded from a grass carp genome website (http://www.ncgr.ac.cn/grasscarp/, or http://bioinfo.ihb.ac.cn/gcgd/php/index.php, accessed on 4 October 2022) [12]. All the PS members of human and zebrafish were downloaded from NCBI (https://www.ncbi.nlm.nih.gov/, accessed on 12 October 2022), as shown in Supplementary Material S1. Proteasome domain information (PF00227) was downloaded from the Pfam database (pfam.sanger.ac.uk, accessed on 12th October 2022) [13]. Using the PS gene protein sequences of human and zebrafish as query information, the protein sequences derived from the genome annotation were retrieved by BLASTP (version 2.9.0+) software with the parameters of expected values ≤1 × 10⁻⁵ and more than 80% coverage of subjects [14]. Then, HMMER (version 3.3) software was used to search for the domain information in the target sequence (PF00227, value: 0.01) [15], which was downloaded from the Pfam website. The genes containing the proteasome domain were identified as the candidate PS genes. The annotation information for all candidate PS genes was obtained from the grass carp genome website, and the number and distribution of exons of the PS gene family members were deduced using information from the same website. Finally, the PS genes of grass carp were classified and named according to the PS genes information of human and zebrafish.

2.2. Phylogenetic and Conserved Motif Analysis of the PS Gene Family

Candidate PS protein sequences were multiply aligned using ClustalW (version 2.1) with default parameters [16]. An unrooted phylogenetic tree for all PS proteins was generated with MEGA (Version 11) [17], using the neighbor joining (NJ) method with the following parameters: Poisson correction, pair-wise deletion, and 1000 bootstrap analysis for statistical reliability. The motif finding tool MEME (Multiple EM for motif Elicitation, Version 4.8.1) was used to identify conserved motifs in grass carp PS genes [18]. The following parameters were used to conduct an MEME search for grass carp PS protein sequences: (1) the optimum motif width was set to ≥10 and ≤50; (2) the maximum number of motifs was set to identify 10 motifs; (3) occurrences of a single motif distributed among the sequences with model: 0 or 1 per sequence (-modzoops).

2.3. Chromosomal Localization and Gene Duplication Analysis of the PS Gene Family

The positional information of all members of the PS gene family were studied and their chromosomal locations in grass carp were drawn using CIRCOS (version 0.69-8) software (http://circos.ca/, 15 October 2022) [19], revealing replication between PS genes in grass carp. Two genes with greater than 85% similarity were identified as tandem repeats, and if they were separated by four or fewer loci, others were identified as fragment repeats (separated by more than five genes). Duplicate genes between different chromosomes or loci are connected with colored lines in the figure, using CIRCOS as described above.

2.4. Gene Regulatory Network Analysis of PS Genes in Grass Carp

The gene regulatory network (GRN) information of zebrafish was downloaded from the STRING database (version 11.5) [20], and the similarity of grass carp genes was identified by BLAST comparison [14]. GRN of grass carp was constructed according to the similarity against zebrafish. All proteins were BLAST-searched against zebrafish proteins, with an e-value cut-off of 1e-05, and hits with highest scores were identified as homologous genes for the grass fish genes. Then, the GRN data of zebrafish were used to reconstruct the GRN of grass carp according to the homology of grass carp and zebrafish. WGCNA method was employed to reconstruct another GRN based on gene expression levels of the saline-alkali stress dataset, which are well described in the next section. The two GRNs were compared, and hypergeometric distribution analysis was performed using “phyper” function in R platform (version 4.2.1). Sub-networks containing grass fish PS genes were retrieved and analyzed; the results were viewed using Cytoscape software (version 3.9.1) [21], and the genes of these sub-networks were annotated using gene ontology information based on grass fish genome annotation information [22]. The sub-networks were subjected to gene ontology (GO) enrichment analysis using topGO (version 2.50.0) [23], the threshold level was set as 0.05, and the top 10 of the most significant terms were displayed and the high enrichment terms were assigned as GRN functions, as described in the software’s protocol.

2.5. Transcriptomic Analysis of the Response of PS Genes to Environmental Stresses

Three sets of transcriptome data were analyzed to investigate the expression patterns of PS gene members from the grass carp genome (CiPS) and their response to diverse environmental stresses. The transcriptome data of six tissues of grass carps were downloaded from the grass carp genome website, which were TPM values without replicates for each tissue. These expressional data were transformed using the “log2” function and centered using the “scale” function of the R program (version 4.2.1); then, all expression data were clustered and plotted using the “heatmap.2” function of the ggplots package (version 3.1.3). Similarly, the saline-alkali stress dataset was obtained from an experiment at the Institute of Hydrobiology, Chinese Academy of Sciences, and downloaded from the GEO database of NCBI (Accession numbers: GSE185170), and the gene expression values were FPKM, which were analyzed with a similar procedure. It should be noted that there were three biological replicates for each treatment, and differentially expressed genes (DEGs) were identified using the limma package (version 3.54.0) in R platform (version 4.2.1) [24], the results of CiPS genes were listed in Supplements Materials. Lastly, the transcriptome data for the high density stress test were obtained from an experiment at Shanghai Ocean University [25] and downloaded from the SRA database of NCBI (Accession number: PRJNA587607); there were no replicates for each treatment or tissue. All reads of this RNA-seq were mapped to the transcript sequences of grass carp genomes using the Salmon software (version 0.12.0), and the expression level of each gene (FPKM value) was calculated by Salmon’s subroutine quant [26], and then analyzed and clustered using the R program (version 4.2.1) as described above [27]. The CiPS gene expression data were extracted from the above data, and they were listed in Supplements Materials.

3. Results

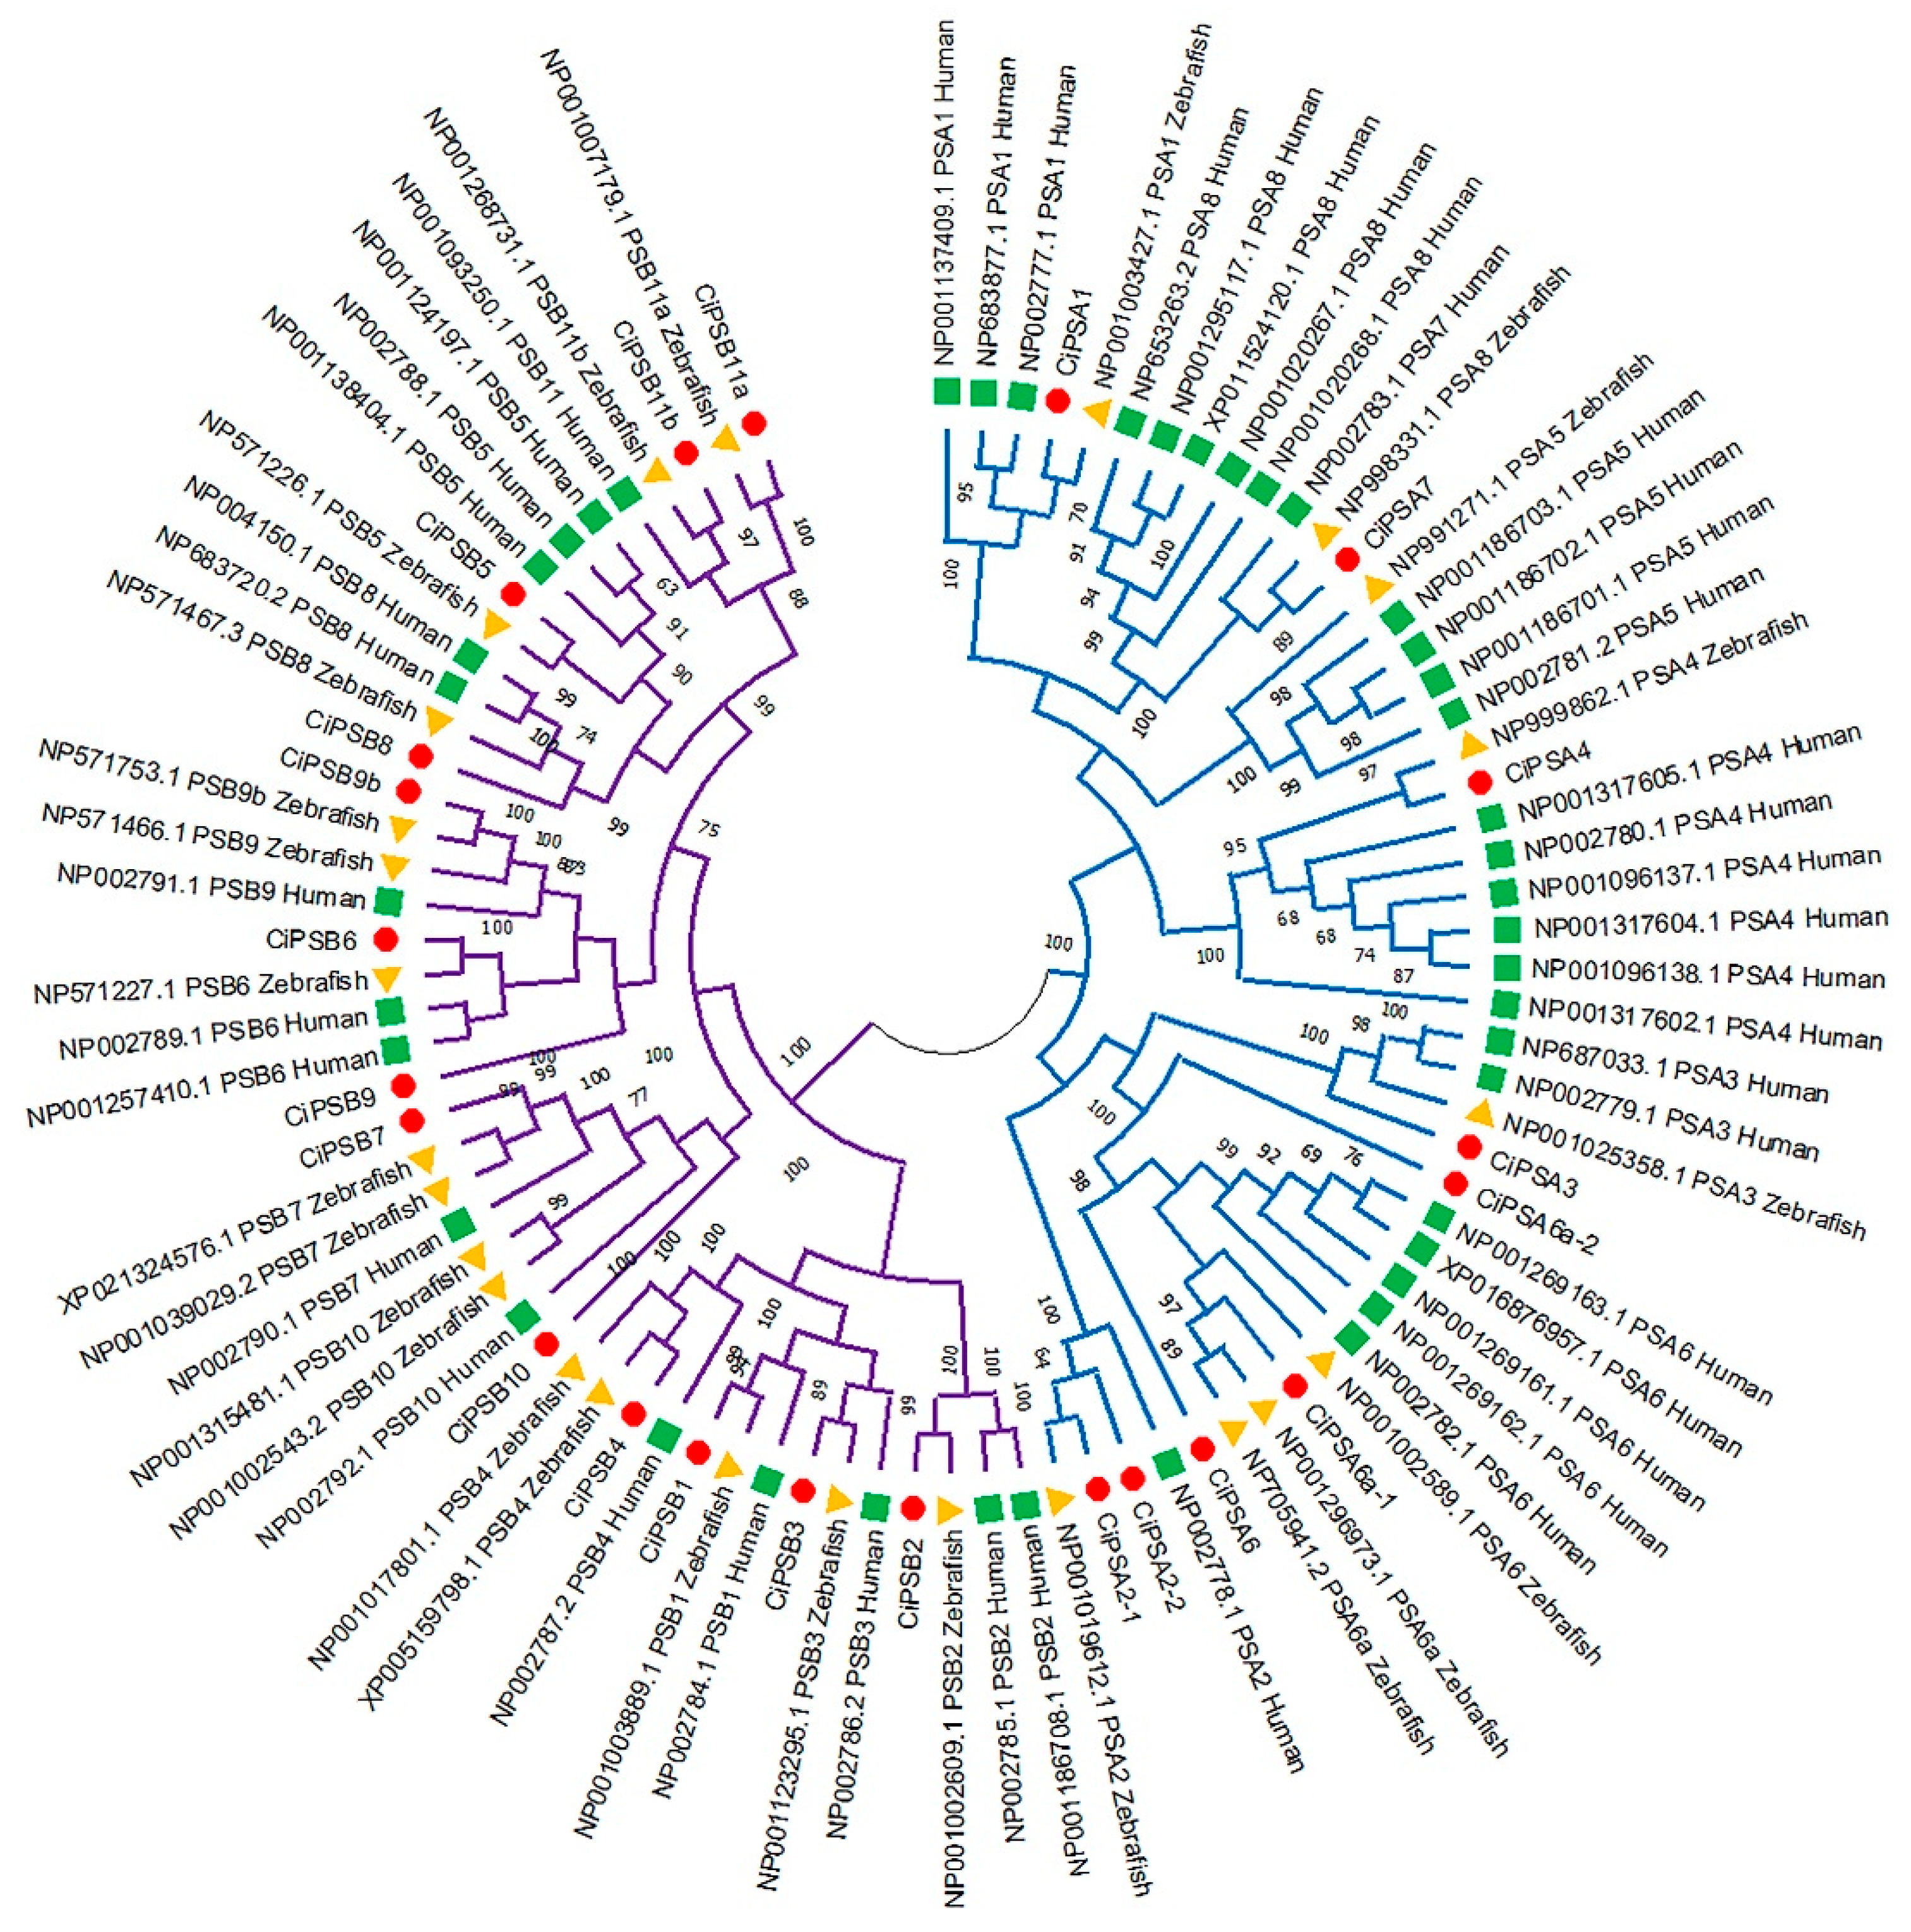
3.1. Identification and Phylogenetic Analysis of the PS Genes in Grass Carp

Through a similarity comparison and a domain search, we identified 22 CiPS gene members with deduced putative peptides ranging in length from 138 to 1218 amino acids and an exon number from 1 to 30 (Table 1). Among them, CiPSA3 had the longest length of 1218 aa, and consisted of thirty exons, while CiPSB11a had the simplest gene structure with only one exon. From the perspective of sequence similarity, the CiPS gene family members could be roughly divided into two categories, but the detailed information needed to be integrated with phylogenetic analysis results. Phylogenetic analysis of PS genes in human, zebrafish, and grass carp revealed that these genes were clearly clustered into two branches, named subfamily A and subfamily B, corresponding to the results obtained through structural similarity, respectively; as shown in Figure 1, which also confirmed the differences between the subfamilies. At the same time, the molecular phylogenetic tree showed that the distribution of PS genes in grass carp and zebrafish was highly consistent.

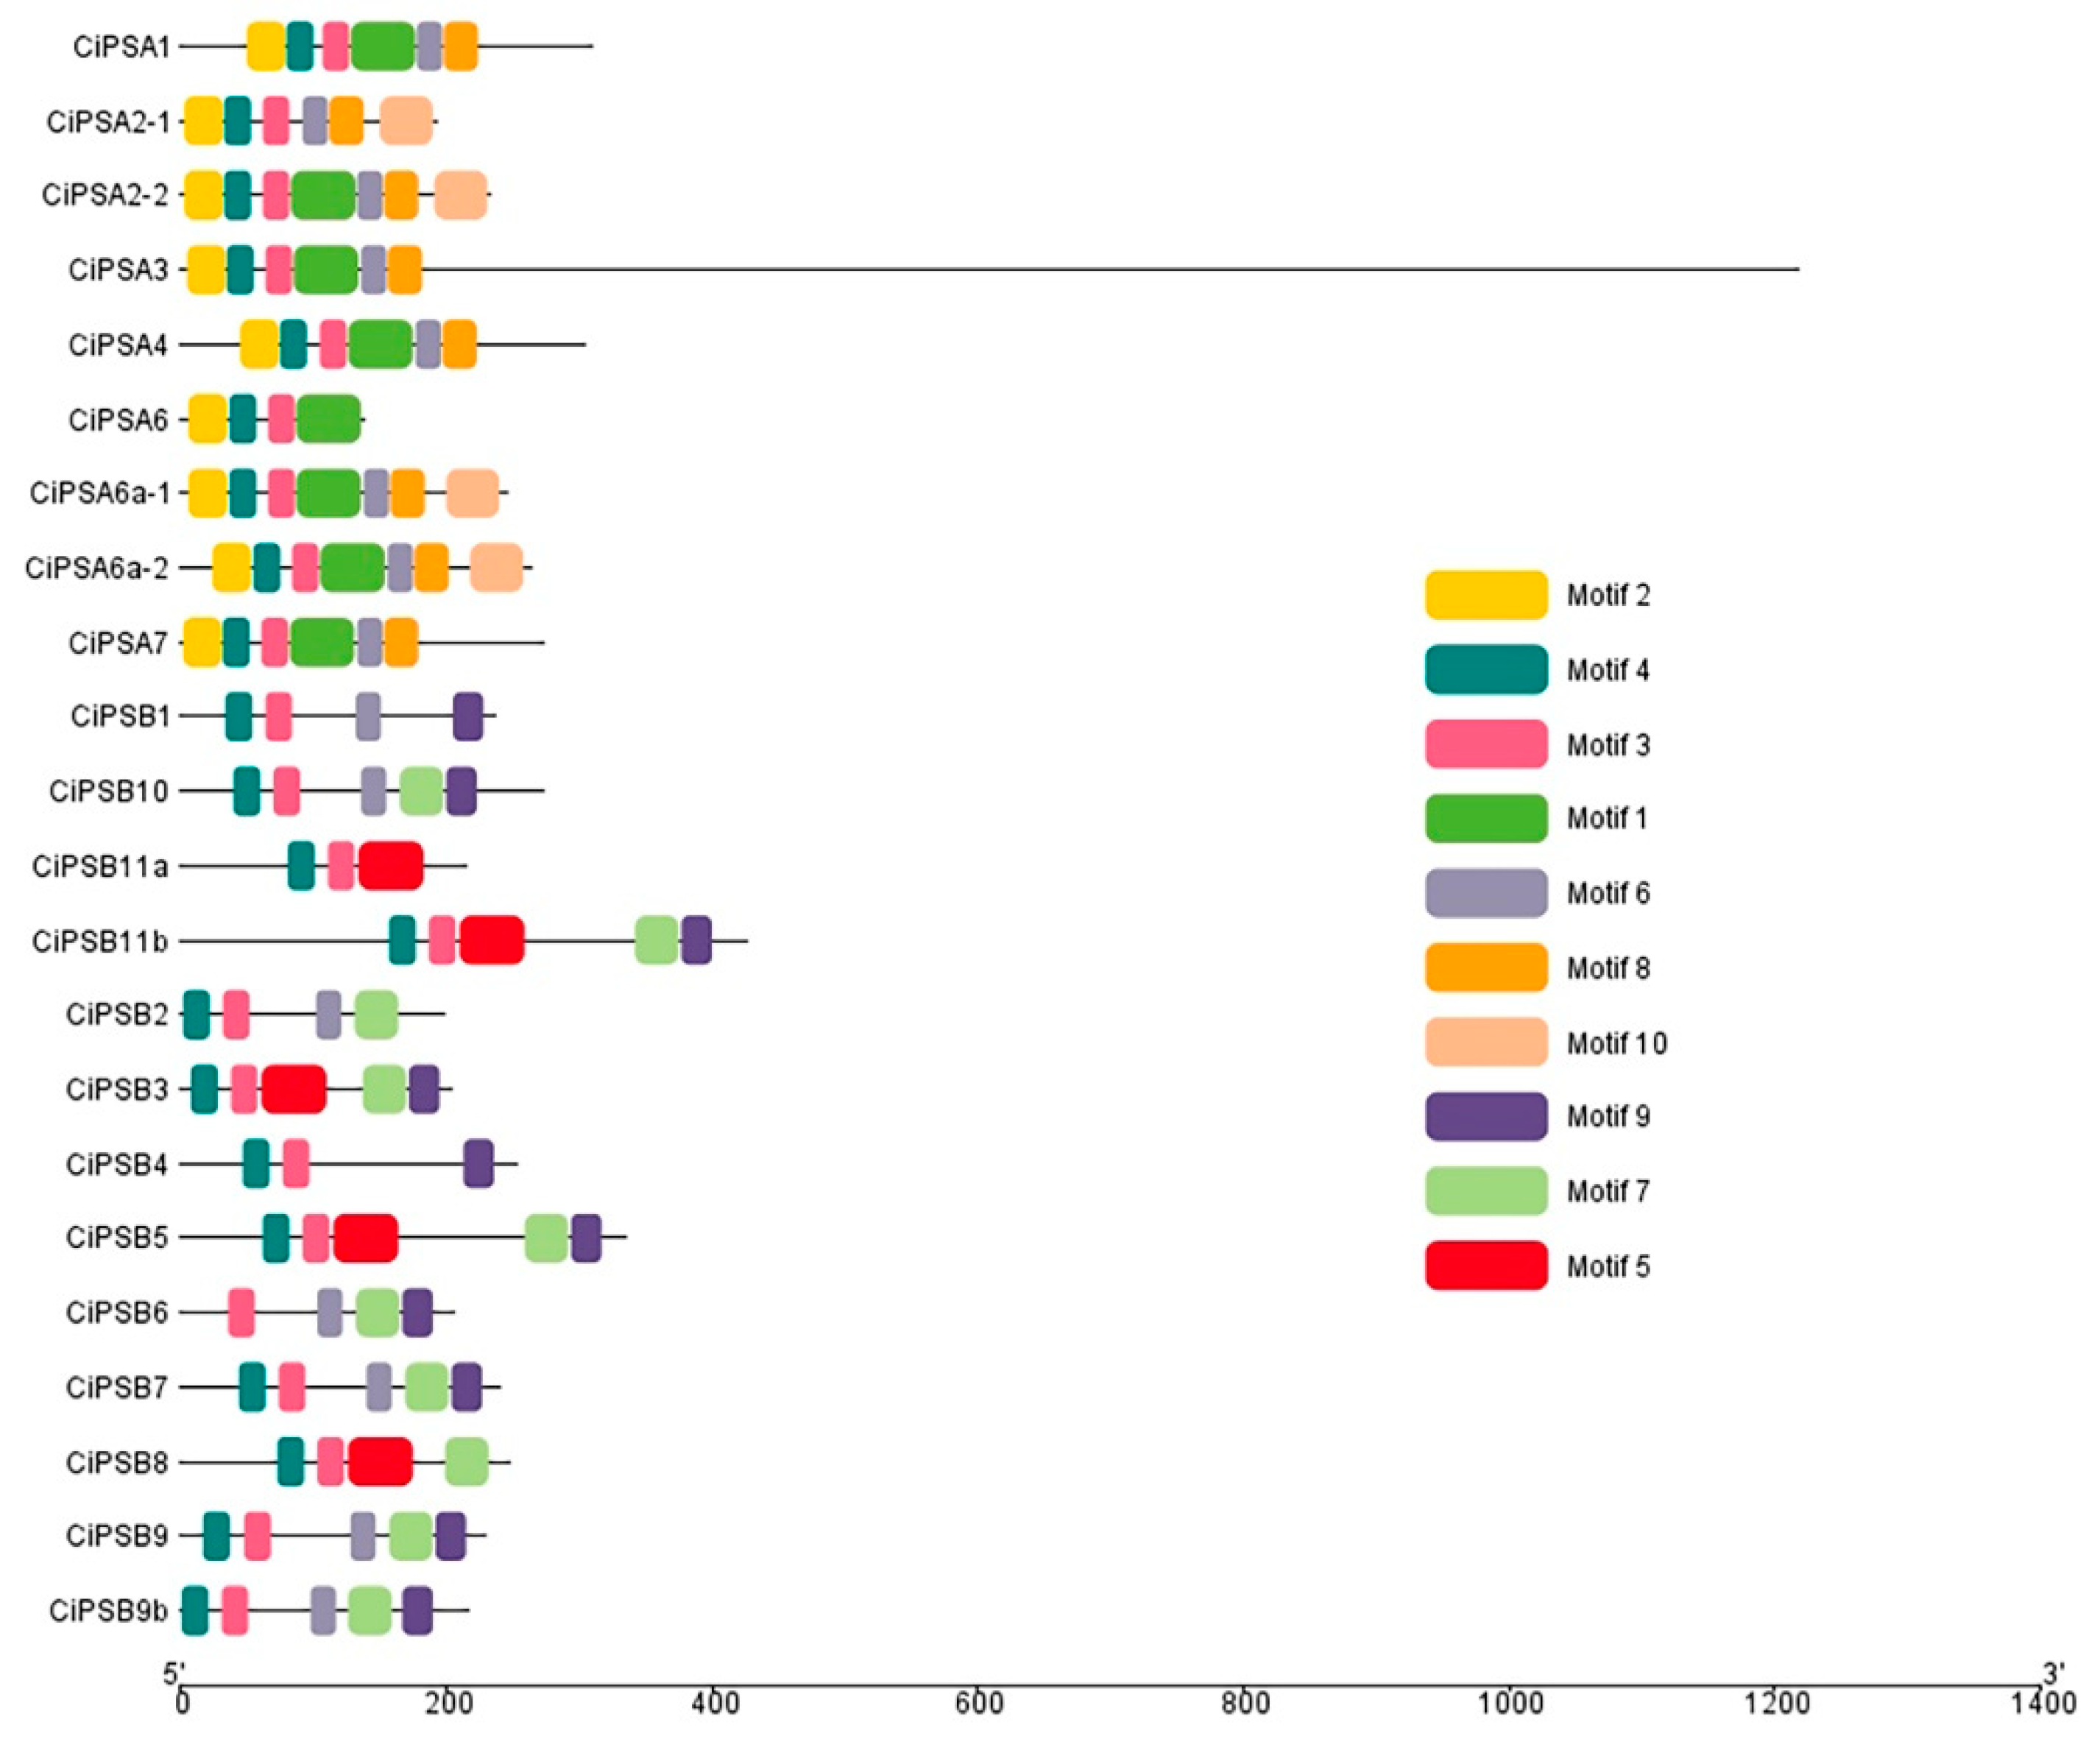
3.2. Conserved Motif Analysis of the PS Genes

To investigate the molecular structure and function of the CiPS gene family, we analyzed the conserved motifs of the CiPS gene family members and found that there were distinct differences between subfamily A and B, as shown in Figure 2. The results of motif analysis also supported the results of sequence similarity and phylogenetic tree analysis, demonstrating clear structural motif differences between the two subfamilies. Conserved motifs 1, 2, 6, 8, and 10 were detected only in subfamily A; meanwhile, motifs 5, 7, and 9 were found only in subfamily B. Interestingly, motif 3 was detected in all members of the CiPS gene family.

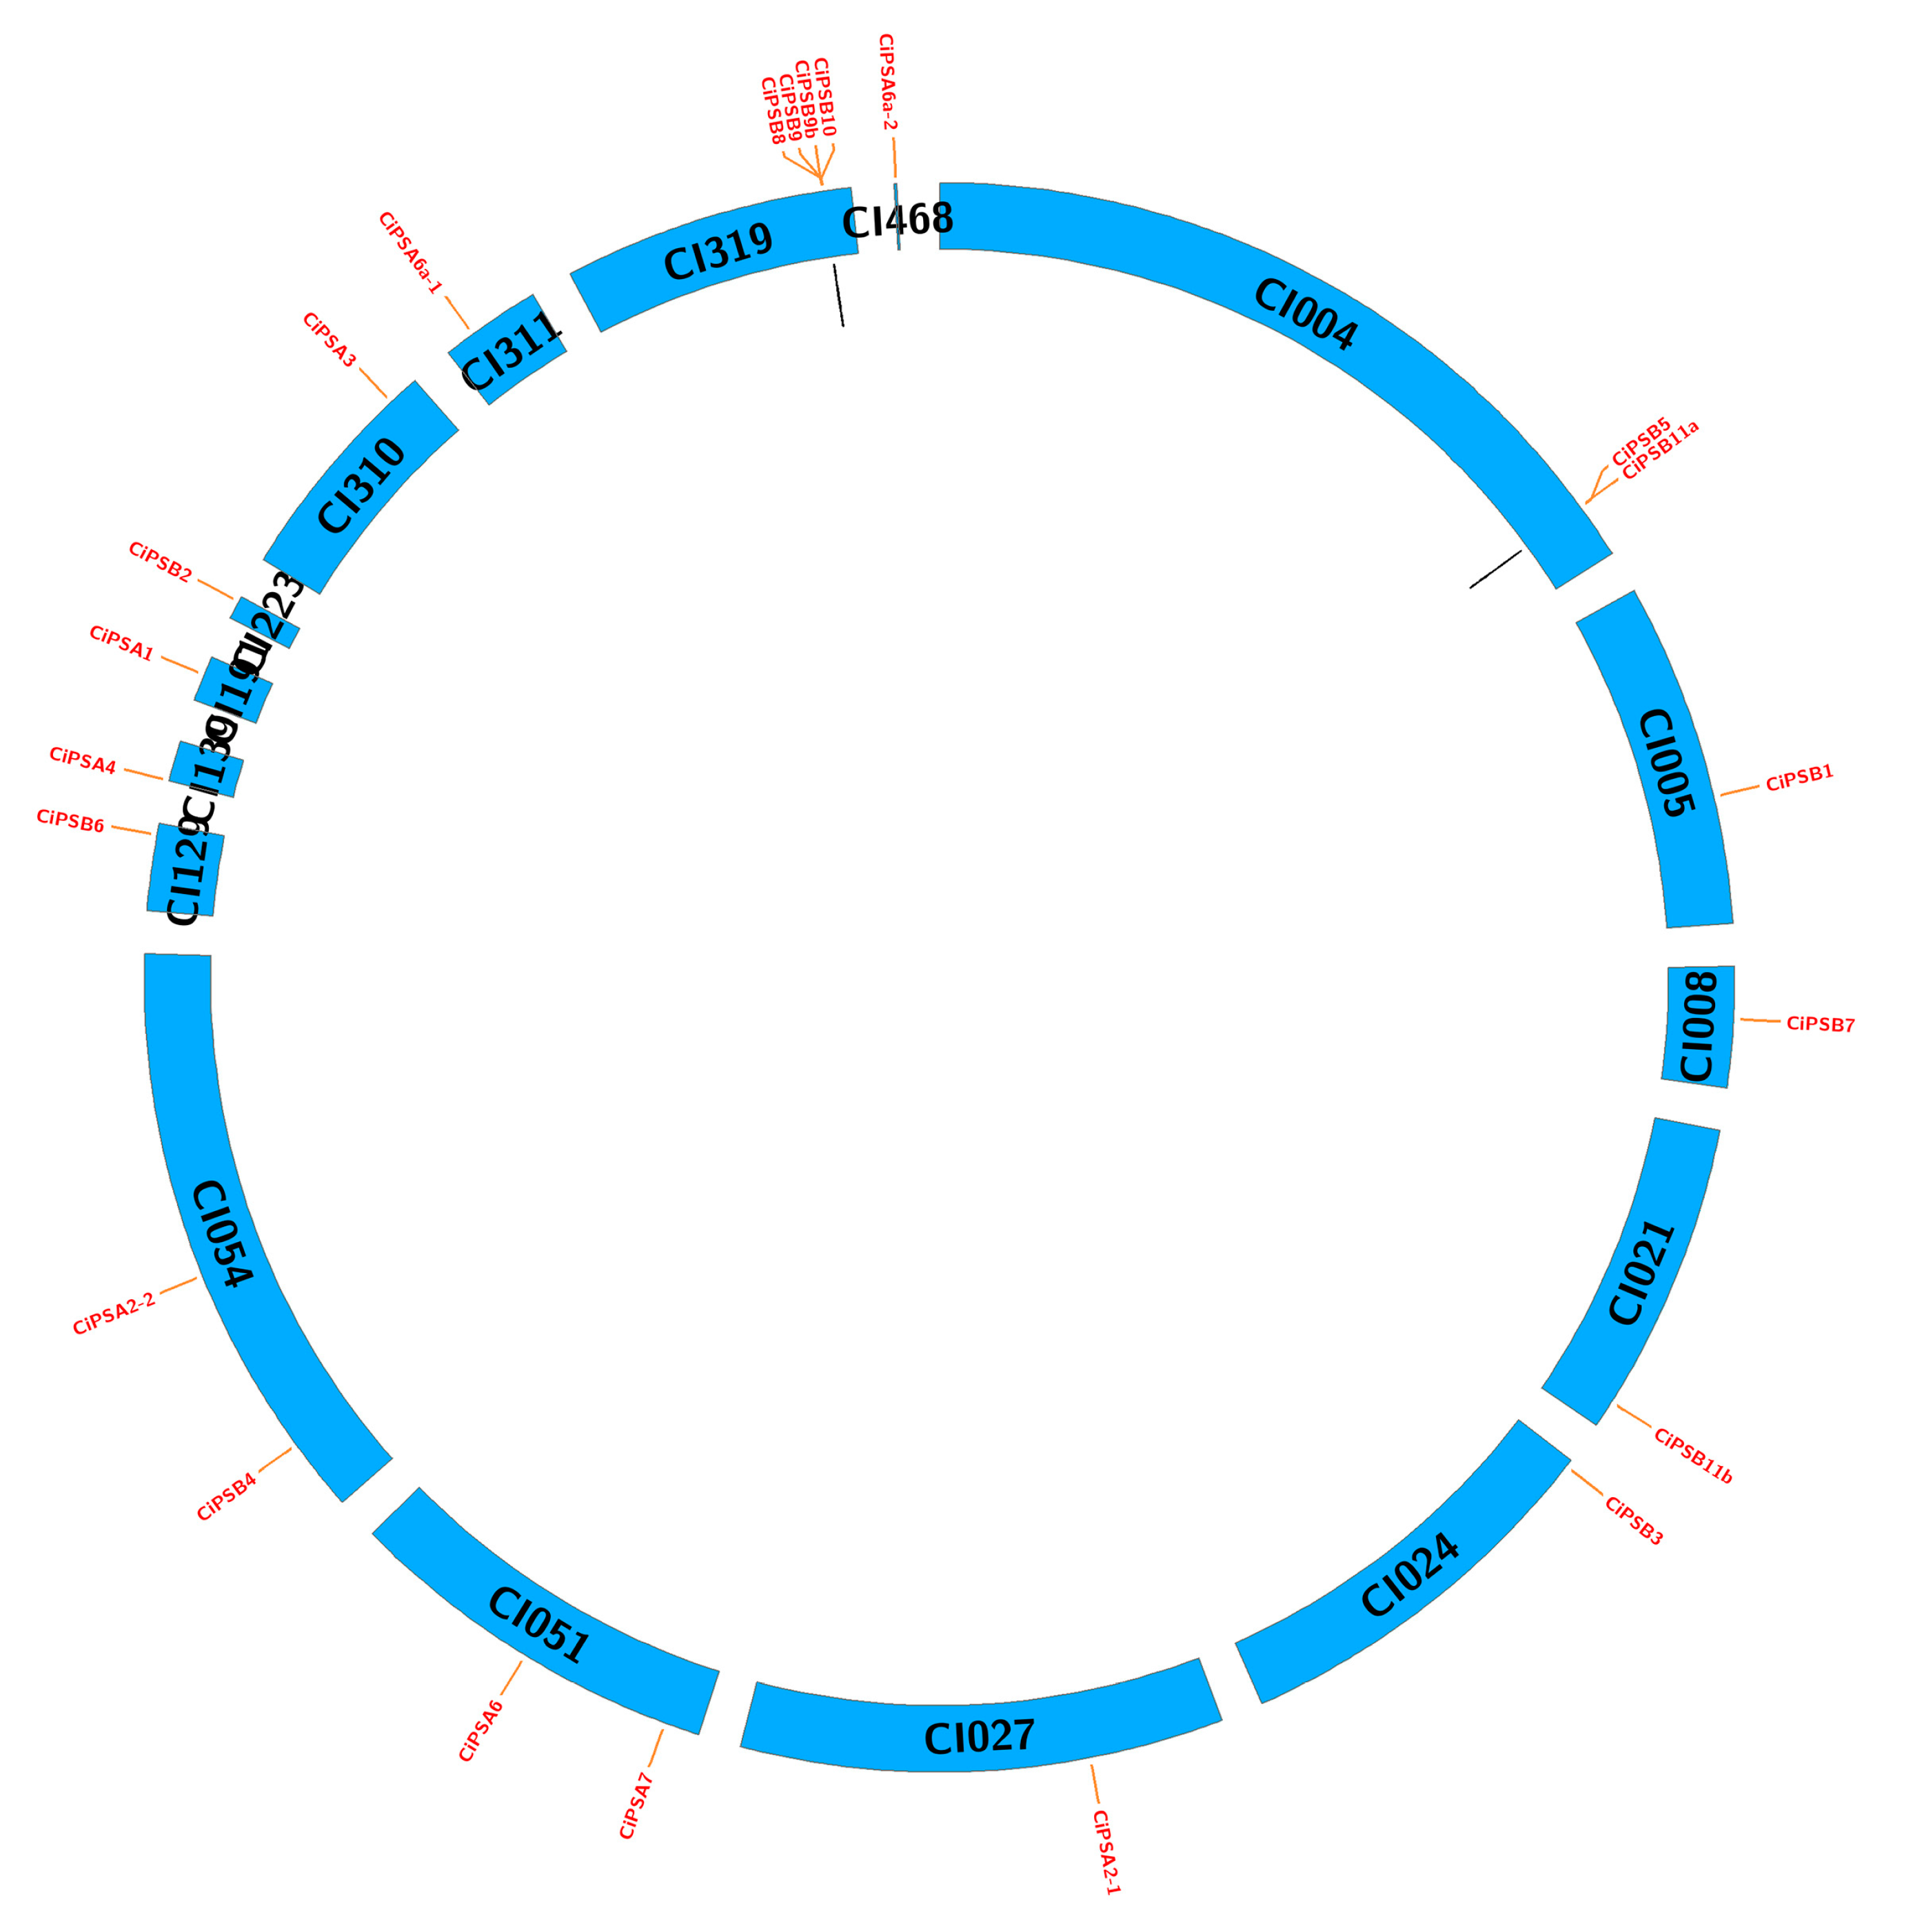
3.3. Chromosomal Localization and Gene Duplication Analysis of the PS Genes

The 22 CiPB genes were distributed throughout the 16 chromosome segments. Three PS gene amplification events were detected; their physical locations on the chromosome segments are shown in Figure 3. Tandem duplications produced a gene cluster “hotspot region” found on chromosome segment CI01000319, on which four PS genes, CiPSB9, CiPSB9b, CiPSB10, and CiPSB8, were clustered in an 15 kb region, among which CiPSB9, CiPSB, and CiPSB10 had two tandem replication events. In addition, there was another tandem repeat event between CiPSB5 and CiPSB11a in the CI01000004 fragment. However, there may have also been a gene fragment loss event, resulting in CiPSB11a becoming very short, with only one exon, encoding a PS gene of 215aa in length, resulting in a very large phylogenetic difference between the two genes.

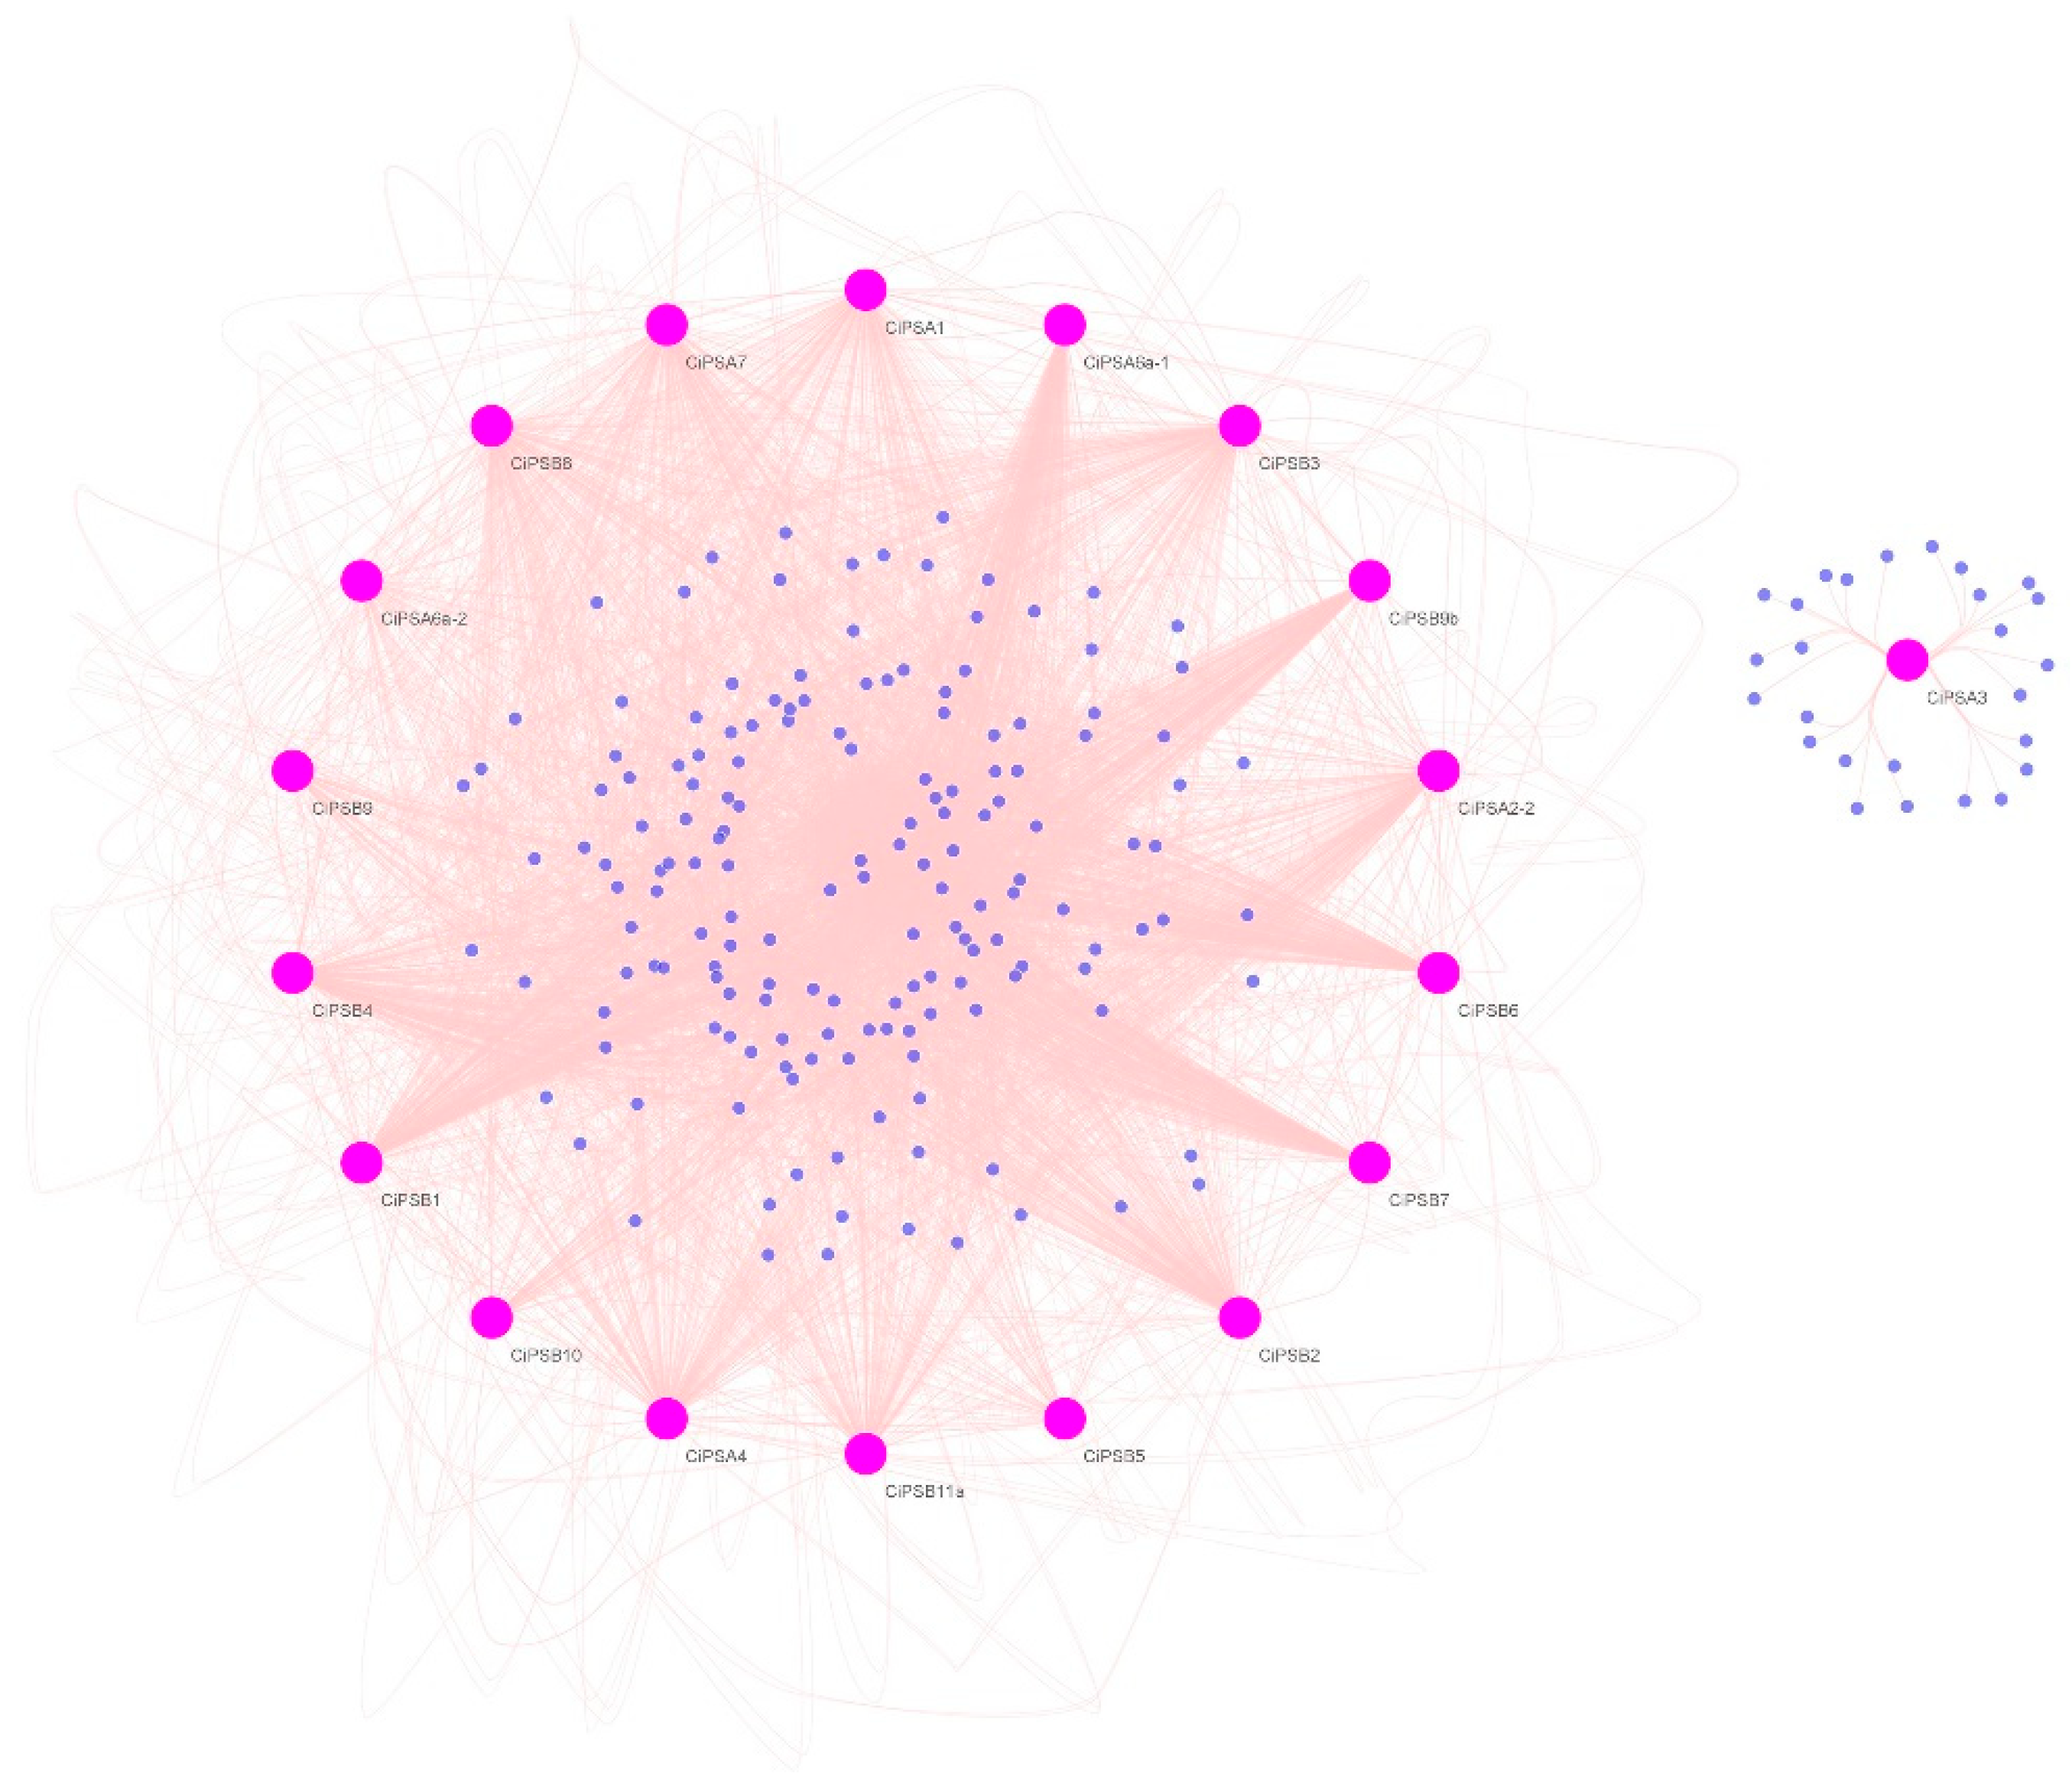
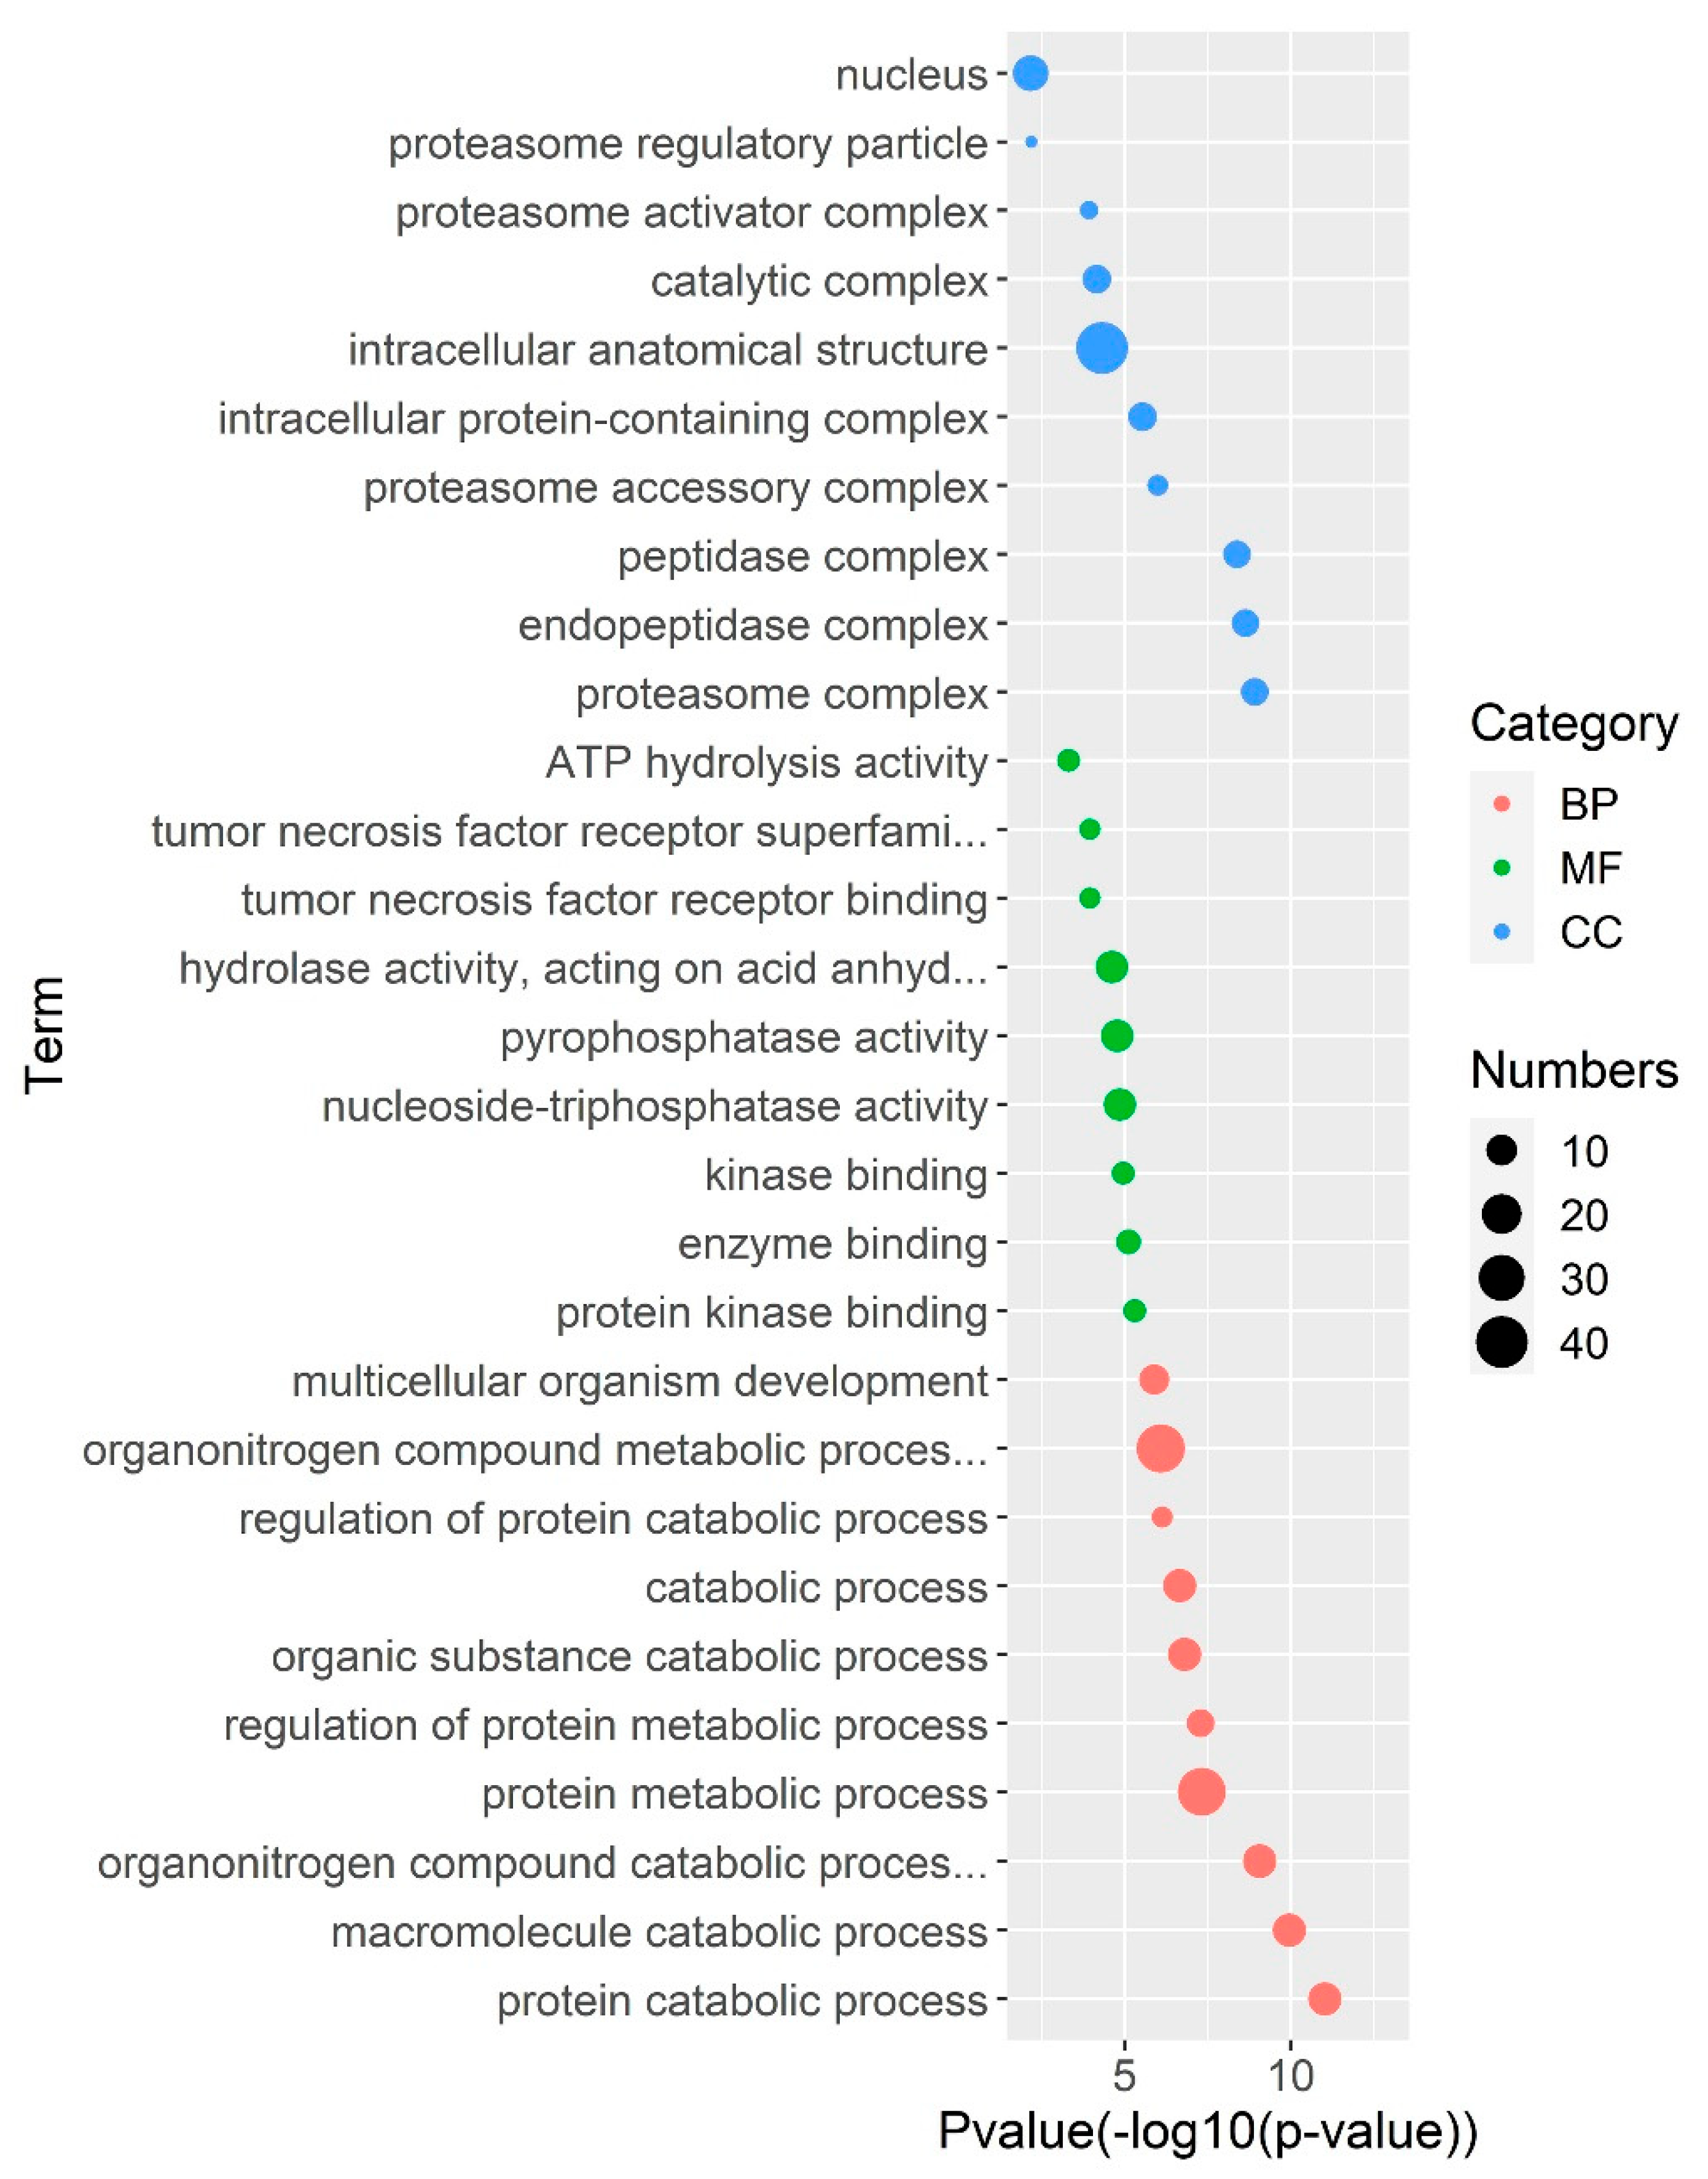
3.4. Gene Regulatory Network Analysis of PS Genes

Based on the GRN of zebrafish, we established the GRN of grass carp, and extracted a sub-network containing CiPS genes, involving 208 genes, including 18 CiPS genes, forming a total of 1744 interaction relationships; as shown in Figure 4. Among them, CiPSA1, CiPSB3, and CiPSB2 linked the most genes, with 134, 130, and 129 genes, respectively, suggesting that they may play key regulatory roles. Interestingly, CiPSA3 participated in a regulatory network independent of other CiPS members. To validate our GRN reconstruction based on STRING information, we reconstructed a gene network based on RNA-seq data of GSE185170 using the WGCNA, which resulted in a GRN with 26834 gene interactions. Compared with the GRN from STRING, there were 1411 interactions validated by the RNA-seq network; the p-value was approximant to zero based on hypergeometric distribution analysis, which indicated that our GRN from STRING was highly credible.
The GRN of CiPS genes was extracted and their functional enrichment analysis showed that these genes were mainly involved in the formation of the proteasome complex, as shown in Figure 5, which was consistent with the known function of PS genes. At the same time, they may also participate in the process of protein metabolism, protein alienation, and other processes through ATP binding, protein kinase, and hydrolase, as well as other molecular functions.

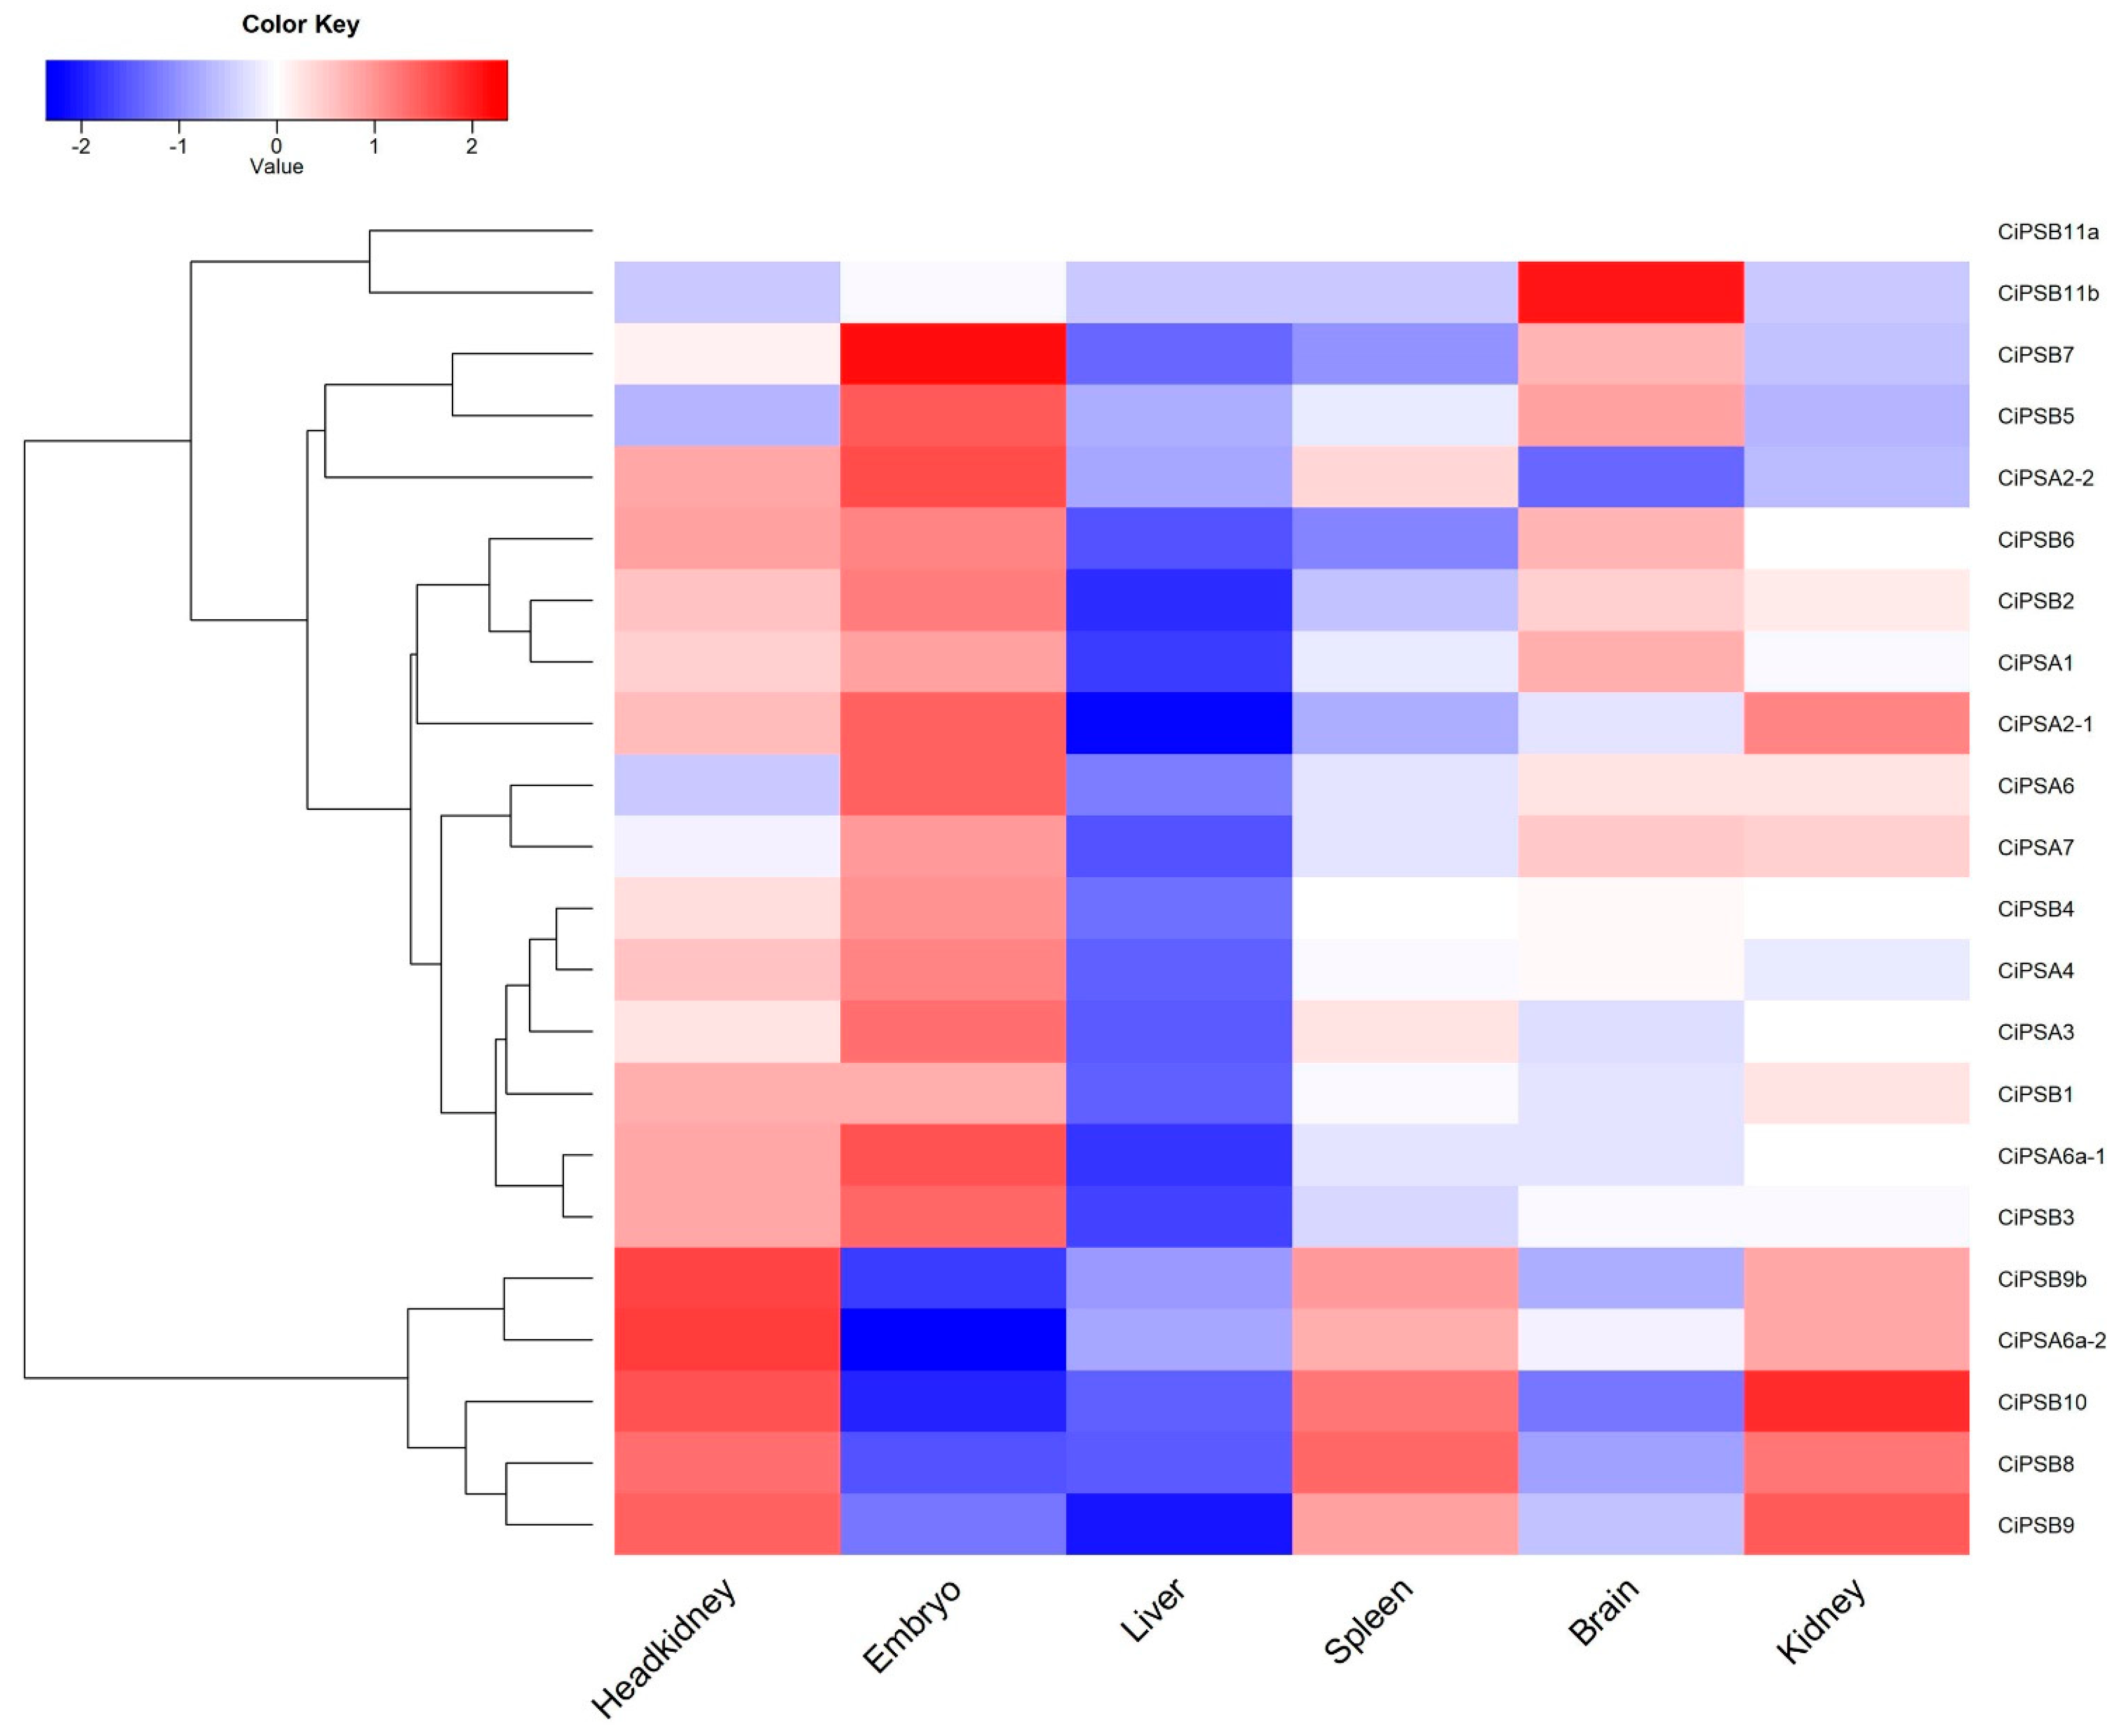
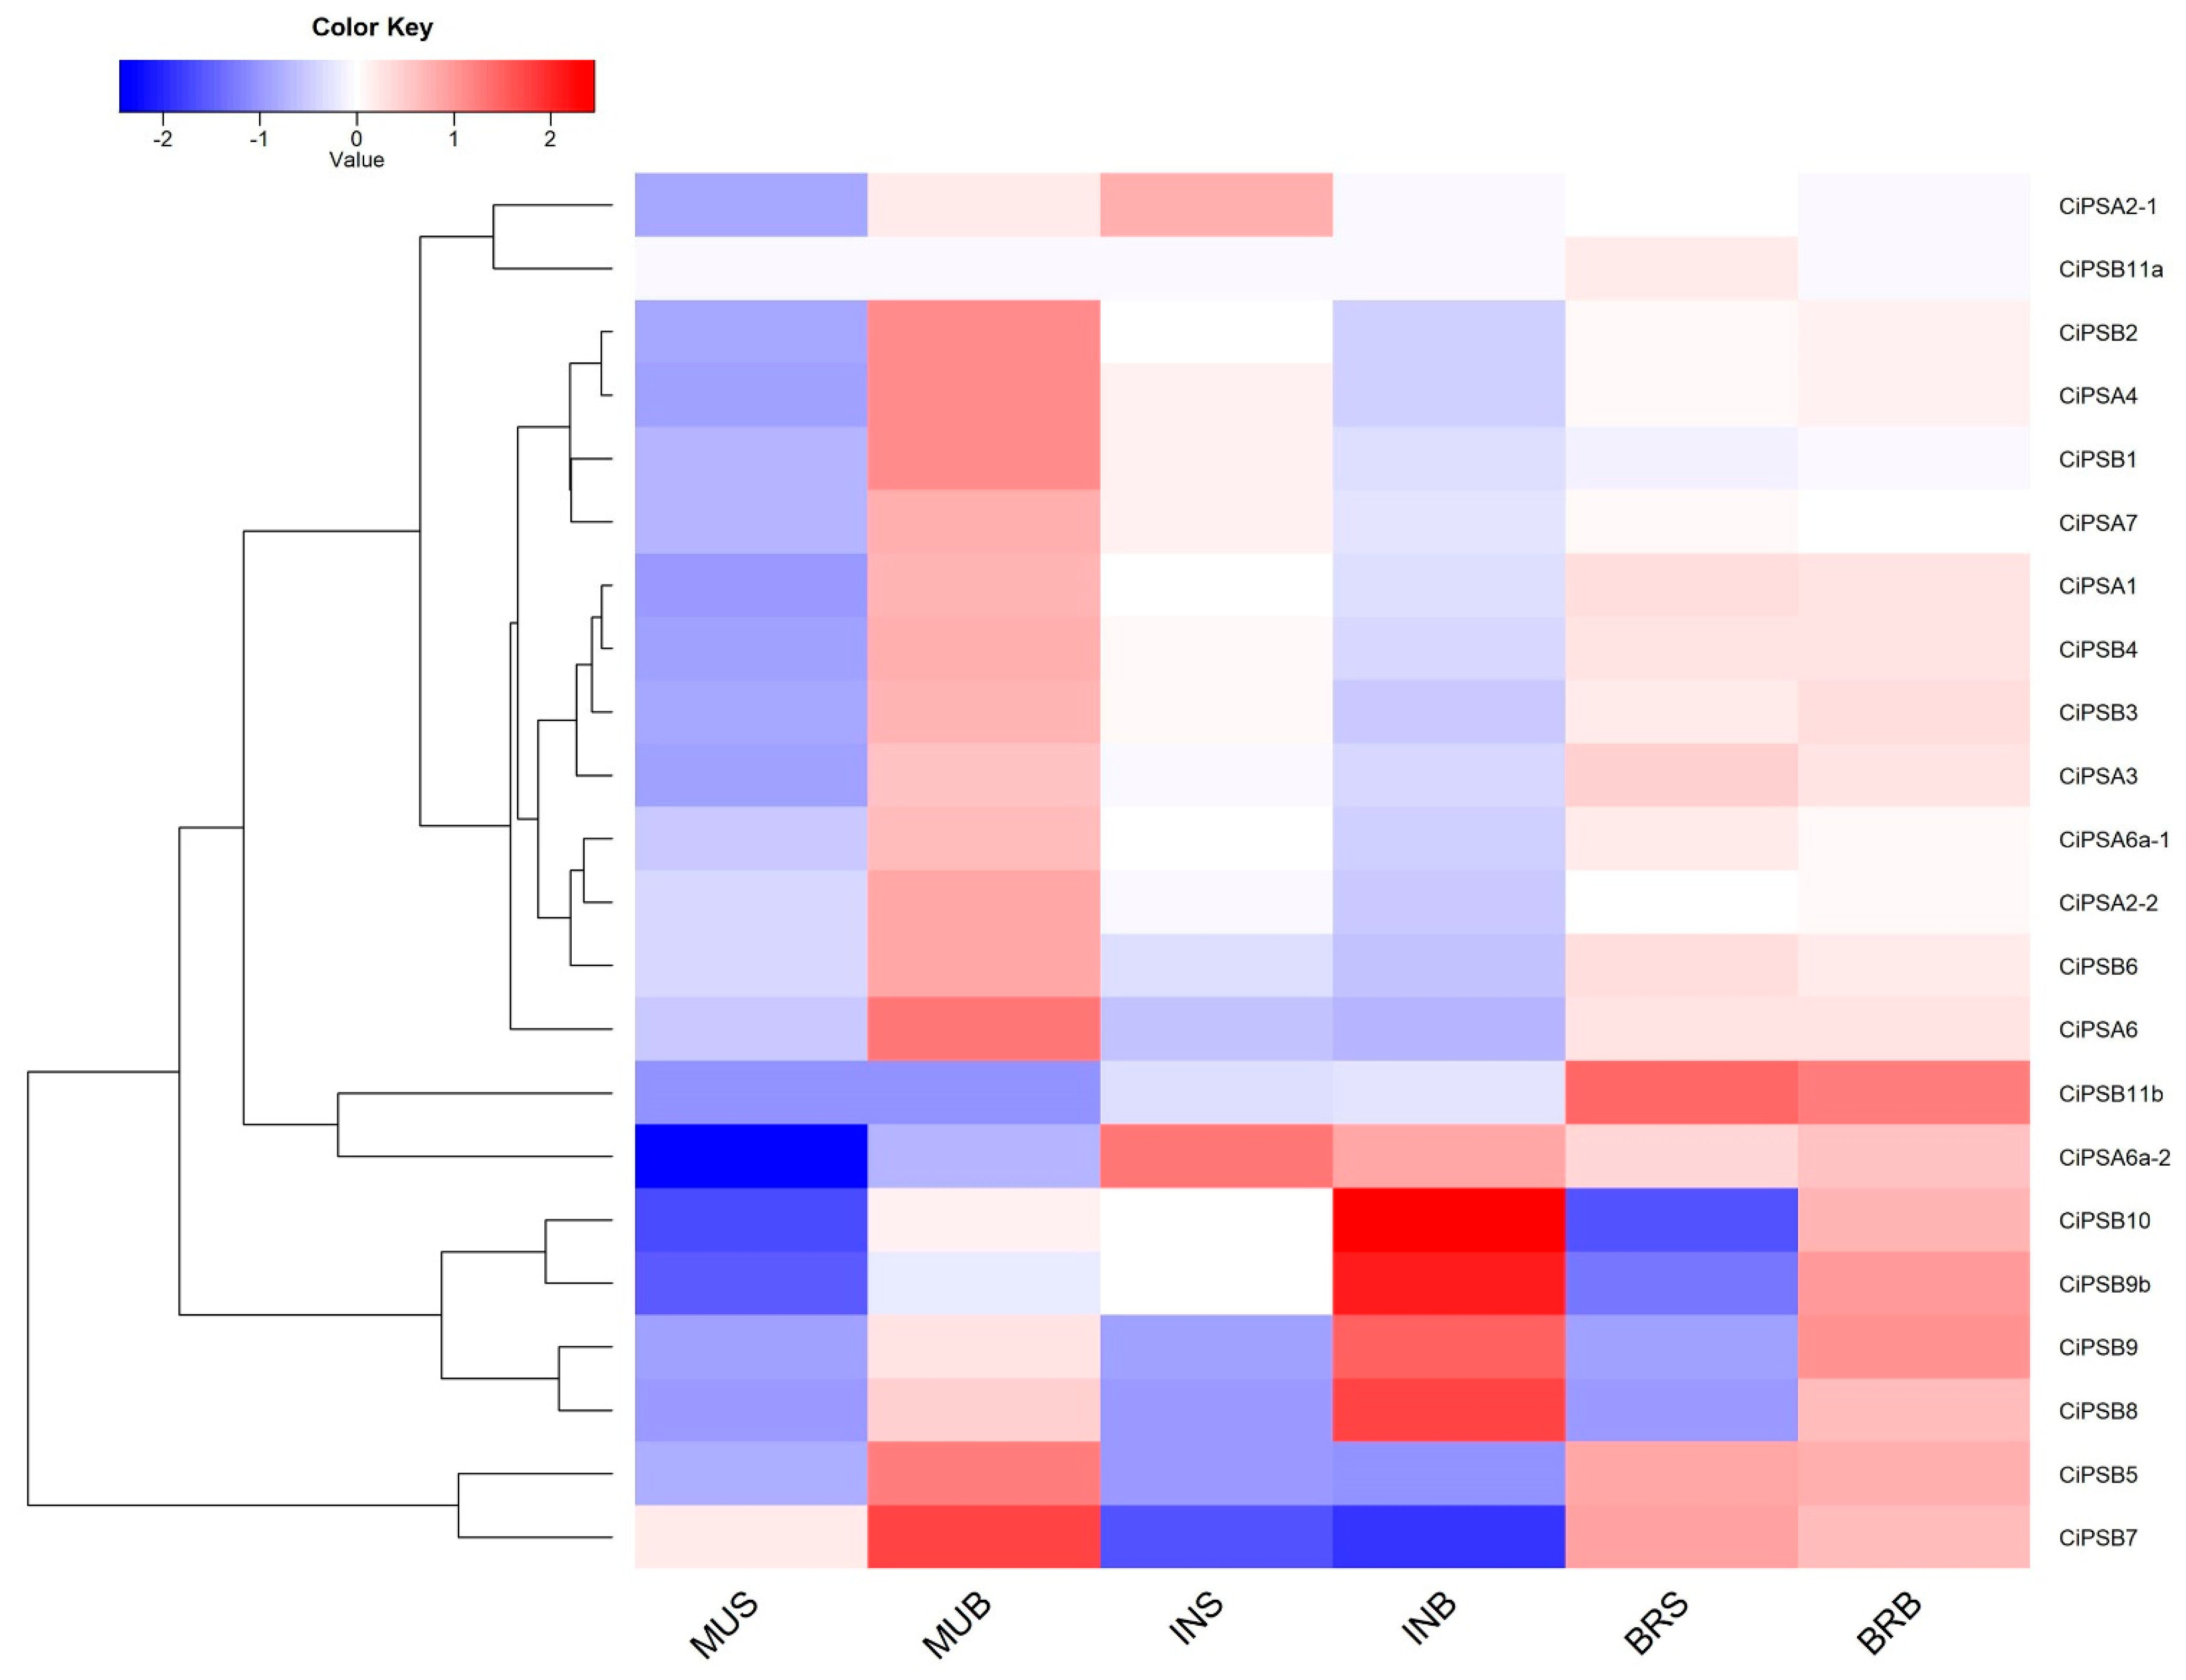
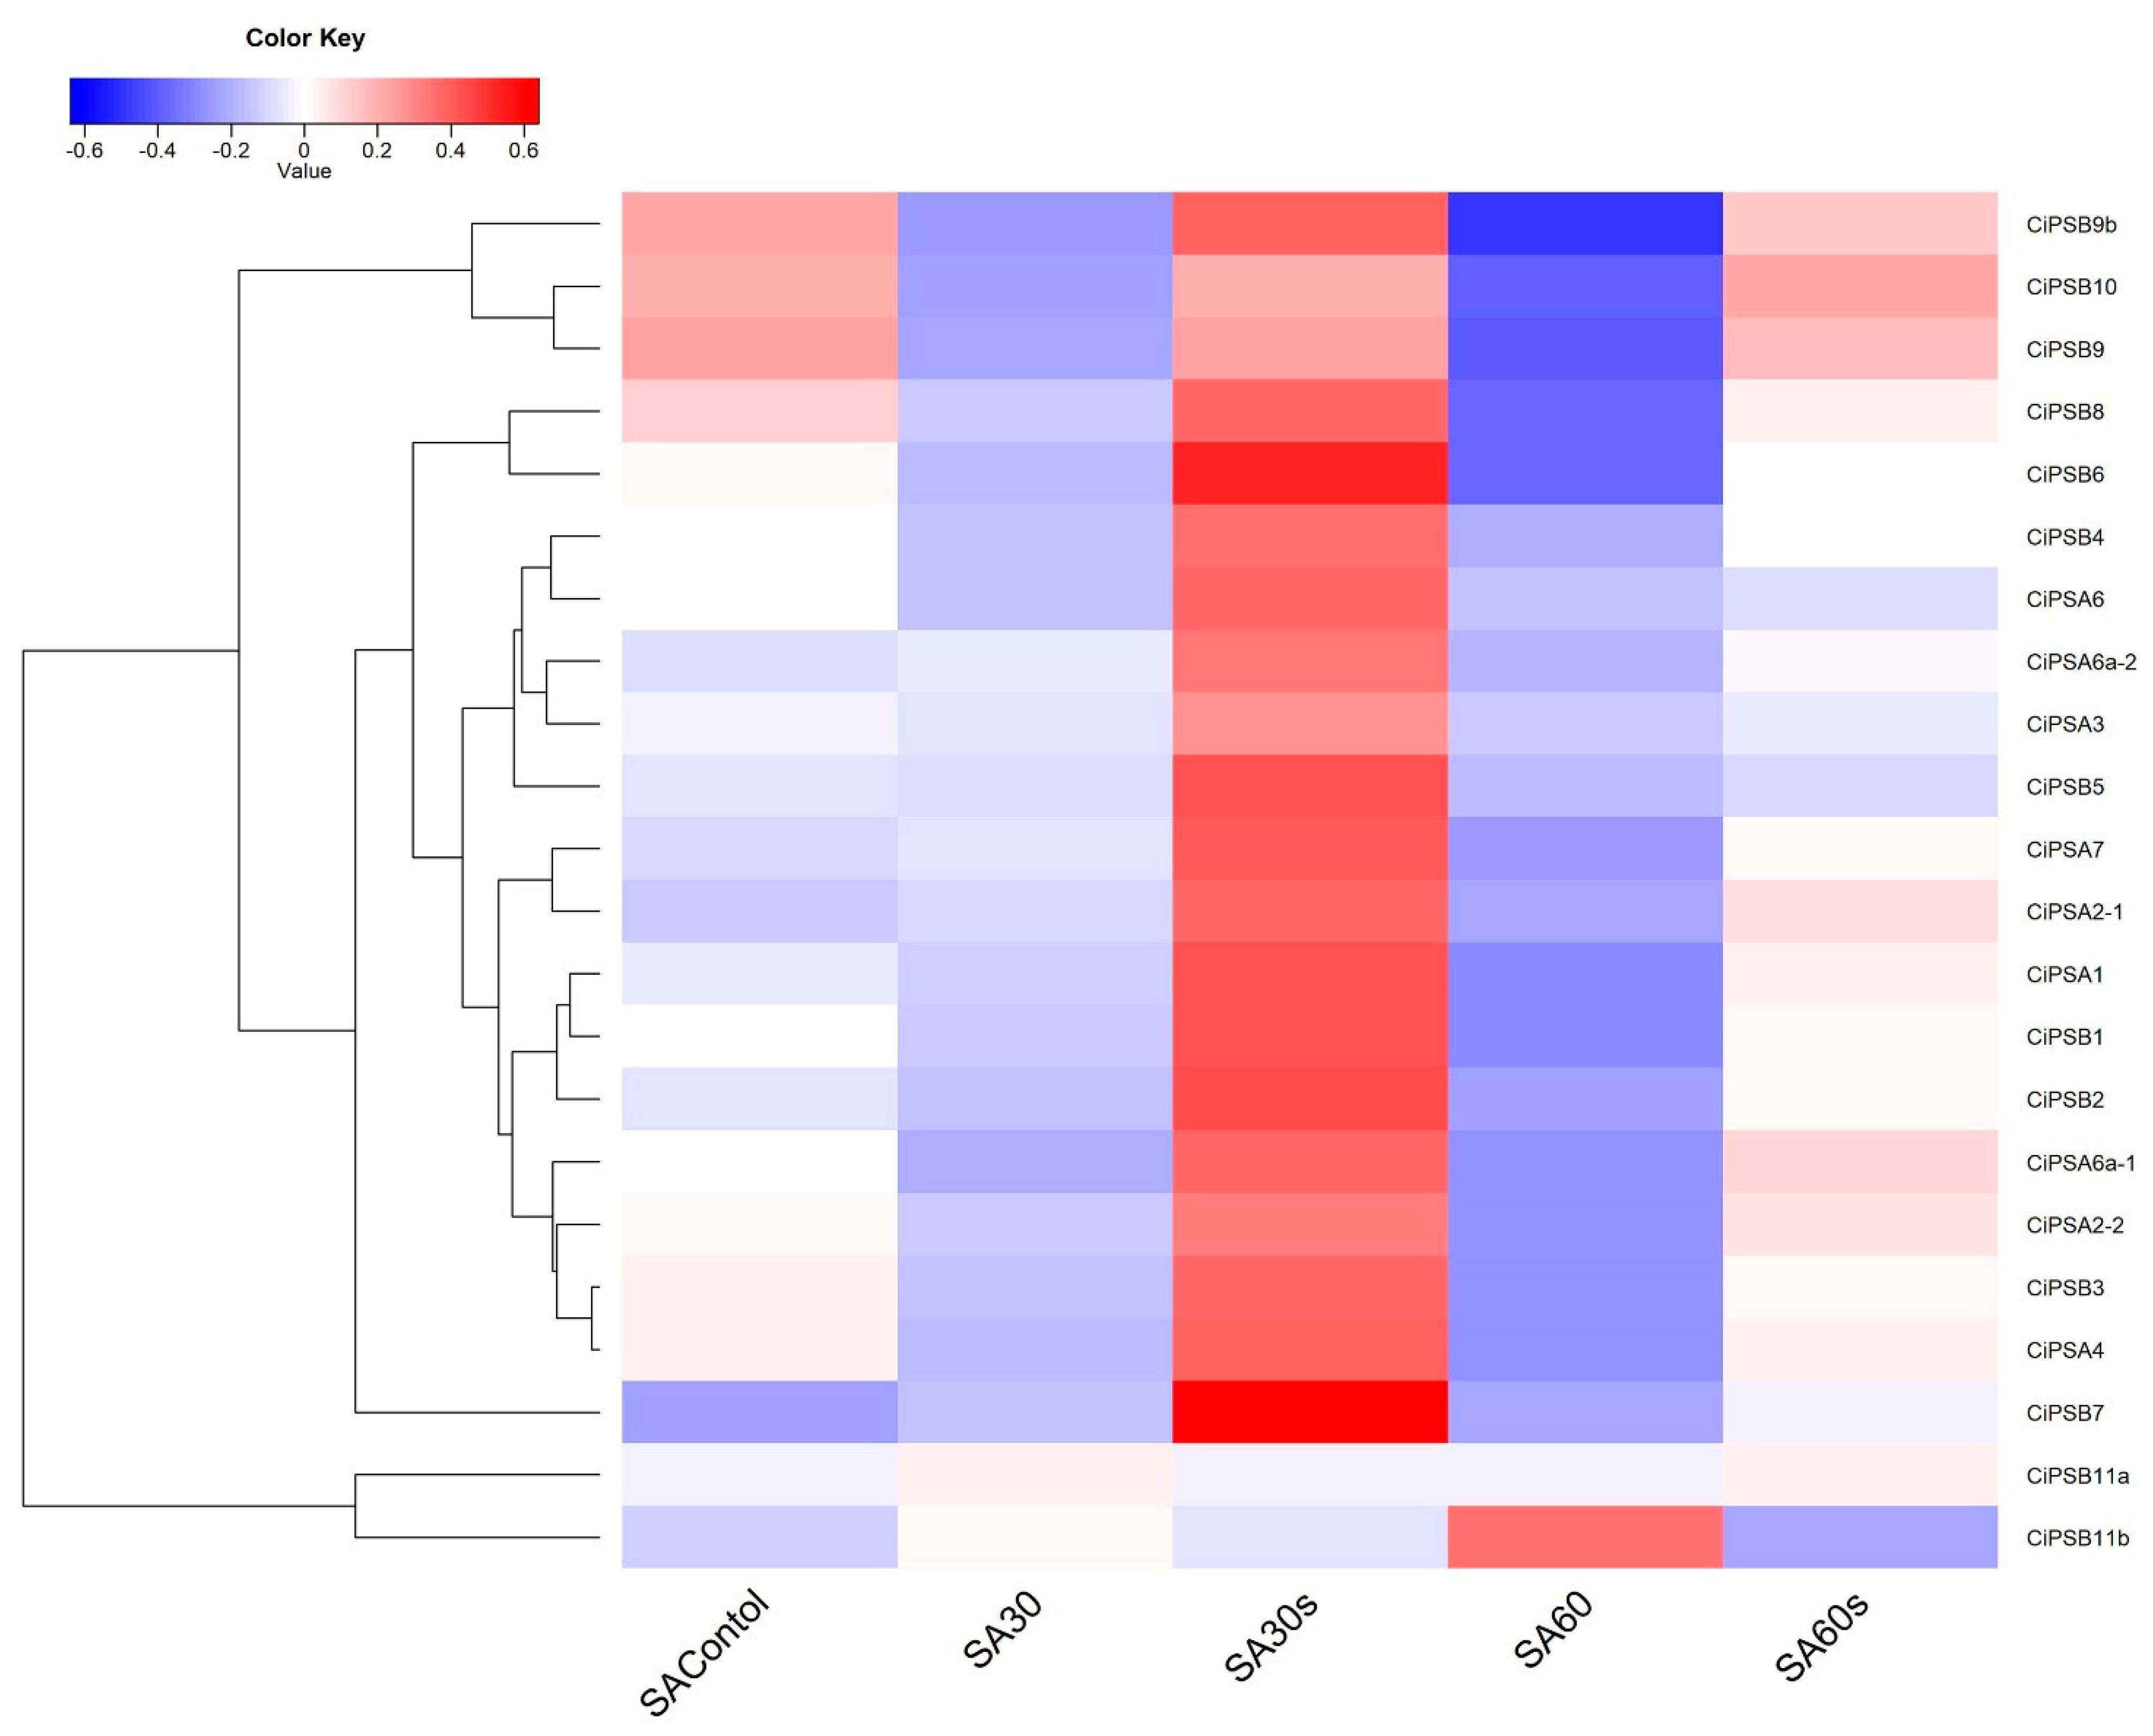
3.5. Expression Analysis of CiPS Genes in Response to Environmental Stresses

To investigate tissue expression patterns of members of the CiPS gene family, we used transcriptome data from normal grass carp tissues, including kidney, liver, head kidney, spleen, brain, and embryo. Among six tissues, it was found that CiPS genes were mainly expressed at high levels in the head kidney, embryo, and kidney (Figure 6); the expression levels of each CiPS gene family member can be referred to in Supplementary Material S2.
In the high-density culture stress test, juvenile grass carp (n = 400, 31.3 ± 7.3 g) were collected from the Jiangsu grass carp breeding center and randomly distributed in circulating tanks for domestication for 14 days. A net was placed in the tank to regulate stock density, and the fish were randomly divided into two groups: simulated intensive farming high density (40 kg m−3) and extensive farming low density (3 kg m−3). CiPS genes were highly expressed in muscle with low density versus high density, and some of the CiPS members were also expressed in the brain and the intestine in response to the high stocking density. Most notably, the CiPSB genes on the chromosome segment CI01000319 (including CiPSB9, CiPSB9b, CiPSB10, and CiPSB8) were consistently expressed, showing a pattern of low expression in the stressed group and high expression in the non-stressed group (Figure 7). The expression levels of each CiPS gene family member can be referred to in Supplementary Material S3.
Before the experiment began, grass carp individuals with an average body length of 12 cm were collected from the Duofu fish farm (Wuhan, China), and cultured for 2 weeks in a recirculating aquaculture system. Then, grass carp were randomly divided into three groups, which were cultured in salt water with concentrations of 0‰, 3‰, and 6‰, respectively. Some grass carp were injured after being cultured in 3‰ and 6‰ saline-alkali water for 30 days. At the end of the experiment, grass carp gill samples were collected from 0‰ (uninjured), 3‰ (injured), 3‰ (injured), 6‰ (uninjured), and 6‰ (injured) salt-alkali groups, respectively.
Similarly, in healthy fish, the expression levels of almost all CiPS gene family members under high saline-alkali stress were similar to those under high density stress. Most CiPS genes were highly expressed in the gills from the stressed group with high expression in the non-stressed group, and CiPSB genes on CI01000319 (including CiPSB9, CiPSB9b, CiPSB10, and CiPSB8) were uniformly expressed, showing a pattern of low expression even though the two transcriptome datasets were derived from different tissues. However, high expression of almost all CiPS gene family members was observed in injured fish in both 3‰ and 6‰ treatment groups. Meanwhile, only CiPSB11a and CiPSB11b showed an opposite pattern of expression (Figure 8). The expression levels of each CiPS gene family member can be referred to in Supplementary Material S4. For simplicity, we performed an analysis of significant differences in the expression levels of each CiPS gene family member between SA30s and controls, and the results are presented in Supplementary Material S5.
Since the CiPSB gene cluster CI01000319 showed a potential role in both of the above experiments, we further performed functional enrichment analysis of the genes interacting with the CiPSB gene cluster. It was found that this gene cluster possesses functions related to the structure and function of proteasome and ATP hydrolysis activity, and also interacts with tumor necrosis factor (TNF), and may participate in immune regulation through interaction with TNF (Figure 9).

4. Discussion

Classical biochemistry and modern molecular biology tell us that the ubiquitin proteasome system (UPS) regulates protein degradation and functional stabilization, and it is also involved in various cellular processes [28], such as cell signaling, cell cycle control, apoptosis, and antigen presentation [29,30]. Ubiquitination conjugation is a complex biochemical process that requires ubiquitin, ubiquitin activase (E1), ubiquitin binding enzyme (E2), and ubiquitin protein ligase (E3). E3 ligases play a key role in coupling ubiquitin to target proteins and generating specific mechanisms [31]. UPS is an ATP-dependent proteolytic system that consists of two main steps. The target protein is ubiquitinated and the specificity is determined by E3 ubiquitin ligase; then, the ubiquitinated protein is recognized by the 26S proteasome, which degrades the substrate into peptides. The expression products of PS gene family members constitute the proteasome subunits, which constitute the 20S proteasome core structure, and then further assemble into the 26S proteasome, which maintains the basic functions of various protein metabolic processes in the organism [8,30]. The PS gene family in grass carp has not been systematically studied, and biological function information still needs to be explored. In this study, we analyzed the CiPS gene family in terms of structural genomics, phylogenetic relationships, and transcriptome, which have positive significance for revealing the biological function of this gene family in grass carp.
CiPS membership identification was the foundation work in this study. If the result was not qualified, it would not work in the next step. The results of the genome comparison study showed that grass carp and zebrafish were closely phylogenically related species, and they had undergone similar genome evolution, sharing a total of 7227 gene families [12]. Therefore, we first extracted the PS gene family of zebrafish and humans using a well-studied PS gene family information, and found 25 members in zebrafish. In comparison, the CiPS gene family was detected with 22 members. Objectively speaking, the quality of genome assembly of grass carp as an economic fish was not as good as zebrafish as a model animal. The above results confirmed the validity of our method of identification and classification of the CiPS gene family.
Gene family evolution is characterized by gene duplication through whole genome duplication, tandem gene duplication, and fragment duplication events that can lead to an increase in the number of genes in the genome [32]. Larger genomes may help diversify gene functions, leading to larger gene families that allow for the evolution of more complex interactions and gene networks. In our study, the results of motif and phylogenetic analyses showed that the CiPS gene family was also divided into type A and type B, and a large number of motifs and structures were stable among the human, zebrafish, and grass carp. We also observed intron-exon distribution patterns and structures of all detected CiPS as supporting evidence for the pattern of gene family expansion, and analyzed its evolutionary relationship with other species via a phylogenetic tree. These results suggested that this was consistent with the conserved basic function of the proteasome, which was very important during evolution.
The PS gene family is relatively conserved in terms of evolution, which is also reflected in its limited expansion in the genome. Collinearity analysis of the CiPS gene family showed that there were three tandem replication events, and that the evolution of the PS gene family was related to fragment replication events in grass carp. One of the three expansion events identified in the CiPS family formed the CiPSB11a gene, which is very short, with a significantly abnormal number of exon (only one) and may be an evolutionary product of this gene family. The other two replicates resulted in the formation of the CiPSB gene cluster (four PSB members, including CiPSB9, CiPSB9b, CiPSB10, and CiPSB8) within 15 kb on CI01000319. The formation of gene clusters implies that the gene family has the basis for the evolution of new capabilities; that is, to open up space for subsequent functional differentiation. CiPSB11a and the CiPSB gene cluster on CI01000319 showed inconsistent expression patterns with other members of the CiPS family in response to environmental stresses, suggesting that these expansions may generate new functions for the gene family.
PS gene family members were initially an object of concern for aquaculturists, because they could affect the meat quality of fish filets [29,33]. For example, UPS has been found to play a role in the decrease in meat quality of rainbow trout females after spawning [34]. Later studies found that the proteasome changes when the filet quality of cultured fish is changed by various treatments [11,34,35]. These findings suggested that proteasome might play a role in stress responses in fish. In this study, GRN analysis of CiPS members and GO annotation of interactive genes showed that CiPS members and their target genes played important roles in various metabolic processes of proteins.
The results of the transcriptome analysis suggested that CiPS gene family members might be widely involved in the immune response of grass carp, negatively regulating the response process to environmental stresses. At the same time, when grass carp are under stresses, proteasome activity could be activated, which initiates the related process of response to high saline-alkali or high density stress. The tolerance of grass carp to salt-alkali stress of 3‰ and 6‰ was different among individuals. Some were injured and others were still healthy. If the saline-alkali level was not considered, and only the fish injury phenotype was concerned, it was found to be significantly negatively correlated with the expression level of the CiPS family genes, especially the expression level of the CiPSB gene cluster on CI01000319. The expression level of gill tissue in healthy fish was low; otherwise the phenotype was injured, which further confirmed that CiPS gene family members were involved in the response to high saline-alkali stress. In both of transcriptome analyses, the expression of the CiPSB gene cluster on the CI01000319 segment (CiPSB8, CiPSB9, CiPSB9b, and CiPSB10) was different from that of other CiPS members, and this gene cluster was likely to use a unified regulatory mode, especially under environmental stresses. As mentioned above, the CiPS gene family is functionally fundamental, and the divergence here also suggests that this gene cluster is a surrogate for other members in response to stresses and may have important response patterns that regulate critical pathways at low levels. According to the annotation results of the GRN, the gene cluster may interact with TNF, which needs to be confirmed in future experiments. Based on current knowledge, interaction with TNF may not only have cytotoxic effects on a variety of tumor cells, but may also be closely associated with inflammatory and febrile responses [36].

5. Conclusions

In summary, we identified 22 CiPS genes from the genome sequence of grass carp. Classification, phylogenetic analysis, and tissue expression of these genes were investigated, revealing that CiPS gene family members were involved in responding to diverse environmental stresses, mainly in the form of negative regulation. Interestingly, we identified a CiPSB gene cluster in an 15 kb region on chromosome segment CI01000319, that might be involved in environmental stress responses. Our results should contribute to the identification and characterization of the CiPS gene family. Further functional analysis of these genes will be performed in the future to enable their application in grass carp breeding.

Supplementary Materials

The following supporting information can be downloaded at: https://www.mdpi.com/article/10.3390/fishes7060350/s1, Supplementary Material S1: All PS gene sequences of human, zebrafish and grass carp involved in this study; Supplementary Material S2: Expression level of each CiPS gene family member in six tissues of grass carp; Supplementary Material S3: Expression level of each CiPS gene family member response to high density stress in grass carp; Supplementary Material S4: Expression level of each CiPS gene family member response to high saline-alkali stress in grass carp; Supplementary Material S5: Differences in the expression levels of each CiPS gene family member between SA30s and controls.

Author Contributions

Conceptualization, G.H. and X.Z.; methodology, Y.S.; investigation, P.L., T.Z., F.C.; data curation, G.H. and Y.S.; writing—original draft preparation, G.H., X.Z.; writing—review and editing, G.H., X.Z.; supervision, X.Z.; funding acquisition, X.Z. All authors have read and agreed to the published version of the manuscript.

Funding

This research was funded by Ministry of Science and Technology of China, National Freshwater Genetic Resource Center (FGRC:18537); Chinese Academy of Fishery Sciences, the Central Public-interest Scientific Institution Basal Research Fund (2020TD22).

Institutional Review Board Statement

Not applicable.

Data Availability Statement

All data in this study are from public databases and have been annotated in detail in the main text.

Acknowledgments

The authors gratefully appreciate to the scientists and platforms that have made their data available to the public.

Conflicts of Interest

The authors declare no conflict of interest.

References

  1. Fishery Administration of Ministry of Agriculture and Rural Affairs. China Fishery Statistical Yearbook; China Agriculture Press: Beijing, China, 2022.
  2. Xie, C.; Li, J.; Li, D.; Shen, Y.; Gao, Y.; Zhang, Z. Grass Carp: The Fish that Feeds Half of China. In Aquaculture in China; Gui, J., Tang, Q., Li, Z., Liu, J., De Silva, S.S., Eds.; John Wiley & Sons Press: Oxford, UK, 2018; pp. 93–115. [Google Scholar]
  3. Zhao, Y.; Zhang, L.; Wang, C.; Xie, C. Biology and Ecology of Grass Carp in China: A Review and Synthesis. North Am. J. Fish. Manag. 2020, 40, 1379–1399. [Google Scholar] [CrossRef]
  4. Petitjean, Q.; Jean, S.; Gandar, A.; Côte, J.; Laffaille, P.; Jacquin, L. Stress responses in fish: From molecular to evolutionary processes. Sci. Total Environ. 2019, 684, 371–380. [Google Scholar] [CrossRef] [PubMed]
  5. Pankhurst, N.W. The endocrinology of stress in fish: An environmental perspective. Gen. Comp. Endocrinol. 2011, 170, 265–275. [Google Scholar] [CrossRef] [PubMed] [Green Version]
  6. Schulte, P.M. What is environmental stress? Insights from fish living in a variable environment. J. Exp. Biol. 2014, 217, 23–34. [Google Scholar] [CrossRef] [PubMed] [Green Version]
  7. Mao, Y. Structure, Dynamics and Function of the 26S Proteasome. Subcell. Biochem. 2021, 96, 1–151. [Google Scholar] [PubMed]
  8. Gomes, A.V. Genetics of proteasome diseases. Sci. Cairo 2013, 2013, 637629. [Google Scholar] [CrossRef] [Green Version]
  9. Adams, J. The proteasome: Structure, function, and role in the cell. Cancer Treat Rev. 2003, 29, 3–9. [Google Scholar] [CrossRef]
  10. Adams, J. The proteasome: A suitable antineoplastic target. Nat. Rev. Cancer 2004, 4, 349–360. [Google Scholar] [CrossRef]
  11. Sun, Y.; Liang, X.; Chen, J.; Tang, R.; Li, L.; Li, D. Change in Ubiquitin Proteasome System of Grass Carp Ctenopharyngodon idellus Reared in the Different Stocking Densities. Front Physiol. 2018, 9, 837. [Google Scholar] [CrossRef]
  12. Wang, Y.; Lu, Y.; Zhang, Y.; Ning, Z.; Li, Y.; Zhao, Q.; Lu, H.; Huang, R.; Xia, X.; Feng, Q.; et al. The draft genome of the grass carp (Ctenopharyngodon idellus) provides insights into its evolution and vegetarian adaptation. Nat. Genet. 2015, 47, 625–631. [Google Scholar] [CrossRef]
  13. Finn, R.D.; Bateman, A.; Clements, J.; Coggill, P.; Eberhardt, R.Y.; Eddy, S.R.; Heger, A.; Hetherington, K.; Holm, L.; Mistry, J.; et al. Pfam: The protein families database. Nucleic Acids Res. 2014, 42, D222–D230. [Google Scholar] [CrossRef] [Green Version]
  14. Altschul, S.F.; Madden, T.L.; Schaffer, A.A.; Zhang, J.; Zhang, Z.; Miller, W.; Lipman, D.J. Gapped BLAST and PSI-BLAST: A new generation of protein database search programs. Nucleic Acids Res. 1997, 25, 3389–3402. [Google Scholar] [CrossRef] [Green Version]
  15. Potter, S.C.; Luciani, A.; Eddy, S.R.; Park, Y.; Lopez, R.; Finn, R.D. HMMER web server: 2018 update. Nucleic Acids Res. 2018, 46, W200–W204. [Google Scholar] [CrossRef] [Green Version]
  16. Thompson, J.D.; Gibson, T.J.; Higgins, D.G. Multiple sequence alignment using ClustalW and ClustalX. Curr. Protoc. Bioinform. 2002. [Google Scholar] [CrossRef]
  17. Tamura, K.; Stecher, G.; Kumar, S. MEGA11: Molecular Evolutionary Genetics Analysis Version 11. Mol. Biol. Evol. 2021, 38, 3022–3027. [Google Scholar] [CrossRef]
  18. Bailey, T.L.; Boden, M.; Buske, F.A.; Frith, M.; Grant, C.E.; Clementi, L.; Ren, J.; Li, W.W.; Noble, W.S. MEME SUITE: Tools for motif discovery and searching. Nucleic Acids Res. 2009, 37, W202–W208. [Google Scholar] [CrossRef]
  19. Krzywinski, M.; Schein, J.; Birol, I.; Connors, J.; Gascoyne, R.; Horsman, D.; Jones, S.J.; Marra, M.A. Circos: An information aesthetic for comparative genomics. Genome Res. 2009, 19, 1639–1645. [Google Scholar] [CrossRef] [Green Version]
  20. Szklarczyk, D.; Gable, A.L.; Nastou, K.C.; Lyon, D.; Kirsch, R.; Pyysalo, S.; Doncheva, N.T.; Legeay, M.; Fang, T.; Bork, P.; et al. The STRING database in 2021: Customizable protein-protein networks, and functional characterization of user-uploaded gene/measurement sets. Nucleic Acids Res. 2021, 49, D605–D612. [Google Scholar] [CrossRef]
  21. Shannon, P.; Markiel, A.; Ozier, O.; Baliga, N.S.; Wang, J.T.; Ramage, D.; Amin, N.; Schwikowski, B.; Ideker, T. Cytoscape: A Software Environment for Integrated Models of Biomolecular Interaction Networks. Genome Res. 2003, 13, 2498–2504. [Google Scholar] [CrossRef]
  22. Ashburner, M.; Ball, C.A.; Blake, J.A.; Botstein, D.; Butler, H.; Cherry, J.M.; Davis, A.P.; Dolinski, K.; Dwight, S.S.; Eppig, J.T.; et al. Gene ontology: Tool for the unification of biology. The Gene Ontology Consortium. Nat. Genet. 2000, 25, 25–29. [Google Scholar] [CrossRef]
  23. Alexa, A.; Rahnenfuhrer, J. topGO: Enrichment analysis for gene ontology. R Package 2019, version 2.38.1.
  24. Ritchie, M.E.; Phipson, B.; Wu, D.; Hu, Y.; Law, C.W.; Shi, W.; Smyth, G.K. limma powers differential expression analyses for RNA-sequencing and microarray studies. Nucleic Acids Res. 2015, 43, e47. [Google Scholar] [CrossRef]
  25. He, Y.; Yu, H.; Zhao, H.; Zhu, H.; Zhang, Q.; Wang, A.; Shen, Y.; Xu, X.; Li, J. Transcriptomic analysis to elucidate the effects of high stocking density on grass carp (Ctenopharyngodon idella). BMC Genom. 2021, 22, 620. [Google Scholar] [CrossRef] [PubMed]
  26. Patro, R.; Duggal, G.; Love, M.I.; Irizarry, R.A.; Kingsford, C. Salmon provides fast and bias-aware quantification of transcript expression. Nat. Methods 2017, 14, 417–419. [Google Scholar] [CrossRef] [Green Version]
  27. R Core Team. R: A Language and Environment for Statistical Computing; R Foundation for Statistical Computing: Vienna, Austria, 2022. [Google Scholar]
  28. Pohl, C.; Dikic, I. Cellular quality control by the ubiquitin-proteasome system and autophagy. Science 2019, 366, 818–822. [Google Scholar] [CrossRef] [PubMed]
  29. Khalil, R. Ubiquitin-Proteasome Pathway and Muscle Atrophy. Adv. Exp. Med. Biol. 2018, 1088, 235–248. [Google Scholar] [PubMed]
  30. Thibaudeau, T.A.; Smith, D.M. A Practical Review of Proteasome Pharmacology. Pharmacol. Rev. 2019, 71, 170–197. [Google Scholar] [CrossRef] [PubMed] [Green Version]
  31. Liu, W.; Tang, X.; Qi, X.; Fu, X.; Ghimire, S.; Ma, R.; Li, S.; Zhang, N.; Si, H. The Ubiquitin Conjugating Enzyme: An Important Ubiquitin Transfer Platform in Ubiquitin-Proteasome System. Int. J. Mol. Sci. 2020, 21, 2894. [Google Scholar] [CrossRef] [Green Version]
  32. Maere, S.; De Bodt, S.; Raes, J.; Casneuf, T.; Van Montagu, M.; Kuiper, M.; Van de Peer, Y. Modeling gene and genome duplications in eukaryotes. Proc. Natl. Acad. Sci. USA 2005, 102, 5454–5459. [Google Scholar] [CrossRef] [Green Version]
  33. Seiliez, I.; Panserat, S.; Skiba-Cassy, S.; Fricot, A.; Vachot, C.; Kaushik, S.; Tesseraud, S. Feeding status regulates the polyubiquitination step of the ubiquitin-proteasome-dependent proteolysis in rainbow trout (Oncorhynchus mykiss) muscle. J. Nutr. 2008, 138, 487–491. [Google Scholar] [CrossRef] [Green Version]
  34. Ahongo, Y.D.; Le Cam, A.; Montfort, J.; Bugeon, J.; Lefèvre, F.; Rescan, P.Y. Gene expression profiling of trout muscle during flesh quality recovery following spawning. BMC Genom. 2022, 23, 9. [Google Scholar] [CrossRef]
  35. Li, Z.; Du, X.; Wen, L.; Li, Y.; Qin, J.; Chen, Z.; Huang, Y.; Wu, X.; Luo, H.; Lin, Y.; et al. Transcriptome analysis reveals the involvement of ubiquitin-proteasome pathway in the regulation of muscle growth of rice flower carp. Comp. Biochem. Physiol. Part D Genom. Proteom. 2022, 41, 100948. [Google Scholar] [CrossRef]
  36. Li, Y.; Xiao, T.; Zou, J. Fish TNF and TNF receptors. Sci. China Life Sci. 2021, 64, 196–220. [Google Scholar] [CrossRef]
Figure 1. Phylogenetic tree analysis of the CiPS gene family members in grass carp.
Fishes 07 00350 g001
Figure 2. Distribution of conserved motifs within CiPS gene family members in grass carp.
Fishes 07 00350 g002
Figure 3. Chromosomal distribution and expansion analysis of the CiPS gene family members in grass carp.
Fishes 07 00350 g003
Figure 4. Gene regulatory network analysis of CiPS gene family members in grass carp.
Fishes 07 00350 g004
Figure 5. GO analysis of gene regulatory networks of the CiPS gene family members in grass carp. Note: Red dot BP, green dot MF, and blue dot CC represent three types of GO terms, including biological process, molecular function, and cellular component. The dot size represents the number of genes enriched in the GO term. The ordinate is the term of GO, and the abscissa is the p-value of topGO enrichment analysis, −log10 (p).
Fishes 07 00350 g005
Figure 6. Expression profile of CiPS gene family members in six tissues of grass carp.
Fishes 07 00350 g006
Figure 7. Expression profile of CiPS gene family members response to high density stress in grass carp. Note: S group: Grass carp high-density culture (40 kg m−3); B group: normal culture (3 kg m−3); MUS represents muscle in S group, MUB represents muscle in B group; INS represents intestine in S group, INB represents intestine in B group; BRS represents brain in S group, BRB represents brain in B group.
Fishes 07 00350 g007
Figure 8. Expression profile of CiPS gene family members response to high saline-alkali stress in grass carp. Note: SAcontrol means gill samples of grass carp were collected from 0 saline-alkali groups; SA30 means gill samples of grass carp were collected from 3‰ saline-alkali groups, and grass carp was not injured); SA30s means gill samples of grass carp were collected from 3‰ saline-alkali groups, and grass carp was injured); SA60 means gill samples of grass carp were collected from 6‰ saline-alkali groups, and grass carp was not injured); SA60s means gill samples of grass carp were collected from 6‰ saline-alkali groups, and grass carp was injured.
Fishes 07 00350 g008
Figure 9. GO analysis of gene regulatory network of CiPSB gene cluster on chromosome segment CI01000319. Note: Red dot BP, green dot MF, and blue dot CC represent three types of GO terms, including biological process, molecular function, and cellular component. The dot size represents the number of genes enriched in the GO term. The ordinate is the term of GO, and the abscissa is the p-value of topGO enrichment analysis, −log10 (p).
Fishes 07 00350 g009
Table 1. List of all CiPS genes identified in the grass carp genome.
Gene NameChromosome SegmentGene LocusExonAmino AcidSubfamily
CiPSA1CI0100019100591202_0059448510309A
CiPSA2-1CI0100002702991231_029945607193A
CiPSA2-2CI0100005405825039_058273258234A
CiPSA3CI0100031004428945_04459038301218A
CiPSA4CI0100013900003689_0001200510304A
CiPSA6CI0100005104165819_041673314138A
CiPSA6a-1CI0100031100675876_006804337246A
CiPSA6a-2CI0100046800039181_000477048264A
CiPSA7CI0100005100775546_007804987273A
CiPSB1CI0100000504829696_048370476237B
CiPSB2CI0100022300398156_004055786199B
CiPSB3CI0100002400161629_001655225204B
CiPSB4CI0100005401613638_016176746254B
CiPSB5CI0100000416221780_162324264336B
CiPSB6CI0100012901661645_016636215205B
CiPSB7CI0100000801141528_011458247240B
CiPSB8CI0100031905816948_058194995247B
CiPSB9CI0100031905808908_058124986230B
CiPSB9bCI0100031905804236_058069555216B
CiPSB10CI0100031905812788_058160978273B
CiPSB11aCI0100000416217935_162185801215B
CiPSB11bCI0100002106402127_064060303426B
Publisher’s Note: MDPI stays neutral with regard to jurisdictional claims in published maps and institutional affiliations.

