Article

The Black Soldier Fly (Hermetia illucens) Larvae Meal Can Cost-Effectively Replace Fish Meal in Practical Nursery Diets for Post-Larval Penaeus vannamei under High-Density Culture

by
Alberto J. P. Nunes
1,*,
Hiroshi Yamamoto
2,
João Paulo Simões
3,
João Luiz Pisa
4,
Nelson Miyamoto
3 and
Jordana Sampaio Leite
1
1
LABOMAR—Instituto de Ciências do Mar, Universidade Federal do Ceará, Avenida da Abolição, 3207, Meireles, Fortaleza 60165-081, CE, Brazil
2
Sumitomo Corporation, 3-2 Otemachi 2-Chome, Chiyoda-ku, Tokyo 100-8601, Japan
3
Sumitomo Corporation do Brasil S.A., Avenida Paulista, nº 37, 20º andar, Conjunto 201, Bela Vista, São Paulo 01311-902, SP, Brazil
4
BSF Nutrição e Biotecnologia S.A. (CYNS), Avenida Roma, 937, Piracicaba 13408-035, SP, Brazil
*
Author to whom correspondence should be addressed.
Fishes 2023, 8(12), 605; https://doi.org/10.3390/fishes8120605
Submission received: 13 October 2023 / Revised: 16 November 2023 / Accepted: 28 November 2023 / Published: 10 December 2023
(This article belongs to the Special Issue Application of Protein and Amino Acid in Aquaculture Feed)

Abstract

:
The black soldier larvae meal (BSFLM) has been the most extensively studied insect protein source in shrimp nutrition. However, both the availability and prices of BSFLM are still a constraint for its widespread use as an ingredient in animal feeds. The present study investigated the growth and economic performance of post-larval (PL) P. vannamei fed nursery diets with a progressive replacement of fish meal (FML) for BSFLM at 0, 25, 50, 75, and 100%. These replacements corresponded to a dietary inclusion (% of the diet, as-is) of FML and BSFLM of 16.50 and 6.33%, 11.00 and 13.04%, 5.50 and 19.74%, and 0 and 26.46%, respectively. A total of 102,647 shrimp at the age of PL15 with 2.7 ± 0.2 mg body weight (BW) were stocked in fifty 1.5 m3 tanks under 1369 PLs/m3 (2053 ± 33 PLs/tank) and reared for 42 days. Final shrimp survival (90.5 ± 7.6%), daily weight gain (14.7 ± 1.1 mg/day), and apparent feed intake (0.67 ± 0.03 g of feed per stocked shrimp) were unaffected by dietary treatment. The highest gained yield (791 ± 52 and 776 ± 38 g/m3) and final BW (621 ± 7.2 and 632 ± 7.2 mg) were attained when FML was replaced for BSFLM at 50 and 75% with the lowest at 0% (726 ± 34 g/m3 and 598 ± 8.1 mg, respectively). Shrimp fed diets with 0 and 100% replacement of FML exhibited the highest feed conversion ratio (1.25 ± 0.04 and 1.24 ± 0.08) compared to those fed a diet with 50% (1.16 ± 0.06). At a price of USD 2.00/kg, BSFLM demonstrated a favorable ROI (return of investment) when compared to FML, irrespective of the replacement level. With 25 and 50% replacement, BSFLM remained cost-competitive up to 3.50 USD/kg. At 75% FML replacement, there were no significant differences in ROI with a price range of 2.00 up to 3.04 USD/kg. At full replacement, ROI dropped significantly at a BSFLM price of 2.50 USD/kg and beyond. It can be concluded that FML can be fully replaced for BSFLM in well-balanced nursery diets for P. vannamei. Although the full replacement of FML for BSFLM was successfully accomplished, the competitive ROI was sustained only when the price of BSFLM did not exceed 3.04 USD/kg at its dietary highest inclusion of 19.74%. Further research may be necessary to fine-tune cost-effective inclusion levels of BSFLM to optimize the economic outcomes while considering the fluctuating prices of FML.
Key Contribution: Black soldier fly larvae meal can effectively replace fish meal while ensuring cost-efficiency in shrimp nursery diets, given that careful consideration of dietary nutrient balance and price sensitivity is integrated to achieve optimal growth and economic performance.

1. Introduction

The use of insect meals in aquatic feeds has gained increased attention in recent years, driven by a greater volatility in supply and prices from conventional protein sources [1] alongside the pressing need to reduce carbon emissions and promote a circular economy [2]. In comparison to protein sources obtained from fisheries, agriculture, and animal husbandry, the utilization of insects as feed ingredients can comprehensively integrate the advantages linked with sustainability, nutritional value, and functionality [2,3]. Insects also have a short life cycle and exhibit high efficiency as food converters, demanding fewer resources during their production.
Numerous insects have been examined as potential feed ingredients for aquaculture species. Their nutrient value lies in their adequate levels of digestible protein, amino acids (AAs), lipids, and energy [2,3,4,5]. A study by Shin and Lee (2021) [6] with juvenile whiteleg shrimp, Penaeus vannamei, has shown that a full-fat black soldier fly, Hermetia illucens, larvae meal (BSFLM) contains crude protein (CP) and lipid content of 41.7 and 17.4% (%, dry matter basis), respectively. Authors have reported high apparent digestibility coefficients for protein (85.1 ± 5.58%, mean ± standard deviation), lipids (95.2 ± 2.43%), and energy (87.1 ± 6.08%). In shrimp feeds, the BSFLM has been the most extensively studied insect protein source. Its reported benefits have included partial replacement of fish meal [7,8,9,10,11,12,13], improved intestinal health [6,11], growth and feed efficiency [8], higher resistance to Vibrio sp. infection [6,8,9], and increased levels of digestive protease activity [12]. However, both the availability and prices of BSFLM are still a constraint for its widespread use as an ingredient in animal feeds [2] at times where it is considered uncompetitive [14]. Hence, its current utilization is expected to become more prevalent in specialty diets through the substitution of costly protein ingredients, such as fish meal (FML). The present study aimed at investigating the growth performance of post-larval P. vannamei fed nursery diets with a progressive replacement of FML for BSFLM. Additionally, a sensitive analysis over the price of BSFLM was carried out to determine the optimal level of FML replacement.

2. Materials and Methods

2.1. Experimental Design

The study consisted of a 42-day nursery culture carried out to evaluate shrimp growth performance throughout post-larval (PL) and early juvenile stages. Shrimp were fed on diets containing graded levels of a partially-defatted black soldier fly larvae meal (BSFLM). For the experimental phase, shrimp were raised from PL15 to over 600 mg body weight (BW) in 50 outdoor tanks of 1.50 m3 (1.70 m2 bottom area × 0.88 m height) under 1369 PLs/m3 (2053 ± 33 PLs/tank). Shrimp were fed five nursery diets with graded levels of BSFLM as a replacement for FML at 0, 25, 50, 75 and 100%. One diet without BSFLM containing 22.00% FML (as-is basis) acted as the control. This initial set-up allowed 10 replicate tanks per feeding treatment. At harvest, shrimp survival, feed efficiency, and growth performance from each tank were determined.

2.2. Rearing System and Water Preparation

The study employed a rearing system comprising 50 independent outdoor tanks, each with a capacity of 1.5 m3. These tanks, constructed from blue polypropylene, were equipped with their water inlet, outlet, and aeration systems. Tanks were sheltered under a roof, but subjected to a natural light cycle (12 h light starting at 05:45 a.m.). The system operated under a minimum water exchange condition, without any water interexchange between rearing tanks over the complete rearing cycle. Weekly water exchange was carried out using sand-filtered seawater mixed with groundwater. Continuous aeration was provided by an air diffusing system made with a 0.5 m aeration tube that rested near the bottom of each tank, but opposite to the feed delivery point.
Prior to water preparation, thorough cleaning and disinfection procedures were conducted on the rearing tanks, aeration lines, tubes, and feeding trays. Internal tank walls underwent high-pressure jet cleaning with manual removal of water residues. Sulfuric acid, diluted at a ratio of 1 L per 50 L of water, was applied to tank surfaces and plumbing, followed by a 24 h resting period. Subsequently, a peracetic acid-based disinfectant, diluted to 1 L per 500 L of water, was applied. After drying, the tanks were filled with sand-filtered brackish water (15 g/L salinity), achieved by mixing groundwater (5 g/L salinity) with pre-disinfected seawater (30 g/L salinity), treated with 30 ppm active sodium hypochlorite.
Water fertilization was carried out using a commercial probiotic (BM-Pro, Biotrends Soluções Tecnológicas Ltda., Eusébio, Brazil) composed of a consortium of microorganisms (Bacillus spp., Lactobacillus spp. and Saccharomyces cerevisiae). A mixture containing 20 g of the probiotic, 3 L of sugar-cane molasses, 5 kg of wheat bran, and 1 L of tap water were allowed to ferment in a bucket with aeration over a 24 h period. The mixture was sieved to remove solids and applied to each tank at 50 g/m3 once daily over a seven-day period. During water preparation, strong aeration was applied in rearing tanks for water mixing.

2.3. BSFLM, Fish Meal, and Diet Formulation, Manufacturing, and Chemical Analysis

A commercial partially-defatted BSFLM (Hermetia illucens) was obtained from BSF Nutrição e Biotecnologia S.A.—CYNS (Piracicaba, Brazil). Fish meal (FML) was produced from the byproducts obtained during processing of farmed Atlantic salmon (Pesquera Pacific-Star, Puerto Montt, Chile). Crude protein (CP) and total lipid content in these meals reached 57.77% and 67.08%, and 7.58% and 10.88%, respectively (Table 1). The total amino acid (AA) composition of BSFLM was lower compared to FML. BSFLM also carried lower levels of essential AAs than FML, including methionine (Met, 0.92 versus 1.69%, as-is basis), lysine (Lys, 3.77 vs. 4.47%), and Met plus cysteine (M + C, 1.38 vs. 2.35%, respectively).
Five diets were formulated to progressively reduce the inclusion of FML by BSFLM (Table 2). The control diet (BSF0%) contained 22.00% FML with no BSFLM. The other diets replaced FML with BSFLM at rates of 25, 50, 75, and 100%. This led to varying proportions of FML and BSFLM in each diet: 16.50% and 6.33% (BSF25%), 11.00% and 13.04% (BSF50%), 5.50% and 19.74% (BSF75%), and 0% and 26.46% (BSF100%).
Diets were prepared in a laboratory feed mill facility following the procedure outlined by Nunes et al. (2021) [15]. Raw materials were ground to less than 300 microns, and ingredients were precisely weighed using an electronic scale. Micro ingredients were mixed with a sample of dried macro ingredients, and the blend was combined with other macro ingredients to form a feed dough. The dough was extruded into small, moist chunks using a pellet mill adjusted to a maximum temperature of 95 °C. Pellets of 2.4 mm diameter by 5 mm length were produced and dried at 60 °C in a convection oven. Steam-cooking followed by final drying achieved a consistent moisture content of 8–10%. Halogen rapid moisture analysis ensured moisture consistency during drying. Post-manufacturing, pellets were ground into crumbled particles, and a mechanical shaker with sieves of various micron sizes was used to separate particles. Two particle size ranges were employed: a mix of particles of 300 and 425 microns, and a mix of particles of 600 and 850 microns.
Diets were chemically analyzed [16]. Dry matter (DM) was determined by drying samples in a convection oven for 24 h at 105 °C. The Dumas combustion method was applied to analyze CP (AOAC 968.06), while total lipids were determined through acid hydrolysis (AOAC 954.02). Ash content was determined by burning samples in a muffle furnace at 600 °C for 2 h (AOAC 942.05) and crude fiber by enzymatic–gravimetric determination (AOAC 992.16). Amino acid (AA) and fatty acid (FA) compositions were determined using high-performance liquid chromatography [17] and high-resolution gas chromatography (GC) with a flame ionization detection fitted with a capillary GC column [18], respectively.
Diets reached a mean (± standard deviation, sd) CP and total lipid content of 39.66 ± 0.72 and 8.36 ± 0.30% (% of the diet, as-is), respectively. As the dietary inclusion of BSFLM increased, diets were supplemented with DL-Methionine, L-Lysine, and L-Threonine to reach a corresponding total dietary Met (M + C), Lys, and threonine (Thr) content of 0.92 ± 0.07 (1.45 ± 0.08%, as-is basis), 2.33 ± 0.09, and 1.64 ± 0.10%, respectively (Table 3). The dietary fatty acid profile changed as FML was replaced by BSFLM (Table 4) despite increased inclusion levels of salmon oil. The higher the dietary inclusion of BSFLM, the lower were the levels of omega-3 (n-3), polyunsaturated (PUFA), and highly unsaturated fatty acids (HUFA). However, the levels of eicosapentaenoic (EPA, 20:5n-3) and docosahexaenoic (DHA, 22:6n-3) acids were kept within a range of 0.16–0.21 and 0.19–0.31% (% of the diet, as-is), respectively. There was an increasing trend in the dietary levels of saturated fatty acids (SFA) with higher inclusions of BSFLM, from 2.00 (BSF0%) up to 2.62% (BSF100%).

2.4. Shrimp Post-Larvae

The shrimp species used in this trial was the Pacific whiteleg shrimp, P. vannamei, purchased as post-larvae (PL) from a commercial hatchery (Aquatec Aquacultura Ltda., Canguaretama, Brazil), 469 km from the lab. A total of 132,000 PLs at the age of PL10 (217 PLs per gram) were transported to the lab in twelve 15 L plastic bags (733 PLs/L) and individually stored in cardboard boxes lined with Styrofoam. Plastic bags contained seawater at 30 g/L salinity and 25 °C temperature, saturated with pure dissolved oxygen.
Upon arrival, shrimp were acclimated to temperature, pH, and salinity and stocked in six nursery tanks of 3000 L each. A shrimp sample containing approximately 1000 animals was collected for RT-PCR (real-time polymerase chain reaction) to screen for the following viruses, WSS (white spot syndrome), infectious hypodermal and hematopoietic necrosis (IHHN), and infectious myonecrosis (IMN). A five-day quarantine period was allowed until diagnostic results were available, which indicated that shrimp were free from all selected viruses. For stocking in the rearing tanks, shrimp were counted using a portable smart device for rapid inventory assessment (XperCount2, XpertSea, Québec, QC, Canada). PLs were captured with a bag net from the quarantine tanks and transferred to the XperCount2 bucket at a total quantity near 1000 shrimp, requiring two individuals counted per rearing tank. After each counting, total PL biomass was determined by first removing excess water and then weighing shrimp in bulk using an electronic 0.001 g resolution scale. Subsequently, shrimp were transferred to their respective rearing tank. At stocking, a total of 102,647 PLs at the age of PL15 weighed on average 2.7 ± 0.2 mg BW (body weight). They were stocked under 1369 PLs/m3 (2053 ± 33 PLs/tank).

2.5. Feeding and Water Quality

Diets were delivered in rearing tanks daily, including Sundays. Shrimp were fed eight times per day, between 08:00 a.m. and 04:00 p.m., exclusively in circular feeding trays (placed at one unit per tank, 19 cm in diameter). Starting on the 12th day of rearing and then on a weekly basis (days 19, 26, 34), shrimp were sampled and weighed using a 0.001 g precision scale. During weighing, shrimp were first collected, blotted dry with absorbent paper, counted individually, and then weighed in bulk. Five subsamples of 10 shrimp each per tank were weighed to determine their mean BW and were then returned to their respective tank. Until the next weight check, rations increased assuming this mean daily weight gain for each tank, maintaining a consistent daily drop in survival. Meals were adjusted daily for each rearing tank assuming an estimated daily drop in shrimp survival and an increase in weight gain across all diets (Table 5, [15]). Dietary particle size changed according to shrimp BW and day of nursery. The particle size range between 300 and 425 microns was delivered from the day of stocking to the 23rd day of nursery (total of 37.7% of all feed delivered); particle range between 600 and 850 microns was delivered between the 20th day of nursery until shrimp harvest (total of 62.3% of all feed). A three-day transition was allowed when introducing the second particle size range.
Water quality parameters (i.e., pH, temperature, and salinity) were measured once daily starting at 09:00 a.m. in all rearing tanks. Average pH reached 7.9 ± 0.2 (n = 1600), with minimum and maximum values ranging from 7.1 and 8.5, respectively. Salinity was kept consistent at 19.2 ± 1.1 g/L (n = 1600). Temperature was high, with an average of 27.7 ± 0.7 °C (n = 1600). Dissolved oxygen was kept saturated over the complete rearing period. Water alkalinity was adjusted above 160 mg/L of CaCO3 through applications of sodium bicarbonate. Water was exchanged from the tank bottom on a weekly basis starting at the end of the first week after shrimp stocking. A total of 8% of total water volume was drained and replaced by filtered and chemically disinfected seawater. To control nitrogen compounds, a 24 h fermented mix of a commercial probiotic (20 g), sugar-cane molasses (40 mL), and tap water was applied in each tank daily at 10 mL/m3.

2.6. Shrimp Growth Performance

Shrimp harvest took place after 42 days of rearing. Initially, water from each tank was drained slowly while a batch with 100 shrimp per rearing tank was captured and weighed individually to a 0.001 g precision. In this case, shrimp were blotted dry for individual weighing. Finally, the tank was completely drained and the remaining shrimp were captured and weighed in bulk on an electronic scale. Final shrimp survival (%) from each tank was calculated by dividing the total shrimp biomass from each tank by the shrimp mean BW obtained from weighing 100 shrimp individually from the respective tank. The daily weight gain (DWG, mg/day) was determined by the formula: DWG = [(BWf − BWi)/t] × 7, where BWi = wet shrimp BW (mg) at stocking, BWf = final shrimp BW at harvest, and t = number of days in culture. The gain in shrimp yield (YIE, g of gained shrimp biomass/m3) was determined as YIE = (BIOf − BIOi) ÷ tank volume (m3), where BIOi = initial shrimp biomass (g) per tank, BIOf = final shrimp biomass (g) per tank, and tank volume = 1.5 m3. FCR was calculated by dividing the total inputs of feed (g, as-is basis) delivered per tank during the entire rearing period by the total gained shrimp biomass per tank (g, as-is). The apparent feed intake (AFI, g of feed delivered divided by the number of stocked shrimp) was calculated by dividing the total amount of feed delivered (g) by the number of stocked shrimp.

2.7. Price Sensitivity Analysis

The cost of formulation of each individual diet was first calculated by using international FOB (Free on Board) market prices of each ingredient and feed additive. The price of FML (1.86 USD/kg) was based on the Peruvian steam-dried anchovy meal with 67% CP (source: https://hammersmithltd.blogspot.com/, accessed on 10 June 2023). For simulation purposes, a baseline price of 2.00 USD/kg for the BSFLM was considered with gradual 15% increments until 3.50 USD/kg was reached. To carry the price sensitivity analysis for each nursery diet, the following assumptions were made: (1) grower feed price = USD 1.00/kg; (2) feed conversion ratio (FCR) at grow-out = 1.5; (3) final shrimp BW at grow-out = 23.5 g, and; (4) final shrimp survival at grow-out = 75%. These parameters were fixed across all diets. Subsequently, it was assumed that the initial stocked population in grow-out equaled 1,000,000 shrimp multiplied by the final shrimp survival achieved in each tank during nursery. Therefore, final shrimp production in the grow-out phase was the equivalent to the population available for stocking after nursery phase multiplied by the fixed final BW and final survival in grow-out. The farm gate price for head-on shell-on (HOSO) shrimp was estimated at USD 5.00/kg.
Feed production cost (USD) was determined by multiplying the feed price (USD/kg) by the FCR and the total shrimp production in both nursery and grow-out phases. Feed accounts for 40% of the total shrimp production costs (USD/kg) in grow-out. Thus, the remainder production costs were attributed to other variables (PLs, amendments, sediment removal, electricity, fuel, labor) and fixed costs [19]. The gross revenue (USD/kg) was determined by multiplying the farm gate shrimp price (USD/kg) with the gained shrimp yield (kg) from each tank. The gross profit (USD) was given as the gross revenue subtracted by the total production cost. The return on investment (ROI, %) was calculated by subtracting the gross revenue by the total production cost and then dividing the result by the total production cost multiplied by 100.

2.8. Statistical Analysis
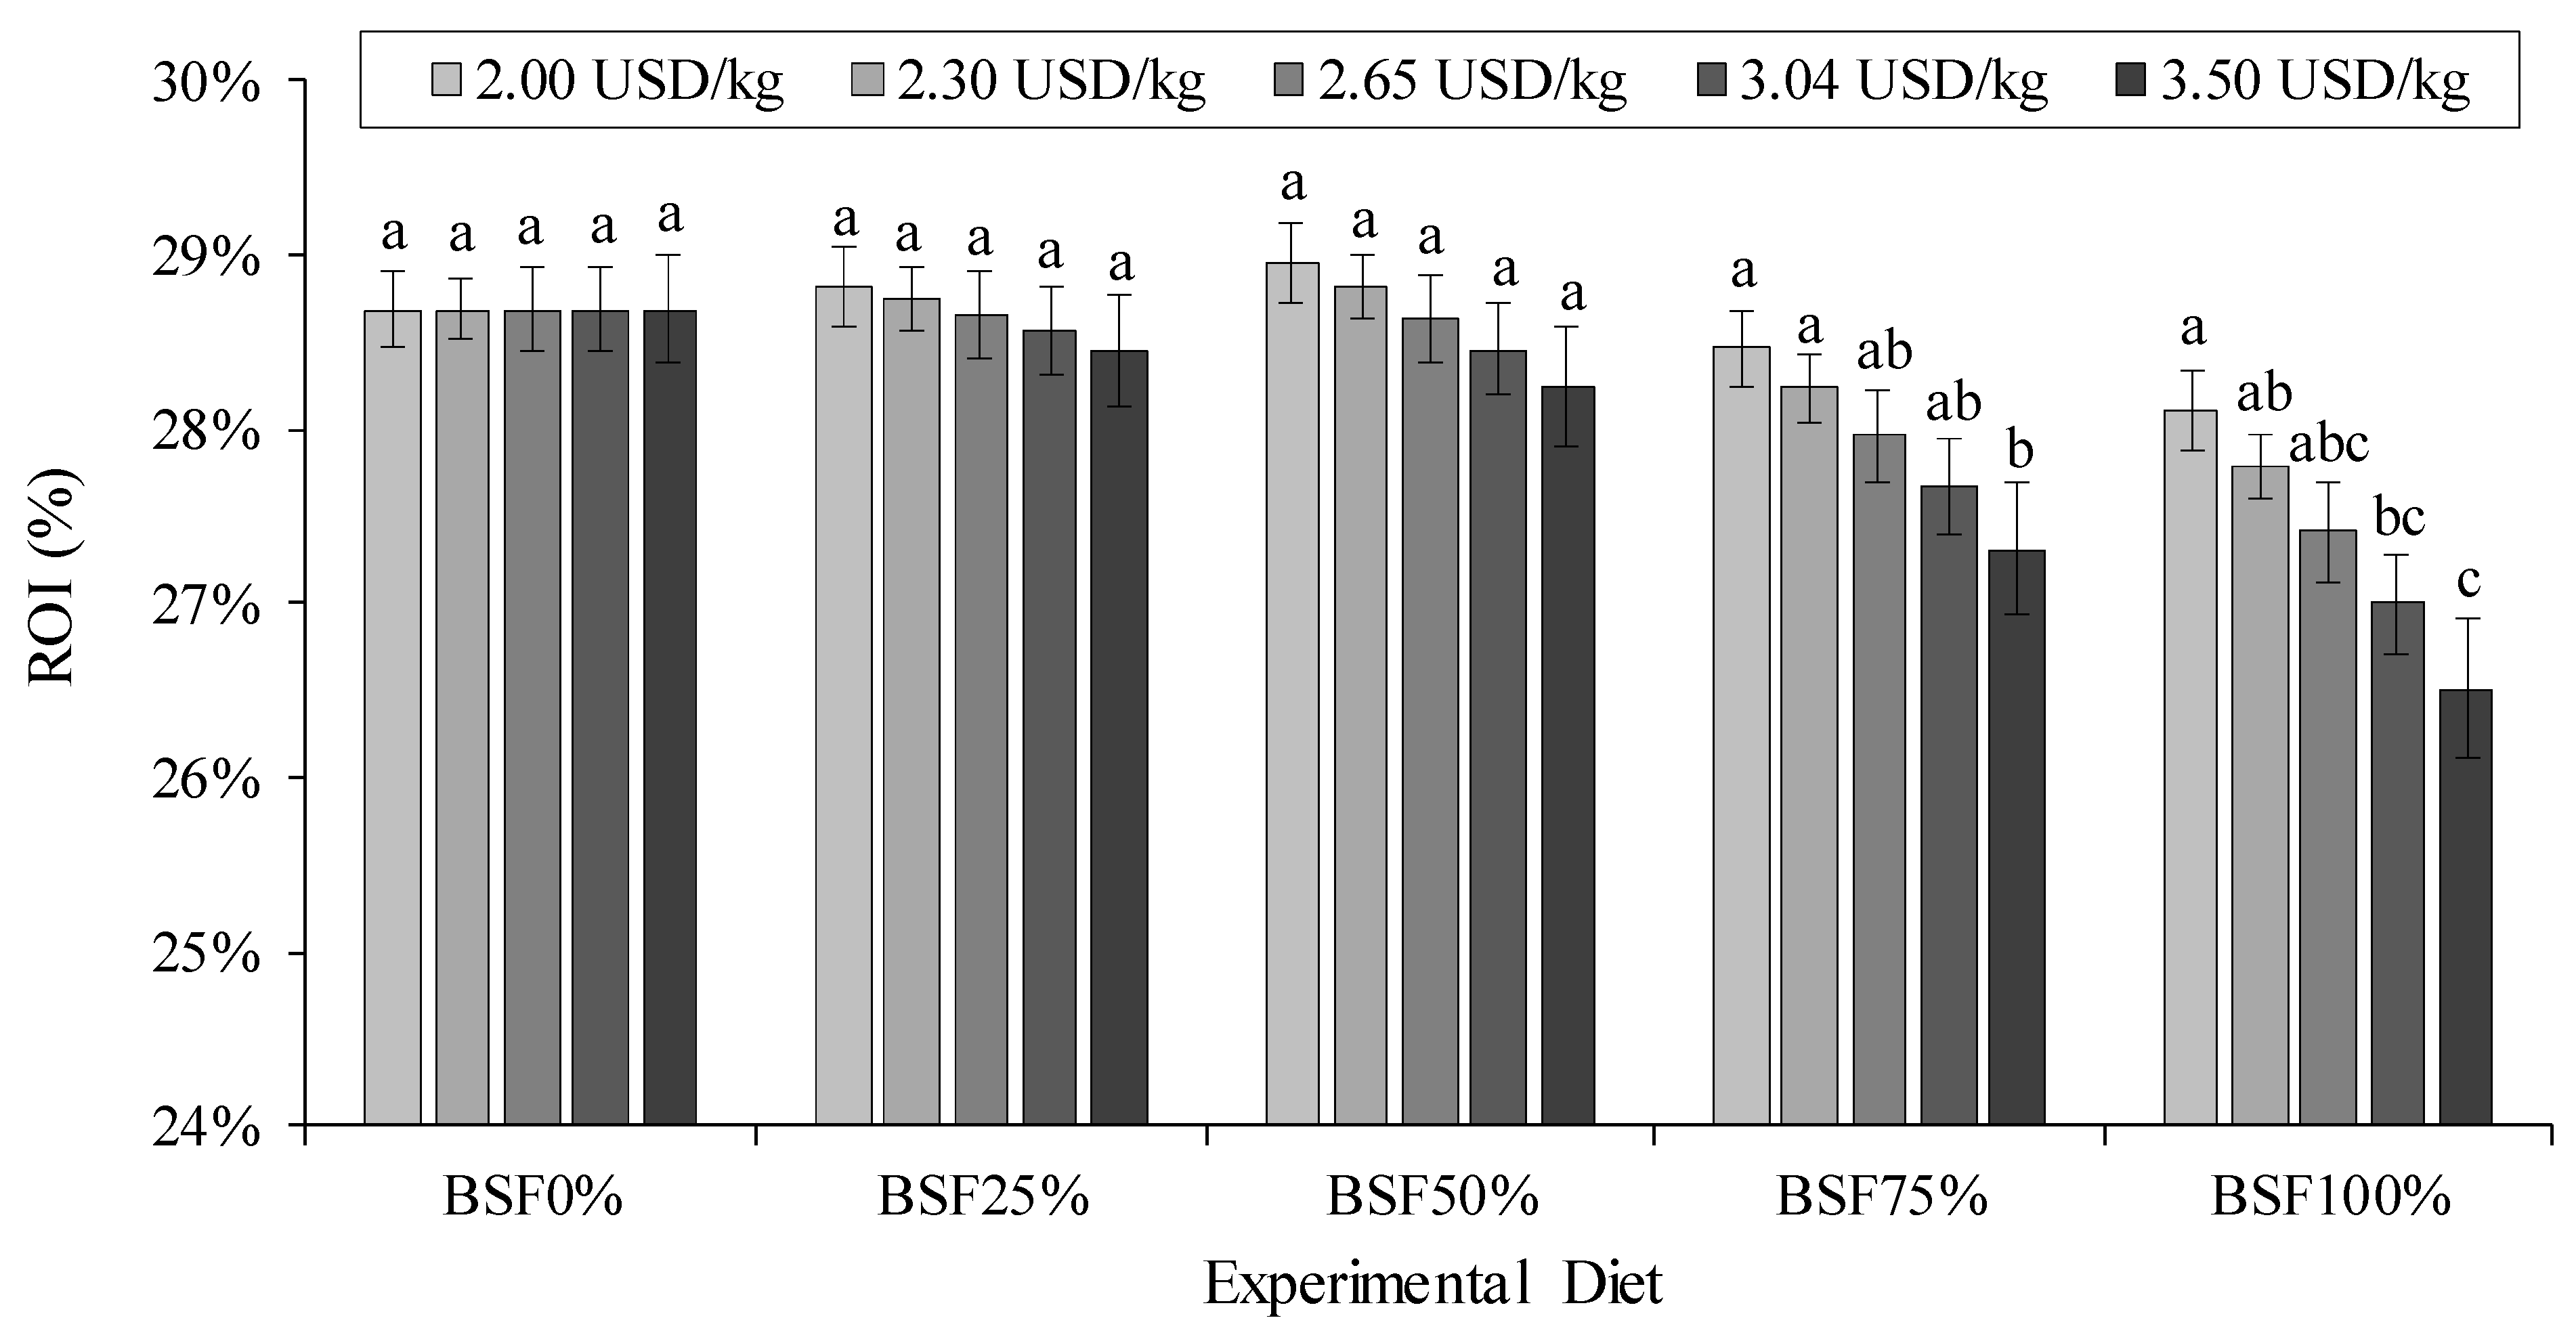
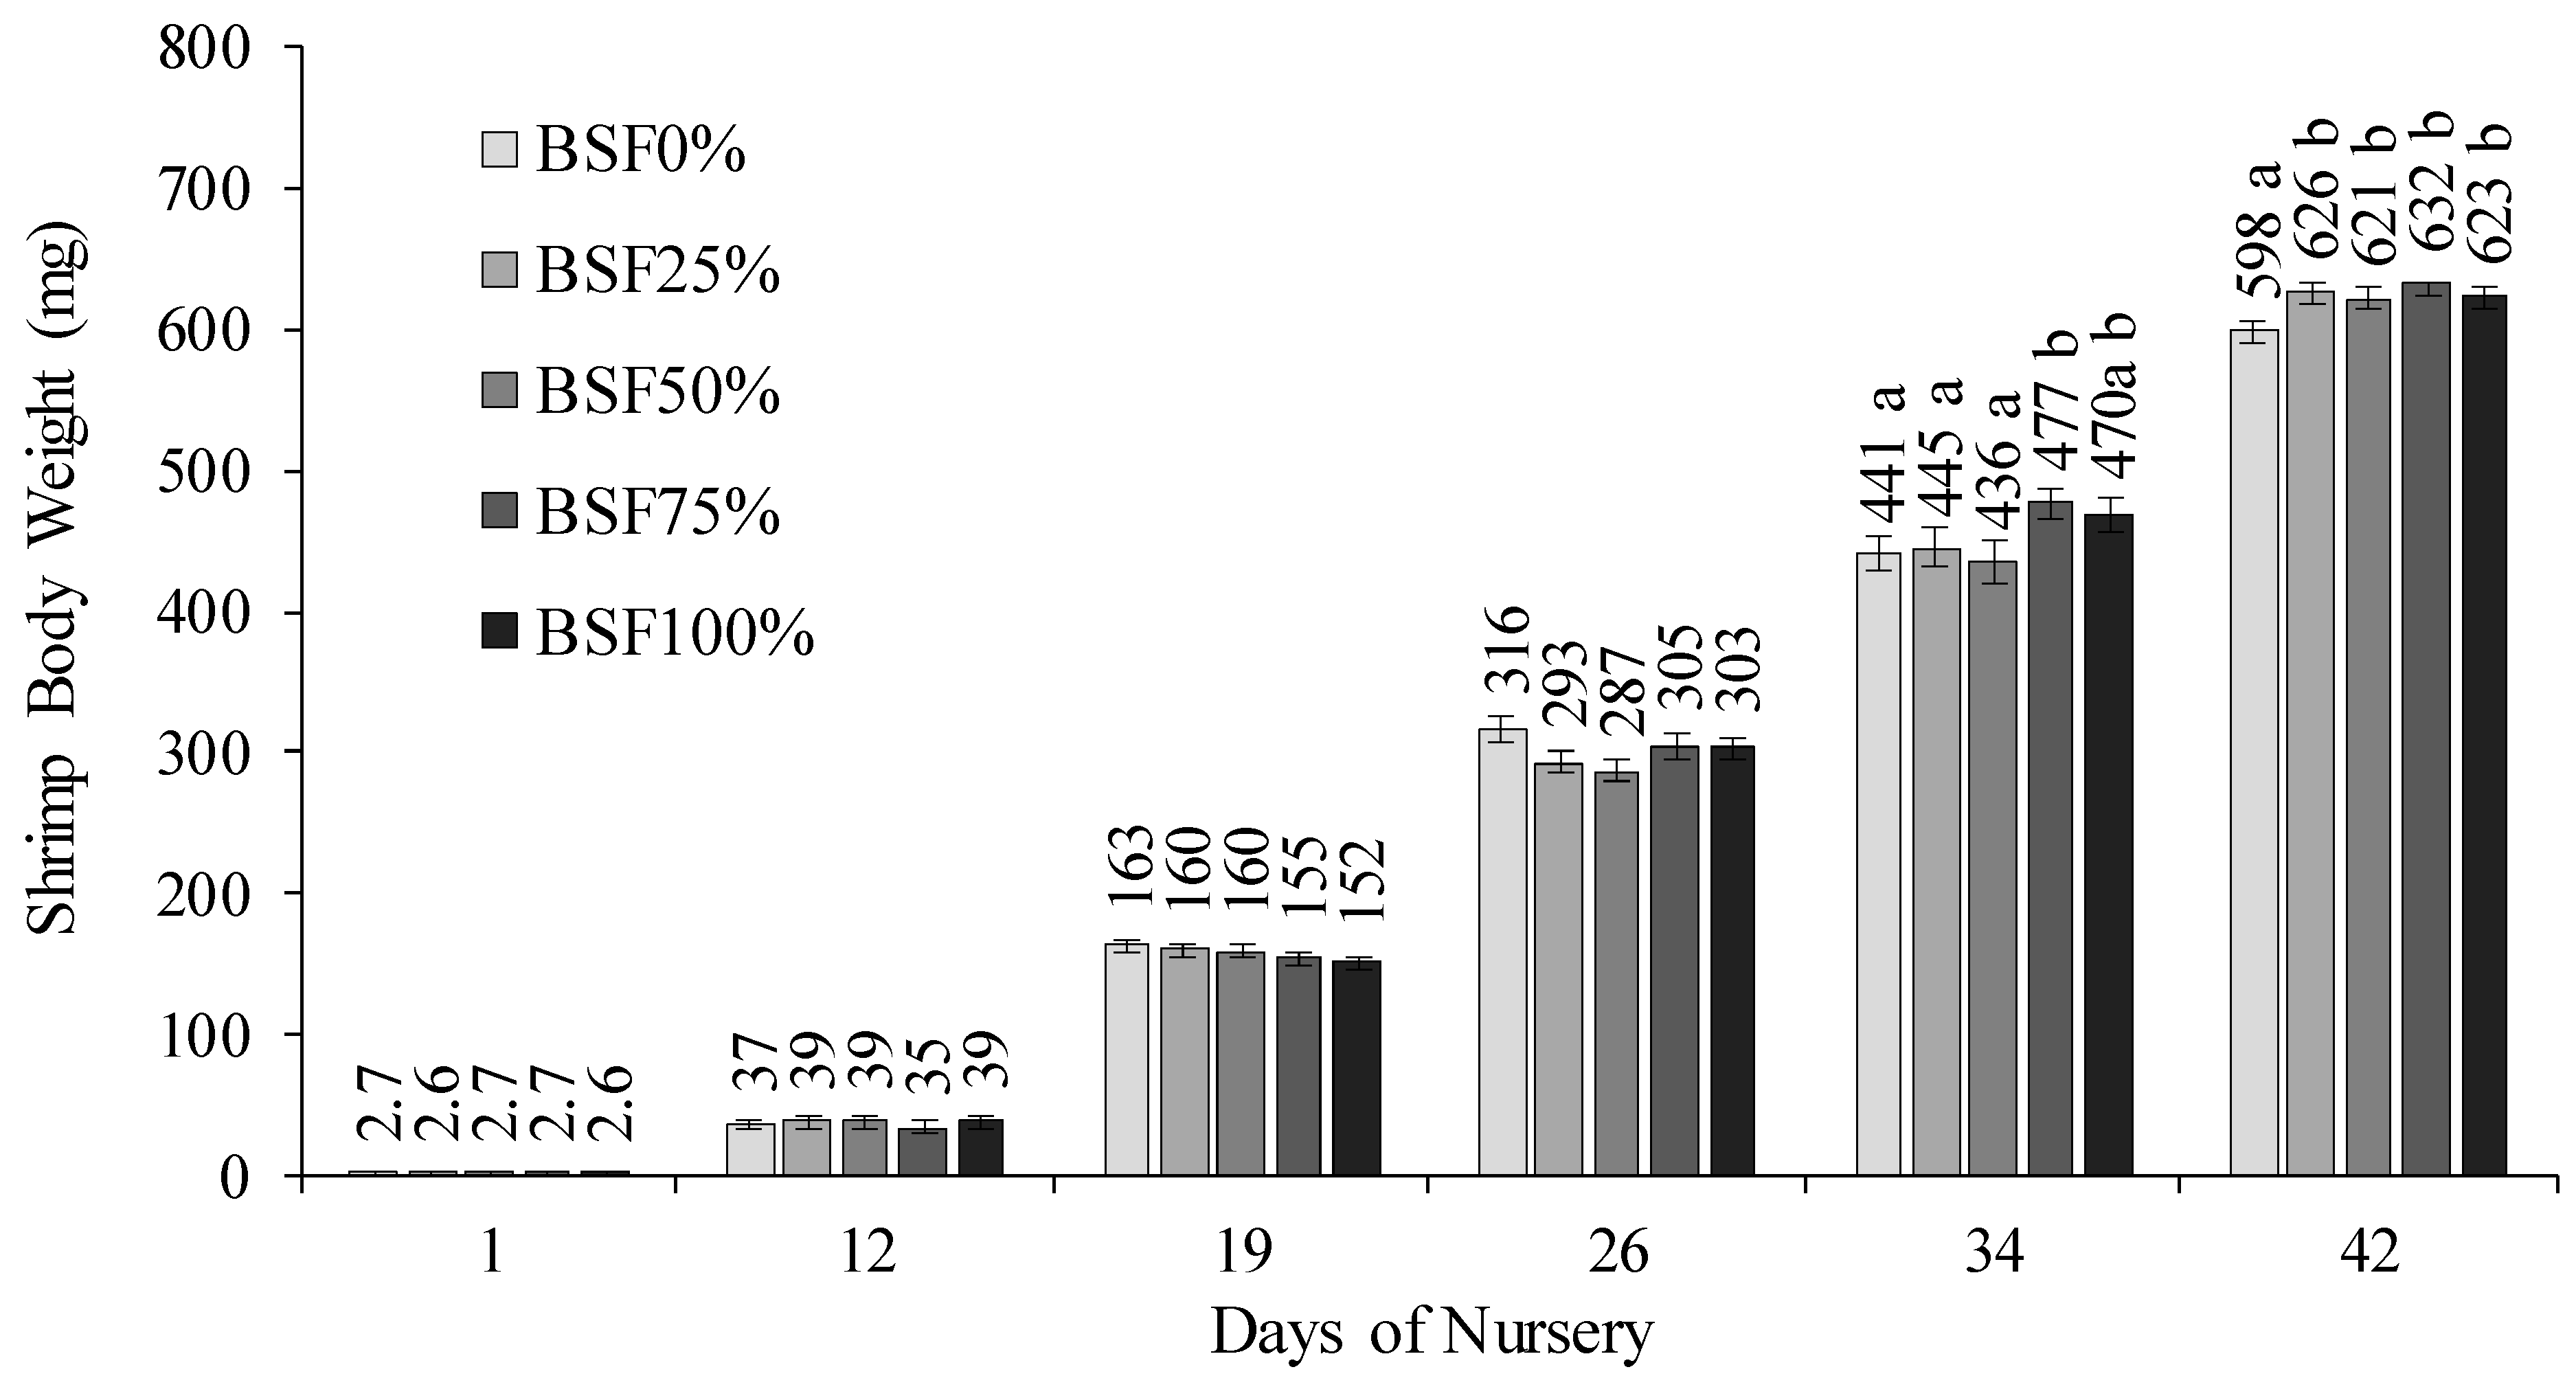
The effect of FML replacement over water quality, shrimp performance, and ROI was analyzed through one-way ANOVA. When significant differences were detected, they were compared two-by-two with the Duncan’s test. The significant level of 5% was set in all statistical analyses. The statistical package IBM® SPSS® Statistics 23.0 (SPSS Inc., Chicago, IL, USA) was used.

3. Results

Final shrimp survival was high and unaffected by dietary treatment (p > 0.05, Table 6). From a total of 50 rearing tanks used in the study, two were excluded from statistical analyses due to out-of-range survival (below 50%). The average final survival of the remaining tanks reached 90.5 ± 7.6%. Similarly, DWG, and AFI (Apparent Feed Intake), reached an average of 14.7 ± 1.1 mg/day, and 0.67 ± 0.03 g of feed per stocked shrimp, respectively. These parameters were not statistically affected by dietary treatment (p > 0.05).
However, the replacement of FML for BSFLM had a significant impact on both gained yield and FCR (p < 0.05). The highest gained yield was attained when FML was replaced for BSFLM at 50% and 75% levels (diets BSF50% and BSF75%). Conversely, the lowest gained yield was observed when FML was included at its highest dietary inclusion, i.e., 22.00%, without any BSFLM (diet BSF0%). Notably, fully replacing FML for BSFLM did not adversely affect the gained yield (p > 0.05). There were no significant differences in gained yield between shrimp fed diets BSF0% and BSF100%. Shrimp fed these two diets exhibited the highest FCRs (1.25 ± 0.04 and 1.24 ± 0.08) compared to those fed diet BSF50% (1.16 ± 0.06). No differences in FCR were found among the remaining diets or between diet BSF100% (p < 0.05).
Throughout the nursery period, shrimp demonstrated a progressive growth (Figure 1). Statistical differences in shrimp BW among dietary treatments were observed a week prior to harvest, on the 34th day of nursery (p < 0.05). By this stage, shrimp had surpassed 430 mg in BW. Shrimp fed diets BSF75% and BSF100% displayed the highest BWs in comparison to those fed remaining diets. At harvest, the lowest BW was recorded for shrimp fed the BSF0% diet (598 ± 8.1 mg). In contrast, shrimp fed diets containing BSFLM, regardless of the replacement level, achieved higher BWs ranging from 621 ± 7.2 mg (BSF50%) to 632 ± 7.2 mg (BSF75%).
The return on investment (ROI) was influenced by the various price scenarios for BSFLM and the dietary inclusion adopted (Figure 2). At a price of USD 2.00/kg, BSFLM demonstrated a favorable ROI when compared to FML, irrespective of the chosen replacement level and dietary inclusion. However, as the price of BSFLM increased to 2.50, 3.00, and 3.50 USD/kg, ROI progressively deteriorated with higher levels of FML replacement. With the 25 and 50% replacements, BSFLM remained cost-competitive at all simulated prices. At 75% FML replacement, there was a decline in ROI with higher BSFLM prices. However, there were no statistical differences in ROI with a price range of 2.00 up to 3.04 USD/kg. At full replacement, ROI dropped significantly at a BSFLM price of 2.50 USD/kg and beyond. In general, there was a significant drop in ROI when replacement levels of 75 and 100% were adopted, corresponding to dietary inclusions of BSFLM at 19.74% (BSF75%) and 26.46% (BSF100%).

4. Discussion

Shrimp performance in the present study was consistent with other work carried out under similar rearing conditions. Nunes et al. (2021) [15] reared post-larval P. vannamei of 3.6–2.5 mg BW in an outdoor and indoor tank system under 2371–2504 PLs/m3, respectively. After 52–41 days of nursery, shrimp reached an average of 84.0–91.8% final survival, 1568–1611 g/m3 gained yield, 14.2–14.2 mg daily growth, and 1.70–0.89 FCR, respectively. In their work, shrimp final BW varied according to the diet, from 683 to 775 mg and from 567 to 629 mg in the outdoor and indoor tanks, respectively. Our results demonstrated that it is possible to fully replace FML for BSFLM in nursery diets for post-larval P. vannamei with no detriment to shrimp performance. The highest dietary inclusion level obtained for BSFLM was 26.46% (% of the diet, as-is) which is equivalent to a full replacement of FML. This contrasts with other studies which have only reported partial replacement of FML for BSFLM. For example, Chen et al. (2021) [7] evaluated the replacement of brown FML (68.21% CP and 9.00% lipid) for BSFLM at 10, 20, and 30%. This corresponded to a dietary inclusion of FML and BSFLM of 25.0 and 0%, 22.5 and 4.75%, 20.0 and 9.5%, and 17.5 and 14.25%, respectively. Diets were formulated to contain 42.30 ± 0.64% CP and 7.31 ± 0.34% lipid. Juvenile P. vannamei (0.88 g initial BW) were reared for seven weeks in 12 tanks of 300 L at 40 shrimp/tank. They reported a significant drop in final shrimp BW (from 7.76 ± 0.09 to 7.06 ± 0.16 g) and weight gain (776.4 ± 10.3 to 698.4 ± 19.0%) when shrimp were fed diets with 0 and 14.25% BSFLM, respectively. At 30% FML replacement, they reported intestinal cell apoptosis and degeneration. Unlike the research conducted by Chen et al. (2021) [7], our study did not identify any adverse impact on shrimp performance that could indicate potential harm to shrimp health. This could be due to the nutrient profile of the BSFLM which may alter depending on the type of residues they were raised on.
In our study, the favorable outcomes regarding the replacement of FML were probably influenced by an appropriate supplementation with crystalline AAs, a sufficient provision of n-3 fatty acids, and the inclusion of feed attractants in all diets. The importance of the dietary supplementation of these nutrients and feed attractants when FML is challenged has been demonstrated in several other studies with penaeid shrimp [1,20]. As BSFLM inherently possesses lower levels of these nutrients compared to FML [21], achieving full FML replacement necessitates the formulation of a well-balanced diet [1,21]. Cummins et al. (2017) [8] conducted a dose–response study with juvenile P. vannamei, replacing menhaden meal (FML) with 66.02% CP for BSFLM with 52.03% CP. They formulated six different diets, with protein replacement of FML ranging from zero to 100%. While maintaining isonitrogenous diets, there was a progressive drop in dietary levels of Lys and Met as FML was replaced, from 2.74% to 2.40% and from 0.79% to 0.53%, respectively. The authors achieved a maximum replacement of FML for BSFLM at only 20%, equivalent to a dietary inclusion of 10.00% FML and 21.20% BSFLM. The authors acknowledged that the decrease in shrimp performance observed as BSFLM content increased was likely a result of rising deficiencies in essential AAs and an increasing imbalance between essential and nonessential AAs. Thus, ensuring these key nutrients are appropriately supplemented in the diet appears as a key element to achieve full FML replacement for BSFLM.
Similarly, Wang et al. (2021) [11] evaluated the replacement of FML for BSFLM in diets for juvenile P. vannamei (1.1 g initial BW) over a 56-day culture period. The authors dropped the dietary inclusion of FML from 25.0% to zero by progressively increasing the dietary levels of a defatted BSFLM up to 31.32%. Their results demonstrated that up to 60% of FML could be replaced by BSFLM without any adverse effects to shrimp performance. In their work, while diets were properly supplemented with Met and Lys, fish oil levels reduced with higher inclusions of BSFLM. This caused a significant reduction in the dietary levels of EPA and DHA as higher inclusions of BSFLM were adopted. In another study, He, Liu, et al. (2022) [13] have found that up to 50% of a commercial shrimp diet (42% CP and 11% moisture) for juvenile P. vannamei (0.22 g initial BW) could be successfully replaced by fresh BSFL (17.8% CP and 69.3% moisture) without negative effects on growth performance, digestive and antioxidant enzyme activity, and intestinal histology. In summary, complete replacement of FML for BSFLM is possible if diets are properly balanced for key nutrients, such as essential AAs and n-3 fatty acids.
In our study, we have observed a growth response with higher dietary inclusion levels of BSFLM, even in diets deprived of FML. In terms of protein digestibility, both BSFLM and FML exhibit similar characteristics. Apparent protein digestibility coefficient for BSFLM has been reported at 85.1 ± 5.58% [6] in comparison to 78.9% [22] and 85.8% [23] for the salmon meal (FML) used in the present study. Our diets were formulated to contain nearly the same AA content, but an increase was found in the total dietary Met (Met plus cysteine) content with a progressive replacement of FML. Total dietary levels increased from 0.85% (1.39%) in the CTL diet to a high of 1.03% (1.56%) in the diet with 100% replacement of FML. On the other hand, the CTL diet contained slightly higher levels of n-3 fatty acids and HUFA than the diets containing BSFLM. Hence, the growth enhancement effect recorded in shrimp fed BSFLM may not have been associated with the dietary nutrient levels which were likely above shrimp requirements.
A similar enhancement in shrimp growth performance with the dietary inclusion of BSFLM has been reported by other authors. Richardson et al. (2021) [9] investigated the use of BSFLM for post-larval P. vannamei (PL41, 0.1 g initial BW). Four diets were formulated to contain a high quality FML (70% CP) at 15.00, 10.50, 7.50, and 4.50% with BSFLM at 0, 4.50, 7.50, and 10.50% (% of the diet, as-is), respectively. Shrimp were raised for 28 days in 12 plastic tanks of 290 L under 100 animals/tank (20 g/L water salinity). Authors reported that all diets with BSFLM improved weight gain, FCR and specific growth rate (SGR) compared to the diet with the highest FML level. Additionally, they reported that SGR was significantly improved from the dietary inclusion of 4.5%, whilst FCR was significantly improved at 7.5%. Shin and Lee (2021) [6] also identified BSFLM as one of the top two options for improving the growth performance of juvenile P. vannamei (0.17 and 11.1 g initial and final BW respectively) among seven insect meals. Shrimp were fed 38% CP diets for 65 days in which tuna meal was reduced from 27.0% to 17.0% and the insect meal included at 10.0%.
We have found that the ROI for farming shrimp until 23.5 g can be impacted by the price and dietary inclusion of BSFLM in nursery diets. As the price of BSFLM rises along with its inclusion level, there is a progressive decrease in ROI. Nonetheless, a noticeable reduction in ROI occurred only when replacing more than 75% of FML, but this occurred when the price of BSFLM surpassed 3.04 USD/kg. At 100% FML replacement, a price of 2.65 USD/kg for the BSFLM was still advantageous. It is important to note that these economic simulations focused solely on the impact of shrimp survival and FCR during the nursery phase in response to dietary treatment. Shrimp BW at the end of the nursery phase also plays a crucial role in subsequent shrimp performance. For example, initiating the grow-out phase with larger shrimp can lead to shorter production cycles, early harvest, reduced operating costs, and increased annual yield [24]. In our simulations, the operating costs associated with the use of nursery diets accounted for a small portion of the total feed costs to produce a 23.5 g shrimp, ranging from 3.8 to 4.5% depending on the diet formulation. This is attributed to the minimal feed quantities used in the early stages of shrimp culture. The nursery phase allows for a greater control of feed inputs due to more compact farming areas resulting in lower FCRs compared to grow-out.

5. Conclusions

Based on the findings from the present study, it can be concluded that FML can be fully replaced for BSFLM in well-balanced nursery diets for P. vannamei (between 2.7 and 600 mg). This corresponds to a dietary inclusion level of 26.46% BSFLM (% of the diet, as-is). While the full replacement of FML for BSFLM was successfully accomplished, it should be noted that the competitive return on investment (ROI) was sustained only when the maximum price of BSFLM did not exceed 3.04 USD/kg. This price level corresponds to a maximum dietary inclusion of 19.74% or a 75% replacement of FML. Further research may be necessary to fine-tune cost-effective inclusion levels of BSFLM to optimize the economic outcomes while considering the fluctuating prices of FML.

Author Contributions

Conceptualization, A.J.P.N., J.L.P. and J.P.S.; Data curation, A.J.P.N. and J.S.L.; Funding acquisition, H.Y., J.P.S. and N.M.; Investigation, A.J.P.N. and J.S.L.; Project administration, A.J.P.N., J.P.S., N.M. and J.S.L.; Resources, H.Y., J.P.S., J.L.P., N.M. and J.S.L.; Supervision, J.P.S.; Writing—original draft, A.J.P.N. and J.S.L.; Writing—review & editing, A.J.P.N., H.Y., J.P.S., J.L.P. and N.M. All authors have read and agreed to the published version of the manuscript.

Funding

The Brazilian National Council of Technological and Scientific Development (CNPq, Brasilia, Brazil) provided financial support for the first author (CNPq/MCTI, PQ# 306144/2020-4). Sumitomo Corporation do Brasil S.A. provided funding (FCPC project #3863) for acquiring raw materials for manufacturing experimental diets, shrimp post-larvae, and running feed chemical analyses described in this manuscript.

Institutional Review Board Statement

Ethical review and approval were waived for this study, since shrimp do not fall under phylum Chordata and subphylum Vertebrata which require ethical approval for research activities according to the Brazilian Federal Law No. 11794 of 8 October 2008 (http://www.planalto.gov.br/ccivil_03/_ato2007-2010/2008/lei/l11794.htm, accessed on 18 September 2023) and Brazilian Federal Decree No. 6899 of 15 July 2009 (http://www.planalto.gov.br/ccivil_03/_ato2007-2010/2009/decreto/d6899.htm, accessed on 18 September 2023). All rearing procedures were performed in compliance with relevant local laws and institutional guidelines, including those related to animal welfare. All applicable international, national, and institutional guidelines for the care and use of animals were followed by the authors.

Informed Consent Statement

Not applicable.

Data Availability Statement

The data that support the findings of this study are available from the corresponding author upon reasonable request.

Conflicts of Interest

Sumitomo Corporation do Brasil (São Paulo, Brazil) funded this study. This did not alter, influence, or affect the development of the study, including study design, sampling, analysis of results, interpretation of data, or decision for publication. Authors declare no other conflict of interest.

References

  1. Nunes, A.J.P.; Dalen, L.L.; Leonardi, G.; Burri, L. Developing sustainable, cost-effective and high-performance shrimp feed formulations containing low fish meal levels. Aquac. Rep. 2022, 27, 101422. [Google Scholar] [CrossRef]
  2. Sánchez-Muros, M.J.; Renteria, P.; Vizcaino, A.; Barroso, F.G. Innovative protein sources in shrimp (Litopenaeus vannamei) feeding. Rev. Aquac. 2020, 12, 186–203. [Google Scholar] [CrossRef]
  3. Siva Raman, S.; Stringer, L.C.; Bruce, N.C.; Chong, C.S. Opportunities, challenges and solutions for black soldier fly larvae-based animal feed production. J. Clean. Prod. 2022, 373, 133802. [Google Scholar] [CrossRef]
  4. Khalifah, A.; Abdalla, S.; Rageb, M.; Maruccio, L.; Ciani, F.; El-Sabrout, K. Could Insect Products Provide a Safe and Sustainable Feed Alternative for the Poultry Industry? A Comprehensive Review. Animals 2023, 13, 1534. [Google Scholar] [CrossRef] [PubMed]
  5. Alfiko, Y.; Xie, D.; Astuti, R.T.; Wong, J.; Wang, L. Insects as a feed ingredient for fish culture: Status and trends. Aquac. Fish. 2022, 7, 166–178. [Google Scholar] [CrossRef]
  6. Shin, J.; Lee, K.J. Digestibility of insect meals for Pacific white shrimp (Litopenaeus vannamei) and their performance for growth, feed utilization and immune responses. PLoS ONE 2021, 16, e0260305. [Google Scholar] [CrossRef] [PubMed]
  7. Chen, Y.; Chi, S.; Zhang, S.; Dong, X.; Yang, Q.; Liu, H.; Tan, B.; Xie, S. Evaluation of the Dietary Black Soldier Fly Larvae Meal (Hermetia illucens) on Growth Performance, Intestinal Health, and Disease Resistance to Vibrio parahaemolyticus of the Pacific White Shrimp (Litopenaeus vannamei). Front. Mar. Sci. 2021, 8, 1072. [Google Scholar] [CrossRef]
  8. Cummins, V.C.; Rawles, S.D.; Thompson, K.R.; Velasquez, A.; Kobayashi, Y.; Hager, J.; Webster, C.D. Evaluation of black soldier fly (Hermetia illucens) larvae meal as partial or total replacement of marine fish meal in practical diets for Pacific white shrimp (Litopenaeus vannamei). Aquaculture 2017, 473, 337–344. [Google Scholar] [CrossRef]
  9. Richardson, A.; Dantas-Lima, J.; Lefranc, M.; Walraven, M. Effect of a black soldier fly ingredient on the growth performance and disease resistance of juvenile pacific white shrimp (Litopenaeus vannamei). Animals 2021, 11, 1450. [Google Scholar] [CrossRef]
  10. Keetanon, A.; Chuchird, N.; Phansawat, P.; Kitsanayanyong, L.; Chou, C.C.; Verstraete, P.; Ménard, R.; Richards, C.S.; Ducharne, F.; Rairat, T. Effects of black soldier fly larval meal on the growth performance, survival, immune responses, and resistance to Vibrio parahaemolyticus infection of Pacific white shrimp (Litopenaeus vannamei). Aquac. Int. 2023. [Google Scholar] [CrossRef]
  11. Wang, G.; Peng, K.; Hu, J.; Mo, W.; Wei, Z.; Huang, Y. Evaluation of defatted Hermetia illucens larvae meal for Litopenaeus vannamei: Effects on growth performance, nutrition retention, antioxidant and immune response, digestive enzyme activity and hepatic morphology. Aquac. Nutr. 2021, 27, 986–997. [Google Scholar] [CrossRef]
  12. He, Y.; Zhang, N.; Wang, A.; Wang, S.; Che, Y.; Huang, S.; Yi, Q.; Ma, Y.; Jiang, Y. Positive effects of replacing commercial feeds by fresh black soldier fly (Hermetia illucens) larvae in the diets of Pacific white shrimp (Litopenaeus vannamei): Immune enzyme, water quality, and intestinal microbiota. Front. Mar. Sci. 2022, 9, 987363. [Google Scholar] [CrossRef]
  13. He, Y.; Liu, X.; Zhang, N.; Wang, S.; Wang, A.; Zuo, R.; Jiang, Y. Replacement of Commercial Feed with Fresh Black Soldier Fly (Hermetia illucens) Larvae in Pacific White Shrimp (Litopenaeus vannamei). Aquac. Nutr. 2022, 2022, 9130400. [Google Scholar] [CrossRef]
  14. Yildirim-Aksoy, M.; Eljack, R.; Beck, B.H.; Peatman, E. Nutritional evaluation of frass from black soldier fly larvae as potential feed ingredient for Pacific white shrimp, Litopenaeus vannamei. Aquac. Rep. 2022, 27, 101353. [Google Scholar] [CrossRef]
  15. Nunes, A.J.P.; Soares, A.N.; Sabry-Neto, H.; Burri, L. Effect of dietary graded levels of astaxanthin krill oil and high protein krill meal on the growth performance and stress resistance of post larval Litopenaeus vannamei under hyper-intensive nursery culture. Aquac. Nutr. 2021, 27, 327–341. [Google Scholar] [CrossRef]
  16. Official Methods of Analysis of Aoac International; Oxford University Press: Oxford, UK, 2023. [CrossRef]
  17. Hagen, S.R.; Augustin, J.; Grings, E.; Tassinari, P. Precolumn phenylisothiocyanate derivatization and liquid chromatography of free amino acids in biological samples. Food Chem. 1993, 46, 319–323. [Google Scholar] [CrossRef]
  18. Road, R. An Pico-Tag. Water 1986, 8, 170–177. [Google Scholar]
  19. Engle, C.R.; McNevin, A.; Racine, P.; Boyd, C.E.; Paungkaew, D.; Viriyatum, R.; Tinh, H.Q.; Minh, H.N. Economics of Sustainable Intensification of Aquaculture: Evidence from Shrimp Farms in Vietnam and Thailand. J. World Aquac. Soc. 2017, 48, 227–239. [Google Scholar] [CrossRef]
  20. Xie, J.J.; Lemme, A.; He, J.Y.; Yin, P.; Figueiredo-Silva, C.; Liu, Y.J.; Xie, S.W.; Niu, J.; Tian, L.X. Fishmeal levels can be successfully reduced in white shrimp (Litopenaeus vannamei) if supplemented with DL-Methionine (DL-Met) or DL-Methionyl-DL-Methionine (Met-Met). Aquac. Nutr. 2018, 24, 1144–1152. [Google Scholar] [CrossRef]
  21. Mohan, K.; Rajan, D.K.; Muralisankar, T.; Ganesan, A.R.; Sathishkumar, P.; Revathi, N. Use of black soldier fly (Hermetia illucens L.) larvae meal in aquafeeds for a sustainable aquaculture industry: A review of past and future needs. Aquaculture 2022, 553, 738095. [Google Scholar] [CrossRef]
  22. Vieira, C.C.F.; Pinto, R.C.C.; Diógenes, A.F.; Nunes, A.J.P. Apparent digestibility of protein and essential aminoacids from commonly used feed ingredients in Brazil for juvenile shrimp Litopenaeus vannamei. Revista Brasileira de Zootecnia 2022, 51, e20210177. [Google Scholar] [CrossRef]
  23. Galkanda-Arachchige, H.S.C.; Guo, J.; Stein, H.H.; Allen Davis, D. Apparent energy, dry matter and amino acid digestibility of differently sourced soybean meal fed to Pacific white shrimp Litopenaeus vannamei. Aquac. Res. 2020, 51, 326–340. [Google Scholar] [CrossRef]
  24. Jory, D.E. Penaeid Shrimp Nursery Systems Penaeid Shrimp Nursery Systems. Aquac. Mag. 2020, 23, 1–5. [Google Scholar]
Figure 1. Mean (±standard error) body weight (BW) of P. vannamei along the 42 days of nursery. Each column is the mean BW obtained from 10 rearing tanks. Diet BSF0% with no replacement of FML at 22.00% dietary inclusion; diet BSF25% with 25% replacement of FML (16.50%) for BSFLM (6.33%); diet BSF50%, with 50% replacement of FML (11.00%) for BSFLM (13.04%); diet BSF75%, with 75% replacement of FML (5.50%) for BSFLM (19.74%), and; diet BSF100%, with 100% replacement of FML for BSFLM (26.46%). Common letters indicate non-statistically significant differences according to Duncan’s test at 0.05 significant level.
Fishes 08 00605 g001
Figure 2. Mean (± standard error) ROI (return on investment) for different dietary inclusion levels of FML and BSFLM in diets for post-larval P. vannamei. ROI simulations were based on a fixed price of 1.86 USD/kg for FML and a baseline price of 2.00 USD/kg for BSFLM with 15% gradual increase in price. Diet BSF0% with no replacement of FML at 22.00% dietary inclusion; diet BSF25% with 25% replacement of FML (16.50%) for BSFLM (6.33%); diet BSF50%, with 50% replacement of FML (11.00%) for BSFLM (13.04%); diet BSF75%, with 75% replacement of FML (5.50%) for BSFLM (19.74%), and; diet BSF100%, with 100% replacement of FML for BSFLM (26.46%). Common letters indicate non-statistically significant differences according to Duncan’s test at 0.05 significant level.
Fishes 08 00605 g002
Table 1. Proximate and amino acid composition (%, as-is basis) of partially-defatted black soldier fly larvae meal (BSFLM) and fish meal (FML) used in the present study.
Nutrients 1Composition (%, as-is)
BSFLMFML
Dry matter96.7092.45
Crude protein57.7767.08
Ether extract7.5810.88
Total fiber-0.13
Crude ash9.8714.07
Nitrogen-free extract 29.870.29
Gross energy (MJ/kg) 320.8121.20
Essential Amino Acids (EAA)
Arginine2.533.74
Histidine1.511.66
Isoleucine2.132.07
Leucine3.603.62
Lysine3.774.47
Methionine0.921.69
Methionine + Cysteine1.382.35
Phenylalanine2.092.21
Threonine2.132.45
Tryptophan0.745.71
Valine2.962.67
Non-Essential Amino Acids (NEAA)
Alanine3.474.27
Aspartic acid4.605.66
Cystine0.460.66
Glycine2.816.84
Glutamic acid7.128.10
Hydroxyproline0.281.55
Proline3.103.64
Serine2.262.74
Taurine0.080.86
Tyrosine3.111.59
Sum EAA 222.3830.29
Sum NEAA27.2931.64
Sum EAA + NEAA49.6761.93
1 Chemically analyzed, except where indicated. 2 Nitrogen-free extract. Calculated by difference [dry matter − (crude protein + ether extract + total fiber + ash)]. 3 Gross energy (GE) given on a dry matter (DM) basis. Calculated as GE = (4143 + (56 × EE [DM]) + (15 × crude protein [DM]) − (44 × crude ash [DM])) × 0.0041868.
Table 2. Ingredient composition (%, as-is) and formulated nutrient levels of nursery diets used in this study.
IngredientsDiets/Ingredient Composition (%, as-is)
BSF0%BSF25%BSF50%BSF75%BSF100%
Soybean meal 135.0035.0035.0035.0035.00
Wheat flour 224.2622.9021.2819.6718.00
Salmon meal 322.0016.5011.005.50-
BSF larvae meal 4-6.3313.0419.7426.46
Wheat gluten meal 54.004.004.004.004.00
Soybean oil2.531.981.410.840.26
Salmon oil2.392.652.903.153.40
Krill meal 62.002.002.002.002.00
Squid meal 72.002.002.002.002.00
Potassium chloride1.511.511.521.531.54
Magnesium sulphate1.001.001.001.001.00
Sodium monophosphate 81.001.001.001.001.28
Vitamin–mineral premix 90.500.500.500.500.50
Salt0.490.340.340.340.34
Calcium carbonate0.360.600.821.041.03
Synthetic binder 100.300.300.300.300.30
Stay C, 35% 110.230.230.230.230.23
DL-Methionine 120.170.210.250.280.32
Soy lecithin oil0.150.621.081.552.02
L-Threonine 130.080.140.140.140.14
L-Lysine 140.030.200.200.190.19
Formulation cost (USD/kg) 151.091.191.291.391.50
Proximate composition (%, as-is)
Dry matter87.0289.3488.6987.9288.61
Crude protein39.2939.6139.6738.8940.82
Total lipids8.528.528.247.898.61
Total fiber1.752.523.114.243.43
Crude ash10.329.779.639.4310.12
Nitrogen-free extract 1627.1428.9228.0427.4725.63
Gross energy (MJ/kg)15.6616.4216.9516.6616.47
1 Bunge Alimentos S.A. (Luiz Eduardo Magalhães, Brazil). 89.81% dry matter (DM), 46.06% CP, 1.60% ether extract (EE), 5.70% total fiber, 6.79% ash, 0.51% methionine (Met), 1.27% M + C, 2.90% lysine (Lys), 1.80% threonine (Thr). 2 Bunge Alimentos S.A. (Gaspar, Brazil). 87.32% DM, 12.44% CP, 1.55% EE, 0.37% total fiber, 0.81% ash, 0.21% Met, 0.61% M + C, 0.28% Lys, 0.45% Thr. 3 Pesquera Pacific-Star (Puerto Montt, Chile). See Table 1 for composition. 4 CYNS PRO, BSF Nutrição e Biotecnologia S.A.—CYNS (Piracicaba, Brazil). See Table 1 for composition. 5 Agridient, Inc. (Farmington Hills, MI, USA). 90.91% moisture, 79.19% CP, 3.96% EE, 0.18% total fiber, 0.82% ash, 1.24% Met, 2.68% M + C, 1.33% Lys, 2.16% Thr. 6 QRILL™ Aqua, Aker Biomarine Antarctic AS (Lysaker, Norway). 93.53% DM, 57.42% CP, 22.00% EE, 3.51% total fiber, 12.23% ash, 1.57% Met, 1.98% M + C, 4.00% Lys, 2.41% Thr. 7 Peruvian Sea Food S.A. (Paita, Peru). 93.19% DM, 80.18% CP, 4.28% EE, 2.37% total fiber, 7.44% ash, 2.25% Met, 3.08 M + C, 5.03% Lys, 3.23% Thr. 8 Monobasic sodium phosphate. 0.60% calcium, 20.70% phosphorus, 14.12% available phosphorus. 9 Rovimix 2050 Px Camarões VitMin (SAM) VM25L3 (BR4418A025). DSM Produtos Nutricionais Brasil Ltda. (São Paulo, Brazil). Guarantee levels per kg of product: vitamin A, 2,996,333 IU; vit. D3, 1,080,066 IU; vit. E, 22,344.50 mg; vit. K3, 7350 mg; vit. B1, 14,560 mg; vit. B2, 13,200 m g; vit. B5, 45,070 mg; vit. B6, 14,560 mg; vit. B12, 7.63 mg; folic acid, 1870 mg; nicotinic acid, 26,350 mg; biotin, 381 mg; inositol, 83,000 mg; Cu, 11,000 mg; I, 500 mg; Mn, 5000 mg; Se, 134 mg; Zn, 31,000 mg; Co, 1350 mg. 10 Nutri-Bind Aqua Veg Dry, Nutri-Ad International NV (Dendermonde, Belgium). Synthetic pellet binder consisting of calcium lignosulfonate (94.00%) and guar gum (6.00%). 11 Rovimix® Stay C® 35. Minimum of 35% of phosphorylated vitamin C activity. DSM Nutritional Products AG (Schweiz, Switzerland). 12 MetAMINO®, Evonik Nutrition & Care GmbH (Hanau, Germany). DL-Methionine, Feed Grade 99%. 13 ThreAMINO®, Evonik Nutrition & Care GmbH (Hanau, Germany). L-Threonine 98.5%. 14 Biolys®, Evonik Nutrition & Care GmbH (Hanau, Germany). L-Lysine 54.6%. 15 Assuming a FOB price of 1.86 and 3.00 USD/kg for salmon meal and BSFLM, respectively. 16 Check Table 1 for calculations.
Table 3. Amino acid (% of the diet, as-is) composition of experimental diets. CV, coefficient of variation (%).
Diets/Amino Acid Composition (%, as-is)CV (%)
Amino AcidsBSF0%BSF25%BSF50%BSF75%BSF100%
Essential Amino Acids (EAA)
Arginine2.322.292.282.092.344.4
Histidine0.840.850.90.961.049.1
Isoleucine1.501.491.551.51.613.3
Leucine2.582.632.712.552.814.0
Lysine2.262.342.372.212.454.0
Methionine0.850.910.940.871.037.7
Met + Cys 11.391.461.481.371.565.2
Phenylalanine1.691.691.721.651.772.6
Threonine1.551.631.691.551.796.2
Valine1.741.761.861.821.954.6
Non-Essential Amino Acids (NEAA)
Alanine1.911.911.941.842.043.8
Aspartic acid3.373.443.503.23.624.6
Cystine0.540.550.540.50.533.6
Glycine2.672.502.352.052.359.6
Glutamic acid7.477.547.546.987.663.6
Hydroxyproline0.340.240.150.090.1155.7
Proline2.302.302.332.22.372.7
Serine1.831.881.901.761.974.2
Taurine0.200.150.110.070.0941.7
Tyrosine1.151.281.421.461.5411.3
Sum EAA 215.3315.5916.0215.2016.794.1
Sum NEAA21.7821.7921.7820.1522.283.8
Sum EAA + NEAA37.1137.3837.8035.3539.073.6
1 Methionine + cysteine. 2 Tryptophan not analyzed.
Table 4. Fatty acid composition (% of the diet, as-is basis) of experimental diets.
Diet/Composition (%, as-is)
Fatty AcidsBSF0%BSF25%BSF50%BSF75%BSF100%
4:0<0.001<0.001<0.001--
6:0<0.001<0.001<0.001<0.001<0.001
8:0<0.001<0.001<0.001<0.001<0.001
10:0<0.001-0.010.010.01
11:0<0.001<0.001<0.001<0.001<0.001
12:0-0.130.280.410.41
13:0<0.001<0.001<0.001<0.001<0.001
14:00.120.150.180.200.22
15:00.010.010.010.010.01
16:01.321.331.321.311.44
17:00.020.020.020.020.02
18:00.430.410.380.360.41
20:00.030.030.030.030.03
21:00.020.030.020.020.02
22:00.030.030.030.030.03
23:00.010.010.01-0.01
24:00.010.010.010.010.01
15:1<0.001<0.001<0.001<0.001<0.001
17:1<0.001<0.001<0.001<0.001<0.001
16:1n-70.140.140.140.140.16
18:1n-92.552.462.302.152.41
20:1n-90.110.100.090.090.10
22:1n-90.040.040.040.030.04
24:1n-90.030.030.020.020.02
18:2n-62.632.632.45--
20:2n-60.050.050.040.050.06
18:3n-60.010.010.010.010.01
20:3n-60.020.020.020.010.02
20:4n-60.030.030.020.020.03
18:3n-30.340.330.320.310.33
20:3n-30.010.01-0.010.01
20:5n-30.210.190.180.160.19
22:6n-30.310.300.250.190.25
∑ n-3 10.870.830.750.670.78
∑ n-6 22.742.742.580.080.11
∑ SFA 32.002.162.302.412.62
∑ MUFA 42.872.772.592.432.73
∑ PUFA 53.063.052.880.380.42
∑ HUFA 60.550.520.450.370.47
1 n-3, 18:3n-3, 20:3n-3, 20:5n-3, 22:6n-3. 2 n-6, 18:2n-6, 20:2n-6, 18:3n-6, 20:3n-6, 20:4n-6. 3 SFA, saturated fatty acids, 4:0, 6:0, 8:0, 10:0, 11:0, 12:0, 13:0, 14:0, 15:0, 16:0, 17:0, 18:0, 20:0, 21:0, 22:0, 23:0, 24:0. 4 MUFA, monounsaturated fatty acids, 15:1, 16:1, 17:1, 18:1, 20:1, 22:1, 24:1. 5 PUFA, polyunsaturated fatty acids, 18:2n-6, 20:2n-6, 18:3n-6, 18:3n-3, 20:3n-6, 20:3n-3. 6 HUFA, highly unsaturated fatty acids, 20:4n-6, 20:5n-3, 22:6n-3.
Table 5. Feeding and survival table used in the current study. DWG, daily weight.
Shrimp
Stage
Shrimp Body Weight (BW, mg)Feeding Rate
(% of BW per Day)
Estimated
Survival (%)
DWG
(mg)
FromTo
PL101235.01000.1
PL112335.01000.2
PL123635.01000.3
PL136934.51000.4
PL1491333.01000.5
PL15131732.01000.6
PL16172231.0990.7
PL17222826.0990.8
PL18283525.0991.0
PL19354324.0991.0
PL20435223.0992.0
PL21526222.0992.0
PL22627320.0983.0
PL23738618.0983.0
PL248610117.0984.0
PL2510111816.0984.0
PL2611813713.0986.0
PL2713715812.0986.0
PL2815818211.5977.0
PL2918220711.0977.0
PL3020723210.5978.0
Juvenile23225910.0978.0
Juvenile25928610.0979.0
Juvenile2863149.5979.0
Juvenile3143429.09610.0
Juvenile3423728.59610.0
Juvenile3724028.09611.0
Juvenile4024347.59611.0
Juvenile4344667.09612.0
Juvenile4665006.89612.0
Juvenile5005346.59513.0
Juvenile5345706.39513.0
Juvenile5706086.19514.0
Juvenile6086485.99514.0
Juvenile6486885.79515.0
Juvenile6887305.59515.0
Juvenile7307725.39416.0
Juvenile7728175.19416.0
Juvenile8178624.99417.0
Juvenile8629094.79417.0
Table 6. Growth performance (mean ± standard deviation) of post-larval P. vannamei fed nursery diets with graded levels of BSFLM in replacement of FML. Diet BSF0% with no replacement of FML at 22.00% dietary inclusion; diet BSF25% with 25% replacement of FML (16.50%) for BSFLM (6.33%); diet BSF50%, with 50% replacement of FML (11.00%) for BSFLM (13.04%); diet BSF75%, with 75% replacement of FML (5.50%) for BSFLM (19.74%), and; diet BSF100%, with 100% replacement of SLM for BSFLM (18.00%). Common letters indicate non-statistically significant differences according to Duncan’s test at 0.05 significant level.
Growth ParametersDietsMean ± SDp ANOVA
BSF0%BSF25%BSF50%BSF75%BSF100%
Initial body weight (mg)2.7 ± 0.22.6 ± 0.22.7 ± 0.32.7 ± 0.22.6 ± 0.32.7 ± 0.20.608
Final survival (%)89.5 ± 7.589.1 ± 4.694.0 ± 9.790.8 ± 7.788.9 ± 7.990.5 ± 7.60.562
Gained yield (mg/m3)726 ± 34 b762 ± 47 a,b791 ± 52 a776 ± 38 a749 ± 58 a,b-0.047
Growth (mg/day)14.2 ± 0.814.8 ± 1.314.7 ± 1.315.0 ± 1.514.8 ± 0.814.7 ± 1.10.653
AFI a (g/stocked shrimp)0.66 ± 0.030.67 ± 0.040.67 ± 0.030.68 ± 0.020.68 ± 0.020.67 ± 0.030.561
FCR b1.25 ± 0.04 b1.20 ± 0.06 a,b1.16 ± 0.06 a1.20 ± 0.05 a,b1.24 ± 0.08 b-0.036
a Apparent feed intake (AFI, g) is the amount of feed delivered divided by the number of stocked shrimp. b Feed conversion ratio.
Disclaimer/Publisher’s Note: The statements, opinions and data contained in all publications are solely those of the individual author(s) and contributor(s) and not of MDPI and/or the editor(s). MDPI and/or the editor(s) disclaim responsibility for any injury to people or property resulting from any ideas, methods, instructions or products referred to in the content.

