

Biological Responses of Oyster Crassostrea gasar Exposed to Different Concentrations of Biofloc


 ,
, 
Abstract
:1. Introduction
2. Materials and Methods
2.1. Oyster Origin
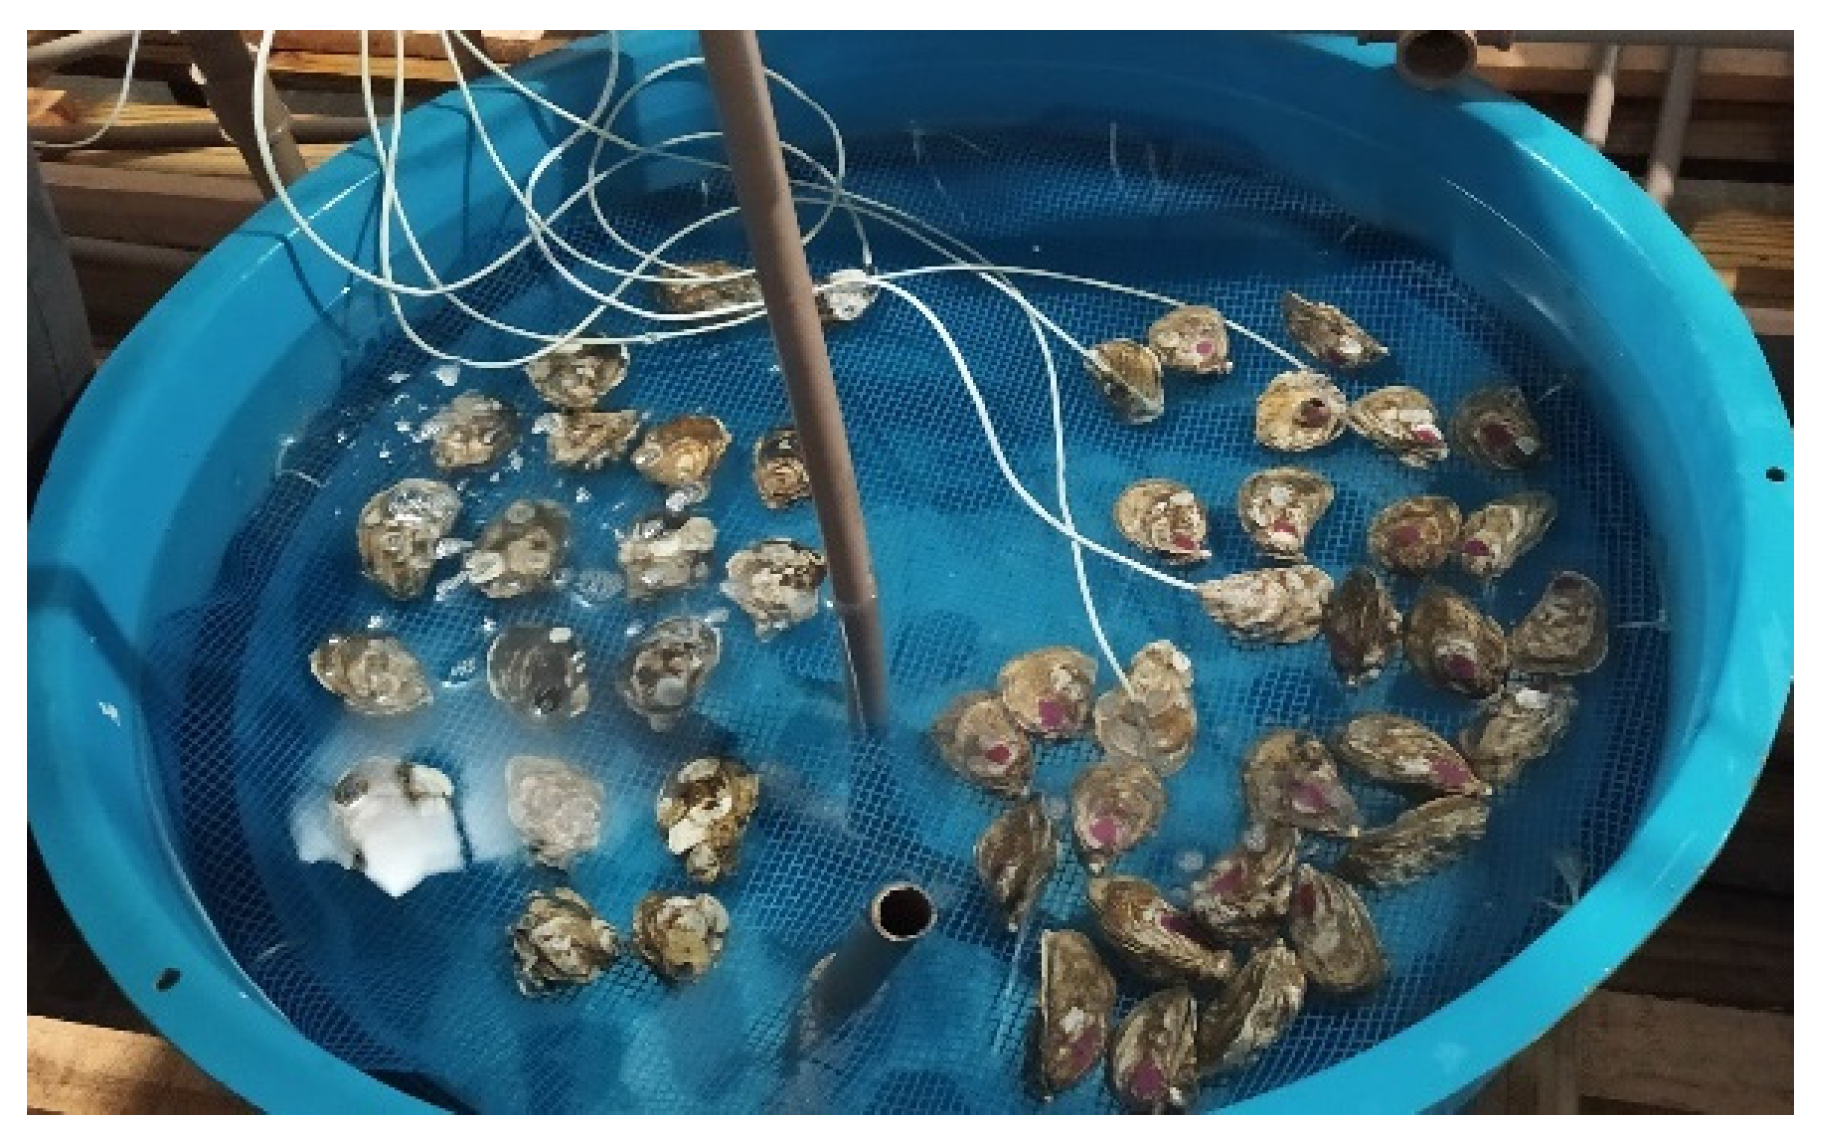
2.2. Experimental Design
2.3. Water Quality
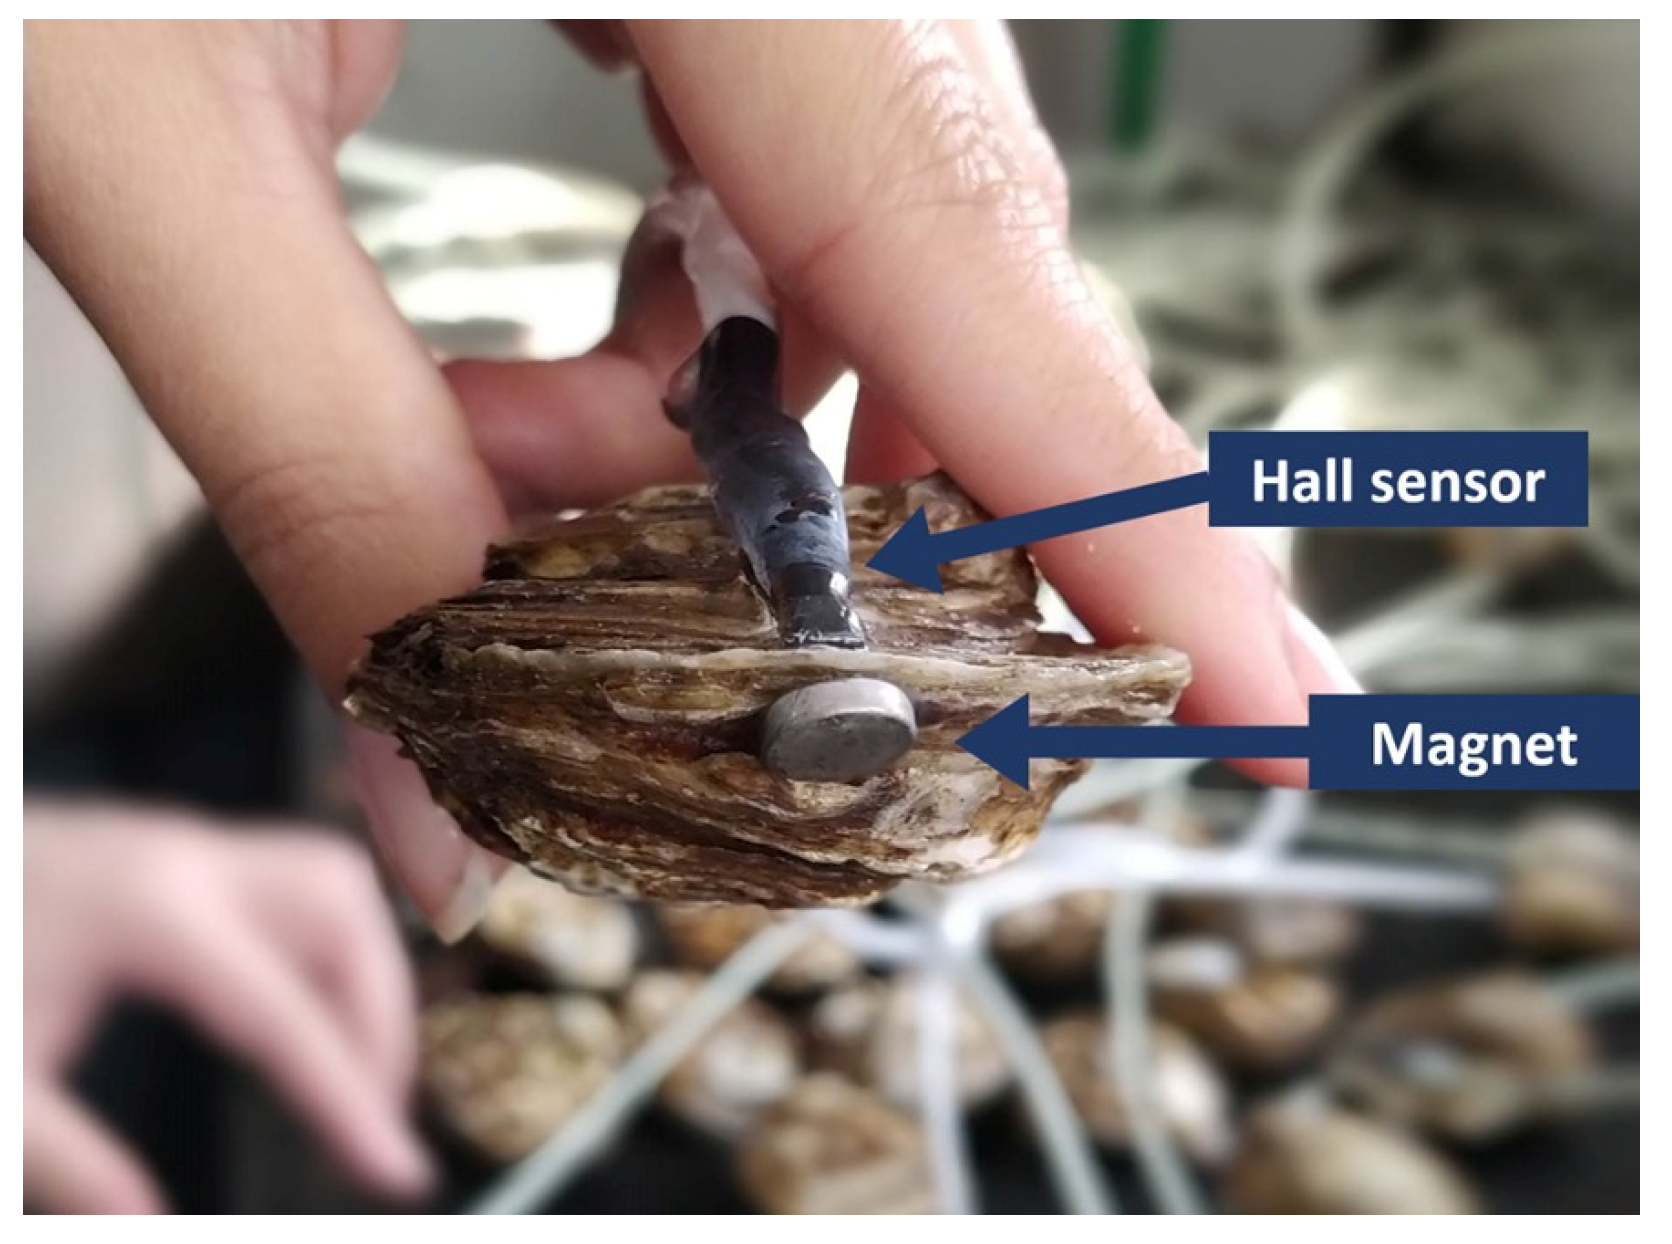
2.4. Hall Sensor
2.5. Biochemical Analyses
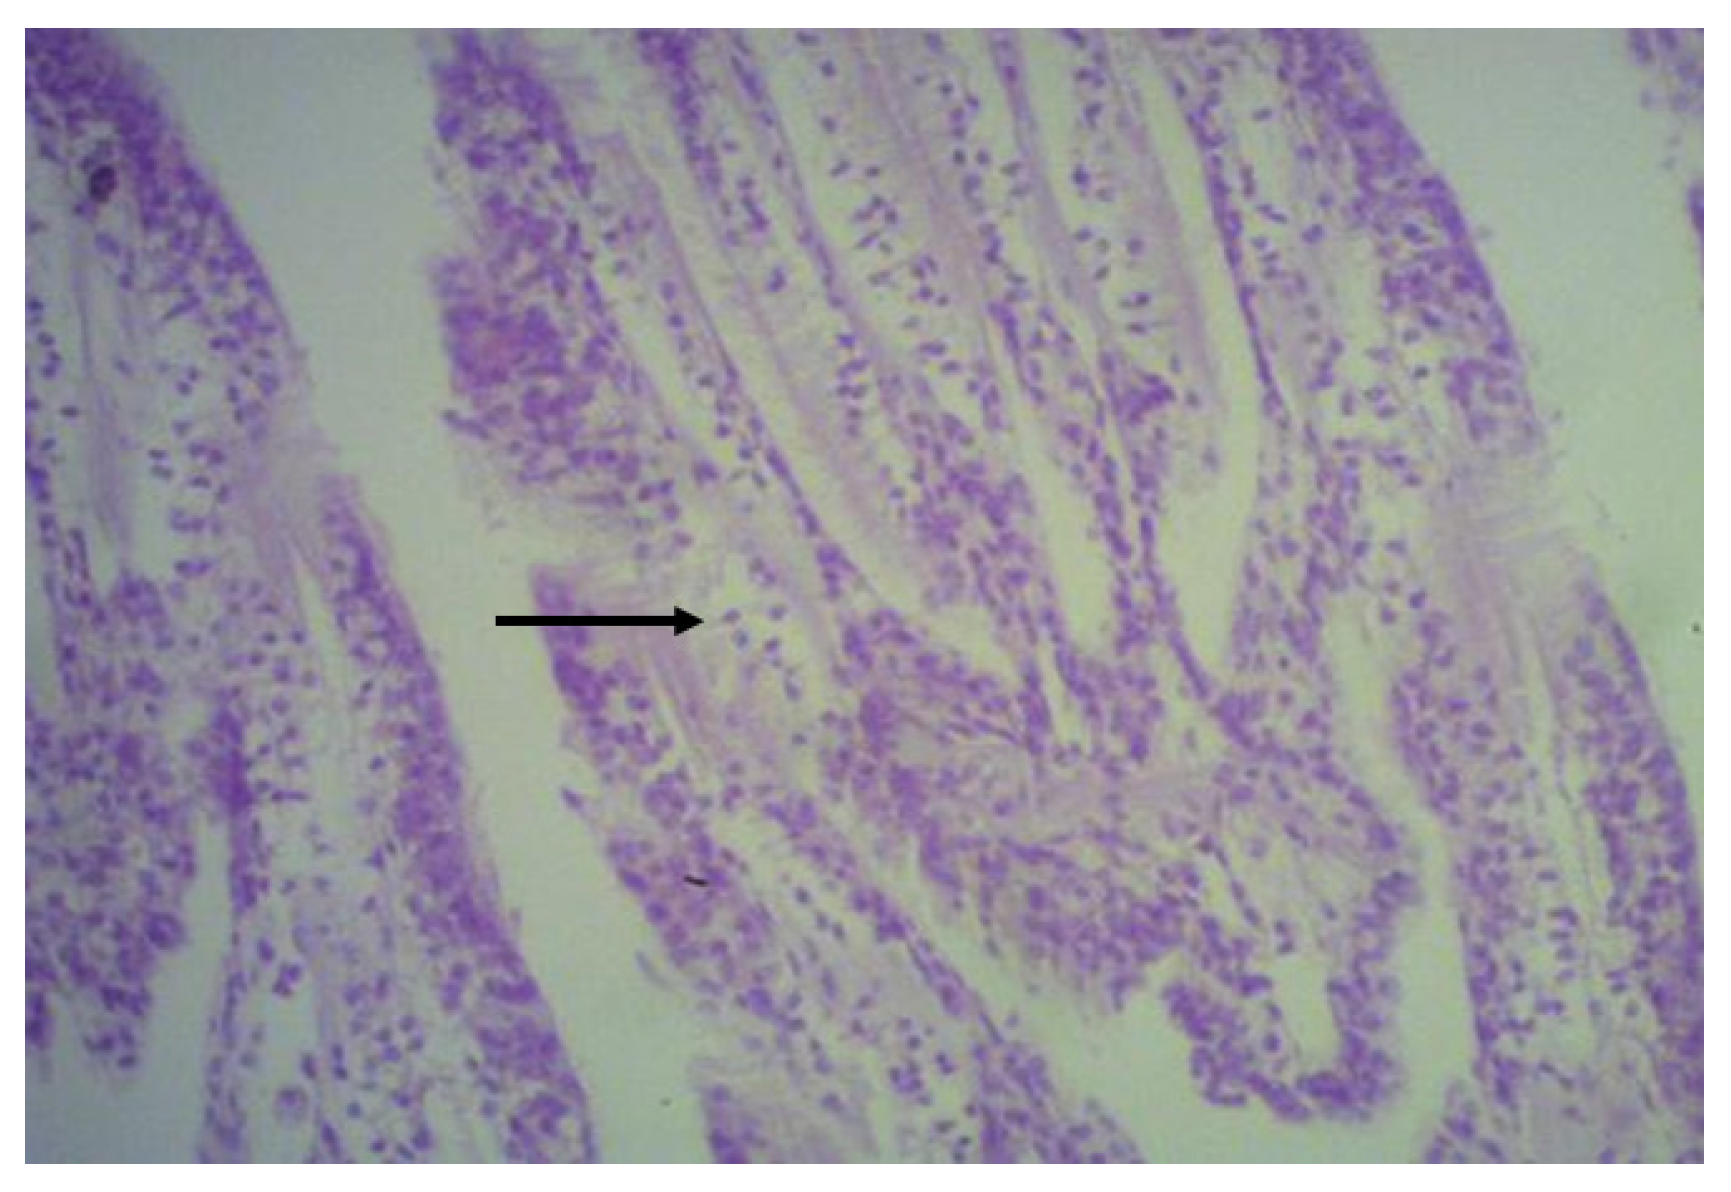
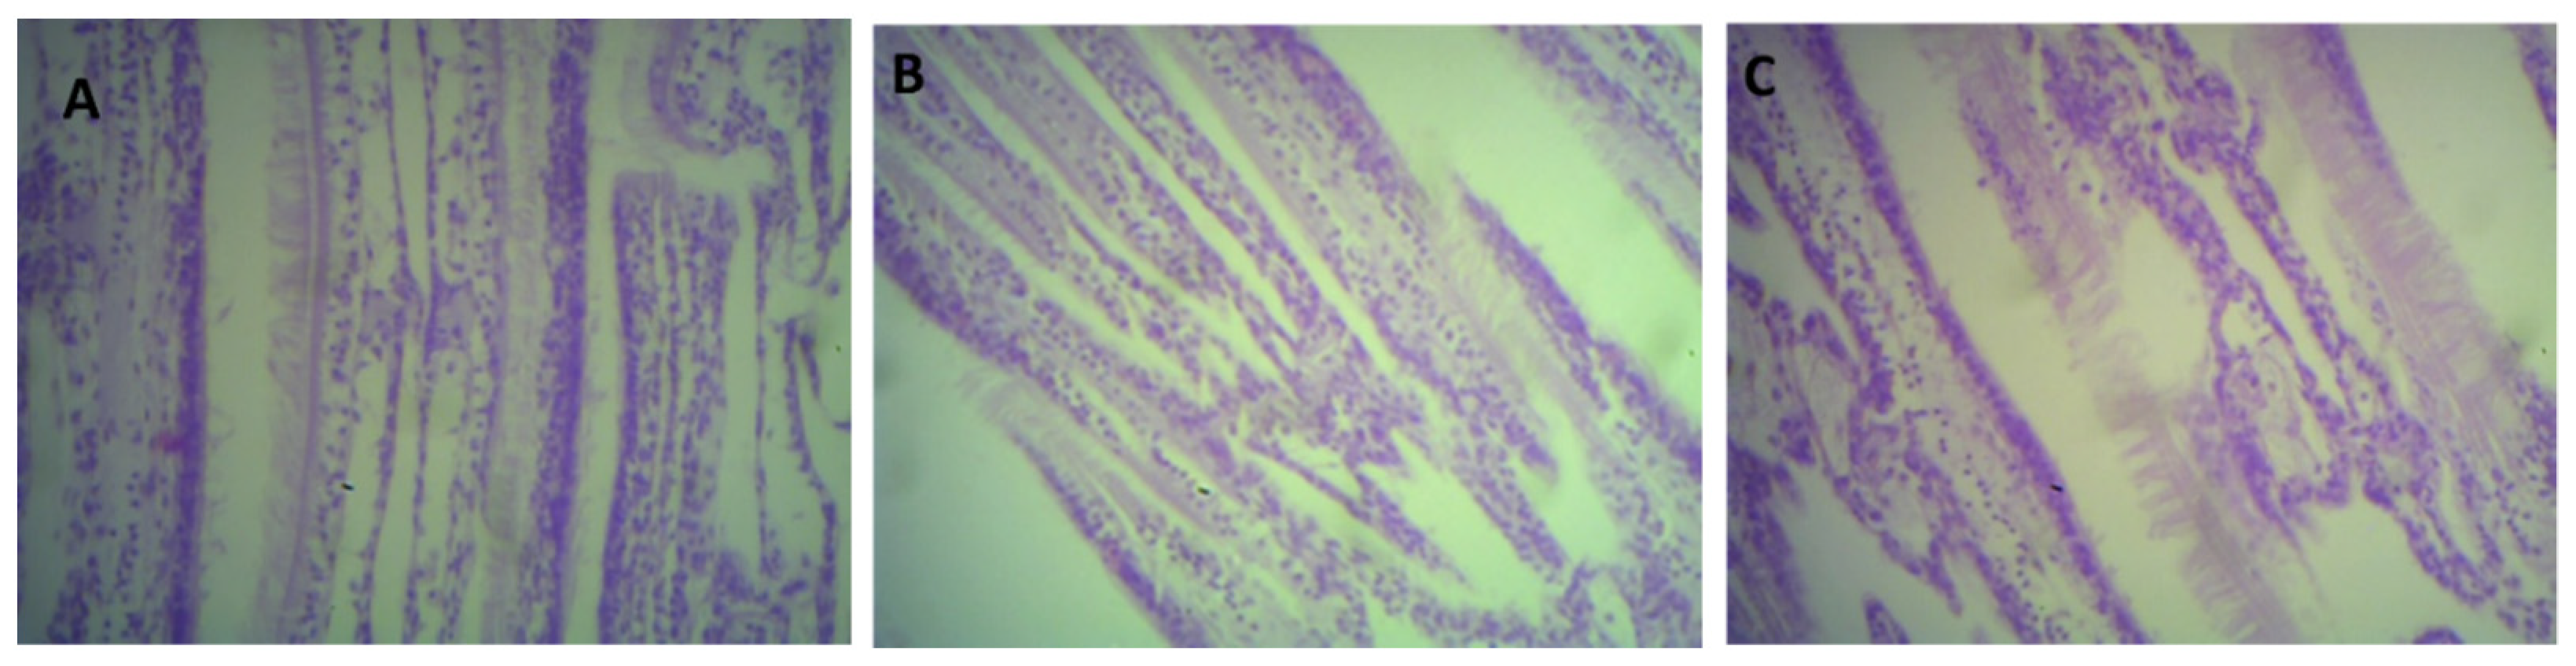
2.6. Histological Analysis
2.7. Statistical Analysis
3. Results
3.1. Water quality
3.2. Hall Sensor
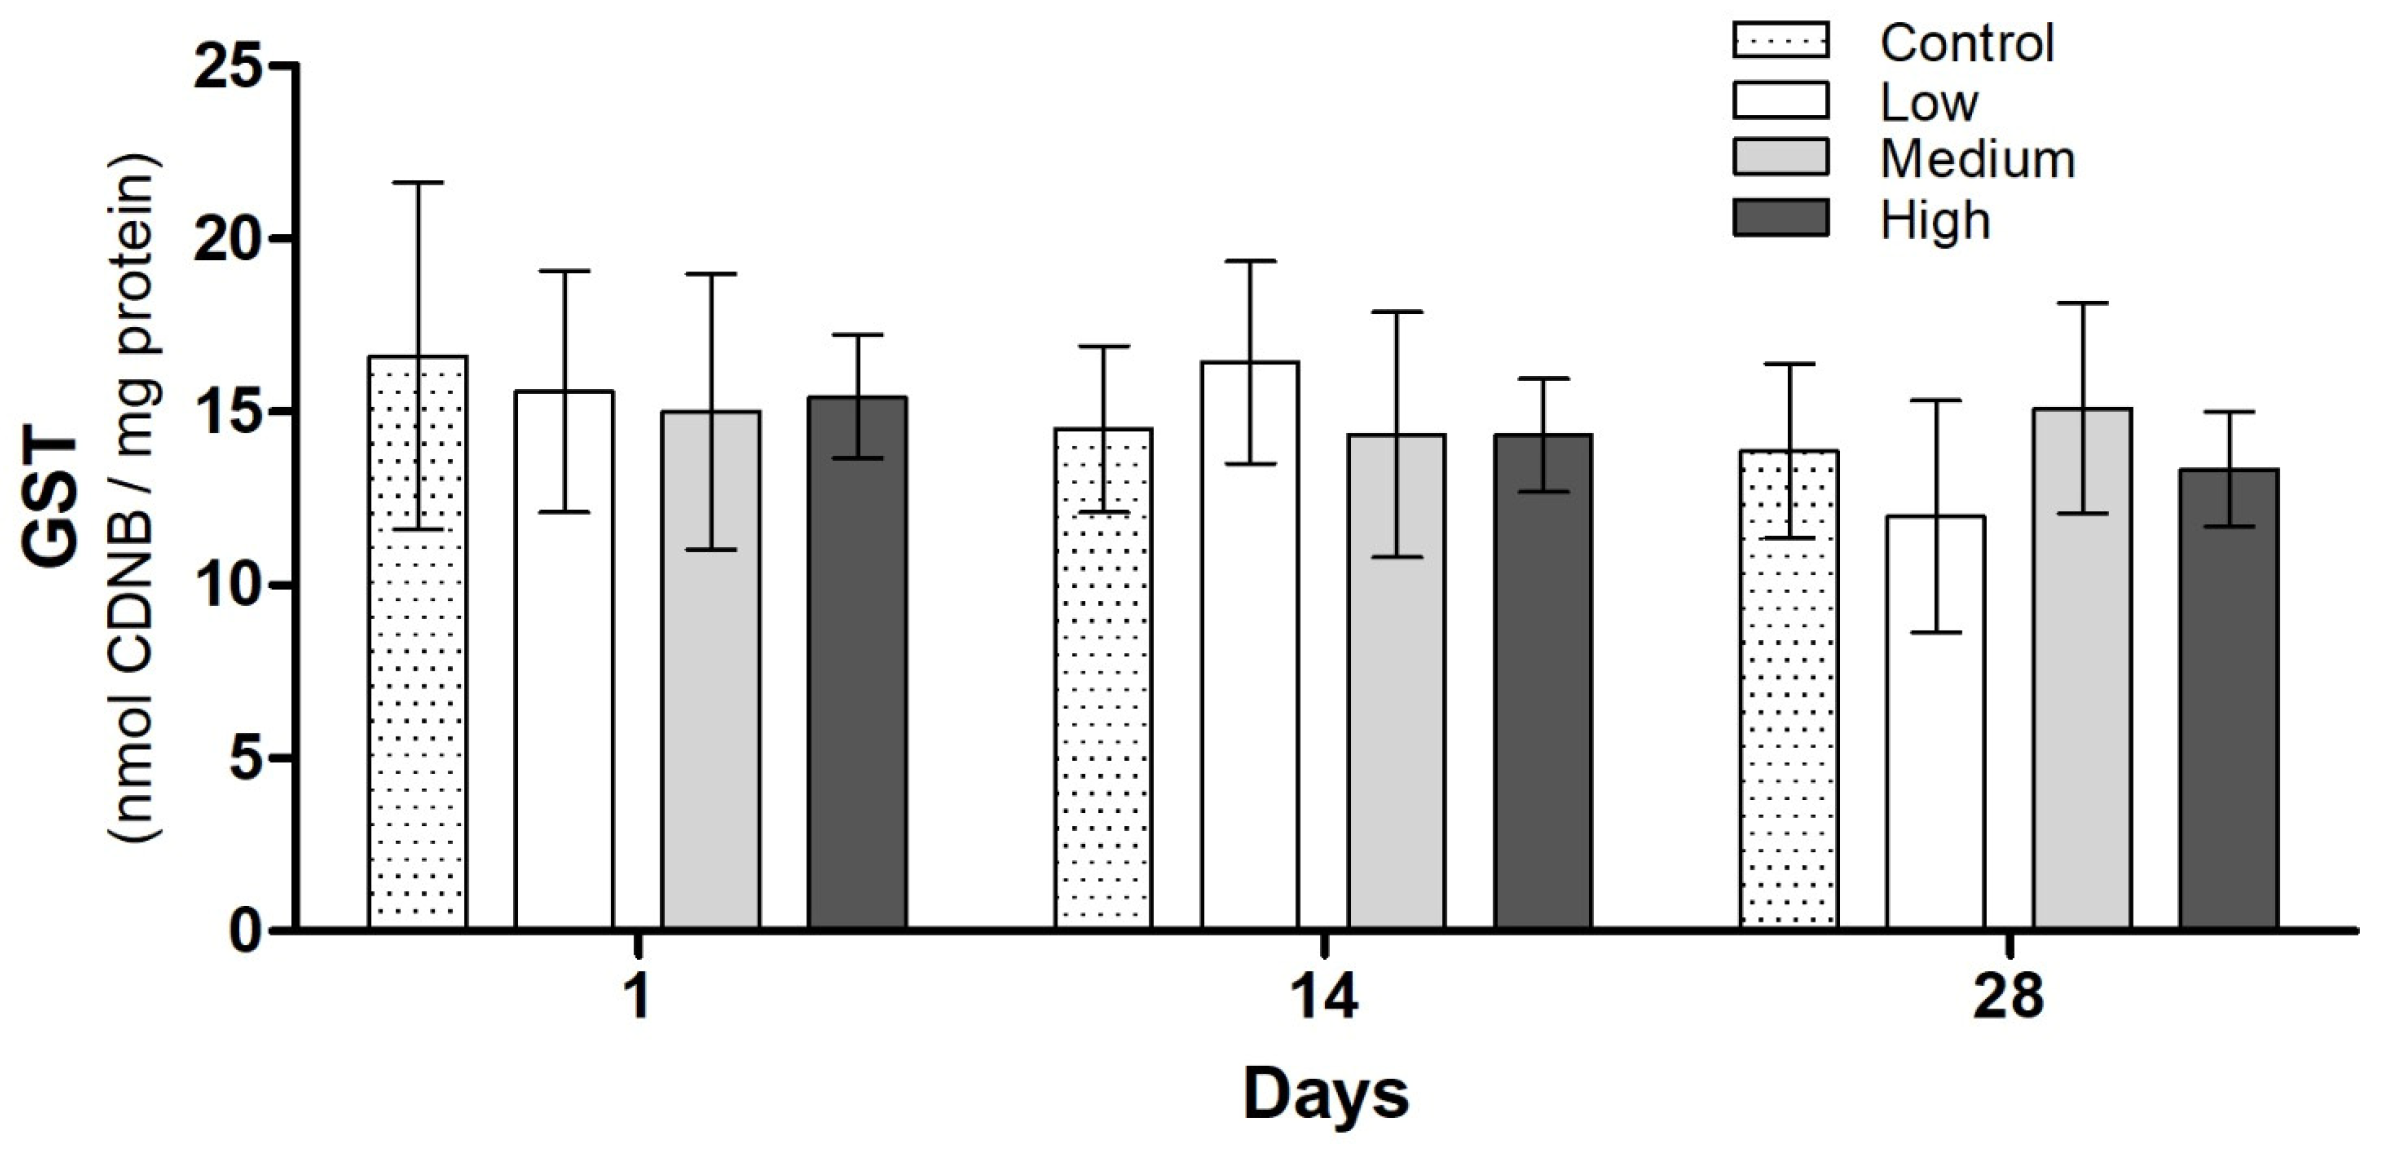
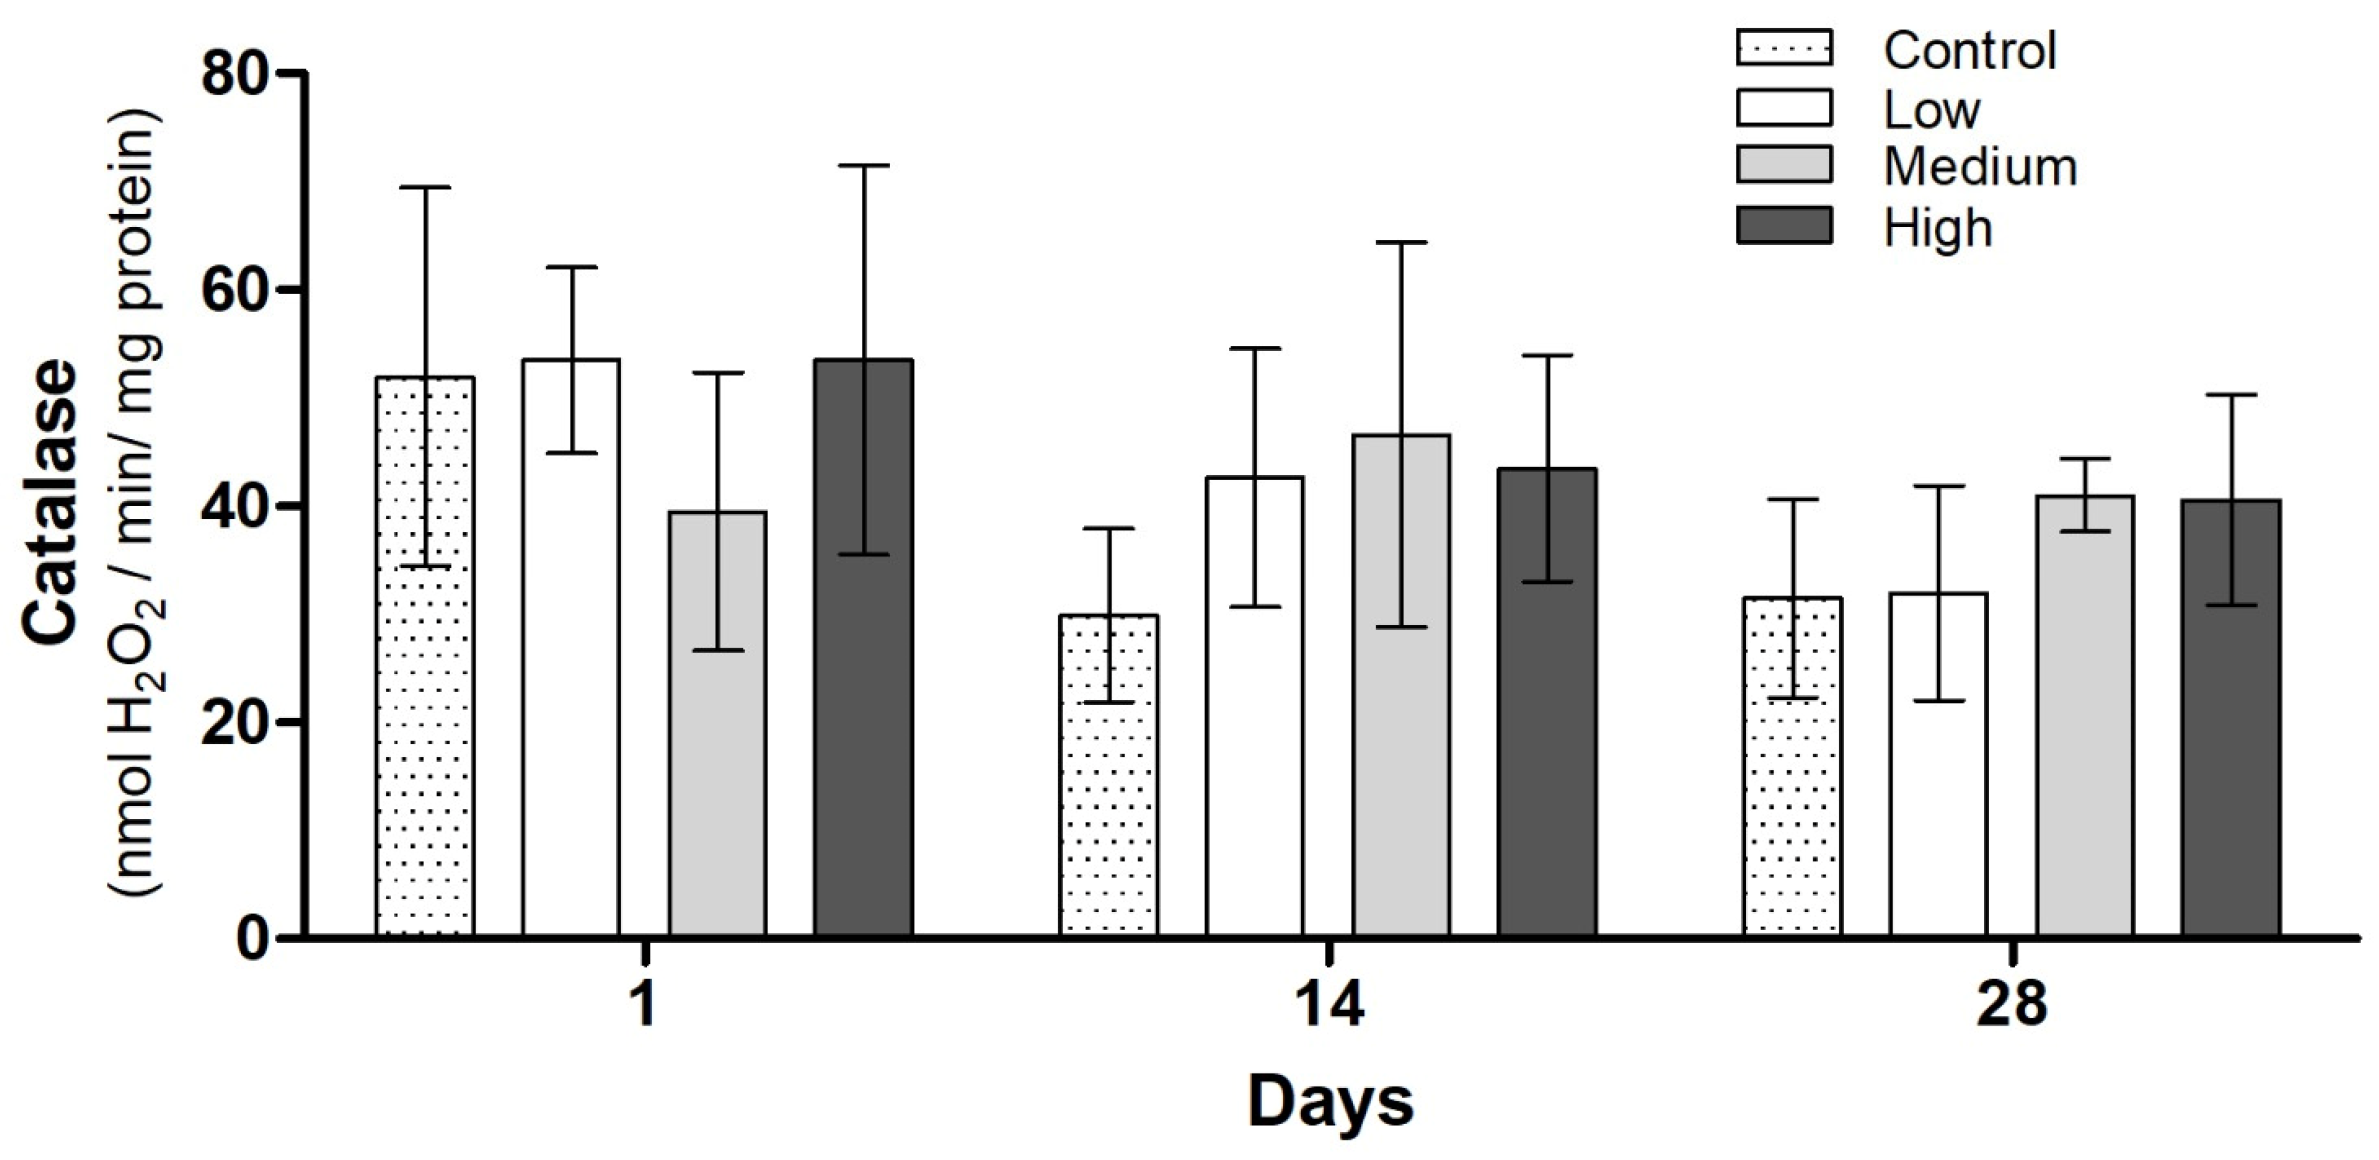
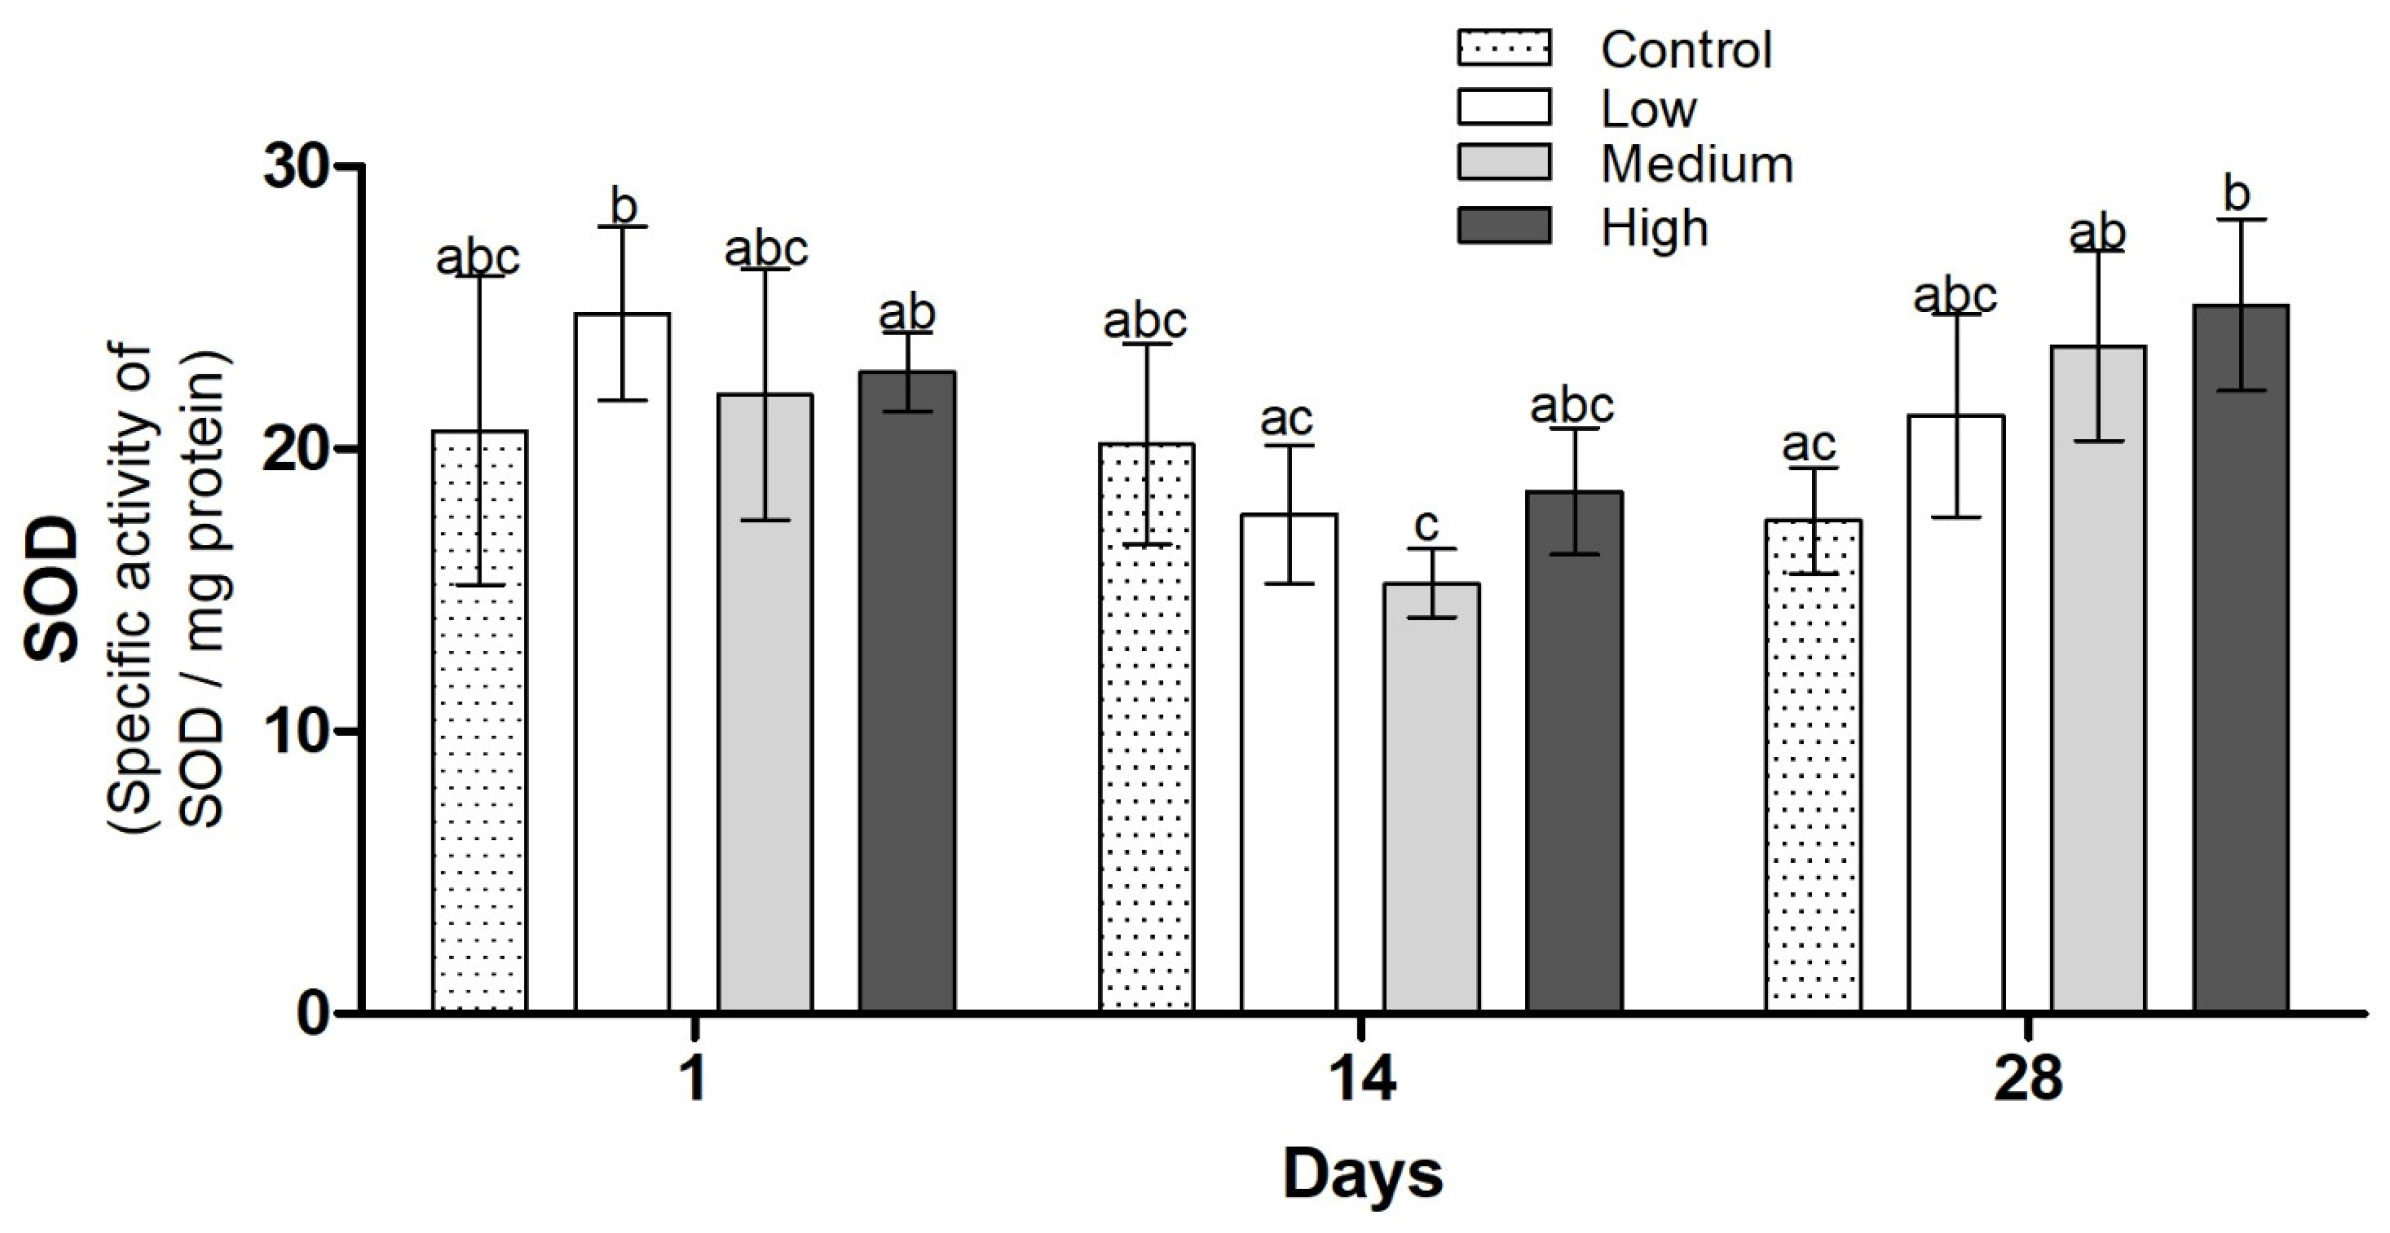
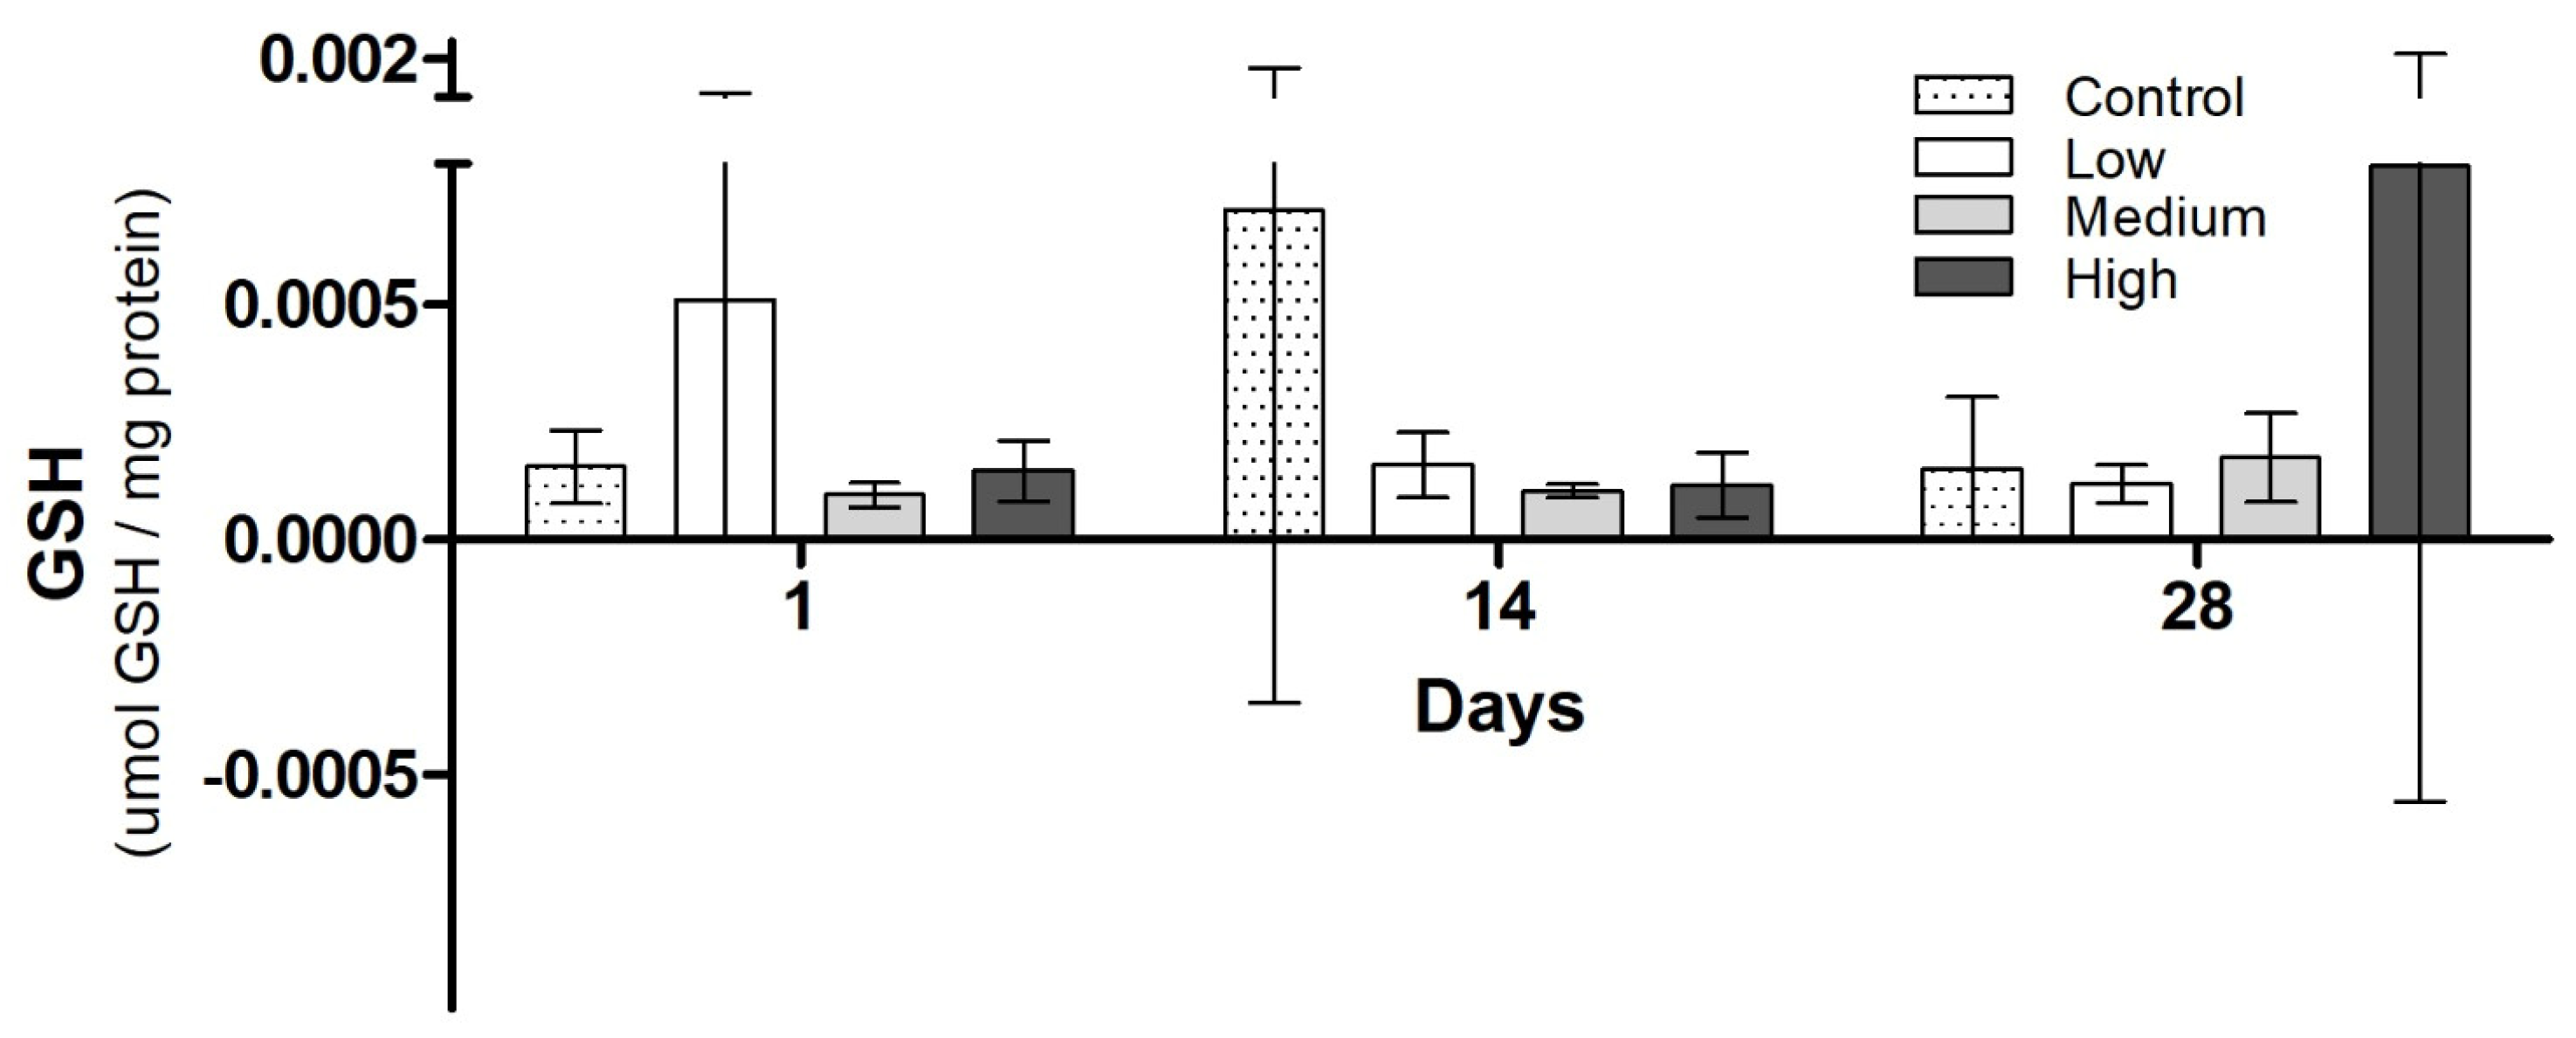
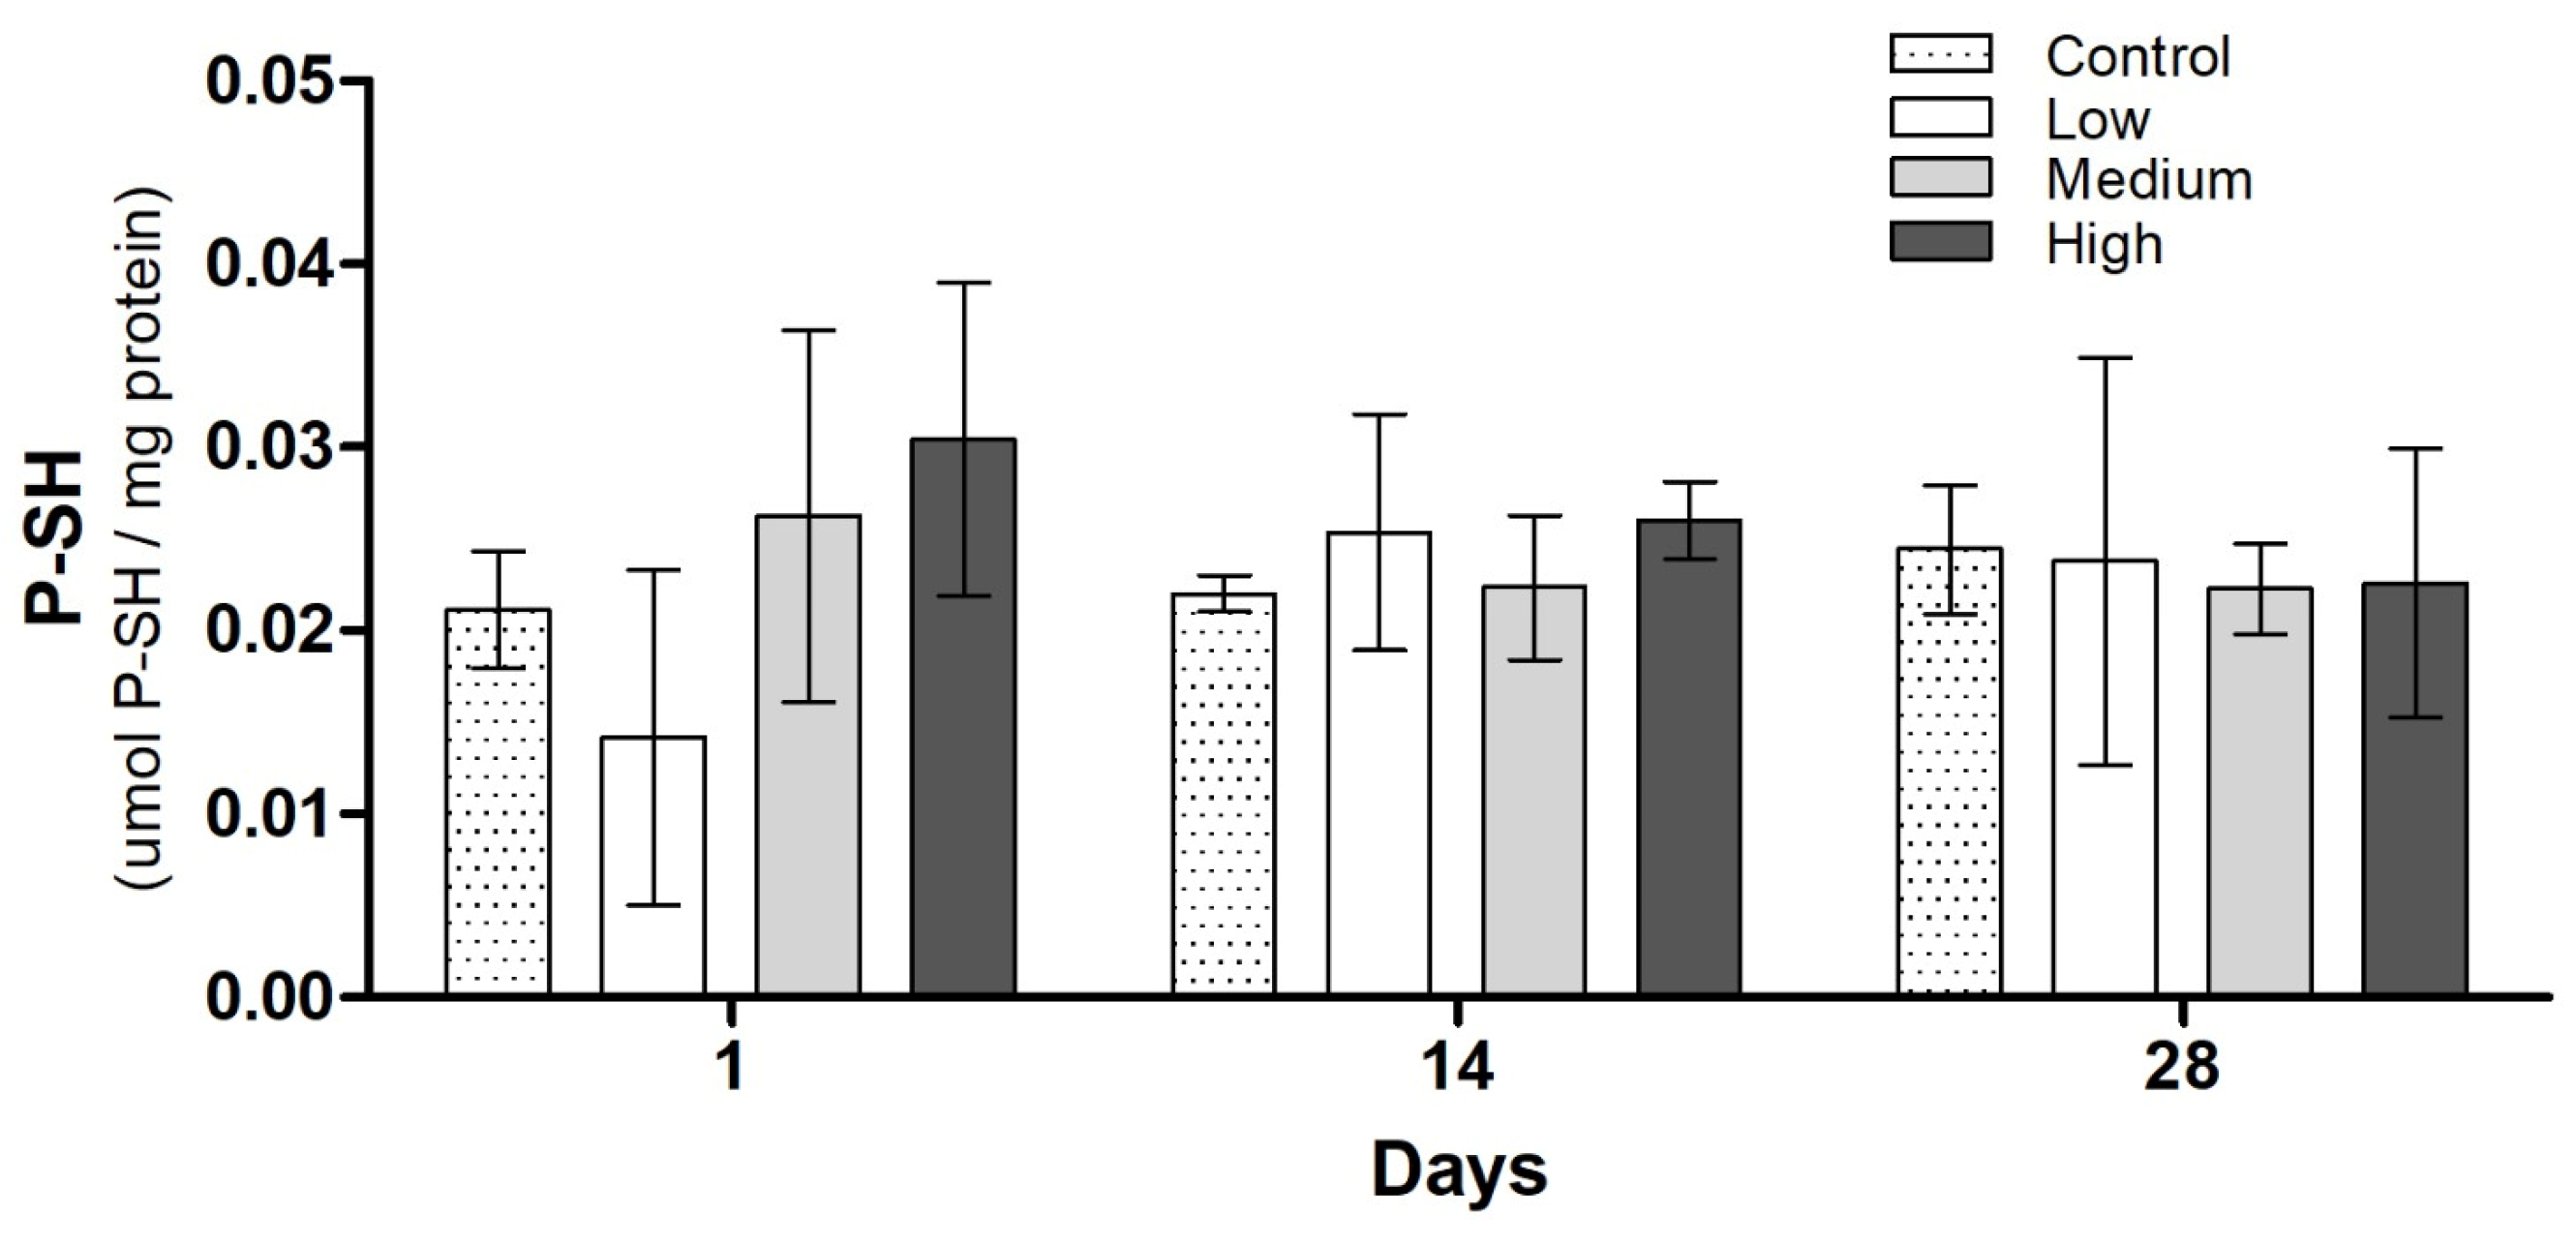
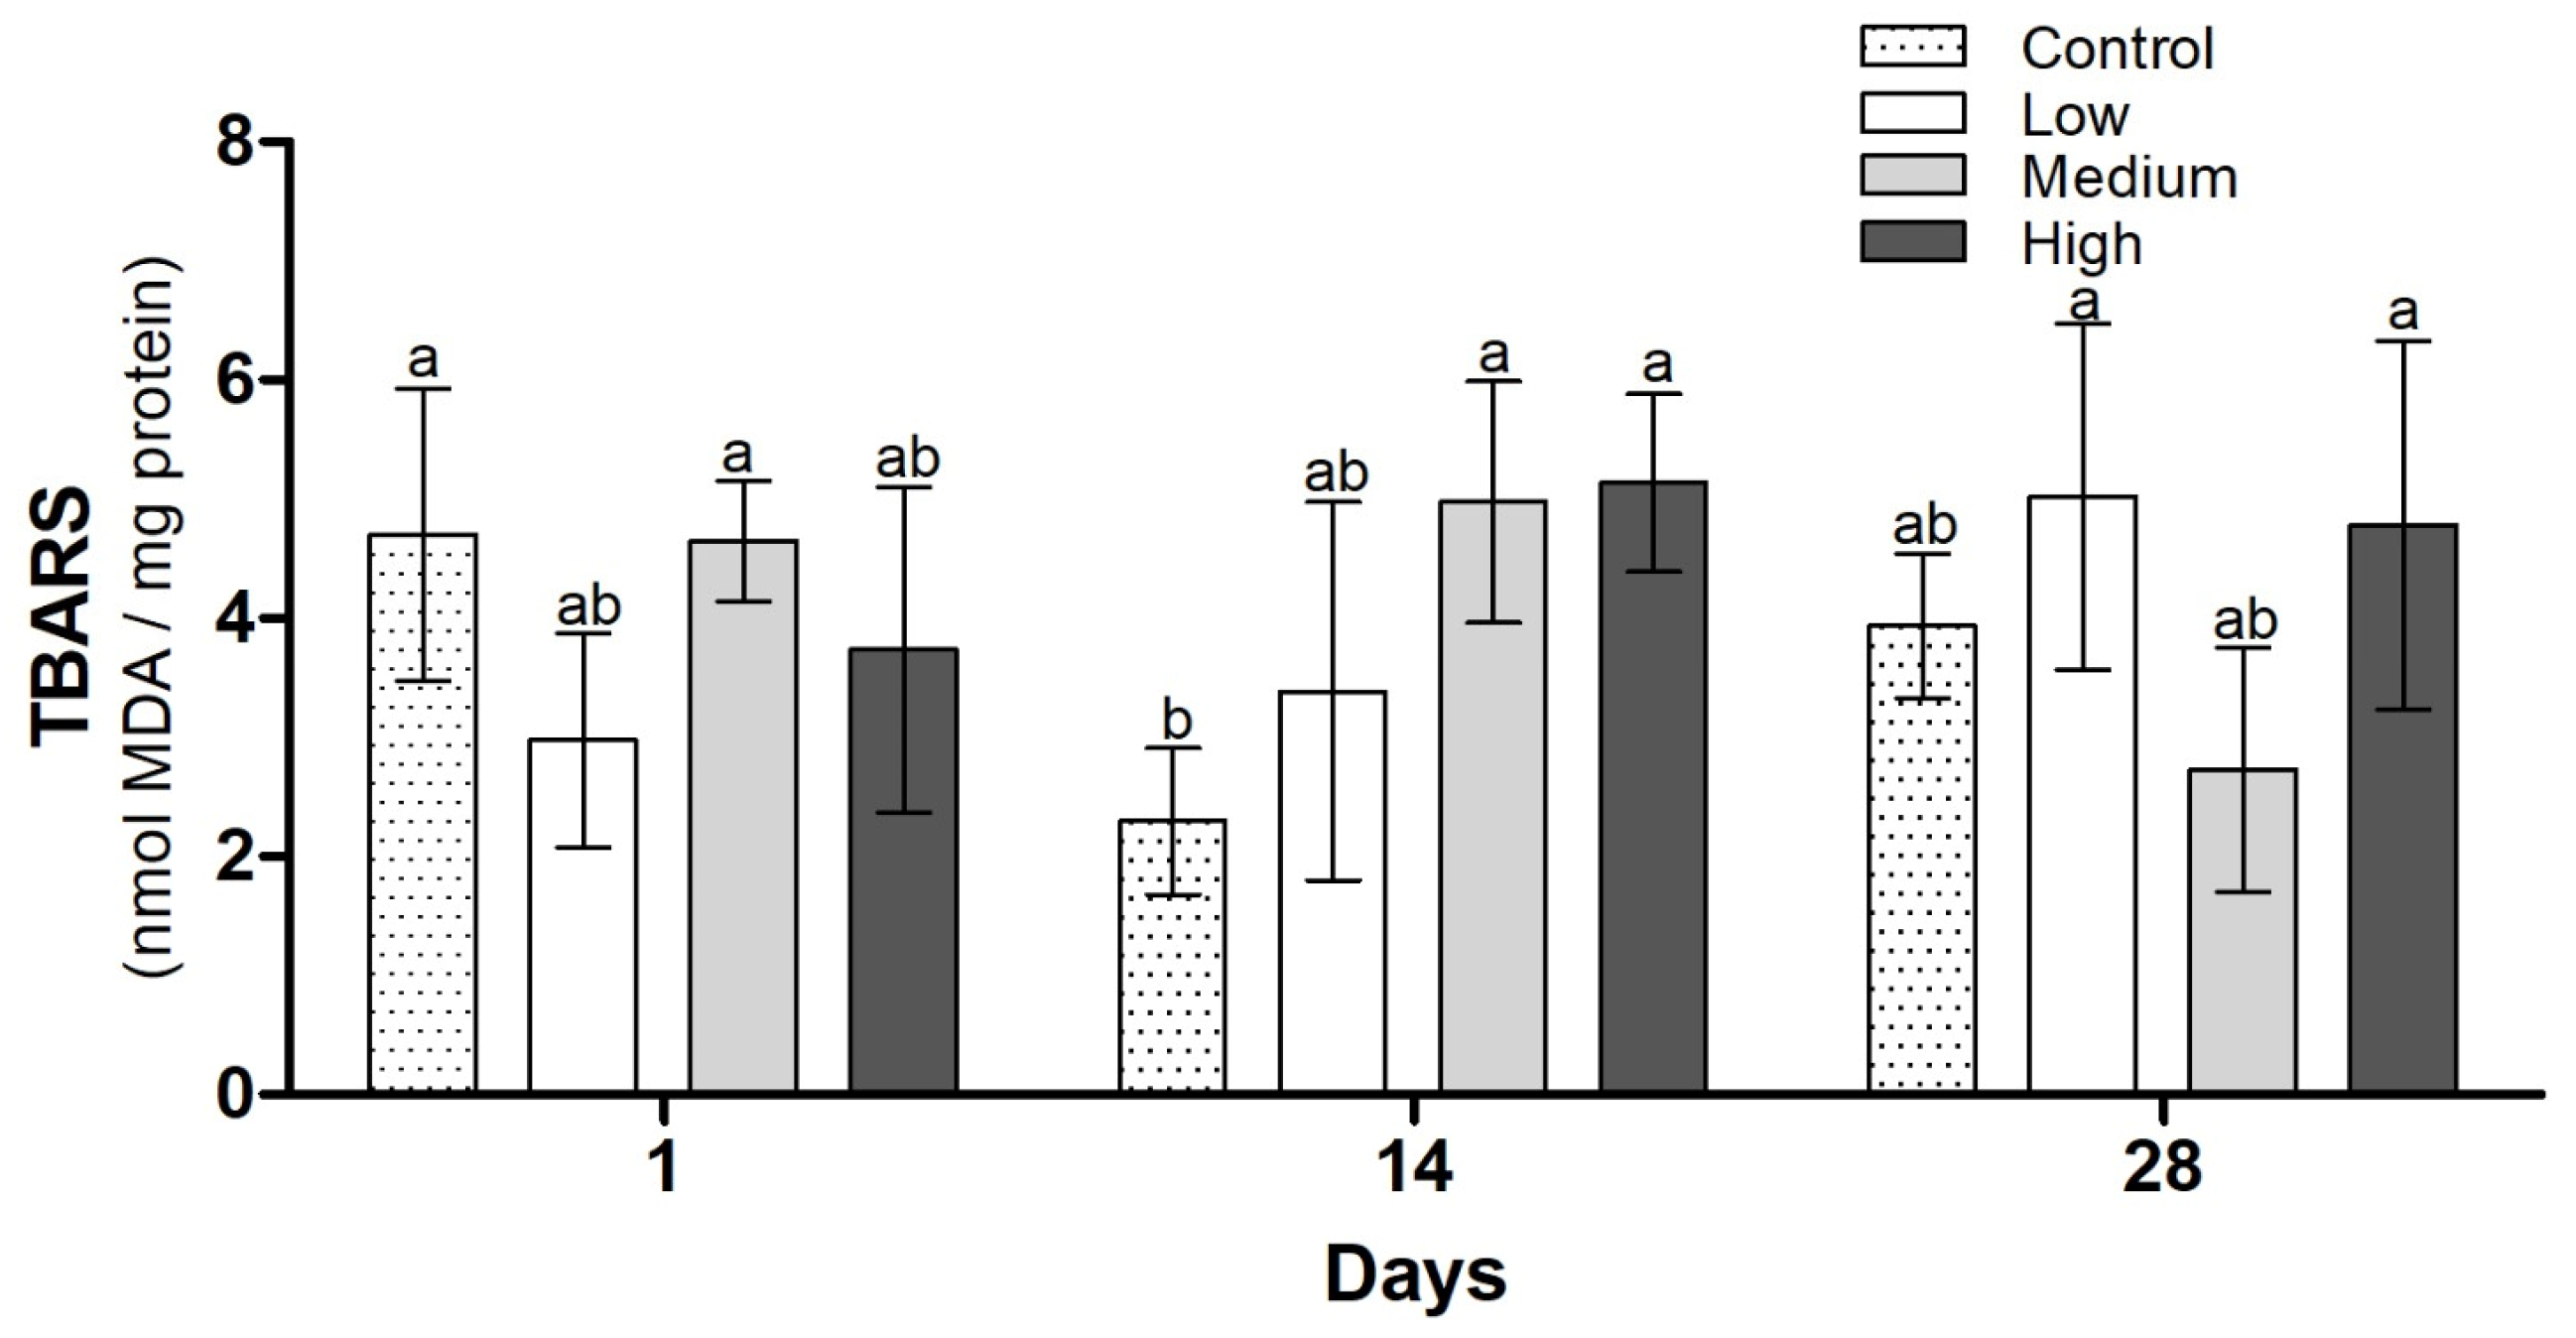
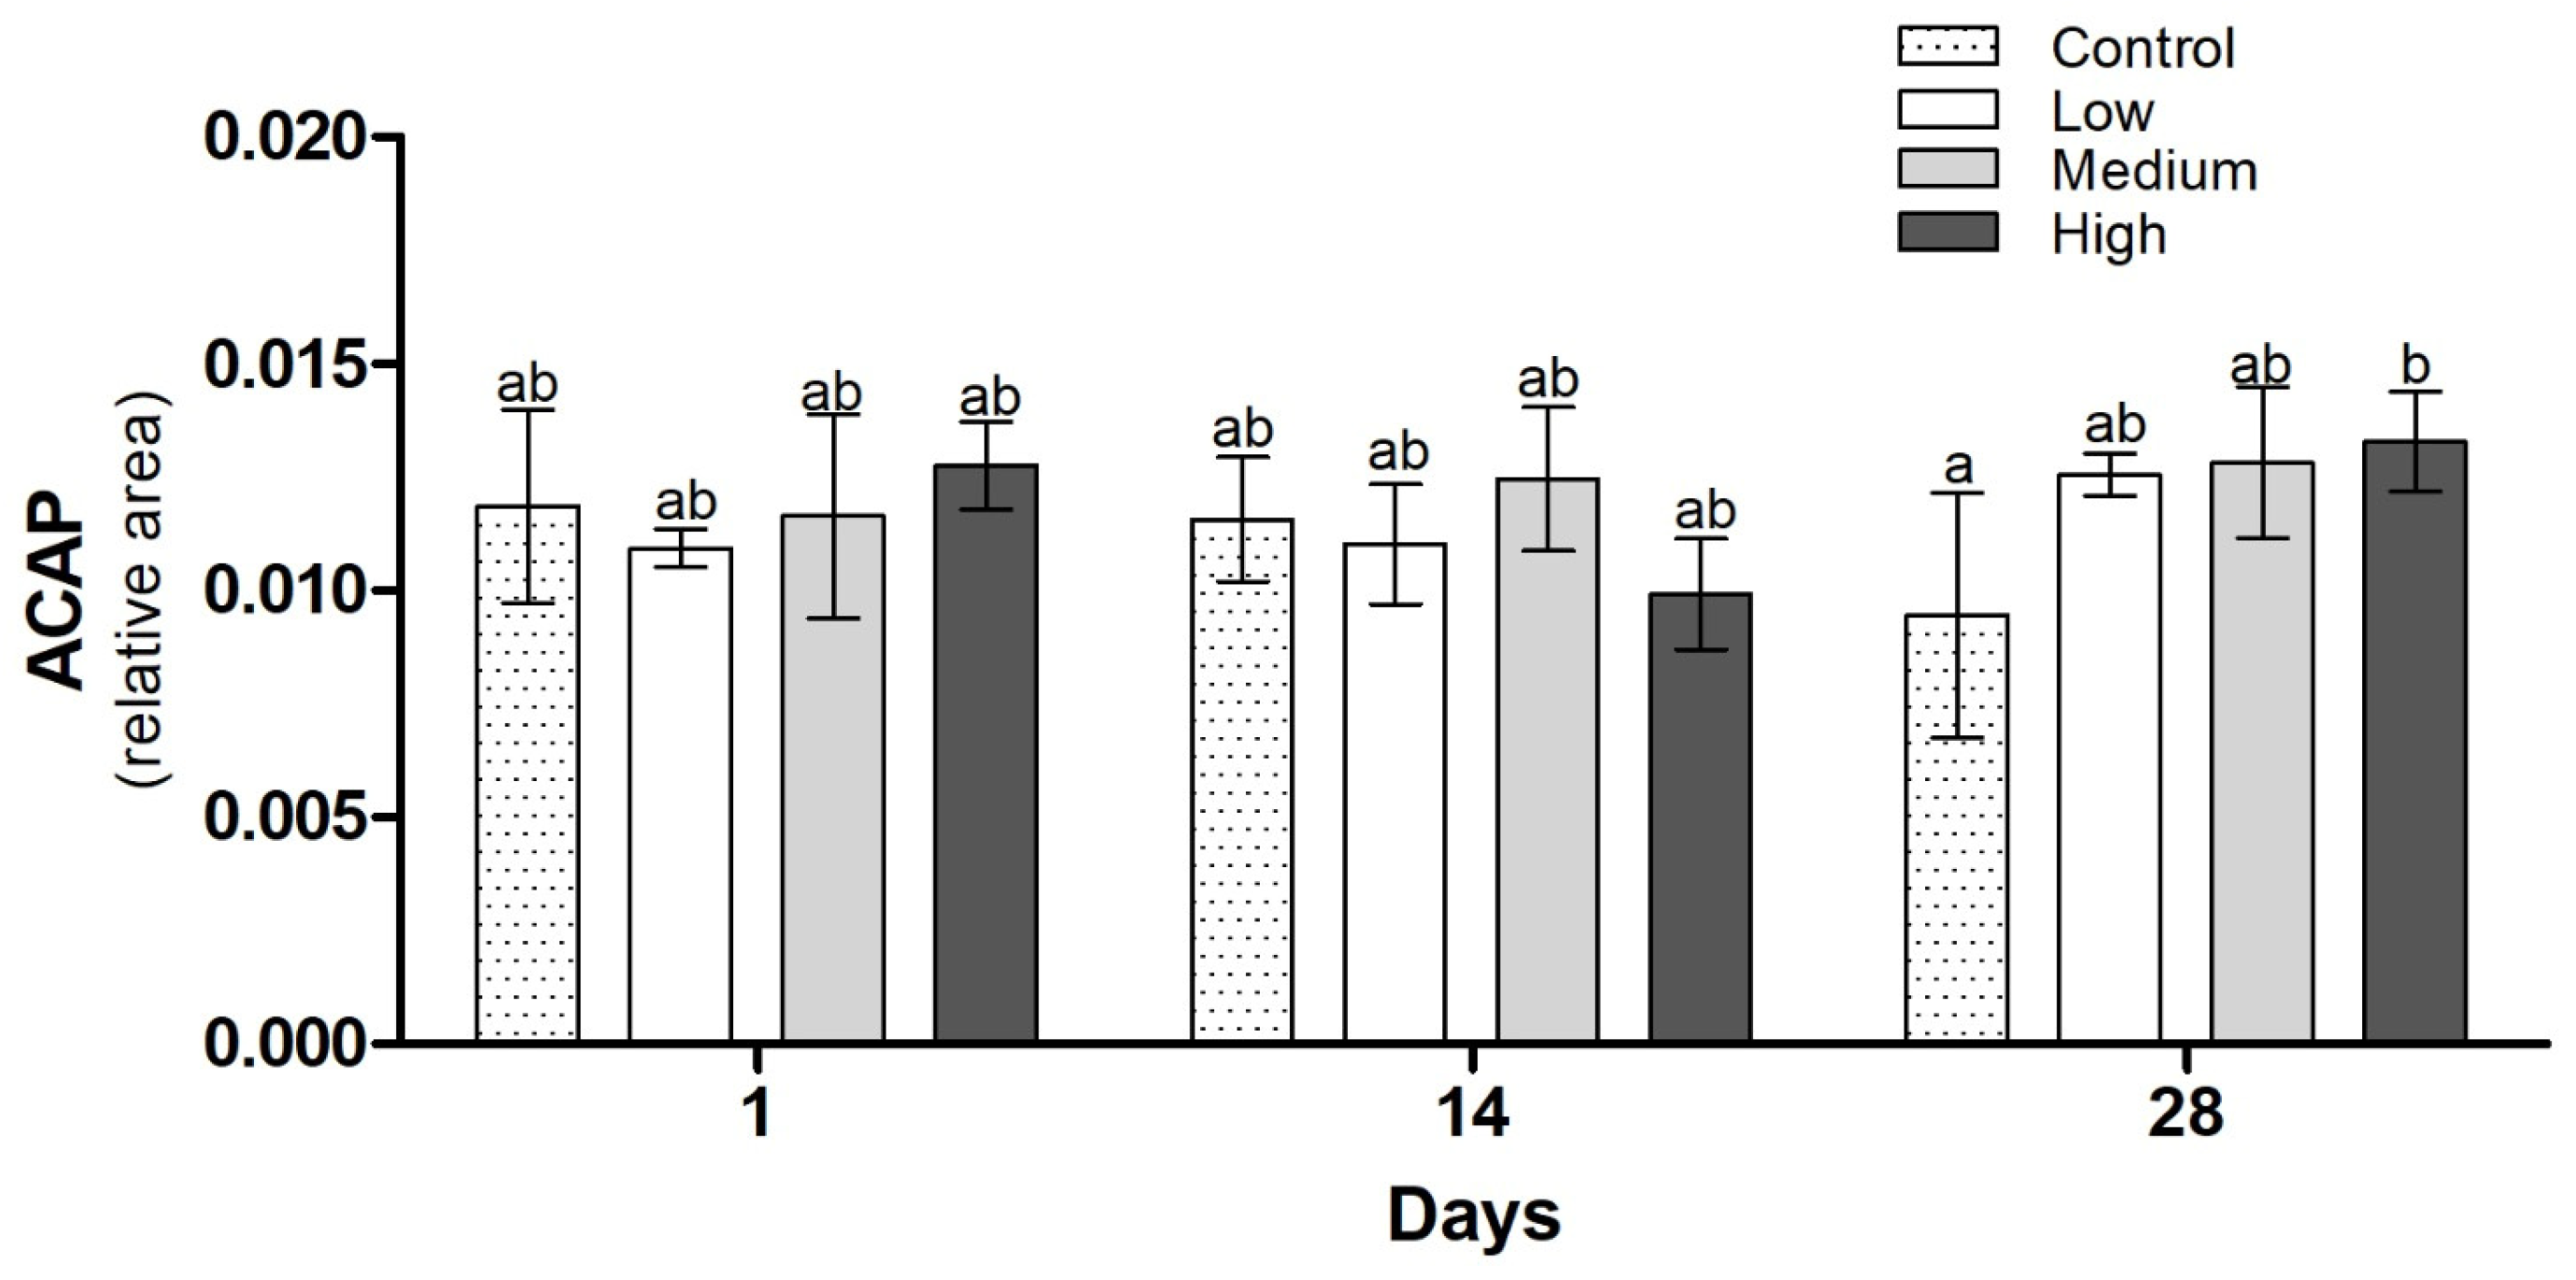
3.3. Biochemical Analysis
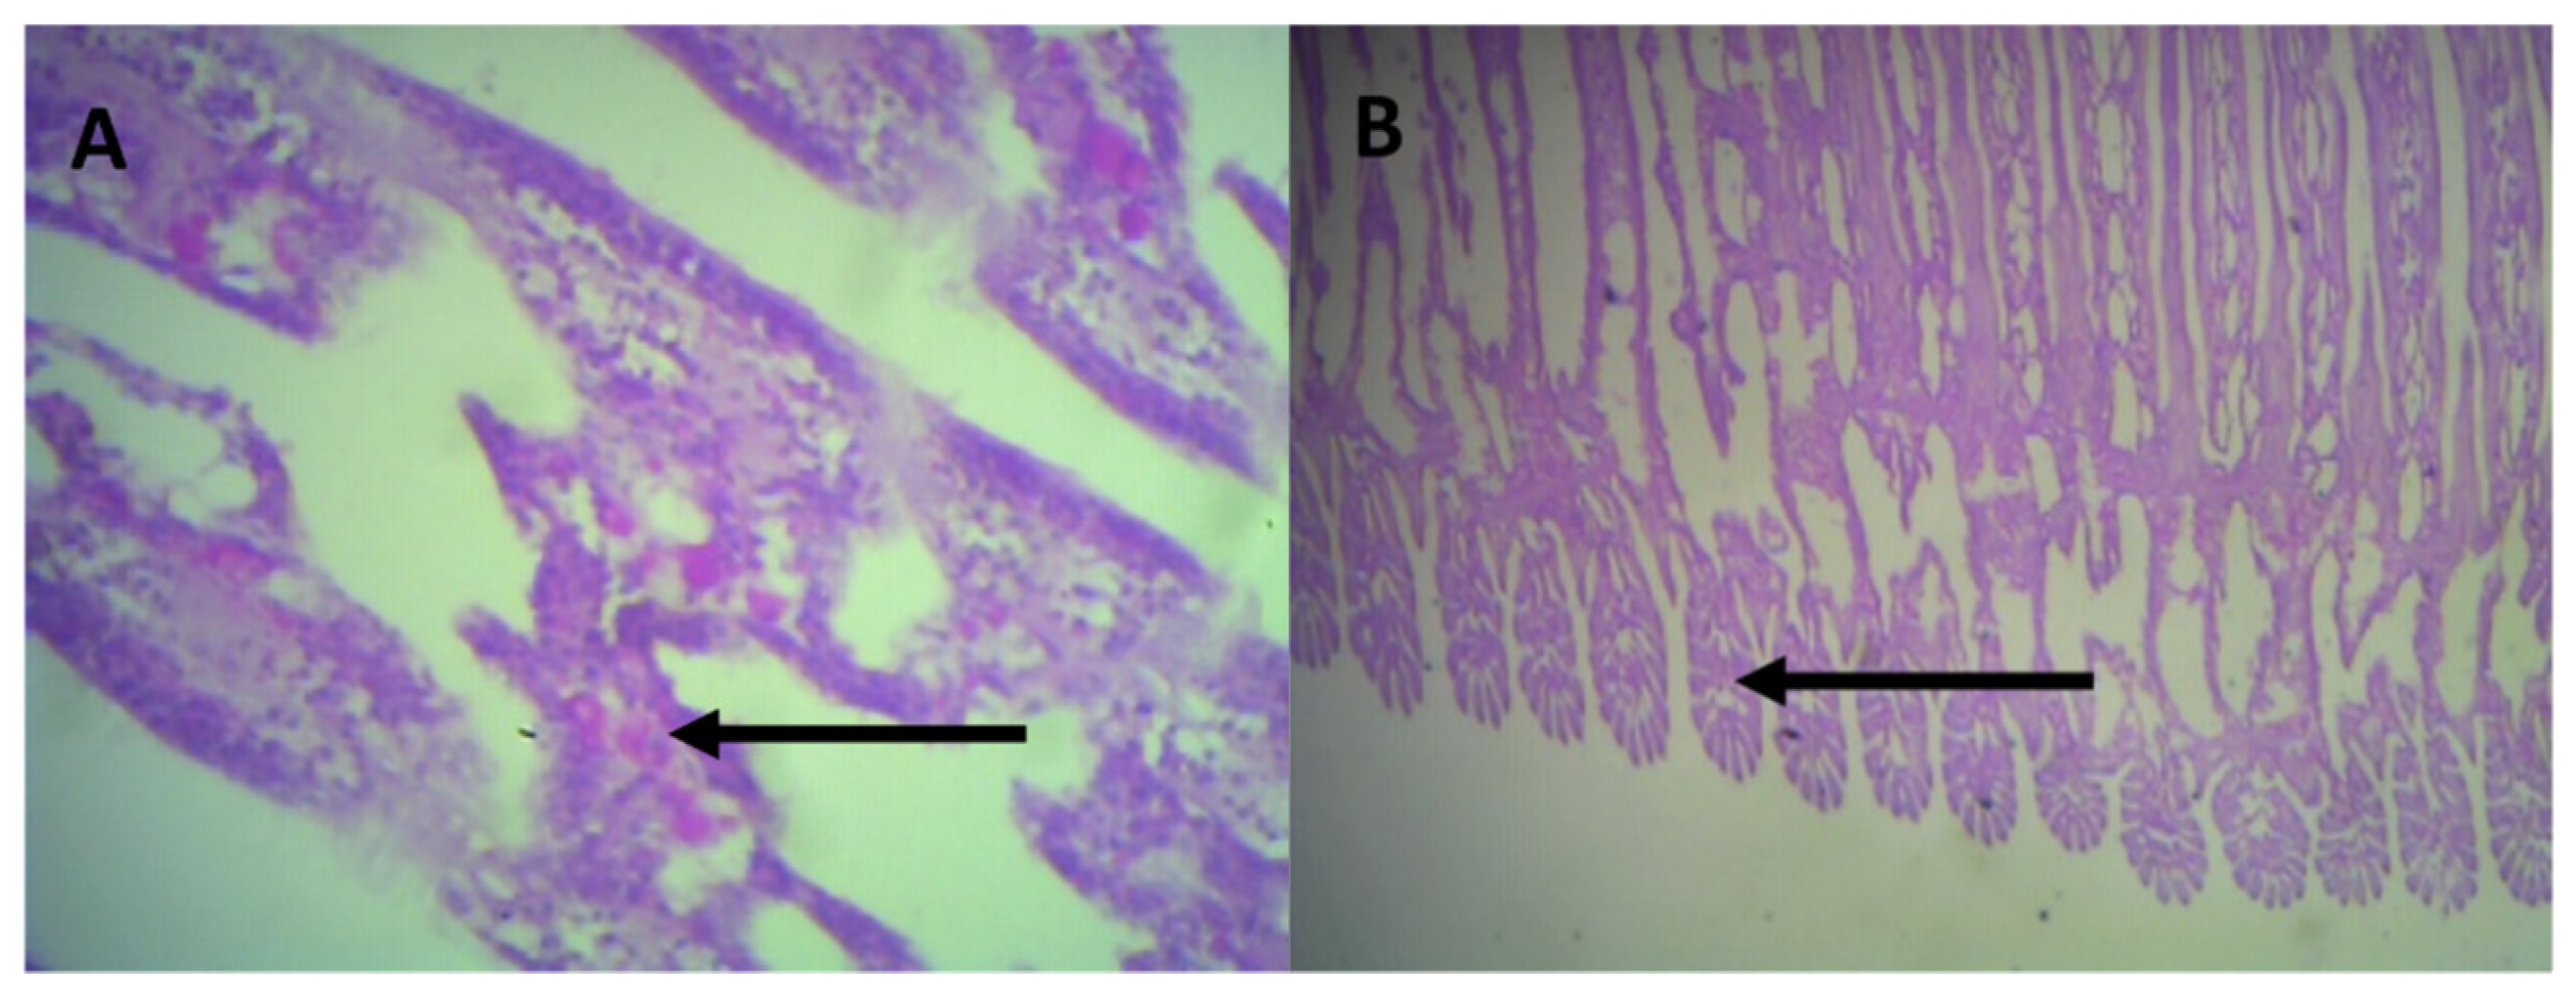
3.4. Histological Analysis
4. Discussion
5. Conclusions
Author Contributions
Funding
Data Availability Statement
Acknowledgments
Conflicts of Interest
References
- FAO. The State of the World Fisheries and Aquaculture—2022 (SOFIA); FAO: Rome, Italy, 2022; ISBN 9789251072257. [Google Scholar]
- Lima, P.C.M.; Silva, A.E.M.; Silva, D.A.; Silva, S.M.B.C.; Brito, L.O.; Gálvez, A.O. Effect of stocking density of Crassostrea sp. in a multitrophic biofloc system with Litopenaeus vannamei in nursery. Aquaculture 2021, 530, 735913. [Google Scholar] [CrossRef]
- Iwama, G.K.; Afonso, L.O.B.; Todgham, A.; Ackerman, P.; Nakano, K. Are hsps suitable for indicating stressed states in fish? J. Exp. Biol. 2004, 207, 15–19. [Google Scholar] [CrossRef]
- Afonso, L.O.B. Identifying and managing maladaptive physiological responses to aquaculture stressors. Fish Physiol. 2020, 38, 163–191. [Google Scholar] [CrossRef]
- Coates, C.J.; Söderhäll, K. The stress–immunity axis in shellfish. J. Invertebr. Pathol. 2021, 186, 107492. [Google Scholar] [CrossRef]
- Guo, X.; He, Y.; Zhang, L.; Lelong, C.; Jouaux, A. Immune and stress responses in oysters with insights on adaptation. Fish Shellfish Immunol. 2015, 46, 107–119. [Google Scholar] [CrossRef]
- Gerhardt, A.; Janssens de Bisthoven, L.; Soares, A.M.V. Evidence for the Stepwise Stress Model: Gambusia holbrooki and Daphnia magna under Acid Mine Drainage and Acidified Reference Water Stress. Environ. Sci. Technol. 2005, 39, 4150–4158. [Google Scholar] [CrossRef] [PubMed]
- de Vargas Guterres, B.; da Silveira Guerreiro, A.; Sandrini, J.Z.; da Costa Botelho, S.S. Feasibility of visual signals on the construction of biosensors based on behavioral analysis of Perna perna mussels. Ecol. Inform. 2020, 59, 101118. [Google Scholar] [CrossRef]
- Newton, T.; Gregory Cope, W. Biomarker Responses of Unionid Mussels to Environmental Contaminants. In Freshwater Bivalve Ecotoxicology; CRC Press: Boca Raton, FL, USA, 2006; pp. 257–284. [Google Scholar] [CrossRef]
- Comeau, L.A.; Babarro, J.M.F.; Longa, A.; Padin, X.A. Valve-gaping behavior of raft-cultivated mussels in the Ría de Arousa, Spain. Aquac. Rep. 2018, 9, 68–73. [Google Scholar] [CrossRef]
- Hartmann, J.T.; Beggel, S.; Auerswald, K.; Geist, J. Determination of the most suitable adhesive for tagging freshwater mussels and its use in an experimental study of filtration behaviour and biological rhythm. J. Molluscan Stud. 2016, 82, 415–421. [Google Scholar] [CrossRef]
- Lummer, E.-M.; Auerswald, K.; Geist, J. Fine sediment as environmental stressor affecting freshwater mussel behavior and ecosystem services. Sci. Total Environ. 2016, 571, 1340–1348. [Google Scholar] [CrossRef]
- Le Moullac, G.; Soyez, C.; Lyonnard, P.; Chabrier, S.; Milhade, L.; Gueguen, Y.; Beliaeff, B. Non-invasive functional exploration techniques for bivalves with applications to pearl oyster Pinctada margaritifera. Rev. Aquac. 2020, 12, 1783–1791. [Google Scholar] [CrossRef]
- Andrewartha, S.J.; Elliott, N.G. Aquaculture Sentinels: Smart-farming with Biosensor Equipped Stock. J. Aquac. Res. Dev. 2015, 7, 393. [Google Scholar] [CrossRef]
- Basti, L.; Nagai, K.; Shimasaki, Y.; Oshima, Y.; Honjo, T.; Segawa, S. Effects of the toxic dinoflagellate Heterocapsa circularisquama on the valve movement behaviour of the Manila clam Ruditapes philippinarum. Aquaculture 2009, 291, 41–47. [Google Scholar] [CrossRef]
- Nagai, K.; Honjo, T.; Go, J.; Yamashita, H.; Oh, S.J. Detecting the shellfish killer Heterocapsa circularisquama (Dinophyceae) by measuring bivalve valve activity with a Hall element sensor. Aquaculture 2006, 255, 395–401. [Google Scholar] [CrossRef]
- Tran, D.; Haberkorn, H.; Soudant, P.; Ciret, P.; Massabuau, J.-C. Behavioral responses of Crassostrea gigas exposed to the harmful algae Alexandrium minutum. Aquaculture 2010, 298, 338–345. [Google Scholar] [CrossRef]
- da Silva Martins, Á.C.; Artigas Flores, J.; Porto, C.; Wasielesky Junior, W.; Monserrat, J.M. Antioxidant and oxidative damage responses in different organs of Pacific white shrimp Litopenaeus vannamei (Boone, 1931) reared in a biofloc technology system. Mar. Freshw. Behav. Physiol. 2015, 48, 279–288. [Google Scholar] [CrossRef]
- Cogo, A.J.; Siqueira, A.F.; Ramos, A.C.; Cruz, Z.M.; Silva, A.G. Utilização de enzimas do estresse oxidativo como biomarcadoras de impactos ambientais. Nat. Line 2009, 7, 37–42. [Google Scholar]
- Valavanidis, A.; Vlahogianni, T.; Dassenakis, M.; Scoullos, M. Molecular biomarkers of oxidative stress in aquatic organisms in relation to toxic environmental pollutants. Ecotoxicol. Environ. Saf. 2006, 64, 178–189. [Google Scholar] [CrossRef] [PubMed]
- Sies, H.; Jones, D.P. Oxidative stress. In Encyclopedia of Stress; Fink, G., Ed.; Elsevier: Amsterdam, The Netherlands, 2007; pp. 45–48. [Google Scholar]
- Jones, D.P. Extracellular Redox State: Refining the Definition of Oxidative Stress in Aging. Rejuvenation Res. 2006, 9, 169–181. [Google Scholar] [CrossRef]
- Kunwar, A.; Priyadarsini, K.I. Free radicals, oxidative stress and importance of antioxidants in human health. J. Med. Allied Sci. 2011, 1, 53–60. [Google Scholar]
- Comporti, M.; Signorini, C.; Leoncini, S.; Gardi, C.; Ciccoli, L.; Giardini, A.; Vecchio, D.; Arezzini, B. Ethanol-induced oxidative stress: Basic knowledge. Genes Nutr. 2010, 5, 101–109. [Google Scholar] [CrossRef]
- Urso, M.L.; Clarkson, P.M. Oxidative stress, exercise, and antioxidant supplementation. Toxicology 2003, 189, 41–54. [Google Scholar] [CrossRef] [PubMed]
- Genten, F.; Terwinghe, E.; Danguy, A. Atlas of Fish Histology; Science Publishers: Enfield, NH, USA, 2008. [Google Scholar]
- Costa, P.M.; Carreira, S.; Costa, M.H.; Caeiro, S. Development of histopathological indices in a commercial marine bivalve (Ruditapes decussatus) to determine environmental quality. Aquat. Toxicol. 2013, 126, 442–454. [Google Scholar] [CrossRef] [PubMed]
- Barillé, L.; Prou, J.; Héral, M.; Razet, D. Effects of high natural seston concentrations on the feeding, selection, and absorption of the oyster Crassostrea gigas (Thunberg). J. Exp. Mar. Bio. Ecol. 1997, 212, 149–172. [Google Scholar] [CrossRef]
- Gaona, C.A.P.; de Almeida, M.S.; Viau, V.; Poersch, L.H.; Wasielesky, W. Effect of different total suspended solids levels on a Litopenaeus vannamei (Boone, 1931) BFT culture system during biofloc formation. Aquac. Res. 2017, 48, 1070–1079. [Google Scholar] [CrossRef]
- Guillard, R.R.L. Culture of phytoplankton for feeding marine invertebrates. In Culture of Marine Invertebrate Animals; Smith, W.L., Chanley, M.H., Eds.; Plenum: New York, NY, USA, 1975; pp. 29–60. [Google Scholar]
- AOAC. Official Methods of Analysis of the AOAC, 14th ed.; AOAC International: Washington, DC, USA, 1999. [Google Scholar]
- Avnimelech, Y. Feeding with microbial flocs by tilapia in minimal discharge bio-flocs technology ponds. Aquaculture 2007, 264, 140–147. [Google Scholar] [CrossRef]
- APHA. Standard Methods for the Examination of Water and Waste Water, 16th ed.; American Public Health Association, AWWA, WPFC: New York, NY, USA, 1989. [Google Scholar]
- UNESCO. Chemical Methods for Use in Marine Environmental Monitoring. Manual and Guides 12; Intergovernamental Oceanographic Commissiony: Paris, France, 1983. [Google Scholar]
- Strickland, J.D.H.; Parsons, T.R. A Practical Handbook of Seawater Analysis, 2nd ed.; Fisheries research board of Canada: Ottawa, ON, Canada, 1972. [Google Scholar]
- Furtado, P.S.; Poersch, L.H.; Wasielesky, W. The effect of different alkalinity levels on Litopenaeus vannamei reared with biofloc technology (BFT). Aquac. Int. 2015, 23, 345–358. [Google Scholar] [CrossRef]
- Aminot, A.; Chaussepied, M. Manuel des Analyses Chimiques en Milieu Marin; Centre National Pour L’exploitation des Océans: Brest, France, 1983. [Google Scholar]
- Clements, J.C.; Poirier, L.A.; Pérez, F.F.; Comeau, L.A.; Babarro, J.M.F. Behavioural responses to predators in Mediterranean mussels (Mytilus galloprovincialis) are unaffected by elevated pCO2. Mar. Environ. Res. 2020, 161, 105148. [Google Scholar] [CrossRef]
- Bebianno, M.J.; Mello, A.C.P.; Serrano, M.A.S.; Flores-Nunes, F.; Mattos, J.J.; Zacchi, F.L.; Piazza, C.E.; Siebert, M.N.; Piazza, R.S.; Gomes, C.H.A.M.; et al. Transcriptional and cellular effects of paracetamol in the oyster Crassostrea gigas. Ecotoxicol. Environ. Saf. 2017, 144, 258–267. [Google Scholar] [CrossRef]
- Bradford, M.M. A rapid and sensitive method for the quantitation of microgram quantities of protein utilizing the principle of protein-dye binding. Anal. Biochem. 1976, 72, 248–254. [Google Scholar] [CrossRef]
- Habig, W.H.; Pabst, M.J.; Jakoby, W.B. Glutathione S-Transferases. J. Biol. Chem. 1974, 249, 7130–7139. [Google Scholar] [CrossRef] [PubMed]
- Beutler, E. The preparation of red cells for assay. In Red Cell Metabolism: A Manual of Biochemical Methods; Beutler, E., Ed.; Grune & Straton: New York, NY, USA, 1975; pp. 8–18. [Google Scholar]
- Sedlak, J.; Lindsay, R.H. Estimation of total, protein-bound, and nonprotein sulfhydryl groups in tissue with Ellman’s reagent. Anal. Biochem. 1968, 25, 192–205. [Google Scholar] [CrossRef] [PubMed]
- Oakes, K.D.; Van Der Kraak, G.J. Utility of the TBARS assay in detecting oxidative stress in white sucker (Catostomus commersoni) populations exposed to pulp mill effluent. Aquat. Toxicol. 2003, 63, 447–463. [Google Scholar] [CrossRef]
- Amado, L.L.; Garcia, M.L.; Ramos, P.B.; Freitas, R.F.; Zafalon, B.; Ferreira, J.L.R.; Yunes, J.S.; Monserrat, J.M. A method to measure total antioxidant capacity against peroxyl radicals in aquatic organisms: Application to evaluate microcystins toxicity. Sci. Total Environ. 2009, 407, 2115–2123. [Google Scholar] [CrossRef] [PubMed]
- McCord, J.M.; Fridovich, I. Superoxide Dismutase. J. Biol. Chem. 1969, 244, 6049–6055. [Google Scholar] [CrossRef]
- Bainy, A.C.D.; Saito, E.; Carvalho, P.S.M.; Junqueira, V.B.C. Oxidative stress in gill, erythrocytes, liver and kidney of Nile tilapia (Oreochromis niloticus) from a polluted site. Aquat. Toxicol. 1996, 34, 151–162. [Google Scholar] [CrossRef]
- Zar, J.H. Biostatistical Analysis, 5th ed.; Prentice Hall: Upper Saddle River, NJ, USA, 2010. [Google Scholar]
- Schveitzer, R.; Arantes, R.; Costódio, P.F.S.; do Espírito Santo, C.M.; Arana, L.V.; Seiffert, W.Q.; Andreatta, E.R. Effect of different biofloc levels on microbial activity, water quality and performance of Litopenaeus vannamei in a tank system operated with no water exchange. Aquac. Eng. 2013, 56, 59–70. [Google Scholar] [CrossRef]
- Ekasari, J.; Angela, D.; Waluyo, S.H.; Bachtiar, T.; Surawidjaja, E.H.; Bossier, P.; De Schryver, P. The size of biofloc determines the nutritional composition and the nitrogen recovery by aquaculture animals. Aquaculture 2014, 426, 105–111. [Google Scholar] [CrossRef]
- Avnimelech, Y. Bio-filters: The need for an new comprehensive approach. Aquac. Eng. 2006, 34, 172–178. [Google Scholar] [CrossRef]
- Hargreaves, J.A. Photosynthetic suspended-growth systems in aquaculture. Aquac. Eng. 2006, 34, 344–363. [Google Scholar] [CrossRef]
- Lombardi, S.A.; Harlan, N.P.; Paynter, K.T. Survival, Acid—Base Balance, and Gaping Responses of the Asian Oyster Crassostrea ariakensis and the Eastern Oyster Crassostrea virginica During Clamped Emersion and Hypoxic Immersion. J. Shellfish Res. 2013, 32, 409–415. [Google Scholar] [CrossRef]
- Porter, E.T.; Breitburg, D.L. Eastern oyster, Crassostrea virginica, valve gape behavior under diel-cycling hypoxia. Mar. Biol. 2016, 163, 218. [Google Scholar] [CrossRef]
- Ballesta-Artero, I.; Witbaard, R.; Carroll, M.L.; van der Meer, J. Environmental factors regulating gaping activity of the bivalve Arctica islandica in Northern Norway. Mar. Biol. 2017, 164, 116. [Google Scholar] [CrossRef] [PubMed]
- Comeau, L.A.; Sonier, R.; Guyondet, T.; Landry, T.; Ramsay, A.; Davidson, J. Behavioural response of bivalve molluscs to calcium hydroxide. Aquaculture 2017, 466, 78–85. [Google Scholar] [CrossRef]
- Liao, C.-M.; Jau, S.-F.; Lin, C.-M.; Jou, L.-J.; Liu, C.-W.; Liao, V.H.-C.; Chang, F.-J. Valve movement response of the freshwater clam Corbicula fluminea following exposure to waterborne arsenic. Ecotoxicology 2009, 18, 567–576. [Google Scholar] [CrossRef] [PubMed]
- Charifi, M.; Sow, M.; Ciret, P.; Benomar, S.; Massabuau, J.-C. The sense of hearing in the Pacific oyster, Magallana gigas. PLoS ONE 2017, 12, e0185353. [Google Scholar] [CrossRef] [PubMed]
- Møhlenberg, F.; Riisgård, H.U. Filtration rate, using a new indirect technique, in thirteen species of suspension-feeding bivalves. Mar. Biol. 1979, 54, 143–147. [Google Scholar] [CrossRef]
- Newell, C.R.; Wildish, D.; MacDonald, B. The effects of velocity and seston concentration on the exhalant siphon area, valve gape and filtration rate of the mussel Mytilus edulis. J. Exp. Mar. Biol. Ecol. 2001, 262, 91–111. [Google Scholar] [CrossRef]
- Riisgård, H.U.; Larsen, P.S. Physiologically regulated valve-closure makes mussels long-term starvation survivors: Test of hypothesis. J. Molluscan Stud. 2015, 81, 303–307. [Google Scholar] [CrossRef]
- Schreck, C.B.; Olla, B.L.; Davis, M.W. Behavioral responses to stress. In Fish Stress and Health in Aquaculture; Cambridge University Press: Cambridge, UK, 1997; pp. 145–170. [Google Scholar]
- Clements, J.C.; Comeau, L.A. Use of High-Frequency Noninvasive Electromagnetic Biosensors to Detect Ocean Acidification Effects on Shellfish Behavior. J. Shellfish Res. 2019, 38, 811. [Google Scholar] [CrossRef]
- Romano, N.; Zeng, C. Toxic Effects of Ammonia, Nitrite, and Nitrate to Decapod Crustaceans: A Review on Factors Influencing their Toxicity, Physiological Consequences, and Coping Mechanisms. Rev. Fish. Sci. 2013, 21, 1–21. [Google Scholar] [CrossRef]
- Brol, J.; Müller, L.; Prates, E.C.A.; de Farias, B.S.; Pedrosa, V.F.; de Almeida Pinto, L.A.; Sant’anna Cadaval, T.R.; Tesser, M.B.; Wasielesky, W.; Ventura-Lima, J. Dietary chitosan supplementation in Litopenaeus vannamei reared in a biofloc system: Effect on antioxidant status facing saline stress. Aquaculture 2021, 544, 737034. [Google Scholar] [CrossRef]
- de Souza, D.M.; Borges, V.D.; Furtado, P.; Romano, L.A.; Wasielesky, W.; Monserrat, J.M.; de Oliveira Garcia, L. Antioxidant enzyme activities and immunological system analysis of Litopenaeus vannamei reared in biofloc technology (BFT) at different water temperatures. Aquaculture 2016, 451, 436–443. [Google Scholar] [CrossRef]
- Martins, G.B.; da Rosa, C.E.; Tarouco, F.d.M.; Robaldo, R.B. Growth, water quality and oxidative stress of Nile tilapia Oreochromis niloticus (L.) in biofloc technology system at different pH. Aquac. Res. 2019, 50, 1030–1039. [Google Scholar] [CrossRef]
- da Silva Martins, Á.C.; Artigas Flores, J.; Porto, C.; Romano, L.A.; Wasielesky Junior, W.; Caldas, S.S.; Primel, E.G.; Külkamp-Guerreiro, I.; Monserrat, J.M. Antioxidant effects of nanoencapsulated lipoic acid in tissues and on the immune condition in haemolymph of Pacific white shrimp Litopenaeus vannamei (Boone, 1931). Aquac. Nutr. 2018, 24, 1255–1262. [Google Scholar] [CrossRef]
- Pellegrin, L.; Nitz, L.F.; Pinto, D.d.S.B.; Copatti, C.E.; Wasielesky, W.; Garcia, L. Effects of suspended solids in the survival and haematological parameters of pacu juveniles (Piaractus mesopotamicus) in a biofloc technology culture system. Aquac. Res. 2022, 53, 276–284. [Google Scholar] [CrossRef]
- Zanette, J.; de Almeida, E.A.; da Silva, A.Z.; Guzenski, J.; Ferreira, J.F.; Di Mascio, P.; Marques, M.R.F.; Bainy, A.C.D. Salinity influences glutathione S-transferase activity and lipid peroxidation responses in the Crassostrea gigas oyster exposed to diesel oil. Sci. Total Environ. 2011, 409, 1976–1983. [Google Scholar] [CrossRef]
- Sies, H. Strategies of antioxidant defense. Eur. J. Biochem. 1993, 215, 213–219. [Google Scholar] [CrossRef]
- Sies, H.; Berndt, C.; Jones, D.P. Oxidative stress. Annu. Rev. Biochem. 2017, 86, 715–748. [Google Scholar] [CrossRef] [PubMed]
- Winston, G.W.; Regoli, F.; Dugas, A.J.; Fong, J.H.; Blanchard, K.A. A Rapid Gas Chromatographic Assay for Determining Oxyradical Scavenging Capacity of Antioxidants and Biological Fluids. Free Radic. Biol. Med. 1998, 24, 480–493. [Google Scholar] [CrossRef]
- Sabatini, S.E.; Rocchetta, I.; Nahabedian, D.E.; Luquet, C.M.; Eppis, M.R.; Bianchi, L.; Ríos de Molina, M.d.C. Oxidative stress and histological alterations produced by dietary copper in the fresh water bivalve Diplodon chilensis. Comp. Biochem. Physiol. Part C Toxicol. Pharmacol. 2011, 154, 391–398. [Google Scholar] [CrossRef]
- Li, Z.; Chang, X.; Hu, M.; Fang, J.K.-H.; Sokolova, I.M.; Huang, W.; Xu, E.G.; Wang, Y. Is microplastic an oxidative stressor? Evidence from a meta-analysis on bivalves. J. Hazard. Mater. 2022, 423, 127211. [Google Scholar] [CrossRef]
- Basti, L.; Endo, M.; Segawa, S.; Shumway, S.E.; Tanaka, Y.; Nagai, S. Prevalence and intensity of pathologies induced by the toxic dinoflagellate, Heterocapsa circularisquama, in the Mediterranean mussel, Mytilus galloprovincialis. Aquat. Toxicol. 2015, 163, 37–50. [Google Scholar] [CrossRef] [PubMed]
- Au, D.W.T. The application of histo-cytopathological biomarkers in marine pollution monitoring: A review. Mar. Pollut. Bull. 2004, 48, 817–834. [Google Scholar] [CrossRef] [PubMed]
- Salas-Yanquin, L.P.; Navarro, J.M.; Pechenik, J.A.; Montory, J.A.; Chaparro, O.R. Volcanic ash in the water column: Physiological impact on the suspension-feeding bivalve Mytilus chilensis. Mar. Pollut. Bull. 2018, 127, 342–351. [Google Scholar] [CrossRef]
- Garrido, M.V.; Chaparro, O.R.; Thompson, R.J.; Garrido, O.; Navarro, J.M. Particle sorting and formation and elimination of pseudofaeces in the bivalves Mulinia edulis (siphonate) and Mytilus chilensis (asiphonate). Mar. Biol. 2012, 159, 987–1000. [Google Scholar] [CrossRef]
- de Oliveira David, J.A.; Salaroli, R.B.; Fontanetti, C.S. Fine structure of Mytella falcata (Bivalvia) gill filaments. Micron 2008, 39, 329–336. [Google Scholar] [CrossRef] [PubMed]
- Zannella, C.; Mosca, F.; Mariani, F.; Franci, G.; Folliero, V.; Galdiero, M.; Tiscar, P.G.; Galdiero, M. Microbial Diseases of Bivalve Mollusks: Infections, Immunology and Antimicrobial Defense. Mar. Drugs 2017, 15, 182. [Google Scholar] [CrossRef]


| Treatments | ||||
|---|---|---|---|---|
| Parameters | Control | Low | Medium | High |
| Oxygen (mg/L) | 6.83 ± 0.67 | 6.65 ± 0.62 | 6.84 ± 0.64 | 6.79 ± 0.63 |
| Temperature (°C) | 20.76 ± 1.83 a | 20.64 ± 1.51 a | 19.40 ± 1.79 b | 20.07 ± 1.43 b |
| pH | 8.21 ± 0.05 b | 8.31 ± 0.06 a | 8.31 ± 0.05 a | 8.32 ± 0.05 a |
| SS (mL/L) | 0.00 ± 0.00 a | 0.06 ± 0.12 a | 1.78 ± 2.00 b | 5.65 ± 4.62 c |
| TSS (mg/L) | 83.04 ± 29.18 a | 71.27 ± 44.74 a | 189.88 ± 120.15 b | 291.38 ± 98.26 c |
| Turbidity (NUT) | 22.74 ± 18.17 a | 33.30 ± 35.02 a | 108.29 ± 72.43 b | 259.22 ± 142.88 c |
| Alkalinity (mg CaCO3/L) | 146.11 ± 10.54 | 167.22 ± 25.51 | 173.33 ± 21.94 | 173.33 ± 41.53 |
| Salinity | 33.63 ± 2.39 | 32.38 ± 1.41 | 31.63 ± 1.69 | 32.00 ± 1.07 |
| Ammonia (mg/L) | 0.17 ± 0.13 | 0.09 ± 0.04 | 0.08 ± 0.04 | 0.11 ± 0.04 |
| Nitrite (mg/L) | 0.65 ± 0.60 b | 0.07 ± 0.06 a | 0.12 ± 0.18 a | 0.13 ± 0.11 a |
| Nitrate (mg/L) | 9.56 ± 4.42 a | 10.87 ± 4.85 a | 17.20 ± 5.55 ab | 20.76 ± 8.56 b |
| Phosphate (mg/L) | 2.64 ± 1.14 a | 3.80 ± 0.87 a | 6.76 ± 2.05 b | 6.50 ± 0.84 b |
| Opening Range of Oyster Valves | ||||||
|---|---|---|---|---|---|---|
| Treatment | Week | Closed | Slightly Open | Moderately Open | Open | Fully Open |
| Control | 1 | 64.54 ± 7.15 | 0.20 ± 0.45 | 0.90 ± 0.67 | 7.06 ± 4.89 | 27.30 ± 7.25 |
| Low | 1 | 73.23 ± 5.88 | 0.02 ± 0.02 | 1.90 ± 1.23 | 6.78 ± 2.93 | 18.07 ± 7.79 |
| Medium | 1 | 64.32 ± 7.81 | 0.24 ± 0.48 | 0.95 ± 0.71 | 7.51 ± 5.20 | 26.97 ± 7.89 |
| High | 1 | 60.86 ± 14.36 | 0.00 ± 0.00 | 0.89 ± 0.53 | 6.40 ± 2.80 | 31.84 ± 14.02 |
| Control | 2 | 39.35 ± 22.57 | 0.00 ± 0.00 | 0.18 ± 0.29 | 3.87 ± 3.48 | 56.60 ± 20.75 ab |
| Low | 2 | 64.80 ± 26.72 | 0.07 ± 0.07 | 0.69 ± 0.60 | 4.45 ± 2.95 | 30.00 ± 25.67 bc |
| Medium | 2 | 31.01 ± 10.75 | 0.00 ± 0.00 | 0.13 ± 0.28 | 4.37 ± 3.64 | 64.40 ± 9.03 a |
| High | 2 | 65.04 ± 20.13 | 0.11 ± 0.13 | 5.39 ± 10.55 | 18.00 ± 25.16 | 11.47 ± 9.71 c |
| Control | 3 | 66.97 ± 15.14 a | 0.03 ± 0.02 ab | 1.17 ± 1.02 | 3.77 ± 3.25 | 28.05 ± 12.88 a |
| Low | 3 | 79.97 ± 4.93 ab | 0.04 ± 0.01 ab | 0.56 ± 0.71 | 2.99 ± 2.77 | 16.44 ± 7.64 ab |
| Medium | 3 | 79.67 ± 4.57 ab | 0.12 ± 0.05 a | 1.23 ± 0.77 | 4.83 ± 2.95 | 14.14 ± 2.09 ab |
| High | 3 | 85.10 ± 6.29 b | 0.01 ± 0.01 b | 0.19 ± 0.12 | 5.66 ± 8.08 | 9.04 ± 3.91 b |
| Control | 4 | 56.99 ± 27.22 | 0.02 ± 0.04 | 1.45 ± 0.13 | 10.83 ± 5.04 | 30.71 ± 28.23 |
| Low | 4 | 65.06 ± 14.52 | 0.04 ± 0.04 | 0.94 ± 0.73 | 6.30 ± 2.66 | 27.66 ± 15.98 |
| Medium | 4 | 54.10 ± 15.54 | 0.04 ± 0.07 | 1.38 ± 0.68 | 10.60 ± 7.24 | 33.88 ± 15.81 |
| High | 4 | 52.43 ± 17.72 | 0.00 ± 0.00 | 0.57 ± 0.33 | 8.78 ± 7.76 | 38.22 ± 10.58 |
Disclaimer/Publisher’s Note: The statements, opinions and data contained in all publications are solely those of the individual author(s) and contributor(s) and not of MDPI and/or the editor(s). MDPI and/or the editor(s) disclaim responsibility for any injury to people or property resulting from any ideas, methods, instructions or products referred to in the content. |
© 2023 by the authors. Licensee MDPI, Basel, Switzerland. This article is an open access article distributed under the terms and conditions of the Creative Commons Attribution (CC BY) license (https://creativecommons.org/licenses/by/4.0/).
Share and Cite
Costa, L.C.d.O.; Carvalho, A.; Holanda, M.; Santos, J.; Borges, L.; Guterres, B.; Nam Junior, J.; Fonseca, V.; Muller, L.; Romano, L.; et al. Biological Responses of Oyster Crassostrea gasar Exposed to Different Concentrations of Biofloc. Fishes 2023, 8, 586. https://doi.org/10.3390/fishes8120586
Costa LCdO, Carvalho A, Holanda M, Santos J, Borges L, Guterres B, Nam Junior J, Fonseca V, Muller L, Romano L, et al. Biological Responses of Oyster Crassostrea gasar Exposed to Different Concentrations of Biofloc. Fishes. 2023; 8(12):586. https://doi.org/10.3390/fishes8120586
Chicago/Turabian StyleCosta, Léa Carolina de Oliveira, Andrezza Carvalho, Mariana Holanda, Jorge Santos, Lucélia Borges, Bruna Guterres, Je Nam Junior, Virginia Fonseca, Larissa Muller, Luis Romano, and et al. 2023. "Biological Responses of Oyster Crassostrea gasar Exposed to Different Concentrations of Biofloc" Fishes 8, no. 12: 586. https://doi.org/10.3390/fishes8120586
APA StyleCosta, L. C. d. O., Carvalho, A., Holanda, M., Santos, J., Borges, L., Guterres, B., Nam Junior, J., Fonseca, V., Muller, L., Romano, L., Botelho, S., Pias, M., Ventura, J., & Poersch, L. H. (2023). Biological Responses of Oyster Crassostrea gasar Exposed to Different Concentrations of Biofloc. Fishes, 8(12), 586. https://doi.org/10.3390/fishes8120586