Article

Genetic Connectivity of Roundjaw Bonefish Albula glossodonta (Elopomorpha, Albulidae) in the Central Pacific Ocean Resolved through ddRAD-Based Population Genomics

1
Hawaii Institute of Marine Biology SOEST, University of Hawai‘i, Kaneohe, HI 96744, USA
2
NOAA Pacific Islands Fisheries Science Center, Honolulu, HI 96818, USA
3
Hawai‘i Division of Aquatic Resources, Anuenue Fisheries Research Center, Honolulu, HI 96819, USA
4
FWC Fish and Wildlife Research Institute, St. Petersburg, FL 33701, USA
*
Author to whom correspondence should be addressed.
This manuscript is part of a Ph.D. dissertation by the first author Keith Kamikawa. Ph.D. Marine Biology Graduate Program in the University of Hawai‘i.
Fishes 2023, 8(12), 585; https://doi.org/10.3390/fishes8120585
Submission received: 30 October 2023 / Revised: 23 November 2023 / Accepted: 23 November 2023 / Published: 29 November 2023

Abstract

:
Bonefishes are a nearshore species targeted by non-commercial anglers and subsistence fishers in the Central and South Pacific islands. Among the bonefish species in the Indo-Pacific region, Albula glossodonta are known to have one of the widest geographic ranges, from the Red Sea to the Central Pacific, but it is unknown how dispersive A. glossodonta are between geographically isolated islands. Volunteer anglers collected A. glossodonta fin clips from the main Hawaiian Islands in the North Pacific, Anaa Atoll in the South Pacific, and intermediate Kiritimati Island (Line Islands) to assess the scale of dispersal and population structure within the Pacific Ocean. Population genomics was conducted based on 208 individuals and 7225 SNPs. Although adult A. glossodonta exhibit strong site fidelity, genomic results show no population differentiation between Oahu and Maui in Hawai‘i. Bonefishes exhibit significant population structure between Anaa and Hawai‘i (FST = 0.096), with intermediate Kiritimati comprising admixed fishes. A lengthy larval duration likely promotes connectivity between Pacific islands. Regional management regimes may be most appropriate for a species with this level of dispersal.
Key Contribution: Bonefishes are known to have strong site fidelity, but significant population structure was only present between the South Pacific, intermediate Line Islands, and Hawai‘i. The leptocephalus stage of bonefishes is likely providing an avenue of gene flow but the North, Central, and South Pacific islands should be regarded as isolated management units.

1. Introduction

Bonefishes have highly conserved ecology and morphology, which can present challenges for distinguishing species in the field. This is reflected in a volatile taxonomy that has undergone many revisions, yet greater clarification is still needed. There were originally thought to be 23 species of bonefishes, but these were synonymized into two species by Hildebrand in 1963 [1]. More recent research indicates that there are at least 12 bonefish lineages that correspond to distinct species [2,3,4]. Eight species are known to occur in the Indo-Pacific region, and four in the Atlantic-Caribbean region [5,6]. Much of the research effort to date has been in the Atlantic-Caribbean region because of the substantial contribution bonefish fisheries make to local economies [6,7]. However, bonefish research in the Pacific has increased over the past decade (e.g., [8,9,10,11]).
In 1981 Shaklee and Tamaru [12] discovered a genetic distinction of two bonefishes in Hawai‘i, which resulted in recognition of the round jaw bonefish (Albula glossodonta) and the sharp jaw bonefish (A. virgata). Albula virgata is endemic to Hawai‘i, and A. glossodonta occurs from the Red Sea to the Central Pacific Ocean [13]. Very slight morphological differences are coupled with pronounced divergence in life history characteristics, leading to niche separation. A. glossodonta have rounded lower jaws, exhibit a specialized diet, prefer shallow sand flat habitats (generally under 1.5 m), and have a spawning peak from March to June and from November to December [8]. A. virgata have a pointed lower jaw, exhibit a more generalized diet, prefer deep-water habitats (e.g., boat channels and sandy habitats outside of fringing reefs), and have one spawning peak from November to April [8].
In the main Hawaiian Islands, A. glossodonta are targeted by a minor commercial fishery plus a very diverse non-commercial fishery with a multitude of gear types and differing motivations [9]. These fishes are also heavily targeted in other Pacific locales such as Kiritimati Island (Line Islands, Republic of Kiribati) and Anaa Atoll, (Tuamotu Archipelago, French Polynesia). However, those A. glossodonta fisheries in Kiritimati are mostly catch and release and for subsistence in Anaa [11,14]. The International Union for Conservation of Nature (IUCN) assessed A. glossodonta as vulnerable with a decreasing population trend and A. virgata as data deficient [15,16]. Both species require updates, as these assessments were conducted in 2011.
The presence in Hawai‘i of the range-restricted A. virgata and a widespread Indo-Pacific species invokes questions about dispersal and population structure; geographically widespread species accomplish gene flow through mechanisms such as adult fish movement or a highly dispersive larval stage (e.g., [5,17,18]). There is no available data on the pelagic larval duration of the endemic A. virgata, but A. glossodonta pelagic larval duration was up to 72 days, averaging 57 days [19]. The presence of an endemic bonefish species, and the genetic isolation of widespread Indo-Pacific fishes in Hawai‘i [17] may indicate that the A. glossodonta in Hawai‘i are genetically distinct from cohorts at other Indo-Pacific locations. Adult A. glossodonta in Hawai‘i show site fidelity at a fine scale and anecdotes from anglers suggest there may be distinct populations within the Archipelago due to this key life history trait [9]. Comparing the genetic makeup of A. glossodonta from regions around the Indo-Pacific would reveal patterns of connectivity and aid in developing management decisions. In this regard, microsatellite data in [5] show widespread genetic connectivity of A. glossodonta across its vast range, potentially indicating that populations in Hawai‘i are seeded from other locations. If that is the case, the Line Islands (including Kiritimati) and Johnston Atoll (865 km south of Hawai‘i) are postulated to be biodiversity gateways into Hawai‘i [20,21,22].
DNA sequence data, with dwindling costs and increasing coverage, make genomes accessible and provides an excellent tool to understand distribution patterns and resolving evolutionary relationships [23]. Previous genetic methods have proven particularly useful for bonefish, as species often have very similar morphology and overlapping habitats, coupled with deep divergence in allozyme and mtDNA surveys [2]. The more recent availability of double-digest restriction site-associated DNA (ddRAD) sequencing provides the throughput and precision to reveal subtle population differences that may exist within a species distributed across far-flung oceanic islands (e.g., [24]).
Understanding the potential connectivity, or lack thereof, between disjunct bonefish cohorts has implications for the management of the species and their habitat. Hawai‘i comprises eight inhabited islands, and place-based management throughout the archipelago has become a popular conservation tool. One example of this management approach comes from Tarpon (Megalops atlanticus) in the Caribbean, Gulf of Mexico, and south-eastern United States. Tarpon regulations and available habitat vary among jurisdictions, and fishers in these regions target tarpon for a combination of recreation, subsistence, cultural, and commercial reasons [25,26,27]. In this complex network of habitats and fisheries, unregulated harvest in one location may nullify conservation-based fisheries or habitat management in another region. Determining geographic barriers to gene flow may indicate that management regimes would be effective at finer scales. This type of information would be important in establishing place-based management such as minimum sizes or seasonal catch restrictions.
The overall goal of this paper is to identify genetic population structure of A. glossodonta around Hawai‘i at an island, archipelago, and Central Pacific scale. Here we evaluate gene flow and genetic structure along a roughly linear path from French Polynesia in the South Pacific Ocean through Kiribati in the Central Pacific to Hawai‘i in the North. This type of work also presents an opportunity to engage members of the fishing community and create a collaborative effort to understand bonefish life history characteristics. Combining the traditional knowledge of anglers with modern science processes can promote successful research outcomes [10,11,28,29].

2. Materials and Methods

2.1. Field Collection Methods

Hawai‘i is located in the central North Pacific Ocean, with Kiritimati located 2000 km south and Anaa another 2500 km further south (Figure 1). All sampling locations have shallow flats or accessible beaches, allowing bonefish to be targeted with conventional spinning or fly-fishing gear. All regions are known to have A. glossodonta, but anecdotes suggest they exhibit slightly different morphology and behavior. There was an opportunity to collaborate with anglers from all locations and the fishing community was engaged to assist with collecting fin clips. The authors and volunteer anglers collected a 1 cm2 fin clip from the tip of bonefish caudal fin. Anglers on O’ahu were equipped with 2 mL vials with 90% ethanol, small scissors, and basic instructions regarding best bonefish handling practices. Anglers on Maui, Kiritimati, and Anaa were provided vials containing saturated salt (NaCl) DMSO solution, which is more amenable than ethanol for air transport.
The lead author also sampled bonefish leptocephalus larvae with homemade light traps in Kāne’ohe and Maunalua Bays on O’ahu. The light trap was constructed with inverted funnels embedded into the side of a three-gallon plastic bucket. Floats were attached to the bucket handle for buoyancy and an LED light was clipped under the bucket cover to attract larvae. Traps were typically deployed on rising tides, after dusk, around the new moon. Captured leptocephali were preserved in 90% ethanol.

2.2. Laboratory Methods

Genomic DNA was purified from fin clips using the Puregene® tissue kit (Qiagen, Venlo, Netherlands) and a standardized protocol. Due to the presence of other Albula species in the study region, specimens were first screened using a four-locus microsatellite panel (Avu11, Avu12, Avu18, and Avu25) for genetic species identification (GSI) as previously characterized in [4,30]. The microsatellite fragments were PCR amplified in 12.5 μL reactions consisting of: 0.5 μL DNA, 0.07 μL GoTaq® polymerase (Promega, Madison, WI, USA), 0.01–0.04 μL combined forward and reverse 100 μM primers, 0.3 μM each dNTPs, 2.32 mM MgCl2, 2.33 μL 5X GoTaq® buffer, 0.06 μL BSA, and 7.42 μL sterile distilled water. Amplification was conducted on a mastercycler (Eppendorf, Hamburg, Germany) under the following thermal cycling conditions: 1 × 94 °C for 2 min, 32 × 94 °C for 40 s, 55 °C for 40 s, 72 °C for 45 s, followed by a final extension of 72 °C for 7 min. The PCR products were screened on an Applied Biosystems 3130XL genetic analyzer (Thermo Fisher Scientific, Waltham, MA, USA) and scored with Genemapper® (Thermo Fisher Scientific, Waltham, MA, USA). The allelic data was compared to the previously GSI verified genotypes of all Pacific Ocean Albula species in Genetix v4.05 [31].
For genomic library preparation, the purified DNA was fluorometrically quantified using the broad range Qubit kit (Thermo Fisher Scientific, Waltham, MA, USA) to ensure sufficient quality and quantity. The ddRAD libraries were prepared following a protocol modified from [23]. Specimens were first digested at 37 °C for 3 h using the MspI and PstI-HF restriction enzymes, bead cleaned following the protocol in [32], and quantified via Qubit with the high-sensitivity kit (Thermo Fisher Scientific, Waltham, MA, USA). The cleaned digest products were ligated with adapters containing eight unique 5 bp barcodes under the following thermal conditions: 23 °C for 30 min, 65 °C for 10 min, then cooled at 2 °C per 90 s until reaching 23 °C. Equal volumes of ligation products were pooled into sets of eight, bead cleaned, and libraries were size selected (200–300 bp) on a Pippin Prep. The Pippin size selected libraries were PCR amplified (98 °C for 30 s, 12 × 98 °C for 10 s, 87.7 °C for 30 s, 72 °C for 30 s, and a final extension of 72 °C for 10 min, then a 4 °C hold) using the Phusion® kit (New England Biolabs, Ipswich, MA, USA) and a set of 12 unique indices. The PCR products were pooled by index and bead cleaned prior to final library quantitation via qPCR using the NEBnext® library quant kit (New England Biolabs, Ipswich, MA, USA). The final pooled libraries were sequenced on three 1 × 100 lanes on an Illumina HiSeq 2500 (San Diego, CA, USA) at the Brigham Young University genomics core facility.

2.3. Data Analysis

The ddRAD generated libraries were demultiplexed, quality filtered, and single-nucleotide polymorphism (SNP) genotyped using the Stacks v2.55 denovo pipeline and vcftools on the BYU Fulton HPC [33,34]. Raw Illumina reads were demultiplexed with process_radtags then individual loci assembled with ustacks. A subset of specimens was used to build the SNP catalog in cstacks, then all specimens were matched to the catalog in sstacks. Data was converted to per locus using tsv2bam and SNPs were recalled using all individuals with gstacks. A vcf file was obtained using populations with a minimum of 30% individuals per population set for each locus (populations were set to collection island). Quality filtering was completed in vcftools under the following criteria: removed 5 low-scoring individuals, then genotype filtering with max missing level of 0.8. HDPlot in the R package vcfR was used to further filter loci displaying non-conformance to Hardy–Weinberg equilibrium (HWE) while maintaining the site frequency spectrum [35]. Outlier loci were pruned and the dataset further filtered (mac 3) in vcftools. Finally, a custom python script retained the single highest minor allele frequency SNP per locus to avoid linkage issues.
The R packages poppr was used to assess standard diversity indices and identify private alleles in the SNP dataset [36,37]. Several analytical approaches were used to explore genetic population clustering. Pairwise metrics FST and GST [38] were calculated among the four collection locations, as a priori populations, in the R package diveRsity [39]. These metrics range from zero (no genetic differentiation) to 1 (complete differentiation). A multivariate discriminant analysis of principal components (DAPC) with cross validation was performed in the R package adegenet v2.1.0 [40]. Spatial partitioning was then evaluated using the Bayesian method in fastStructure v1.0 using the simple model and visualized with Distruct v1.1 [41,42]. Lastly, genetic clustering was assessed through the maximum likelihood model implemented in Admixture v1.3 using the cross-validation procedure (--cv = 10) [43]. The demultiplexed sequence data is available at the NCBI sequence read archive (SRA) database (Bioproject_PRJNA1029180).

3. Results

3.1. GSI Assays

Anglers collected over 300 fin clips from O’ahu (n = 119), Maui (n = 30), Anaa (n = 58), and Kiritimati (n = 37) from 2016–2020 (Table 1). Leptocephalus larvae (n = 59) were collected using a light trap from O’ahu from 2017–2020. A subset of 254 tissue samples were sent to the Fish and Wildlife Research Institute (FWRI) for processing and analysis. The GSI assays identified 14 A. virgata collected from Maui and O’ahu. These were included in the Illumina sequencing lanes but were removed prior to quality filtering of the A. glossodonta SNP dataset for downstream population analyses. For the subadult/adult A. glossodonta specimens, fork length ranged from 8.5–31 inches (n = 146) and weight from 4.1–11.7 pounds (n = 8). Therefore, these fishes include multiple generations based on length and weight.

3.2. Genomic Libraries

The three Illumina sequencing lanes which included 254 total Albula specimens (240 A. glossodonta and 14 A. virgata) yielded 358,805,000 raw reads. After quality filtering, the final A. glossodonta SNP dataset consisted of 208 individuals and 7225 SNPs. The average depth of coverage was 20.2X across individuals (5.6–162.5X) and 20.7X across loci (9.5–236.3X). Overall data missing across loci and collection locations was low and saturation was rapidly achieved. Genotypic richness (measured as MLG) was higher than expected for all locations (Table 2). The expected genotypic richness (eMLG = 20) accounts for different sampling totals among sites. The observed increased genotypic richness may be due to large population size and/or gene flow among sites. Nei’s unbiased gene diversity (Hexp) was relatively low and similar across locations (0.23–0.24), and evenness (E) = 1. The three diversity indices evaluated, Shannon–Weiner (H), Stoddart and Taylor (G), and Simpson’s (λ), were similar across islands though highest for O’ahu (which had the highest sample size).
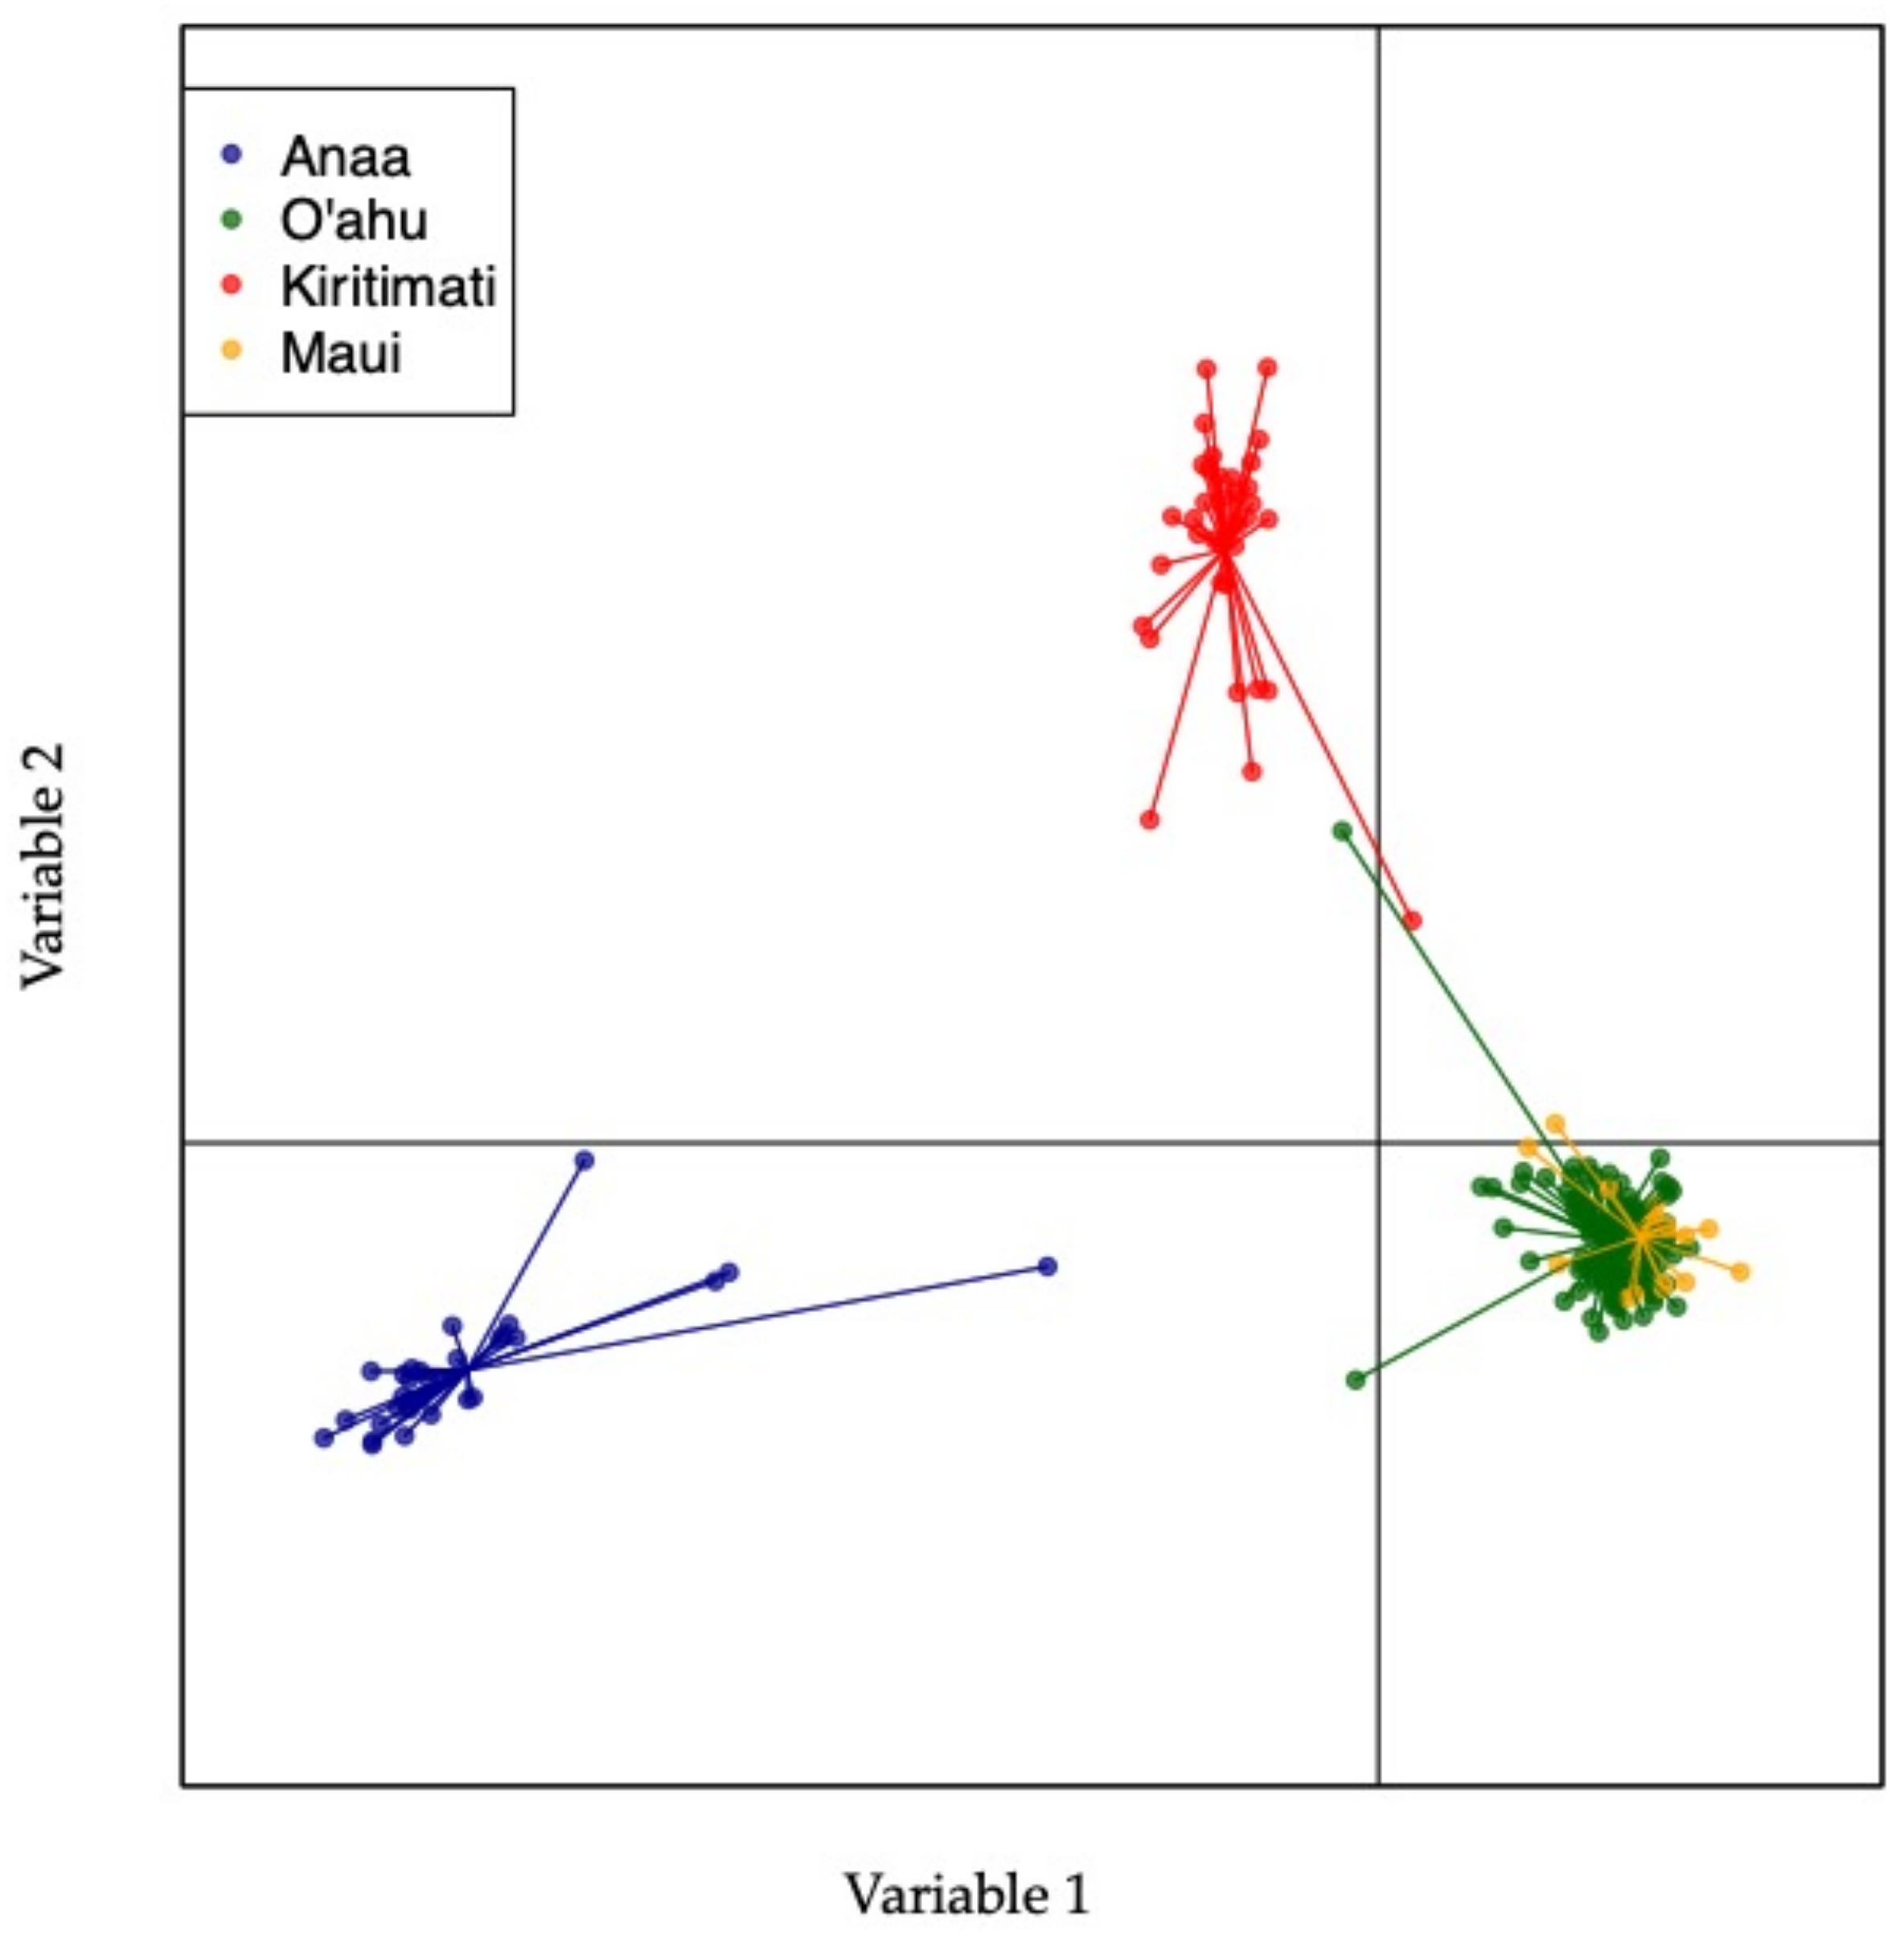
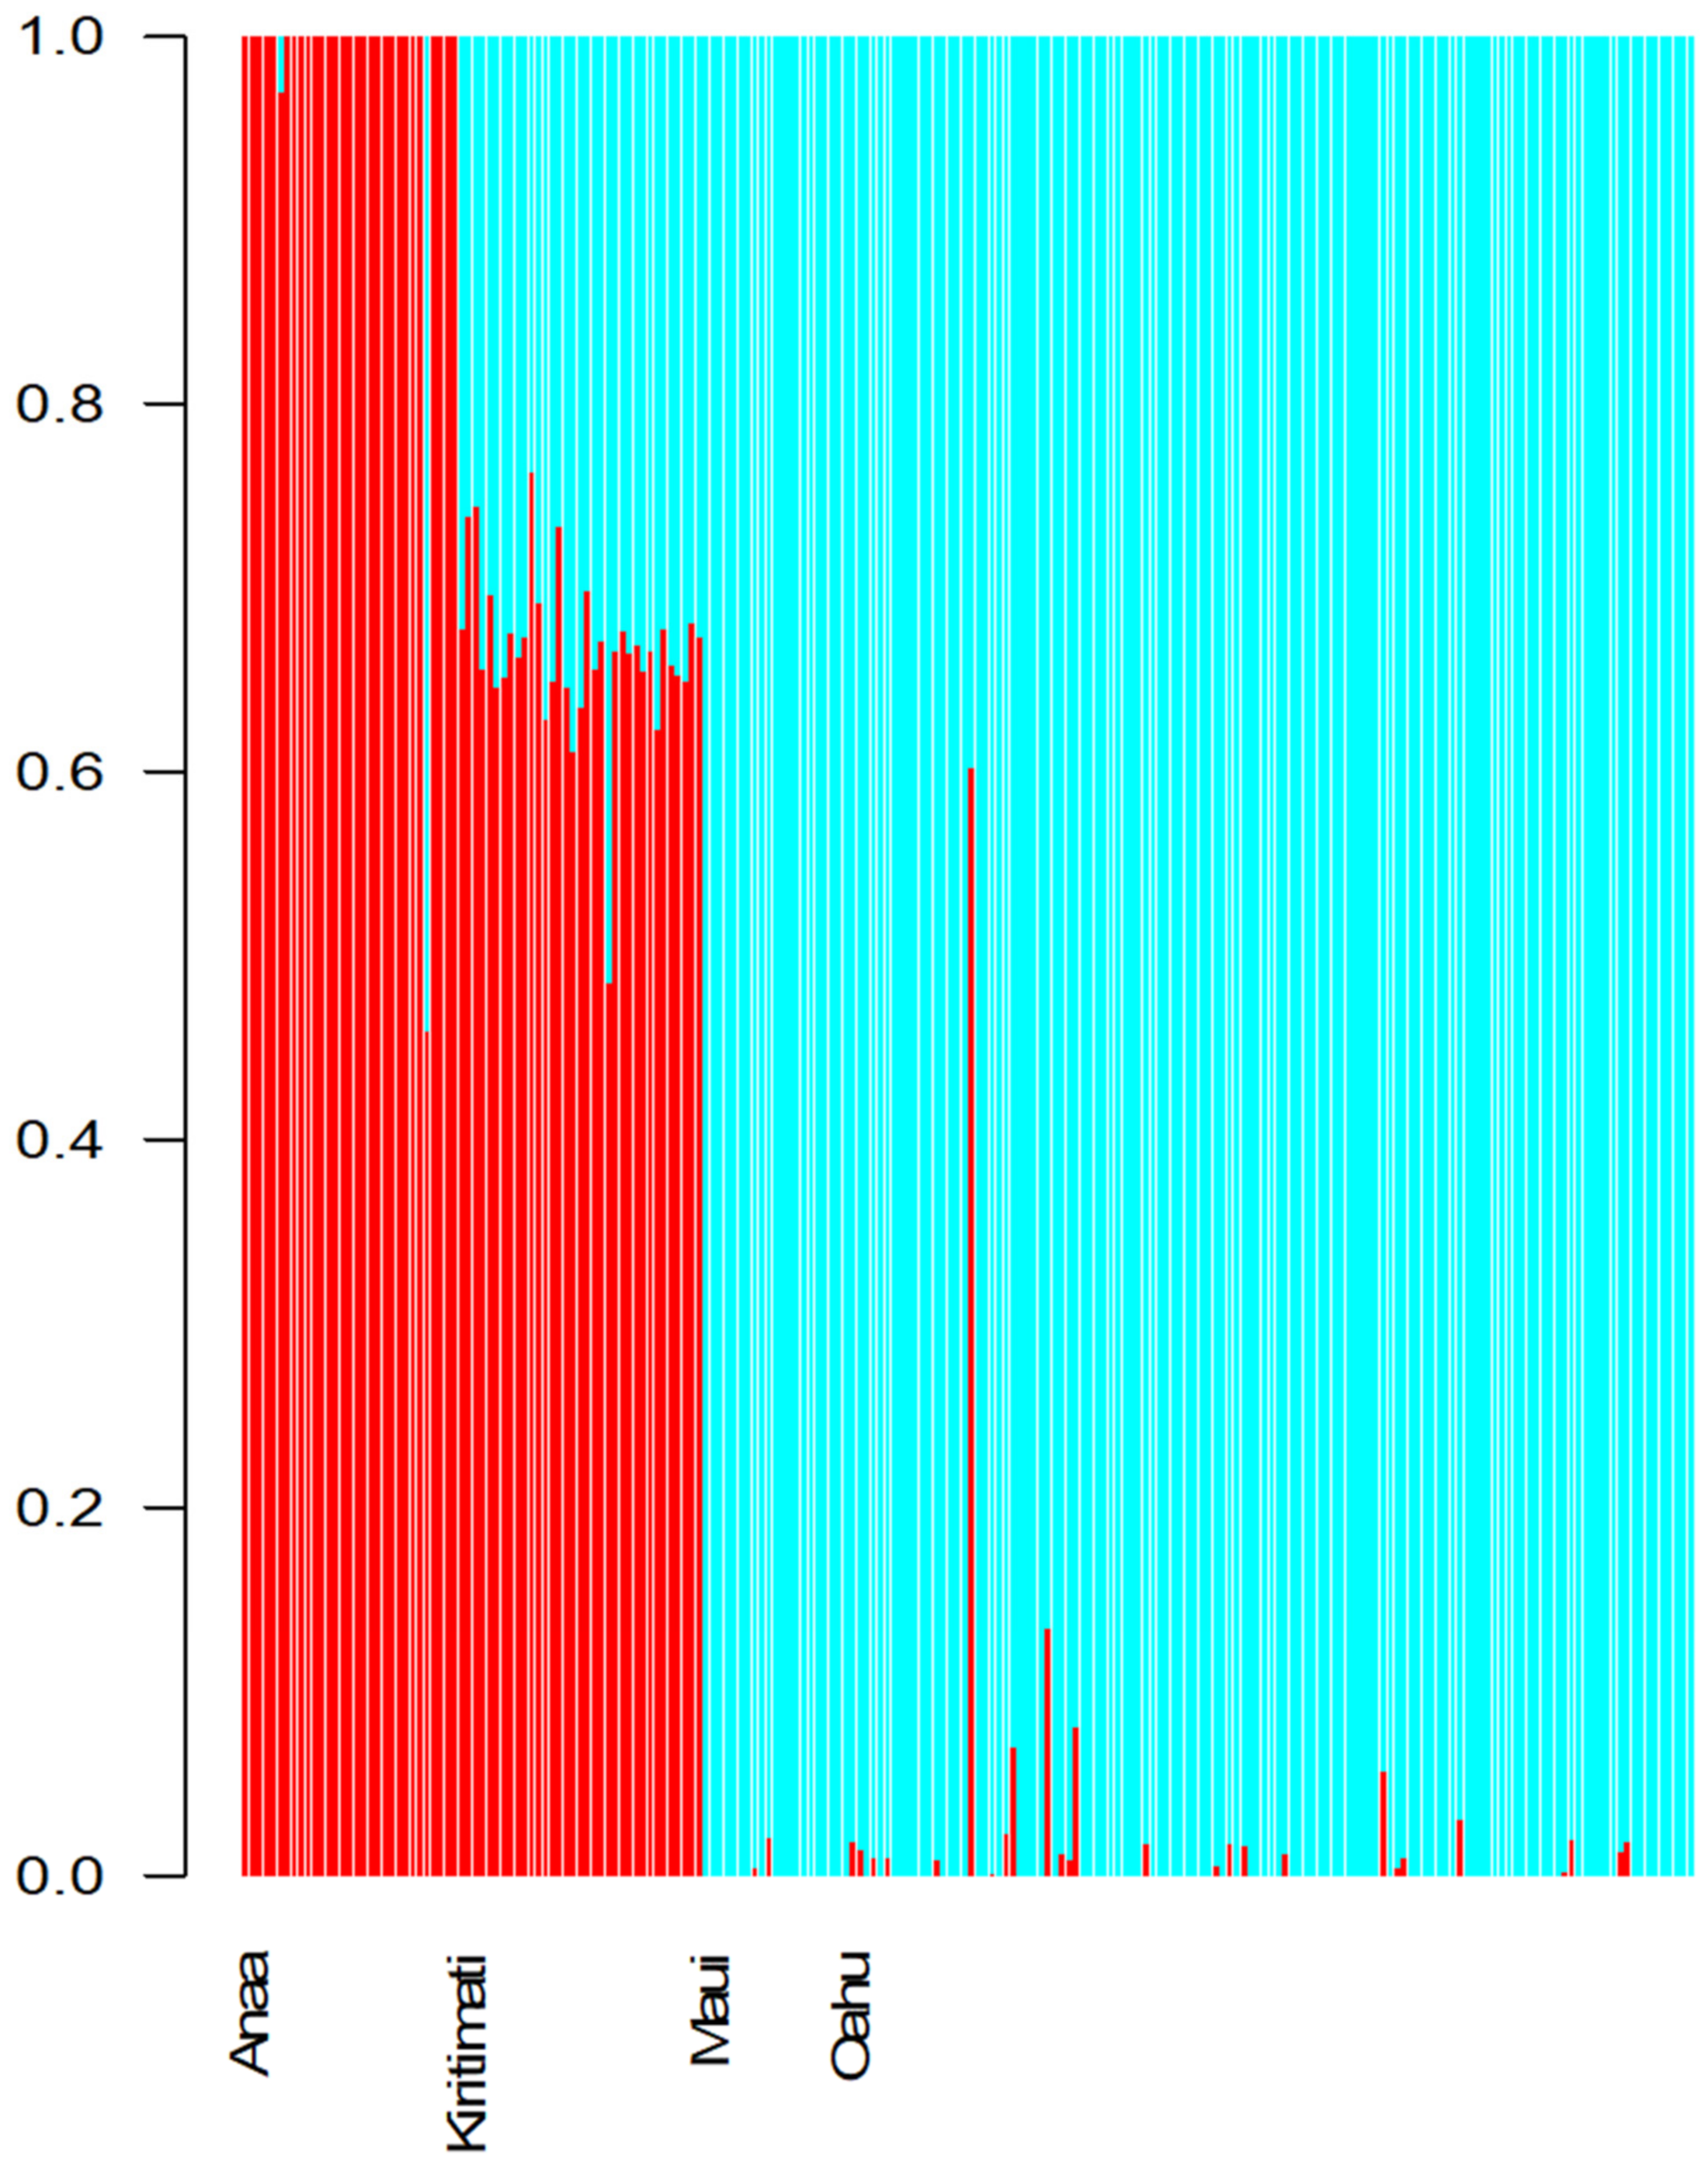
The ad hoc pairwise comparisons, GST and FST, reflected similar patterns among collection locations (Table 3). Differentiation was moderate between Anaa and both Hawaiian Islands, but moderate low for pairs including Kiritimati and slight between O’ahu and Maui. The DAPC analysis retained three discriminant functions and sixty principal components after cross validation, which yielded 0.475 proportion of conserved variance. Strong assignment proportions to each collection island were observed (0.85–0.975), yet the DAPC plot displayed three clusters with O’ahu and Maui individuals overlapping (Figure 2). Two outlier individuals halfway between the Kiritimati and Hawai‘i groups may indicate occasional genetic connectivity. The individual assignment plots identified other admixed specimens (1 Anaa: O’ahu, 2 Kiritimati: O’ahu, and 5 O’ahu: Maui). Two of the admixed specimens were leptocephalus, both collected on O’ahu, with one assigned to Maui and the other to Kiritimati. Two genetic populations were identified under the simple model in fastStructure. One group consisted of individuals from Anaa while the second group contained Hawai‘i specimens (O’ahu and Maui). The Kiritimati individuals all reflected admixture- displaying posterior mean of admixture proportions ~60–75% Anaa group and ~25–35% Hawai‘i group membership. Two other individuals reflected ~50:50 admixture between the Anaa and Hawai‘i populations. Similarly, the Admixture maximum-likelihood model results also supported two populations: Anaa and Hawai‘i, displaying moderate genetic differentiation between them (FST = 0.096) (Figure 3). The Kiritimati individuals were identified as admixed, with very similar proportions to those assigned by fastStructure. Further, the same two individuals (one from Anaa and the other from O’ahu) reflected ~50:50 admixture between the two genetic populations.

4. Discussion

This project showcased a successful, collaborative effort between researchers and the fishing community. Anglers from the Hawaiian Islands, Kiritimati, and Anaa assisted in data collection to answer a question that both stakeholders were interested in understanding. Involving anglers in this project’s progress provided both an efficient means of specimen collection and a level of trust for the science behind the fisheries management processes.
The population structure results were largely concordant across analyses, displaying strong support for two distinct genetic stocks—Anaa and Hawai‘i. Intermediate Kiritimati contained admixed individuals but may qualify as an isolated management unit. Notably, a previous mtDNA comparison of A. glossodonta between Hawai‘i and Kiritimati indicated significant population structure (ϕST = 0.215) [19]. Overall, these data indicate a low level of ongoing gene flow, most frequently between Anaa and Kiritimati and less frequently between Kiritimati and Hawai‘i. Individual population assignments were identical in the fastStructure and Admixture analyses. It is important to acknowledge that of the genetic population structure methods used to evaluate A. glossodonta, fastStructure and Admixture are based on genetic models while the DAPC analysis is not model based. Even so, the differences in geographic clustering among them were slight, dealing exclusively with Kiritimati, the middle location among the islands sampled for this study spanning >4500 km.
Leptocephalus larval dispersal is likely aided by prevailing currents and other oceanographic flow features in the Central Pacific. The main Hawaiian Islands are subject to the North Hawaiian Ridge Current and the Hawaiian Lee Current, moving from southeast to northwest above and below the archipelago, respectively. The Hawaiian Lee Countercurrent, located southwest of the archipelago, moves from west to east [44]. Interactions between current flow, trade winds, and the archipelagic barriers also generate substantial mesoscale eddy activity [45]. These prevailing currents and eddies likely provide dispersal and retention mechanisms for Maui and O’ahu. Larger-scale currents such as the North Pacific Current to the north of the archipelago and the North Equatorial Current, Equatorial Countercurrent, and South Equatorial Current to the south of the archipelago are primarily zonal in nature and would seem to pose substantive barriers to north/south larval transport between the Line Islands and the Hawaiian Archipelago. However, mixed-layer Lagrangian transport modeling has shown modest levels of transport from Kiritimati to both the Island of Hawai‘i and Johnston Atoll (Kobayashi, unpublished), which is consistent with the genetic connectivity observed between Hawai‘i, Kiritimati, and Anaa here and the occasional waif/vagrant species observed by fishers and divers in Hawai‘i. It is also possible that other intermediary sites not sampled in this study serve as stepping stones for regular and/or episodic larval transport and gene flow. The nature and magnitude of such oceanographic connections between these particular locations are the focus of separate and ongoing companion study.
Genetic breaks have been found throughout the Hawaiian archipelago for some fish species inhabiting shallow waters [44,46,47,48]. The deep-water (>100 m) species seem to be more dispersive, with a grouper showing shallow structure in Hawai‘i [46,49] and a snapper showing no structure [17]. However, bonefish larval life history is nearly unique and A. glossodonta have the greatest range of all bonefishes, covering a vast expanse of the Indo-Pacific, including the Red Sea [50]. The Sunda Shelf, a well-known marine biogeographic barrier, surprisingly does not affect population connectivity in this shallow flat inhabiting species [51]. Gene flow across the broad range of A. glossodonta is likely maintained through a functional metapopulation, with higher connectivity for nearby neighbors mainly through larval dispersal and/or anomalous long distant adult movements. Bonefishes are known to travel offshore, away from inshore flats, and make deep dives during spawning activity [52,53,54].
This study represents the first application of an intensive population genomic approach to evaluate inter-island bonefish population structure within the Pacific Ocean. Bonefishes have an extended pelagic stage and are potentially capable of long-distance oceanic dispersal. A recent ddRAD study of A. glossodonta in the southwest Indian Ocean identified weak genetic structure between the Seychelles and Mauritius, a distance of about 1100 km [55]. Another fine-scale population genomic study on A. vulpes in the Bahamas found an asymmetric pattern of inter-island geneflow [56]. Future studies should include gathering A. glossodonta from throughout the Hawaiian archipelago, especially from Hawai‘i Island and the Northwestern Hawaiian Islands.
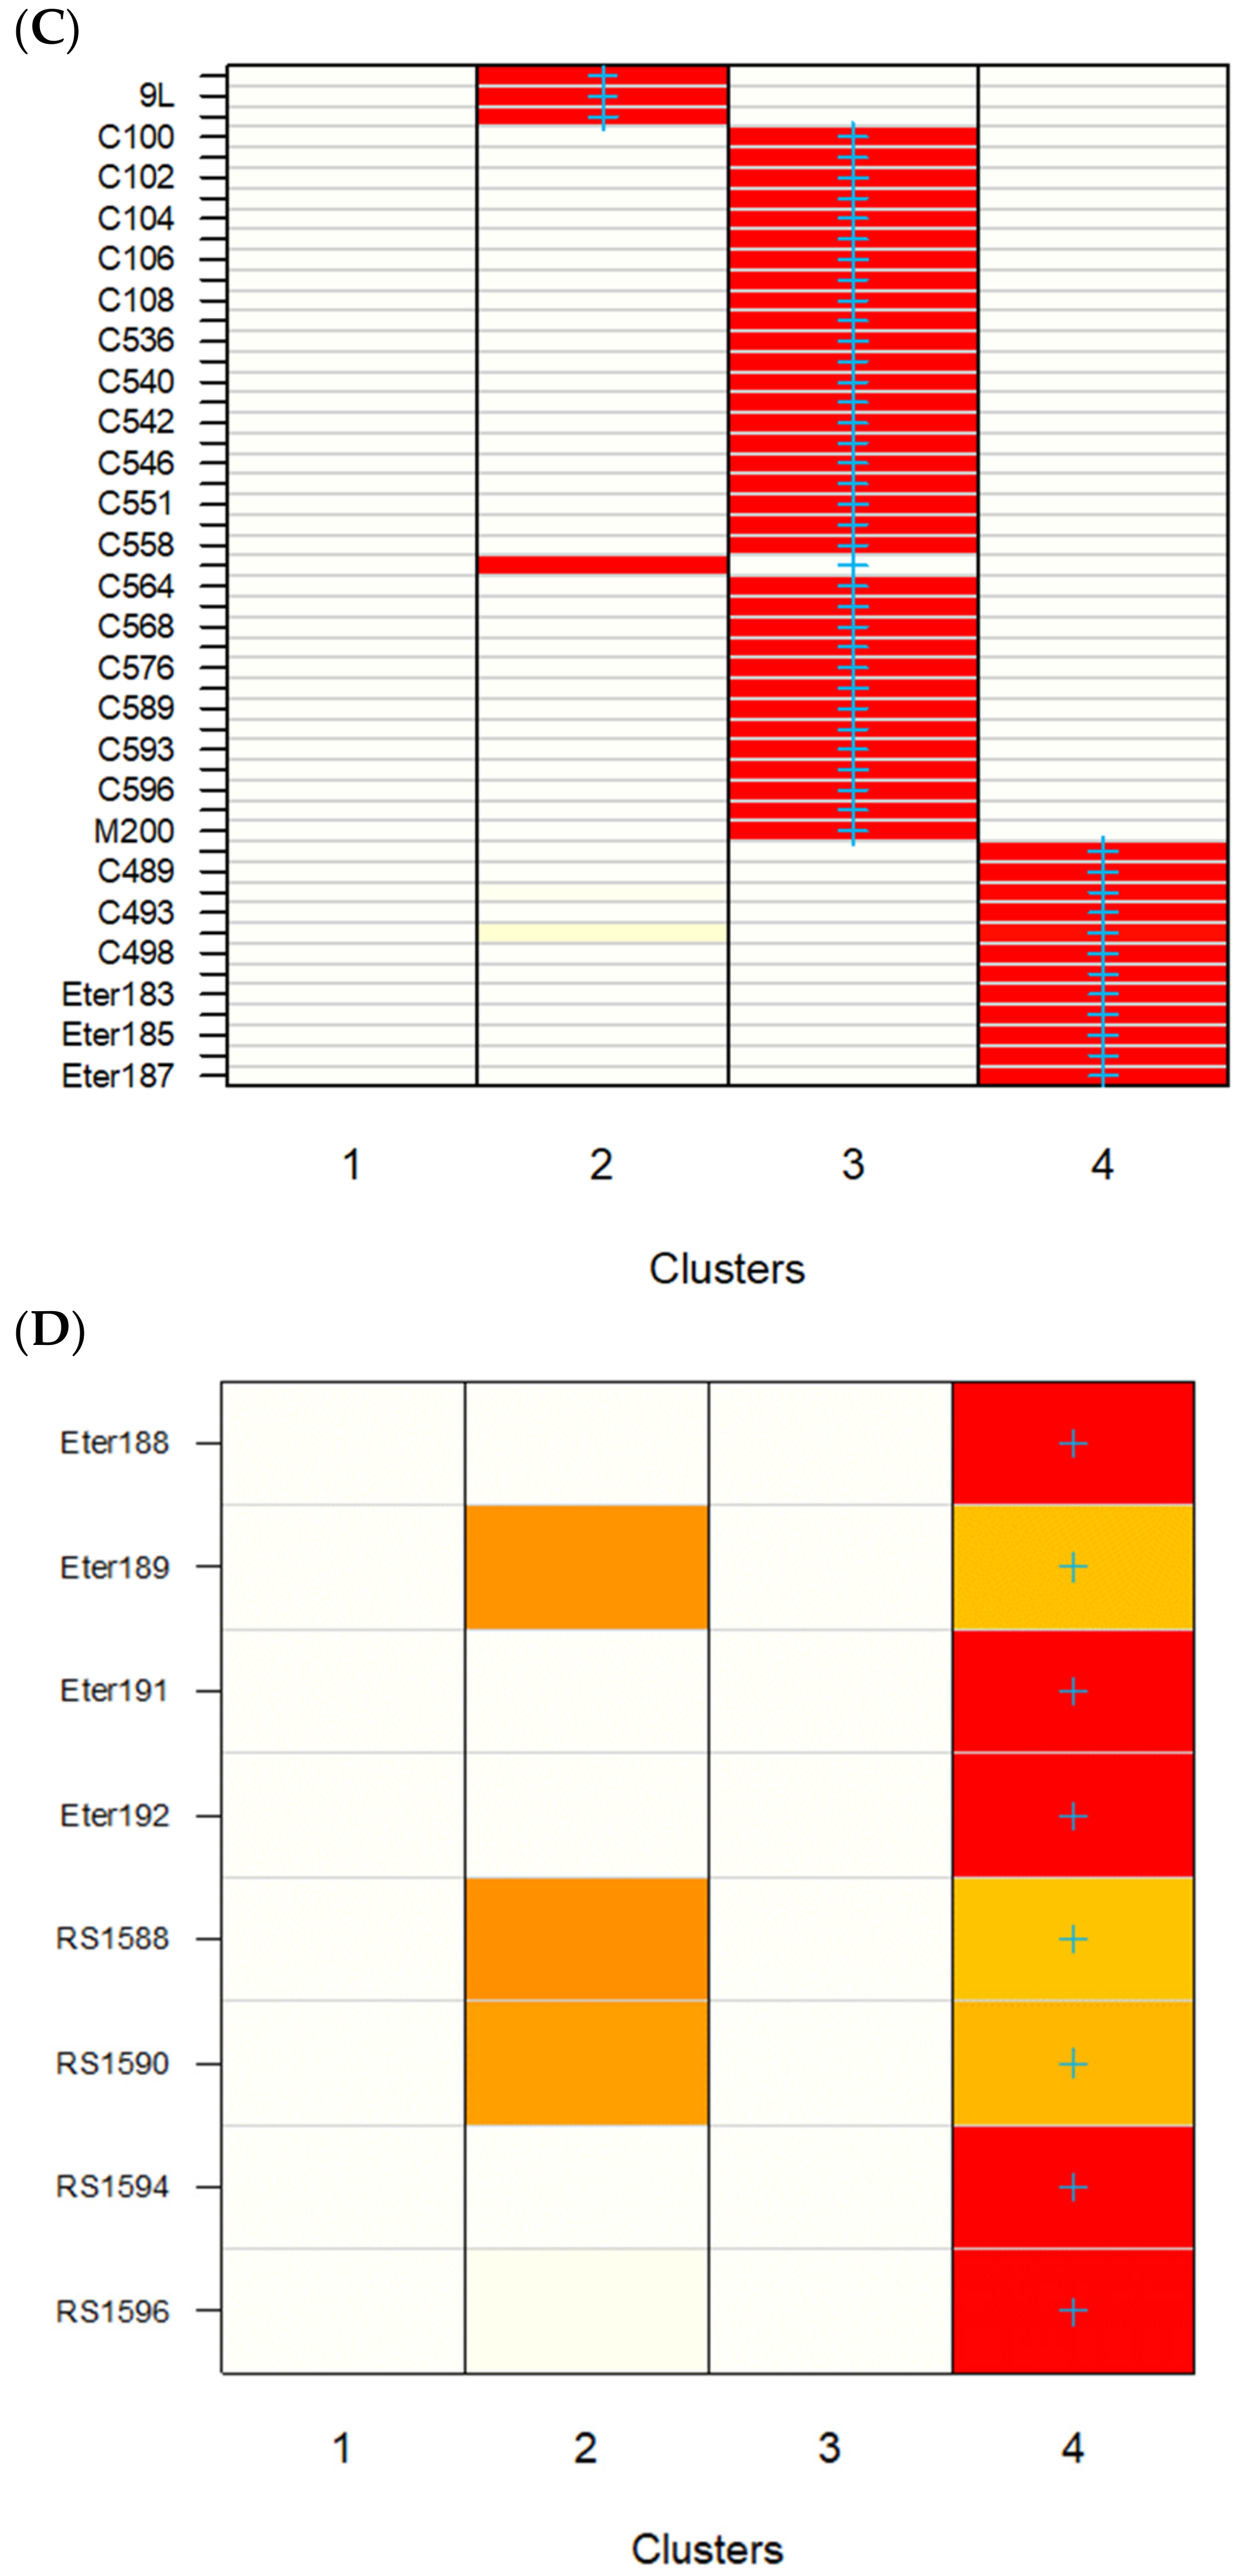
Given the volcanic origin of the Hawaiian Archipelago in the middle of the North Pacific, researchers have long speculated on the origins of the coastal marine fauna, with a focus on colonization from the south [57,58,59]. More recent phylogeographic studies have indicated the intriguing possibility that the flow of biodiversity is bidirectional, with some larvae colonizing from Hawai‘i to Johnson Atoll and the Line Islands [60,61]. The present study clearly supports the latter scenario with DAPC analyses (Figure 4), as Kiritimati in the Line Islands seems to receive input from both the Hawaiian Archipelago and Polynesia (Anaa). Colonization events across the Hawaiian Archipelago have been shown to vary both seasonally and interannually, particularly with respect to ENSO and PDO [62,63]. With availability of several decades of ocean model flow fields (e.g., HYCOM, ROMS) these dynamics will be explored more fully in a separate and ongoing companion study using computer simulation.
The observed long-distance connectivity indicates a regional management approach is needed for A. glossodonta and may aid restoration measures in areas that have experienced population declines. Islands with adequate protection of juvenile habitat and proactive management of the fisheries (including protection of spawning migrations) may replenish local stocks around those island areas through self-recruitment as well as serving as a source for other areas through immigration via larval dispersal [64]. The results from this study clarify local anecdotes that although the adult bonefish in Hawai‘i exhibit strong site fidelity, their larval stage and spawning habits lead to gene flow among adjacent islands, and less frequently among archipelagos.

5. Conclusions

A. glossodonta were genetically distinct between Anaa and Hawai‘i, with Kiritimati containing admixed individuals. Results showed gene flow more frequently occurring between Anaa and Kiritimati compared to Kiritimati and Hawai‘i. Leptocephalus larvae mobility and pelagic larval duration likely leads to the low-level gene flow. Despite bonefishes’ strong site fidelity, the long-distance connectivity provided by their larval stage highlights the utility of region-specific management. Ultimately, collaboration from members of the fishing community helped to shed light on a highly prized and valuable species.

Author Contributions

Conceptualization, K.K. and B.W.B.; methodology, E.W.; software, E.W.; validation, E.W., D.K., K.P. and B.W.B.; formal analysis, E.W.; data curation, E.W.; writing—original draft preparation, K.K.; writing—review and editing, K.K., B.W.B., EW., K.P. and D.K.; visualization, E.W.; supervision, B.W.B.; project administration, B.W.B.; and funding acquisition, K.K. All authors have read and agreed to the published version of the manuscript.

Funding

This research was funded by the University of Hawai‘i at Mānoa Graduate Student Organization, grant number 22-02-10.

Institutional Review Board Statement

The study was approved by the Animal Care & Use Committee (approval codes 19-2959-2 and 19-2959-3).

Data Availability Statement

The sequence data used in this study is available through the NCBI SRA repository (Bioproject_PRJNA1029180).

Acknowledgments

Many thanks to all of the anglers who donated fin clips for this project. Thanks to T.J. Breshears for assistance with generating maps.

Conflicts of Interest

The authors declare no conflict of interest. The funders had no role in the design of the study; in the collection, analyses, or interpretation of data; in the writing of the manuscript; or in the decision to publish the results.

References

  1. Hildebrand, S.F. Family Albulidae. In Fishes of the Western North Atlantic; Bigelow, H.B., Ed.; Sears Foundation for Marine Research, Bingham Oceanographic Laboratory, Yale University: New Haven, CT, USA, 1963; pp. 132–147. [Google Scholar]
  2. Bowen, B.; Karl, S.A.; Pfeiler, E. Resolving evolutionary lineages and taxonomy of bonefishes (Albula spp.). In Biology and Management of the World Tarpon and Bonefish Fisheries; Ault, J.S., Ed.; CRC Press: Boca Raton, FL, USA, 2008; pp. 147–154. [Google Scholar]
  3. Hidaka, K.; Iwatsuki, Y.; Randall, J.E. A review of the Indo-Pacific bonefishes of the Albula argentea complex, with a description of a new species. Ichthyol. Res. 2008, 55, 53–64. [Google Scholar] [CrossRef]
  4. Wallace, E.M.; Tringali, M.D. Identification of a novel member in the family Albulidae (bonefishes). J. Fish Biol. 2010, 76, 1972–1983. [Google Scholar] [CrossRef] [PubMed]
  5. Wallace, E.M. High intraspecific genetic connectivity in the Indo-Pacific bonefishes: Implications for conservation and management. Environ. Biol. Fishes 2015, 98, 2173–2186. [Google Scholar] [CrossRef]
  6. Wallace, E.M.; Tringali, M.D. Fishery composition and evidence of population structure and hybridization in the Atlantic bonefish species complex (Albula spp.). Mar. Biol. 2016, 163, 142. [Google Scholar] [CrossRef]
  7. Adams, A.J.; Cooke, S.J. Advancing the science and management of flats fisheries for bonefish, tarpon, and permit. Environ. Biol. Fishes 2015, 98, 2123–2131. [Google Scholar] [CrossRef]
  8. Donovan, M.K.; Friedlander, A.M.; Harding, K.K.; Schemmel, E.M.; Filous, A.; Kamikawa, K.; Torkelson, N. Ecology and niche specialization of two bonefish species in Hawai‘i. Environ. Biol. Fishes 2015, 98, 2159–2171. [Google Scholar] [CrossRef]
  9. Kamikawa, K.T.; Friedlander, A.M.; Harding, K.K.; Filous, A.; Donovan, M.K.; Schemmel, E. Bonefishes in Hawai‘i and the importance of angler-based data to inform fisheries management. Environ. Biol. Fishes 2015, 98, 2147–2157. [Google Scholar] [CrossRef]
  10. Filous, A.; Lennox, R.J.; Coleman, R.R.; Friedlander, A.M.; Clua, E.E.G.; Danylchuk, A.J. Life-history characteristics of an exploited bonefish Albula glossodonta population in a remote South Pacific atoll. J. Fish Biol. 2019, 95, 562–574. [Google Scholar] [CrossRef]
  11. Filous, A.; Lennox, R.J.; Eveson, P.; Raveino, R.; Clua, E.E.G.; Cooke, S.J.; Danylchuk, A.J. Population dynamics of roundjaw bonefish Albula glossodonta at a remote coralline Atoll inform community-based management in an artisanal fishery. Fish. Manag. Ecol. 2019, 27, 200–214. [Google Scholar] [CrossRef]
  12. Shaklee, J.B.; Tamaru, C.S. Biochemical and morphological evolution of Hawaiian bonefishes (Albula). Syst. Zool. 1981, 30, 125–146. [Google Scholar] [CrossRef]
  13. Pickett, B.D.; Wallace, E.M.; Ridge, P.G.; Kauwe, J.S.K. Lingering Taxonomic Challenges Hinder Conservation and Management of Global Bonefishes. Fisheries 2020, 45, 347–358. [Google Scholar] [CrossRef]
  14. Allen, M. The historical role of bonefishes (Albula spp.) in Polynesian fisheries. Hawaii. Archaeol. 2014, 4, 51–72. [Google Scholar]
  15. Adams, A.; Guindon, K.; Horodysky, A.; MacDonald, T.; McBride, R.; Shenker, J.; Ward, R. Albula glossodonta. The IUCN Red List of Threatened Species. Retrieved Oct. 2012, 2012, e.T194299A2310398. [Google Scholar]
  16. Adams, A.; Guindon, K.; Horodysky, A.; MacDonald, T.; McBride, R.; Shenker, J.; Ward, R. Albula virgata. The IUCN Red List of Threatened Species. Retrieved Oct. 2012, 2012, e.T194302A2310633. [Google Scholar]
  17. Gaither, M.R.; Jones, S.A.; Kelley, C.; Newman, S.J.; Sorenson, L.; Bowen, B.W. High Connectivity in the Deepwater Snapper Pristipomoides filamentosus (Lutjanidae) across the Indo-Pacific with Isolation of the Hawaiian Archipelago. PLoS ONE 2011, 6, e28913. [Google Scholar] [CrossRef] [PubMed]
  18. Graves, J.E.; McDowell, J.R. Population structure of istiophorid billfishes. Fish. Res. 2015, 166, 21–28. [Google Scholar] [CrossRef]
  19. Friedlander, A.M.; Caselle, J.E.; Beets, J.; Lowe, C.G.; Bowen, B.W.; Ogawa, T.K.; Kelley, K.M.; Calitri, T.; Lange, M.; Anderson, B.S. Biology and ecology of the recreational bonefish fishery at Palmyra Atoll National Wildlife Refuge with comparisons to other Pacific Islands. In Biology and Management of the World Tarpon and Bonefish Fisheries; Ault, J.S., Ed.; CRC Press: Boca Raton, FL, USA, 2008; pp. 28–56. [Google Scholar]
  20. Hourigan, T.F.; Reese, E.S. Mid-ocean isolation and the evolution of Hawaiian reef fishes. Trends Ecol. Evol. 1987, 2, 187–191. [Google Scholar] [CrossRef]
  21. Craig, M.T.; Eble, J.; Bowen, B.W. Origins, ages, and populations histories: Comparative phylogeography of endemic Hawaiian butterfly fishes (genus Chaetodon). J. Biogeogr. 2010, 37, 2125–2136. [Google Scholar] [CrossRef]
  22. Hodge, J.R.; van Herwerden, L.; Bellwood, D.R. Temporal evolution of coral reef fishes: Global patterns and disparity in isolated locations. J. Biogeogr. 2014, 41, 2115–2127. [Google Scholar] [CrossRef]
  23. Peterson, B.K.; Weber, J.N.; Kay, E.H.; Fisher, H.S.; Hoekstra, H.E. Double Digest RADseq: An Inexpensive Method for De Novo SNP Discovery and Genotyping in Model and Non-Model Species. PLoS ONE 2012, 7, e37135. [Google Scholar] [CrossRef]
  24. Gaither, M.R.; Bernal, M.A.; Coleman, R.R.; Bowen, B.W.; Jones, S.A.; Simison, W.B.; Rocha, L.A. Genomic signatures of geographic isolation and natural selection in coral reef fishes. Mol. Ecol. 2015, 24, 1543–1557. [Google Scholar] [CrossRef] [PubMed]
  25. Adams, A.J.; Horodysky, A.Z.; McBride, R.S.; Guindon, K.; Shenker, J.; MacDonald, T.C.; Harwell, H.D.; Ward, R.; Carpenter, K. Global conservation status and research needs for tarpons (Megalopidae), ladyfishes (Elopidae) and bonefishes (Albulidae). Fish Fish. 2013, 15, 280–311. [Google Scholar] [CrossRef]
  26. Wilson, J.K.; Adams, A.J.; Ahrens, R.N.M. Atlantic tarpon (Megalops atlanticus) nursery habitats: Evaluation of habitat quality and broad-scale habitat identification. Environ. Biol. Fishes 2019, 102, 383–402. [Google Scholar] [CrossRef]
  27. Fernandez, C.A.F.; Cunha, F.E.A.; Silva, C.E.L.S.; Araujo, A.C.S.; Pereira, R.L.; Viana, D.F.; Magalhães, W.M.; Gondolo, M.A.P.; de Castro, D.M.; Adams, A.; et al. Population dynamics and movements of Atlantic tarpon, Megalops atlanticus, in the Paranaiba Delta Protected Area, Brazil: Challenges for local fishery management planning. Environ. Biol. Fishes 2022, 106, 449–468. [Google Scholar] [CrossRef]
  28. Yochum, N.; Starr, R.M.; Wendt, D.E. Utilizing Fishermen Knowledge and Expertise: Keys to Success for Collaborative Fisheries Research. Fisheries 2011, 36, 593–605. [Google Scholar] [CrossRef]
  29. Schemmel, E.; Friedlander, A.M.; Andrade, P.; Keakealani, K.; Castro, L.M.; Wiggins, C.; Wilcox, B.A.; Yasutake, Y.; Kittinger, J.N. The codevelopment of coastal fisheries monitoring methods to support local management. Ecol. Soc. 2016, 21, 34. [Google Scholar] [CrossRef]
  30. Seyoum, S.; Wallace, E.M.; Tringali, M.D. Permanent genetic resources: Twelve polymorphic microsatellite markers for the bonefish, Albula vulpes and two congeners. Mol. Ecol. Resour. 2008, 8, 354–356. [Google Scholar] [CrossRef]
  31. Belkhir, K.; Borsa, P.; Chikhi, L.; Raufaste, N.; Bonhomme, F. GENETIX, Logiciel sous WindowsTM pour la Génétique des Populations; Laboratoire Génome, Populations, Interactions CNRS UMR 5000, Université deMontpellier II: Montpellier, France, 2000. [Google Scholar]
  32. Faircloth, B.; Glenn, T. Homemade AMPure XP Beads; Department of Ecology and Evolutionary Biology, University of California: Los Angeles, CA, USA, 2011. [Google Scholar]
  33. Catchen, J.; Hohenlohe, P.A.; Bassham, S.; Amores, A.; Cresko, W.A. Stacks: An analysis tool set for population genomics. Mol. Ecol. 2013, 22, 3124–3140. [Google Scholar] [CrossRef]
  34. Danecek, P.; Auton, A.; Abecasis, G.; Albers, C.A.; Banks, E.; DePristo, M.A.; Handsaker, R.E.; Lunter, G.; Marth, G.T.; Sherry, S.T.; et al. The variant call format and VCFtools. Bioinformatics 2011, 27, 2156–2158. [Google Scholar] [CrossRef]
  35. McKinney, G.J.; Waples, R.K.; Seeb, L.W.; Seeb, J.E. Paralogs are revealed by proportion of heterozygotes and deviations in read ratios in genotyping-by-sequencing data from natural populations. Mol. Ecol. Resour. 2016, 17, 656–669. [Google Scholar] [CrossRef]
  36. Kamvar, Z.N.; Tabima, J.F.; Grünwald, N.J. Poppr: An R package for genetic analysis of populations with clonal, partially clonal, and/or sexual reproduction. PeerJ 2014, 2, e281. [Google Scholar] [CrossRef] [PubMed]
  37. Winter, D.; Green, P.; Kamvar, Z.; Gosselin, T. mmod: Modern Measures of Population Differentiation (Version 1.3.3). 2017. Available online: https://github.com/dwinter/mmod (accessed on 1 October 2023).
  38. Hedrick, P.H. Genetics of Populations, 4th ed.; James and Bartlett Publishers: Subury, MA, USA, 2011. [Google Scholar]
  39. Keenan, K.; McGinnity, P.; Cross, T.F.; Crozier, W.W.; Prodöhl, P.A. diveRsity: An R package for the estimation and exploration of population genetics parameters and their associated errors. Methods Ecol. Evol. 2013, 4, 782–788. [Google Scholar] [CrossRef]
  40. Jombart, T.; Ahmend, I. Adegenet 1.3-1: New tools for the analysis of genome-wide SNP data. Bioinformatics 2011, 27, 3070–3071. [Google Scholar] [CrossRef] [PubMed]
  41. Raj, A.; Stephens, M.; Pritchard, J.K. fastSTRUCTURE: Variational Inference of Population Structure in Large SNP Data Sets. Genetics 2014, 197, 573–589. [Google Scholar] [CrossRef] [PubMed]
  42. Rosenberg, N.A. Distruct: A program for the graphical display of population structure. Mol. Ecol. Notes 2004, 4, 137–138. [Google Scholar] [CrossRef]
  43. Alexander, D.H.; Novembre, J.; Lange, K. Fast model-based estimation of ancestry in unrelated individuals. Genome Res. 2009, 19, 1655–1664. [Google Scholar] [CrossRef]
  44. Toonen, R.J.; Andrews, K.R.; Baums, I.B.; Bird, C.E.; Concepcion, G.T.; Daly-Engel, T.S.; Eble, J.A.; Faucci, A.; Gaither, M.R.; Iacchei, M.; et al. Defining Boundaries for Ecosystem-Based Management: A Multispecies Case Study of Marine Connectivity across the Hawaiian Archipelago. J. Mar. Biol. 2011, 2011, 460173. [Google Scholar] [CrossRef]
  45. Lindo-Atichati, D.; Jia, Y.; Wren, J.L.K.; Antoniades, A.; Kobayashi, D.R. Eddies in the Hawaiian Archipelago Region: Formation, Characterization, and Potential Implications on Larval Retention of Reef Fish. J. Geophys. Res. Oceans 2020, 125, e2019JC015348. [Google Scholar] [CrossRef]
  46. Rivera, M.A.J.; Andrews, K.R.; Kobayashi, D.R.; Wren, J.L.K.; Kelley, C.; Roderick, G.K.; Toonen, R.J. Genetic Analyses and Simulations of Larval Dispersal Reveal Distinct Populations and Directional Connectivity across the Range of the Hawaiian Grouper (Epinephelus quernus). J. Mar. Biol. 2010, 2011, 765353. [Google Scholar] [CrossRef]
  47. Tenggardjaja, K.A.; Bowen, B.W.; Bernardi, G. Reef Fish Dispersal in the Hawaiian Archipelago: Comparative Phylogeography of Three Endemic Damselfishes. J. Mar. Biol. 2016, 2016, 3251814. [Google Scholar] [CrossRef]
  48. Coleman, R.R.; Bowen, B.W. Genomic assessment of an endemic Hawaiian surgeonfish, Acanthurus triostegus sandvicensis reveals high levels of connectivity and fine-scale population structure. Coral Reefs 2022, 41, 687–697. [Google Scholar] [CrossRef]
  49. Rivera, M.A.J.; Kelley, C.D.; Roderick, G.K. Subtle population genetic structure in the Hawaiian grouper, Epinephelus quernus (Serranidae) as revealed by mitochondrial DNA analyses. Biol. J. Linn. Soc. 2004, 81, 449–468. [Google Scholar] [CrossRef]
  50. Williams, C.T.; Mclvor, A.J.; Wallace, E.M.; Lin, Y.J.; Berumen, M.L. Genetic diversity and life-history traits of bonefish Albula spp. from the Red Sea. J. Fish Biol. 2020, 98, 855–864. [Google Scholar] [CrossRef]
  51. Husson, L.; Boucher, F.C.; Sarr, A.; Sepulchre, P.; Cahyarini, S.Y. Evidence of Sundaland’s subsidence requires revisiting its biogeography. J. Biogeogr. 2019, 47, 843–853. [Google Scholar] [CrossRef]
  52. Danylchuk, A.J.; Cooke, S.J.; Goldberg, T.L.; Suski, C.D.; Murchie, K.J.; Danylchuk, S.E.; Shultz, A.D.; Haak, C.R.; Brooks, J.; Oronti, A.; et al. Aggregations and offshore movements as indicators of spawning activity of bonefish (Albula vulpes) in The Bahamas. Mar. Biol. 2011, 158, 1981–1999. [Google Scholar] [CrossRef]
  53. Wills, P.S.; Shenker, J.; Ajemian, M.J.; Mejri, S.; Adams, A. Bonefish Reproduction Research Project: March 2016–February 2022 Final Report. 2022, p. 189. Available online: https://www.bonefishtarpontrust.org/downloads/research-reports/stories/brrp-btt-final%20report.pdf (accessed on 11 September 2022).
  54. Lombardo, S.M.; Chérubin, L.M.; Adams, A.J.; Shenker, J.M.; Wills, P.S.; Danylchuk, A.J.; Ajemian, M.J. Biophysical larval dispersal models of observed bonefish (Albula vulpes) spawning events in Abaco, The Bahamas: An assessment of population connectivity and ocean dynamics. PLoS ONE 2022, 17, e0276528. [Google Scholar] [CrossRef]
  55. Talma, S.C.A.L. Genetic Connectivity of the Roundjaw Bonefish (Albula glossodonta) in the Southwest Indian Ocean. Master’s Thesis, Rhodes University, Grahamstown, South Africa, 2021. Available online: http://hdl.handle.net/10962/192174 (accessed on 10 February 2023).
  56. Douglas, M.R.; Chafin, T.K.; Claussen, J.E.; Philipp, D.P.; Douglas, M.E. Are populations of economically important bonefish and queen conch ‘open’ or ‘closed’ in the northern caribbean basin? Mar. Ecol. 2021, 42, e12639. [Google Scholar] [CrossRef]
  57. Maragos, J.E.; Jokiel, P.L. Reef corals of Johnston Atoll: One of the world’s most isolated reefs. Coral Reefs 1986, 4, 141–150. [Google Scholar] [CrossRef]
  58. Kosaki, R.K.; Pyle, R.L.; Randall, J.E.; Irons, D.K. New records of fishes from Johnston Atoll with notes on biogeography. Pac. Sci. 1991, 45, 186–203. [Google Scholar]
  59. Randall, J.E. Zoogeography of shore fishes of the Indo-Pacific region. Zool. Stud. 1998, 37, 227–268. [Google Scholar]
  60. DiBattista, J.D.; Wilcox, C.; Craig, M.T.; Rocha, L.A.; Bowen, B.W. Phylogeography of the Pacific Blueline Surgeonfish Acanthurus nigroris reveals a cryptic species in the Hawaiian Archipelago. J. Mar. Biol. 2011, 2011, 839134. [Google Scholar] [CrossRef]
  61. Skillings, D.J.; Bird, C.E.; Toonen, R.J. Gateways to Hawai‘i: Genetic Population Structure of the Tropical Sea Cucumber Holothuria atra. J. Mar. Biol. 2010, 2011, 783030. [Google Scholar] [CrossRef]
  62. Wren, J.L.K.; Kobayashi, D.R.; Jia, Y.; Toonen, R.J. Modeled Population Connectivity across the Hawaiian Archipelago. PLoS ONE 2016, 11, e0167626. [Google Scholar] [CrossRef] [PubMed]
  63. Kobayashi, D.R.; Polovina, J.J. Simulated seasonal and interannual variability in larval transport and oceanography in the Northwestern Hawaiian Islands using satellite remotely sensed data and computer modeling. Atoll Res. Bull. 2006, 543, 365–390. [Google Scholar]
  64. Zeng, X.; Adams, A.; Roffer, M.; He, R. Potential connectivity among spatially distinct management zones for Bonefish (Albula vulpes) via larval dispersal. Environ. Biol. Fishes 2018, 102, 233–252. [Google Scholar] [CrossRef]
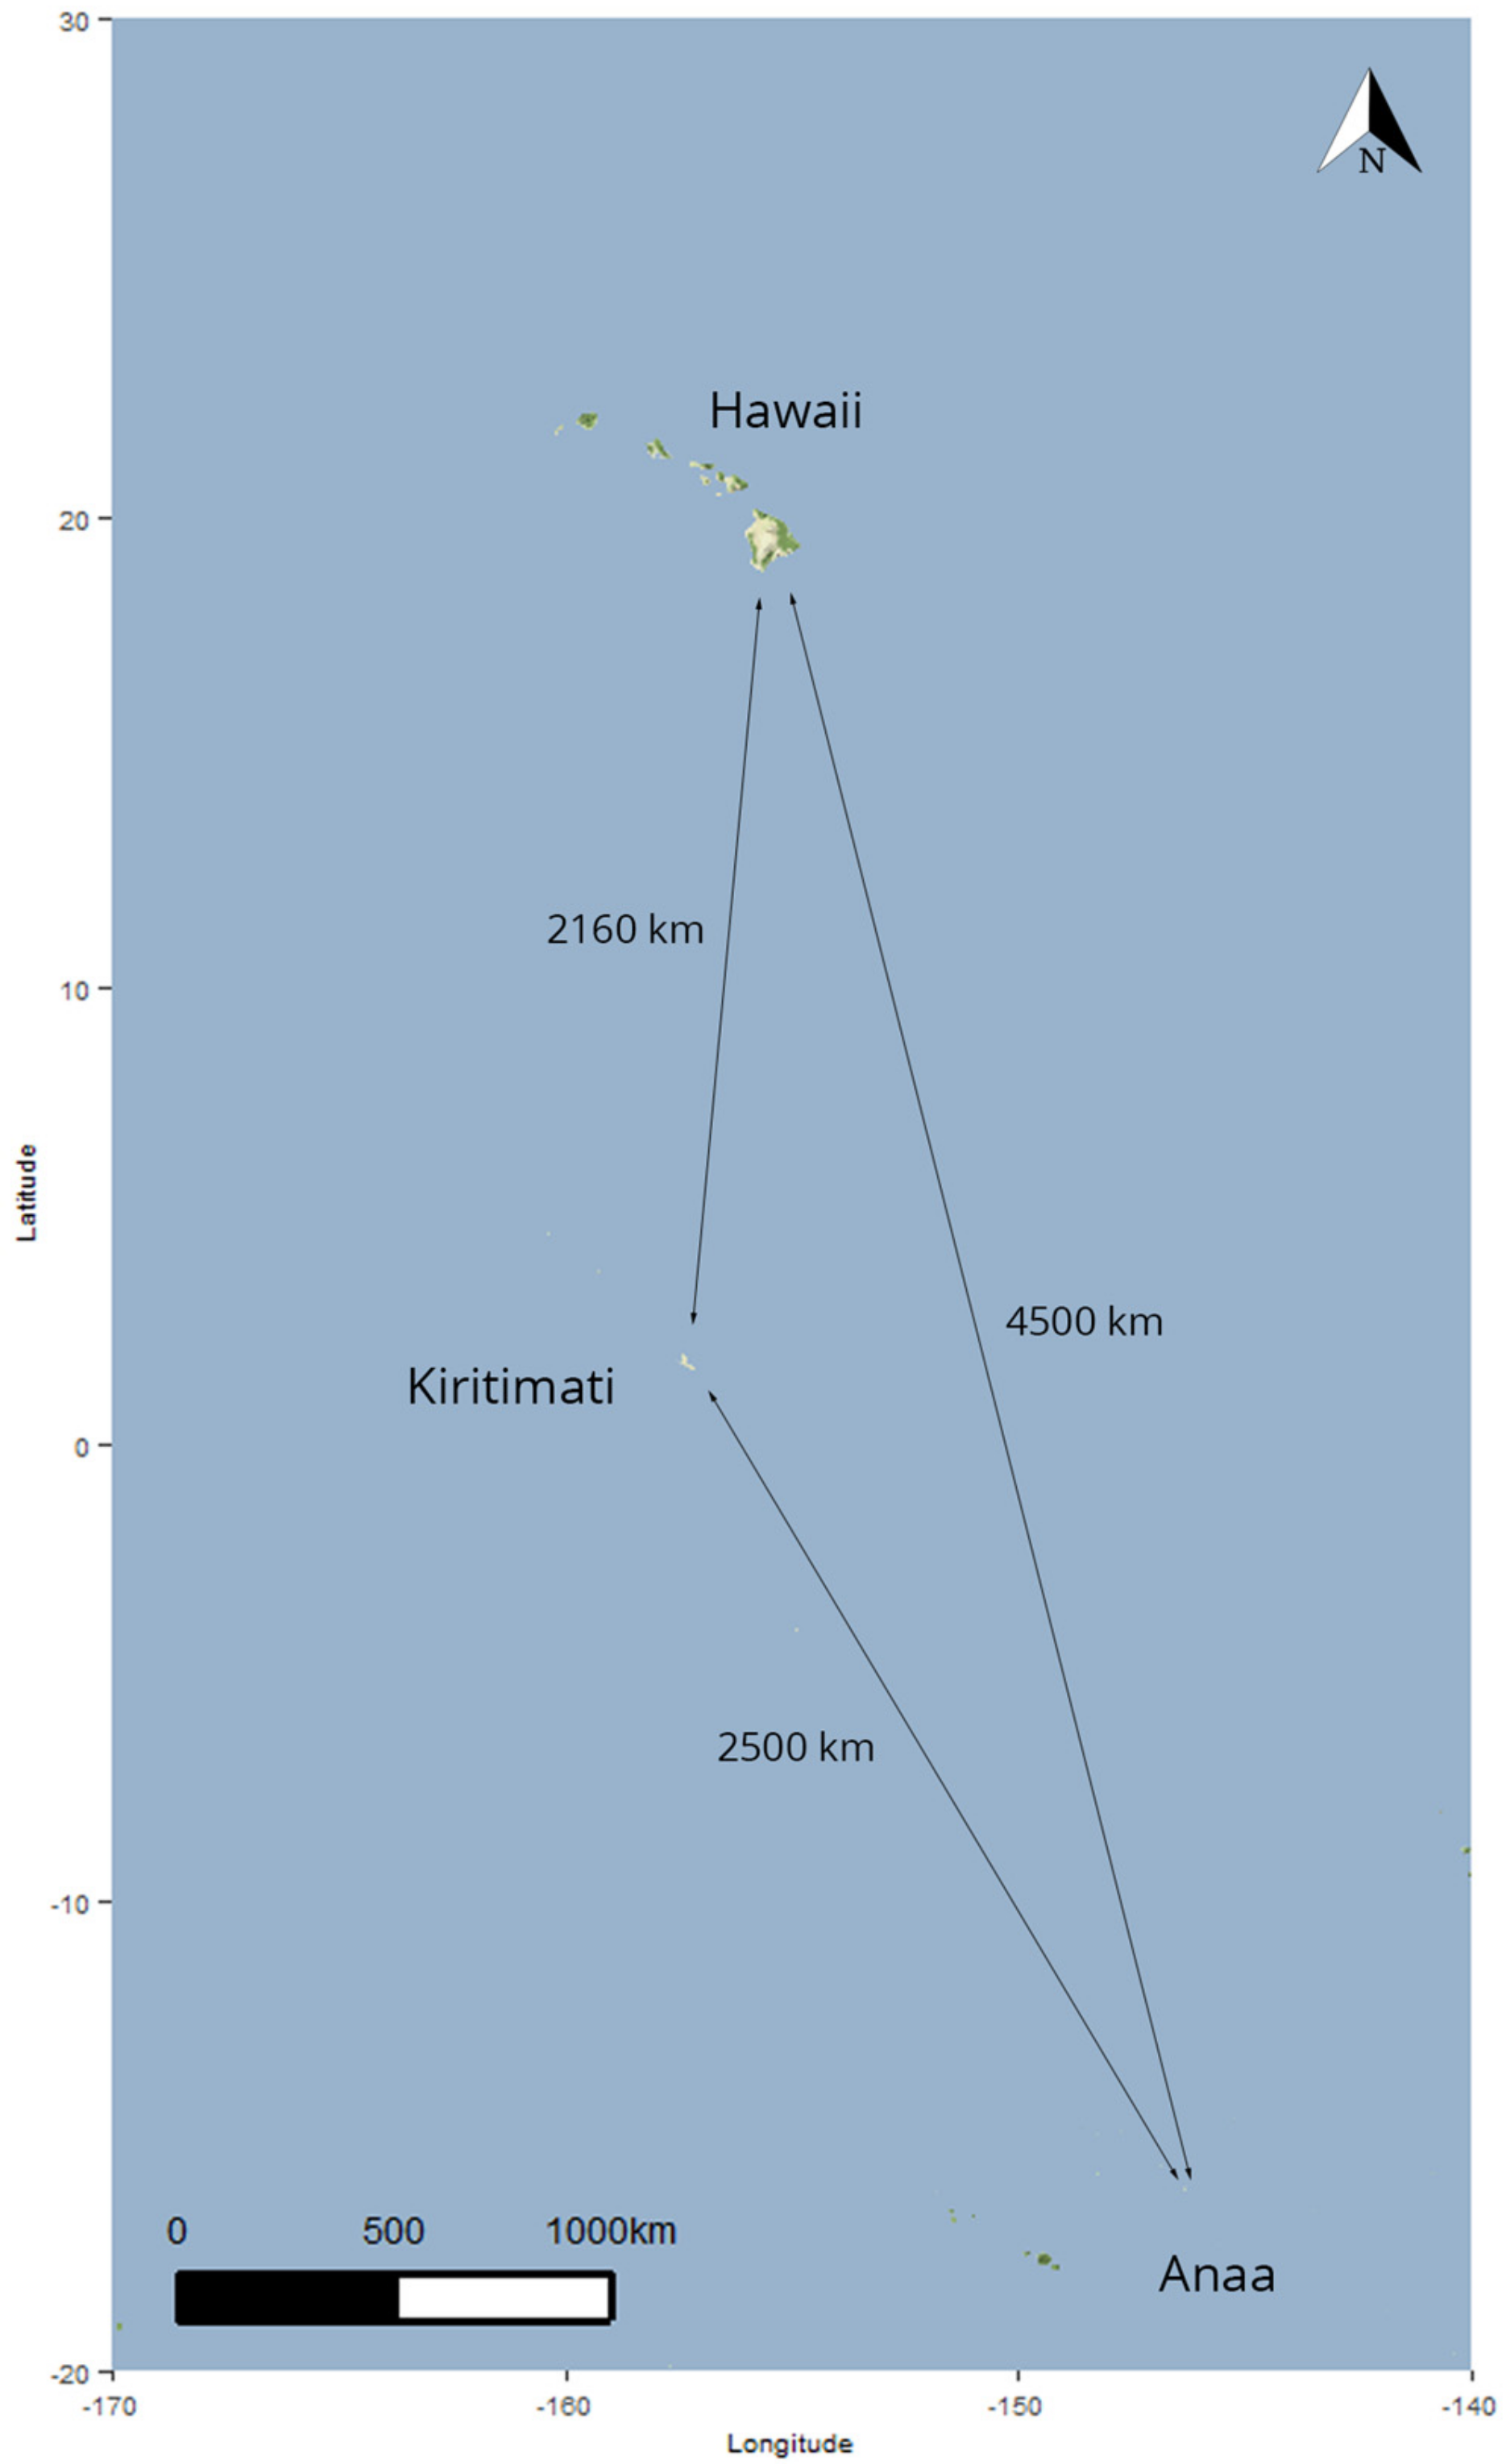
Figure 1. Map of three Albula glossodonta sampling regions in the Central Pacific.
Fishes 08 00585 g001
Figure 2. Albula glossodonta discriminant analysis of principal components (DAPC) spatial clustering among four islands in the central South Pacific Ocean. The number of retained variables (da = 3 and pc = 60, 47.5% conserved variance) was determined through cross validation.
Fishes 08 00585 g002
Figure 3. Maximum likelihood genetic clustering of Albula glossodonta from four Pacific Ocean islands assessed in Admixture based on 7225 SNPs.
Fishes 08 00585 g003
Figure 4. Discriminant analysis of principal components (DAPC) group assignments for Albula glossodonta (A) specimens 1–50, (B) specimens 51–100, (C) specimens 151–200, and (D) specimens 201–208. Blue crosses indicate collection location, while heatmap colors represent post-analysis group (hotter colors = stronger assignment). 1 = Anaa, 2 = O’ahu, 3 = Kiritimati, 4 = Maui.
Fishes 08 00585 g004aFishes 08 00585 g004b
Table 1. Number of Albula specimens collected and processed from each location.
LocationSamples CollectedSamples Processed
O’ahu (adults)150108
O’ahu (leptocephalus)2823
Maui3030
Kiritimati3736
Anaa5857
Total303254 *
* There were 14 A. virgata identified and these were removed for analysis. Of the 240 GSI verified Albula glossodonta, 208 were retained for analyses after data quality filtering.
Table 2. Genetic diversity estimates for the 7225 SNP Albula glossodonta dataset collected from four islands in the Central Pacific Ocean. Indices were calculated in the R package poppr. Abbreviations: N = sample size, MLG = multilocus genotypes, eMLG = rarefaction corrected MLG, SE = standard error based on eMLG, H = Shannon–Weiner index, G = Stoddart and Taylor’s index, λ = Simpson’s index, E = allelic evenness, and Hexp = Nei’s unbiased gene diversity.
LocationNMLGeMLGSEHGλEHexp
Anaa3131200.003.43310.9710.23
O’ahu122122200.004.801220.9910.24
Kiritimati3535200.003.56350.9710.24
Maui2020200.003.00200.9510.24
The majority of private alleles occurred in individuals from Maui (n = 682) and O’ahu (n = 593), fewer were identified from Anaa and Kiritimati (n = 287 and 234, respectively).
Table 3. Pairwise genetic differentiation of Albula glossodonta among four Pacific Ocean islands, measured as GST [37] (lower triangle) and FST (upper triangle).
AnaaO’ahuKiritimatiMaui
Anaa~0.09980.04160.1066
O’ahu0.0847~0.05090.005
Kiritimati0.03250.0415~0.0537
Maui0.08720.00160.043~
Disclaimer/Publisher’s Note: The statements, opinions and data contained in all publications are solely those of the individual author(s) and contributor(s) and not of MDPI and/or the editor(s). MDPI and/or the editor(s) disclaim responsibility for any injury to people or property resulting from any ideas, methods, instructions or products referred to in the content.