1. Introduction
The Atlantic bluefin tuna (
Thunnus thynnus, ABFT) is one of the largest osteichthyans, has a life span of more than 35 years, and has a wide distribution in the Atlantic Ocean and Mediterranean Sea, where it carries out extensive feeding and reproductive migrations. This species is exploited by many countries, and even though the total catch is not very large compared to other tuna species, it is one of the world’s most valuable fish species [
1,
2,
3].
The description of the life cycle and effective management of ABFT requires comprehensive knowledge on the age and growth of this species. One of the most widely used methods for estimating the age of ABFT is based on examination of calcified structures [
3]. The estimation of absolute age by reading otoliths is validated by the bomb radiocarbon method [
4] and the otolith strontium (Sr):calcium (Ca) profiles revealed periodicity of the formation of the annual increments [
5].
Direct age assignment depends not only on the number of annuli, comprising an opaque and a translucent band found in the calcified structure, but also on the time of the year when each type of band is formed. This is so because, to convert the band count into an age estimate, it is necessary to consider the marginal band type found in the structure related to the catch date and the birth date. The study by Siskey et al. [
5], shows that compared periodicity of annuli formation in otoliths of ABFT against Sr:Ca oscillations, indicates that opaque bands occurs cyclically, consistent with seasonal cycles in Sr:Ca that serve as a proxy for seasonal temperatures variation (i.e., higher otolith Sr:Ca in opaque bands is presumed to occur during winter months), confirming the assumed inverse relationship between Sr uptake and temperature. In contrast, a higher Sr concentration was detected in the translucent bands of the otolith of southern bluefin tuna (
Thunnus maccoyii) [
6] when applying the same technique. Similarly, Sr concentrations assessed across annulus of the first dorsal fin spine (fin spine, hereafter) of juvenile ABFTs were significantly higher in the translucent bands [
7], and were interpreted as having formed in winter. In support of that, edge type and marginal increment analyses of the ABFT fin spines indicated a yearly periodicity of annulus formation, with the translucent bands appearing in winter [
8].
The periodicity of annuli formation is commonly determined by marginal increment analysis (MIA), in which the distance from the last completely formed annulus to the edge of the otolith is tracked over time. This method requires a good representation of observations throughout the year to detect any seasonal trend in the formation of growth bands [
9,
10]. The selected mark must be accurate enough to allow detection of its formation at the extreme edge of the otolith. Edge type identification, either as translucent or opaque, in otoliths of ABFT, is difficult. The thickness of the section and the diffraction of light can influence the perception of the of edge type, making identification of marginal areas in the ABFT otoliths more difficult. Recently, it was accepted that using transmitted light for otoliths direct ageing improves agreement on marginal edge recognition [
11,
12]. However, long-standing controversies remain regarding the periodicity, or seasonality, of otolith type of band formation, which directly influences the correct age determination of ABFT using this calcified structure. Thereby, the aim of this work was to apply MIA to determine the timing of band deposition. To address this, growth bands (annuli) were measured from otoliths of ABFT collected monthly. We also performed edge type analysis (EA) by analyzing the change in the relative frequency of the opaque or translucent bands over the months.
2. Materials and Methods
To be able to effectively use the marginal increment analysis (MIA) method, sampling is required in all months of the year and, as far as possible, for all ages in each month. The seasonality and size-selectivity of ABFT fisheries, in addition to the migratory behavior of this widely distributed species, makes comprehensive year-round sampling difficult for ABFT. For this study, ABFT otoliths were collected from specimens obtained from both sides of the Atlantic Ocean and from the Mediterranean Sea, thanks to extensive sampling by the Atlantic-Wide Research Programme for Bluefin Tuna of the International Commission for the Conservation of Atlantic Tunas (GBYP, ICCAT), the contributions of St. Andrews Biological Station (SABS) and the Spanish Institute of Oceanography (IEO-CSIC). Sampling was carried out from 2009 to 2021 and used a combination of capture methods (e.g., traps, long-lining, bait boats, purse seine, etc.). No live animals were used for this study. Fish were measured mostly at straight fork length (SFL), but also at curved fork length, snout length and round weight. The latter measurements were converted into SFL, following the biometric relationships established by ICCAT [
13,
14]. Size range sampled was from 50 to 295 cm SFL.
Otoliths were prepared by three laboratories (Fish Ageing Services (FAS), SABS, and IEO-CSIC) following the standardized methodology described in Rodriguez-Marin et al. [
11]. Three research centers were involved in the otolith age reading and analysis (SABS, IEO-CSIC, and AZTI) using the standardized reading criterion [
11]. In addition, otoliths read with the previous reading criterion of Busawon et al. [
15] were also included in the analysis to ensure a better monthly sampling and size range coverage. These two criteria differ mainly in that the opaque bands at the otolith edge were only counted if it was completely formed and translucent otolith material was visible between the opaque band and the marginal edge, following Rodriguez-Marin et al. [
11], and were counted, even if not complete, following Busawon et al. [
15]. As such, to use the same band counting criteria to all samples, otolith readings using Busawon et al. [
15] criterion were adjusted as follows: if the otolith edge was opaque, then number of bands = number of bands − 1. The number of otoliths read applying the Busawon et al. [
15] criterion was 152, and for the Rodriguez-Marin et al. [
11] criterion was 2128.
The timing of band formation was assessed by examining the outermost edge of the ventral arm of the otolith section. Following the recommendation from Campana [
9], a minimum of two complete cycles needs to be examined to reduce variability. MIA was used to examine the periodicity of otolith band formation. As such, MIA was determined using the index of completion [
16]:
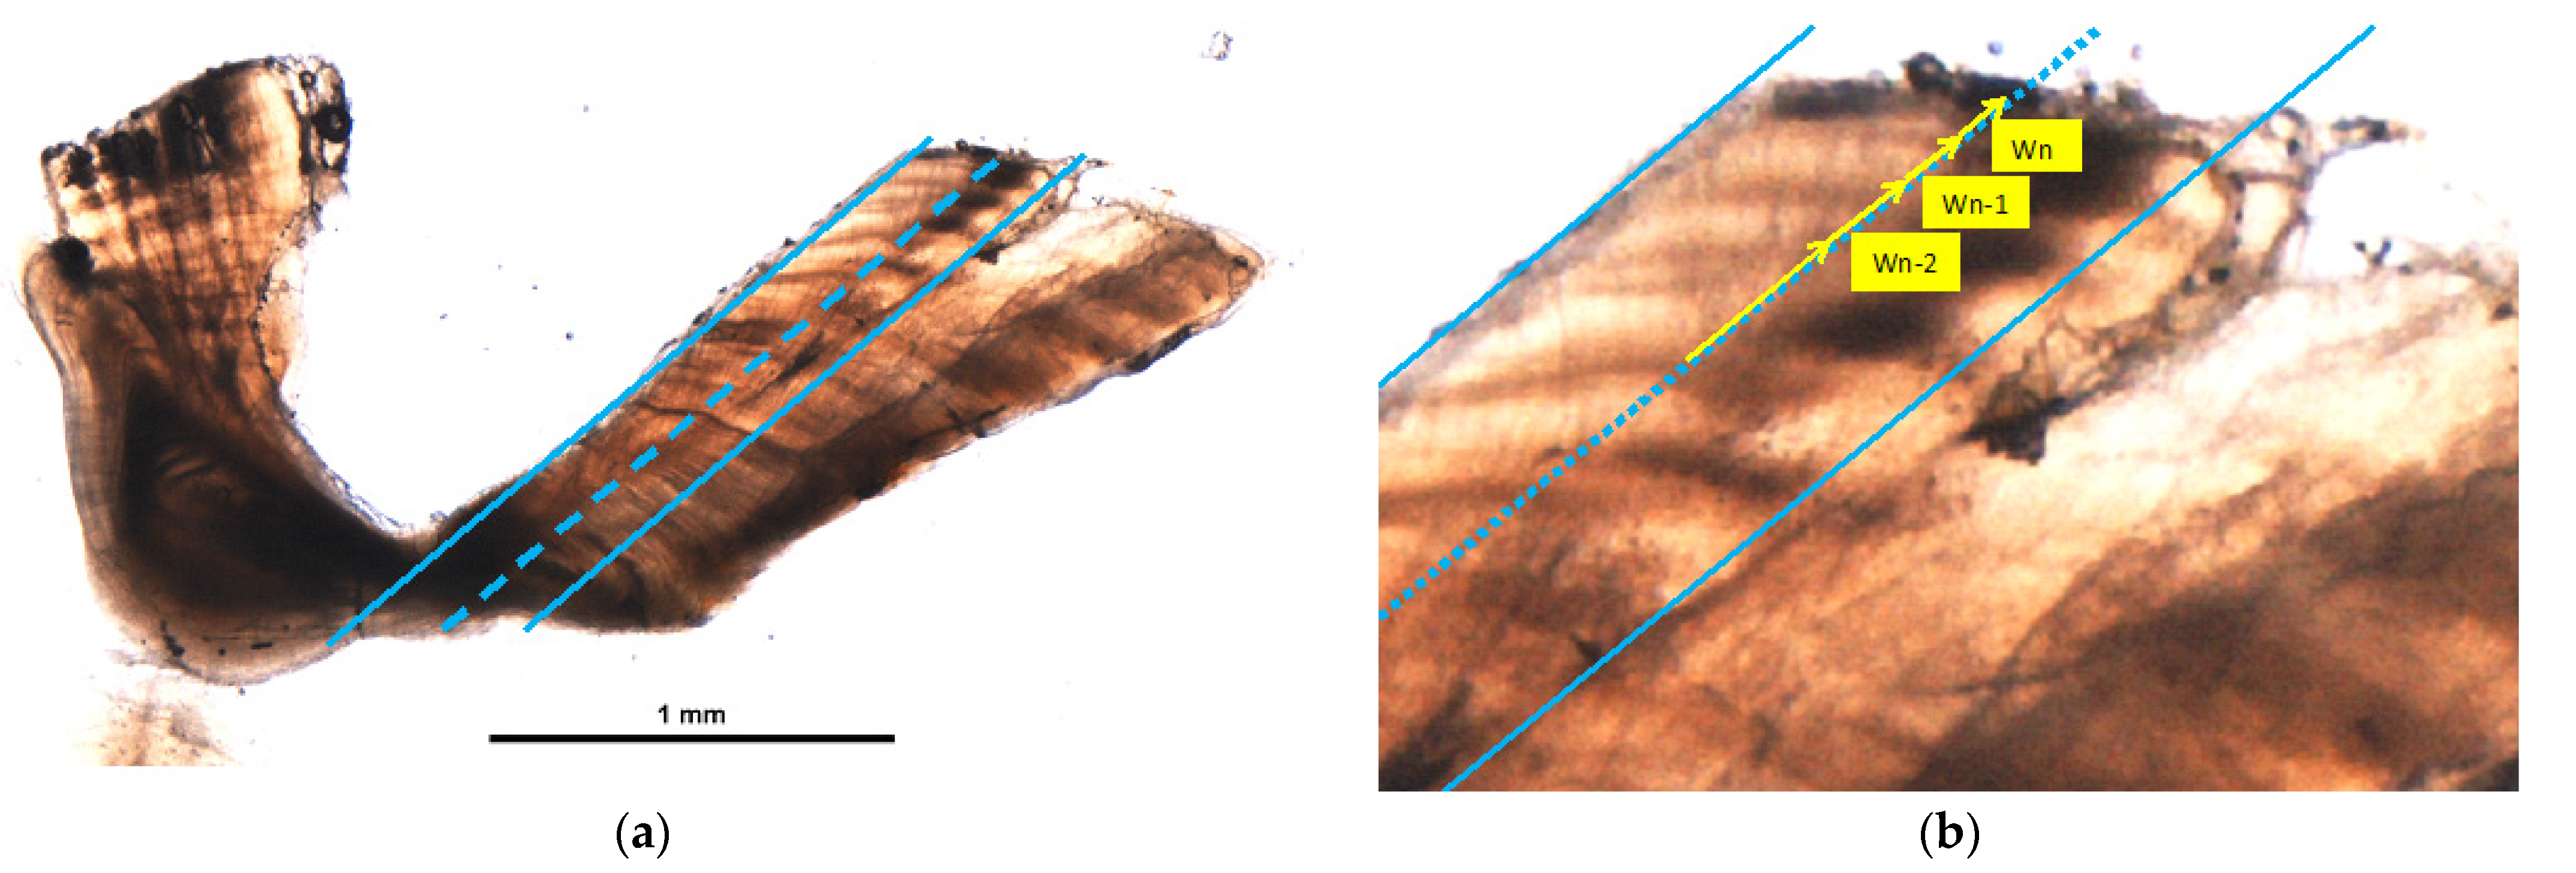
where Wn is the width of the marginal increment (distance from the end of the last opaque zone to the marginal edge, regardless of edge type); and Wn-1 and Wn-2 are widths of the two previously completed increments (the distance from the end of the second or third most outer opaque zones to the last and penultimate opaque zone). This method only allows analysis of MIA in otoliths of specimens over two years old, while for specimens older than one year, only one complete cycle was used:
Measurements were performed with a digital image analysis system. Otoliths were measured along an axis in the area between the sulcus margin and the ventral groove of the ventral arm where the annuli are most distinct, using a standardized “measurement line” [
11] (
Figure 1).
Five readers participated in the measurements, although one of them read with both types of light, transmitted and reflected. This reader was considered as two different readers according to the type of light used. This resulted in a total of 6 readers. The number of images read by each light type was 1740 for transmitted and 540 for reflected. Readers were requested to provide the following information by sample: Light type (reflected, transmitted), number of annual bands (opaque), reading criterion (1 Busawon et al. [
15]; 2 Rodriguez-Marin et al. [
11]), ventral arm marginal edge type (wide translucent, WT; narrow translucent, NT or opaque, O), edge type confidence (1 = not confident; 2 = confident in completeness but not with the edge type and 3 = confident), readability code (1 = pattern present−no meaning, 2 = pattern present−unsure with age estimate, 3 = good pattern present−slightly unsure in some areas, and 4 = good pattern−confident with age estimate), Wn, Wn-1, and Wn-2 widths in mm, agreed band count (“Yes” for agreed and “No” for individual decision), agreed edge type (“Yes” for agreed and “No” for individual decision), measuring date, reader coding, and notes with observations about the sample. The agreement fields were used because all samples were previously read by expert readers as part of several ageing exercise exchanges or read by FAS, however we did not want to restrict new readers to the pre-assigned band counts if they did not agree with the originally assigned band count or marginal edge type. An agreement with previous readings of 49% in the number of bands (were mostly +/− 1 band) and 50% in the type of edge (with the three categories) was reached.
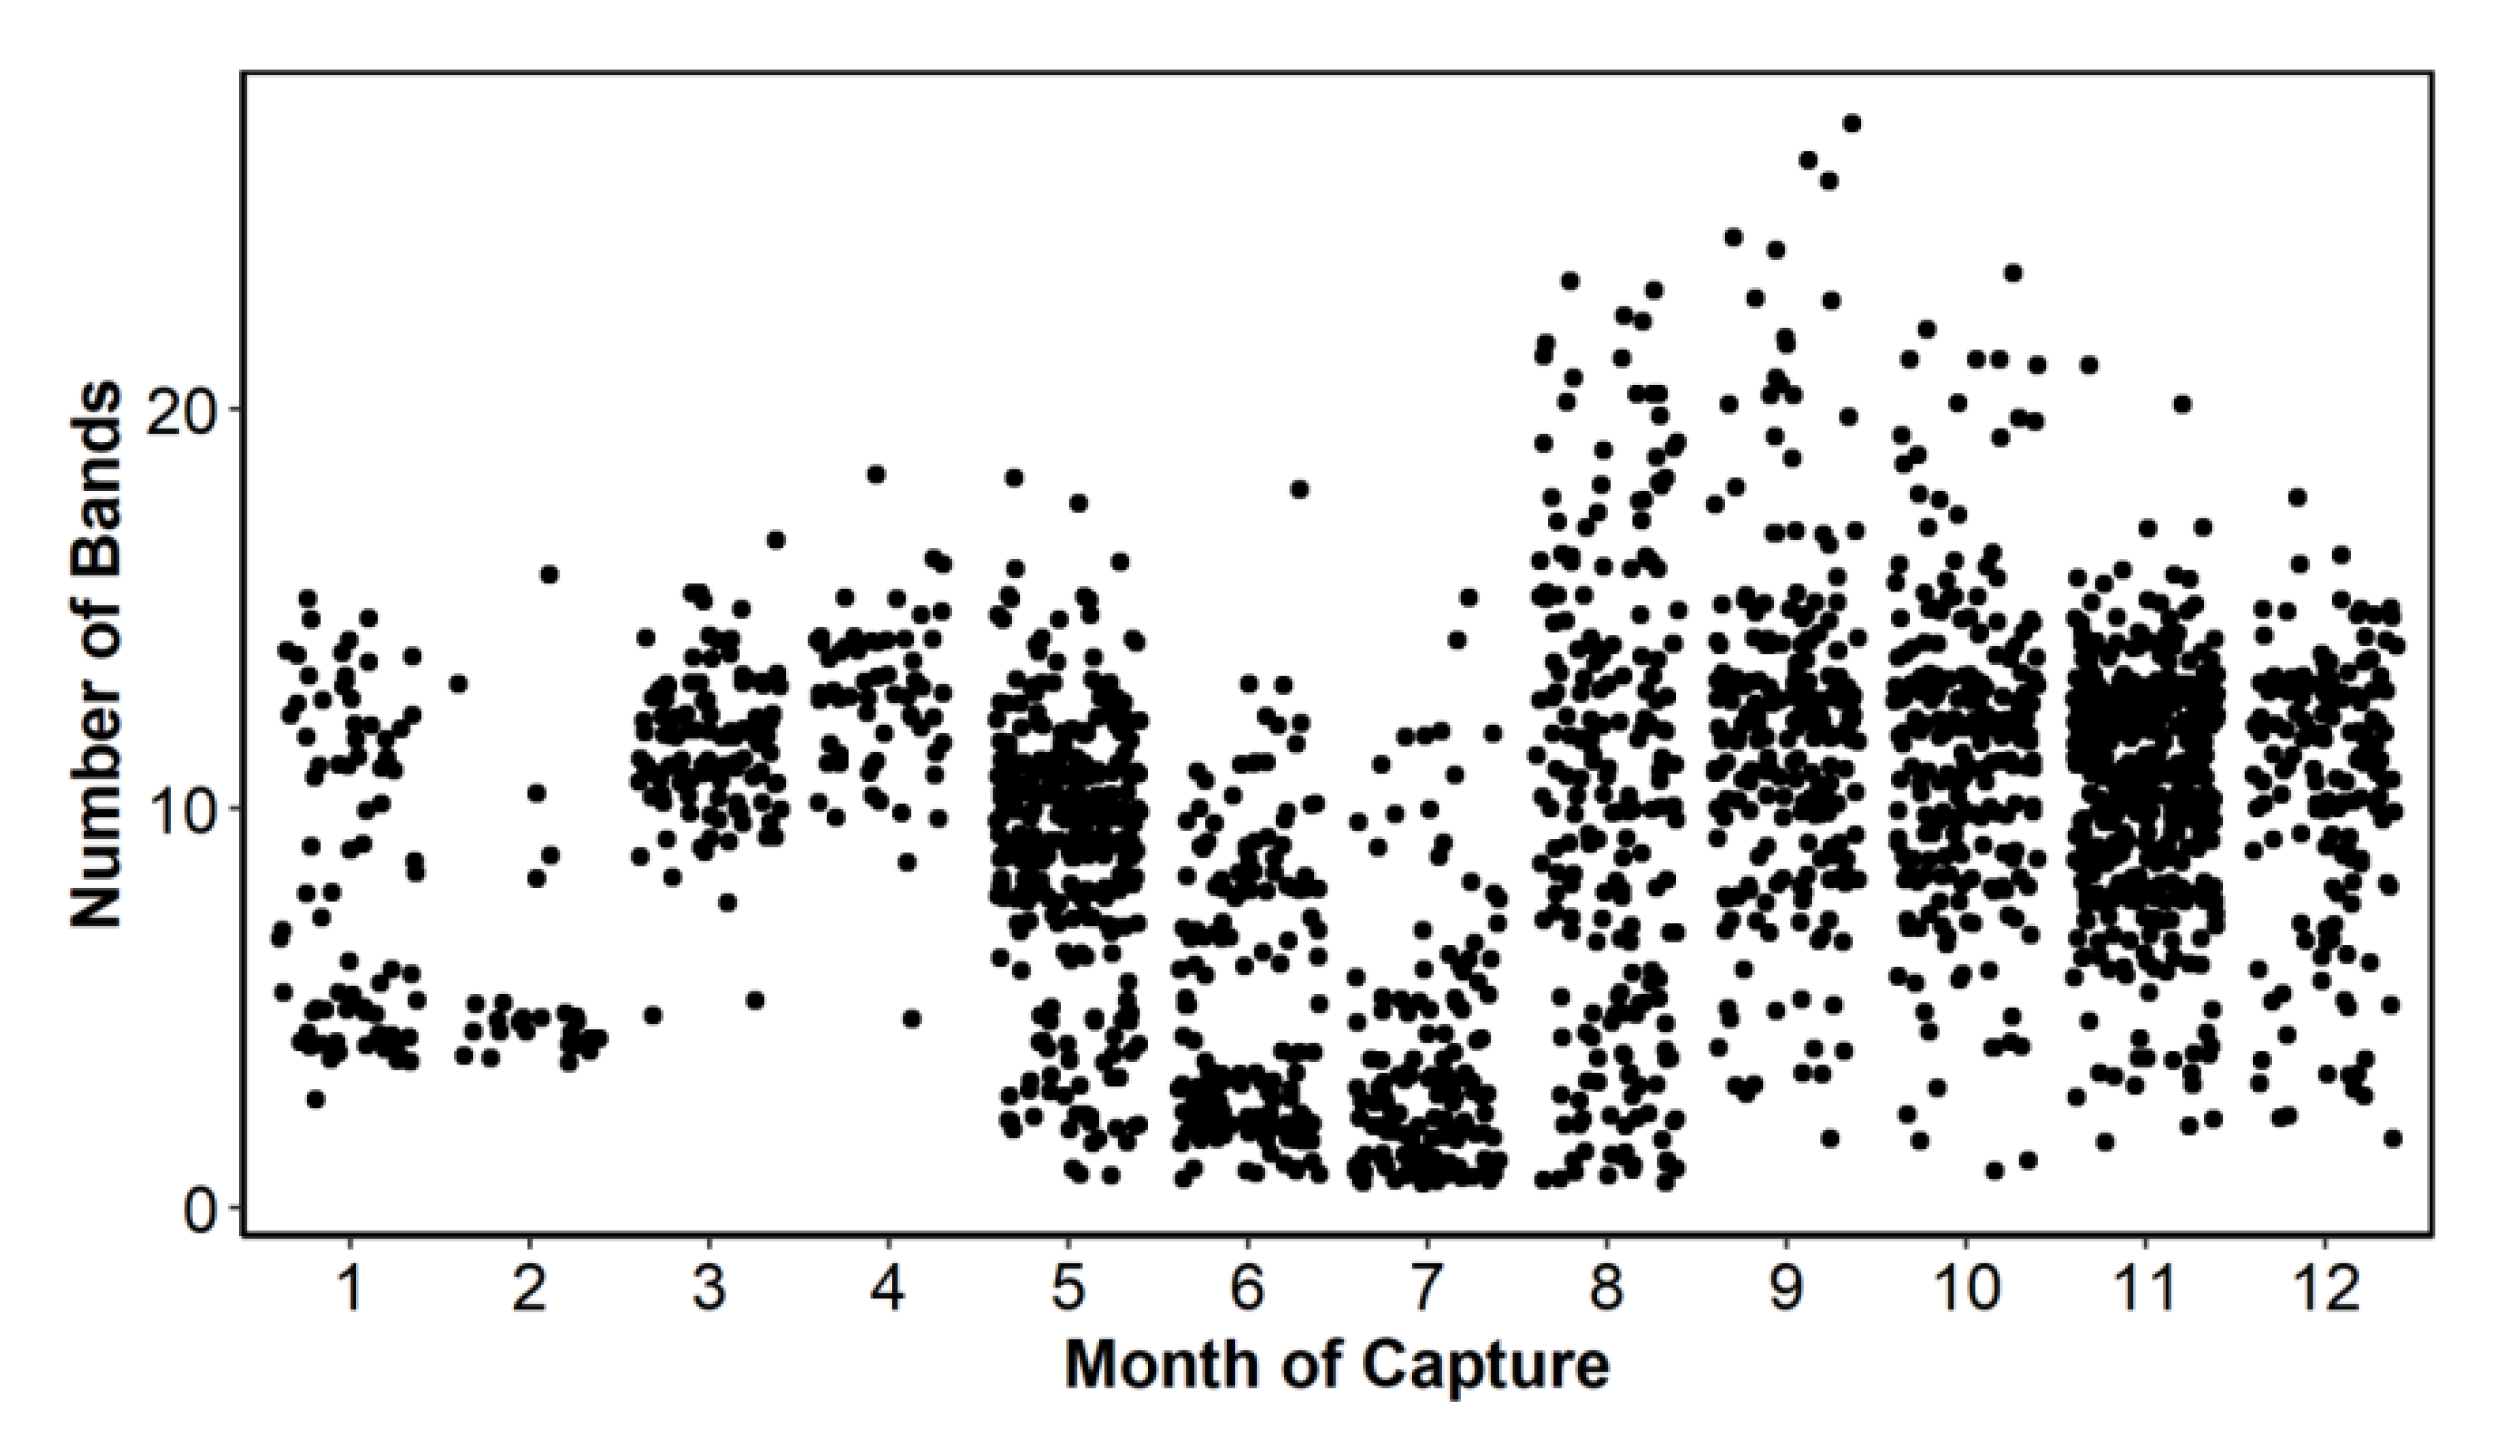
A total of 2280 ABFT otolith images were available for participants to determine yearly periodicity of annulus formation. Approximately 8% of the available samples were not included for further analysis due to poor image quality, missing measurements, age (age 0), or obvious outliers for size-at-age. Furthermore, 18 samples were identified as outliers using the following criteria: if Wn > Wn-1 > Wn-2 and the index of completion C was greater than 120%, they were re-ordered Wn < Wn-1 < Wn-2. This resulted in a total of 2101 samples available for analysis, which included overall good monthly representation by age (number of complete opaque bands), except for months 2, 3, and 4 (
Figure 2).
An alternative measure of annuli completion (CB) was derived using mean annulus width values derived from a recently completed back-calculation study [
17], which was used to provide expected values in the following equation: CB = (observed/expected) × 100, where
observed was an observed annuli width measured in the current study. The
expected width was calculated as the difference in the mean total annuli width (measured from the origin of the ventral arm to the end of a given opaque band) for each annulus for band numbers 1−28. Due in part to the number of available samples decreasing at older age classes, this calculation was achieved to yield negative values at band numbers 24 and 28. To generalize the expected values, we used a GAM (mean annulus width ~ spline (number of bands), family = Gaussian (link = log) to provide the expected values at each annuli width for the CB equation. Plots of mean annual increment measurements and the monthly mean index of completion (CB) were examined for differences in completion trends.
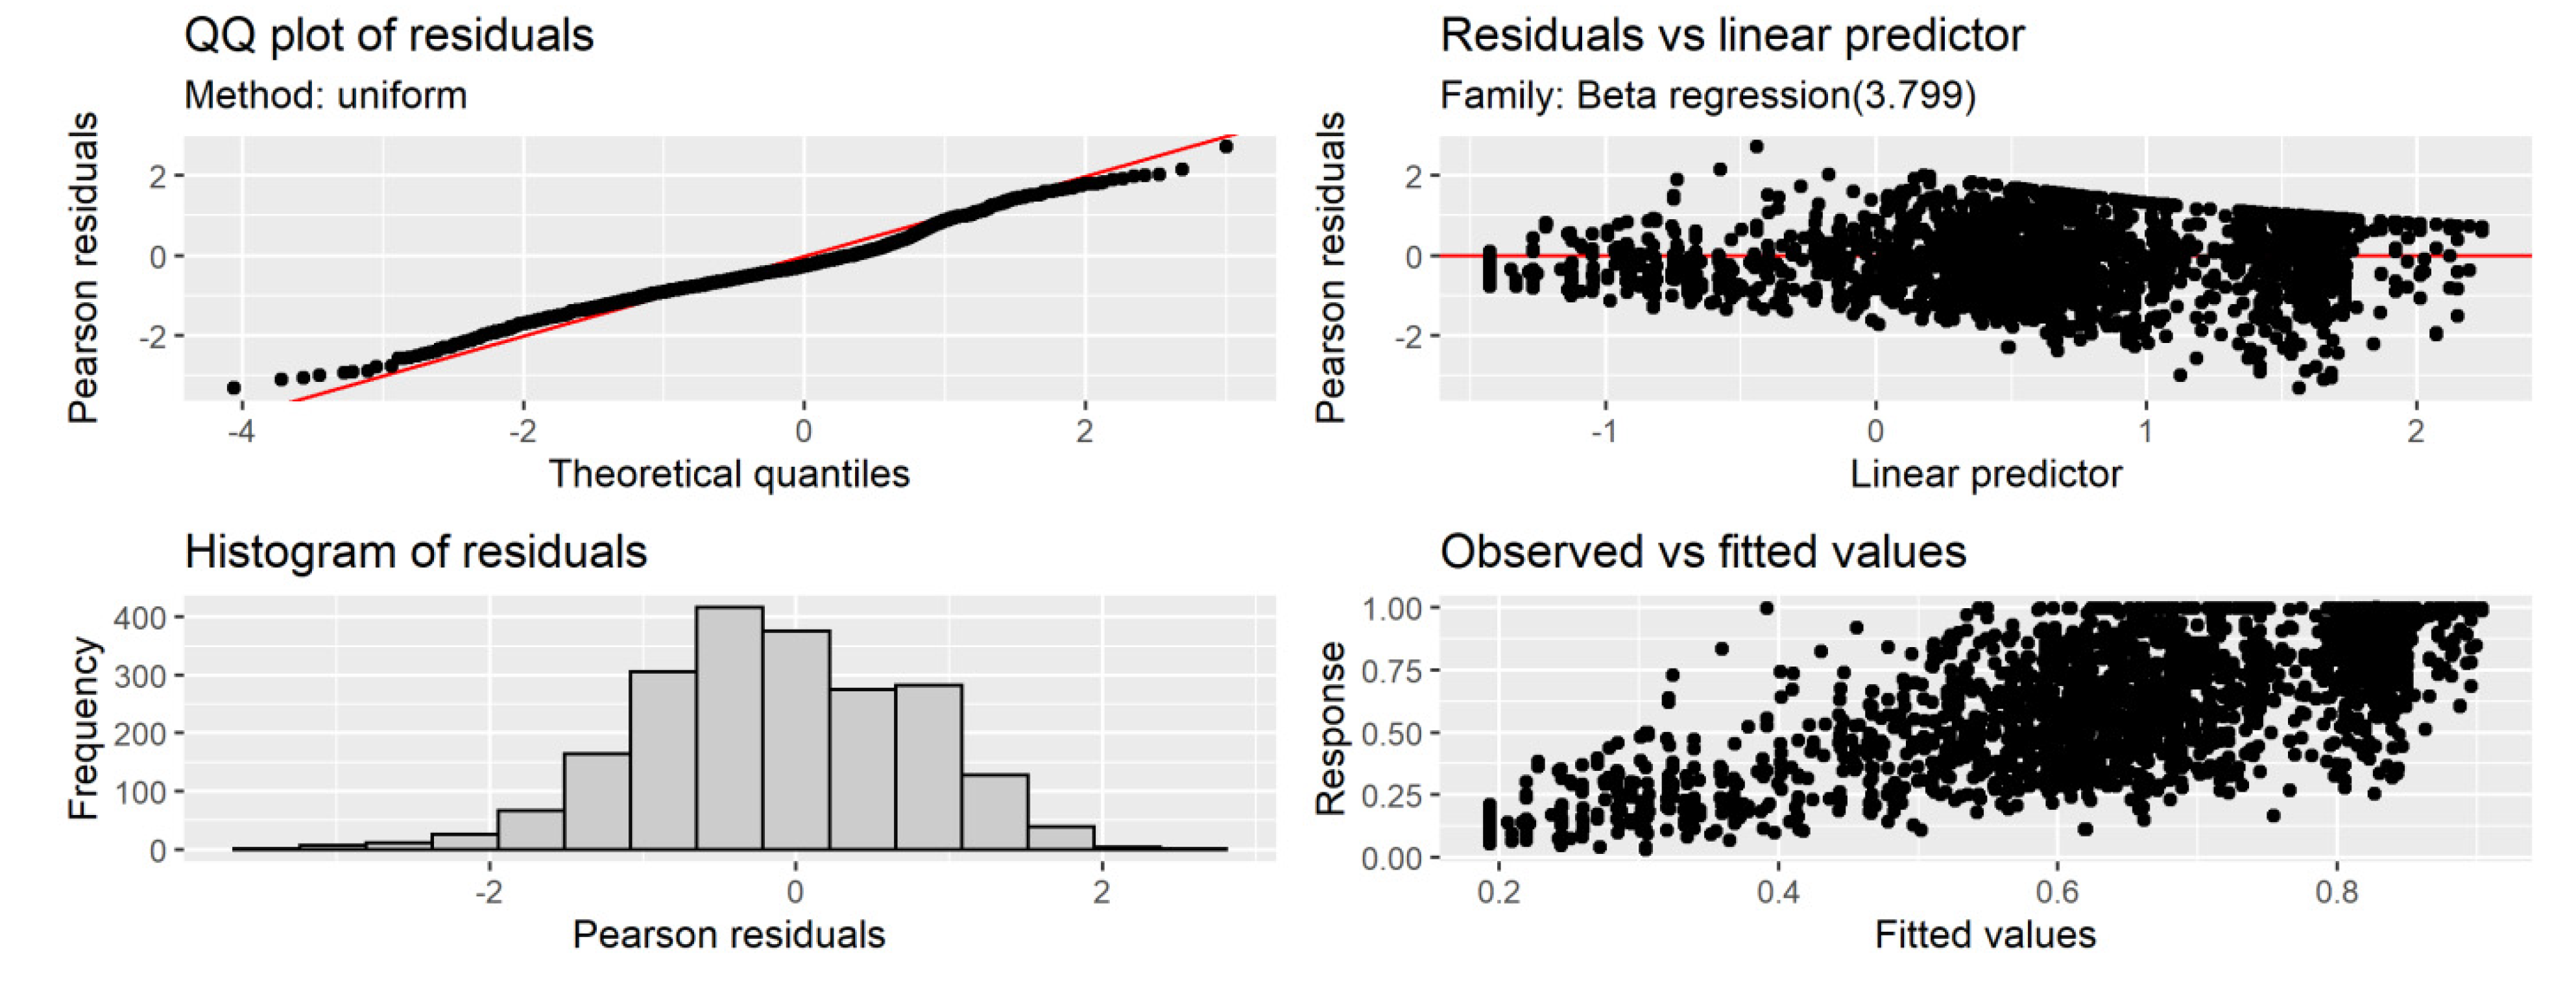
The index of completion was also analyzed using general additive models (GAMs) to evaluate the importance of variables, such as month, age/size, reading criteria, light type, and reader. The following transformations were applied to the data prior to fitting the models: to account for cases where C was greater than 100, samples with an index of completion of 100 were changed to 99.9. Edge type was not included in the model, since it represents phases of completion and is essentially a derivative of the index of completion, that is the completion index for NT < WT < O. Formulations of the model with the light effect as a random effect showed similar trends that differed slightly in the peak of completion, with rate of completion being the highest in July for reflected light vs. September for transmitted light. Since the trends were similar, and due to the fact that the reflected light trend was not very informative due to the timing/span of the sample collection, light type was excluded from the final model. Furthermore, the final model was fitted using both SFL and age; however, SFL yielded a better fit compared to age. This better fit is likely due to length being a more continuous variable compared to age or number of bands. GAMs were fitted assuming beta-distributed data for the response with a logit link. A cyclic cubic spline basis function was specified for smoothers involving month of capture and was limited to 8 knots. Reader, age, and SFL were included as random effects. The best fitted GAM was:
3. Results
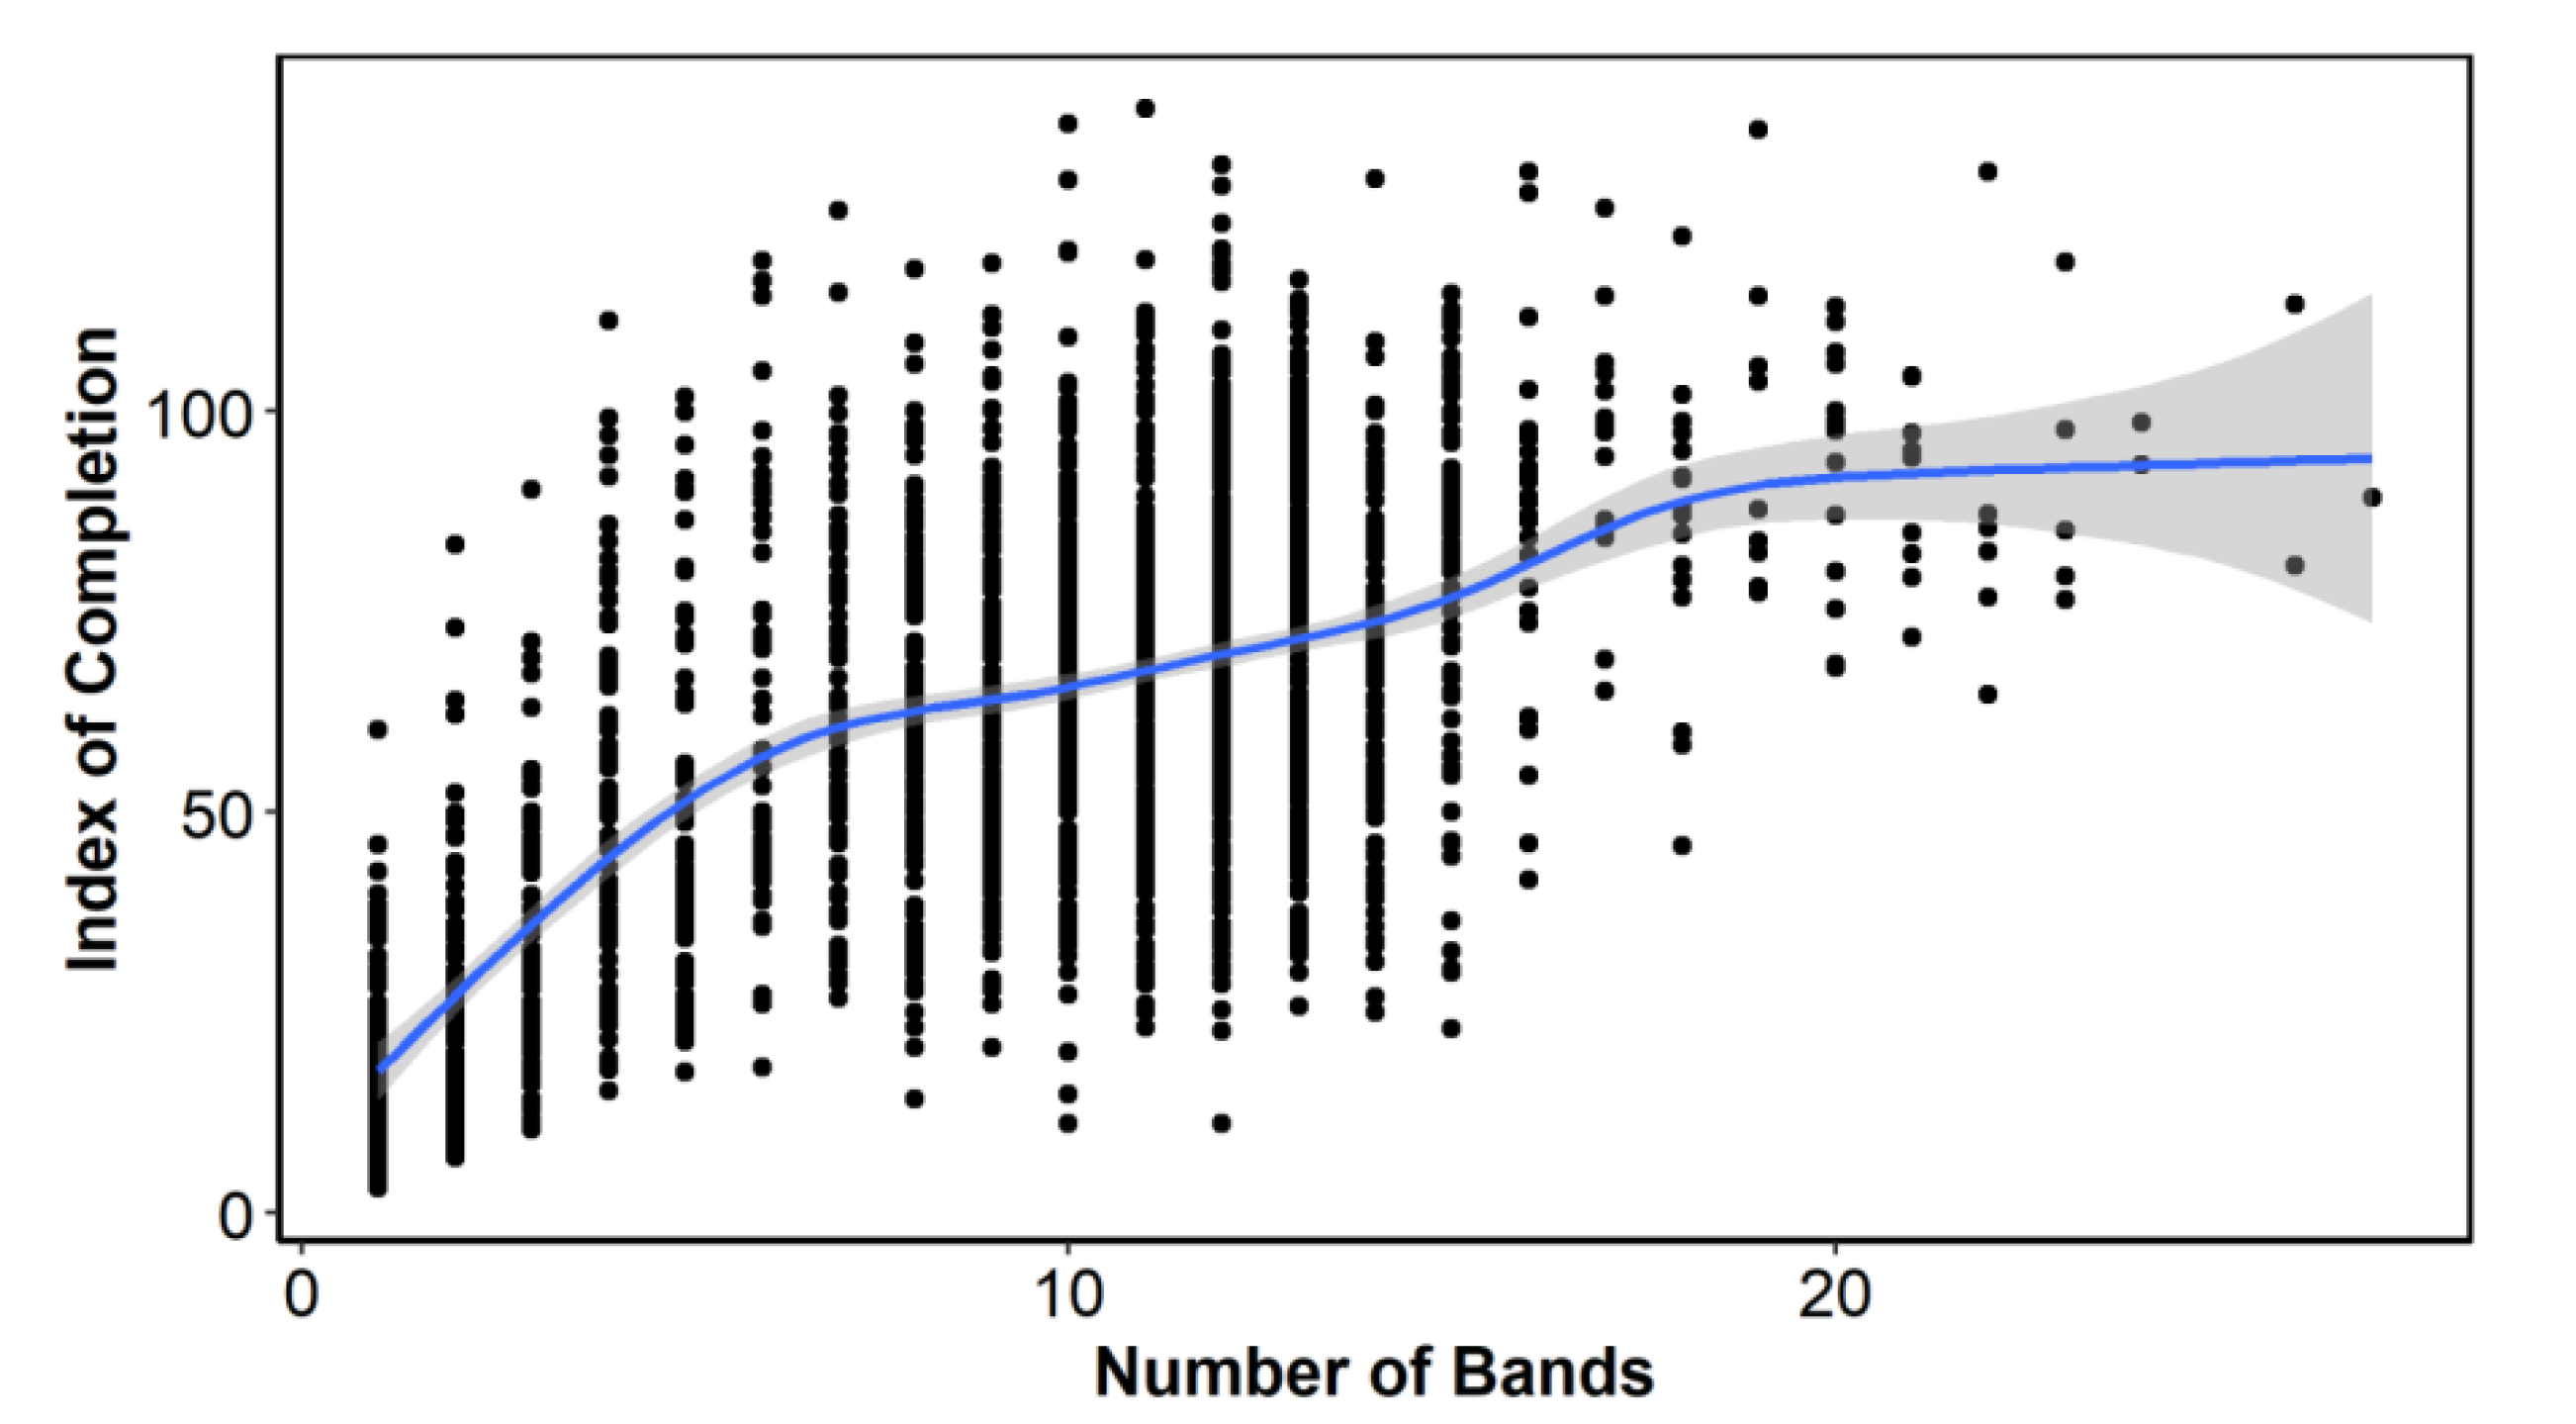
The index of completion (C) by number of bands showed an increase in C with the number of bands, although there was a clear change in the slope of this line, forming three groups: from 1 to 6 bands (juveniles), from 7 to 16 bands (adults) and more than 16 bands (old adults) (
Figure 3). These three slope sections made us explore MIA and EA with all annual/age bands grouped together and by the band groups or bins described above.
The trend in C appeared to be bimodal, indicating that the highest rate of completion occurred during August to October and in April (
Figure 4a). When C was analyzed by age group, this bimodality continued to be observed, with June and July again showing the lowest values, indicating that the otolith margin grew very slowly in these months. The maximum C values of the first months were supported by few samples, while the maximum values of the months from mid-summer to mid-fall were well sampled and indicated higher C values for the months of August–September, through November. This was especially evident in the adults group, which was the best sampled group (
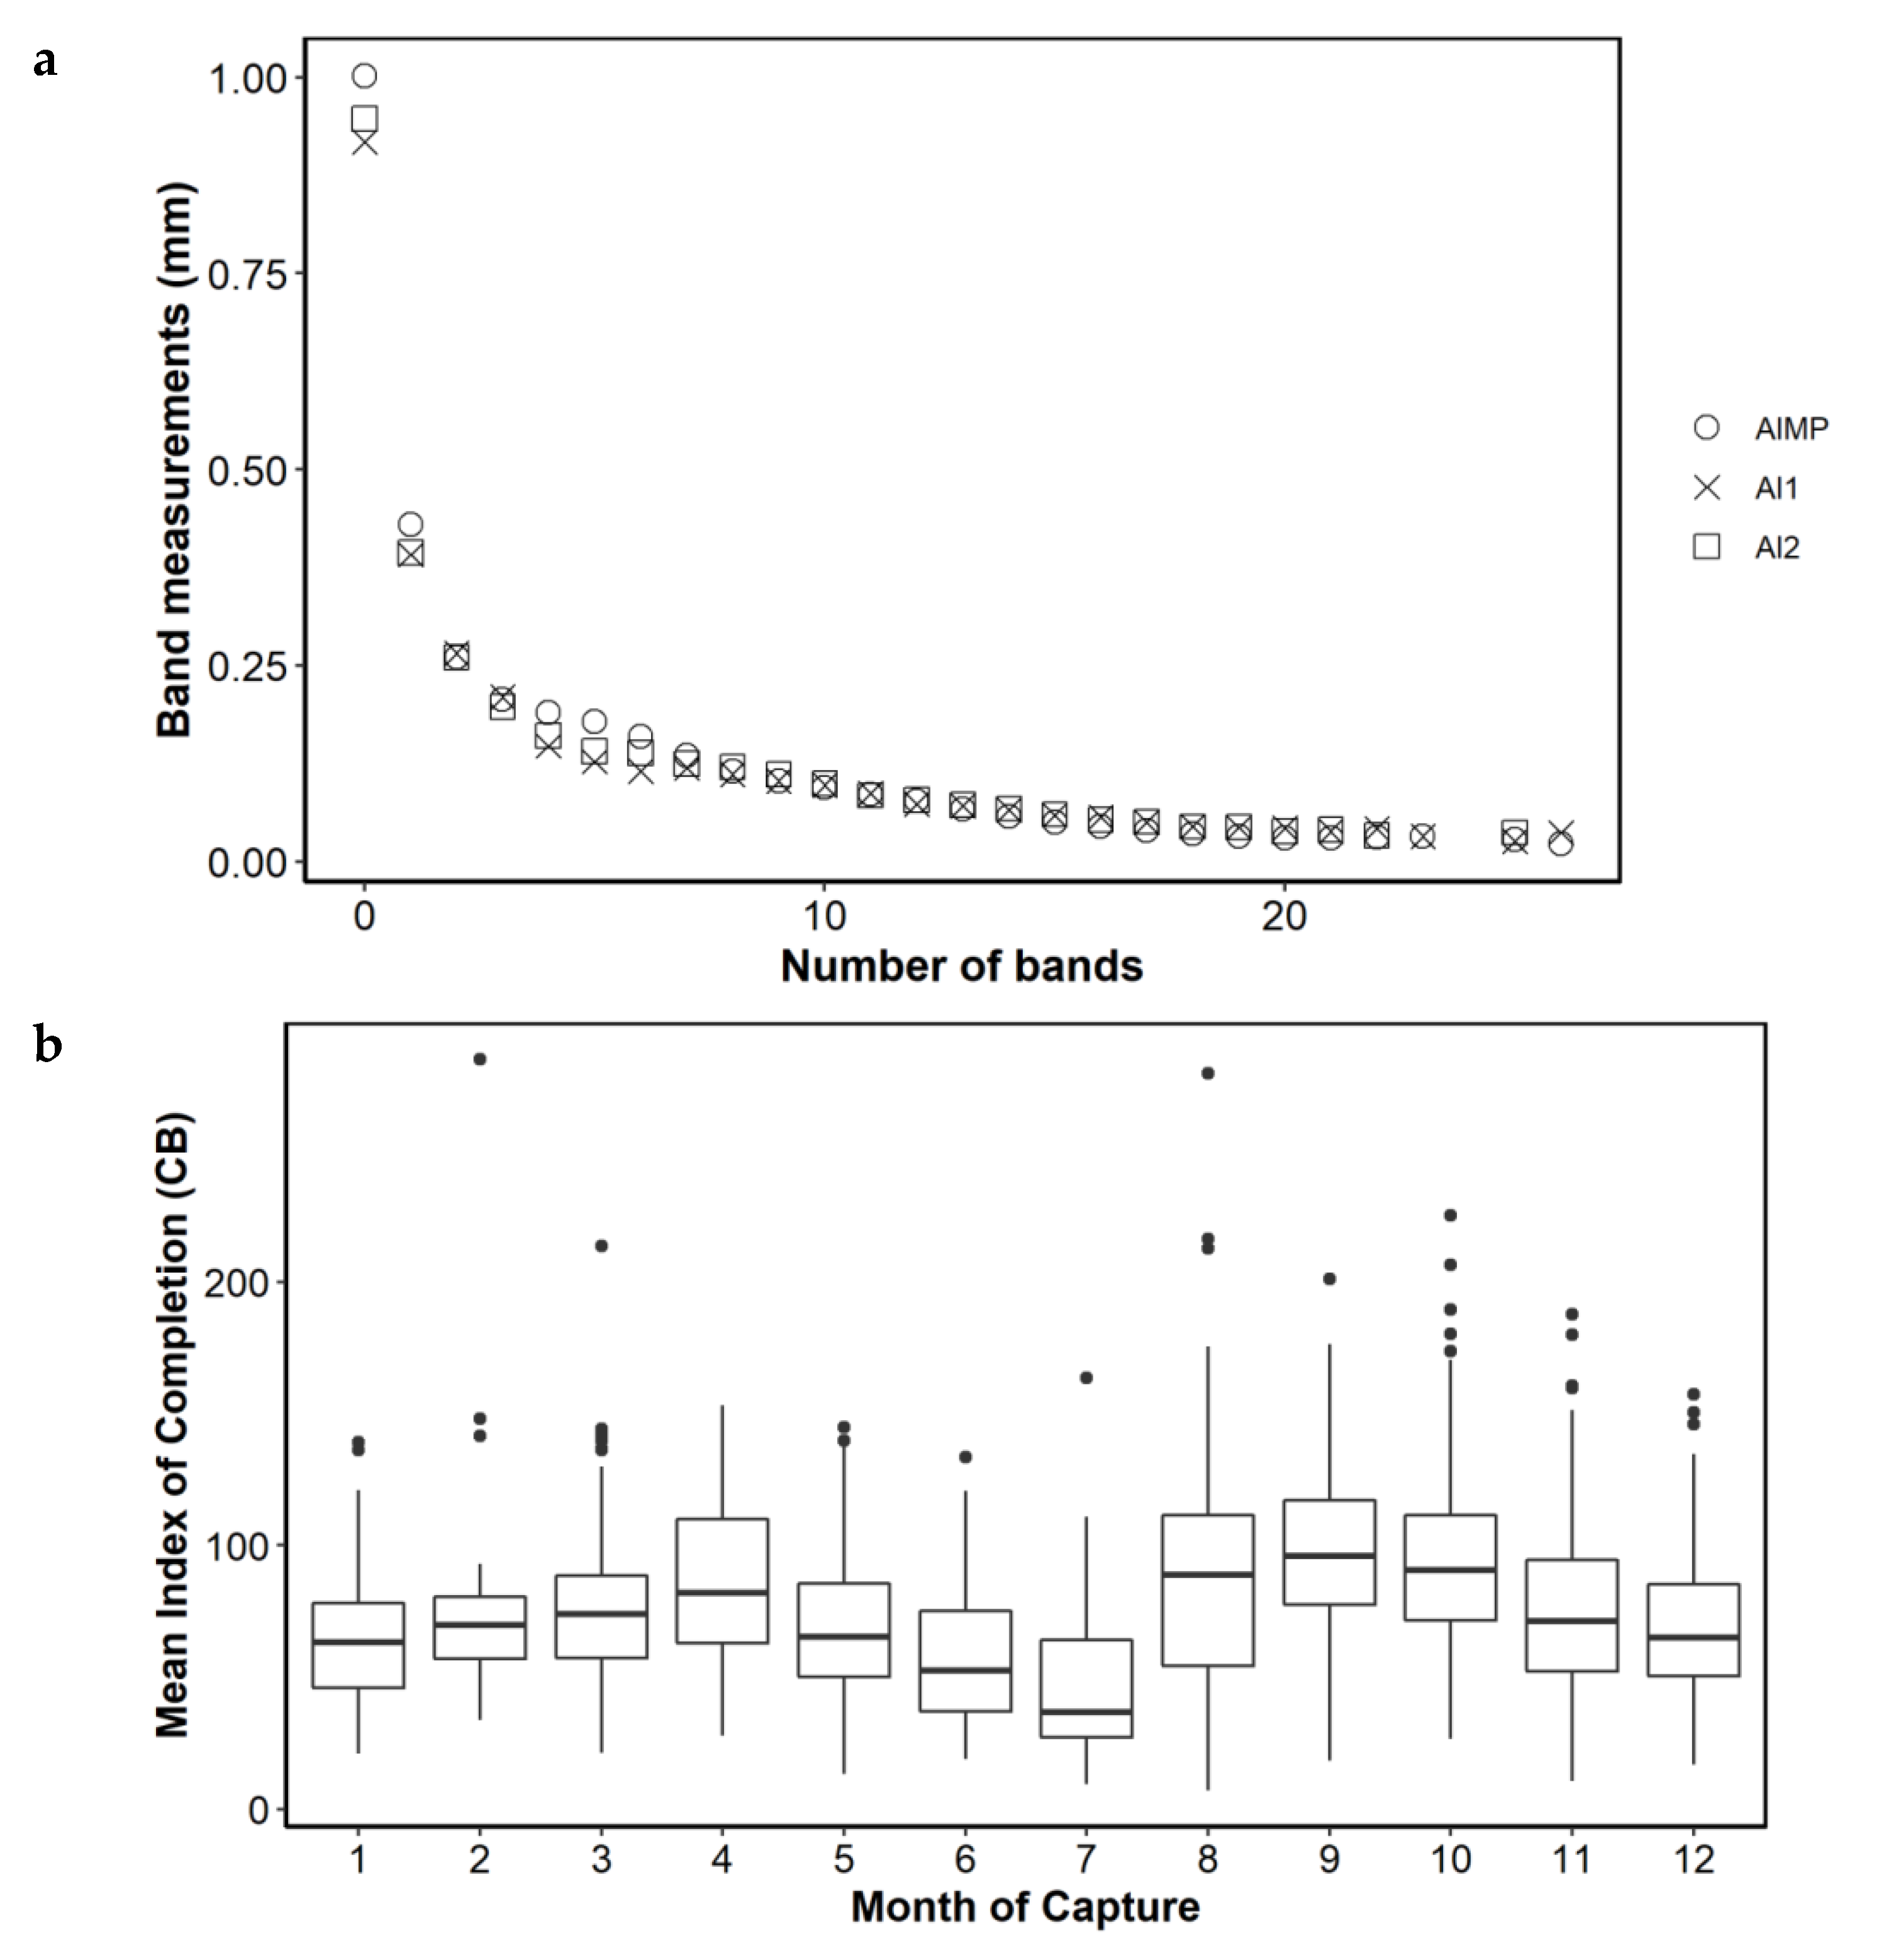
Figure 4b). Mean annual band increment measurements from the back-calculation study [
17] and the present study (AI1 = Wn-1 and AI2 = Wn-2) were the same, except in annual bands 0, 1 and 4 to 6, where there were small differences, but with a similar trend of decreasing size. The alternative completion index (CB) also showed a bimodal pattern, with greater growth in August to October compared to the rest of the year (
Figure 5).
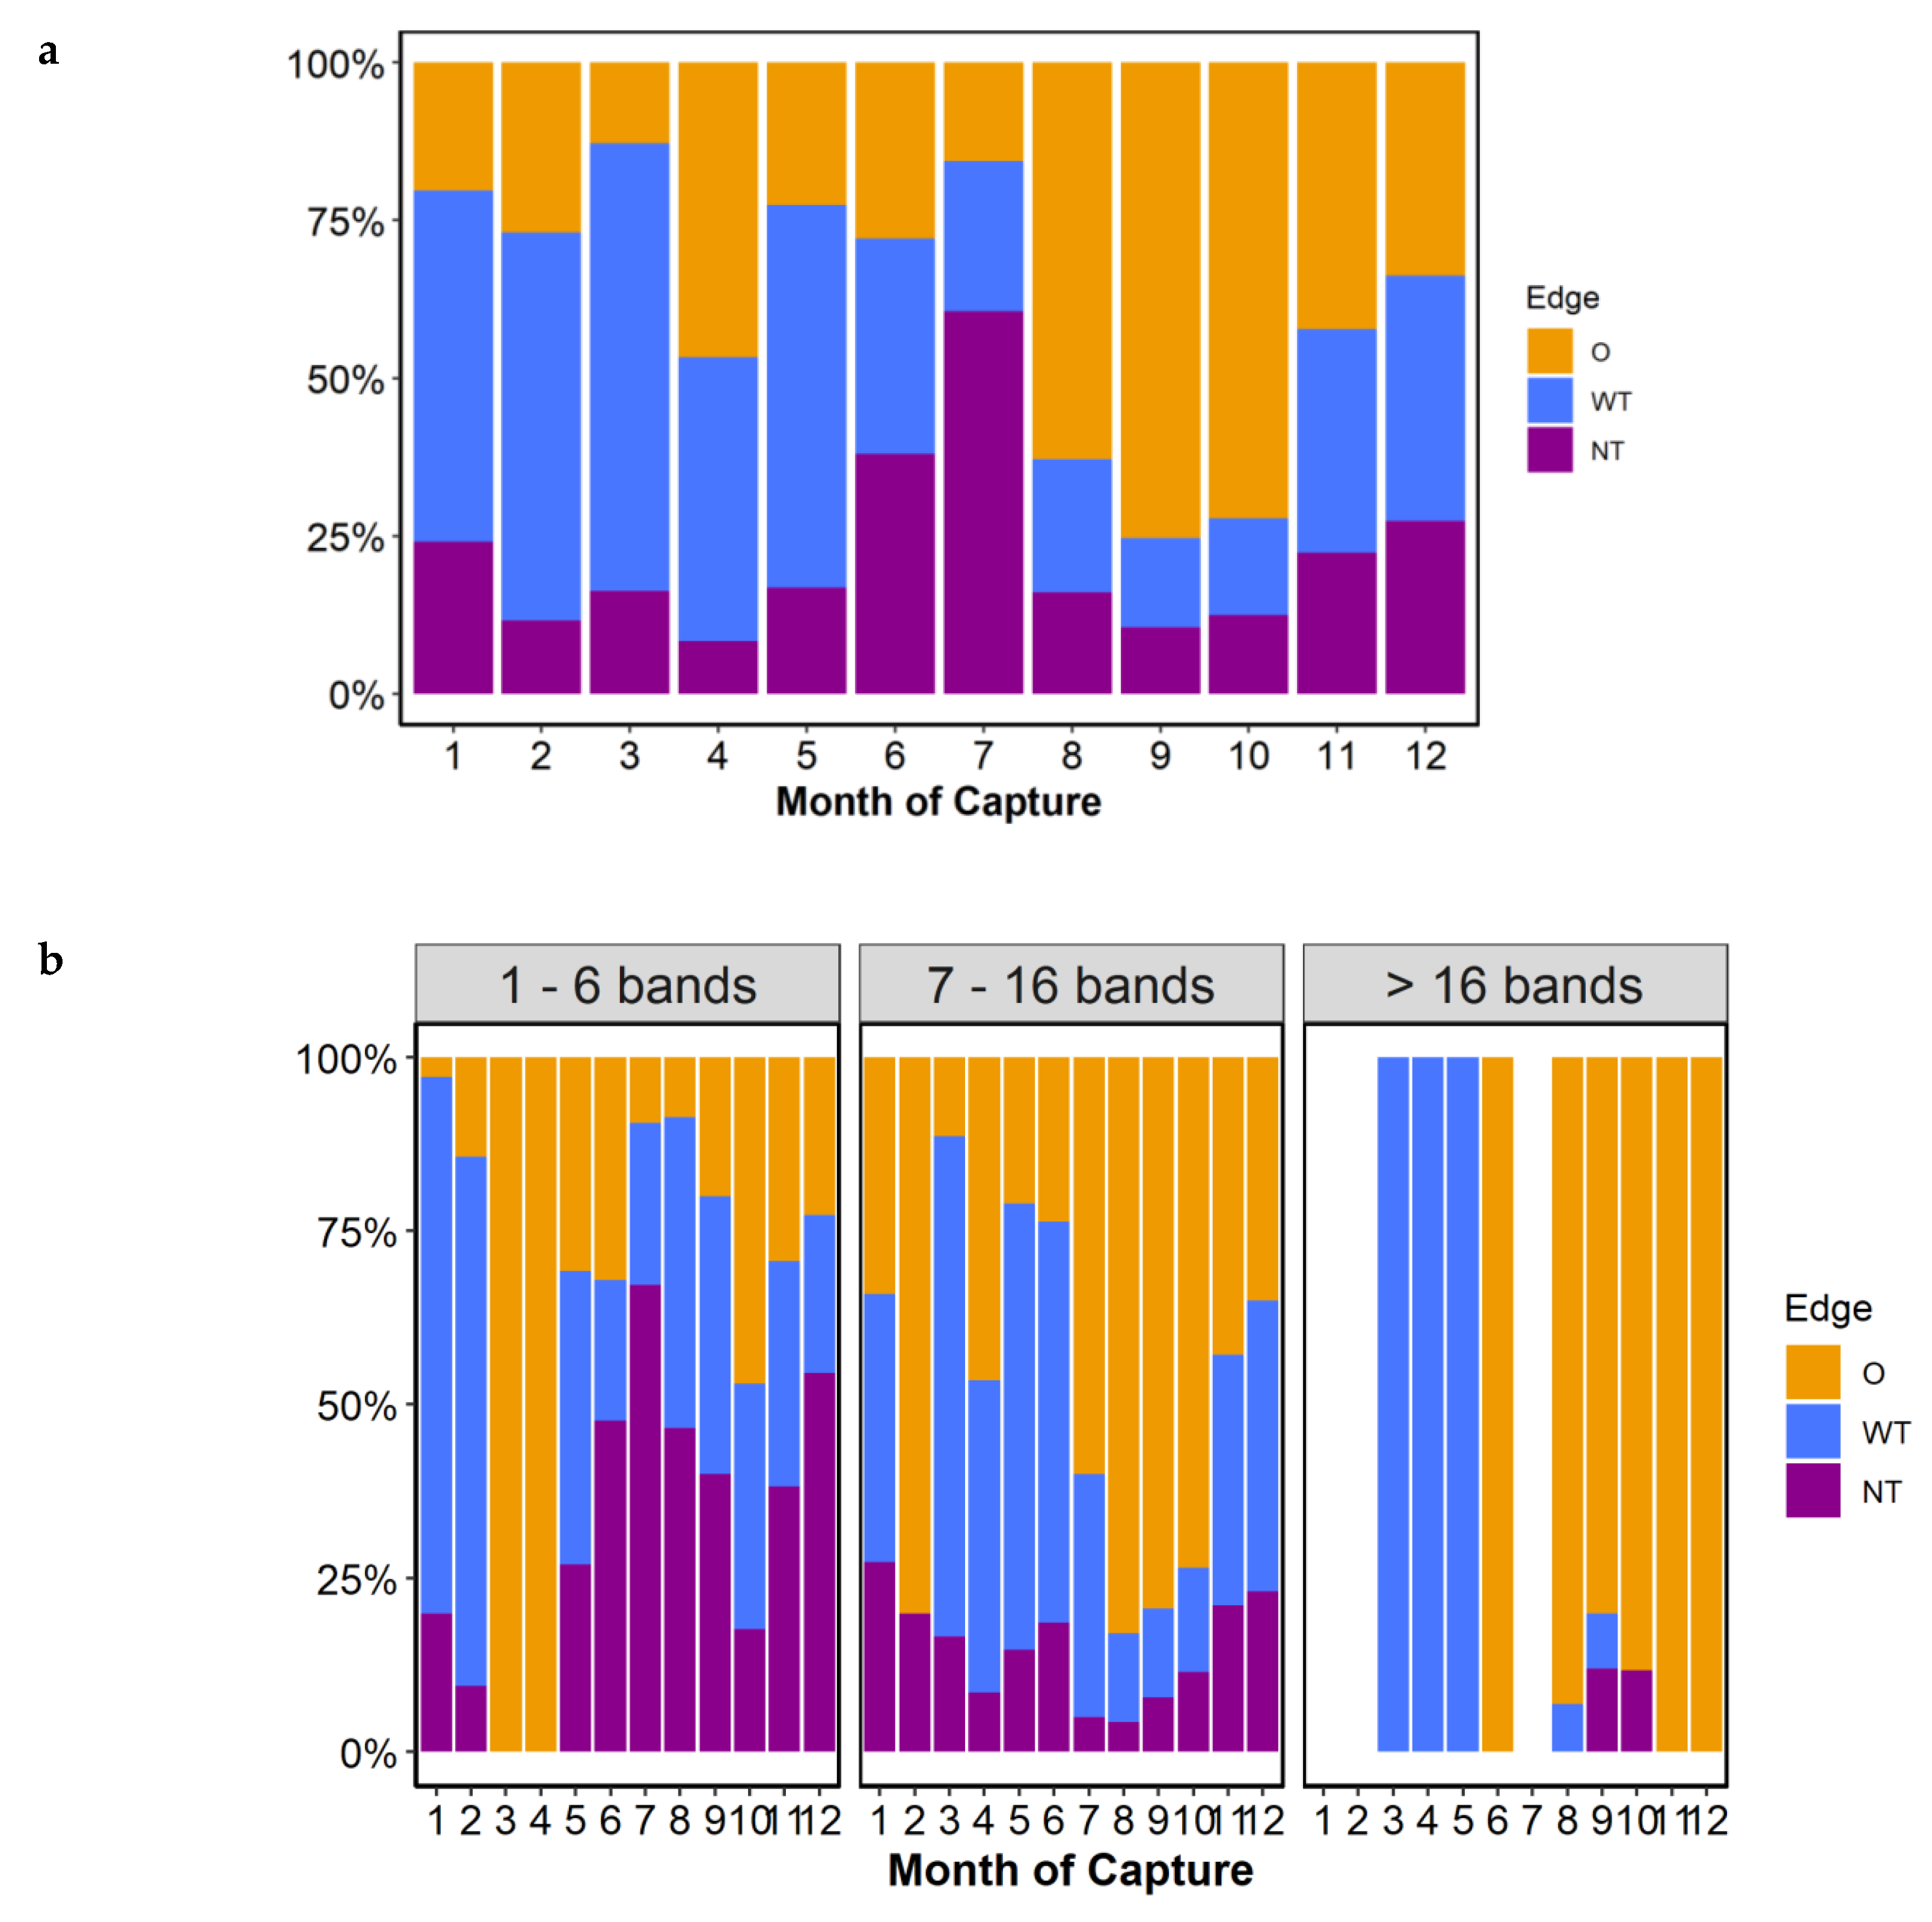
When the type of edge was analyzed, the month of greatest change in the ratio of translucent to opaque bands indicated that the formation of opaque bands occurred between July and August in the overall marginal status (
Figure 6a) and from June to July in the marginal estate of adult groups (7–16 bands,
Figure 6b). This indicated that the opaque bands began to form in June–July and continued to form up to and including October. The translucent band started to form in November with a narrow translucent margin until February, and the incidence of otoliths with a wide translucent margin from March to June in the best sampled group of adults (7–16 bands group,
Figure 6b).
Considering the group of samples as a whole, MIA and EA showed consistency in the results among readers and among quality values in the identification of marginal edge type. The type of light used for reading (reflected or transmitted) also had no influence, except in the month of August, where with transmitted light, the opaque marginal edge represented nearly 20%, while with reflected light, it represented 70%.
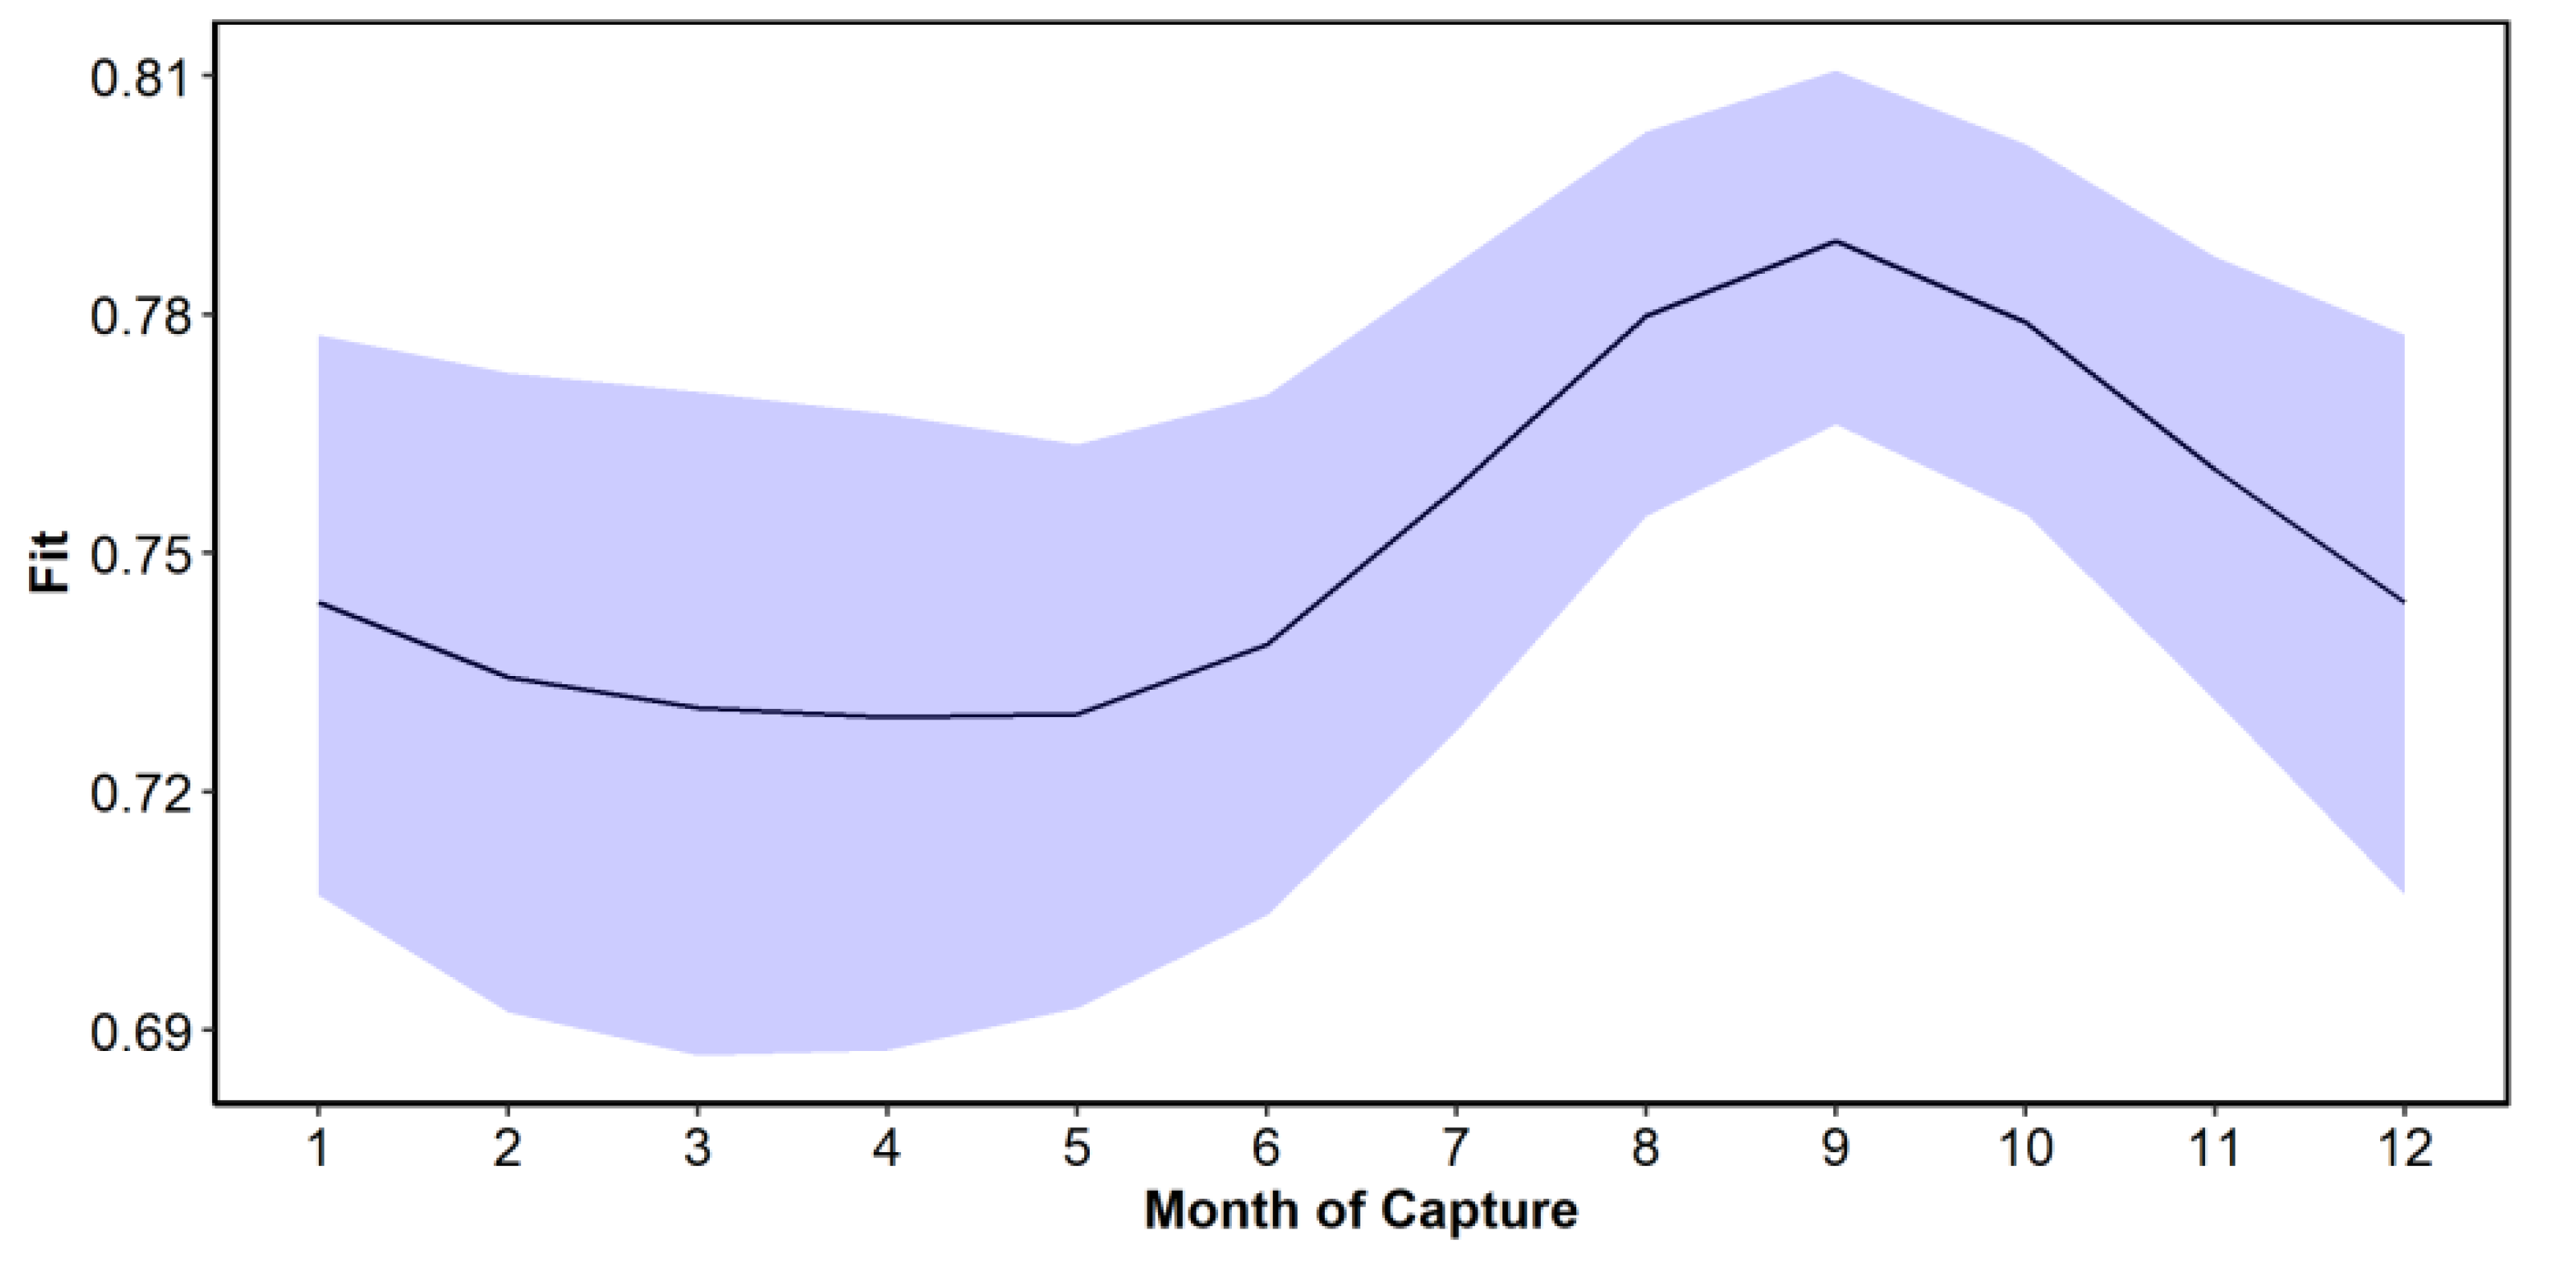
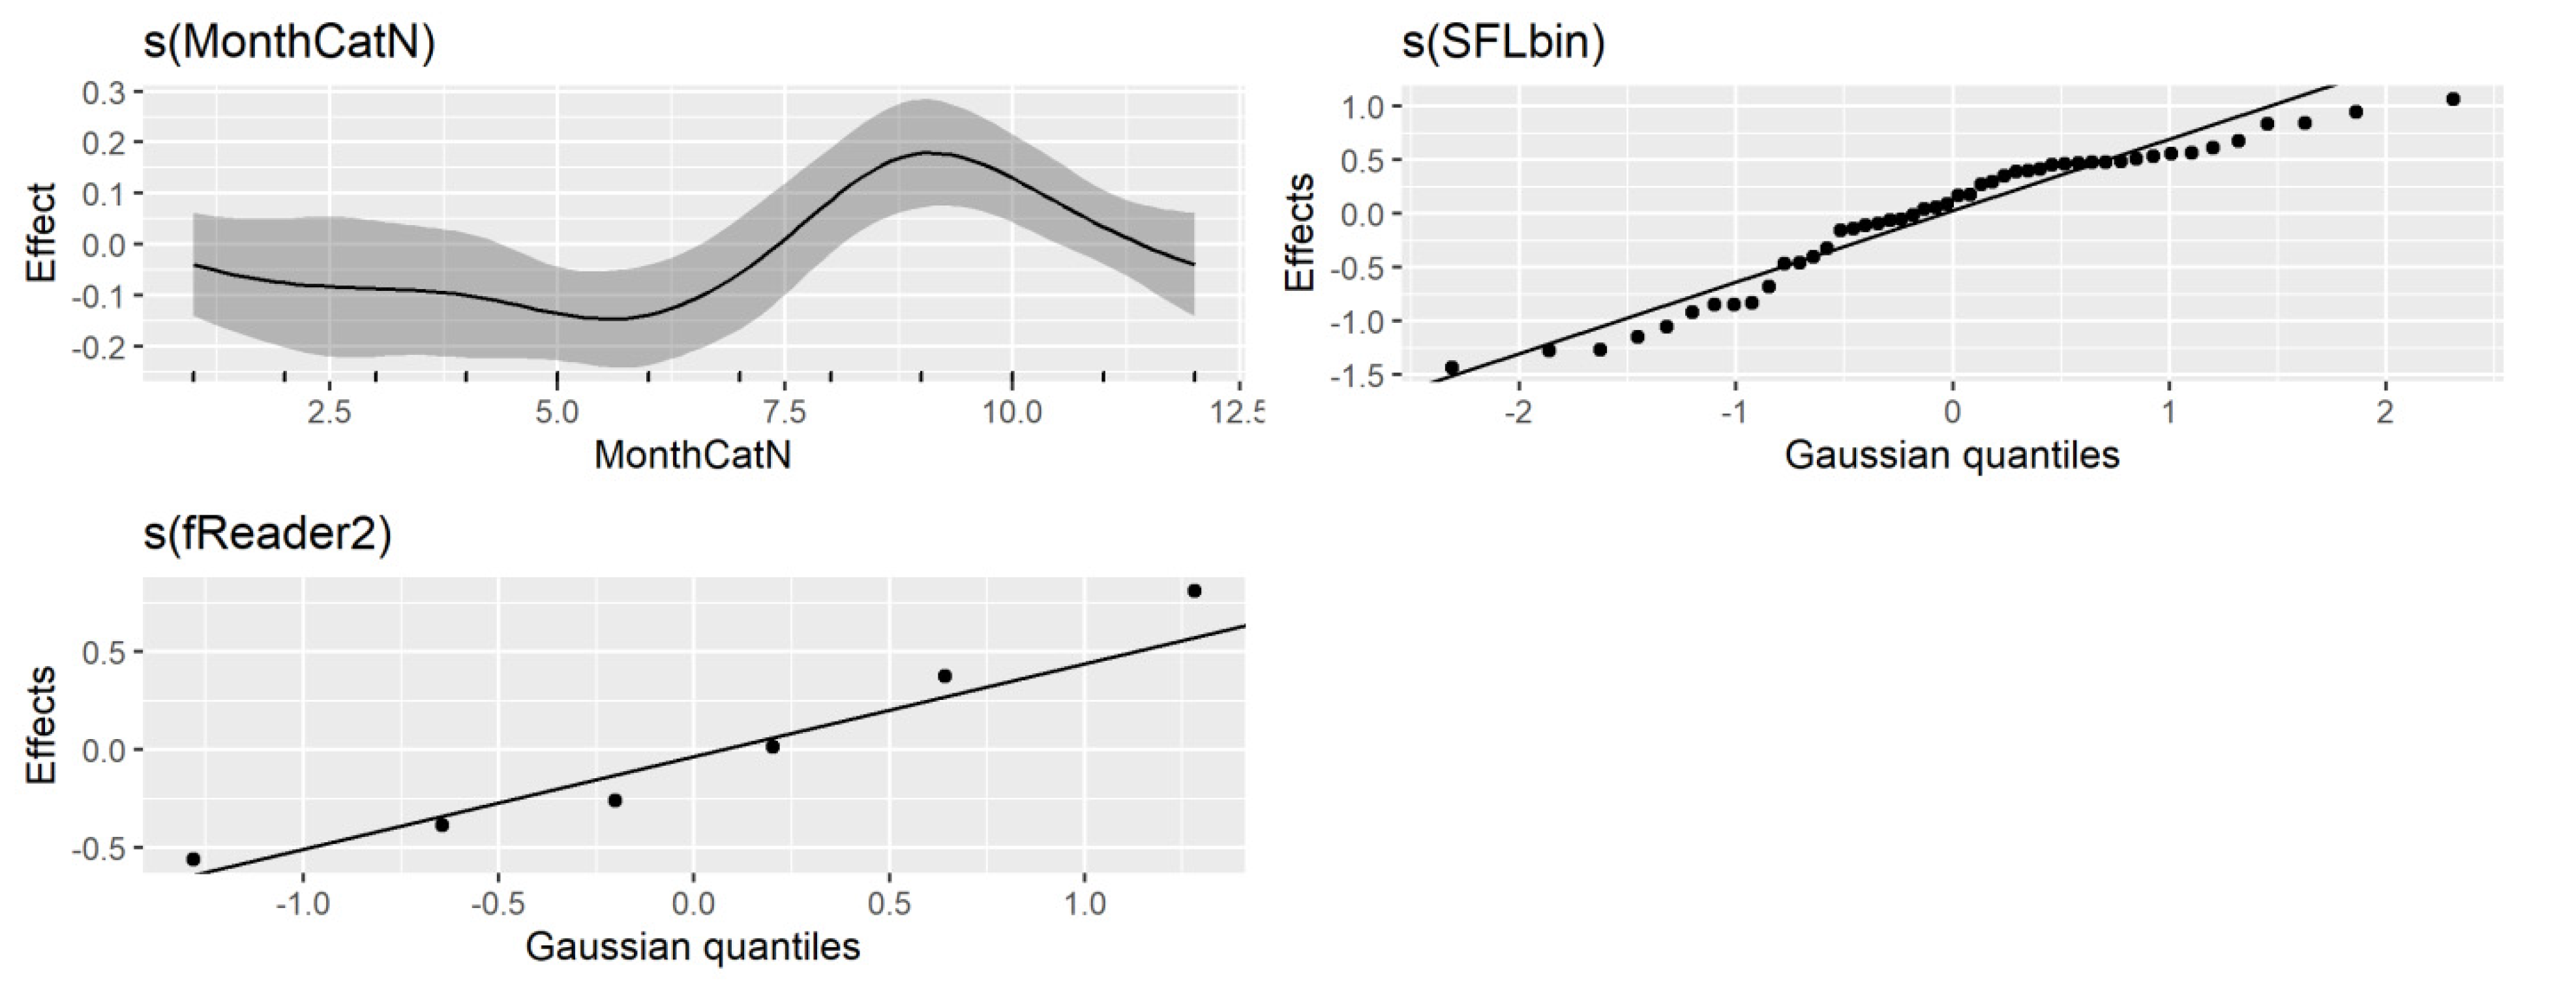
The functional relationship between month of capture and C obtained from the GAM model showed that the maximum C was obtained in the month of September, and from that month onwards, it decreased until it reached a minimum value in May (
Figure 7). The trend represents the population-level predicted values and their corresponding confidence intervals (i.e., the uncertainty related to the variance parameters for the mean random effects associated with reader and SFL are not included). Variability in C of the marginal increment was large. The variability associated with the month of capture was relatively small compared to sources such as the reader (
Table 1). Nevertheless, there is evidence for the level of completion to be highest in September. The factors of month, age, SFL, and reader accounted for a significant amount of the variability in C, with the model explaining 47.3% of the variation in the dataset, with an
R2 of 0.46. Diagnostic plots for the GAM model indicated no issues (
Figure 8 and
Figure 9).
4. Discussion
In this study, MIA, and EA were used to determine the annual periodicity in the annuli formation of ABFT otoliths. Despite the difficulty in accurately interpreting the increment structure in ABFT otoliths (where opaque bands are not easily distinguished from translucent bands), and the difficulty of sampling this species in entirety throughout the year and from all size classes, we identified when and how the growth of the otolith marginal edge occurs throughout the year.
Both MIA and EA analyses are not recommended with pooled age data because there may be different patterns of growth band formation at different life stages (e.g., at sexual maturity) [
9,
18]. However, grouping the data by age groups, such as young and old fish, can reduce this age effect and improve the reliability of the results [
18,
19]. In this study, the change in slope in C by number of bands identified three main groups: juveniles (1 to 6 bands), adults (7 to16 bands) and old adults (>16 bands). Despite each of these age groups being unbalanced in terms of samples available for all months, MIA results show similar trends, whereas EA results between age groups did not. While the differences between groups could be largely attributed to the difficulty in identifying the type of marginal edge and further complicated by the low number of specimens sampled, we cannot rule out the effect due to changes in the seasonal timing of the marginal increment with age or capture location.
The band formation process is related to age and associated with energy destined towards somatic growth in relation to biological processes, such as spawning and food availability [
20,
21,
22]. A graph of MIA thus follows a sawtooth shape, where growth rates are sensitive to environmental conditions and individual ontogeny [
9,
23]. The expected pattern in an annual MIA cycle is that it presents a single maximum, however, we found two periods of maximum growth in C, although the peak in March and April is lower than the one in September and is based on an inadequate number of samples. This first peak of the year could be related to the development of the wide translucent margin beginning in March. It is necessary to rely on modeling using GAM in order to clearly identify the period of greatest growth in C. A modeling approach is necessary to identify the temporal annual periodicity of growth increments, as it is not always so obvious and is influenced by differences between years and geographic areas [
24,
25,
26].
The concordance between the MIA and EA results in the adults group (7–16 bands), which was the best sampled group, the similarity between the results of the band measurements and C and CB [
17], and the fit of the GAM analysis provide us with a marginal growth pattern with a yearly sinusoidal cycle. We can confirm that this marginal edge deposition is annual and consists of an opaque and a translucent zone because the annulus formation was previously validated through the bomb radiocarbon method [
4], and the annual periodicity of its formation was confirmed thanks to Sr:Ca oscillations [
5]. The greatest growth of the marginal edge occurs from June onwards and peaks in September. From this month forward, it starts to decrease and slows down from November to May.
Since the completion index is based on the measurement between the end of consecutive opaque bands, the minimum value of C from MIA and GAM models after the maximum values in the period from August to October indicate that the opaque band is being completed during November. This is also supported by EA, which indicates that the deposition of the opaque band finishes forming in November. From the end of the year to the first months of the following year, there is minimal marginal edge growth, and this is when the translucent band begins to form and reaches its maximum development in May, with the highest proportion of wide translucent zones from March to June (particularly evident from adults group interpretation in
Figure 6b).
Individual ages are estimated using the count of opaque bands, otolith edge classification, catch date, assumed spawning month or birth date, and timing of opaque band formation. The last opaque band is only counted when translucent material can be observed between the last opaque and the margin, i.e., a narrow or wide translucent edge [
11]. Therefore, the time of year when the otolith edges are changing from opaque into narrow translucent needs to be the period for the initial edge type zone adjustment. Using a date of November 30th as a date of opaque completion, a two-step age adjustment protocol is proposed: firstly, a zone formation adjustment. If this initial step is not completed, it is possible that individuals with the same birth year, even when captured on the same date, could be assigned to different age classes due to either reader differences in interpreting edge type or individual variability in when fish are completing their opaque band formation on their otoliths (
Table 2a). Secondly, a biological age adjustment using June 1st as the birth date, assumed for both ABFT management units based on the ABFT reproductive cycle, where spawning occurs from May to June in the western Atlantic (Gulf of Mexico) and eastern Mediterranean (Levantine Sea), or from June to July in the western and central Mediterranean (Balearic Islands waters, South of Tyrrhenian Sea and Sea of Sicily) [
1] (
Table 2b); and a second option, instead of adjusting for biological age, is to perform a calendar year adjustment to properly identify each year class (
Table 2c). To convert opaque band counts (N) into age estimates following the ageing protocol of Busawon et al. [
15], which states that opaque bands are counted even if not complete, the following steps need to be used. (1) Subtract 1 from the zone count for each sample assigned with an opaque (O) edge type, (2) leave unchanged the number of bands of the samples with a translucent (T) edge type, and (3) covert zone count into age using June 1st for the biological age adjustment (2b) or January 1st for the calendar year adjustment (2c).
To ensure that the age adjustment tables were providing correct age assignment, i.e., incrementing the age by a count of one each year while still ensuring that individuals hatched in the same year remained in the correct age cohort, a conceptual age adjustment table for a fictional individual ABFT was created for comparison. This table shows (1) the progression of monthly and yearly (decimal) age and (2) the band count or age for each combination of band counts and edge types for a given month of life of an individual hatched in June 2020 and caught 3.6 years later (see
Supplementary Table S1).
The proposed new adjustment criterion involves delaying the date of the current adjustment criterion from 1 July [
11] to November 30. The 1 July criterion was based on a preliminary study with a smaller number of samples, especially in the first 4 months of the year, than those used in the present study, and used a different band measurement methodology. This study also showed an increase in the completion rate in the last months of the year, although this increase is delayed by two months with respect to the present study. To evaluate the influence of applying the existing age adjustment criterion [
11] and the new one proposed in this study, we used the current ICCAT length at age database to see how the cohorts were reflected using the otolith readings available in that database [
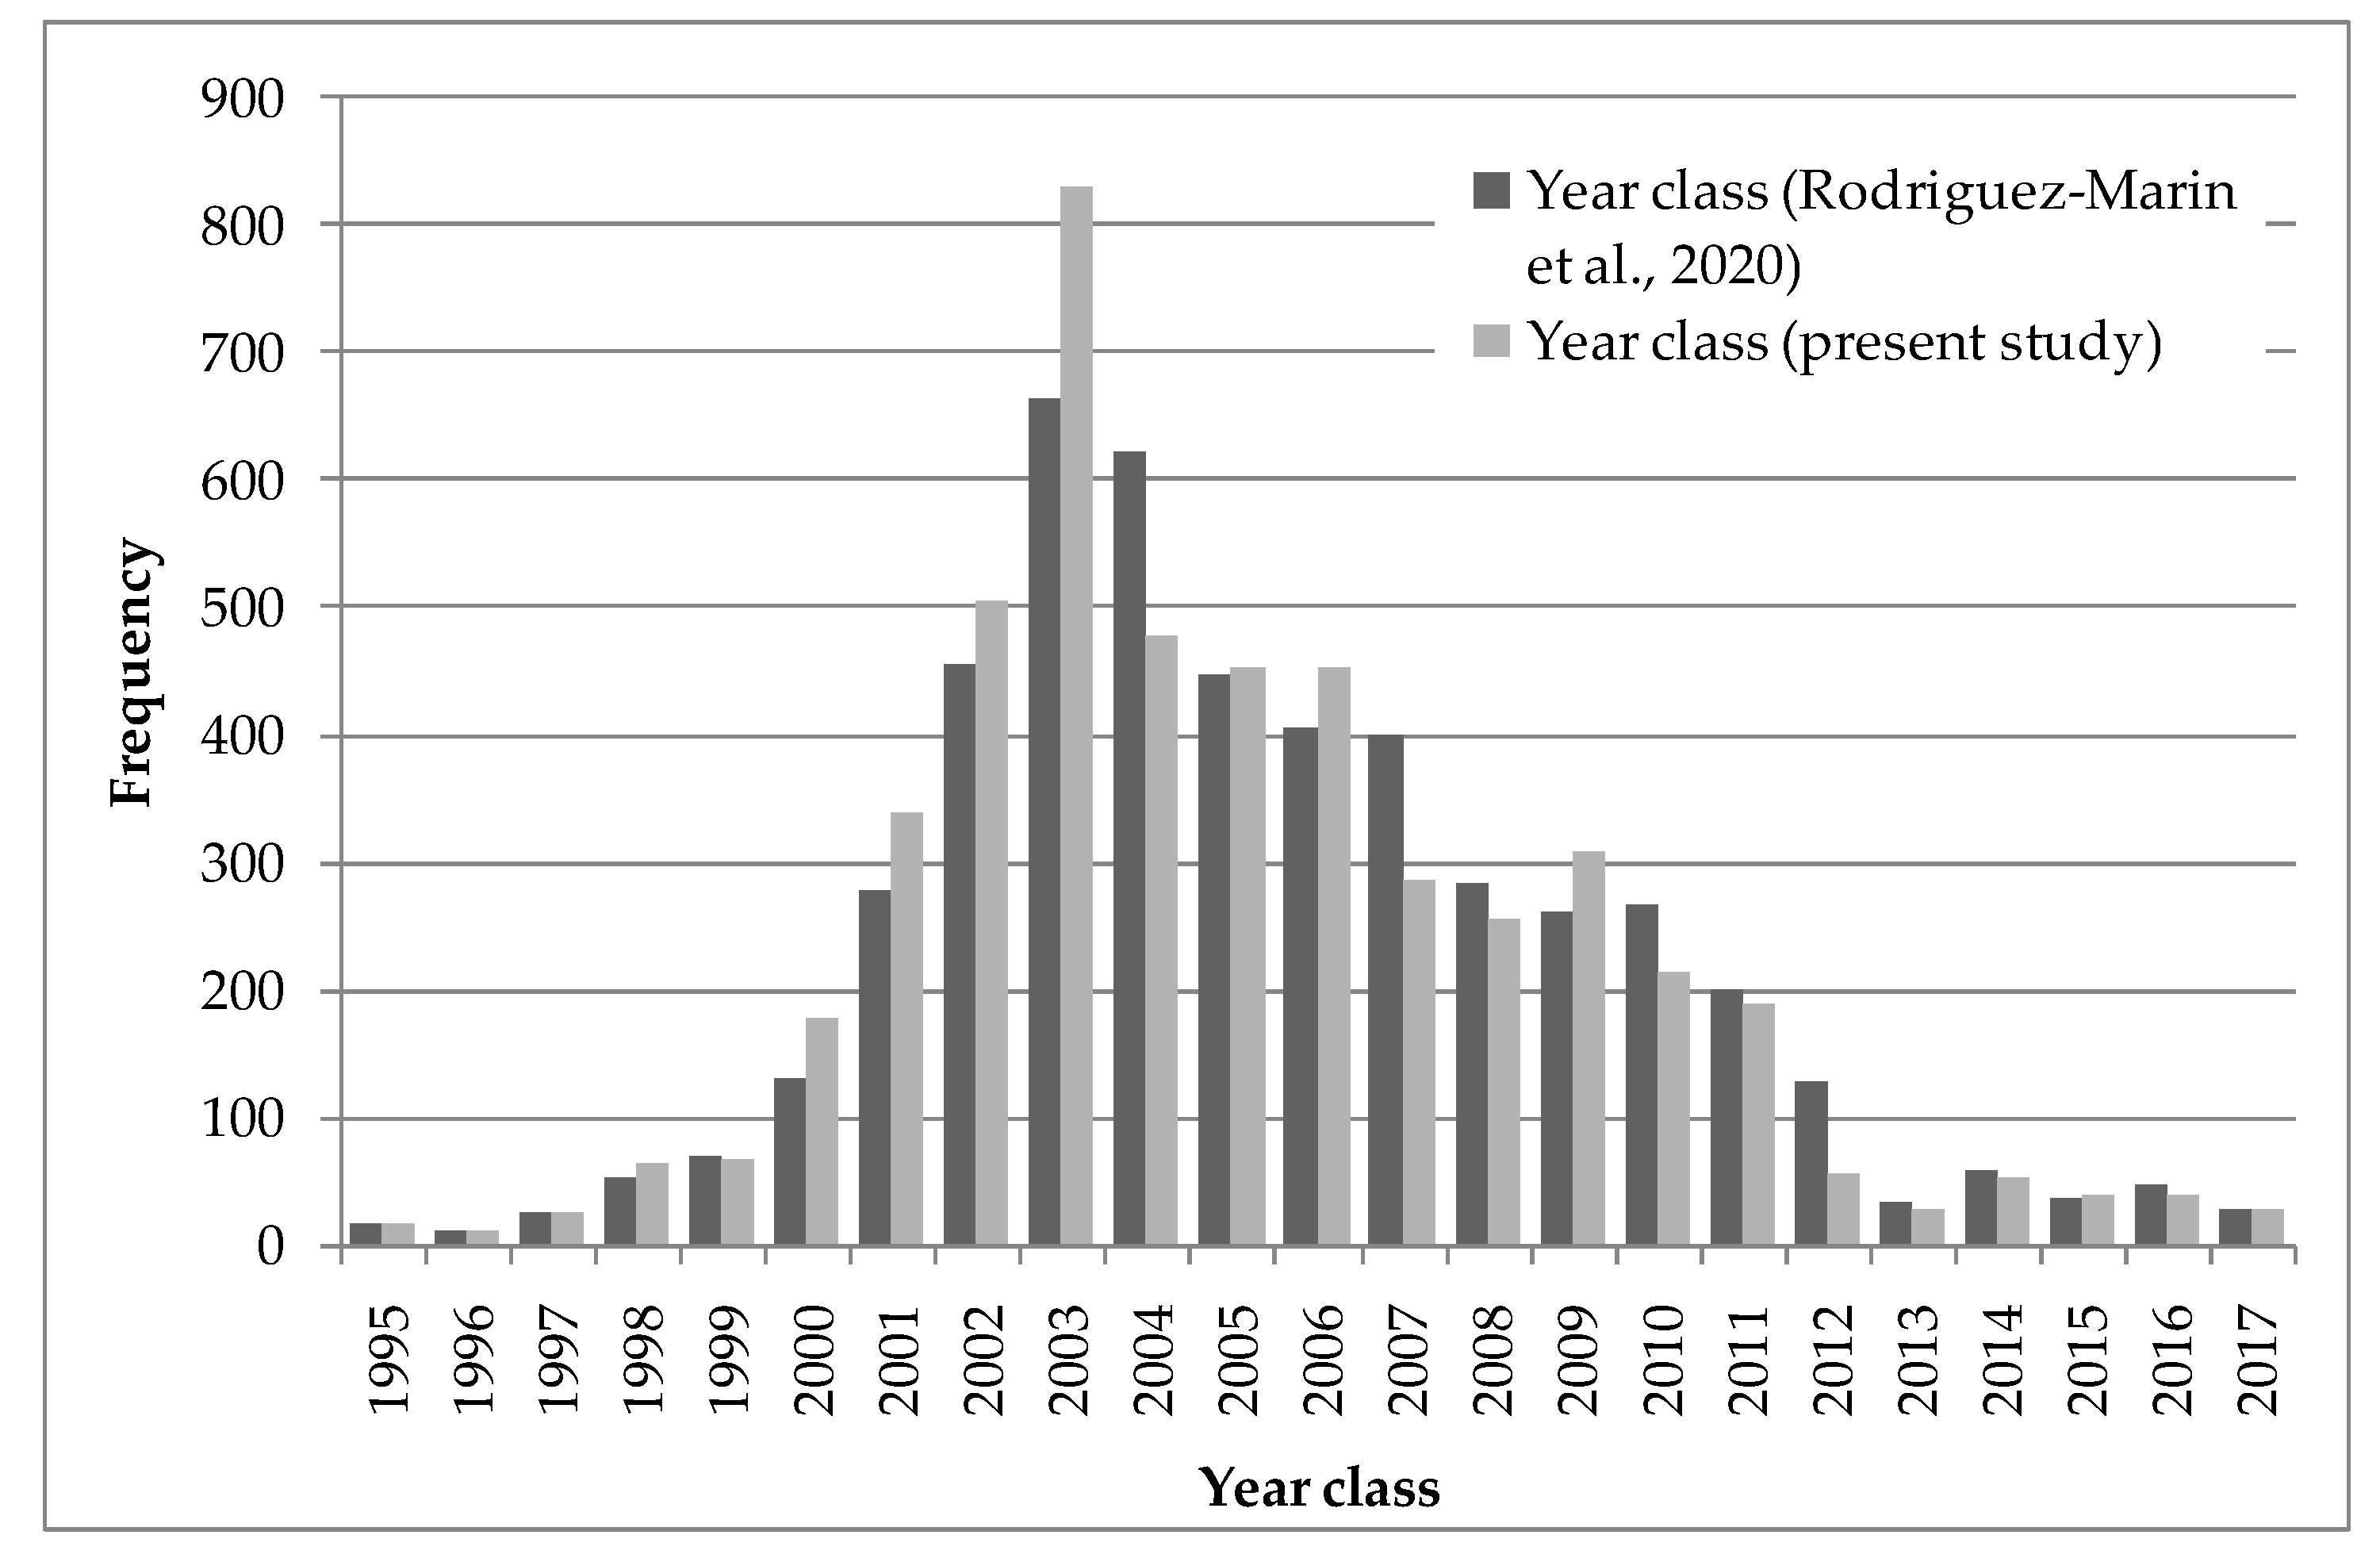
27], and in particular to see how it influenced the location of the strong 2003 year class [
28,
29]. The change in the date of the otolith fitting criterion allows for a better outline of the strong 2003 year class, despite the fact that the otolith samples in this database do not proportionally cover all fisheries in every year (
Figure 10).
The occurrence of translucent bands in ABFT otoliths were described in studies over 40 years ago, describing their appearance from October to December to May of the following year [
30,
31,
32]. The findings of the present study, in relation to the formation of the otolith edge type, would be in agreement with these studies and also with the seasonal deposition patterns found in ABFT fin spines [
8]. It would also agree with the results of the higher Sr:Ca ratio concentration found in the translucent bands of the same species and in southern bluefin tuna, Luque et al. [
7] and Clear et al. [
6], respectively. In contrast, Siskey et al. [
5] found higher Sr:Ca in the opaque bands in western ABFT adults over 10 years of age, which would imply that the bands formed during the winter months, due to the inverse relationship between Sr uptake and temperature. A possible explanation for this discrepancy, between the present study and that of Siskey et al. [
5], is that this difference in the "presumed" timing of the opaque band deposition could be due to the migrations of western ABFT. These individuals migrate from the spawning grounds in the Gulf of Mexico in spring (warm waters) to the Mid-Atlantic Bight and Canadian shelf areas in summer (cold waters); the type of signal given by Sr:Ca could be influenced by this temperature change, where it is precisely the colder waters that the western ABFT occupy in summer [
33,
34].
Stock assessments used to provide management advice for ABFT rely on age-structured population analysis. The method applied for transforming length-structured data to age structured data is age slicing using a deterministic growth model [
35]. This method divides size distributions into age classes under the assumption that there are distinct lengths separating adjacent age classes. Given the variability in growth between individuals, which increases as fish grow, this technique can assign an incorrect age when one or more age classes overlap in length. Growth variability over time and strong cohort signals can also be affected by this deterministic method [
36]. An alternative approach to estimating age composition, including variability in growth, is the use of age–length keys (ALKs). It is precisely in the construction of these ALKs that our study is essential to convert band counts in calcified structures, such as otoliths, into age estimates. The age adjustment we propose is suitable for both ABFT management units or stocks, the western stock, and the eastern stock and Mediterranean Sea; in fact, we used samples from both management units. Being able to apply the same adjustment, including the biological adjustment (in relation to the date of birth), explained above, facilitates its application. Moreover, rather than differences in growth between the two management units, it is the type of fitting made to the length at age data (e.g., Richards’ or von Bertalanffy’s growth models) and the size range covered in the sampling that has the greatest influence [
3,
37]. Furthermore, it was shown that there is no difference in the growth of both management units [
17].
5. Conclusions
We used MIA and EA to determine when the opaque and translucent band of each growth annuli forms at the marginal edge of the ABFT otolith throughout the year. We used GAM to clearly identify marginal edge growth. This modeling was necessary to interpret the results, due to the difficulty of identifying translucent and opaque bands and the difficulty of sampling this species in its entirety throughout the year and from all size classes. The use of GAM also allowed the evaluation of some of the variables affecting edge growth, such as month, age/size, and reader.
Opaque bands are present at the marginal edge of the otolith from June 1st to November 30th, with a maximum in September (opaque bands in January–May are late forming or late identified from the previous year). Translucent bands are present on the otolith from December 1st to May 31st, going from narrow to wide in March and reaching the maximum growth of the translucent band in May. Each type of band, opaque or translucent, having a six-month time period. The results obtained in this study provide evidence that the annulus formation in the otoliths of Atlantic bluefin tuna are completed later in the calendar year than previously thought. This would mean that it is necessary to delay the date of the current July 1st adjustment criterion to November 30.
The discrepancies found among the references for this species and the results of the present study regarding the season in which the translucent and opaque bands form may be due to migrations of western adult specimens from the warmer waters of the Gulf of Mexico during the spring spawning season to the cooler waters of the Mid-Atlantic Bight and Canadian shelf areas in summer to feed. The type of signal given by the Sr:Ca concentration in the opaque bands, the source of the discrepancy, could be influenced by this temperature shift.
Our study is essential for converting band counts in calcified structures, such as otoliths, into age estimates. This allows using an alternative approach to estimate catch at age composition that includes growth variability. This variability is not currently accounted for in age-structured population analyses used to provide management advice in ABFT stock assessments, which use deterministic growth models.


 ,
, 


