
Dietary Protein Modifies Hepatic Glycolipid Metabolism, Intestinal Immune Response, and Resistance to Streptococcus agalactiae of Genetically Improved Farmed Tilapia (GIFT: Oreochromis niloticus) Exposed to High Temperature


Abstract
:1. Introduction
2. Materials and Methods
2.1. Experimental Diets
2.2. Experimental Fish and Feeding Management
2.3. Sampling Procedure
2.4. Plasma Biochemical Analysis
2.5. Analysis of Intestinal Antioxidant Indices
2.6. Total RNA Extraction and Real-Time RT–PCR Analysis
2.7. Streptococcus agalactiae Challenge Test
2.8. Data Analysis
3. Results
3.1. Plasma Biochemical Composition
3.2. Intestinal Enzyme and Antioxidant Status
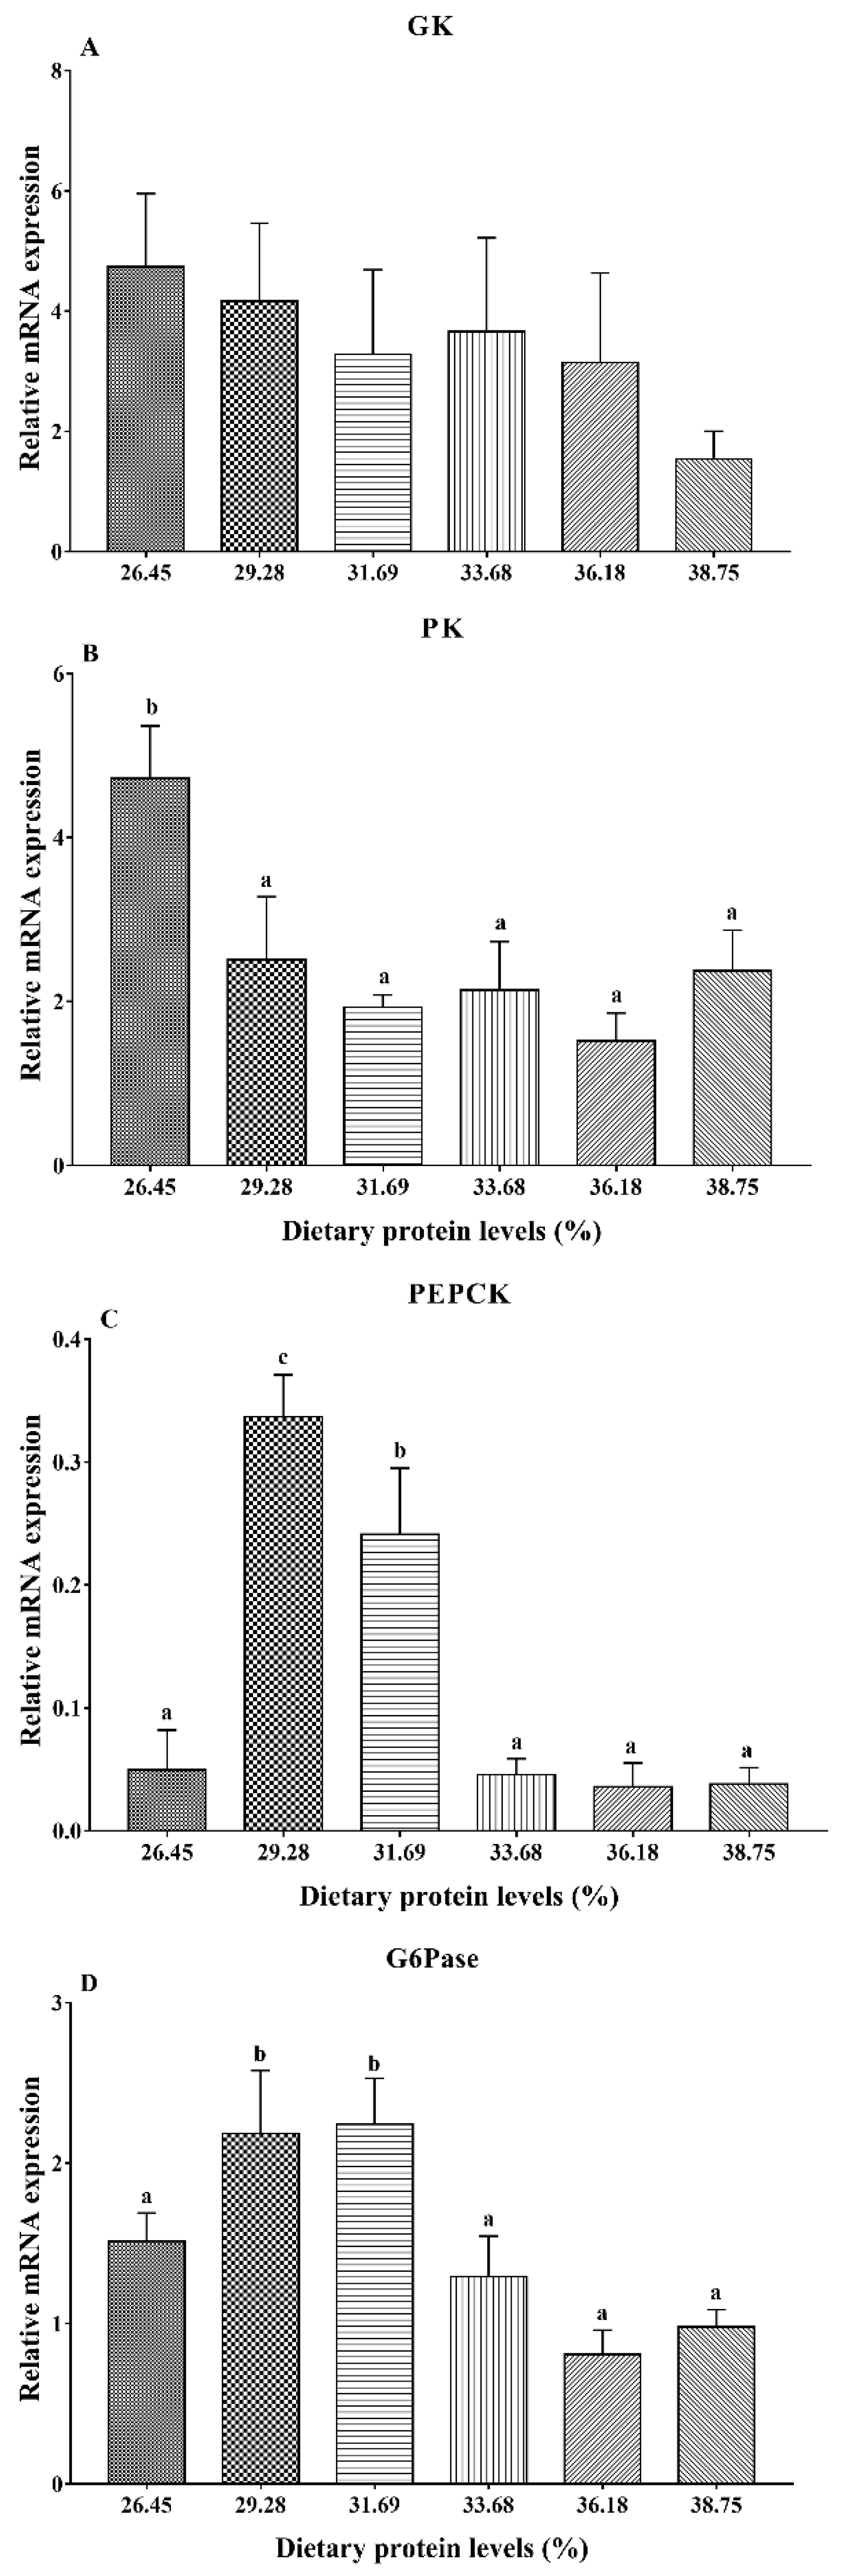
3.3. Gene Expression Analysis of Glucose Metabolism
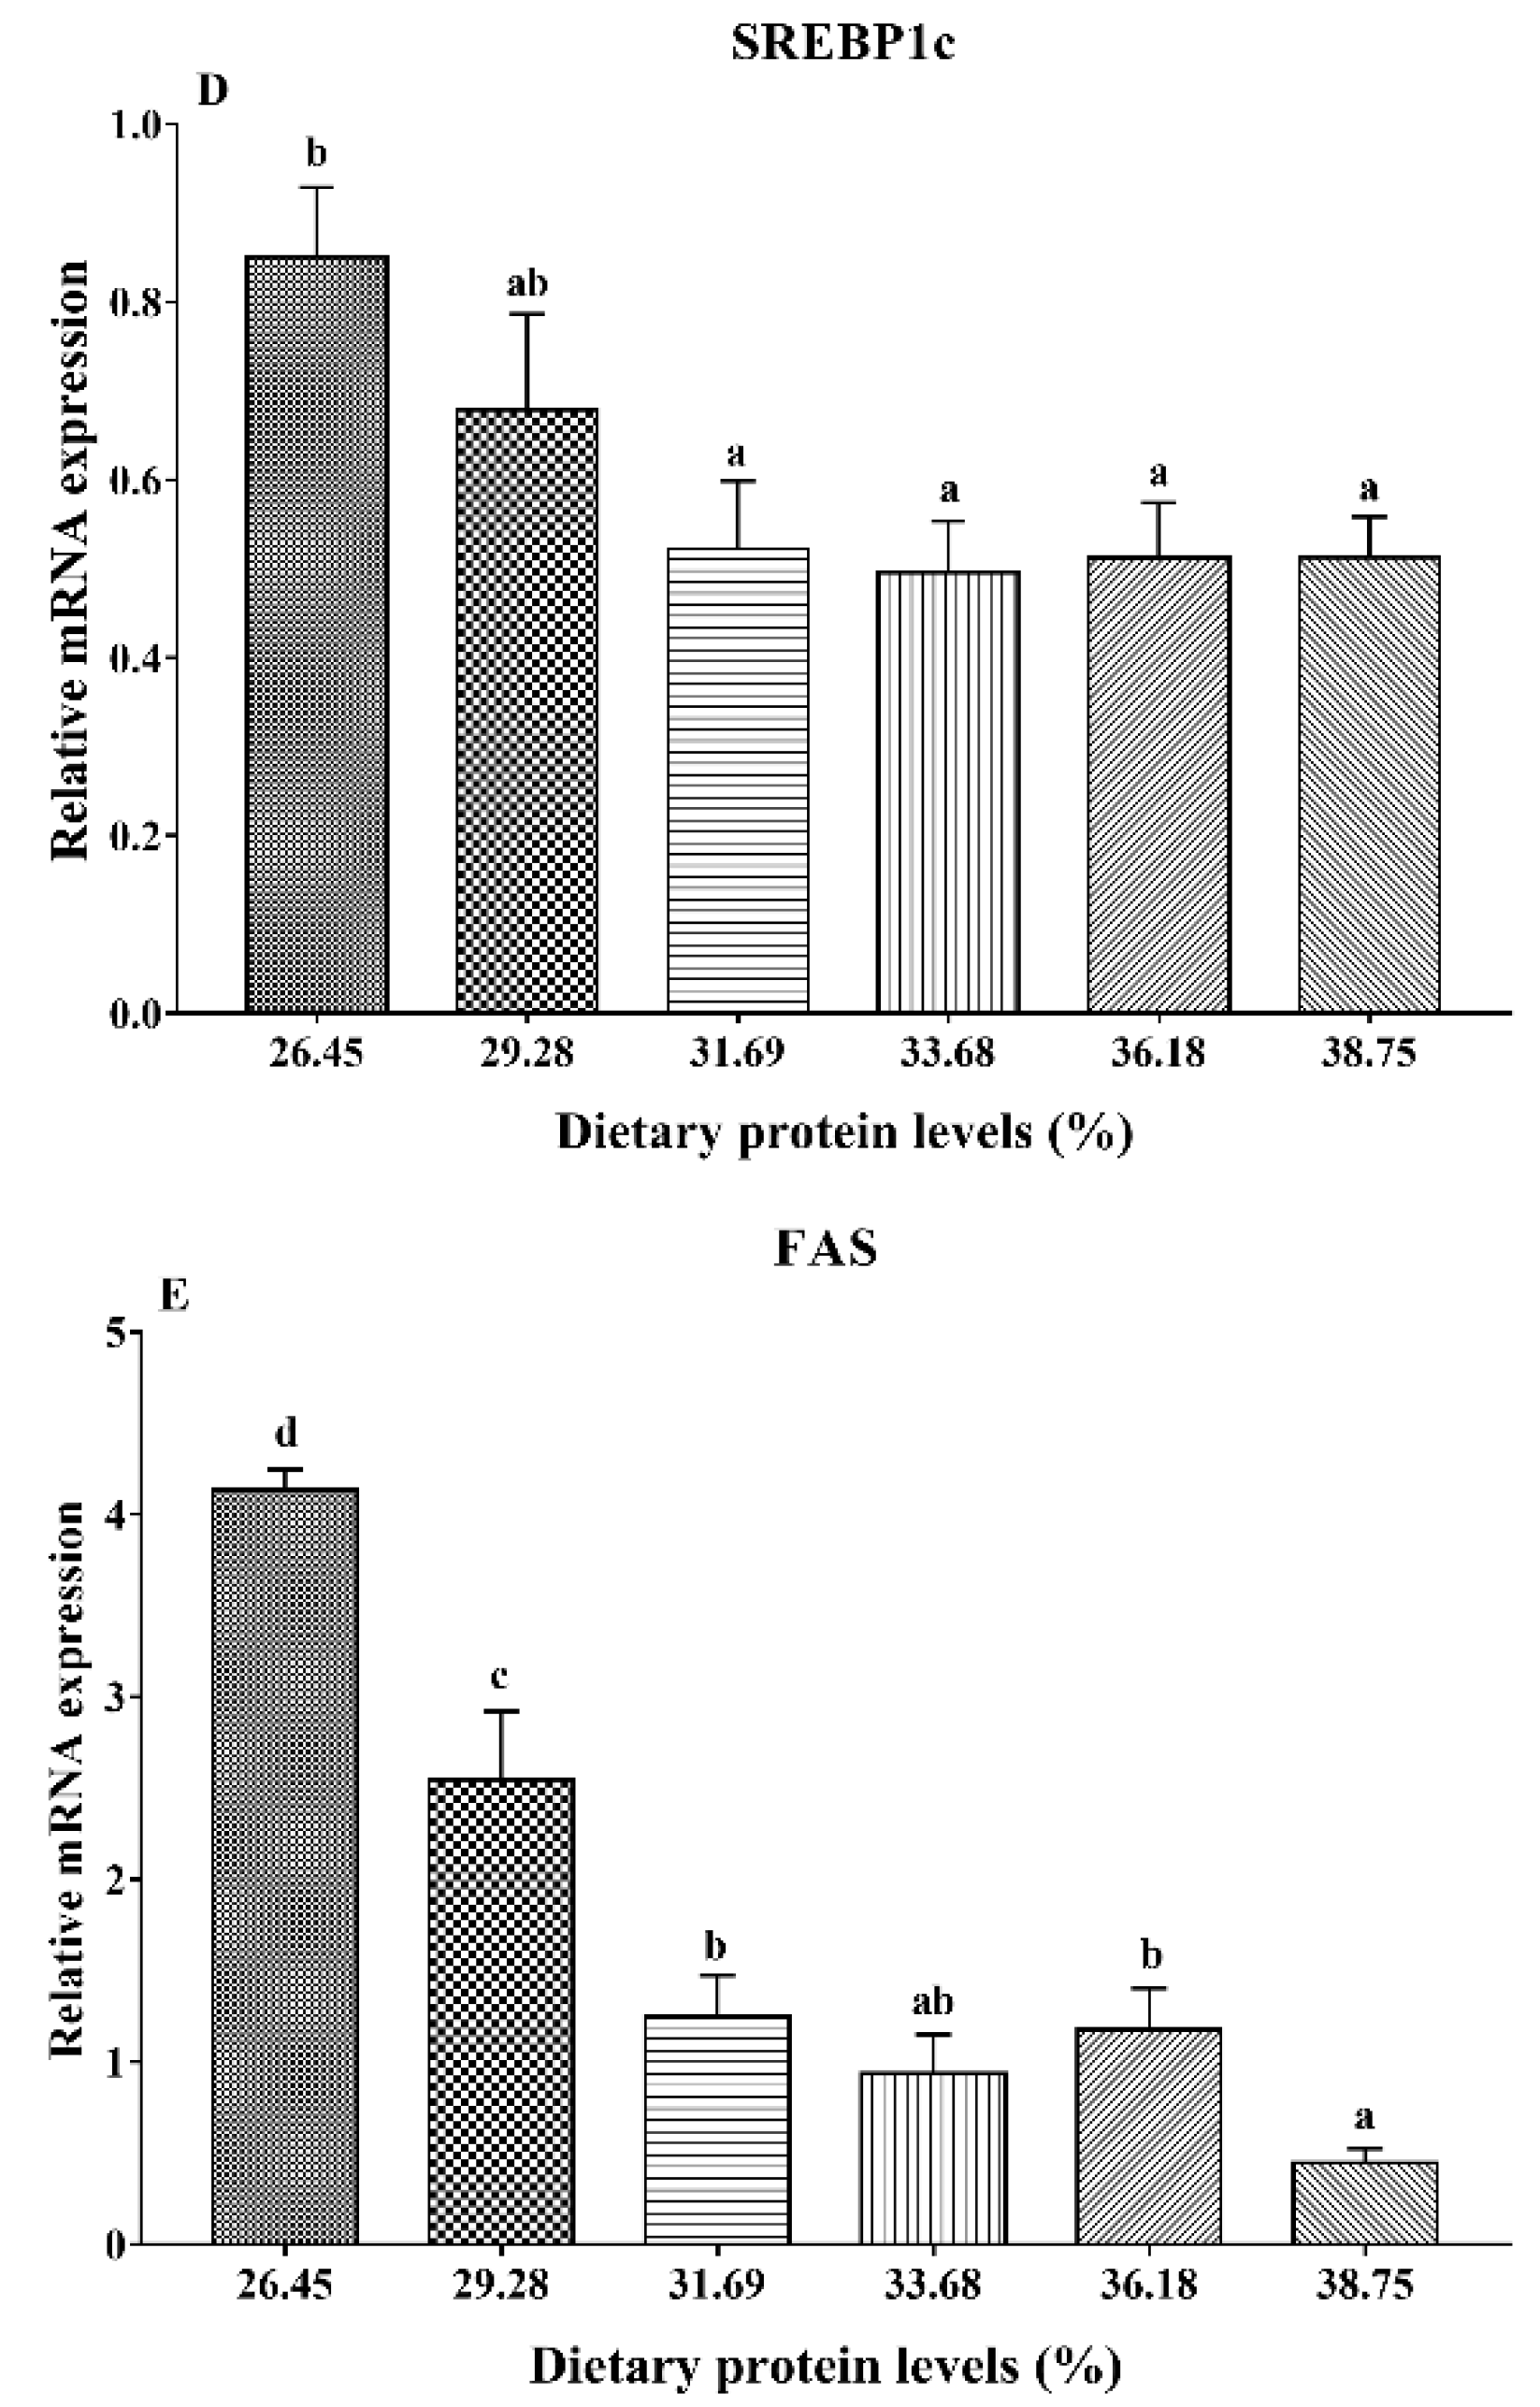
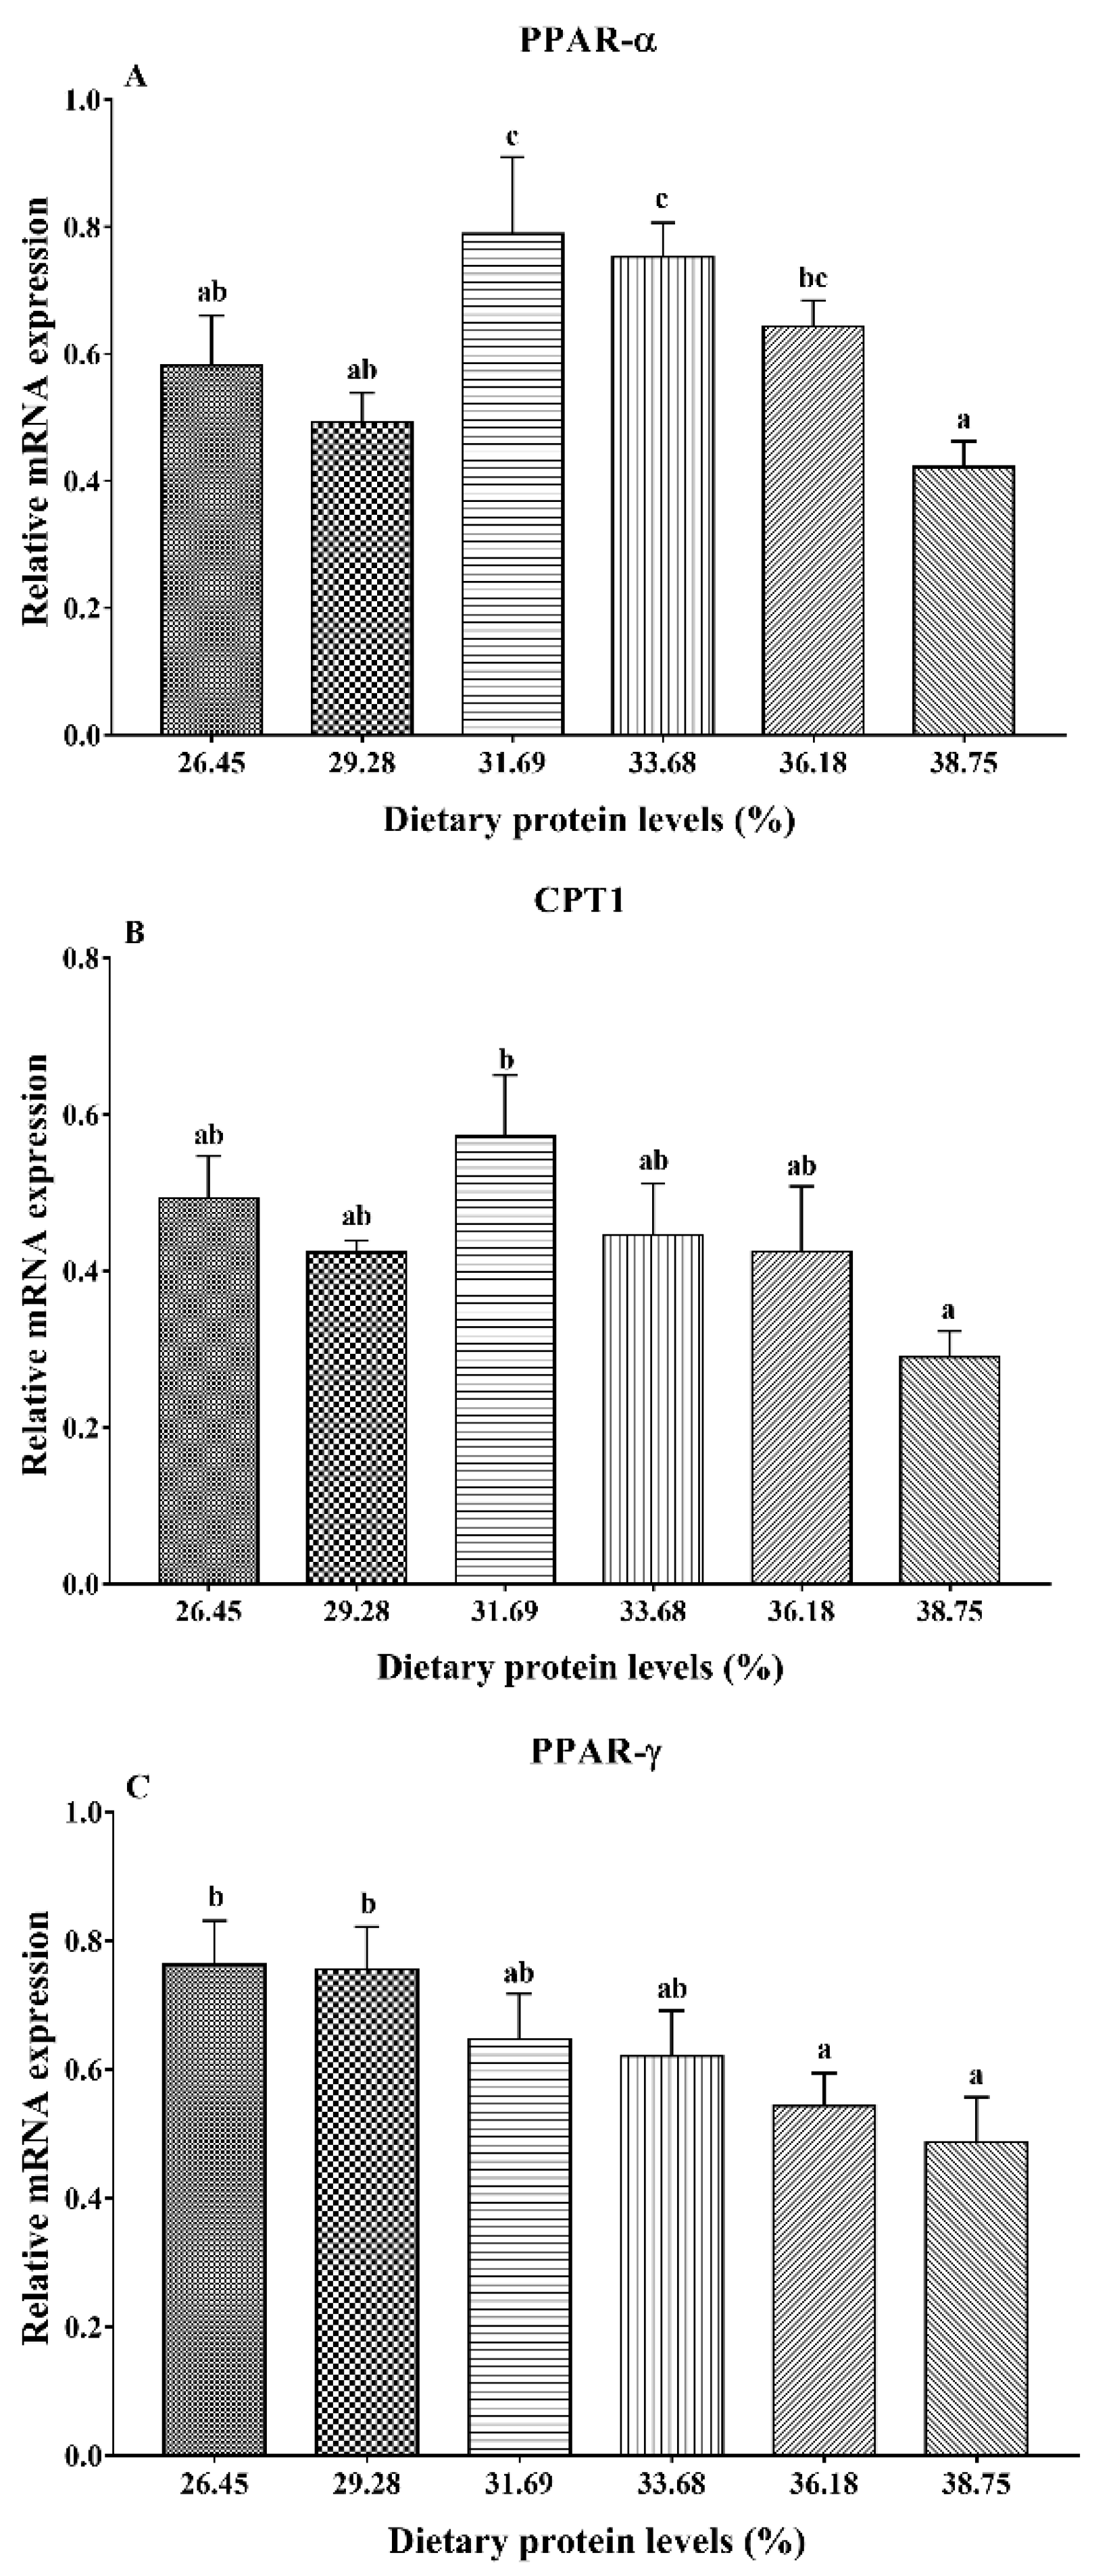
3.4. Gene Expression Analysis of Lipid Metabolism
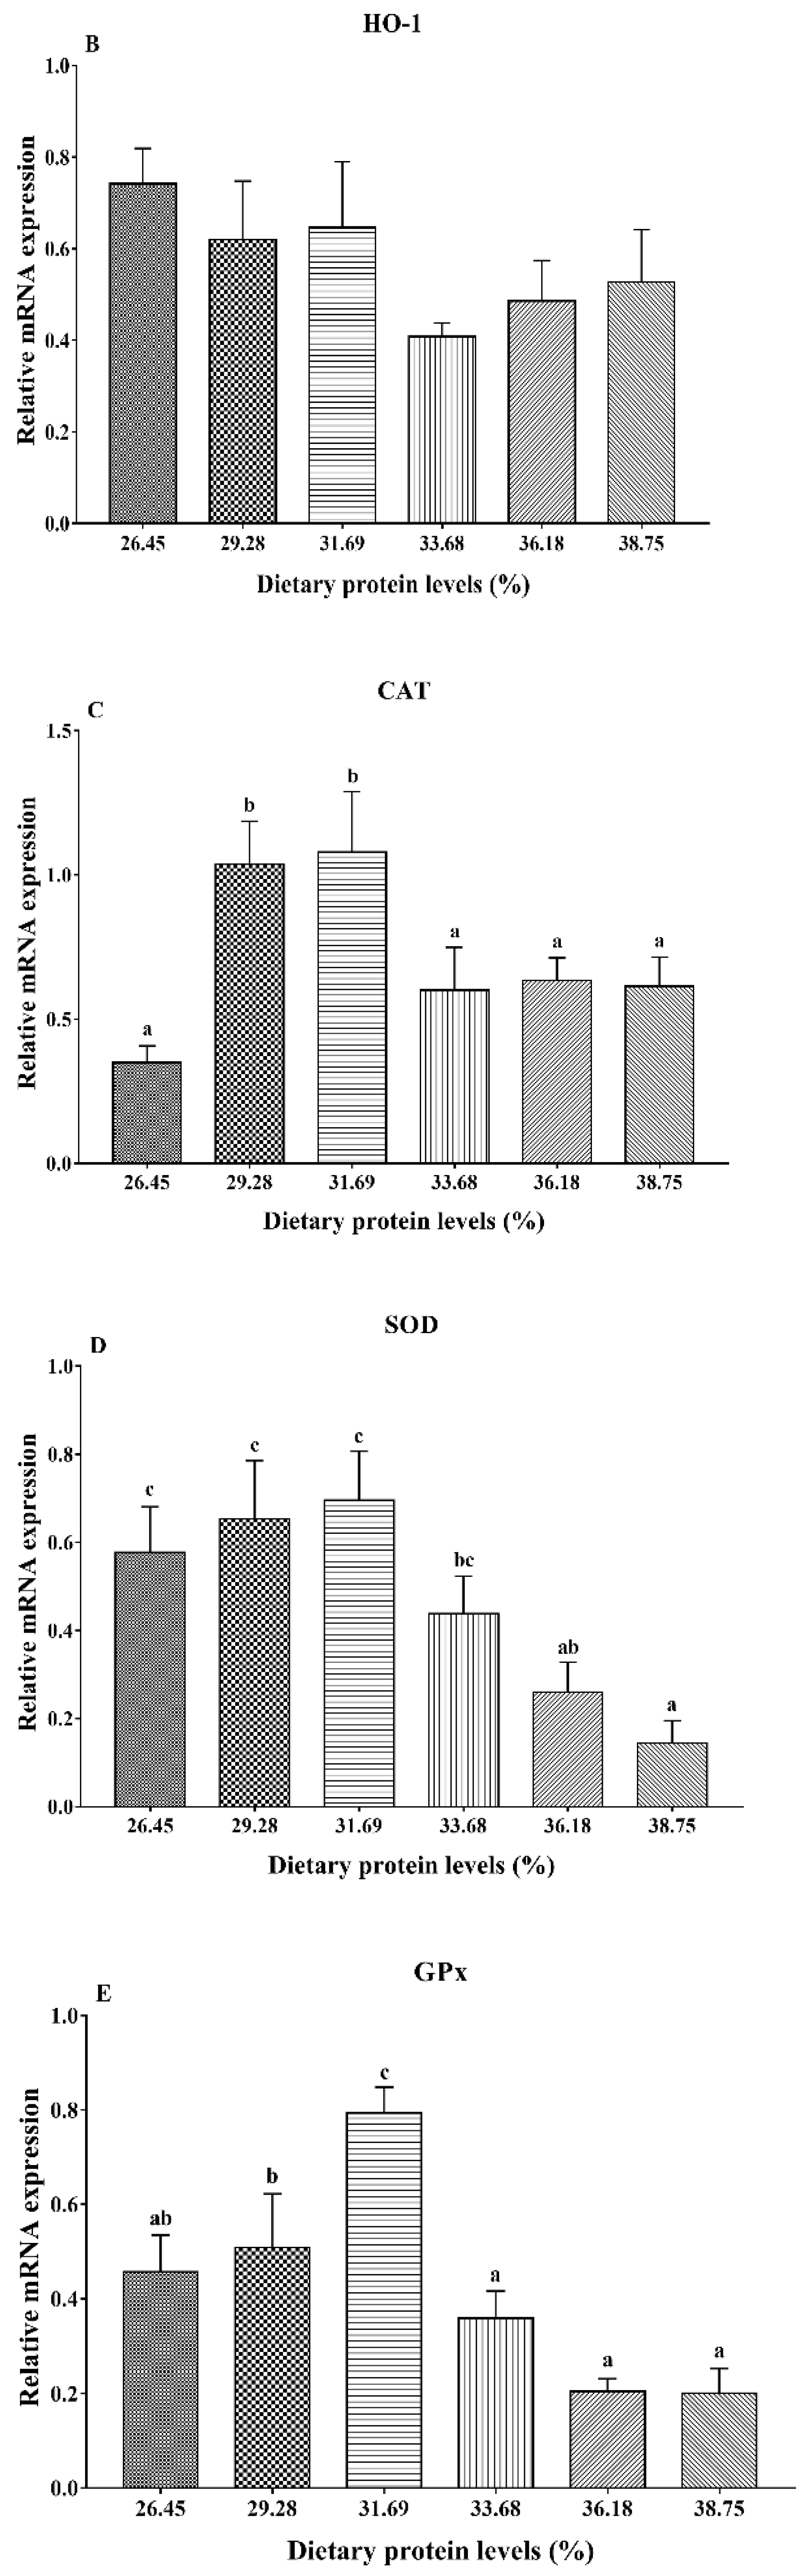
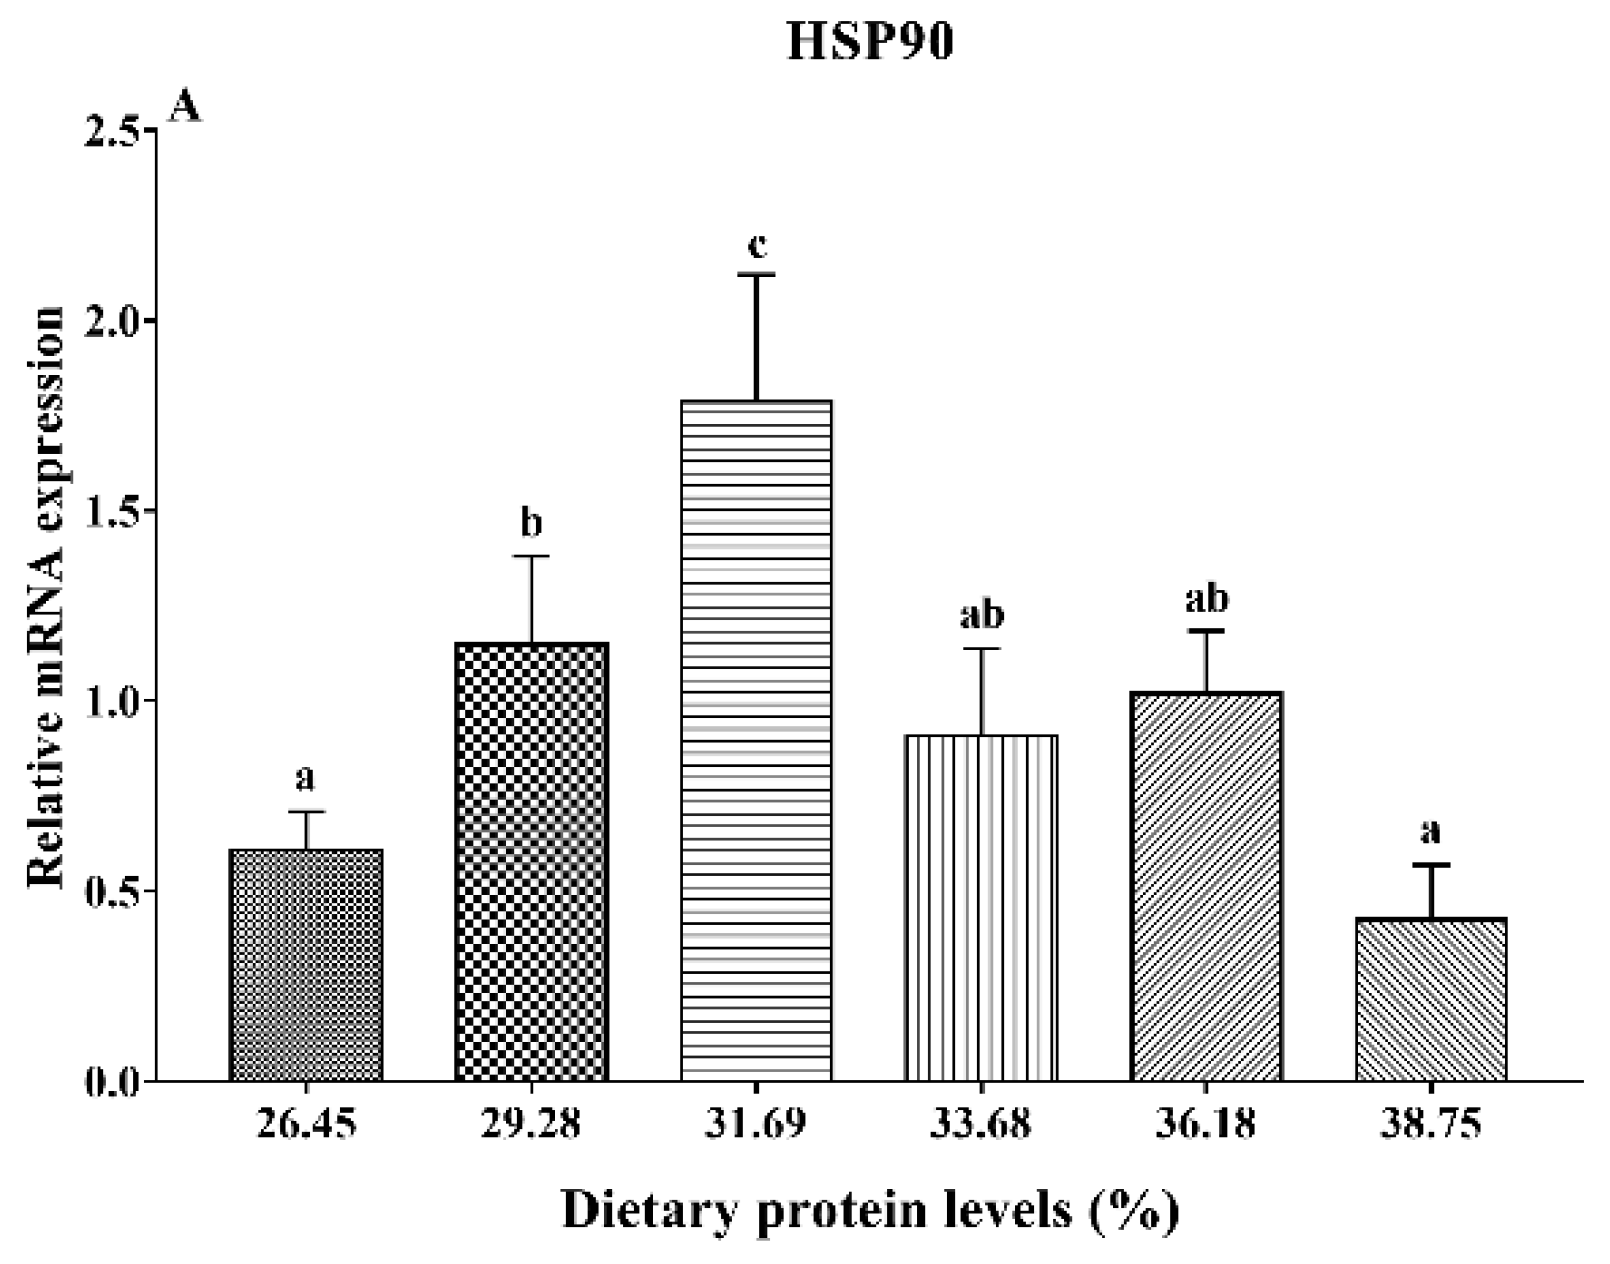
3.5. Gene Expression Analysis of HSP90 and Antioxidant Status
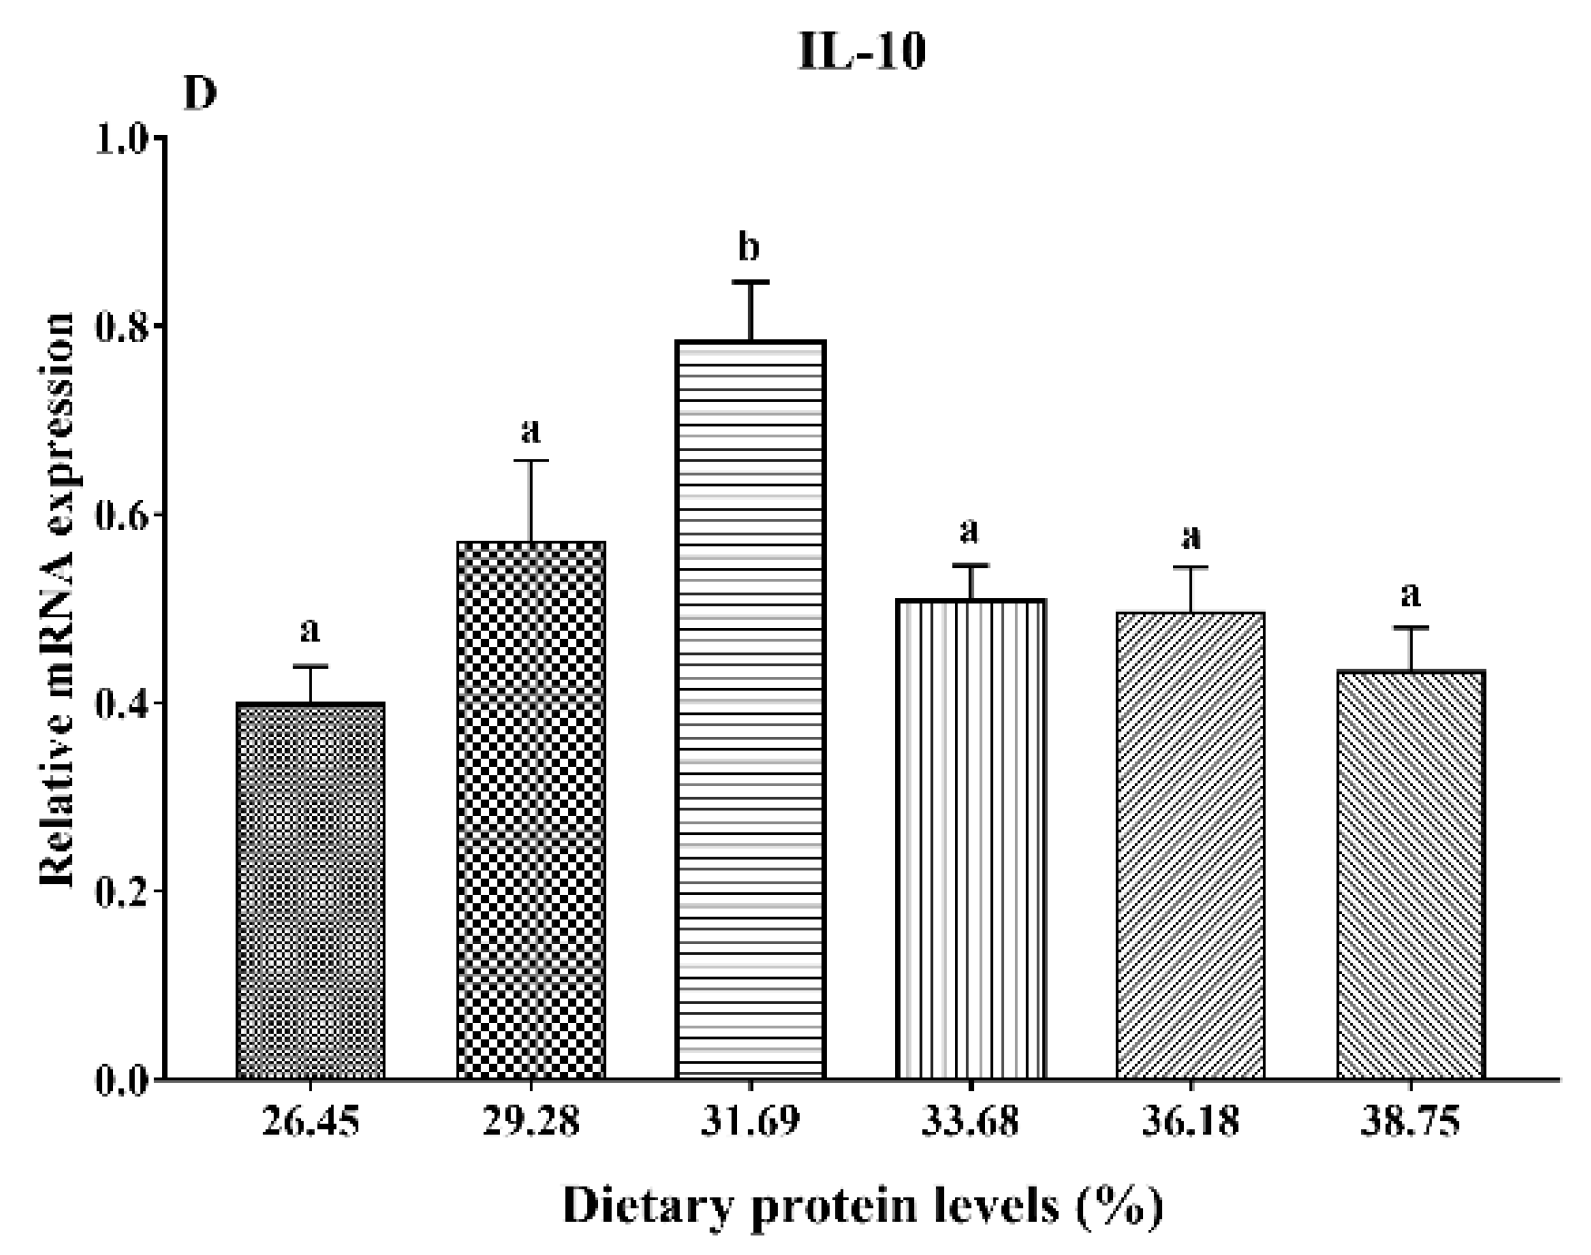
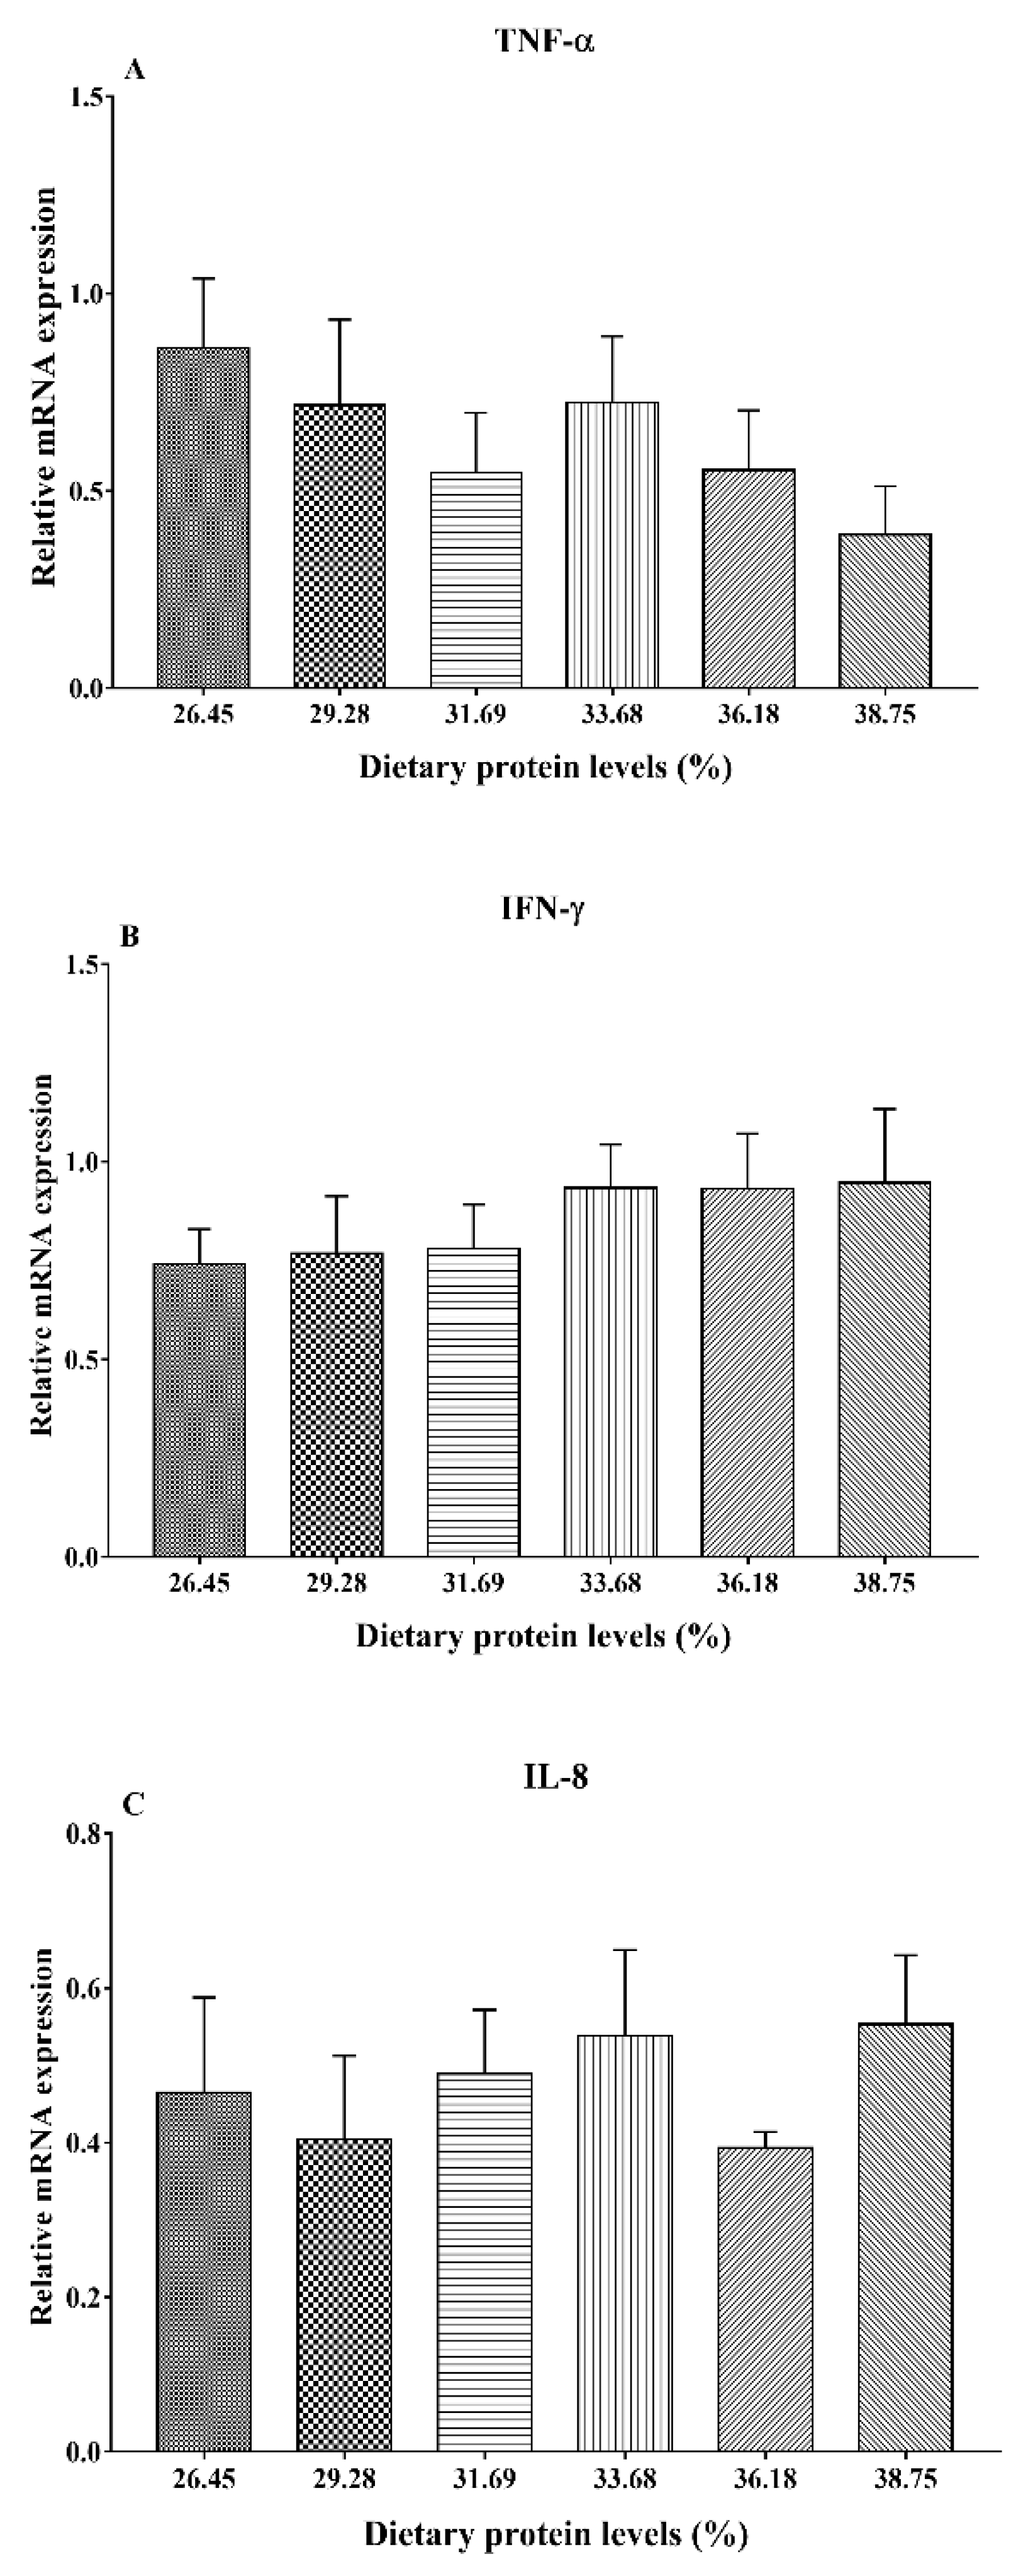
3.6. Gene Expression Analysis of Immunity
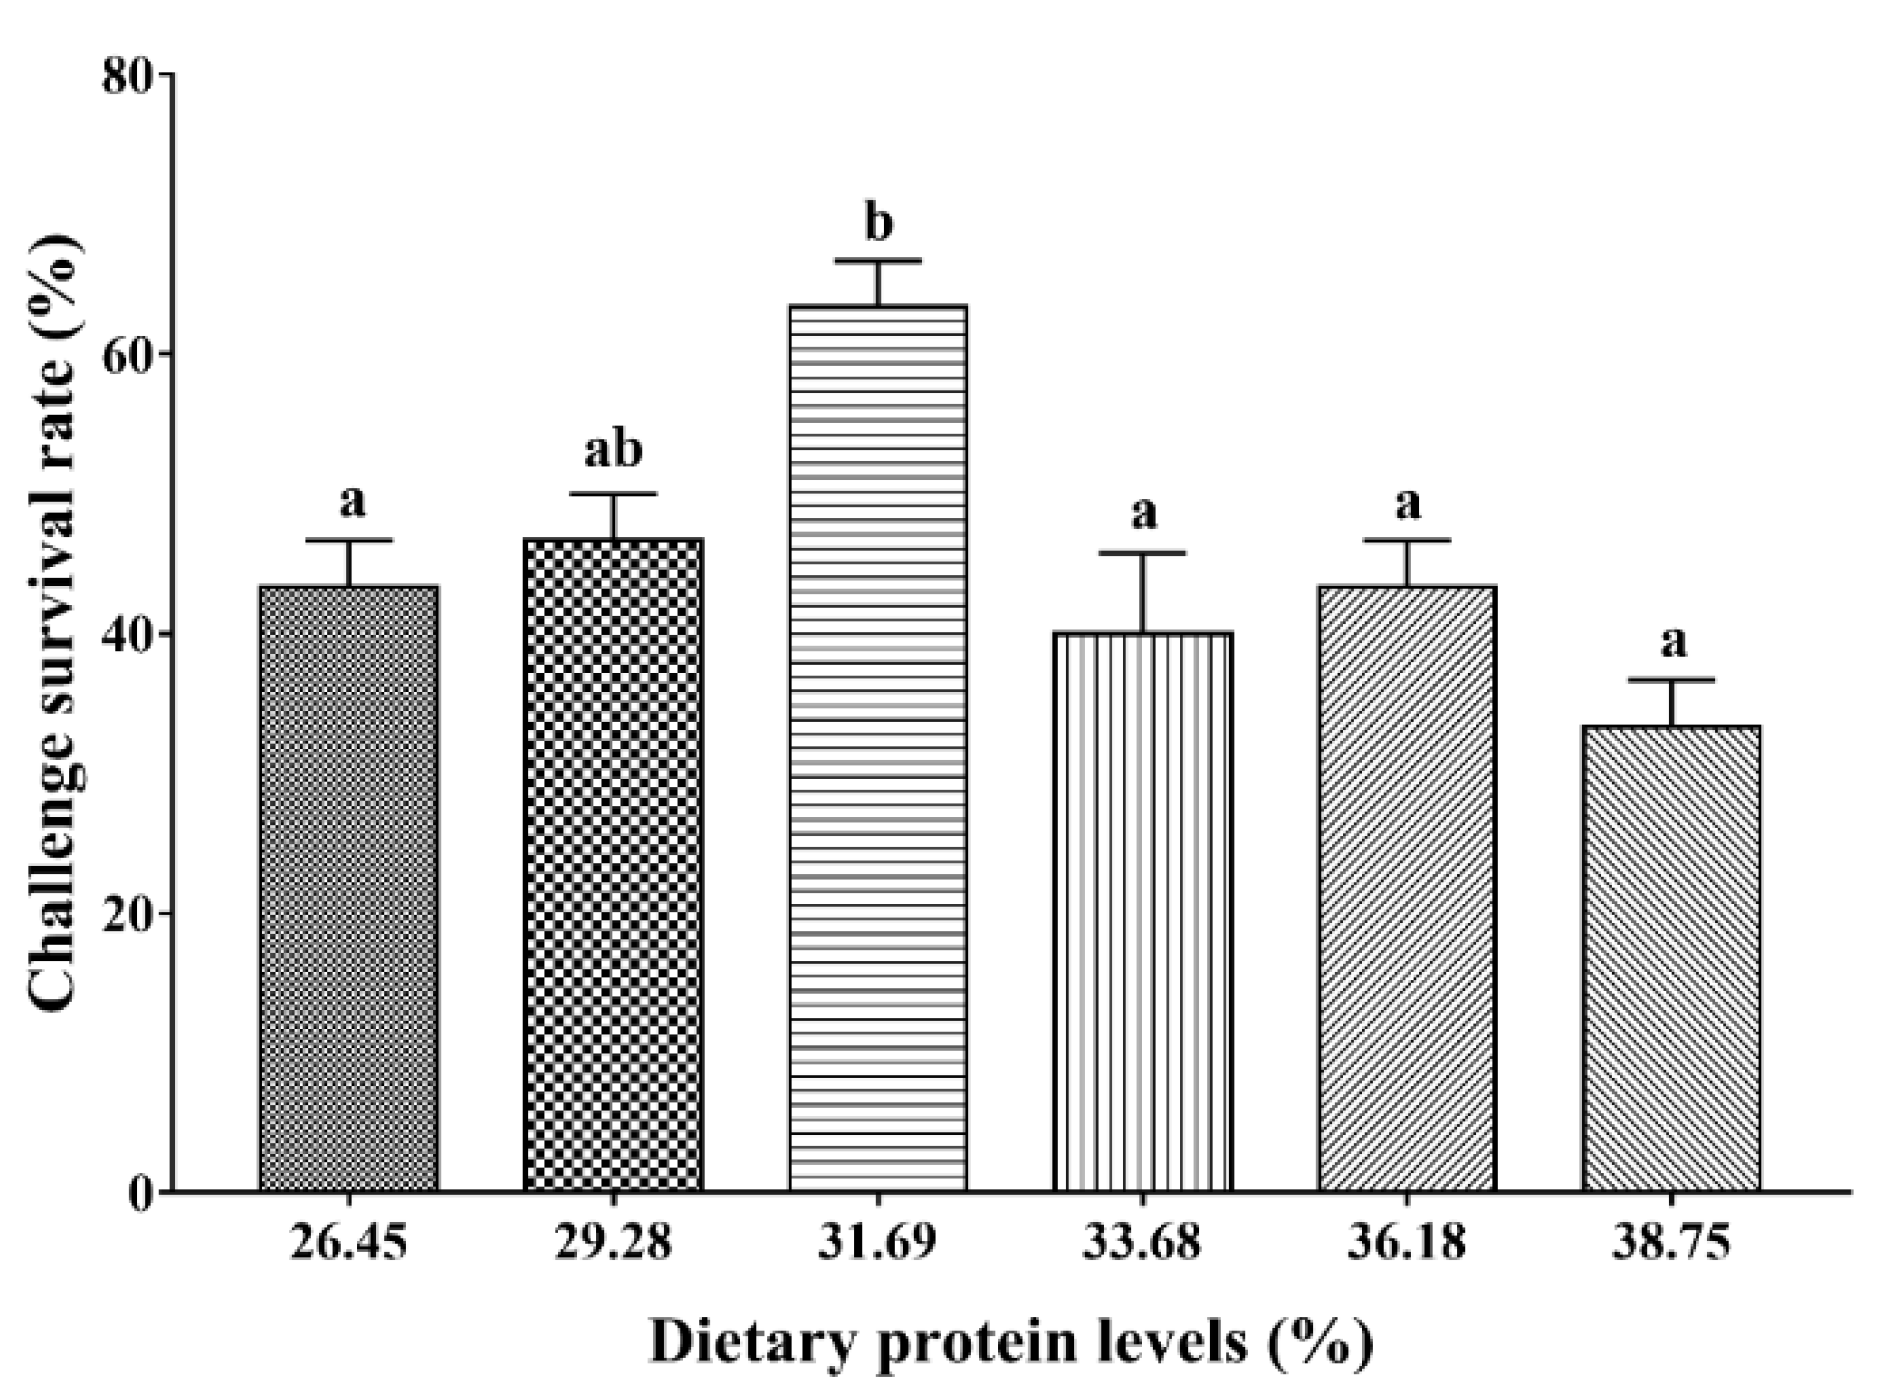
3.7. Streptococcus agalactiae Challenge Test
4. Discussion
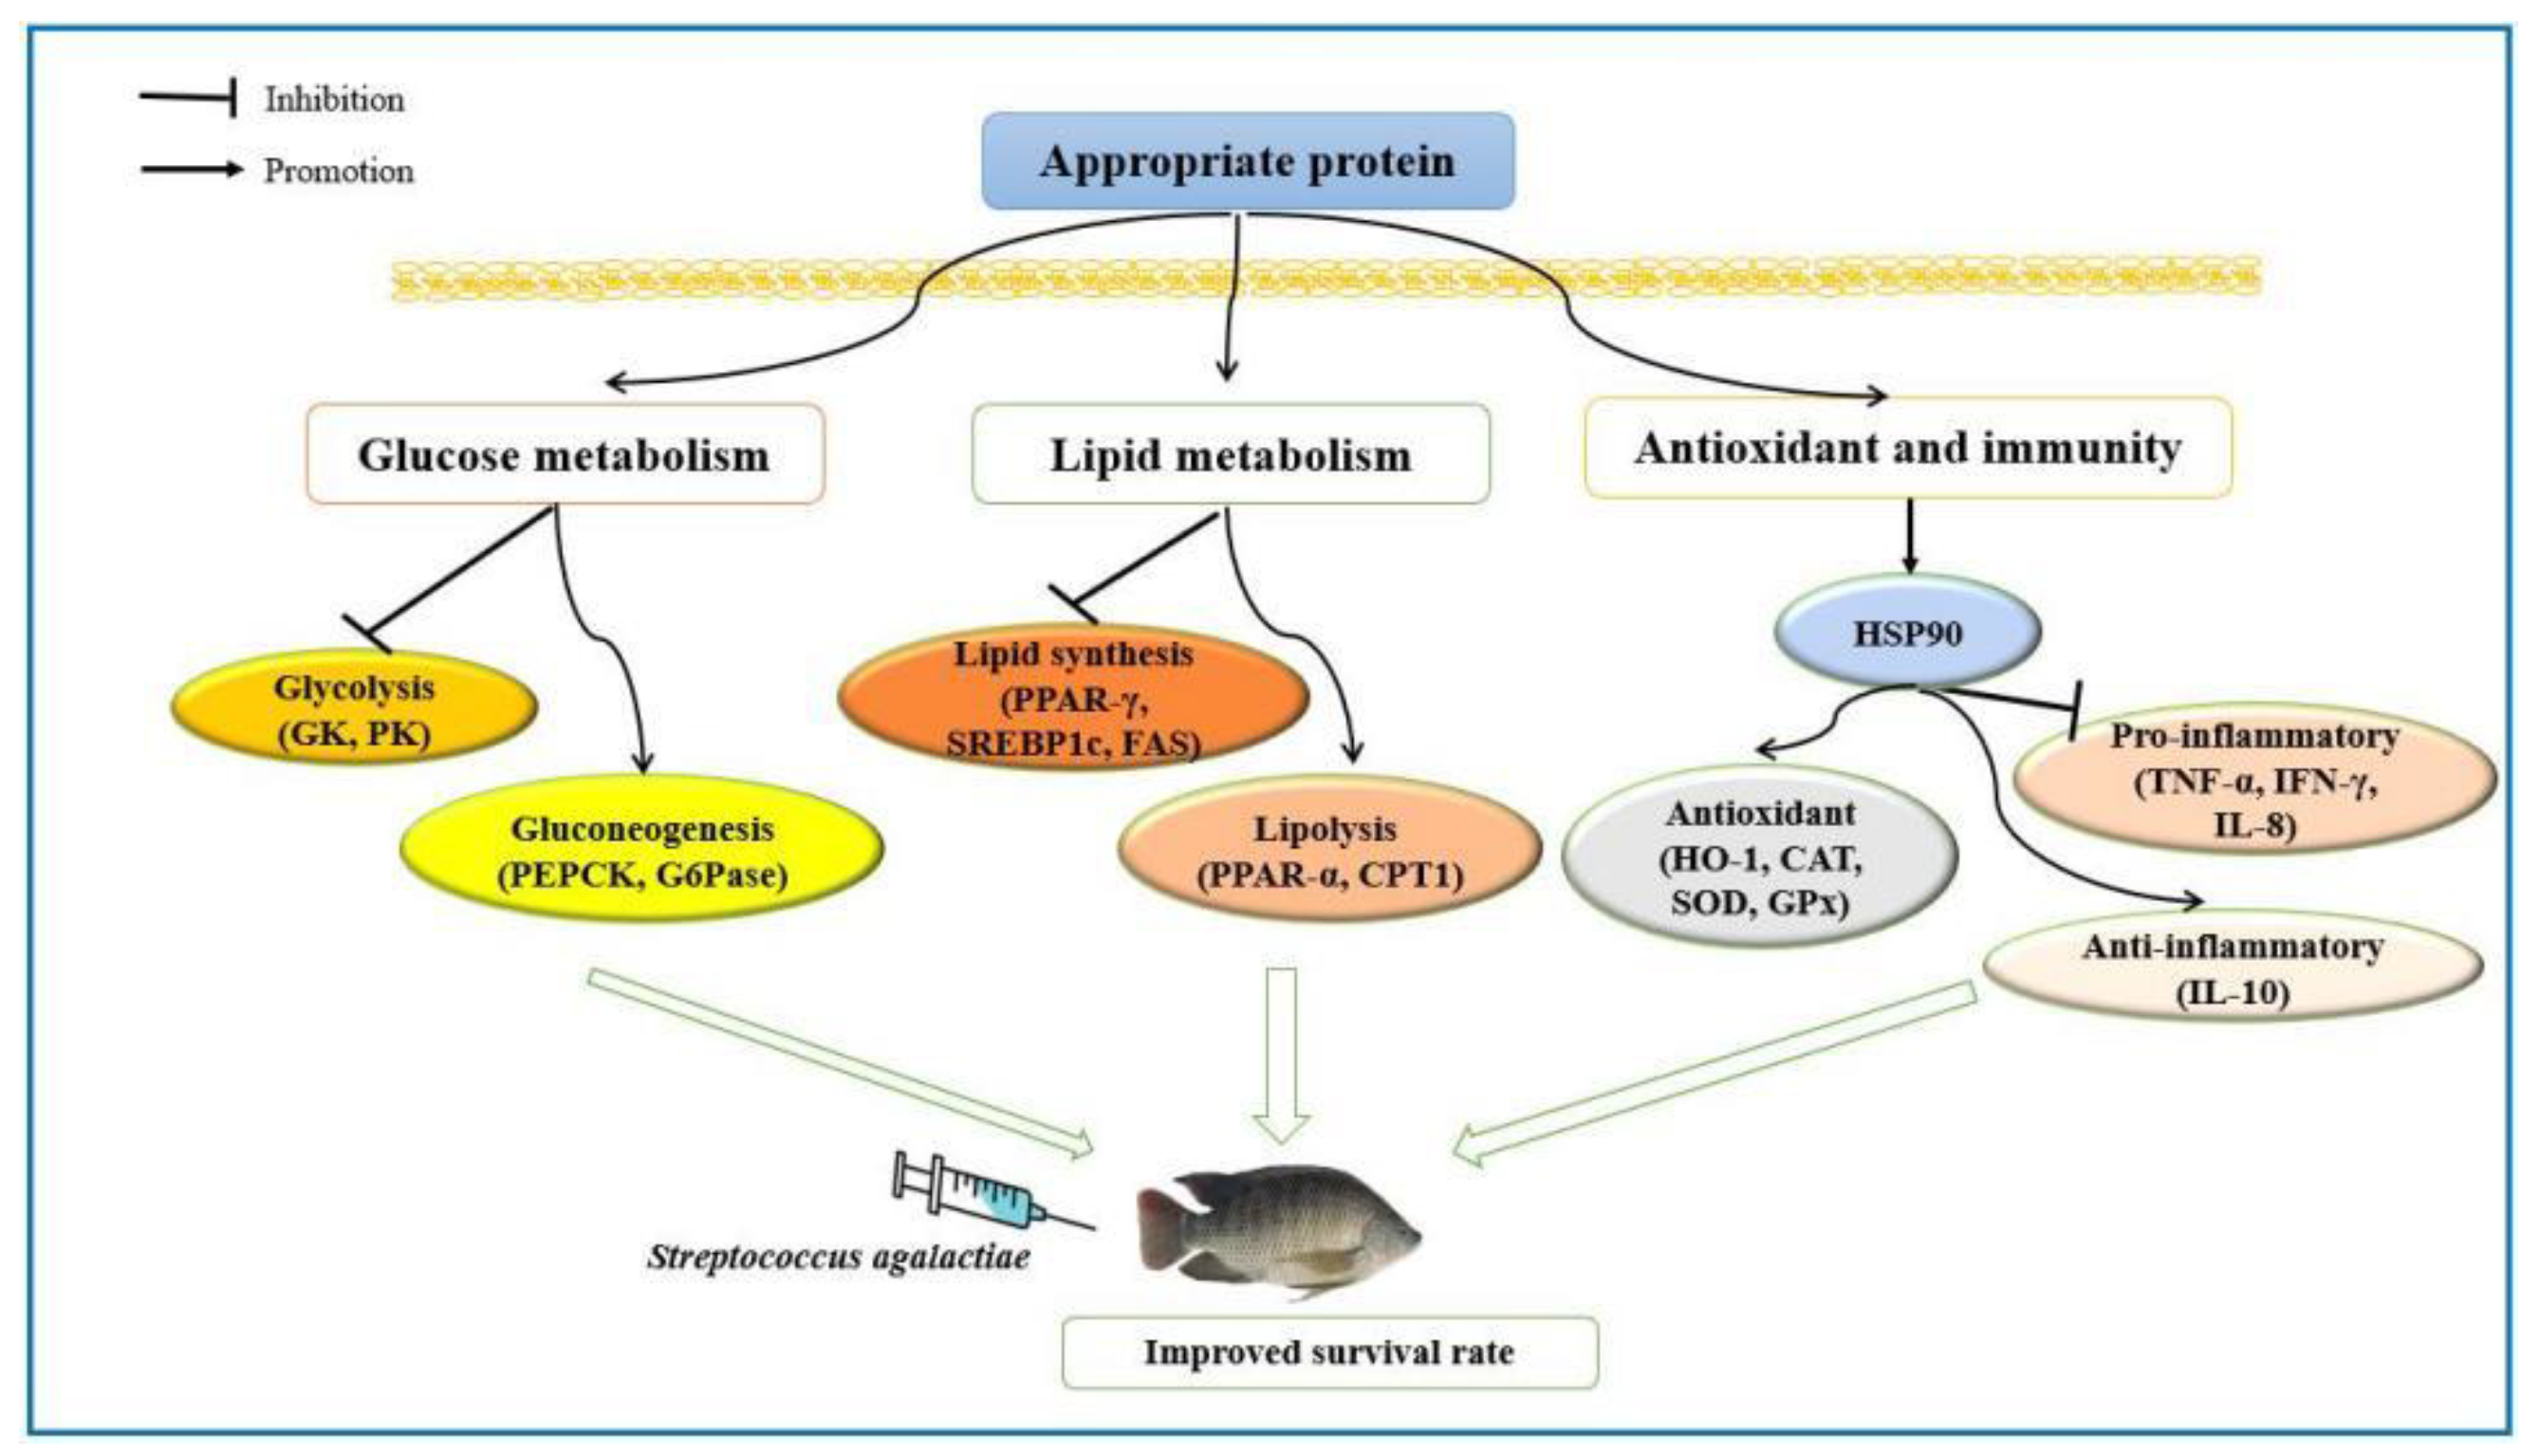
5. Conclusions
Author Contributions
Funding
Institutional Review Board Statement
Data Availability Statement
Conflicts of Interest
References
- Yu, H.; Liang, H.; Ren, M.; Ge, X.; Ji, K.; Huang, D.; Pan, L.; Xia, D. A study to explore the effects of low dietary protein levels on the growth performance and nutritional metabolism of grass carp (Ctenopharyngodon idella) fry. Aquaculture 2022, 546, 737324. [Google Scholar] [CrossRef]
- Lu, X.; Wei, H.; Yang, C.; Li, Q.; Li, P.; Chen, J.; Sun, Y.; Wen, H.; Jiang, M.; Wang, G. Effects of dietary protein levels on growth performance and liver transcriptome changes in juvenile top-mouth culter Erythroculter ilishaeformis. Aquac. Rep. 2021, 21, 100964. [Google Scholar] [CrossRef]
- Liang, M.; Wang, J.; Chang, Q.; Mai, K. Effects of different levels of fish protein hydrolysate in the diet on the nonspecific immunity of Japanese sea bass, Lateolabrax japonicus (Cuvieret Valenciennes, 1828). Aquac. Res. 2005, 37, 102–106. [Google Scholar] [CrossRef]
- Xia, S.; Sun, J.; Li, M.; Zhao, W.; Zhang, D.; You, H.; Rajkumar, M.; Wu, B. Influence of dietary protein level on growth performance, digestibility and activity of immunity-related enzymes of leopard coral grouper, Plectropomus leopardus (Lacépède, 1802). Aquac. Nutr. 2020, 26, 242–247. [Google Scholar] [CrossRef]
- Ojaveer, H.; Morris, P.C.; Davies, S.J.; Russell, P. The response of thick-lipped grey mullet, Chelon labrosus (Risso), to diets of varied protein-to-energy ratio. Aquac. Res. 1996, 27, 603–612. [Google Scholar] [CrossRef]
- Doran, O.; Moule, S.K.; Teye, G.A.; Whittington, F.M.; Hallett, K.G.; Wood, J.D. A reduced protein diet induces stearoyl-CoA desaturase protein expression in pig muscle but not in subcutaneous adipose tissue: Relationship with intramuscular lipid formation. Br. J. Nutr. 2006, 95, 609–617. [Google Scholar] [CrossRef]
- Pascual, C.; Zenteno, E.; Cuzon, G.; Suárez, J.; Sánchez, A.; Gaxiola, G.; Taboada, G.; Maldonado, T.; Rosas, C. Litopenaeus vannamei juveniles energetic balance and immunological response to dietary proteins. Aquaculture 2004, 239, 375–395. [Google Scholar] [CrossRef]
- Kiron, V.; Watanabe, T.; Fukuda, H.; Okamoto, N.; Takeuchi, T. Protein nutrition and defence mechanisms in rainbow trout Oncorhynchus mykiss. Comp. Biochem. Physiol. Part A Physiol. 1995, 111, 351–359. [Google Scholar] [CrossRef]
- Ma, S.; Guo, Y.; Sun, L.; Fan, W.; Liu, Y.; Liu, D.; Huang, D.; Li, X.; Zhang, W.; Mai, K. Over high or low dietary protein levels depressed the growth, TOR signaling, apoptosis, immune and anti-stress of abalone Haliotis discus hannai. Fish Shellfish Immunol. 2020, 106, 241–251. [Google Scholar] [CrossRef]
- Sun, L.; Chen, H.; Huang, L. Growth, faecal production, nitrogenous excretion and energy budget of juvenile yellow grouper (Epinephelus awoara) relative to ration level. Aquaculture 2007, 264, 228–235. [Google Scholar] [CrossRef]
- Hu, Y.-C.; Kang, C.-K.; Tang, C.-H.; Lee, T.-H. Transcriptomic Analysis of Metabolic Pathways in Milkfish That Respond to Salinity and Temperature Changes. PLoS ONE 2015, 10, e0134959. [Google Scholar] [CrossRef]
- Callaghan, N.I.; Tunnah, L.; Currie, S.; MacCormack, T.J. Metabolic Adjustments to Short-Term Diurnal Temperature Fluctuation in the Rainbow Trout (Oncorhynchus mykiss). Physiol. Biochem. Zool. 2016, 89, 498–510. [Google Scholar] [CrossRef]
- Forgati, M.; Kandalski, P.K.; Herrerias, T.; Zaleski, T.; Machado, C.; Souza, M.R.D.P.; Donatti, L. Effects of heat stress on the renal and branchial carbohydrate metabolism and antioxidant system of Antarctic fish. J. Comp. Physiol. B 2017, 187, 1137–1154. [Google Scholar] [CrossRef]
- Fernandez, M.V.S.; Johnson, J.S.; Abuajamieh, M.; Stoakes, S.K.; Seibert, J.T.; Cox, L.; Kahl, S.; Elsasser, T.H.; Ross, J.W.; Isom, S.C.; et al. Effects of heat stress on carbohydrate and lipid metabolism in growing pigs. Physiol. Rep. 2015, 3, e12315. [Google Scholar] [CrossRef]
- Zhao, T.; Ma, A.; Huang, Z.; Liu, Z.; Sun, Z.; Zhu, C.; Yang, J.; Li, Y.; Wang, Q.; Qiao, X.; et al. Transcriptome analysis reveals that high temperatures alter modes of lipid metabolism in juvenile turbot (Scophthalmus maximus) liver. Comp. Biochem. Physiol. Part D Genom. Proteom. 2021, 40, 100887. [Google Scholar] [CrossRef]
- Huang, D.; Ren, M.; Liang, H.; Ge, X.; Xu, H.; Wu, L. Transcriptome analysis of the effect of high-temperature on nutrient metabolism in juvenile grass carp (Ctenopharyngodon idellus). Gene 2021, 809, 146035. [Google Scholar] [CrossRef]
- Aepahi, A.; Heidarieh, M.; Mirvaghefi, A.; Rafiee, G.R.; Farid, M.; Sheikhzadeh, N. Effects of water temperature on the susceptibility of rainbow trout to streptococcus agalactiae. Acta Sci. Vet. 2013, 41, 1–5. [Google Scholar]
- Cheng, A.-C.; Cheng, S.-A.; Chen, Y.-Y.; Chen, J.-C. Effects of temperature change on the innate cellular and humoral immune responses of orange-spotted grouper Epinephelus coioides and its susceptibility to Vibrio alginolyticus. Fish Shellfish Immunol. 2009, 26, 768–772. [Google Scholar] [CrossRef]
- Wang, X.; Wang, L.; Zhang, H.; Ji, Q.; Song, L.; Qiu, L.; Zhou, Z.; Wang, M.; Wang, L. Immune response and energy metabolism of Chlamys farreri under Vibrio anguillarum challenge and high temperature exposure. Fish Shellfish Immunol. 2012, 33, 1016–1026. [Google Scholar] [CrossRef]
- Fisheries and Aquaculture Software. FishStatJ-Software for Fishery and Aquaculture Statistical Time Series. In FAO Fisheries and Aquaculture Department, Food and Agriculture Organization; Rome, Italy. 2020. Available online: https://www.fao.org/home/en/ (accessed on 28 December 2020).
- Amal, M.N.A.; Zamri-Saad, M. Streptococcosis in tilapia (Oreochromis niloticus): A review. Pertanika J. Trop. Agric. Sci. 2011, 34, 195–206. [Google Scholar]
- Huang, D.; Liang, H.; Ren, M.; Ge, X.; Zhang, Q.; Gu, J. The optimum dietary protein requirement of the genetically improved farmed tilapia (GIFT: Oreochromis niloticus): Effects on growth performance and protein metabolism via GH-IGF axis and TOR signalling pathway at different seasonal growth stages. Aquac. Res. 2022, 1–15. [Google Scholar] [CrossRef]
- Rodkhum, C.; Kayansamruaj, P.; Pirarat, N.; Zhou, W.; Liu, Y.; Chen, G.H. Effect of water temperature on susceptibility to Streptococcus agalactiae serotype Ia infection in Nile tilapia (Oreochromis niloticus). Thai J. Vet. Med. 2011, 41, 309. [Google Scholar]
- Kayansamruaj, P.; Pirarat, N.; Hirono, I.; Rodkhum, C. Increasing of temperature induces pathogenicity of Streptococcus agalactiae and the up-regulation of inflammatory related genes in infected Nile tilapia (Oreochromis niloticus). Veter-Microbiol. 2014, 172, 265–271. [Google Scholar] [CrossRef] [PubMed]
- Association of Official Analytical Chemists (AOAC). Official Methods of Analysis of the Association of Official Analytical Chemists, 15th ed.; Association of Official Analytical Chemists Inc.: Arlington, TX, USA, 2003. [Google Scholar]
- Pfaffl, M.W. A new mathematical model for relative quantification in real-time RT-PCR. Nucleic Acids Res. 2001, 29, 2002–2007. [Google Scholar] [CrossRef] [PubMed]
- Liang, H.; Ji, K.; Ge, X.; Ren, M.; Liu, B.; Xi, B.; Pan, L. Effects of dietary arginine on antioxidant status and immunity involved in AMPK-NO signaling pathway in juvenile blunt snout bream. Fish Shellfish Immunol. 2018, 78, 69–78. [Google Scholar] [CrossRef]
- Panserat, S.; Médale, F.; Blin, C.; Brèque, J.; Vachot, C.; Plagnes-Juan, E.; Gomes, E.; Krishnamoorthy, R.; Kaushik, S. Hepatic glucokinase is induced by dietary carbohydrates in rainbow trout, gilthead seabream, and common carp. Am. J. Physiol. Integr. Comp. Physiol. 2000, 278, R1164–R1170. [Google Scholar] [CrossRef] [PubMed]
- Kumar, S.; Sahu, N.P.; Pal, A.K.; Subramanian, S.; Priyadarshi, H.; Kumar, V. High dietary protein combats the stress of Labeo rohita fingerlings exposed to heat shock. Fish Physiol. Biochem. 2011, 37, 1005–1019. [Google Scholar] [CrossRef]
- Cai, L.-S.; Wang, L.; Song, K.; Lu, K.-L.; Zhang, C.-X.; Rahimnejad, S. Evaluation of protein requirement of spotted seabass (Lateolabrax maculatus) under two temperatures, and the liver transcriptome response to thermal stress. Aquaculture 2020, 516, 734615. [Google Scholar] [CrossRef]
- Atli, G.; Ariyurek, S.Y.; Kanak, E.G.; Canli, M. Alterations in the serum biomarkers belonging to different metabolic systems of fish (Oreochromis niloticus) after Cd and Pb exposures. Environ. Toxicol. Pharmacol. 2015, 40, 508–515. [Google Scholar] [CrossRef]
- Yu, H.; Ai, Q.; Mai, K.; Ma, H.; Cahu, C.L.; Infante, J.L.Z. Effects of dietary protein levels on the growth, survival, amylase and trypsin activities in large yellow croaker, Pseudosciaena Crocea R., larvae. Aquac. Res. 2012, 43, 178–186. [Google Scholar] [CrossRef]
- Ye, C.; Wu, Y.; Sun, Z.; Wang, A. Dietary protein requirement of juvenile obscure puffer, Takifugu obscurus. Aquac. Res. 2017, 48, 2064–2073. [Google Scholar] [CrossRef]
- Ibabe, A.; Bilbao, E.; Cajaraville, M.P. Expression of peroxisome proliferator-activated receptors in zebrafish (Danio rerio) depending on gender and developmental stage. Histochem. Cell Biol. 2004, 123, 75–87. [Google Scholar] [CrossRef]
- Kota, B.P.; Huang, T.H.-W.; Roufogalis, B.D. An overview on biological mechanisms of PPARs. Pharmacol. Res. 2005, 51, 85–94. [Google Scholar] [CrossRef]
- Gou, N.; Chang, Z.; Deng, W.; Ji, H.; Zhou, J. Effects of dietary lipid levels on growth, fatty acid composition, antioxidant status and lipid metabolism in juvenile Onychostoma macrolepis. Aquac. Res. 2019, 50, 3369–3381. [Google Scholar] [CrossRef]
- Kerner, J.; Hoppel, C. Fatty acid import into mitochondria. Biochim. Biophys. Acta—Mol. Cell Biol. Lipids 2000, 1486, 1–17. [Google Scholar] [CrossRef]
- Wu, F.N.; Wen, H.; Jiang, M.; Liu, W.; Liu, B.; Tian, J.; Yang, C.G. Effects of different dietary carbohydrate levels on growth performance and blood biochemical parameters of juvenile GIFT tilapia (Oreochromis niloticus). J. Northwest A F Univ.-Nat. Sci. Ed. 2012, 40, 8–14. [Google Scholar]
- Wongsathein, D. Factors Affecting Experimental Streptococcus Agalactiae Infection in Tilapia, Oreochromis Niloticus; University of Stirling: Stirling, UK, 2012; Available online: https://hdl.handle.net/1893/10375 (accessed on 27 September 2012).
- Miyata, Y.; Yahara, I. The 90-kDa heat shock protein, HSP90, binds and protects casein kinase II from self-aggregation and enhances its kinase activity. J. Biol. Chem. 1992, 267, 7042–7047. [Google Scholar] [CrossRef]
- Rokutan, K.; Hirakawa, T.; Teshima, S.; Nakano, Y.; Miyoshi, M.; Kawai, T.; Konda, E.; Morinaga, H.; Nikawa, T.; Kishi, K. Implications of heat shock/stress proteins for medicine and disease. J. Med. Investig. 1998, 44, 137–147. [Google Scholar]
- Weiss, Y.G.; Maloyan, A.; Tazelaar, J.; Raj, N.; Deutschman, C.S. Adenoviral transfer of HSP-70 into pulmonary epithelium ameliorates experimental acute respiratory distress syndrome. J. Clin. Investig. 2002, 110, 801–806. [Google Scholar] [CrossRef]
- Liang, H.; Mokrani, A.; Ji, K.; Ge, X.; Ren, M.; Pan, L.; Sun, A. Effects of dietary arginine on intestinal antioxidant status and immunity involved in Nrf2 and NF-κB signaling pathway in juvenile blunt snout bream, Megalobrama amblycephala. Fish Shellfish Immunol. 2018, 82, 243–249. [Google Scholar] [CrossRef]
- Liu, J.; Mai, K.; Xu, W.; Zhang, Y.; Zhou, H.; Ai, Q. Effects of dietary glutamine on survival, growth performance, activities of digestive enzyme, antioxidant status and hypoxia stress resistance of half-smooth tongue sole (Cynoglossus semilaevis Günther) post larvae. Aquaculture 2015, 446, 48–56. [Google Scholar] [CrossRef]
- Liu, B.; Xie, J.; Ge, X.; Xu, P.; Wang, A.; He, Y.; Zhou, Q.; Pan, L.; Chen, R. Effects of anthraquinone extract from Rheum officinale Bail on the growth performance and physiological responses of Macrobrachium rosenbergii under high temperature stress. Fish Shellfish Immunol. 2010, 29, 49–57. [Google Scholar] [CrossRef]
- Yu, M.-F.; Zhao, X.-M.; Cai, H.; Yi, J.-M.; Hua, G.-H. Dihydropyridine Enhances the Antioxidant Capacities of Lactating Dairy Cows under Heat Stress Condition. Animals 2020, 10, 1812. [Google Scholar] [CrossRef]
- Yan, J.; Li, Y.; Liang, X.; Zhang, Y.; Dawood, M.A.; Matuli’C, D.; Gao, J. Effects of dietary protein and lipid levels on growth performance, fatty acid composition and antioxidant-related gene expressions in juvenile loach Misgurnus anguillicaudatus. Aquac. Res. 2017, 48, 5385–5393. [Google Scholar] [CrossRef]
- Xu, J.; Feng, L.; Jiang, W.-D.; Wu, P.; Liu, Y.; Jiang, J.; Kuang, S.-Y.; Tang, L.; Zhou, X.-Q. Different dietary protein levels affect flesh quality, fatty acids and alter gene expression of Nrf2-mediated antioxidant enzymes in the muscle of grass carp (Ctenopharyngodon idella). Aquaculture 2018, 493, 272–282. [Google Scholar] [CrossRef]
- Yamamoto, Y.; Kume, M.; Yamaoka, Y. Implications of heat shock proteins during liver surgery and liver perfusion. Isol. Liver Perfus. Hepatic Tumors 1998, 147, 157–172. [Google Scholar] [CrossRef]
- Lauber, K.; Brix, N.; Ernst, A.; Hennel, R.; Krombach, J.; Anders, H.; Belka, C. Targeting the heat shock response in combination with radiotherapy: Sensitizing cancer cells to irradiation-induced cell death and heating up their immunogenicity. Cancer Lett. 2015, 368, 209–229. [Google Scholar] [CrossRef]
- Wong, H.R. Heat shock proteins. Facts, thoughts, and dreams. Shock 1999, 11, 323–325. [Google Scholar] [CrossRef]
- Li, Y.; Ding, W.; Li, X. Acute exposure of glyphosate-based herbicide induced damages on common carp organs via heat shock proteins-related immune response and oxidative stress. Toxin Rev. 2019, 40, 1071–1083. [Google Scholar] [CrossRef]
- Sheikh, Z.A.; Ahmed, I. Impact of environmental changes on plasma biochemistry and hematological parameters of Himalayan snow trout, Schizothorax plagiostomus. Comp. Clin. Pathol. 2019, 28, 793–804. [Google Scholar] [CrossRef]
- Wang, K.W.; Takeuchi, T.; Watanabe, T. Effect of dietary protein levels on growth of Tilapia nilotica. Bull. Jpn. Soc. Sci. Fish. 1985, 51, 133–140. [Google Scholar] [CrossRef]
- Sayed, A.N. Optimum Crude Protein Requirement of the Fingerlings Nile Tilapia (Oreochromis niloticus). Biol. Sci. 2018, 2, 1–8. [Google Scholar] [CrossRef]
- Kpundeh, M.D.; Qiang, J.; He, J.; Yang, H.; Xu, P. Effects of dietary protein levels on growth performance and haemato-immunological parameters of juvenile genetically improved farmed tilapia (GIFT), Oreochromis niloticus. Aquac. Int. 2015, 23, 1189–1201. [Google Scholar] [CrossRef]
- Lu, K.L.; Cai, L.S.; Wang, L.; Song, K.; Zhang, C.X.; Rahimnejad, S. Effects of dietary protein/energy ratio and water temperature on growth performance, digestive enzymes activity and non-specific immune response of spotted seabass (Lateolabrax macu-latus). Aquac. Nutr. 2020, 26, 2023–2031. [Google Scholar] [CrossRef]


| Ingredients | Diet 1 | Diet 2 | Diet 3 | Diet 4 | Diet 5 | Diet 6 |
|---|---|---|---|---|---|---|
| Fish meal a | 2.00 | 2.00 | 2.00 | 2.00 | 2.00 | 2.00 |
| Rapeseed meal a | 25.00 | 25.00 | 25.00 | 25.00 | 25.00 | 25.00 |
| Soybean meal a | 2.00 | 10.00 | 18.00 | 26.00 | 34.00 | 43.00 |
| Cottonseed meal a | 9.00 | 9.00 | 9.00 | 9.00 | 9.00 | 9.00 |
| Wheat flour a | 35.00 | 29.30 | 23.60 | 17.90 | 12.20 | 6.00 |
| Soybean oil | 2.50 | 2.50 | 2.50 | 2.50 | 2.50 | 2.50 |
| Choline chloride | 0.50 | 0.50 | 0.50 | 0.50 | 0.50 | 0.50 |
| Vitamin C (35%) | 0.05 | 0.05 | 0.05 | 0.05 | 0.05 | 0.05 |
| Vitamins premix b | 2.00 | 2.00 | 2.00 | 2.00 | 2.00 | 2.00 |
| Mineral premix c | 2.00 | 2.00 | 2.00 | 2.00 | 2.00 | 2.00 |
| Calcium dihydrogen phosphate | 2.50 | 2.50 | 2.50 | 2.50 | 2.50 | 2.50 |
| Rice bran | 10.00 | 8.00 | 6.50 | 5.00 | 3.50 | 2.00 |
| Microcrystalline cellulose | 4.62 | 4.35 | 3.71 | 3.08 | 2.26 | 0.96 |
| Ethoxy quinoline | 0.01 | 0.01 | 0.01 | 0.01 | 0.01 | 0.01 |
| Bentonite | 2.00 | 2.00 | 2.00 | 2.00 | 2.00 | 2.00 |
| Lysine d | 0.32 | 0.26 | 0.14 | 0.00 | 0.00 | 0.00 |
| Methionine d | 0.33 | 0.38 | 0.40 | 0.42 | 0.47 | 0.48 |
| Threonine d | 0.17 | 0.15 | 0.09 | 0.04 | 0.02 | 0.00 |
| Analyzed proximate composition | ||||||
| Dry matter (%) | 94.16 | 93.29 | 93.29 | 93.82 | 92.79 | 92.21 |
| Crude protein (%) | 26.45 | 29.28 | 31.69 | 33.68 | 36.18 | 38.75 |
| Crude lipid (%) | 4.56 | 4.35 | 4.65 | 4.39 | 4.60 | 4.31 |
| Crude ash (%) | 10.56 | 10.54 | 10.94 | 11.22 | 11.25 | 11.74 |
| Crude fiber (%) | 6.17 | 6.32 | 6.57 | 6.81 | 7.05 | 7.36 |
| NFE e | 46.42 | 42.80 | 39.44 | 37.72 | 33.71 | 30.05 |
| Gross energy (KJ/g) | 17.96 | 18.03 | 18.00 | 18.03 | 18.06 | 18.14 |
| Gene | Forward Primer (5′-3′) | Reverse Primer (5′-3′) |
|---|---|---|
| CAT a | GGAAGAGGATGACGAAGAG | GTTACGGCGAGATGATGT |
| CPT1 b | TCAACACCACACGCATTCCT | AAAGTAGCGCCCTTTGTGGT |
| FAS c | TCATCCAGCAGTTCACTGGCATT | TGATTAGGTCCACGGCCACA |
| G6Pase d | AGCGCGAGCCTGAAGAAGTACT | ATGGTCCACAGCAGGTCCACAT |
| GK e | GACATGAGGACATTGACAAGGGAA | CTTGATGGCGTCTCTGAGTAAACC |
| GPx f | CCAAGAGAACTGCAAGAACGA | CAGGACACGTCATTCCTACAC |
| HO-1 g | CTTGCCCGTGTGGAATCACT | AGATCACCGAGGTAGCGAGT |
| HSP90 h | ATCATCAATGTCCAGCATCA | CATCTTCGCAGCATACCA |
| IFN-γ i | ATGGCTACCACAGTGAGGGCAG | AACTCTGGGGCGACCTTTAGC |
| IL-8 j | CTGTGAAGGCATGGGTGTGGAG | TCGCAGTGGGAGTTGGGAAGAA |
| IL-10 k | CTGCTAGATCAGTCCGTCGAA | GCAGAACCGTGTCCAGGTAA |
| PEPCK l | CTGCGCAAGTACAGCAACTG | TCATGGCTTTGTCCCACTCC |
| PK m | GCACTCCTCAGCTGGTTAAT | GCAAGCACTAGAGCAGGATTT |
| PPAR-α n | TCCAAAAGAAGAACCGAAACA | TTCCACCTCTTTCTCAACCAT |
| PPAR-γ o | TTTACCCATCAAACTGACCAC | GAGGAAATGGAGGCGTAGT |
| SOD p | ACAGAAGAGAAGTATCAGGAG | CACCGTAACAGCAGACAT |
| SREBP1c q | TGCAGCAGAGAGACTGTATCCGA | ACTGCCCTGAATGTGTTCAGACA |
| TNF-α r | AAGCCAAGGCAGCCATCCAT | TTGACCATTCCTCCACTCCAGA |
| β-actin | CCACACAGTGCCCATCTACGA | CCACGCTCTGTCAGGATCTTCA |
| Dietary Protein (%) | GLU (mmol/L) | TG (mmol/L) | TC (mmol/L) | ALT (U/L) | AST (U/L) |
|---|---|---|---|---|---|
| 26.45 | 16.63 ± 1.59 | 42.32 ± 0.86 b,c | 3.24 ± 0.08 a,b | 22.16 ± 2.35 a | 118.04 ± 11.00 a,b |
| 29.28 | 18.61 ± 0.79 | 45.64 ± 1.86 c | 3.22 ± 0.07 a,b | 25.60 ± 1.89 a,b | 117.57 ± 13.99 a,b |
| 31.69 | 15.35 ± 0.89 | 45.39 ± 2.90 c | 3.47 ± 0.08 b | 21.25 ± 3.68 a | 75.60 ± 16.75 a |
| 33.68 | 17.98 ± 1.14 | 39.60 ± 2.37 a,b | 3.15 ± 0.13 a | 22.72 ± 4.05 a | 93.88 ± 14.74 a,b |
| 36.18 | 18.57 ± 0.63 | 34.61 ± 1.18 a | 3.15 ± 0.06 a | 36.59 ± 3.32 b,c | 132.18 ± 18.08 b,c |
| 38.75 | 16.35 ± 1.12 | 35.44 ± 1.44 a | 3.16 ± 0.08 a | 46.10 ± 5.75 c | 170.29 ± 20.01 c |
| Dietary Protein (%) | CAT (U/mg Protein) | T-SOD (U/mg Protein) | MDA (nmol/mg Protein) | GSH (μmol/g Protein) | GSH-Px (U/mg Protein) |
|---|---|---|---|---|---|
| 26.45 | 1.68 ± 0.14 | 0.83 ± 0.06 | 0.25 ± 0.04 | 21.64 ± 1.64 a,b | 6.59 ± 0.67 b |
| 29.28 | 1.61 ± 0.12 | 0.73 ± 0.05 | 0.26 ± 0.06 | 24.99 ± 1.37 b | 6.70 ± 0.61 b |
| 31.69 | 1.60 ± 0.08 | 0.74 ± 0.06 | 0.21 ± 0.04 | 22.64 ± 2.29 a,b | 7.42 ± 0.77 b |
| 33.68 | 1.51 ± 0.14 | 0.70 ± 0.03 | 0.16 ± 0.02 | 18.27 ± 1.71 a | 6.17 ± 0.64 a,b |
| 36.18 | 1.46 ± 0.09 | 0.71 ± 0.03 | 0.31 ± 0.03 | 17.71 ± 1.33 a | 5.56 ± 0.53 a,b |
| 38.75 | 1.53 ± 0.09 | 0.68 ± 0.03 | 0.27 ± 0.05 | 17.27 ± 1.76 a | 4.52 ± 0.44 a |
Publisher’s Note: MDPI stays neutral with regard to jurisdictional claims in published maps and institutional affiliations. |
© 2022 by the authors. Licensee MDPI, Basel, Switzerland. This article is an open access article distributed under the terms and conditions of the Creative Commons Attribution (CC BY) license (https://creativecommons.org/licenses/by/4.0/).
Share and Cite
Huang, D.; Liang, H.; Zhu, J.; Ren, M.; Ge, X. Dietary Protein Modifies Hepatic Glycolipid Metabolism, Intestinal Immune Response, and Resistance to Streptococcus agalactiae of Genetically Improved Farmed Tilapia (GIFT: Oreochromis niloticus) Exposed to High Temperature. Fishes 2022, 7, 202. https://doi.org/10.3390/fishes7040202
Huang D, Liang H, Zhu J, Ren M, Ge X. Dietary Protein Modifies Hepatic Glycolipid Metabolism, Intestinal Immune Response, and Resistance to Streptococcus agalactiae of Genetically Improved Farmed Tilapia (GIFT: Oreochromis niloticus) Exposed to High Temperature. Fishes. 2022; 7(4):202. https://doi.org/10.3390/fishes7040202
Chicago/Turabian StyleHuang, Dongyu, Hualiang Liang, Jian Zhu, Mingchun Ren, and Xianping Ge. 2022. "Dietary Protein Modifies Hepatic Glycolipid Metabolism, Intestinal Immune Response, and Resistance to Streptococcus agalactiae of Genetically Improved Farmed Tilapia (GIFT: Oreochromis niloticus) Exposed to High Temperature" Fishes 7, no. 4: 202. https://doi.org/10.3390/fishes7040202
APA StyleHuang, D., Liang, H., Zhu, J., Ren, M., & Ge, X. (2022). Dietary Protein Modifies Hepatic Glycolipid Metabolism, Intestinal Immune Response, and Resistance to Streptococcus agalactiae of Genetically Improved Farmed Tilapia (GIFT: Oreochromis niloticus) Exposed to High Temperature. Fishes, 7(4), 202. https://doi.org/10.3390/fishes7040202