Article

Acoustic Features of Rainbow Trout (Oncorhynchus mykiss) Ingesting Pelletized Feed
College of Fisheries and Life Science, Dalian Ocean University, Dalian 116023, China
*
Authors to whom correspondence should be addressed.
These authors contributed equally to this work.
Fishes 2026, 11(6), 355; https://doi.org/10.3390/fishes11060355
Submission received: 30 April 2026 / Revised: 3 June 2026 / Accepted: 11 June 2026 / Published: 15 June 2026
(This article belongs to the Special Issue Technology for Fish and Fishery Monitoring—2nd Edition)

Abstract

In this study, passive acoustic technology was used to obtain sound signals indicative of feeding in individual rainbow trout (Oncorhynchus mykiss). Feeding signals were separated from background signals to characterize their acoustic parameters, in order to quantify feeding activity. The audio and video data of rainbow trout during feeding were synchronized to determine the signal category and mark it, and the time-domain features and frequency-domain features of fish swallowing feed were extracted. This not only has important theoretical value for in-depth understanding of fish growth, reproduction, and other life activities, but also provides data support and technical recommendations for future research on this topic.
Key Contribution: This study employs passive acoustic technology to record feeding sound signals from individual rainbow trout, extract feeding signals from mixed signals, and identify acoustic parameters that characterize feeding activity in order to quantify feeding intensity. By simultaneously recording audio and video data during the feeding process, signal categories are identified and labeled, and both time-domain and frequency-domain features of feeding activity are extracted.

1. Introduction

Feeding behavior is a complex phenomenon encompassing various behavioral responses related to feeding, including feeding methods and habits, food detection mechanisms, feeding frequency, and feeding preferences [1]. Fish feeding behavior is often accompanied by the production of sounds. Currently, the following types of feeding sounds have been identified in fish: friction sounds produced by the rubbing of bony structures (teeth, skull, jaws, gills, fins, and vertebrae); drumming sounds generated by the vibration of the swim bladder; whistling sounds caused by the stretching of fins; and splashing sounds created by swimming [2]. In the Sparidae family, friction sounds are produced when fish grind and crush shellfish with their teeth during predation [2]. In seahorses (Hippocampus), the rapid return of the body to its straightened position after bending during feeding results in sounds caused by the friction of bones against one another [3]. During movement, the Asian catfish (Parasilurus asotus) produces sounds as its fins expand and retract against its body. In long-jawed catfish (Mormyr), the contraction and relaxation of vocal muscles cause rapid changes in swim bladder volume; that is, the vibration of the swim bladder can produce distinct sounds [4]. Therefore, through the quantitative analysis of the detected fish feeding sound signals, the feeding behavior of fish can be monitored to determine the feeding characteristics of fish [5].
Currently, the primary methods for accurately identifying feeding intensity in farmed fish populations are computer vision and passive acoustic techniques [6]. Computer vision has limited applicability due to factors such as water turbidity and the fish’s own behavioral patterns [7], whereas the development of acoustic monitoring technology has provided new tools for fish behavioral research in aquaculture. Using passive acoustic methods to detect fish feeding behavior does not affect the feeding environment or the fish’s behavior [8], and acoustic technology is stable; as water serves as a medium, it enables reliable long-distance information transmission and possesses strong anti-interference capabilities [9].
Passive acoustic technology can be used to monitor and identify the feeding sounds of fish [10]. Early studies indicate that more than 800 fish species worldwide have been found to be capable of producing sounds [11]. Based on a systematic review of 834 publications from 1874 to 2020, Looby et al. [12] reported that 989 fish species (belonging to 133 families and 33 orders) have been confirmed to produce active sounds, while the latest statistics from the FishSounds database indicate that the number of fish species currently classified as vocal has reached 1062. This acoustic data can be used to infer fish abundance, distribution, and behavioral characteristics [13]. Tricas et al. [14] noted that long-term monitoring of fish sounds can be used to infer their periodic reproductive activities and changes in population abundance; they found that the feeding sounds of some parrotfish (Amphilophus) and barracuda (Sphyraenus) occur in the 2–6 kHz frequency range, and these distinctive sounds serve as good indicators of feeding activity in herbivorous fish. Lagardère et al. [15] noted that feeding sounds from brown trout (Salmo trutta) and rainbow trout (Oncorhynchus mykiss) exhibit maximum energy in the 4–6 kHz frequency range, whereas those from turbot (Scophthalmus maximus) exhibit maximum energy in the 7–9 kHz frequency range. Additionally, a study of feeding sound signals from three turbot specimens of different weights demonstrated that turbot feeding sounds are clearly distinguishable from background noise above 5 kHz, and that feeding sound power is directly proportional to feeding activity, with the power of the feeding sounds gradually decreasing over time. Phillips et al. [16] used hydrophones to record the feeding sounds of rainbow trout and found that these sounds are generally accompanied by splashing and intense tail slapping, with frequencies reaching up to 16 kHz. Manikandan et al. [17] focused on poultry farming, employing multiple acoustic features to quantitatively describe animal sounds—such as cepstral features centered on Mel-scale Frequency Cepstral Coefficients—and summarizing statistical measures including mean, standard deviation, skewness, and kurtosis to form feature vectors suitable for supervised learning. It is evident that fish feeding behavior exhibits certain acoustic patterns, and by detecting their feeding sound signals, one can quantitatively describe fish feeding behavior.
This study focuses on individual rainbow trout. Using passive acoustic technology, it extracts time-domain and frequency-domain acoustic characteristics of their feeding behavior, including waveform features, short-time energy, short-time zero-crossings, power spectra, resonance peaks, and average Mel-scale Frequency Cepstral Coefficients (AMFCC), thereby achieving a preliminary quantification of rainbow trout feeding behavior. This study provides a data reference for the subsequent fusion analysis of acoustic and video data on the feeding behavior of rainbow trout populations, with the aim of providing foundational data support for aquaculture processes. Next, this paper will elaborate on the research background and current situation, the selection of experimental objects, the experimental equipment used, the experimental collection method, the data processing method, and the related analysis content.

2. Materials and Methods

2.1. Experimental Subjects

The experiment was conducted at the Fish Behavior Laboratory of Dalian Ocean University, CHN. The test subjects were landlocked rainbow trout, approximately 100 days old, all purchased from a cold-water fish aquaculture Qiyun cold-water fish farm in Liaoning Province, CHN. To ensure the fish remained as stable as possible, the fry were temporarily housed in circular fiberglass tanks. They were fed once daily at 8:00 a.m., with each feeding amounting to approximately 3–4% of their body weight. The feed consisted of sinking pellets with a diameter of 4–6 mm. Water was changed once daily, replacing half the volume each time. Water temperature and dissolved oxygen levels were monitored simultaneously; the water temperature was 15.3 ± 0.08 °C, and the dissolved oxygen level was 6.08 ± 0.09 mg/L. A total of 6 rainbow trout were selected for the experiment and placed in 6 circular experimental tanks with an average body length of 18.77 ± 0.32 cm. For the follow-up observation data, the individual length of rainbow trout is arranged as shown in Table 1 A1–A6.

2.2. Experimental Setup

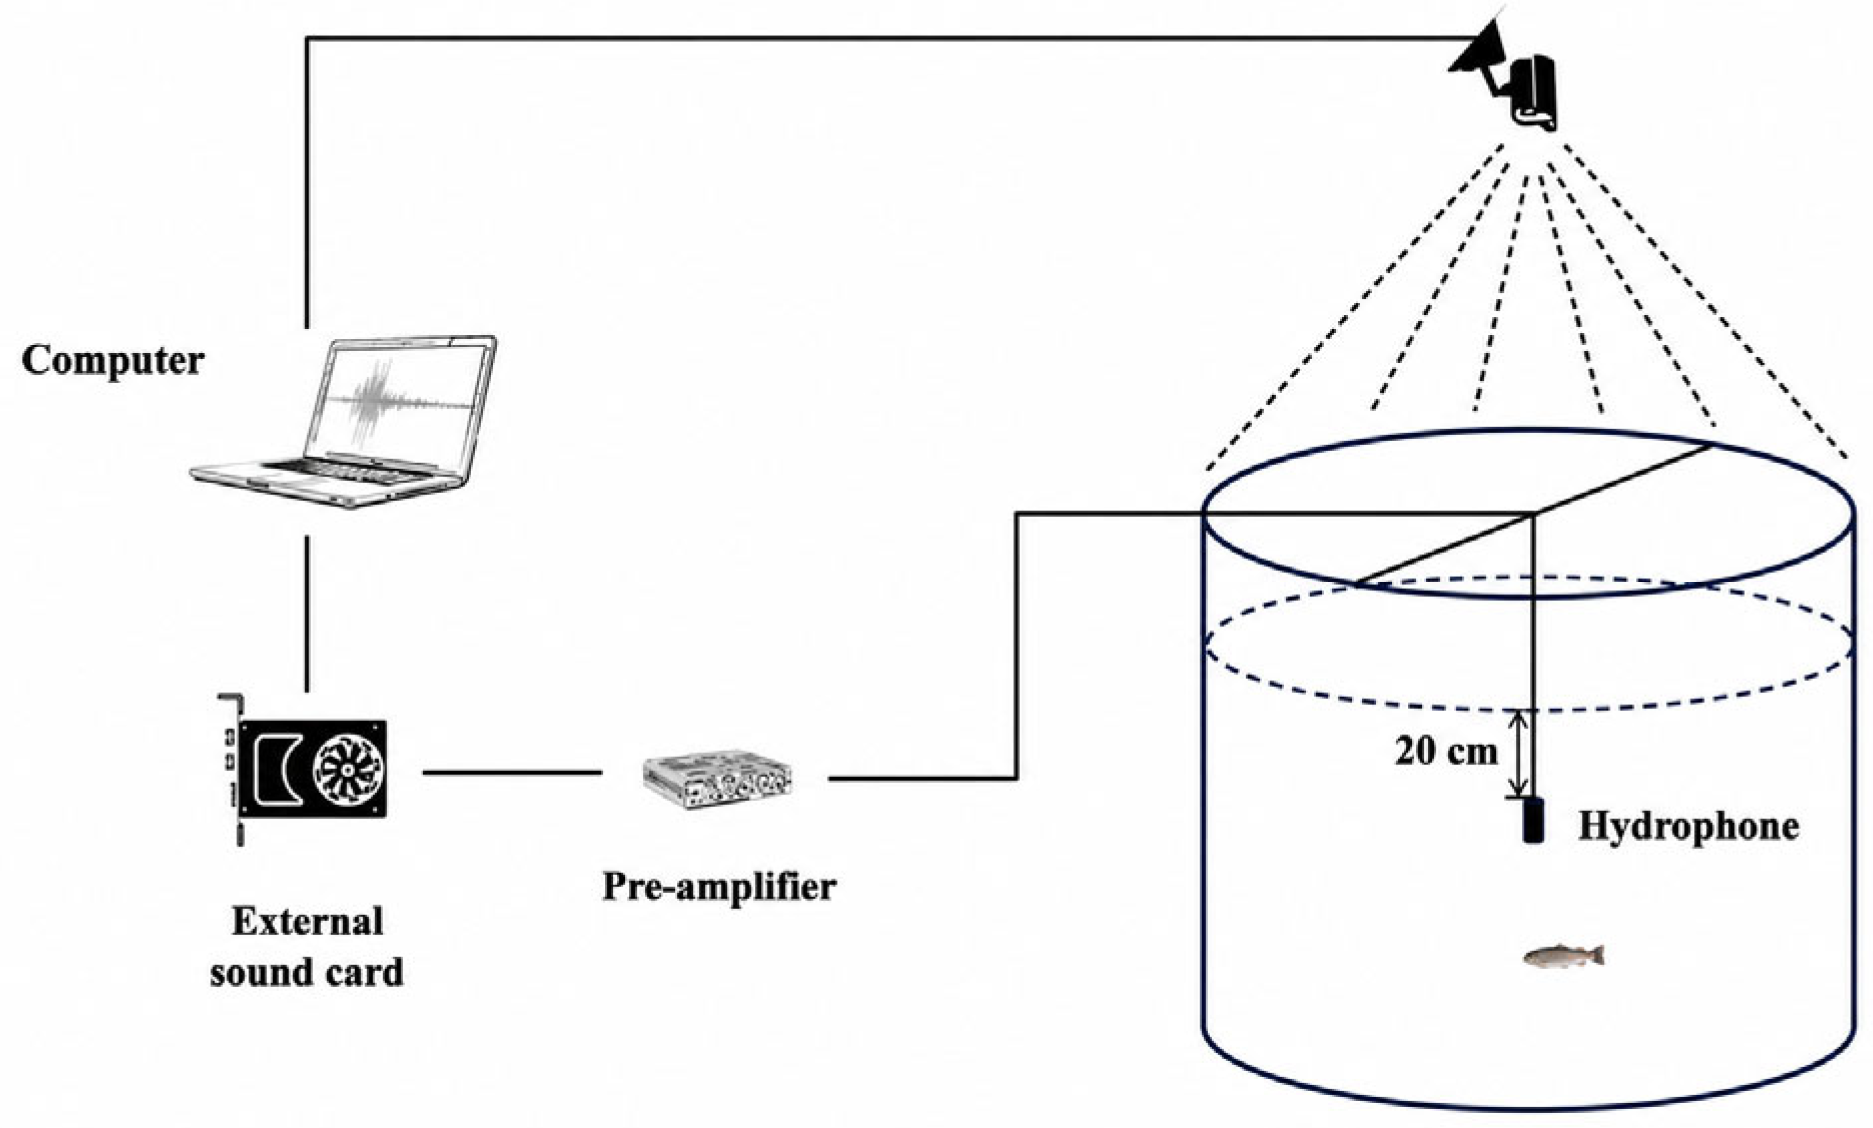
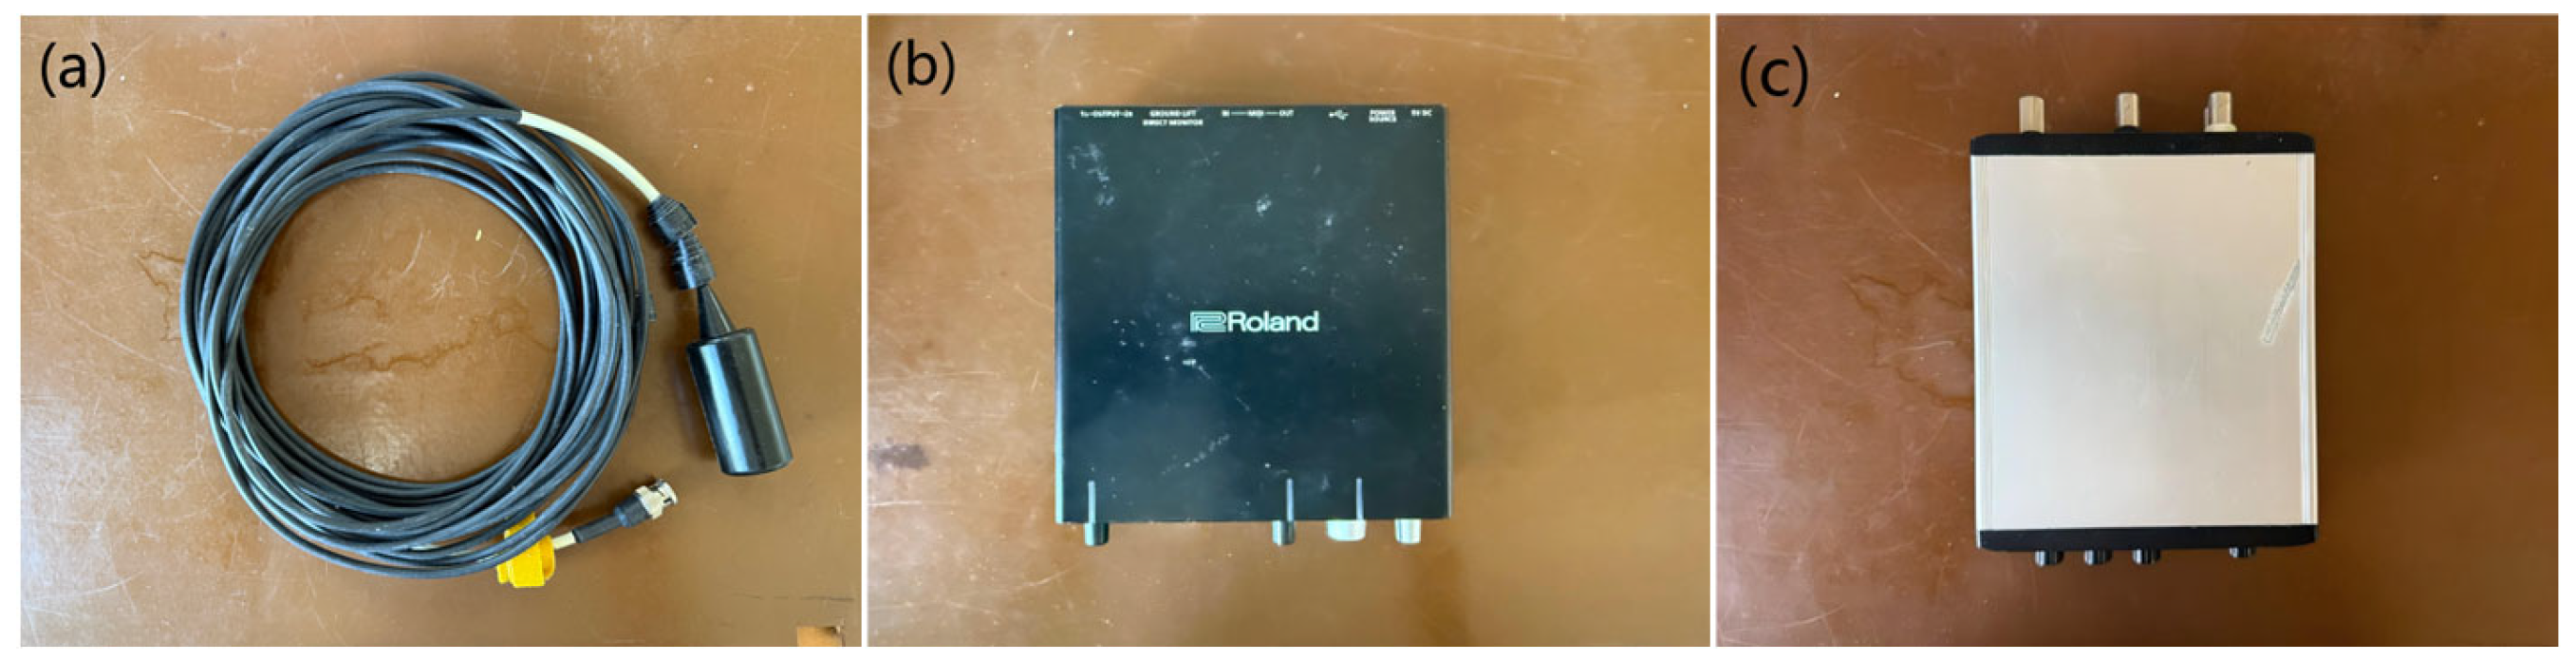
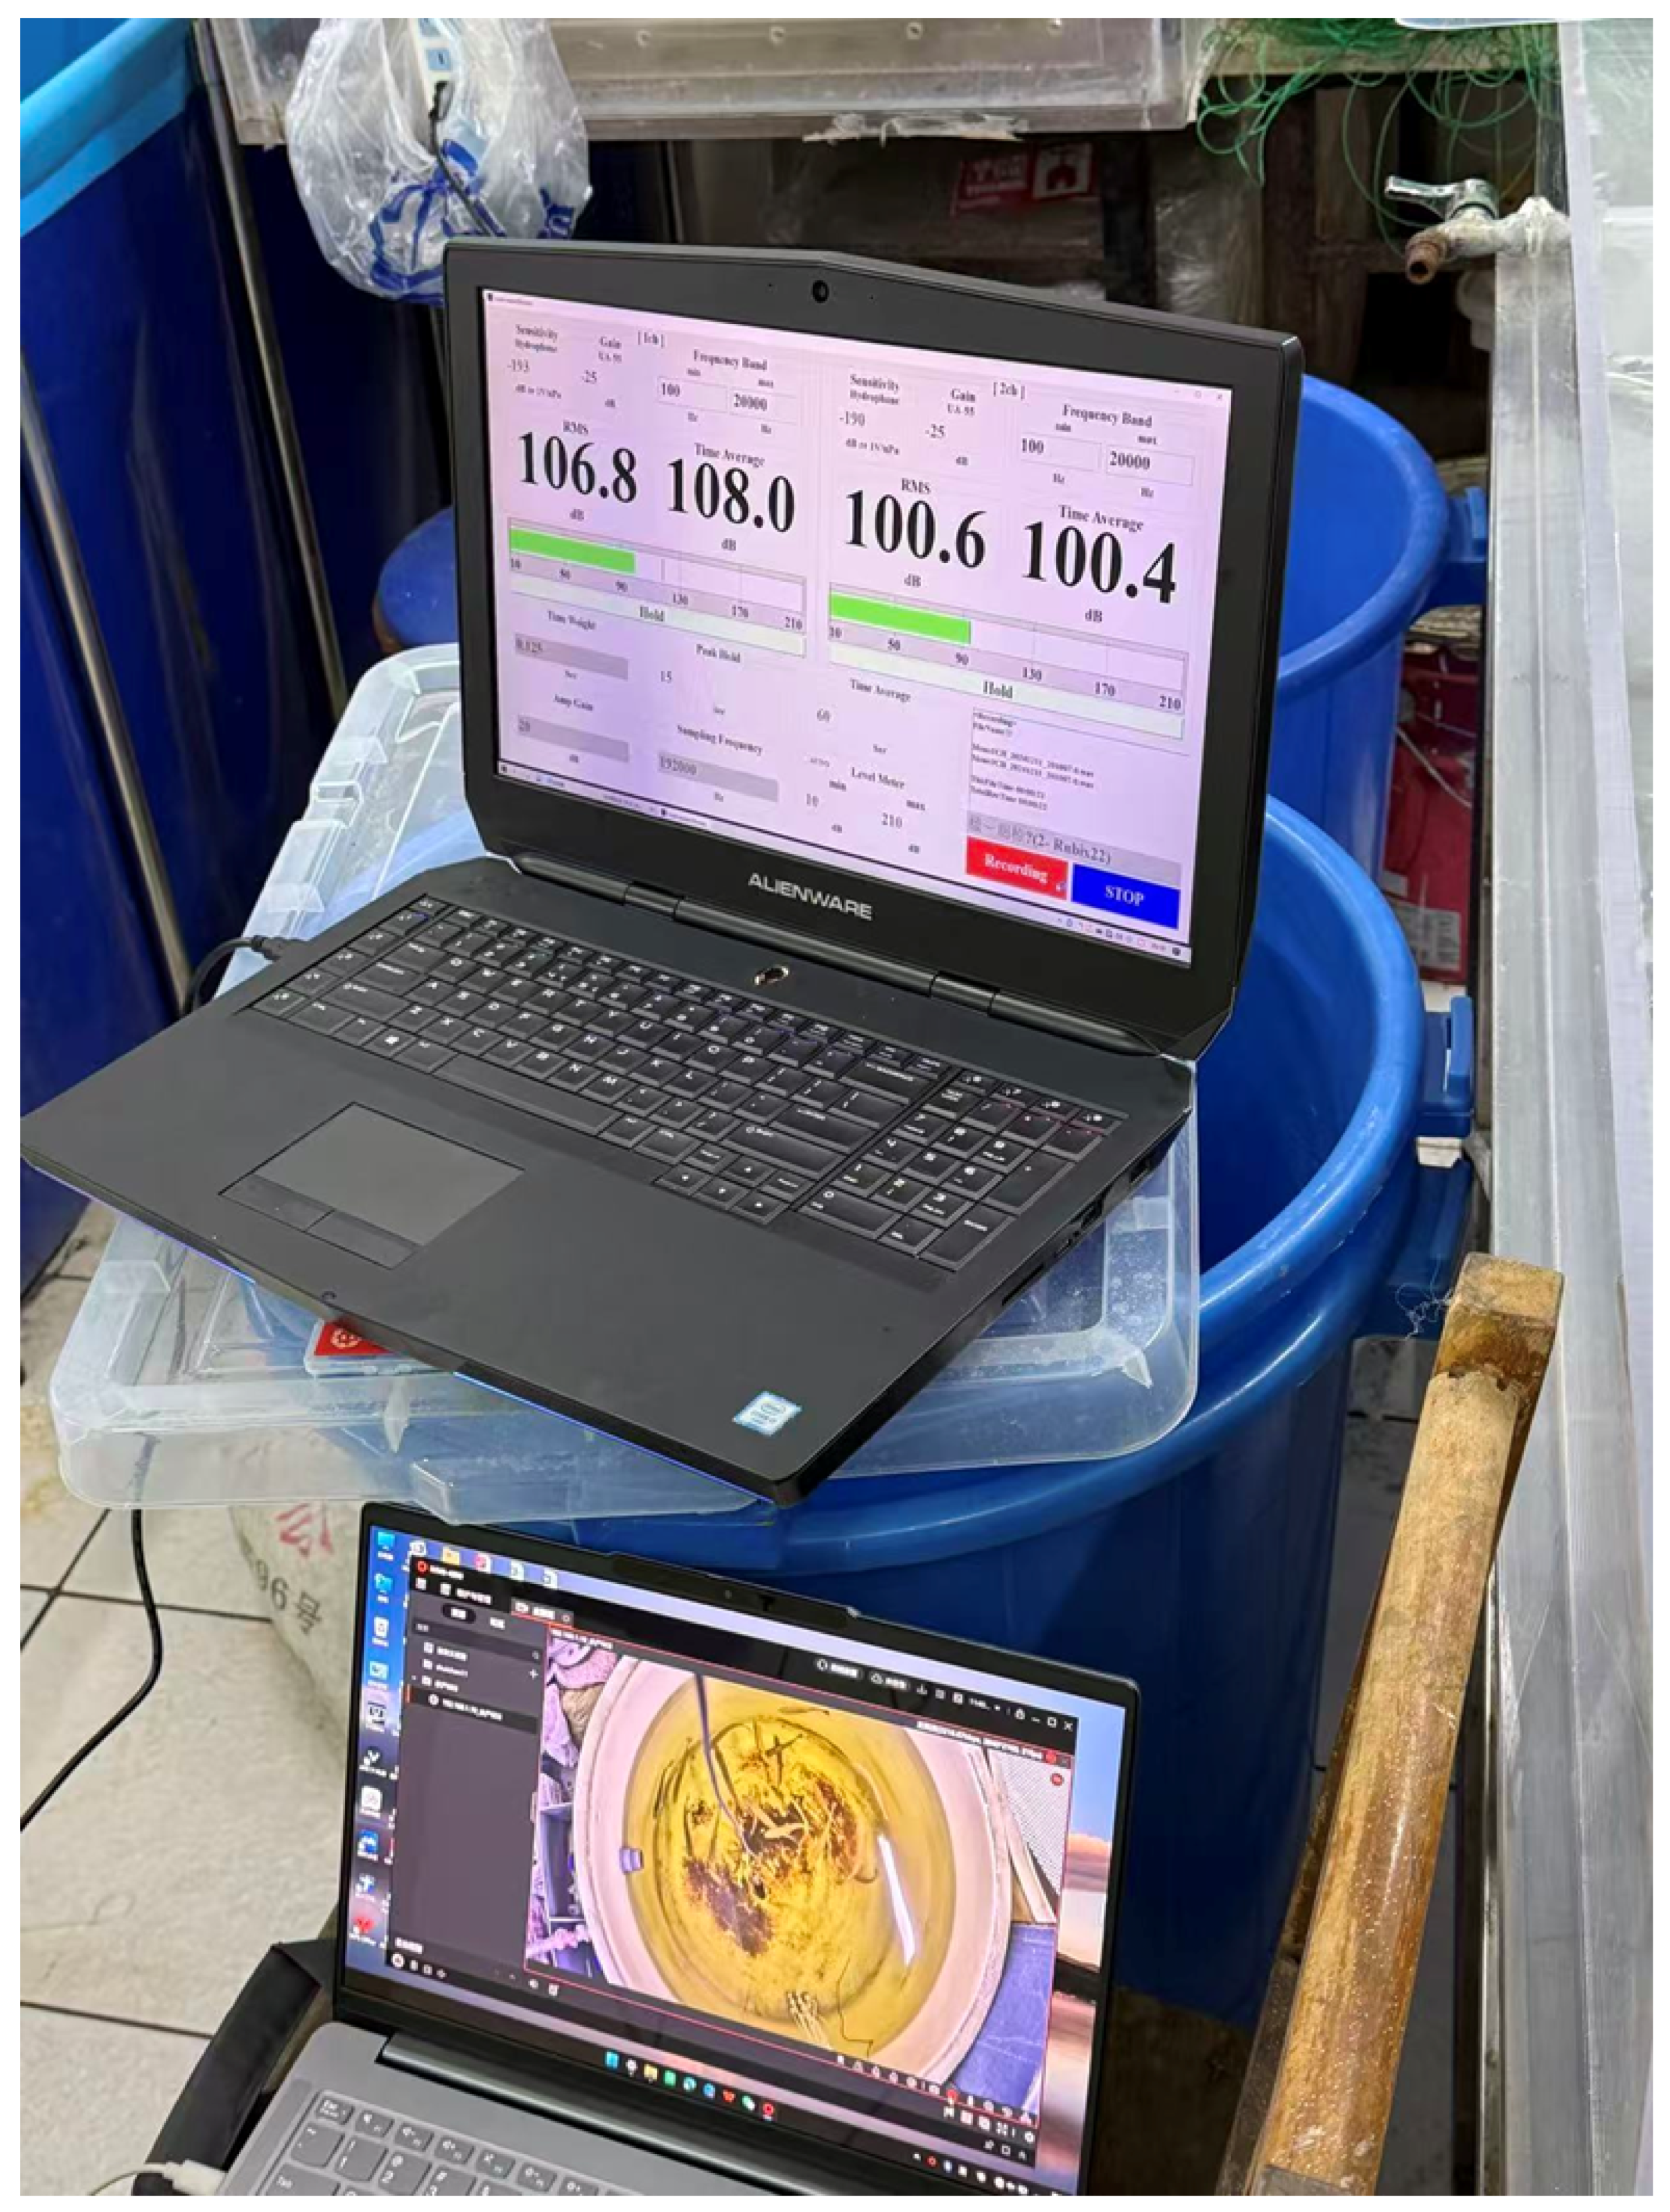
In this experiment, the feeding process of rainbow trout was recorded using a method of audio–visual synchronization, primarily consisting of a hydrophone, a preamplifier, an A/D converter, a camera, and a computer. Following the method described by Craven [18], the hydrophone was positioned 20 cm below the water surface to capture acoustic signals of the rainbow trout’s feeding behavior. The camera was mounted on a tripod above the experimental tank, with its angle adjusted to keep the subject centered in the frame while maintaining a constant height. A schematic diagram of the system setup is shown in Figure 1: Hydrophone: model AQH020k-1062, institute of Informatics, Kyoto University, Kyoto, Japan, frequency range of 20 Hz–20 kHz, and sensitivity of −190 dB re 1 V μPa; Analog-to-digital converter: model Roland QUAD-CAPTURE, Taiwan Lelan Enterprise Co., Ltd., Taipei, China, and maximum sampling rate of 96 kHz; and preamplifier: model Aquafeeler IV, institute of Informatics, Kyoto University, Kyoto, Japan, gain control range of 20–70 dB (in 10 dB steps), and input impedance of 1 MΩ; a photograph of the passive acoustic monitoring system is shown in Figure 2; Hikvision camera: model DS-2CD3T86FWDV3-I3S, Hangzhou Hikvision Digital Technology Co., Ltd., manufactured, Hangzhou, China, resolution of 1920 × 1080, image depth of 24 bits, and video frame rate: 20 fps, CHN; the experimental data acquisition site is shown in Figure 3.

2.3. Experimental Procedure

Before the experiment, the test individuals were transferred from the temporary pond to a test tank with a diameter of 1 m, a height of 0.9 m, and a water depth of 0.7 m for 7 days to adjust them to a normal feeding status. This experiment employed an audio–visual synchronization method to record the feeding process of rainbow trout. Feeding sound signals were recorded using the professional digital audio recording software UnderwaterSPmeter V2.0, with a sampling rate of 96 kHz, a sampling precision of 24 bits, a single channel, and a gain of 50 dB. The collected audio data was saved as .wav files on a computer, and the video was saved as .MP4 files. The feeding behavior of rainbow trout was monitored at 8:00 and 16:00 every morning. Before the experiment, the circulating water treatment system was closed, and the background noise in the tank was collected for two minutes. Six 2 min feeding audio and video files were collected from each experimental fish. Each audio file included at least 12 completed feeding processes. A total of 432 valid audio and video files were obtained.

2.4. Data Processing

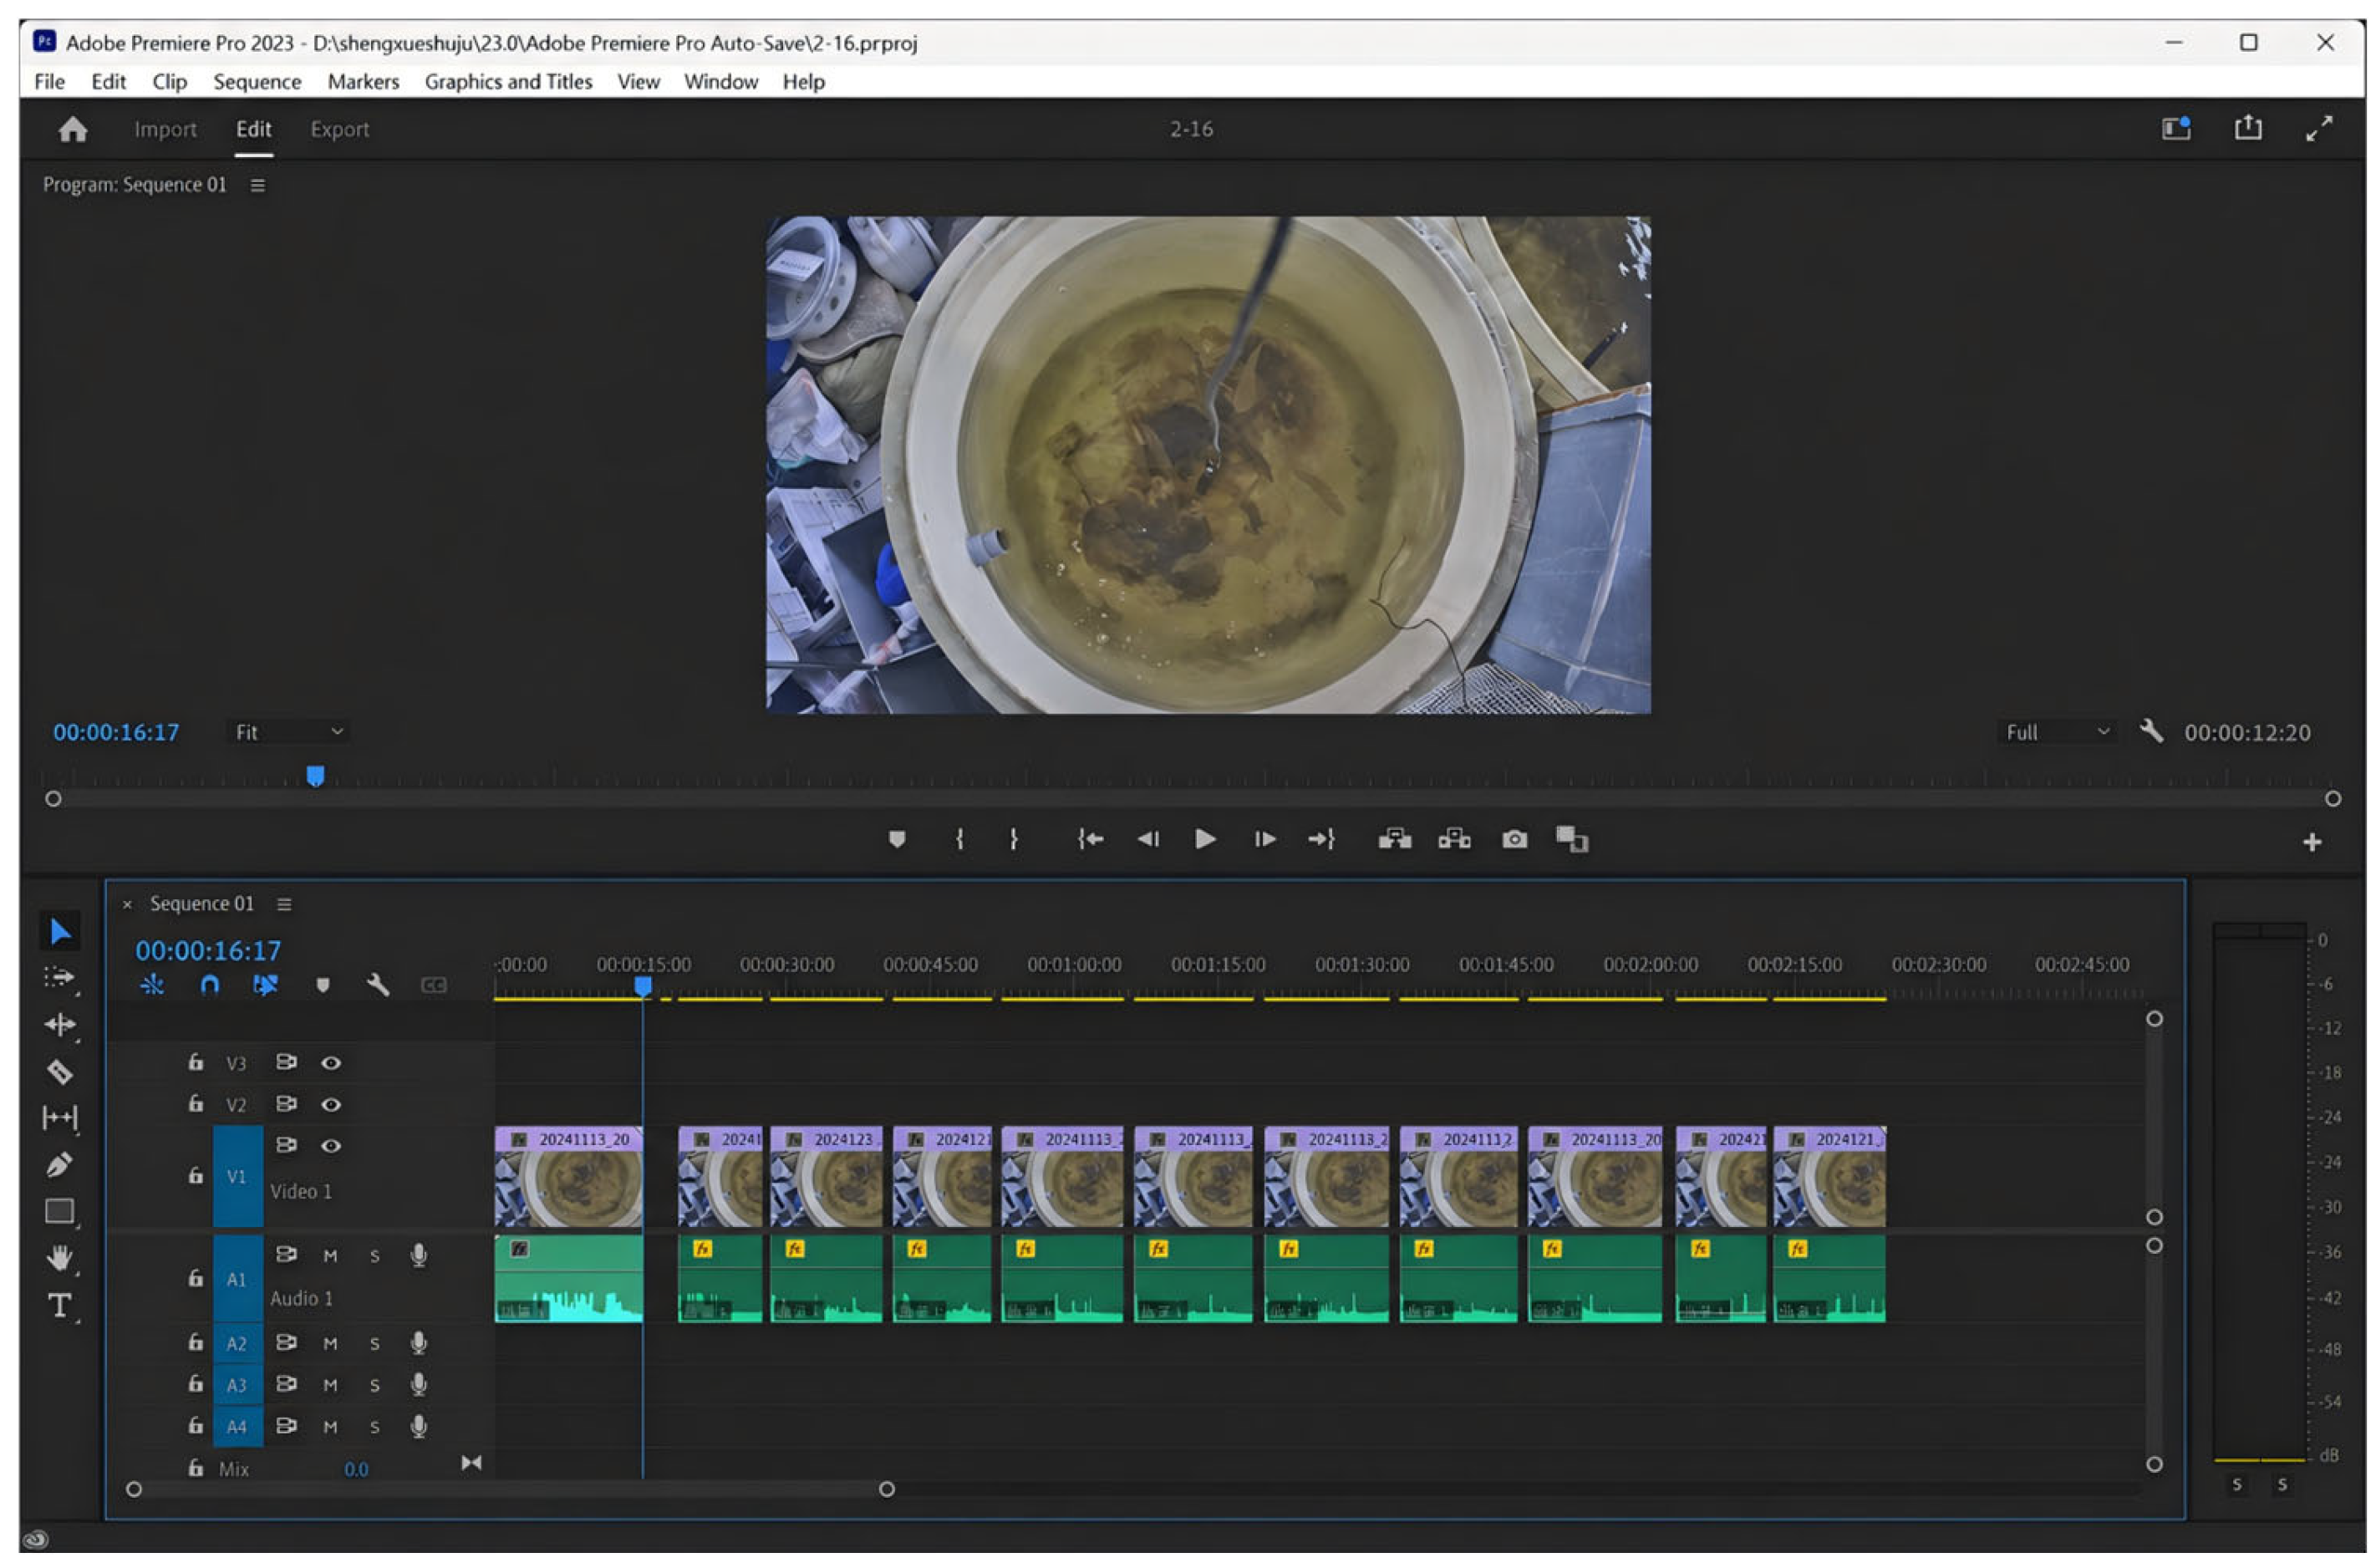
In this study, the audio and video synchronous recording method was used to strictly match the sound signal generated during the feeding process of rainbow trout with its corresponding video behavior. Adobe Premiere Pro 2023 was used to synchronize audio and video. Multi-track editing mode was used to arrange and align the video and audio tracks to ensure consistency of the time axis (Figure 4). Using the waveform characteristics of the sound signal and behavior of the rainbow trout in the video, feeding-related sound events were identified and defined. Audio clips were then marked in chronological order to complete the segmentation of the target audio for analysis.
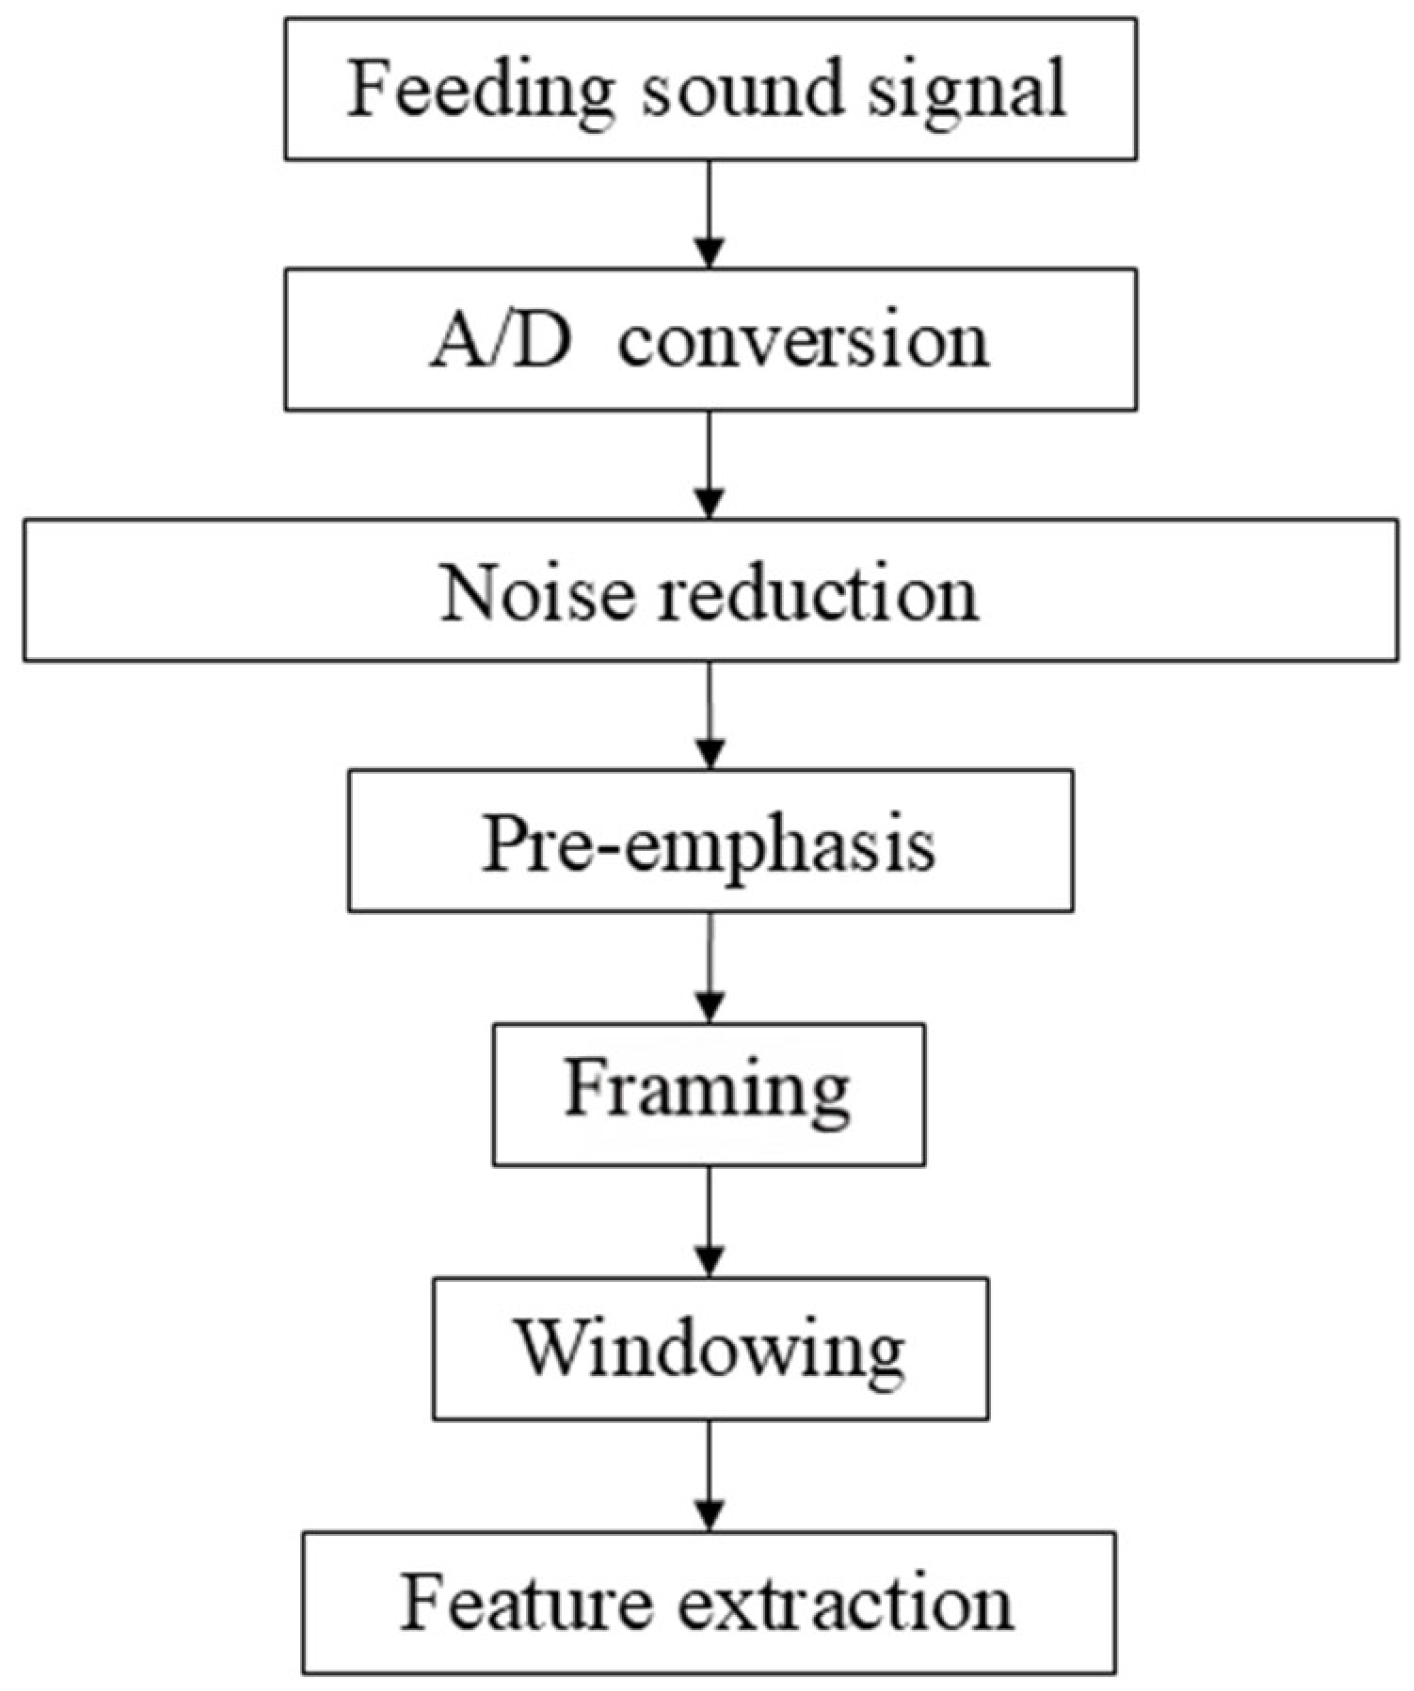
The preprocessing steps for feeding sound signals are shown in Figure 5. Prior to feature extraction, the sound signals must undergo preprocessing, which includes analog-to-digital (A/D) conversion, noise reduction, pre-emphasis, framing, and windowing. A/D conversion, also known as digitization, facilitates more convenient and accurate analysis and processing of sound signals. In this study, a Roland QUAD-CAPTURE sound card was used for this purpose. Noise reduction enables the feeding sound signal to be extracted more clearly from the mixed signal. Analysis of the spectrogram reveals that the frequency range with the most significant background noise interference is primarily concentrated between 1 and 1000 Hz, showing a distinct segmentation from the frequency range of the feeding sound signal. This study employs a subspace speech-enhancement algorithm. Through spatial decomposition, the entire acoustic signal is split into a noise subspace and a signal subspace containing the feeding sound. The noise subspace is removed, and an optimal estimator is used to estimate the eigenvalues of the feeding signal, thereby achieving signal enhancement.
Pre-emphasis was used to prevent the attenuation of high-frequency components in the feeding signal. In this study, a pre-emphasis filter was used to enhance the high-frequency portion; the pre-emphasis coefficient was typically set between 0.9 and 1.0, and in this study, 0.97 was selected based on empirical values. Rainbow trout feeding sound signals were similar to speech signals in that they exhibited short-term stationarity. Framing processing was applied to extract short-term characteristics. To reduce discontinuity between frames, the Hamming window [18] was selected. Based on the characteristics of the feeding sound signals, a frame length of 25 ms and a frame shift of 10 ms were chosen. All acoustic signal preprocessing was performed using MATLAB R2023b.
In the time-domain feature analysis, Pearson correlation was primarily employed to analyze the correlation between feature parameters and feeding sequences, and the Least Significant Difference method was used for one-way multiple significance analysis. For spectral analysis, to identify peaks in the rainbow trout feeding acoustic signals, power spectrum and one-third octave band analyses were performed using AQLevelMeter 1607 software. For formant analysis, the extracted rainbow trout feeding segments were analyzed using Praat software (2020, V6.1, Paul Boersma and David Weenink) to perform formant analysis, thereby conducting a quantitative analysis of individual acoustic characteristics from a formant perspective.
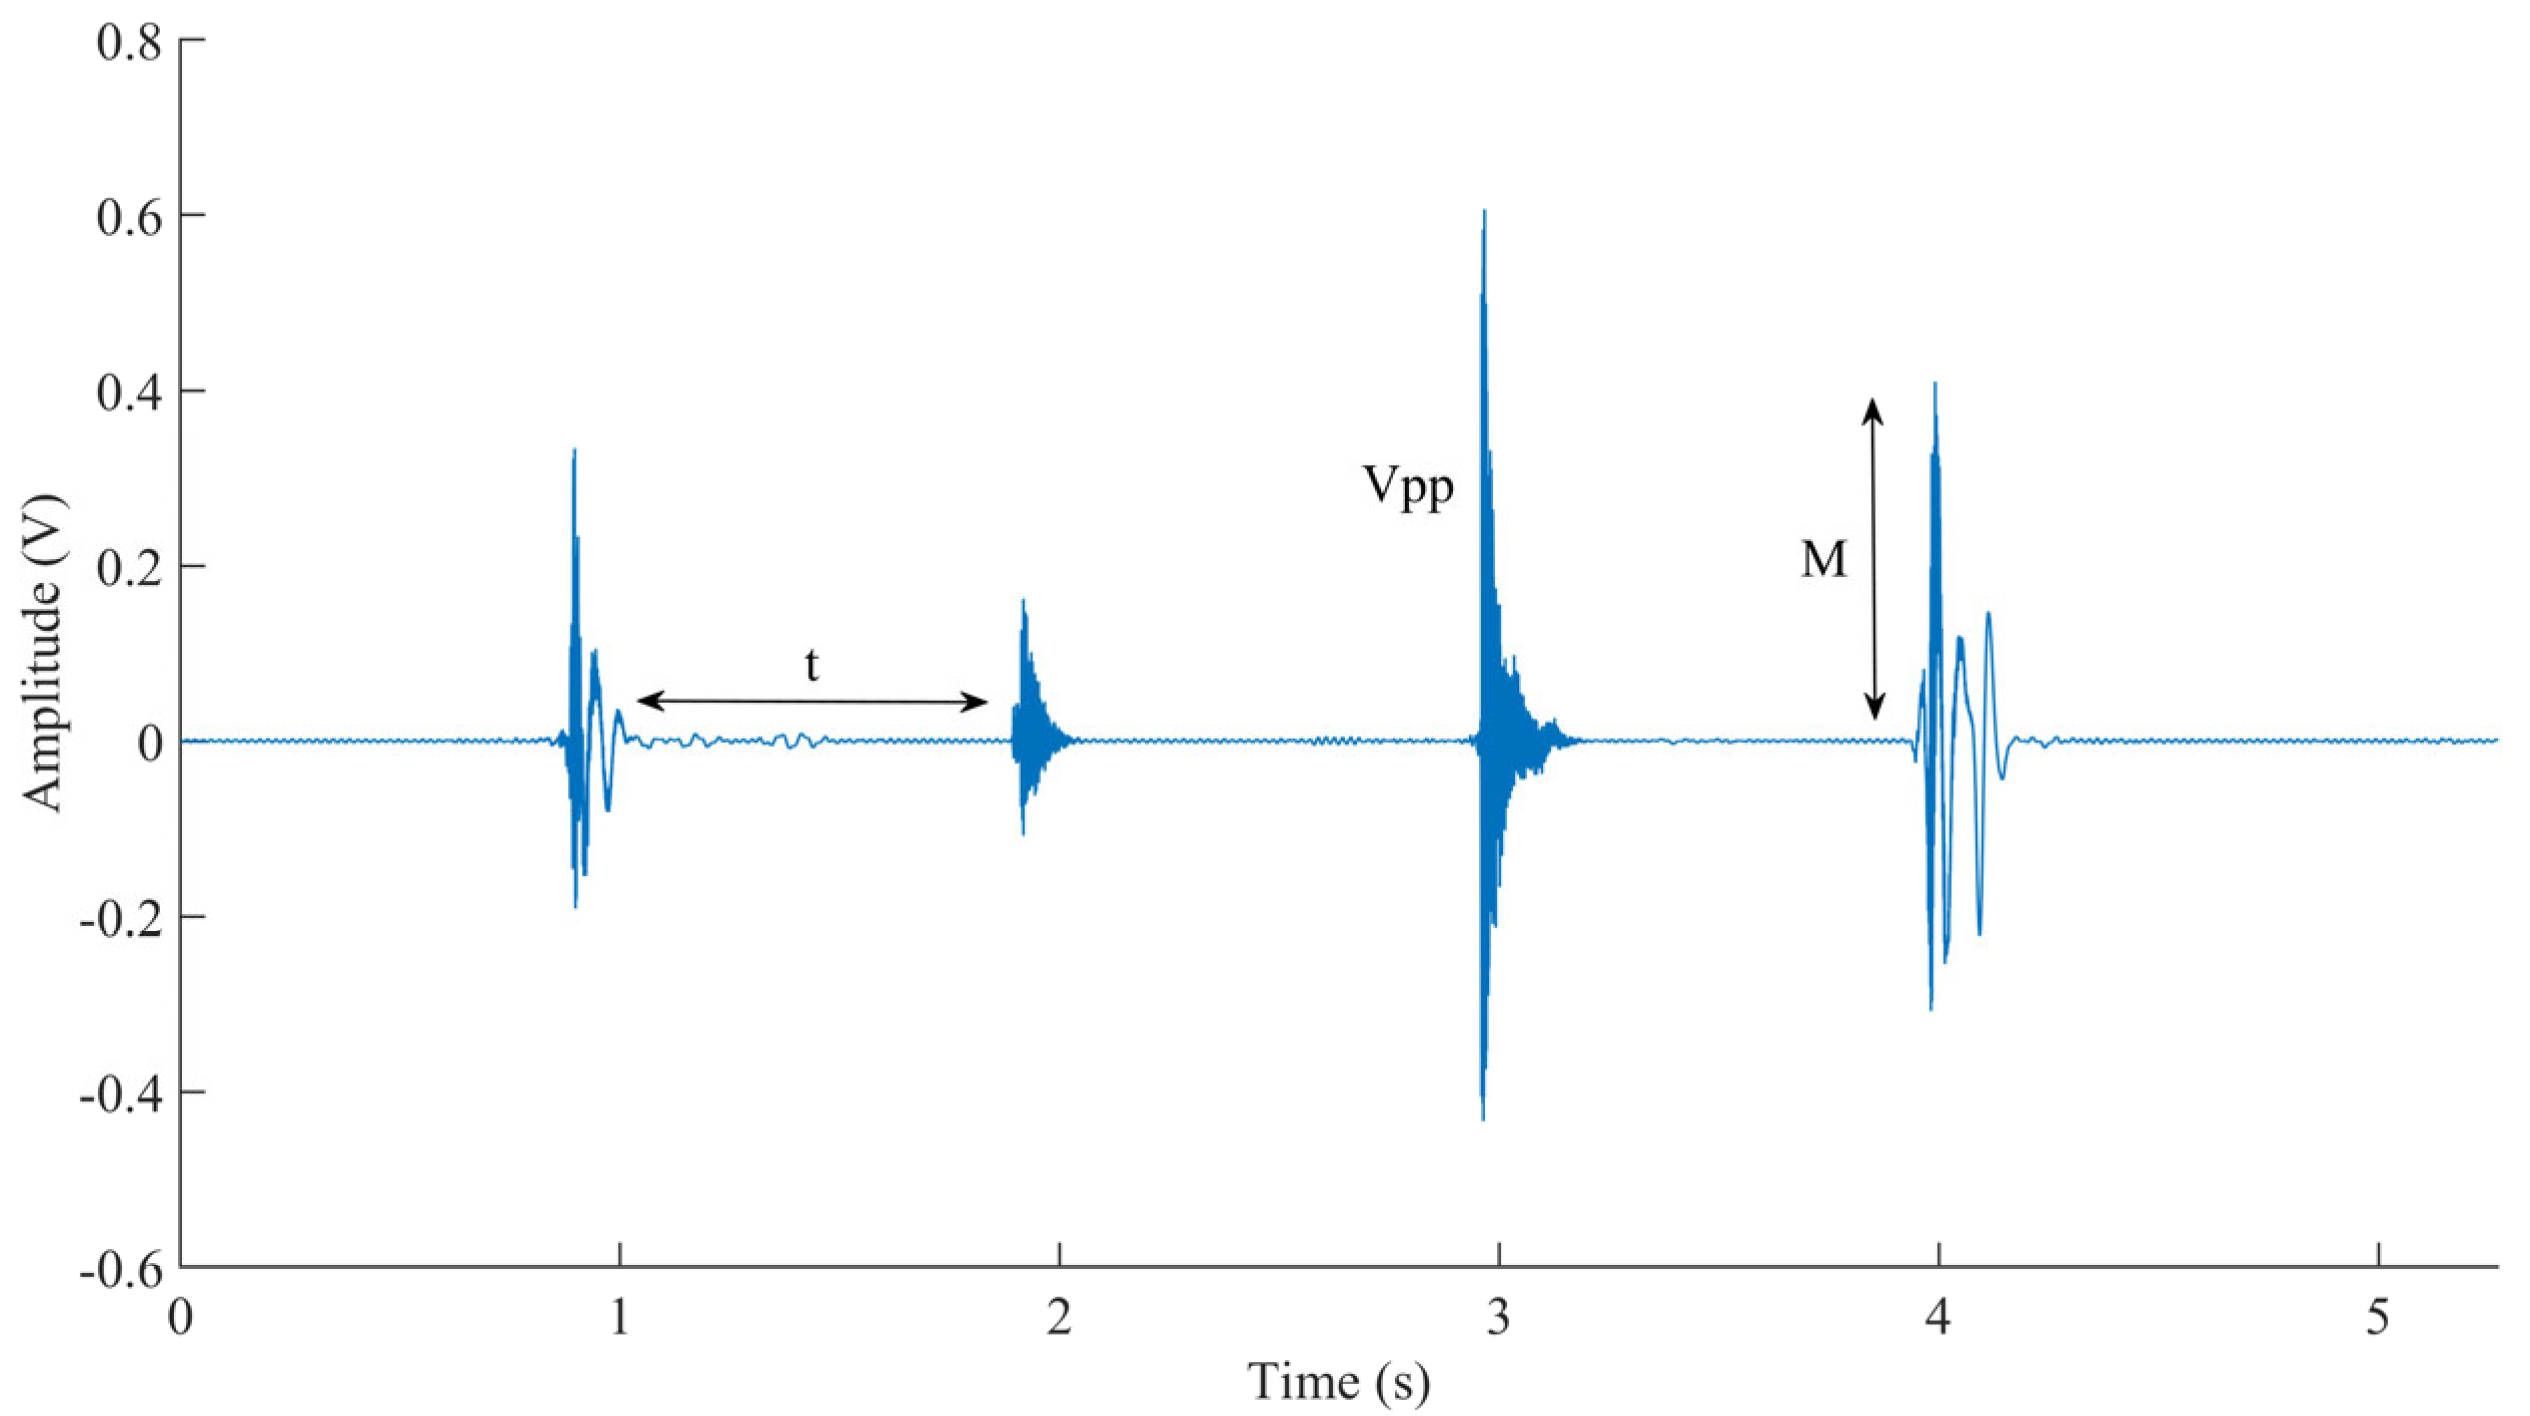
Acoustic signals are inherently time-domain signals; from a complete feeding acoustic signal, one can extract the swallowing interval, amplitude range, and peak amplitude. The swallowing interval reflects the time difference between two consecutive swallows of pellet feed, as indicated by t in Figure 6; the amplitude range is the difference between the maximum and minimum signal amplitudes during a single swallowing event, i.e., the peak-to-peak voltage, as indicated by Vpp in Figure 6; the maximum amplitude refers to the highest peak value of the amplitude signal during each swallowing event, as indicated by M in Figure 6.
Short-term energy is used to characterize the amplitude variation in an audio signal in the time domain. It reflects the trend of energy evolution over time for each frame, and its variation pattern generally aligns with that of the original waveform; therefore, it is often used to distinguish between voiced and unvoiced segments [19,20]. Let the original time-domain signal be x ( m ) , and the signal of the i -th frame after framing be x i ( m ) . Then, the expression for short-term energy is:
x i   =   x [ ( i     1 ) · inc   +   n ] · ω ( n ) , 1     n L , 1     i     f n
In Equation (1), inc represents the frame shift length, n : the number of sampling points in the current frame, ω ( n ) represents the Hanning window function, L denotes the sampling length of each frame, and f n is the total number of frames after framing. Let E i denote the short-term energy of the i -th frame; its calculation formula is:
E i = m = 0 L 1 x i 2 ( m )
The short-term zero-crossing rate counts the number of times the signal waveform crosses the zero level within a frame. This parameter is related to the signal frequency and is commonly used to determine the start and end positions of the audio band [21,22]. Let Z i denote the short-term zero-crossing rate of the signal in the i-th frame; it is calculated as follows:
Z i = m = 1 L 1 | sgn [ x i ( m ) ] sgn [ x i ( m 1 ) ] |
In Equation (3), sgn [ ] denotes the sign function.
Power spectral density (PSD) is used to describe the distribution of signal power across frequencies and effectively reflects the distribution characteristics of signal energy in the frequency domain. This study employs the Welch estimation algorithm based on the modified periodogram method to calculate the power spectral density. This technique involves segmenting the data and applying a window function, which reduces the variance of the spectral estimate and suppresses spectral leakage while maintaining a certain level of frequency resolution [23]. The specific calculation steps are as follows.
Divide the data sequence x(n) of length N into L segments, each of length M , such that N = L · M . Set a 50% overlap rate between adjacent segments; thus, the data in the i -th segment can be expressed as:
x i ( n ) = x ( n + ( i 1 ) M 2 ) , 0 n M ,   1 i L
Apply the window function ω ( n ) to each data segment, perform the Fourier transform, and compute its power spectrum. The power spectrum estimate for the   i -th segment is:
I i ( w ) = 1 U | n = 0 M 1 x i ( n ) ω ( n ) e j ω n | 2 , i = 1 , 2 M 1
where U is the normalization factor, defined as:
U = 1 M N = 0 M     1 ω 2 ( n )
Assuming that the power spectra of each segment are independent of one another, the final power spectrum estimate is obtained by averaging over all segments:
P xx ( e   j ω ) = 1 L i = 1 L I i ( ω )
Resonance peaks refer to frequency bands in the sound spectrum where energy is relatively concentrated; they are not only a key determinant of sound quality but also reflect, to a certain extent, the physical characteristics of the vocal tract [24]. Resonance peak parameters typically include the center frequency and bandwidth; the characteristics of resonance peaks in vocal signals often vary significantly under different conditions [25]. Common methods for extracting formant parameters primarily include the bandpass filter bank method, cepstral analysis, and linear predictive coding. The fundamental principle of linear predictive analysis lies in modeling the combined effects of glottal excitation, vocal tract modulation, and lip-end radiation using a single time-varying digital filter. The system function H ( Z ) of this model can be expressed as:
H ( z ) = G 1 i = 1 p a i z i H ( z ) = G 1 i = 1 p a i Z i
where p is the order of the model, G is the gain factor, and a i are the linear prediction coefficients. Equation (9) describes a   p -order linear prediction model of the all-pole type. Let:
z i = exp ( j 2 π if f s )
The corresponding power spectrum expression can be further derived as:
P (   f   ) = | H   (   f   ) | 2 = G 2 | 1 i = 1 P a i exp ( 2 π ijf   f s ) 2 |
Mel-Frequency Cepstral Coefficients (MFCC) are cepstral parameters extracted in the Mel-scale frequency domain, which focuses more on the auditory mechanism of the human ear [26]. Fourier transformation, triangular Mel filter, and discrete cosine transformation were performed on each frame to obtain Mel cepstral coefficients ( C i ) , while the Average Mel-Frequency Cepstral Coefficient (AMFCC) is the average value ( M i ) of the cepstral coefficients ( C i ) of all frames, that is:
M i = 1 T t = 1 T C i ( t )
Among them, i = 1, 2, …, 12; C i ( t ) denotes the i -th cepstral coefficient of the t -th frame, and T is the number of swallowed signal frames.

3. Results

3.1. Time-Domain Features

Based on the analysis of time-domain characteristics, this study explored the correlation between the three parameters of amplitude range, amplitude maximum, and swallowing interval and the order of swallowing. The correlation coefficients were statistically analyzed, and the results were summarized in Table 2. The amplitude range between different rainbow trout individuals was negatively correlated with the order of swallowing; the correlation coefficient of the six test samples was less than −0.62, and there was no significant difference (p = 0.193). The maximum amplitude was negatively correlated with the order of swallowing, and the correlation coefficient of the six test samples was less than −0.63; there was no significant difference (p = 0.2940). The swallowing interval was positively correlated with the swallowing order, and the correlation coefficient of the six test samples was greater than 0.68, showing a significant positive correlation (p = 0.0016). Among the three time-domain features, the correlation between the swallowing interval and the swallowing order was the most significant, and the correlation coefficient was greater than 0.68, showing a significant positive correlation. Among them, the correlation coefficient of individual A6 was slightly higher than that of other individuals, but the difference did not affect the overall conclusion. In summary, the swallowing order of the test individuals was negatively correlated with the amplitude range and the maximum amplitude, and positively correlated with the swallowing interval.

3.2. Short-Time Features

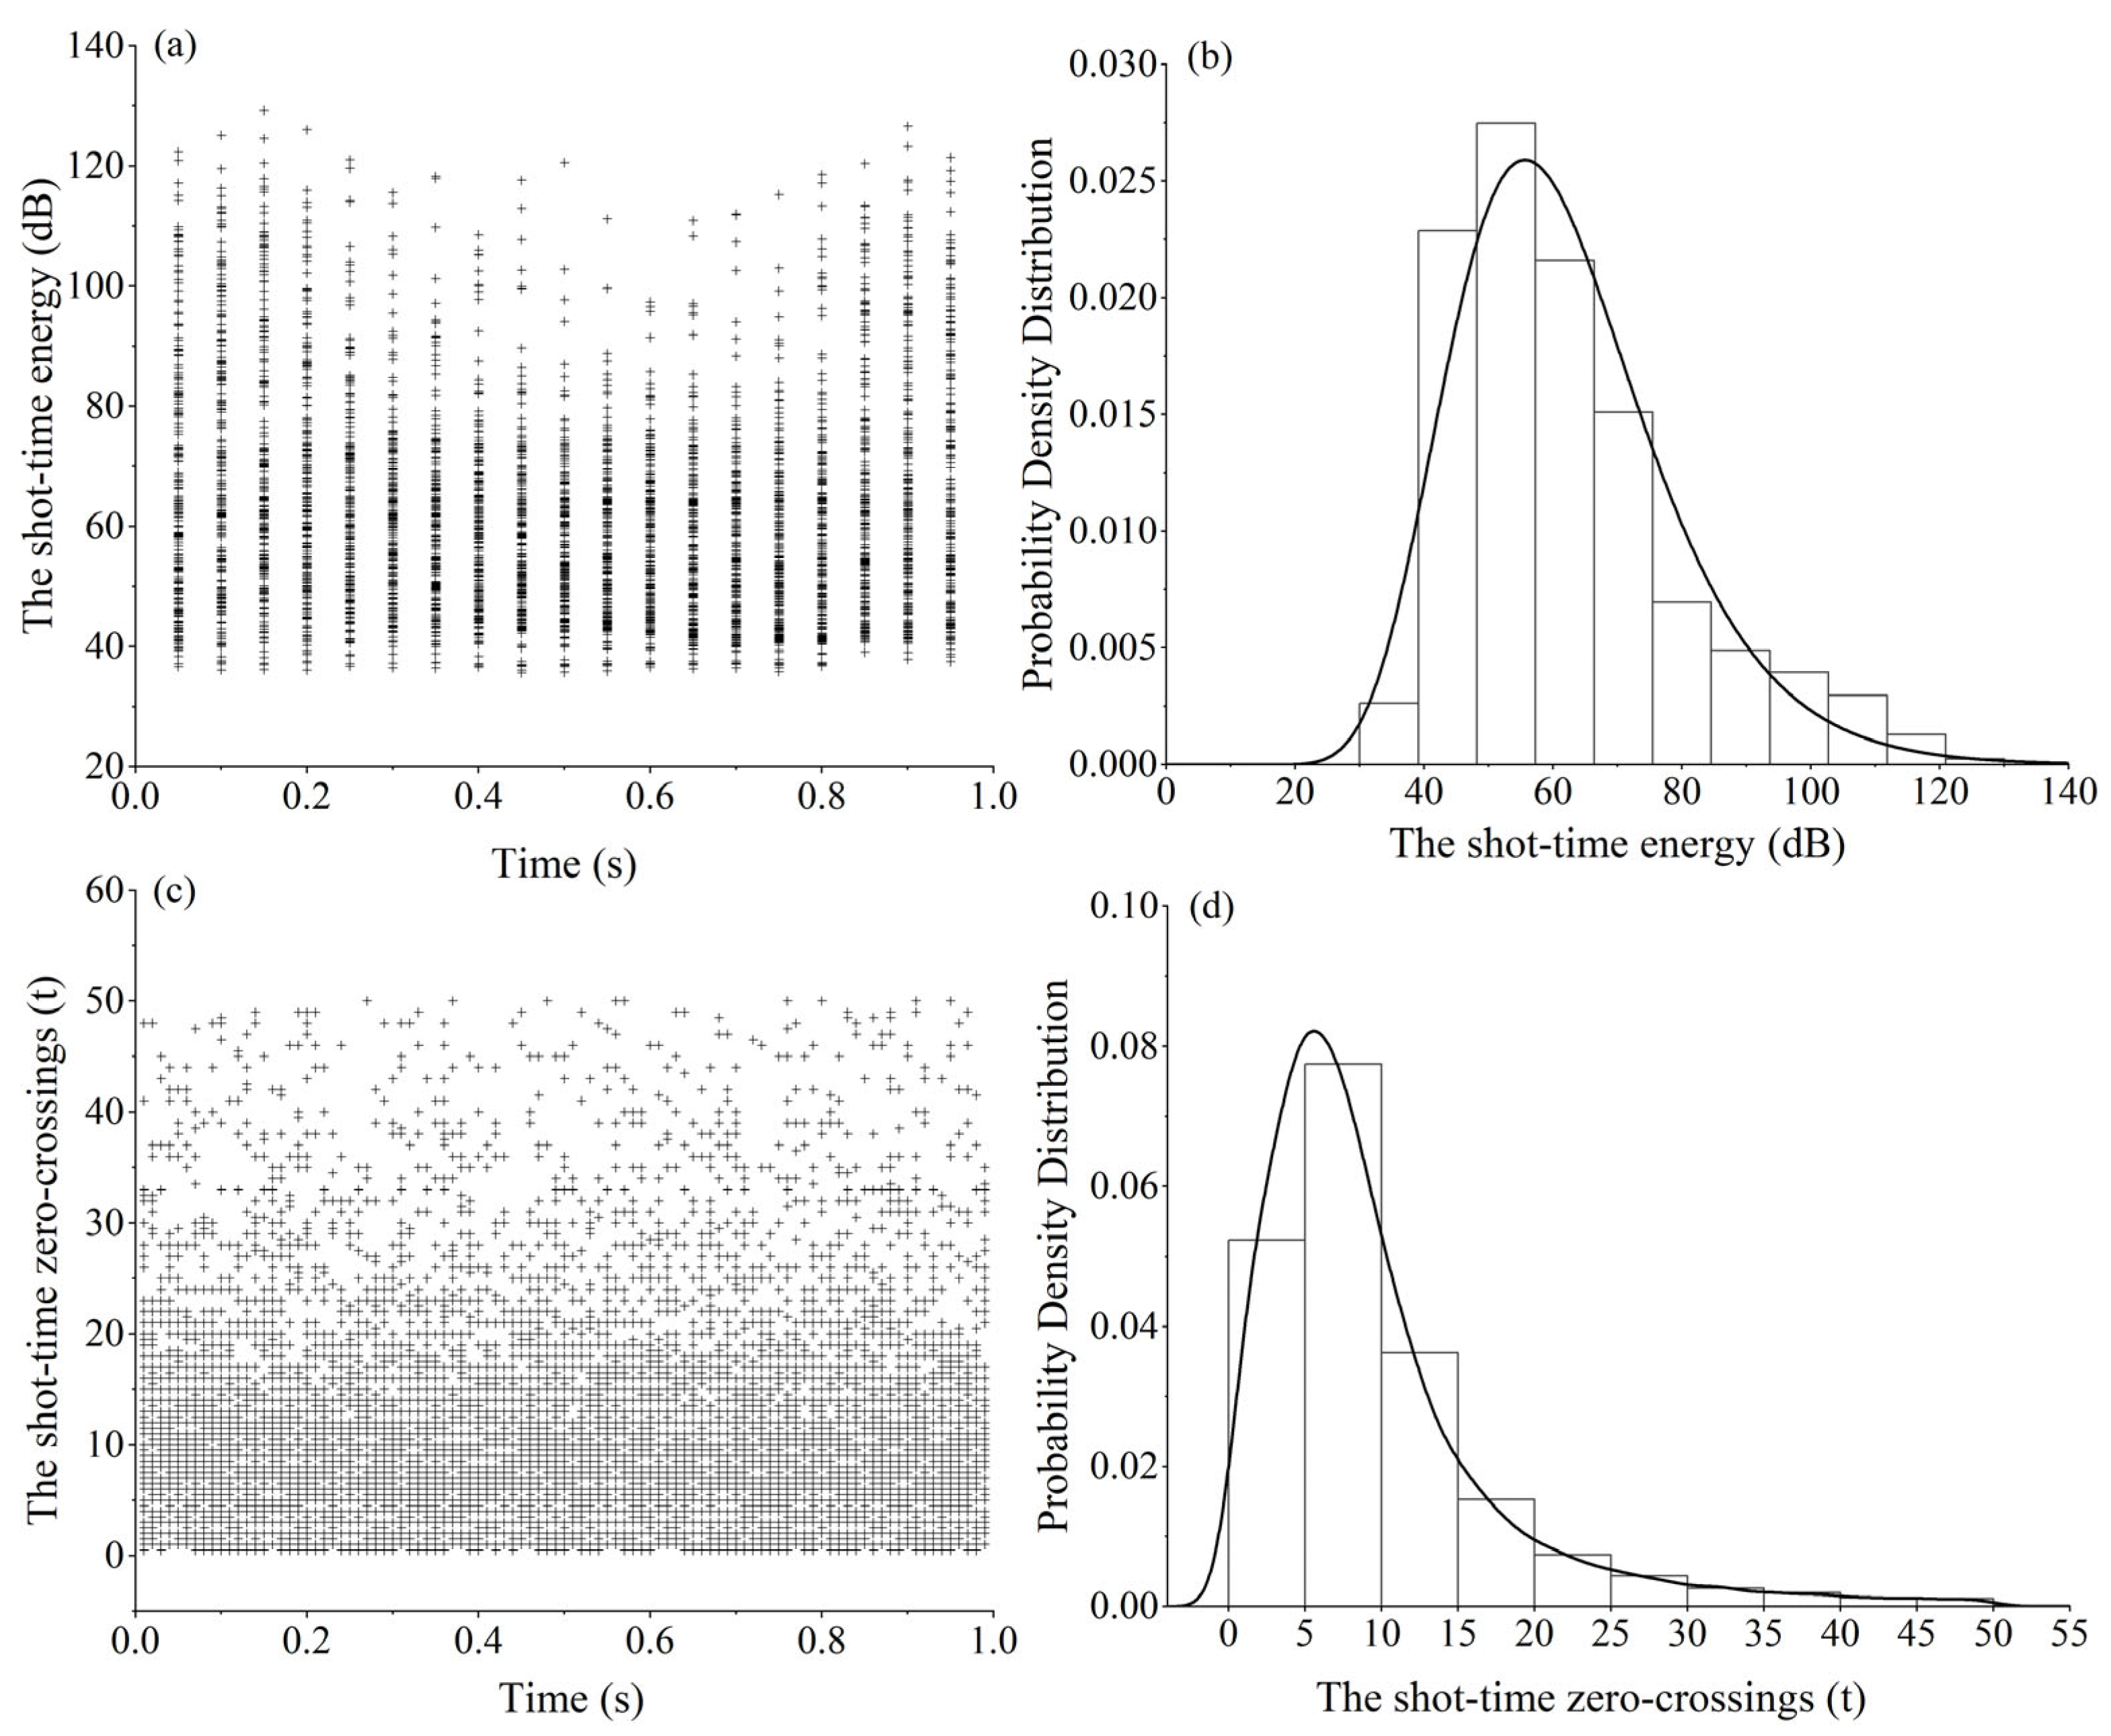
To accurately analyze the short-term characteristics of the feeding behavior of rainbow trout, this study randomly selected thirty-six feeding sound data points from each of the six test fish, and counted the short-term energy and short-term zero-crossing rate of each 0.05 s during each feeding process. The scatter plot and density distribution map are shown in Figure 7. The short-term energy distribution of rainbow trout feeding sound signals ranges from 35 to 130 dB, with the highest concentration in the 40–72 dB range, as shown in Figure 7a,b; the overall range of short-term zero-crossing rates is 0–50 t, with the majority concentrated in the 0–15 t range, as shown in Figure 7c,d.

3.3. Power Spectrum

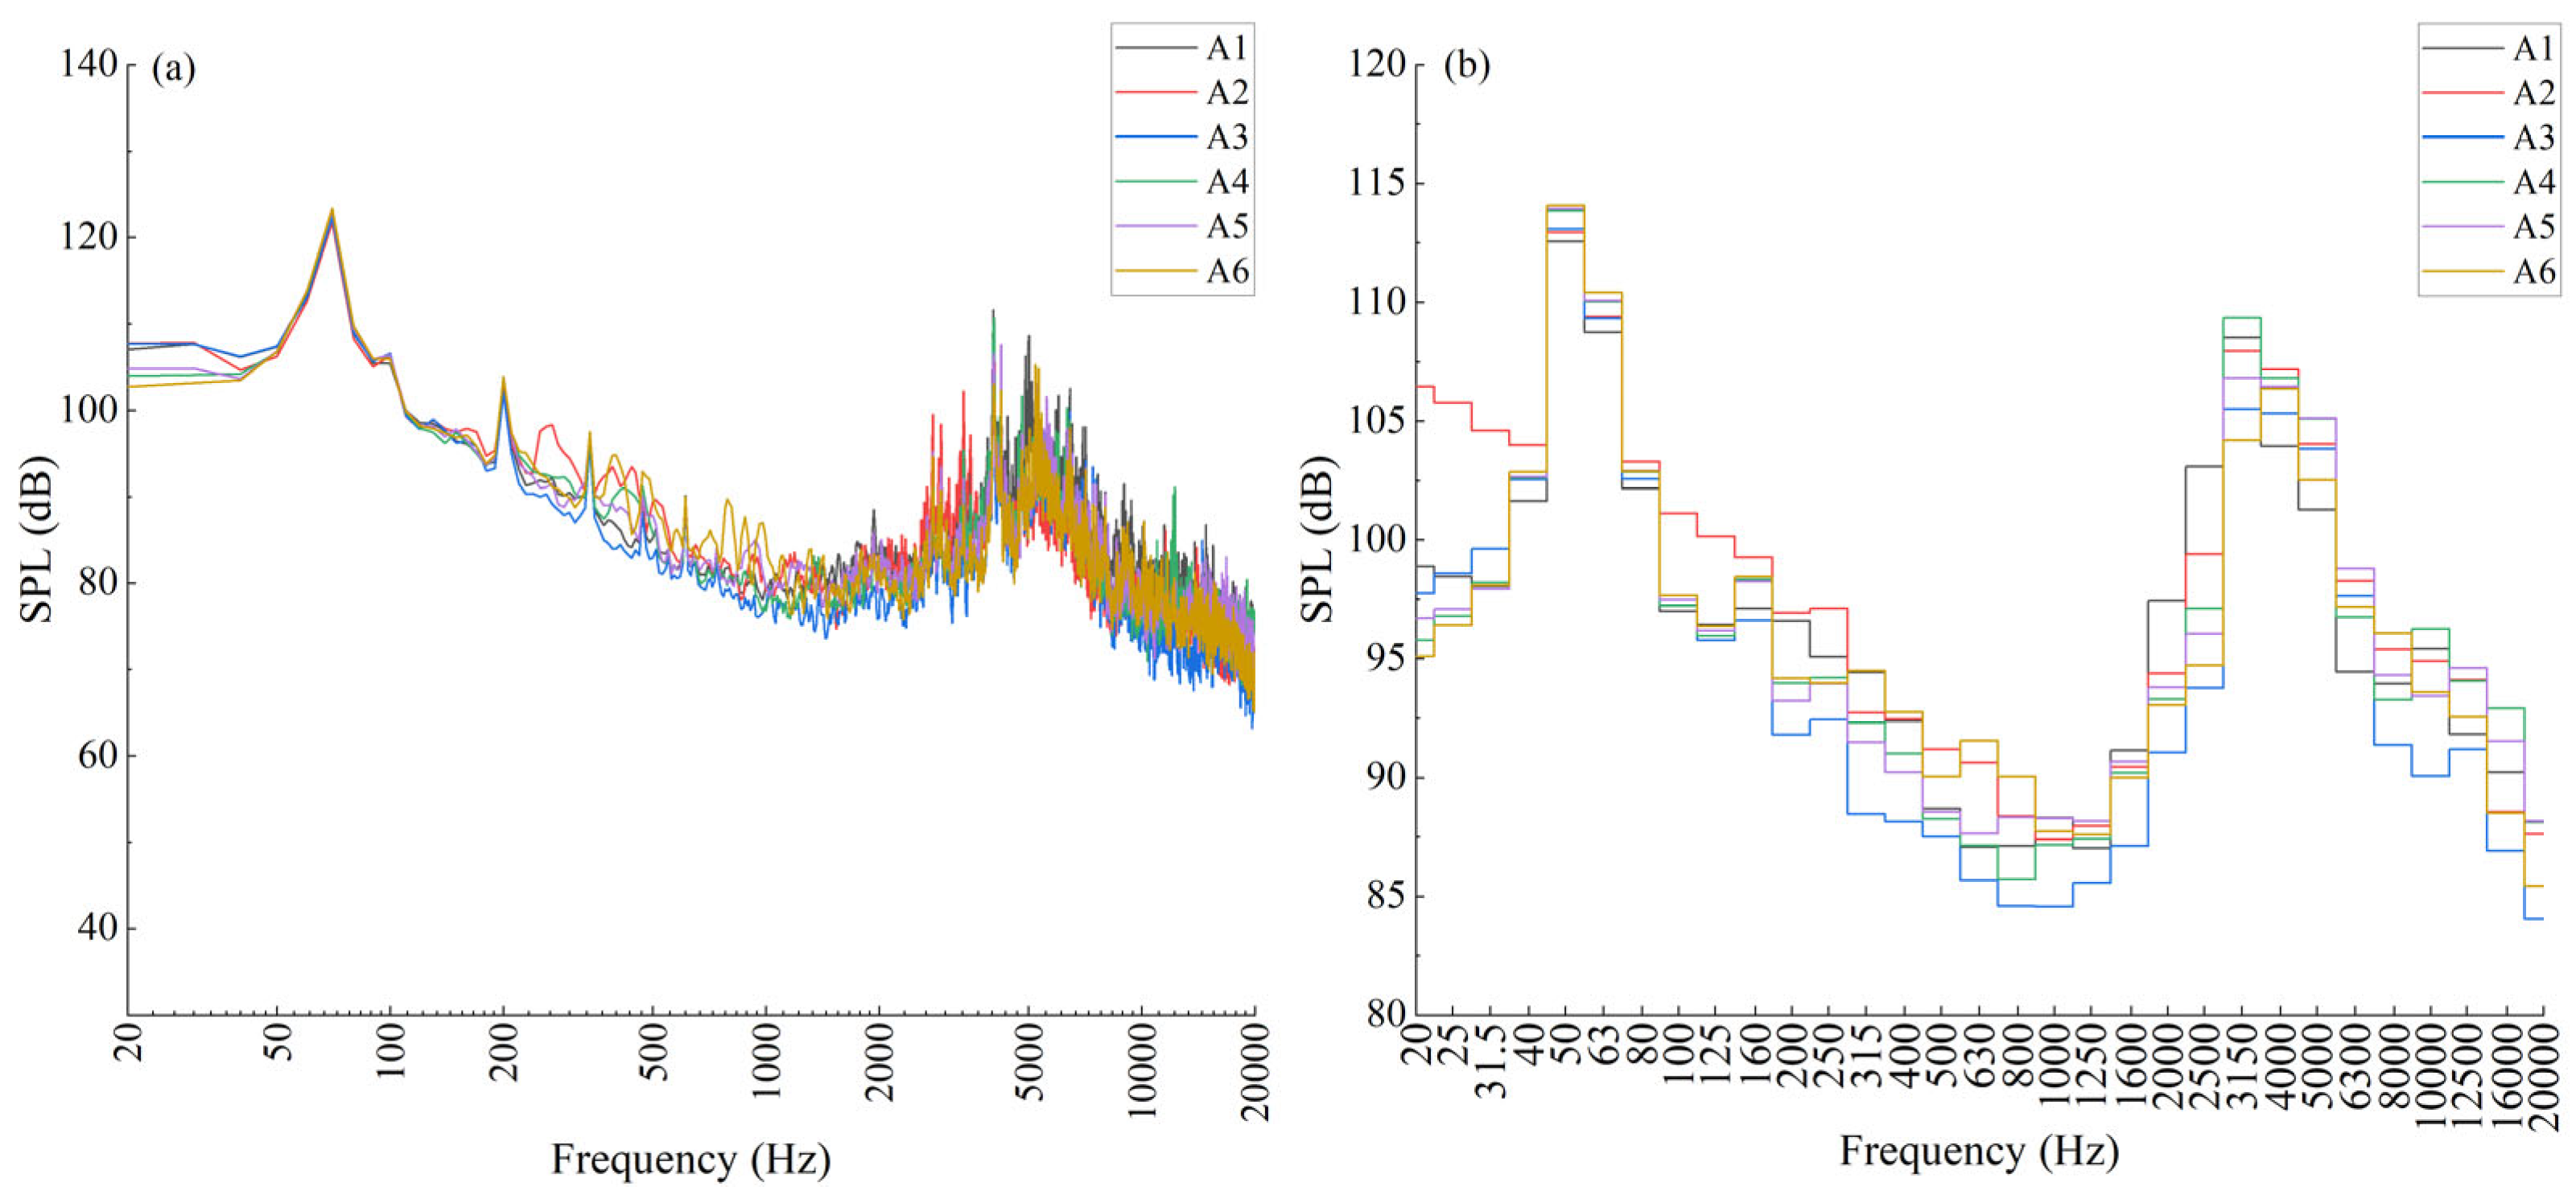
The power spectrum reflects the distribution of signal power across different frequencies. The main peak of the power spectrum is the maximum power value on the spectrum, and the main peak frequency is the frequency corresponding to this peak. In this study, one feeding sound signal was randomly selected from the samples of each of the six test individuals to plot the power spectrum and perform a one-third octave band analysis. The results are shown in Figure 8. The study found that the peaks of rainbow trout feeding sound signals were primarily concentrated in the 3.2–6.3 kHz range, with an average sound pressure level ranging from 85 to 130 dB.

3.4. Formant Characteristics

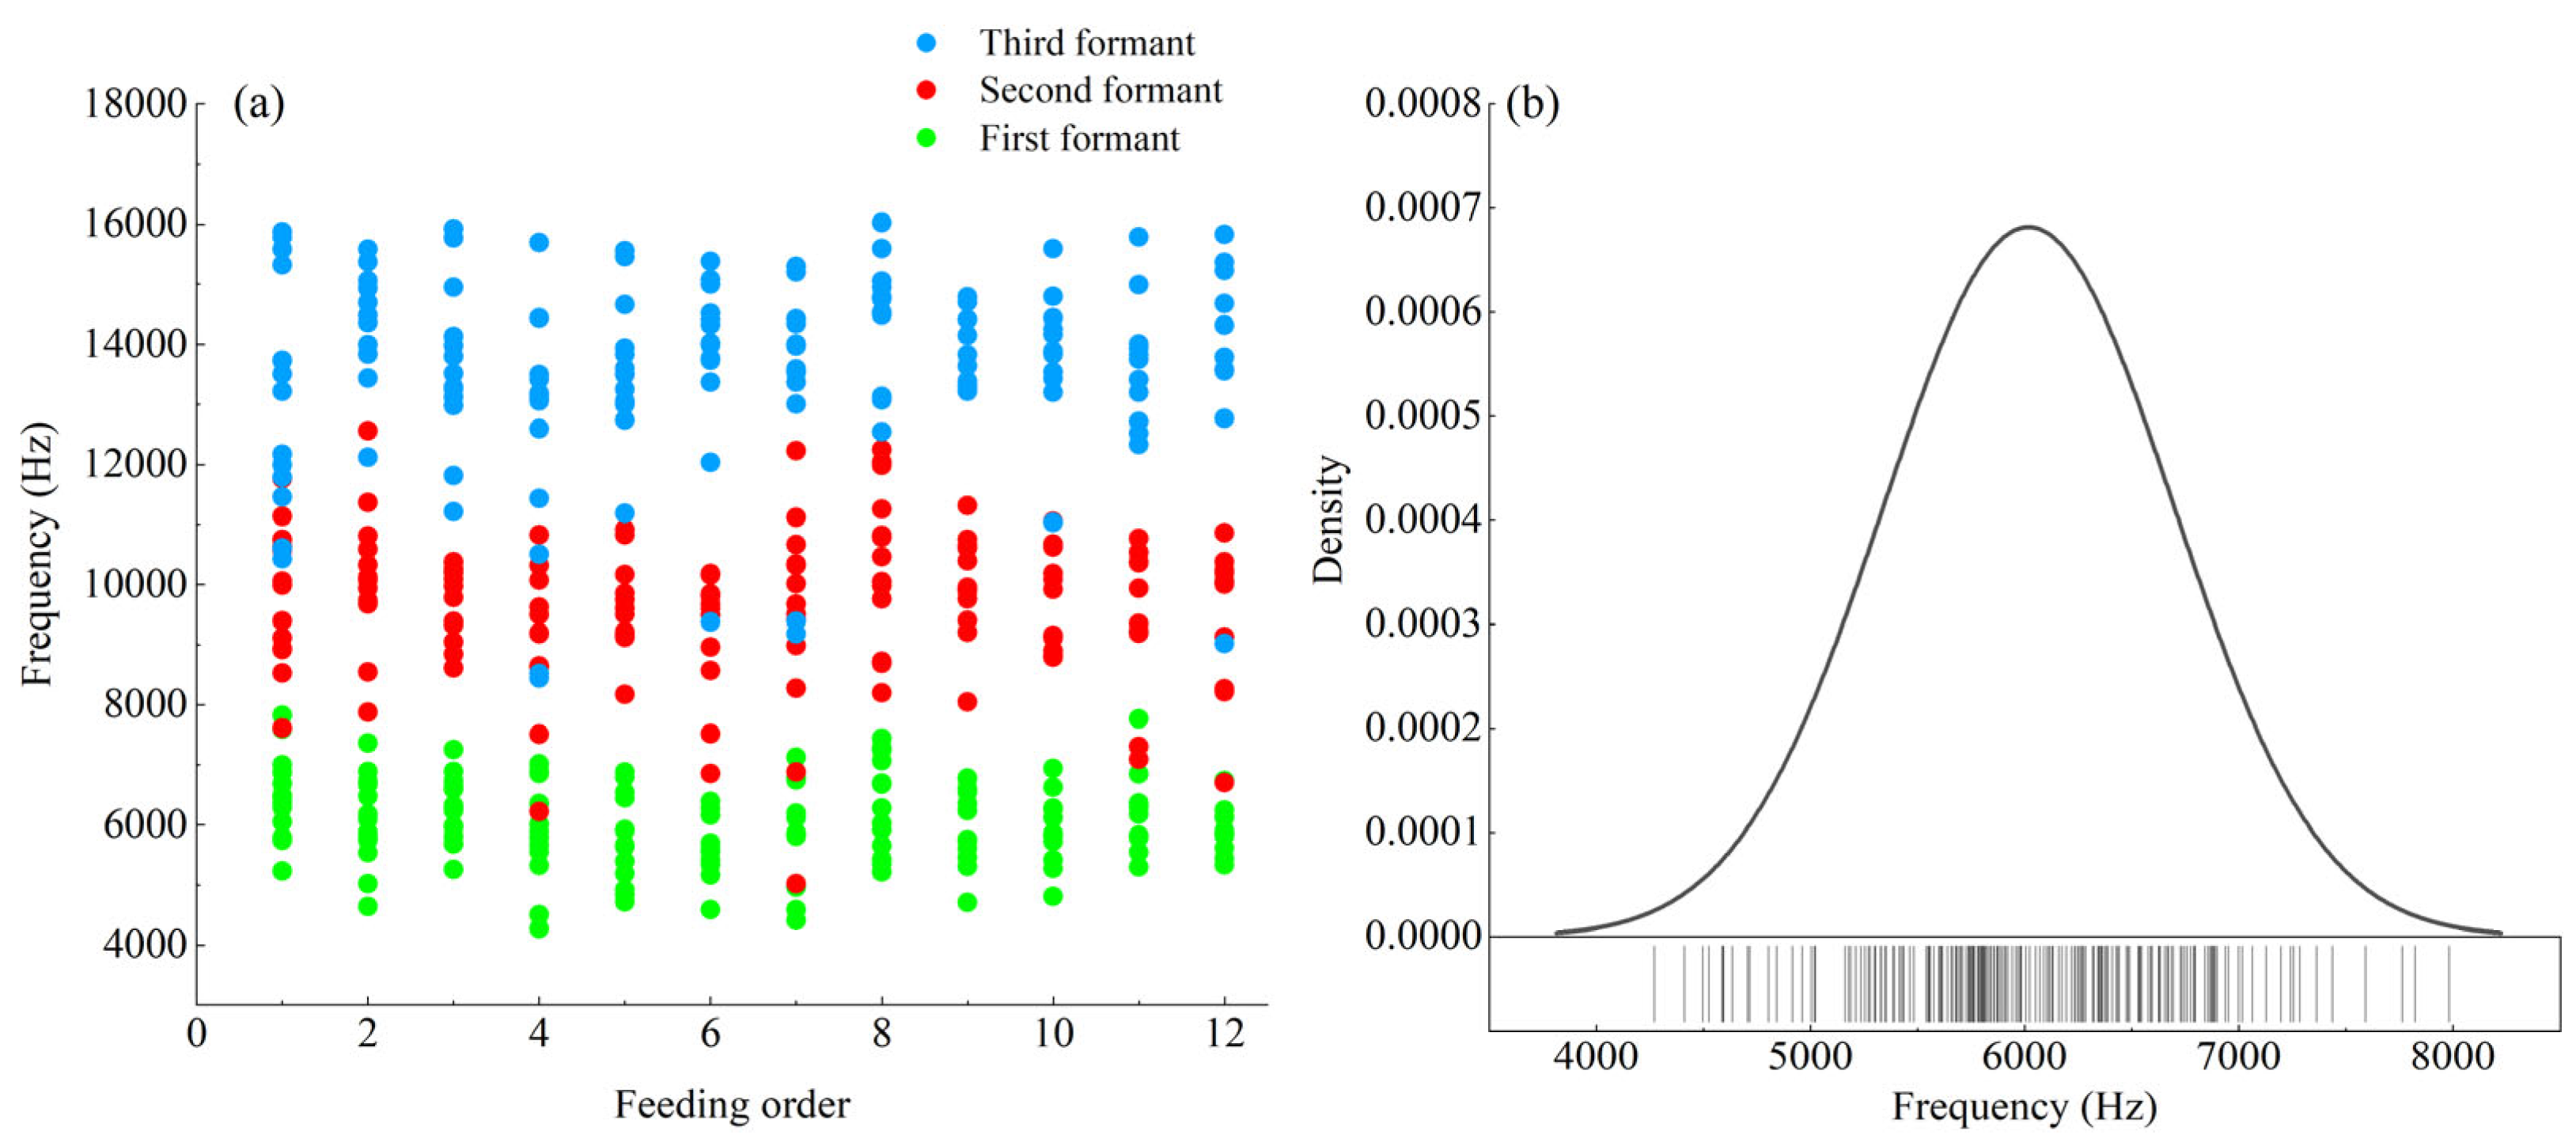
The distribution of the first formant is relatively concentrated, with frequencies primarily ranging from 5.3 to 6.9 kHz; the distribution of the second formant is relatively dispersed, with the majority concentrated around 10 kHz and very few occurring below 8 kHz or above 12 kHz; the third formant exhibits even greater dispersion, as shown in Figure 9a. Further analysis of the scatter plot density distribution reveals that the formant energy of rainbow trout feeding sounds is primarily concentrated in the 5.3–6.9 kHz frequency band. This frequency band characteristic shows good consistency with the distribution of the main peaks in the average sound pressure level of their feeding sound signals, as shown in Figure 9b.

3.5. Mean Mel-Frequency Cepstral Coefficients

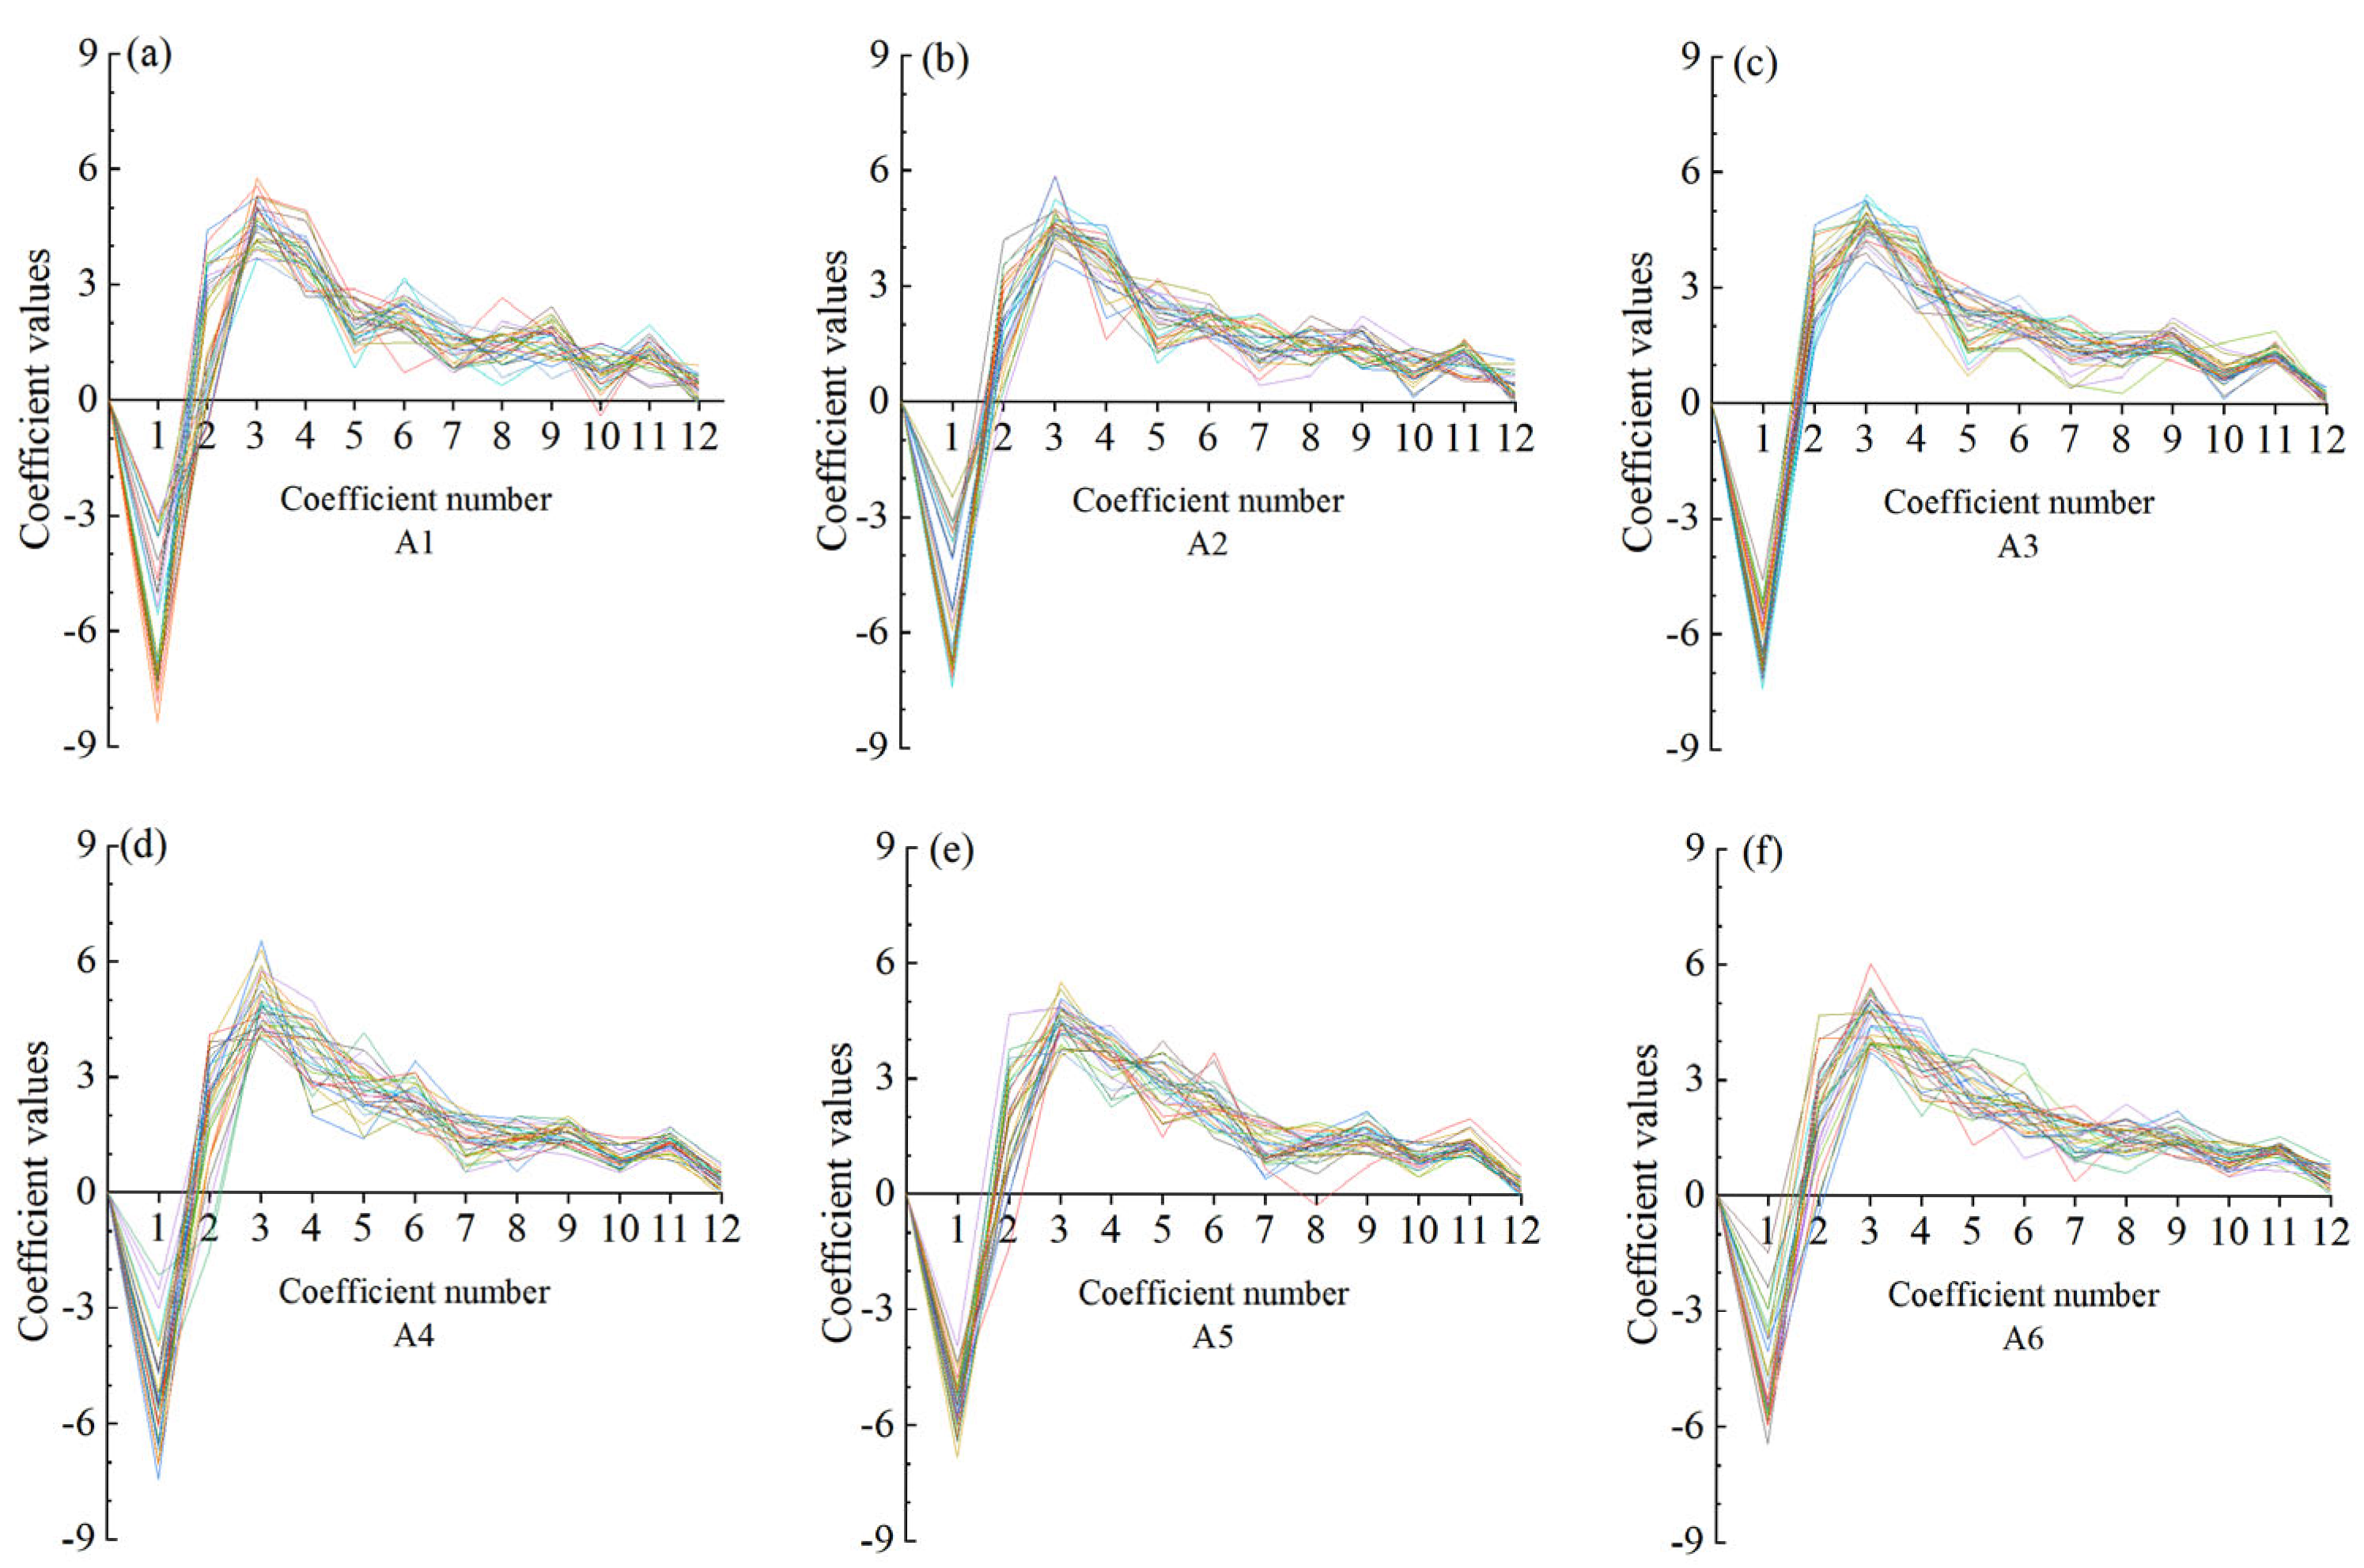
Each curve in the Figure 10 represents the trend of one AMFCC for a single feeding signal. A complete feeding signal comprises 12 AMFCCs, which are distinguished by different color lines, where the first coefficient denotes the mean frame energy (shown in Figure 10). Each feeding event of the rainbow trout consists of several swallowing signals; therefore, superimposing the AMFCCs of each swallowing signal reveals a unified trend.
Figure 10a illustrates the overall AMFCC trend for a complete feeding event of experimental sample A1. Observations of samples A1 through A6 reveal that the value of the third coefficient is consistently higher than the others. The trends of coefficients 1 to 3 show strong consistency, all exhibiting an inflection point at the first coefficient. In contrast, coefficients 4 to 12 display unstable trends without any clear unified pattern. The third coefficient exhibits the most pronounced and consistent peak, making it an effective acoustic feature for identifying the timing of rainbow trout feeding.

4. Discussion

This study utilized audio and video data to investigate the feeding behavior of individual rainbow trout and found that, among the time-domain characteristics of individual fish feeding signals, the correlation between swallowing intervals was stronger than that between the range and peak amplitude. The amplitude fluctuations of acoustic signals are closely related to feeding movements. Analysis of audio–visual synchronized data revealed that significant amplitude extremes and peak values also occur toward the end of the feeding process; video playback confirmed that this is primarily associated with feeding movements. Scholars generally agree that the cavitation mechanism is the earliest verified type of vocalization associated with fish feeding. The principle of this vocalization can be summarized as follows: at the moment of feeding, the fish’s mouth opens rapidly, creating an instantaneous negative pressure inside; the food is then drawn in by the pressure differential between the interior and exterior. Subsequently, the pressure inside the mouth drops sharply, inducing the formation of cavitation bubbles and releasing pulsed acoustic signals during this process [27]. Rainbow trout produce relatively quiet sounds when feeding underwater, whereas feeding at the water’s surface is often accompanied by the sound of their tails striking the water, generating significant energy. This, in turn, leads to an increase in the amplitude difference and the maximum amplitude. Therefore, when quantifying and identifying fish feeding behavior, one cannot rely solely on acoustic signals to determine the intensity of their feeding activity.
In a spectral analysis of individual fish, it was found that the frequency peaks of rainbow trout feeding noise were primarily concentrated in the 3.2–6.3 kHz range. Lagardère et al. [15] analyzed the feeding acoustic signals of turbot of various sizes and found that their feeding sounds could be effectively distinguished from background noise in the frequency range above 5 kHz. The study also noted that the acoustic energy of feeding sounds from brown trout and rainbow trout is concentrated in the 4–6 kHz range, whereas turbot exhibits the highest energy distribution in the 7–9 kHz band. These findings are generally consistent with the experimental results of this study. Resonance peaks and AMFCC are the two most common features used in acoustic identification. This study conducted a correlation analysis between resonance peak frequency and feeding sequence, finding that the resonance peak frequency of feeding is unrelated to feeding sequence. This is consistent with the results of Qi Renyu [28], who also extracted resonance peak frequencies from feeding signals of largemouth bass and analyzed their correlation with feeding sequence. This aligns with the findings of Fitch et al. [29] in their study on vocal resonance peaks in vertebrates, who noted that resonance peaks are universally present in the vocalizations of birds and ruminants and can identify key information such as species and body size, thus holding significant value in animal vocal recognition and classification tasks.
The significance of these findings lies not only in characterizing the acoustic properties of rainbow trout feeding sounds, but also in demonstrating their potential application in precision aquaculture. The time-domain features, including maximum amplitude, amplitude range, and swallowing interval, provide useful information for evaluating feeding intensity and feeding rhythm. Specifically, the maximum amplitude and amplitude range can reflect the strength and fluctuation of feeding sound signals, while the swallowing interval can be used to describe the temporal pattern of feeding behavior. These indicators may help identify changes in feeding activity and provide a basis for assessing the feeding state of rainbow trout.
In addition, the relatively concentrated frequency peaks suggest that feeding sounds can be distinguished from background noise within specific frequency bands, providing an acoustic basis for automatic feeding behavior detection. Moreover, the lack of correlation between resonance peak frequency and feeding sequence indicates that this feature remains relatively stable during feeding, which may enhance the robustness of acoustic recognition models. From a practical perspective, these acoustic indicators could support the development of real-time and non-invasive monitoring systems for rainbow trout feeding behavior. Such systems may help farmers assess feeding intensity more accurately, optimize feeding schedules, reduce feed waste, and improve water quality and production efficiency. Future studies should further evaluate the stability of these acoustic features under different environmental conditions, stocking densities, fish sizes, and feeding regimes, and integrate time-domain features, resonance peak features, and AMFCC with machine learning algorithms to improve the accuracy and generalizability of feeding sound recognition.

5. Conclusions

The results showed that the amplitude range between different rainbow trout monomers was negatively correlated with the order of swallowing, the correlation coefficient was less than −0.62, and there was no significant difference. The maximum amplitude was negatively correlated, the correlation coefficient was less than −0.63, and there was no significant difference. The maximum amplitude was positively correlated with the swallowing interval, and the correlation coefficient was greater than 0.68, showing a significant positive correlation. The short-term energy is mainly concentrated in 40–80, and the short-term zero-crossing number is mainly concentrated in 0–20 times. In the power spectrum analysis, the feeding sound signals for different individuals of the same body length were concentrated in the range of 3.2–6.3 kHz. In the resonance peak analysis, it was found that the first resonance peak was concentrated at about 6 kHz, and the first resonance peak range of rainbow trout feeding was about 5.3–6.9 kHz, which was basically consistent with the main energy frequency range in the power spectrum. At the same time, the correlation between each feeding sound signal and the feeding order was analyzed, and it was found that there was no significant correlation between the formant and the swallowing order. The variation trend of the average Mel cepstrum coefficient from the first coefficient to the third coefficient shows strong consistency, and there is an inflection point at the first coefficient. The variation trend from the fourth coefficient to the twelfth coefficient shows instability, and there is no obvious uniform variation trend.

Author Contributions

L.Y. and Q.L. jointly conceived and designed the experimental scheme. B.X. and H.Y. were responsible for the implementation of the experiment. S.S. and H.C. were involved in data analysis. Y.W. and P.X. co-wrote the paper. Y.W. and P.X. have the same contribution to this study, and both of them have the right to sign as the first author. All authors have read and agreed to the published version of the manuscript.

Funding

This study was funded by the Liaoning Provincial Science and Technology Plan Joint Program (project number: 2024-MSLH-054).

Institutional Review Board Statement

The animal study was reviewed and approved by the Institutional Animal Care and Use Committee (IACUC) of Dalian Ocean University (approval code: DLOU2026051102; approval date: 20 November 2024).

Data Availability Statement

The original contributions presented in the study are included in the article. Further inquiries can be directed to the corresponding authors.

Acknowledgments

We would like to thank the Fish Behavior Laboratory of Dalian Ocean University for the experimental site and technical support provided for this study. At the same time, we thank all the authors for their valuable contributions. If not for the hard work of the authors, this study would have been difficult to complete.

Conflicts of Interest

The authors declare that the research was conducted in the absence of any commercial or financial relationships that could be construed as a potential conflict of interest.

Abbreviations

The following abbreviations are used in this manuscript:
PSDPower spectral density
MFCCsMel-scale Frequency Cepstral Coefficients
AMFCCAverage Mel-frequency cepstral coefficients

References

  1. Volkoff, H.; Peter, R.E. Feeding behavior of fish and its control. Zebrafish 2006, 3, 131–140. [Google Scholar] [CrossRef] [Scilit] [PubMed]
  2. Kasumyan, A.O. Sounds and sound production in fishes. J. Ichthyol. 2008, 48, 981–1030. [Google Scholar] [CrossRef] [Scilit]
  3. Bergert, B.A.; Wainwright, P.C. Morphology and kinematics of prey capture in the syngnathid fishes Hippocampus erectus and Syngnathus floridae. Mar. Biol. 1997, 127, 563–570. [Google Scholar] [CrossRef] [Scilit]
  4. Ladich, F. Comparative analysis of swimbladder (drumming) and pectoral (stridulation) sounds in three families of catfishes. Bioacoustics 1997, 8, 185–208. [Google Scholar] [CrossRef] [Scilit]
  5. Ladich, F. Fish bioacoustics. Curr. Opin. Neurobiol. 2014, 28, 121–127. [Google Scholar] [CrossRef] [Scilit] [PubMed]
  6. Li, D.; Wang, Z.; Wu, S.; Miao, Z.; Du, L.; Duan, Y. Automatic recognition methods of fish feeding behavior in aquaculture: A review. Aquaculture 2020, 528, 735508. [Google Scholar] [CrossRef] [Scilit]
  7. Liu, Z.; Li, X.; Fan, L.; Lu, H.; Liu, L.; Liu, Y. Measuring feeding activity of fish in RAS using computer vision. Aquac. Eng. 2014, 60, 20–27. [Google Scholar] [CrossRef] [Scilit]
  8. Chen, G.; Cai, L.; Zong, L.; Wang, Y.; Yuan, X. Survey of Marine Organisms Based on Passive Acoustic Technology. Int. J. Des. Nat. Ecodyn. 2020, 15, 729–737. [Google Scholar] [CrossRef] [Scilit]
  9. Li, Z.; Li, W.; Sun, K.; Fan, D.; Cui, W. Recent Progress on Underwater Wireless Communication Methods and Applications. J. Mar. Sci. Eng. 2025, 13, 1505. [Google Scholar] [CrossRef] [Scilit]
  10. Gannon, D.P. Passive acoustic techniques in fisheries science: A review and prospectus. Trans. Am. Fish. Soc. 2008, 137, 638–656. [Google Scholar] [CrossRef] [Scilit]
  11. Juanes, F. Listening to fish: An international workshop on the application of passive acoustics in fisheries. Rev. Fish Biol. Fish. 2002, 12, 105–106. [Google Scholar] [CrossRef] [Scilit]
  12. Looby, A.; Cox, K.; Bravo, S.; Rountree, R.; Juanes, F.; Reynolds, L.K.; Martin, C.W. A quantitative inventory of global soniferous fish diversity. Rev. Fish Biol. Fish. 2022, 32, 581–595. [Google Scholar] [CrossRef] [Scilit]
  13. Looby, A.; Vela, S.; Rice, A.N.; Bravo, S.; Davies, H.L.; Murchy, K.A.; Rountree, R.; Reynolds, L.K.; Martin, C.W.; Juanes, F.; et al. FishSounds Versions 2 and 3: Achieving the Largest Global Database of Fish Sound Production. Glob. Ecol. Biogeogr. 2025, 34, e70149. [Google Scholar] [CrossRef] [Scilit]
  14. Tricas, T.C.; Boyle, K.S. Acoustic behaviors in Hawaiian coral reef fish communities. Mar. Ecol. Prog. Ser. 2014, 511, 1–16. [Google Scholar] [CrossRef] [Scilit]
  15. Lagardère, J.P.; Mallekh, R.; Mariani, A. Acoustic characteristics of two feeding modes used by brown trout (Salmo trutta), rainbow trout (Oncorhynchus mykiss) and turbot (Scophthalmus maximus). Aquaculture 2004, 240, 607–616. [Google Scholar] [CrossRef] [Scilit]
  16. Phillips, M.J. The feeding sounds of rainbow trout, Salmo gairdneri Richardson. J. Fish Biol. 1989, 35, 589–592. [Google Scholar] [CrossRef] [Scilit]
  17. Manikandan, V.; Neethirajan, S. Decoding Poultry Welfare from Sound—A Machine Learning Framework for Non-Invasive Acoustic Monitoring. Sensors 2025, 25, 2912. [Google Scholar] [CrossRef] [Scilit]
  18. Liu, S.; Liu, S.; Qi, R.; Zheng, H.; Zhang, J.; Qian, C.; Liu, H. Recognition of feeding sounds of large-mouth black bass based on low-dimensional acoustic features. Front. Mar. Sci. 2024, 11, 1437173. [Google Scholar] [CrossRef] [Scilit]
  19. Ait Mait, H.; Aboutabit, N. An Unsupervised Voice Activity Detection Using Time-Frequency Features. In Proceedings of the International Conference of Machine Learning and Computer Science Applications; Springer: Cham, Switzerland, 2022; pp. 232–240. [Google Scholar]
  20. Warule, P.; Mishra, S.P.; Deb, S. Significance of voiced and unvoiced speech segments for the detection of common cold. Signal Image Video Process. 2023, 17, 1785–1792. [Google Scholar] [CrossRef] [Scilit]
  21. Sarkar, E.; Prasad, R.S.; Doss, M.M. Unsupervised voice activity detection by modeling source and system information using zero frequency filtering. arXiv 2022, arXiv:2206.13420. [Google Scholar] [CrossRef] [Scilit]
  22. Xu, X.; Gan, Y.; Yuan, X.; Cheng, Y.; Zhou, L. Non-contact screening of OSAHS using multi-feature snore segmentation and deep learning. Sensors 2025, 25, 5483. [Google Scholar] [CrossRef] [Scilit]
  23. Jwo, D.J.; Chang, W.Y.; Wu, I.H. Windowing Techniques, the welch method for improvement of Power Spectrum Estimation. Comput. Mater. Contin. 2021, 67, 3983–4003. [Google Scholar] [CrossRef] [Scilit]
  24. Oganian, Y.; Bhaya-Grossman, I.; Johnson, K.; Chang, E.F. Vowel and formant representation in the human auditory speech cortex. Neuron 2023, 111, 2105–2118.e4. [Google Scholar] [CrossRef] [Scilit] [PubMed]
  25. Ishikawa, K.; Webster, J.M. The formant bandwidth as a measure of vowel intelligibility in dysphonic speech. J. Voice 2023, 37, 173–177. [Google Scholar] [CrossRef] [Scilit]
  26. Tanaka, K.; Ichikawa, K.; Kittiwattanawong, K.; Arai, N.; Mitamura, H. Automated classification of dugong calls and tonal noise by combining contour and MFCC features. Acoust. Aust. 2021, 49, 385–394. [Google Scholar] [CrossRef] [Scilit]
  27. Ortega-Jimenez, V.M.; Sanford, C.P.J. Knifefish’s suction makes water boil. Sci. Rep. 2020, 10, 18698. [Google Scholar] [CrossRef] [Scilit]
  28. Qi, R.; Liu, H.; Liu, S. Effects of different culture densities on the acoustic characteristics of Micropterus salmoides feeding. Fishes 2023, 8, 126. [Google Scholar] [CrossRef] [Scilit]
  29. Fitch, W.T.; Anikin, A.; Pisanski, K.; Valente, D.; Reby, D. Formant analysis of vertebrate vocalizations: Achievements, pitfalls, and promises. BMC Biol. 2025, 23, 92. [Google Scholar] [CrossRef] [Scilit] [PubMed]
Figure 1. Schematic diagram of feeding behavior monitoring test process.
Fishes 11 00355 g001
Figure 2. Components of the passive acoustic monitoring system: (a) hydrophone, (b) external sound card, and (c) preamplifier.
Fishes 11 00355 g002
Figure 3. Experimental data acquisition site.
Fishes 11 00355 g003
Figure 4. Adobe Premiere Pro 2023 multi-track audio–visual synchronization interface.
Fishes 11 00355 g004
Figure 5. Flow chart of preprocessing of ingestion sound signal.
Fishes 11 00355 g005
Figure 6. Waveform of ingestion acoustic signal. Note: t: swallowing interval, s; Vpp: peak-to-peak value of voltage, V; M: maximum amplitude, V.
Fishes 11 00355 g006
Figure 7. The short-term characteristics of the feeding sound signal period of rainbow trout. (a) The short-term energy distribution; (b) the short-term energy probability density distribution; (c) the short-term zero-crossing number distribution; (d) probability density distribution of the short-term zero-crossing number.
Fishes 11 00355 g007
Figure 8. Power spectrum and one-third-octave band spectrum of feeding-sound signals in rainbow trout. (a) Power spectrum; (b) one-third-octave band spectrum.
Fishes 11 00355 g008
Figure 9. Scatter plot and density distribution plot of feeding sound signal. (a) Scatter plot of the first, second, and third formants; (b) the density distribution map of the first resonance peak.
Fishes 11 00355 g009
Figure 10. Average Mel-scale Frequency Cepstral Coefficients for each individual. (a) Average Mel-scale Frequency Cepstral Coefficients for A1; (b) Average Mel-scale Frequency Cepstral Coefficients for A2; (c) Average Mel-scale Frequency Cepstral Coefficients for A3; (d) Average Mel-scale Frequency Cepstral Coefficients for A4; (e) Average Mel-scale Frequency Cepstral Coefficients for A5; (f) Average Mel-scale Frequency Cepstral Coefficients for A6; The body length of rainbow trout is different at different growth stages. Therefore, in the follow-up study, the acoustic characteristics of the feeding behavior of rainbow trout at different growth stages were extracted and analyzed to further clarify the differences in the acoustic characteristics of the feeding behavior of rainbow trout at different growth stages. At the same time, the related research on the acoustic characteristics of the feeding behavior of the rainbow trout population under different breeding densities will be carried out, and the database of acoustic characteristics of feeding behavior of rainbow trout will be improved to provide data reference for the accurate feeding of fish.
Fishes 11 00355 g010
Table 1. Body length of rainbow trout in each experimental group.
GroupsA1A2A3A4A5A6
Body Length/cm18.318.518.818.919.019.2
Table 2. Significance analysis of correlation coefficient of peak-to-peak value of voltage, maximum amplitude, and swallowing interval.
Serial No.Peak-to-Peak Value of Voltage VppMaximum Amplitude MSwallowing Interval t
A1−0.73 a−0.71 a0.76 ab
A2−0.62 a−0.63 a0.68 b
A3−0.68 a−0.65 a0.71 b
A4−0.75 a−0.74 a0.73 ab
A5−0.64 a−0.63 a0.69 b
A6−0.75 a−0.72 a0.83 a
Note: In the column, values with the same small letter mean no significant differences (p > 0.05); different small letters mean significant differences (p < 0.05).
Disclaimer/Publisher’s Note: The statements, opinions and data contained in all publications are solely those of the individual author(s) and contributor(s) and not of MDPI and/or the editor(s). MDPI and/or the editor(s) disclaim responsibility for any injury to people or property resulting from any ideas, methods, instructions or products referred to in the content.