Article

AHSC-Net: A Fish Pose Estimation Method for Intelligent Monitoring in Precision Aquaculture
1
College of Mathematics and Computer Science, Guangdong Ocean University, Zhanjiang 524088, China
2
Guangdong Provincial Key Laboratory of Intelligent Equipment for South China Sea Marine Ranching, Guangdong Ocean University, Zhanjiang 524088, China
*
Author to whom correspondence should be addressed.
Fishes 2026, 11(5), 308; https://doi.org/10.3390/fishes11050308

Submission received: 15 April 2026 / Revised: 12 May 2026 / Accepted: 14 May 2026 / Published: 21 May 2026
(This article belongs to the Special Issue Computer Vision Applications for Fisheries and Aquaculture)

Abstract

In aquaculture, fish physiological information serves as the foundation for behavior recognition, precise feeding, and health monitoring. The acquisition of such information relies on accurate keypoint detection and pose estimation of the fish body. To address the challenges caused by inter-occlusion among fish schools and blurred keypoint boundaries in underwater environments, a novel fish pose estimation method based on the Adaptive-kernel Hybrid-center Structural Constraint Network (AHSC-Net) is proposed. Optimized specifically for the characteristics of fish poses, the proposed method effectively enhances detection accuracy and robustness in complex underwater scenarios. First, a Stochastic Local Centroid Sampling (SLCS) strategy is introduced to improve detection capability. By simulating centroid positions in occluded samples, this approach enhances the model’s ability to detect partially occluded fish. Next, a Spatial-Awareness Enhanced Pose Structural Constraint (SAPSC) is established through coordinate embedding and morphological constraints. It ensures the rationality of the predicted poses. Furthermore, an Adaptive Kernel Modulation Module (AKMM) is designed to dynamically adjust the Gaussian kernel distribution, effectively addressing challenges posed by underwater blurring and variations in fish scales. Experimental results demonstrate that AHSC-Net achieves 92.0% AP and 94.6% AR on a self-constructed largemouth bass dataset, outperforming state-of-the-art methods such as HRNet, HigherHRNet, DEKR, and YOLO-Pose. This study presents a fish pose estimation method that provides effective technical support for automated and precise monitoring in aquaculture.
Key Contribution: This paper proposes AHSC-Net, a fish pose estimation network designed for underwater aquaculture scenarios. It effectively addresses the detection challenges caused by fish school occlusion, underwater blurring and variable target scales through three targeted innovations, significantly outperforms mainstream state-of-the-art models, and provides reliable technical support for automated intelligent monitoring in precision aquaculture.

1. Introduction

As a cost-effective source of protein [1], fish hold both significant nutritional value and considerable economic value globally. To achieve automated aquaculture, it is necessary to detect and acquire accurate physiological information from fish in real time. Pose estimation technology employs algorithms to automatically detect and localize object keypoints from images or video sequences, and subsequently infers their spatial position and orientation. By applying pose estimation algorithms for fish keypoint localization and pose analysis, static parameters such as body length and morphology can be directly obtained [2,3]. Furthermore, based on continuous pose analysis, the system can capture pose changes in fish during motion [4,5,6], enabling effective monitoring of fish behavior and health status, as well as the formulation of intelligent precision feeding strategies [7,8].
Traditional methods, relying on handcrafted features, suffer from insufficient robustness. They struggle to adapt to complex and variable real-world underwater scenes and the demands of fine-grained pose analysis, thereby restricting the depth and large-scale application of fish behavior research. In recent years, image processing methods based on machine vision have developed rapidly [9,10,11,12]. Pose estimation has become relatively mature in the human domain [13,14] and is gradually being applied to the field of fish pose recognition [15,16].
Compared with humans, fish pose detection faces more severe challenges: on one hand, the underwater environment presents complex optical interference and low visibility issues; on the other hand, the characteristics of severe inter-occlusion among fish individuals and variable scales, combined with low visual discriminability of key body parts, collectively increase the difficulty of precise detection. Recently, with the increasing demand for high-precision pose estimation, improved algorithms based on HRNet [17] have become a research hotspot. Li et al. [18] proposed a non-contact measurement system based on binocular vision, utilizing an improved FPN-HRNet network to extract fish keypoints and combining it with a 3D curve fitting algorithm to reduce measurement errors caused by fish swimming deformation. Peng et al. [19] developed the HPFPE model for spotted knifejaw, integrating the CBAM attention mechanism and dilated convolutions into the HRNet backbone. This expands the receptive field while maintaining high-resolution features, effectively addressing underwater blurring and occlusion problems. Cui et al. [20] improved the HRNet network by incorporating pyramid split attention, achieving effective detection of fish keypoint features.
However, these methods all adopt a “Top-down” detection pipeline. Although this pipeline offers accuracy advantages, in high-density fish school scenarios, it requires detecting and analyzing each fish individually, leading to bottlenecks such as high computational load and slow inference speed. Meanwhile, single-stage algorithms based on YOLO-Pose [21] have also made significant progress. Li et al. [22] proposed a keypoint detection method based on the YOLOv8-pose model, combined with a line laser system to achieve automated body length and width measurement of fish with inclined poses underwater. Tian et al. [23] proposed a binocular measurement method based on an improved YOLOv8-pose. By introducing a multi-scale StemBlock module, it enhances the capability to capture tiny fish keypoints while ensuring real-time performance. Wang et al. [24] constructed a lightweight convolutional neural network, using rotated bounding boxes to adapt to variable swimming poses, and combined it with the Random Forest algorithm to achieve efficient identification and trajectory tracking.
However, limited by its regression capability for tiny features, the localization accuracy of YOLO-Pose in complex underwater environments often fails to meet the requirements of fine-grained measurement. With the continuously growing demand for fish pose and behavior monitoring in aquaculture [25], there is an urgent need to innovate pose estimation methods to lay a solid foundation for the future development of fish farming.
Addressing the aforementioned problems, this paper focuses on the challenges of keypoint detection under complex conditions such as fish school occlusion in underwater environments. Inspired by LOGOCAP [26], we propose a novel keypoint detection model named Adaptive-kernel Hybrid-center Structural Constraint Network (AHSC-Net). This model implements pose detection based on a “Bottom-up” pipeline: it first detects the keypoints of all fish in the image simultaneously, and then obtains individual poses through clustering and association. This bottom-up paradigm endows the model with efficient parallel processing capabilities; in dense fish school scenarios, the inference time is basically unaffected by the number of targets. The proposed AHSC-Net is designed to meet the actual demands of intelligent aquaculture, enabling high-precision, non-contact, and pose perception for fish schools. It can serve as a core visual module for underwater monitoring systems, supporting practical applications such as behavior recognition, health assessment, and precise feeding in industrial aquaculture. Simultaneously, it demonstrates outstanding performance in detection accuracy, laying a solid foundation for the advancement of intelligent aquaculture technology. The main contributions of this work are summarized as follows:
  • A novel fish pose estimation method named AHSC-Net is proposed: Addressing the detection difficulties in complex aquaculture environments, the high-precision AHSC-Net provides a core visual perception solution for non-contact monitoring in intelligent aquaculture.
  • Multi-module synergistic algorithmic innovation: Three targeted modules are designed: the SLCS module alleviates centroid shift caused by occlusion via stochastic local sampling; the SAPSC module ensures anatomical rationality through spatial-awareness embedding; and the AKMM achieves adaptive Gaussian kernel modulation to handle underwater blur and scale variations.
  • Dedicated dataset construction: A specialized largemouth bass pose dataset comprising 3435 annotated images with 9 anatomical keypoints per fish was constructed, filling the gap in open freshwater fish datasets and providing an essential benchmark for subsequent research.

2. Materials and Methods

2.1. Bass Pose Estimation Dataset

2.1.1. Data Collection and Annotation

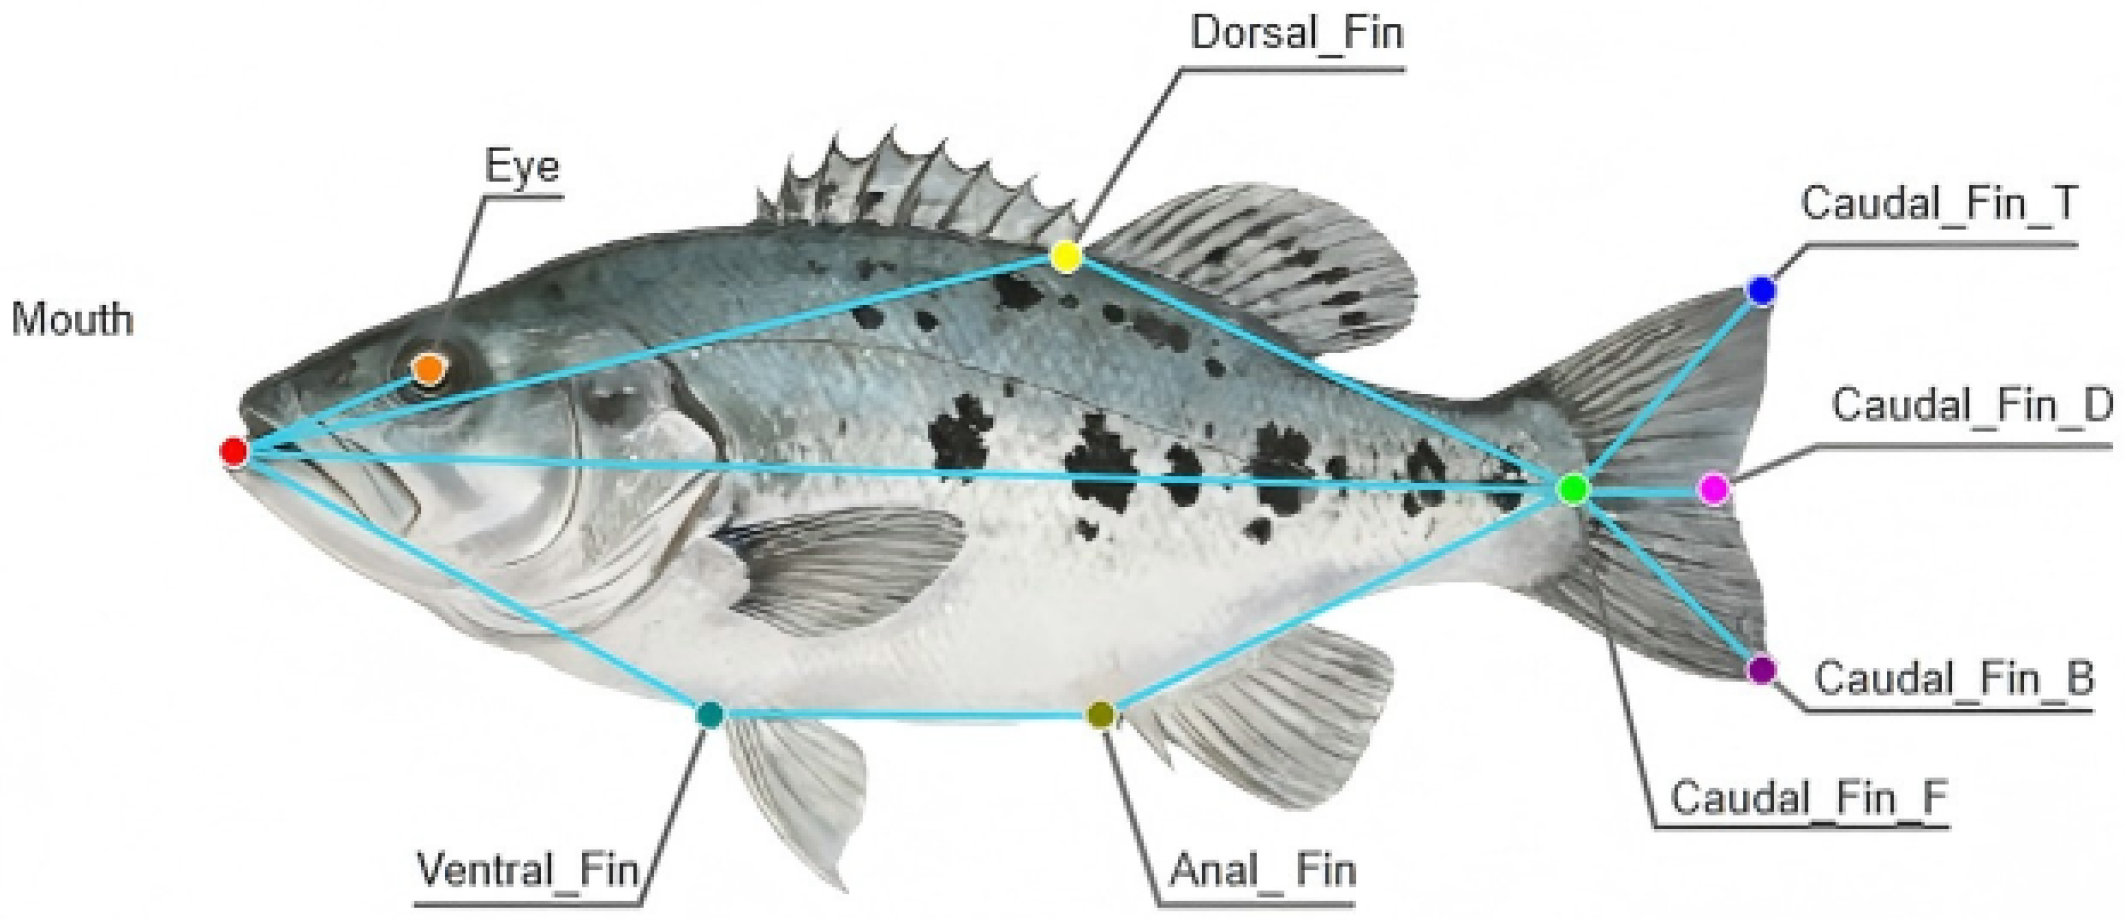
In this experiment, largemouth bass (Micropterus salmoides), a core commercial freshwater species in intensive aquaculture, was selected as the research subject. All image data for dataset construction were acquired in an indoor aquaculture pond, with the Barlus industrial underwater camera (Model: GY-H1.6F-6DHX10-Double) adopted as the image acquisition equipment. To ensure better generalization and robustness of the model in real-world farming scenarios, the dataset was collected under systematically controlled varying light intensities and different fish school densities. In this study, a total of 3435 valid images were screened to construct the experimental dataset, which was then randomly divided into a training set, a validation set and a test set at a ratio of 8:1:1. We used the Computer Vision Annotation Tool (CVAT) to perform fine-grained annotation on the dataset, labeling 9 anatomical keypoints for each complete fish individual. Examples of keypoint skeleton connections and annotation results are shown in Figure 1, and the detailed anatomical definition of the 9 keypoints is listed in Table 1. Furthermore, to ensure the reliability and validity of the ground truth annotations, a rigorous quality control protocol was implemented. Prior to the task, all annotators underwent specific training, the images comprising the dataset were carefully filtered, and the person in charge of annotation systematically reviewed and corrected the results. To empirically quantify the inter-annotator agreement, a representative subset of 200 images was randomly selected and independently relabeled by three different annotators. We computed the Mean OKS between the independent annotations and the original ground truth, achieving a score of 0.9778 ± 0.0043 . In pose estimation tasks, an OKS score exceeding 0.85 indicates highly reliable annotation. Our high score shows that the biological keypoints in our dataset are clearly localized and the annotations are stable, providing a reliable empirical upper bound for the model’s performance.

2.1.2. Data Augmentation

To enhance the model’s robustness against variable fish poses, scale differences, and common occlusions, we adopt a comprehensive data augmentation strategy. In terms of geometric transformations, random rotation ( ± 20 ° ), scaling (0.7–1.3×), and horizontal flipping are applied to the training data to simulate basic deformations of targets in real-world imaging. Furthermore, to simulate scenarios with occluded keypoints, we introduce two structured occlusion augmentation methods: Random Erasing [27] and GridMask [28]. Random Erasing simulates partial occlusion of targets by randomly selecting a rectangular region in the training image and covering it with random pixels or mean values. GridMask systematically masks local regions with black squares by generating a uniform grid-like occlusion pattern on the image. This method prevents the loss of critical features caused by excessive occlusion while ensuring that the target remains partially visible. Consequently, it constructs reasonable occlusion scenarios while providing effective learning signals for the model, thereby enhancing its occlusion resistance performance.

2.2. Experimental Environment

The experiments were conducted using the PyTorch 1.8.0 framework, with the network deployed on an NVIDIA RTX 3090 GPU equipped with 24 GB of video memory. We employed the Adam optimizer, which adaptively adjusts the learning rate for each parameter and demonstrates excellent convergence performance in computer vision tasks. The initial learning rate was set to 0.001. The learning rate adjustment strategy adopted a multi-step decay schedule. Specifically, the model was trained for 300 epochs, and the learning rate was decayed to 0.1 times its original value at the 190th and 260th epochs, respectively.

2.3. Proposed Method

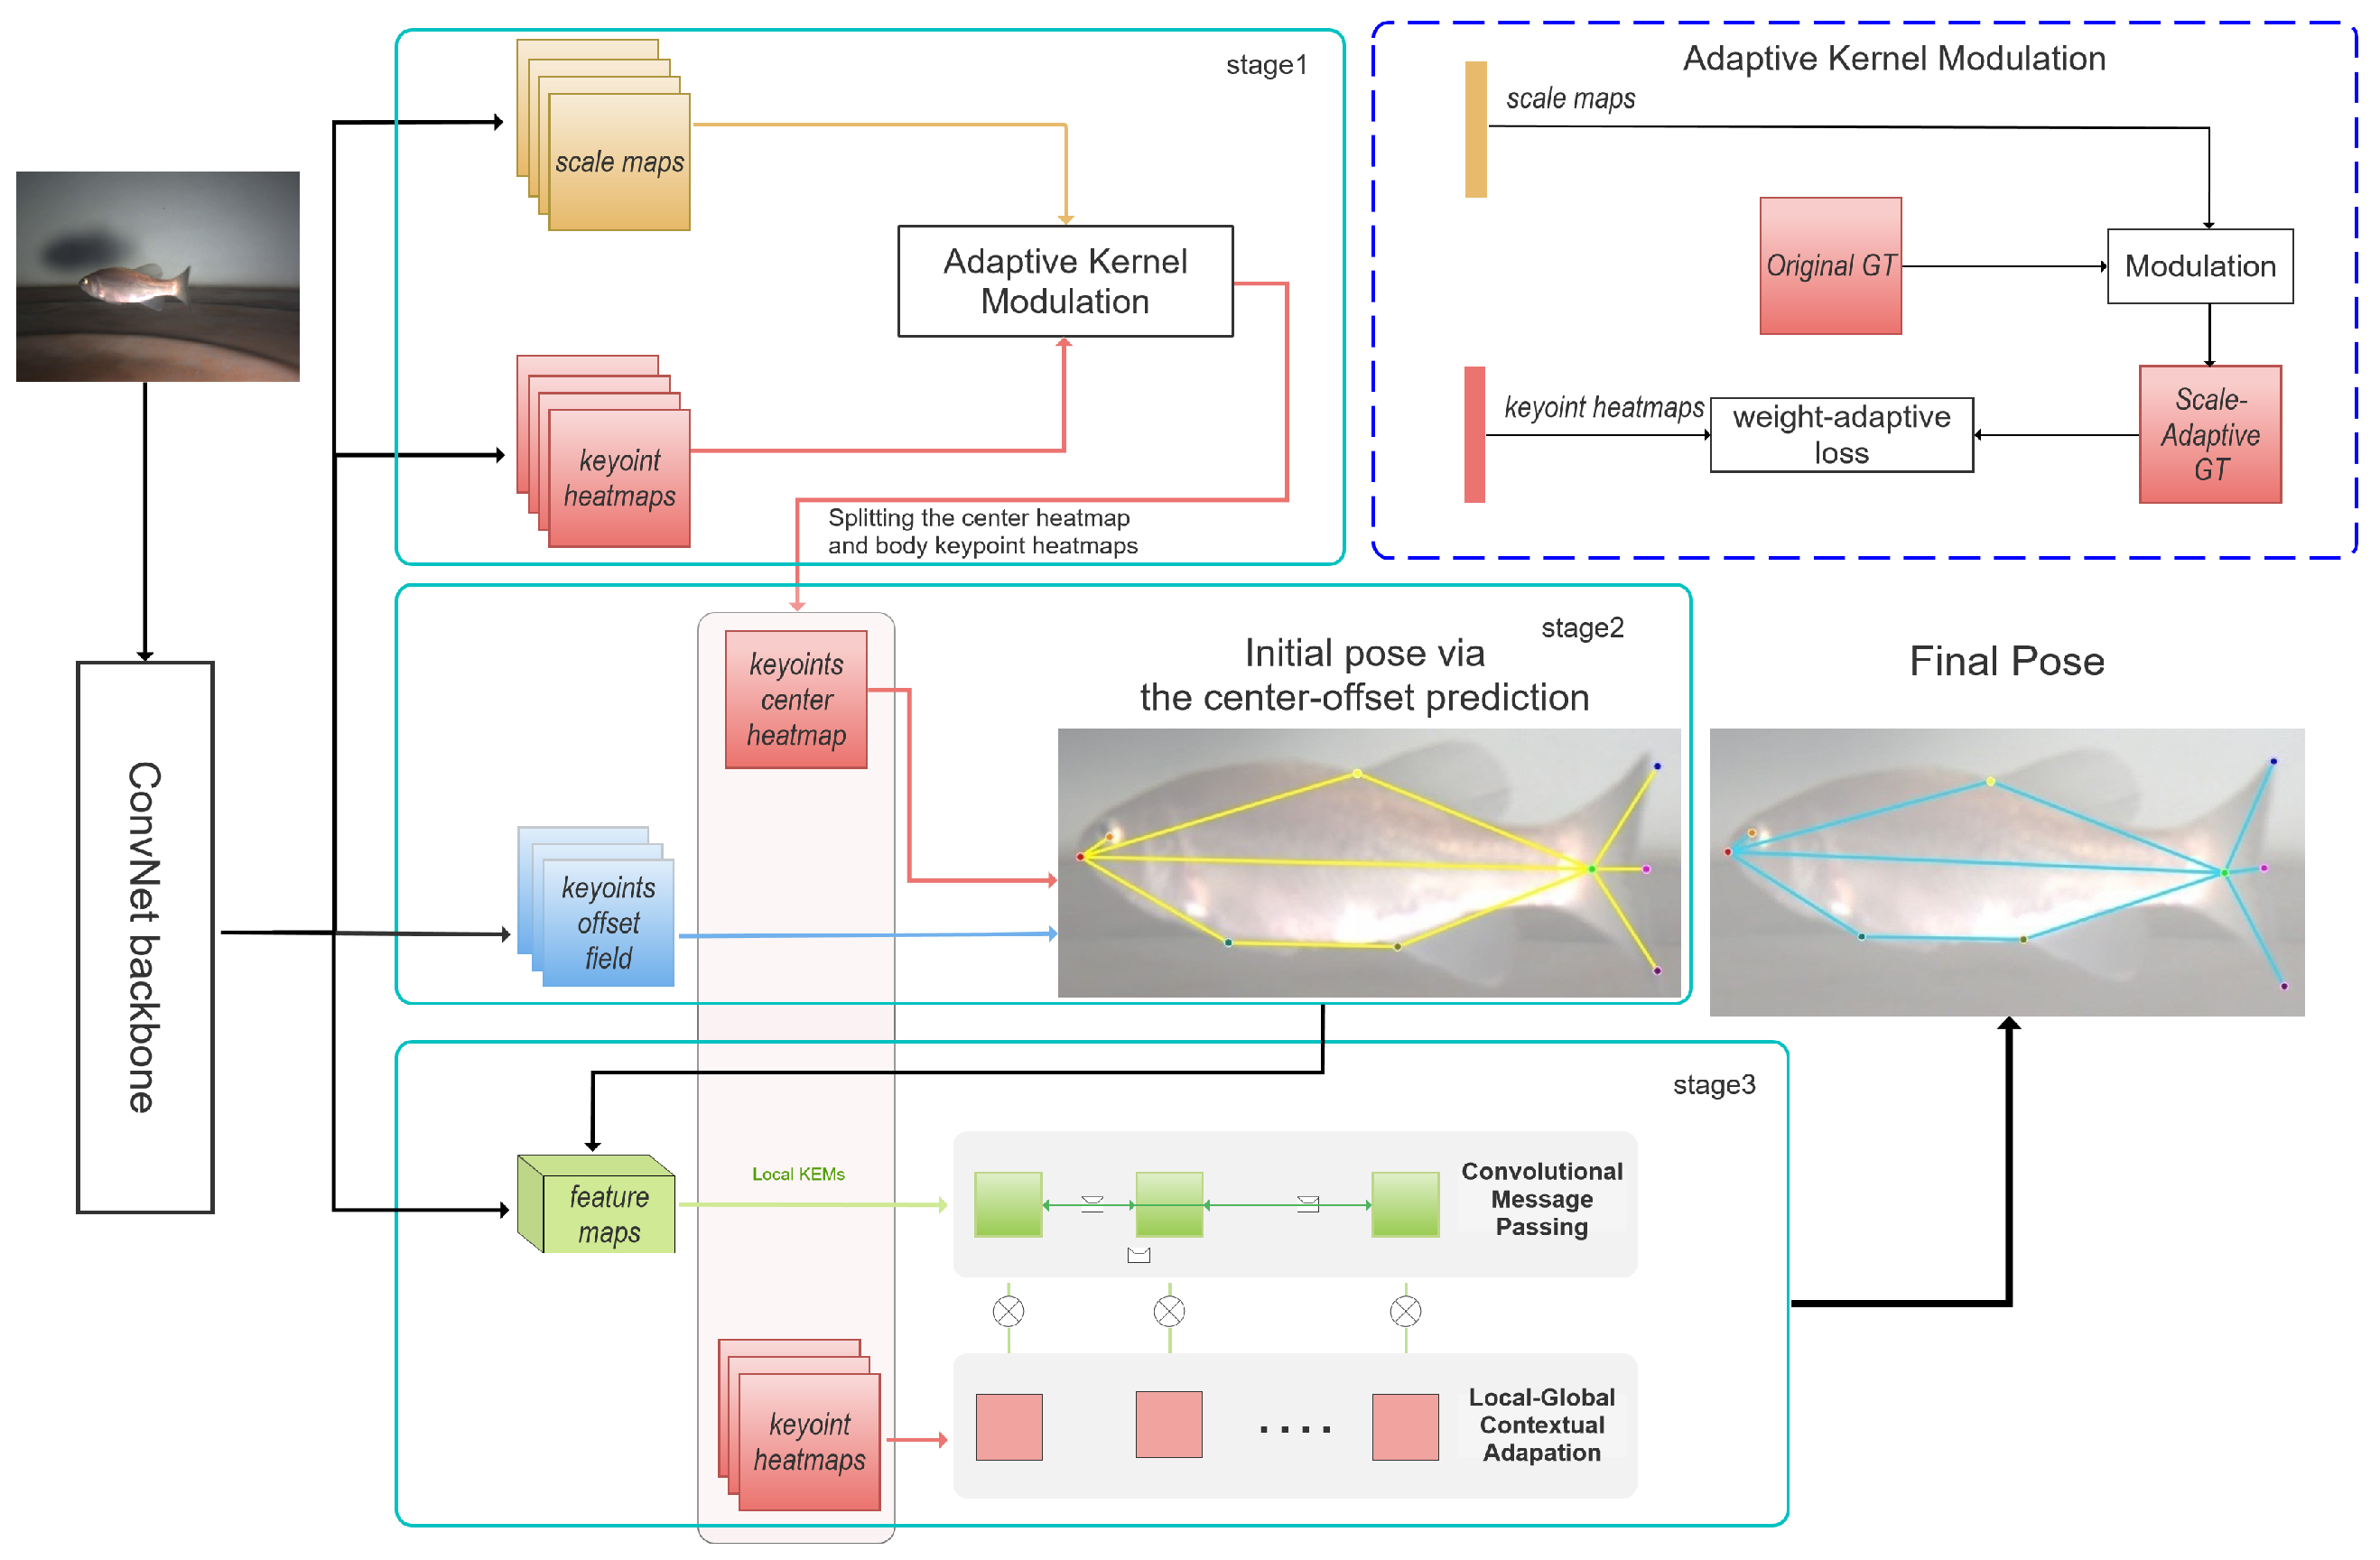
Inspired by LOGOCAP [26], the AHSC-Net proposed in this paper first extracts deep visual features of the input image through the backbone network, and then gradually predicts and outputs the precise pose of the fish body through three coarse-to-fine progressive stages. In the first stage, the network performs keypoint prediction for the fish body based on 9 + 1 keypoint heatmaps refined by adaptive kernel modulation (corresponding to the 9 annotated keypoints in the dataset and 1 additional local center keypoint). In the second stage, the initial pose of each fish is estimated using the predicted center keypoint and its associated offset vectors. In the third stage, the network deeply fuses the keypoint heatmaps generated in the first stage with the initial poses obtained in the second stage. Through a convolutional message passing module and a “local-global” context adaptation module, it further refines and outputs the precise fish poses. The architecture of AHSC-Net is illustrated in Figure 2, utilizing HRNet-W32 [17] as the backbone.
The specific process of the third stage is as follows: First, each coarse keypoint is expanded to generate a local sampling grid (Keypoint Expansion Maps, KEMs). Next, feature sampling is performed on the deep feature map based on this sampling grid to obtain latent spatial features fused with local context information. On this basis, a convolutional message passing module is adopted to learn the topological structural constraint relationships between various keypoints of the fish body, and generate the corresponding Keypoint Attraction Maps (KAMs) for each keypoint, which acts as a dynamically learned local refinement filter. Finally, in the "local-global” context adaptation step, KAMs are used to perform convolution operations on the heatmaps extracted with the initial keypoints as the center, thereby guiding the keypoints to more precise positions and completing the prediction of the final pose.

2.3.1. Stochastic Local Centroid Sampling Strategy

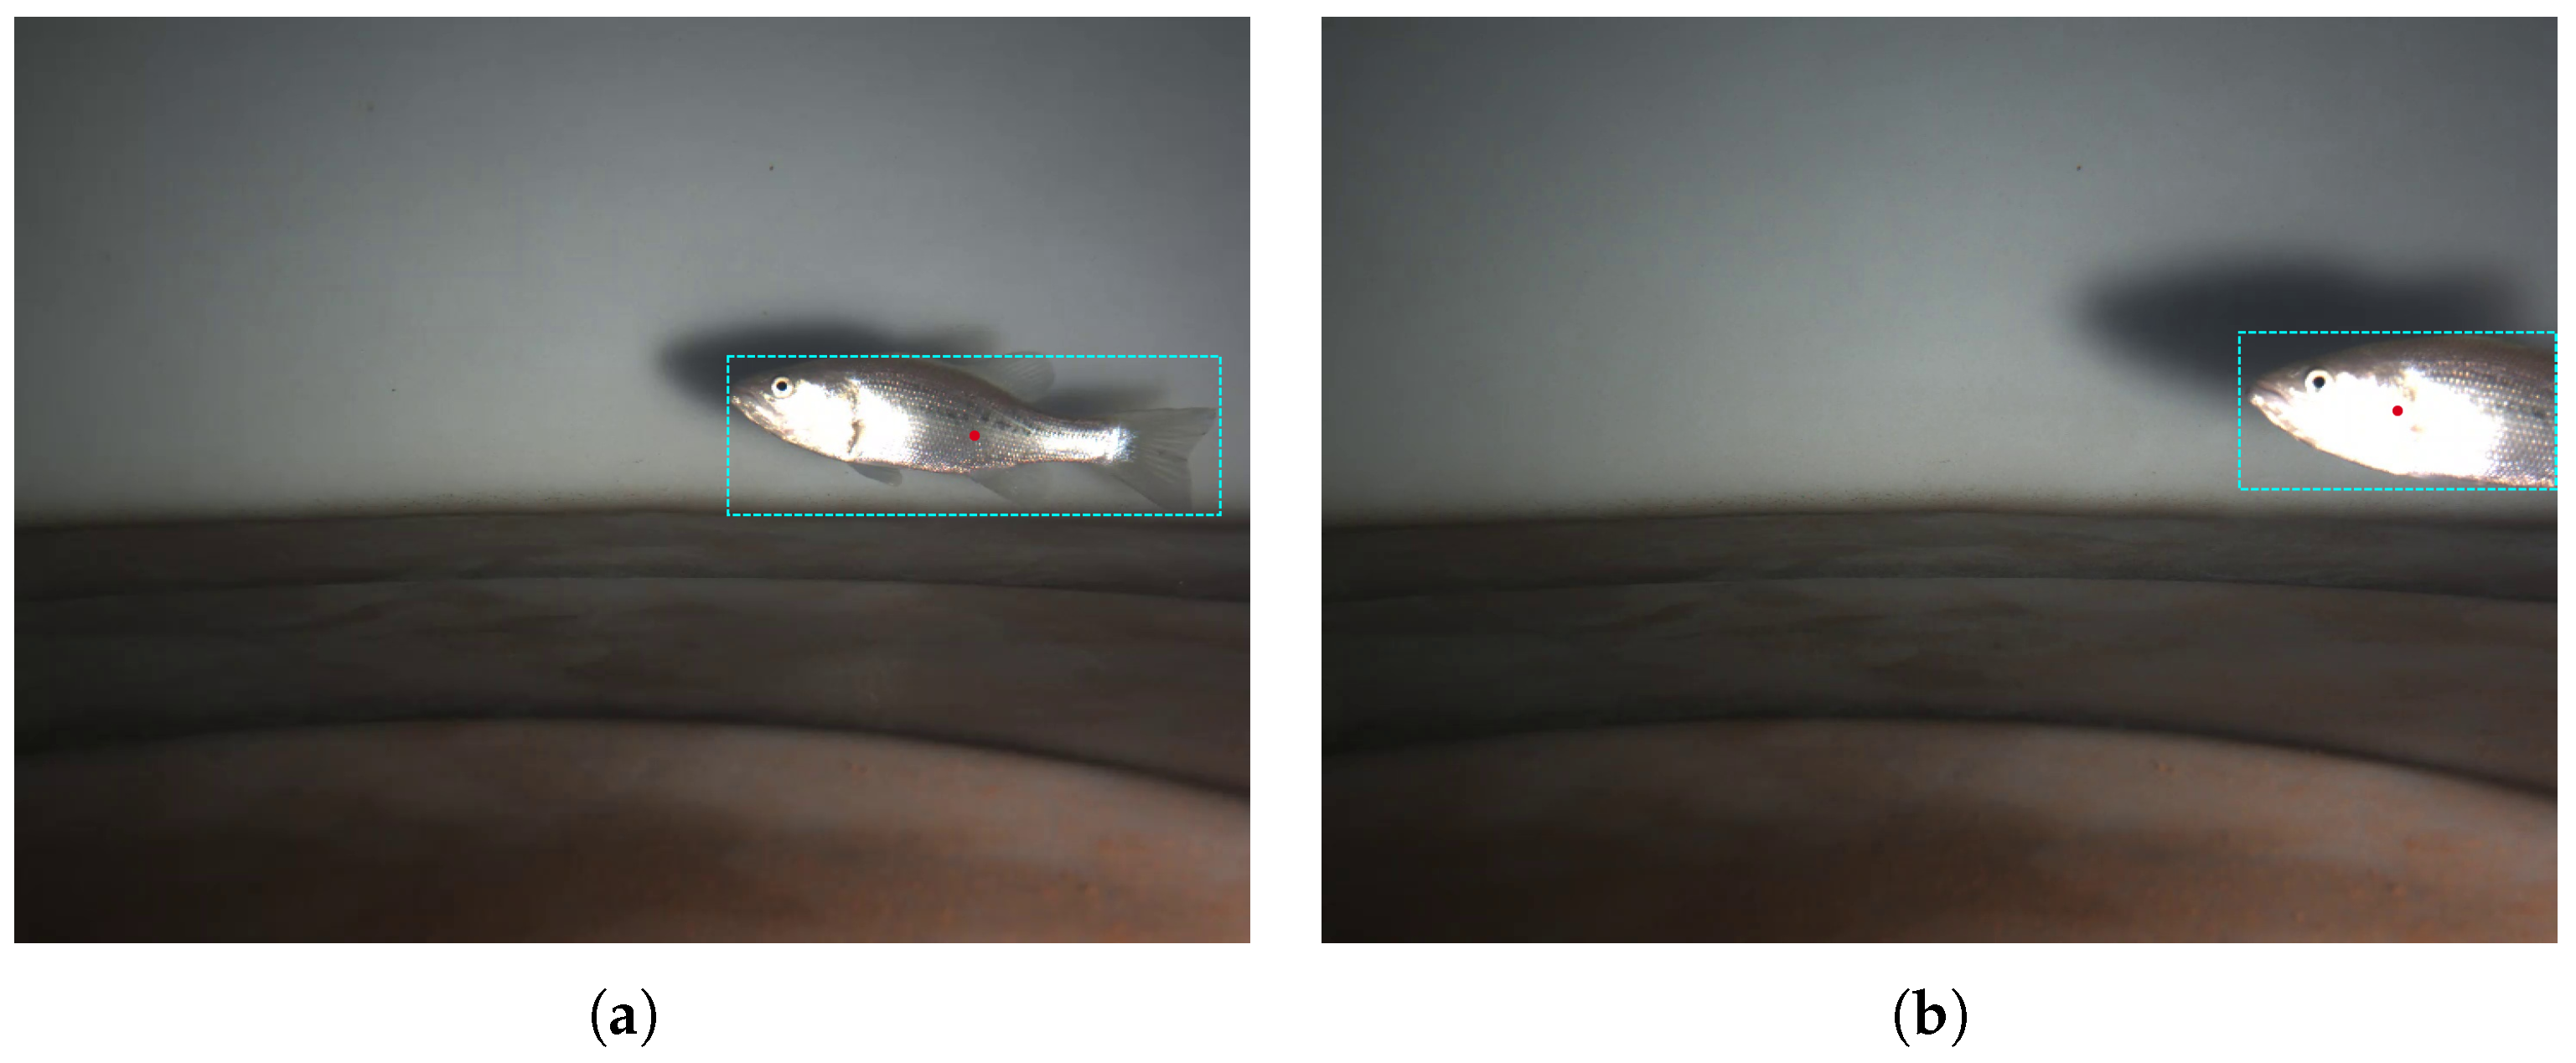
In algorithms that use the center point for pose prediction, the center of the target detection bounding box is usually adopted as the supervision signal. Pose prediction with the center point as the anchor can provide a core basis for the individual association of multi-instance keypoints, simplify the pose decoupling process in dense fish school scenarios, and reduce the learning difficulty of pose estimation, and is a mainstream solution for multi-target pose estimation. However, this definition has an obvious performance bottleneck when dealing with severely occluded fish targets: for fish with part of the body outside the image or severely occluded, the center of their target detection bounding box will shift significantly relative to the bounding box for a complete fish body. For example, when the posterior part of a fish is outside the image or severely occluded, the center of the bounding box will shift substantially towards the head, which causes a severe mismatch with the statistical regularity that “the center point is located in the middle-posterior part of the fish body” learned by the model from a large number of complete samples, as shown in Figure 3.
Such “hard samples” generally account for a low proportion of the dataset. Consequently, the model tends to treat them as noise during the optimization process, leading to insufficient localization capability for occluded targets and ultimately causing missed detections or degraded keypoint regression accuracy. A naive solution is to create center points at more locations on the fish body, enabling the model to effectively adapt to these center points located in rare parts. To this end, this paper proposes a Stochastic Local Centroid Sampling (SLCS) strategy. This strategy dynamically samples the centroid of local keypoints of the fish body as the center point supervision signal during the training phase, simulates the center offset characteristics of occlusion scenarios, improves the model’s ability to accurately identify the fish body and corresponding keypoints when part of the fish body is clearly visible, and enhances the model’s perception and reasoning ability in difficult scenarios.
To establish a more robust regression baseline, we define the regression center as the geometric centroid of all annotated keypoint sets, establishing a direct linear mapping with the core skeleton of the fish body. We divide the 9 keypoints (see Table 1) into two subsets with topological representativeness:
  • Anterior Anatomical Group ( K a n t ): Includes the mouth, eye, dorsal fin, and ventral fin, representing the core structure of the anterior part of the fish body.
  • Posterior Anatomical Group ( K p o s ): Includes the four corner points of the caudal fin and the anal fin, representing the structure of the posterior part of the fish body.
During the model training phase, to artificially simulate the distribution shift of center point supervision signals caused by occlusion, we perform stochastic local centroid sampling with a preset probability for complete individuals in the samples where all keypoints are clearly visible:
1.
Randomly select a subset from either K a n t or K p o s .
2.
Subsequently, calculate the local centroid of the keypoints within this subset as the ground truth center point for the current sample.
In this way, the model receives supervision signals similar to the features of real occlusion scenarios more frequently during training, thereby improving its detection performance in such cases. This practice may result in multiple predicted center points for the same fish. However, since the probability of switching the center point to the centroid of a different anatomical subset is low, the additional center points produced have very low confidence values. In the subsequent processing stage, we can easily eliminate them and retain only the pose result with the highest confidence as the final output.

2.3.2. Spatial-Awareness Enhanced Pose Structural Constraint

In our pose detection algorithm, the accuracy of offset regression directly determines the quality of the initial pose. However, the traditional offset regression loss function usually predicts the spatial displacement of each keypoint independently, completely ignoring the natural geometric topological constraints in the anatomical structure of the fish body, which is very easy to generate unreasonable poses with structural distortion in underwater occlusion or low-contrast scenarios. Secondly, the inherent translation invariance of standard convolution makes the model lack absolute coordinate reference in the regression process, which further amplifies the prediction error of the offset. To systematically solve the above problems, this paper proposes a Spatial-Awareness Enhanced Pose Structural Constraint (SAPSC). To endow the network with spatial awareness capability, we embed normalized coordinate information into the feature map extracted by the backbone network, as shown in Figure 4.
Specifically, two coordinate channels are generated for the input feature map: a horizontal coordinate channel i and a vertical coordinate channel j, with element values linearly normalized to the range [ 1 , 1 ] . By concatenating them with the original feature map along the channel dimension, an enhanced feature map is formed. This design breaks the limitation of missing absolute position awareness in convolution operators, providing a global spatial position reference for offset regression.
However, relying solely on coordinate-aware local feature extraction is still insufficient to avoid pose distortions under complex occlusions. Therefore, we introduce pose structural constraints. We abstract the fish pose as a graph structure where keypoints serve as vertices and connections between adjacent keypoints serve as “bones”. Let β be the set of bones, where each bone b i , j β represents the geometric vector pointing from keypoint i to keypoint j. By constructing a pose structural constraint loss function, the model is compelled to adhere more strictly to the inherent physical constraints of the fish body when predicting offsets. The pose constraint loss function is divided into bone length ratio constraint and bone angle constraint.
Bone Length Ratio Constraint: We choose length ratio rather than absolute length as the constraint term, aiming to eliminate the inconsistency of loss intensity under different scales. If absolute length constraints were used, the loss magnitude generated by large-scale targets would be significantly higher than that of small-scale targets, causing the optimization process to bias towards large fish samples and thereby weakening the model’s topological reasoning ability for small fish. Let the coordinates of two adjacent predicted keypoints P ^ n and P ^ m be ( x ^ n , y ^ n ) and ( x ^ m , y ^ m ) respectively. The pixel length l ^ i of the i-th bone segment formed by them is calculated as follows:
l ^ i = ( x ^ n x ^ m ) 2 + ( y ^ n y ^ m ) 2
Let Ω be the set of bone pairs in the dataset. For any pair of bones, their predicted ratio R ^ i , j and ground truth ratio R i , j g t are expressed as:
R ^ i , j = l ^ i l ^ j , R i , j g t = l i g t l j g t
Since significant size differences in various skeletal parts lead to extremely large spans in ratio values, directly using L1 loss makes it easy for the model to excessively focus on errors between bone pairs with large ratio differences. We adopt logarithmic transformation to enable the model to fairly learn skeletal structural features of different magnitudes:
L r a t i o = ( i , j ) Ω ln ( R ^ i , j ) ln ( R i , j g t )
Bone Angle Constraint: The swimming pose of fish is strictly limited by the physiological bending angle of its skeleton. To constrain the rationality of the predicted pose, this paper introduces an angle constraint based on trigonometric function decomposition. Define the unit direction vectors of two adjacent bones sharing the same joint as e i and e j , and set the physiological bending angle between them as θ . The cosine and sine components of the included angle are extracted through 2D vector dot product and scalar cross product respectively, to realize scale-free and differentiable modeling of the included angle:
cos θ = e i · e j sin θ = e i × e j
In the formula, · is the 2D vector dot product, and × is the 2D vector scalar cross product. The combination of the two can uniquely determine the magnitude and bending direction of the joint angle. Finally, the angle consistency loss is defined as the sum of the differences between the model predicted values and the ground truth values calculated from annotations on these two components:
L a n g l e = ( i , j ) Φ cos θ ^ i , j cos θ i , j g t + sin θ ^ i , j sin θ i , j g t
where Φ is the set of adjacent skeletal joints, θ ^ is the joint bending angle predicted by the model, and θ g t is the ground truth calculated from annotations.
Total Loss Function: Thus, the total loss function is shown in Equation (6). By introducing L b o n e , the gradient can be back-propagated from the global structural deviation to the local offset prediction head, thereby forcing the model to establish a global topological cognition of the fish body structure during the training phase, and improving the accuracy of pose generation of the model in complex underwater environments.
L b o n e = λ a n g l e L a n g l e + λ r a t i o L r a t i o
where λ a n g l e and λ r a t i o are hyperparameters to balance the weights of the two loss terms.
In summary, this synergy ensures that SAPSC effectively guides initial pose generation through offset regression. While structural losses internalize anatomical priors during training, coordinate embedding provide the necessary spatial context during inference, enabling the model to directly regress anatomically consistent poses.

2.3.3. Optimization of Keypoint Regression Based on Adaptive Kernel Modulation

In complex underwater scenarios, accurate keypoint localization faces dual challenges. First, the imaging blur and contour degradation caused by water scattering significantly increase the difficulty for the model to extract stable features. Second, the mismatch of supervision signals caused by drastic changes in target scale: fish schools are distributed at different distances in the scene, resulting in significant differences in their pixel sizes in the image. The fixed-scale static Gaussian kernel supervision signal used in traditional keypoint heatmap regression is difficult to adapt to the changes in keypoint sizes.
To address the aforementioned problems, inspired by SWAHR [29], this paper introduces an Adaptive Kernel Modulation Module (AKMM). Its core logic lies in no longer relying on preset static Gaussian kernels, but instead enabling the model to autonomously predict kernel parameters that best match the current visual features. As shown in the schematic diagram of the Adaptive Kernel Modulation Module in Figure 2, the AKMM runs in parallel with the heatmap prediction head, sharing the deep features of the backbone network, and outputs a scale modulation map consistent with the size of the heatmap. The scale modulation map predicts a scale factor S k ( i , j ) for each keypoint k at its corresponding spatial location ( i , j ) . This factor represents the model’s real-time perception of local spatial scale and localization difficulty. Through this factor, the model acquires the ability to dynamically modulate the standard deviation of the Gaussian kernel:
σ s c a l e = σ k · S k ( i , j )
When the boundaries of target keypoints are blurred, AKMM expands the effective coverage range of the Gaussian kernel by outputting larger modulation factors, thereby enhancing the model’s tolerance to annotation deviations; whereas when the target scale varies drastically, AKMM can adaptively adjust the kernel size according to the target’s actual pixel span, thereby eliminating the mismatch between fixed-scale supervision signals and targets of different scales.
To efficiently implement the kernel modulation strategy during training, directly recalculating the Gaussian distribution would incur enormous computational costs. Therefore, we employ a second-order Taylor expansion to approximate the supervision signal with a polynomial. Given that the standard Gaussian heatmap is defined as H g t = exp ( Δ 2 / 2 σ k 2 ) , when the scale factor is introduced, the target dynamic heatmap can be expressed as H s c a l e d _ g t = ( H g t ) 1 / S 2 . Thus, we observe that H s c a l e d _ g t and H g t share a power relationship. To simplify computation and enhance gradient stability, we let H s c a l e d _ g t = ( H g t ) 1 + S and perform the expansion at the standard scale. Let d i s = log ( H g t ) denote the logarithmic distance factor from the pixel to the Gaussian center; the dynamic heatmap can be approximated by the following polynomial form:
H s c a l e d _ g t = H g t + H g t d i s S p r e d + 1 2 H g t d i s 2 S p r e d 2
Equation (8) transforms complex power operations into efficient multiply-add operations. While preserving the physical meaning of kernel modulation, it significantly optimizes computational efficiency, providing robust mathematical support for AKMM to perceive visual dispersion in real-time.
The loss function for adaptive kernel modulation consists of two parts. The first is the scale regularization loss L s c a l e , used to constrain scale prediction and prevent the model from increasing the kernel range without limit to reduce fitting difficulty:
L s c a l e = 1 N k = 1 K + 1 i , j M ( i , j ) · ( S p r e d , k ( i , j ) ) 2
The second is the dynamic heatmap loss L h m . Since the kernel modulation process alters the coverage area of foreground regions, it further exacerbates sample imbalance. To address this, we integrate a weight-adaptive mechanism to dynamically reconstruct the regression loss by constructing a spatial weight matrix:
L h m = 1 N k = 1 K + 1 i , j W ( i , j ) · M ( i , j ) · ( H p r e d , k ( i , j ) H s c a l e d _ g t , k ( i , j ) ) 2
where the balancing weight W borrows the design idea of Focal Loss, automatically adjusting the loss contribution based on the difference between the ground truth heatmap and the predicted response:
W = | 1 H p r e d | H g t + H p r e d ( 1 H g t )
Consequently, AKMM can automatically down-weight easy-to-learn background samples, enabling the model to focus on difficult keypoint regions. Through the kernel modulation mechanism of AKMM, the keypoint detection accuracy of the model in complex underwater environments is systematically improved.

3. Experimental Results

3.1. Evaluation Metrics

In this study, the Average Precision (AP) and Average Recall (AR) are adopted to evaluate the model’s performance. AP is the primary benchmark metric in the field of pose estimation, ranging from 0 to 1, and is used to quantify the comprehensive localization accuracy of the proposed model under different thresholds. A higher AP score indicates more precise spatial localization of keypoints by the model. AR is a key metric for assessing the completeness of model detection, also ranging from 0 to 1. A higher AR score indicates more comprehensive coverage of targets by the model and fewer missed detections. The calculation of AP relies on Object Keypoint Similarity (OKS) to evaluate the similarity between predicted keypoints and ground truth annotations. The specific calculation formula for OKS is shown in Equation (12):
O K S = i exp d i 2 2 s 2 k i 2 δ ( v i > 0 ) i δ ( v i > 0 )
where i denotes the index of the keypoint, d i represents the Euclidean distance between the i-th predicted keypoint and the annotation, s represents the scale factor of the object, and k i represents the normalization factor for the i-th keypoint, reflecting the annotation difficulty or tolerance for that specific keypoint. v i indicates the visibility of the i-th keypoint, and δ ( v i > 0 ) is an indicator function, meaning the keypoint participates in the calculation only when it is annotated.
After calculating the OKS value, a threshold t is set. If a prediction’s OKS exceeds this threshold, the prediction is classified as a True Positive. Conversely, if it does not reach the threshold, it is classified as a False Positive. The calculation method for A P t is detailed in Equation (13):
A P t = p δ ( O K S > t ) p 1
where t represents the set threshold, and P denotes the current annotated targets. In our evaluation metrics, A P 50 indicates a threshold t of 0.5, and A P 75 indicates a t of 0.75. Average Precision (AP) is the mean of A P t calculated at 10 discrete OKS thresholds ranging from 0.50 to 0.95 (with a step size of 0.05), calculated as follows:
A P = 1 | T | t T A P t , T = { 0.5 , 0.55 , , 0.95 }
Average Recall (AR) is similarly the mean value calculated at OKS thresholds ranging from 0.50 to 0.95. The calculation formula is as follows:
A R = 1 | T | t T T P t N g t , T = { 0.5 , 0.55 , , 0.95 }
where T P t represents the number of ground truth targets successfully detected at threshold t, and N g t represents the total number of ground truth target instances present in the image.

3.2. Comparison with Other Methods

We reproduced bottom-up algorithms that perform excellently in pose estimation tasks to conduct fish pose estimation and performed a comparative analysis with our AHSC-Net. These algorithms include HRNet [17], HigherHRNet [30], and DEKR [31]. The results are shown in Table 2, indicating that our algorithm surpasses other algorithms in both precision and recall.
In terms of precision, our algorithm is 2.9 percentage points higher than HigherHRNet, 2.7 percentage points higher than HRNet, and significantly outperforms DEKR by 9.8 percentage points. Regarding recall, our algorithm far exceeds the others. Our AR value improves by 4.2 percentage points compared to HigherHRNet, 3.2 percentage points compared to HRNet, and 5.3 percentage points compared to DEKR. These data demonstrate that AHSC-Net consistently maintains advantages over mainstream methods in terms of both Average Precision and Average Recall.
In fish keypoint detection research, models based on YOLO-Pose are among the commonly used baseline methods. To comprehensively evaluate the performance advantages of the AHSC-Net model in complex underwater scenarios, we reproduced and compared the YOLOv8-pose and the latest YOLOv11-pose series models officially released by Ultralytics. Representative versions from each series, including balanced (m), large (l), and extra-large (x) models, were selected for performance benchmarking. Additionally, we note that the standards used by the YOLO-Pose series when calculating custom keypoint metrics differ from mainstream pose estimation models such as HRNet. To eliminate evaluation bias, we unified the detection results of all YOLO models into the COCO format and recalculated them based on the pycocotools tool using evaluation standards consistent with our model. The final comparison results are shown in Table 3.
Analysis of Table 3 reveals that the proposed AHSC-Net model significantly outperforms all YOLO-Pose baseline models in key metrics such as Average Precision and Average Recall. Even when compared with YOLOv8x-pose and YOLOv11x-pose, two mainstream pose estimation models with extremely large parameter scales and strong regression capabilities, AHSC-Net still exhibits significant performance superiority. Specifically, compared with YOLOv8x-pose, AHSC-Net achieves a 3.2 percentage point improvement in AP and a 4.2 percentage point improvement in AR; even against the newer-generation YOLOv11x-pose, AHSC-Net still outperforms it by 3.5 percentage points in AP and 4.6 percentage points in AR. While AHSC-Net has a longer inference time, the significant gains in precision and recall represent a worthwhile trade-off for precision aquaculture, especially considering that the YOLO-Pose series benefits from extensive framework-level engineering optimizations.

3.3. Ablation Experiments

In this section, we designed a series of experiments to verify the effectiveness of the strategies and components proposed in this paper. The experimental results are presented in Table 4.
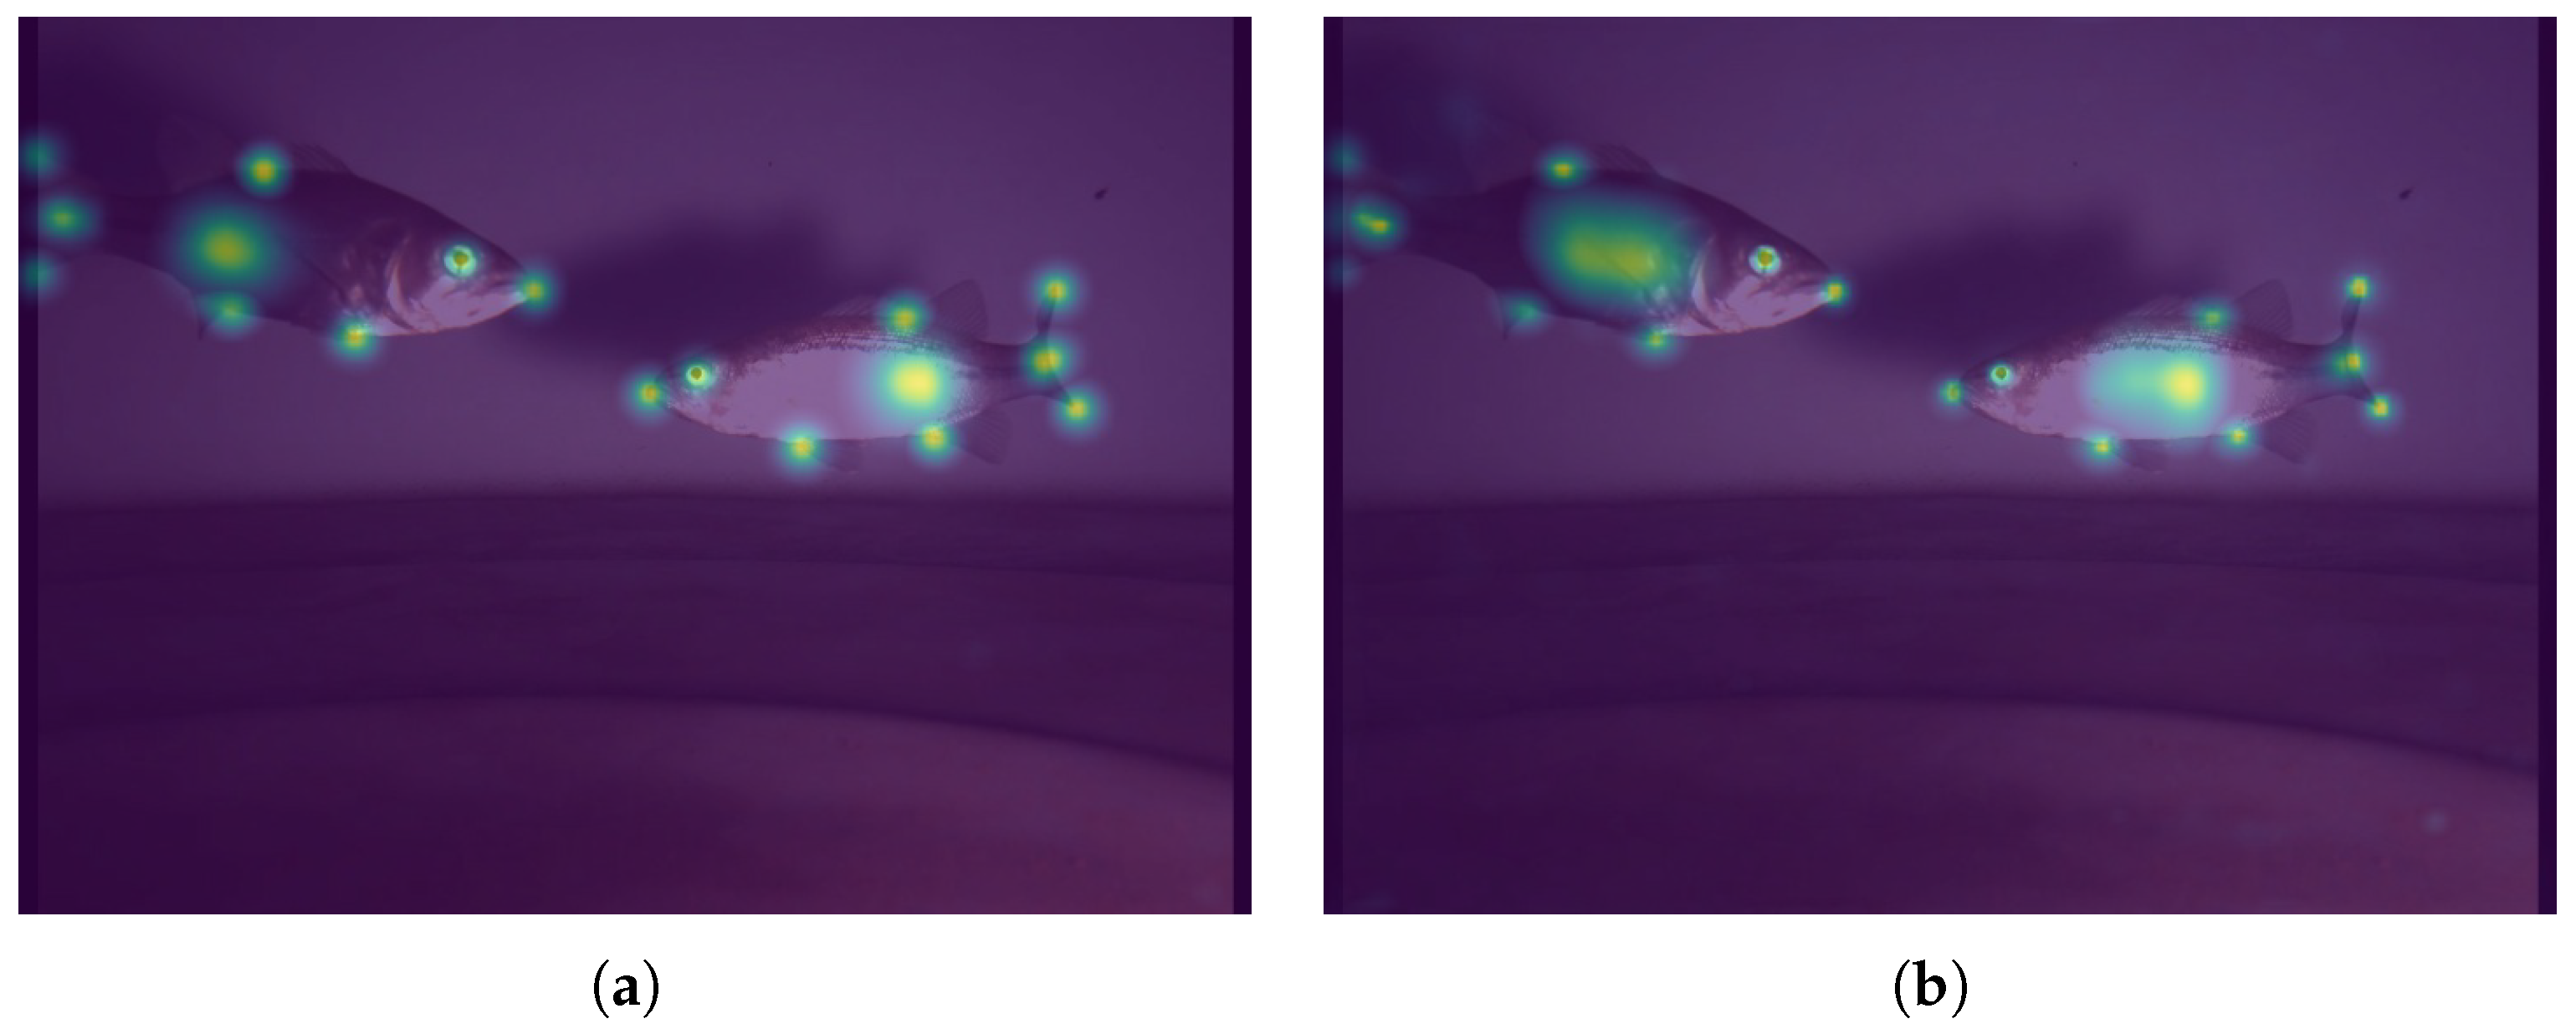
After introducing the Stochastic Local Centroid Sampling strategy, the model’s performance improves, with AP increasing by 0.9% and AR by 1.1%. SLCS enables the model to focus more precisely on the keypoints of fish in hard samples, thereby improving both recognition accuracy and recall. After introducing the SAPSC strategy, the model’s AP increases by 0.7%, and AR increases by 1.3%. SAPSC endows the network with spatial position awareness and allows the model to learn the inherent pose structure of the fish body, thereby reducing pose distortion problems prone to occur in low-contrast underwater backgrounds. After introducing AKMM, the model’s AP reaches 91.5%, an improvement of 0.9% over the baseline. AKMM can adaptively generate supervision heatmaps that match the target’s visual features, eliminating the regression bias caused by fixed Gaussian kernels and thus improving detection accuracy. Figure 5 shows the comparison of keypoint heatmaps before and after improvement.
When all improvements are integrated, AHSC-Net achieves the best performance, reaching 92.0% AP and 94.6% AR. Compared to using none of the three improvements, AP and AR increase by 1.4 percentage points and 2.6 percentage points, respectively. This indicates that SLCS, SAPSC, and AKMM possess good complementarity in addressing the difficulties encountered in complex underwater environments.
Furthermore, to ensure the robustness and statistical significance of our proposed innovations, we conducted an additional 5 training runs for both the baseline model before improvements and the final AHSC-Net after improvements. Across these evaluations, the baseline model yielded an AP of 90.48% ± 0.20% and an AR of 91.80% ± 0.19%, whereas the final AHSC-Net achieved an AP of 91.90% ± 0.10% and an AR of 94.70% ± 0.22%. The consistently low standard deviations confirm the stability of the models. Paired t-tests between the two models resulted in p-values of p < 0.01 for both AP and AR, providing strong statistical evidence that the proposed method brings a highly significant and robust performance enhancement over the baseline.

3.4. Pose Estimation Visualization

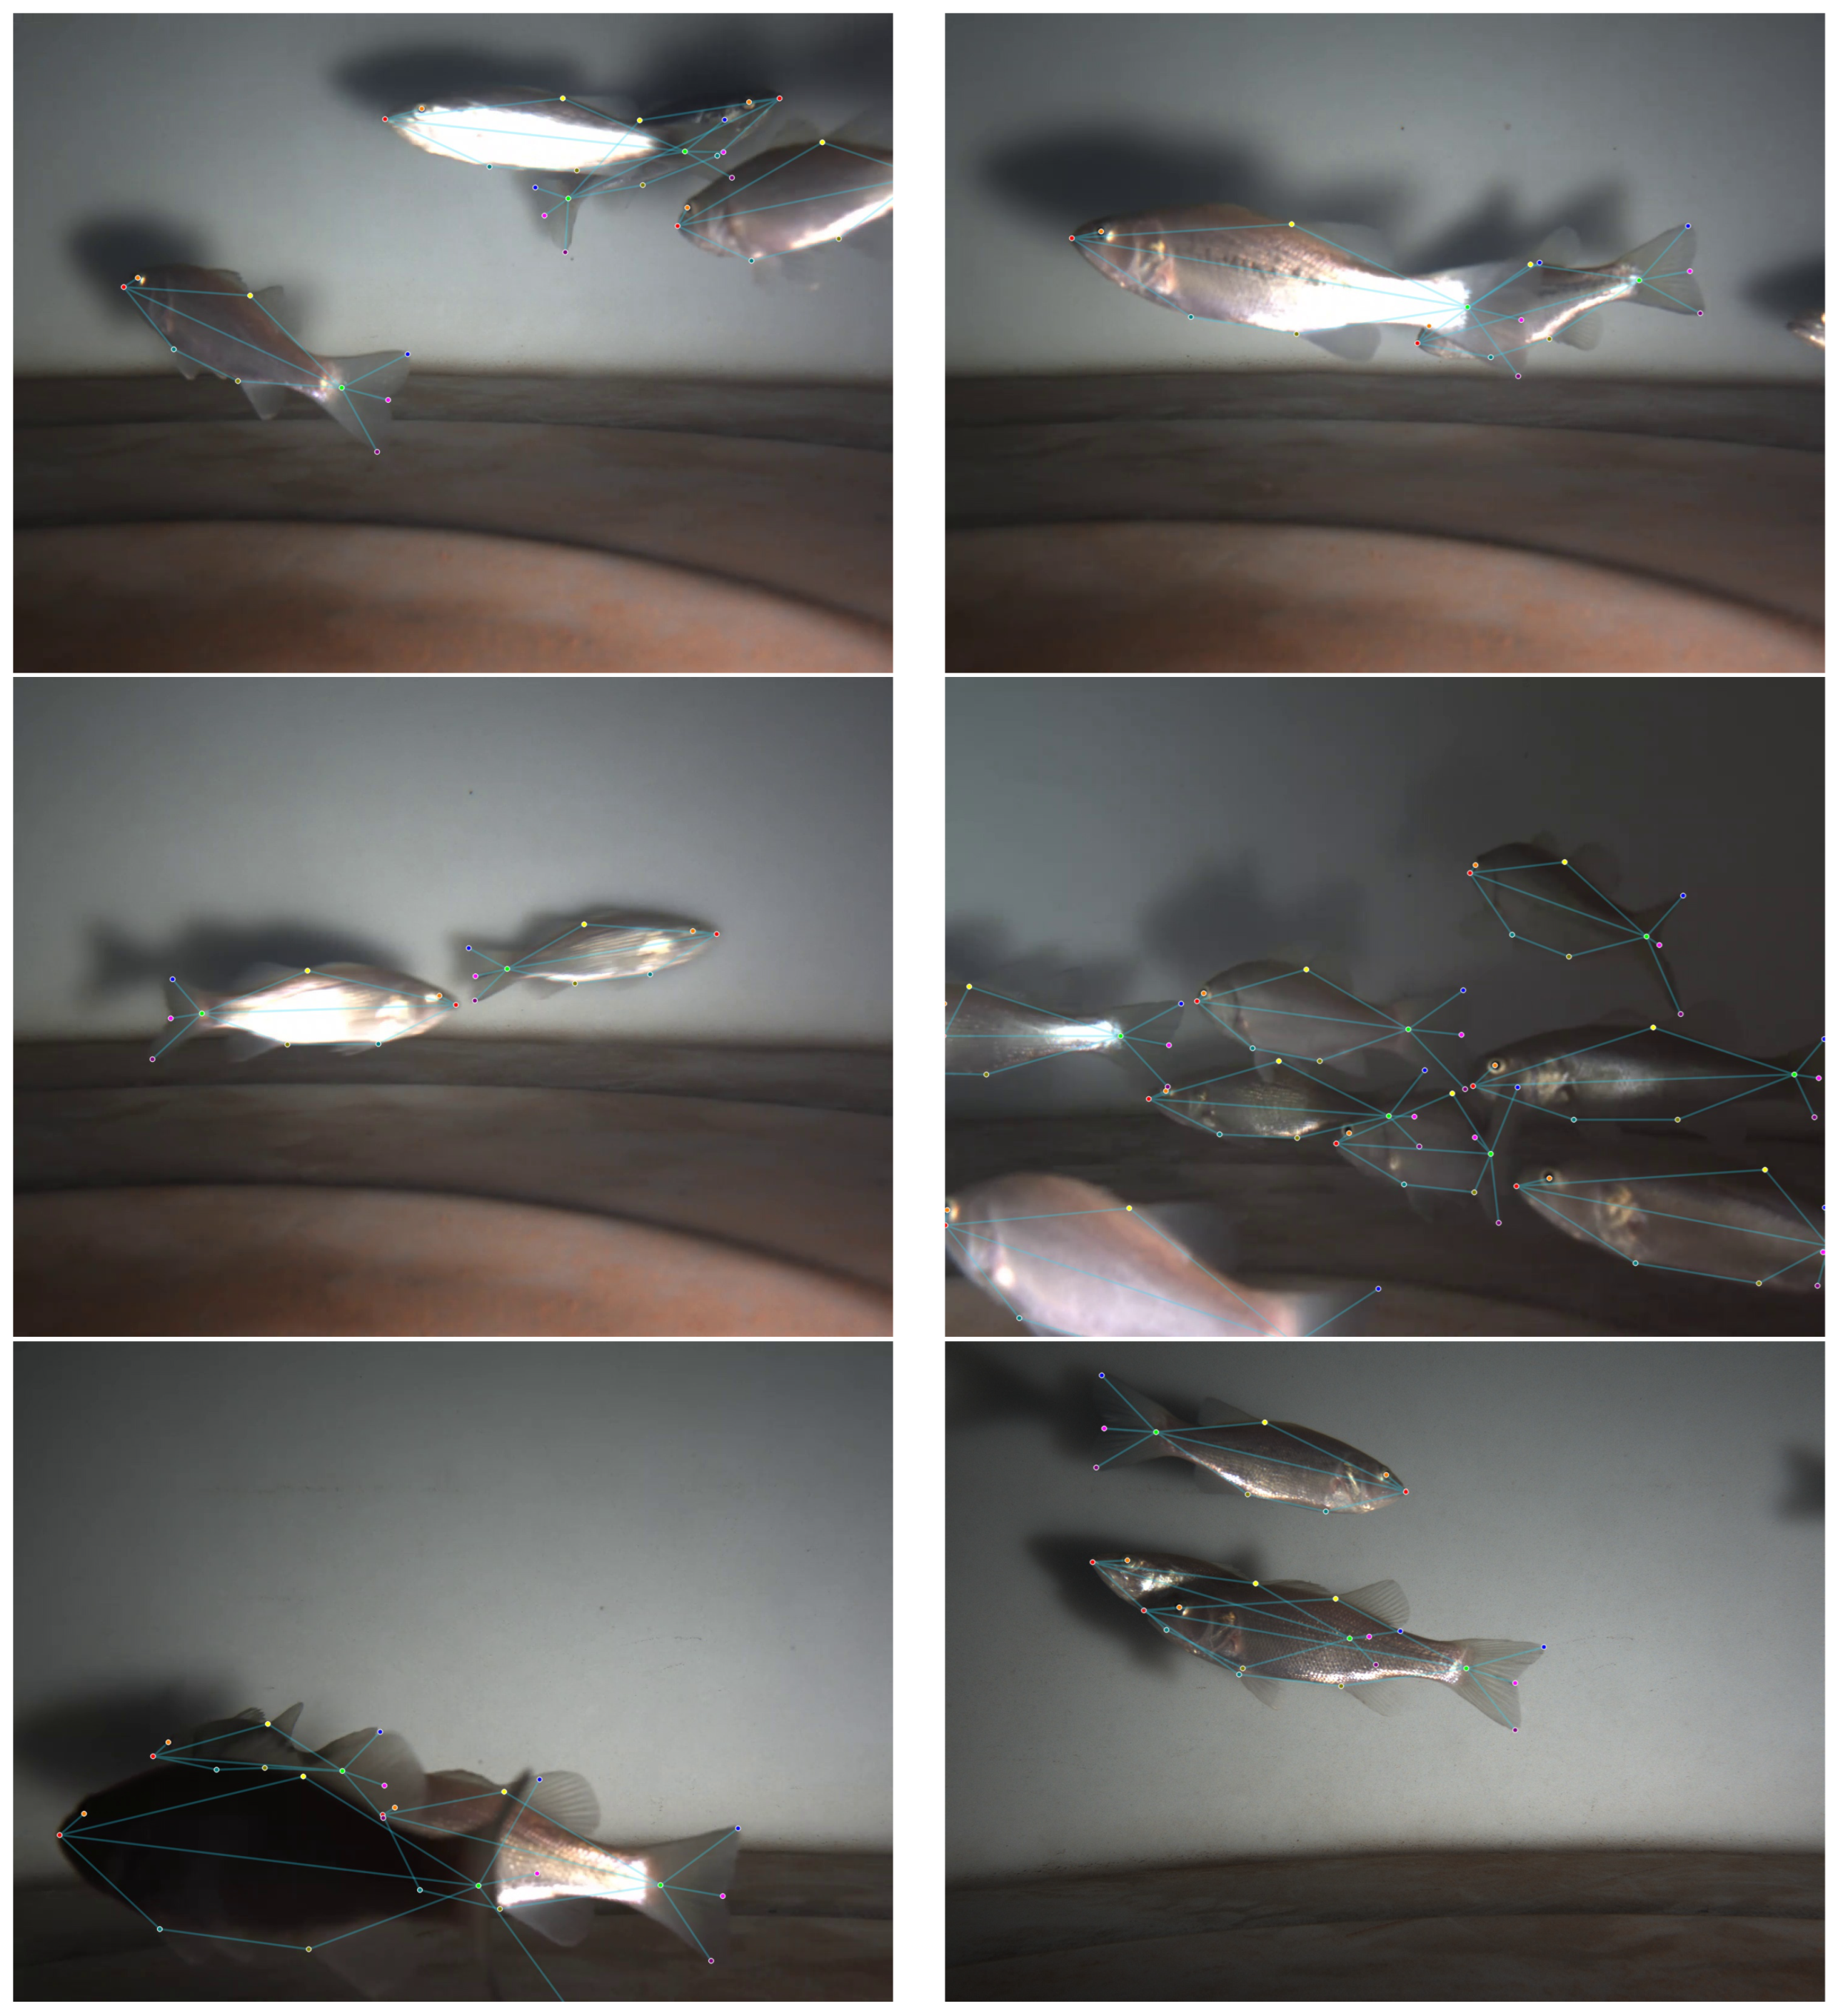
We conducted experiments on the Bass Pose Estimation Dataset. To visually demonstrate the performance of the pose estimation model, 6 images with detection results from the test set were selected for pose recognition and visualization, and the outcomes are shown in Figure 6. For images where fish are clearly visible and complete, AHSC-Net achieves exceptionally accurate keypoint detection. Notably, the model demonstrates high robustness and maintains precise prediction capabilities even for targets with moderate motion blur or lightweight inter-individual occlusion. To further characterize the performance boundaries of AHSC-Net, typical failure scenarios are illustrated in the last two images of Figure 6. These failures are primarily attributed to two environmental factors: (1) extreme low-light conditions, where the fish body appears as a silhouette, leading to the near-total loss of discriminative visual features, and (2) severe inter-individual occlusion, where key body parts are physically obstructed, creating high spatial ambiguity. These examples infer that feature deprivation remains a bottleneck for single-frame pose estimation, and in the future, we might consider employing image enhancement pre-processing to recover suppressed structural details in low-light scenarios, as well as integrating temporal trajectory modeling to potentially resolve these spatial ambiguities.

3.5. Hyperparameter Optimization

To ensure optimal performance and a fair comparison across different architectures, a systematic grid search strategy guided by the validation set was employed. For the baseline models, we utilized their official pre-trained weights and initial optimal settings, followed by localized fine-tuning to adapt to our dataset. For the proposed AHSC-Net, we conducted detailed ablation studies on critical hyperparameters. Firstly, exploring the initial learning rate within { 0.01 , 0.001 , 0.0001 } , we found that 0.001 yielded the optimal performance (AP = 92.0 % , AR = 94.6 % ), significantly outperforming 0.01 (AP = 83.1 % , AR = 89.0 % ) and marginally surpassing 0.0001 (AP = 91.6 % , AR = 93.9 % ). Furthermore, holding the optimal initial learning rate constant, we investigated the learning rate decay factor within { 0.1 , 0.25 , 0.5 } . The results demonstrated that a decay factor of 0.1 achieved the best convergence (AP = 92.0 % , AR = 94.6 % ), effectively preventing premature convergence observed with a factor of 0.5 (AP = 90.5 % , AR = 92.9 % ) or 0.25 (AP = 91.5 % , AR = 93.6 % ). Consequently, an initial learning rate of 0.001 combined with a multi-step decay factor of 0.1 (applied at the 190th and 260th epochs) was adopted as the standard configuration.

4. Discussion

This study proposes a novel fish pose estimation method, AHSC-Net, tailored for aquaculture scenarios. Through three key technical innovations, it systematically improves the accuracy and robustness of pose detection in complex underwater environments. On the self-constructed largemouth bass dataset, AHSC-Net demonstrates stable and superior detection performance in fish pose estimation tasks, with both precision and recall significantly outperforming mainstream methods adopting different technical routes, which fully validates the effectiveness of the proposed method. Specifically, compared with bottom-up pose estimation methods such as HigherHRNet and DEKR, AHSC-Net achieves remarkable improvements in both detection accuracy and recall; compared with single-stage methods including YOLOv8-Pose and YOLOv11-Pose, AHSC-Net also exhibits comprehensive performance surpassing all their model variants of different sizes.
Ablation experiments further verify the independent effectiveness and synergistic value of the three innovative modules. The Stochastic Local Centroid Sampling module effectively alleviates the detection difficulties caused by fish school occlusion; the Spatial-Awareness Enhanced Pose Structural Constraint module ensures the anatomical rationality of pose prediction results; and the Adaptive Kernel Modulation module significantly enhances the model’s adaptability to underwater blurred images. The synergistic effect among the three further amplifies the performance advantages of the model, thereby effectively solving the core technical challenges of fish pose estimation in underwater aquaculture environments.
The bottom-up pose detection pipeline adopted in this study has significant technical advantages. This pipeline follows the strategy of “detect keypoints first, then associate and group”: it first locates all keypoints of all fish bodies in the entire image at one time, and then aggregates the keypoints belonging to the same target into a complete individual pose using an association algorithm. This association task shares similarities with bipartite matching problems, which can be modeled through graph-based optimization perspectives like HybridGNN [32]. In contrast to top-down approaches, AHSC-Net does not require pre-detecting individual targets and then performing pose estimation one by one. Top-down methods adopt a serial processing mode of “detection first, estimation later”, where each additional target requires an extra computation of the pose estimation branch, resulting in an approximately linear increase in inference latency with rising fish school density. Therefore, in high-density fish school scenarios, the inference time of AHSC-Net is barely affected by the increase in the number of targets, effectively mitigating the computational bottleneck of top-down methods in intensive aquaculture environments. Compared with single-stage methods such as YOLO-Pose, the “heatmap detection + post-processing refinement” pipeline adopted by AHSC-Net effectively avoids the problems of susceptibility to noise interference and limited localization accuracy inherent in the direct regression approach. The direct regression approach directly outputs the absolute coordinate values of keypoints without probabilistic modeling of their spatial distribution, so minor feature perturbations may lead to large localization errors. In contrast, AHSC-Net exhibits more robust and high-precision detection capability in complex underwater environments.
This method can be directly integrated into underwater intelligent monitoring systems to support core tasks such as quantitative analysis of fish behavior, health status early warning, and automated measurement of growth parameters, providing key visual perception technical support for precision aquaculture. These improvements in AP and AR are practically significant: given the cubic power-law relationship between fish length and weight ( W = a L b , b 3 ), even modest precision gains in AP significantly narrow the uncertainty in biomass estimation and feed conversion ratio (FCR) calculations. Furthermore, the increased AR ensures a more representative monitoring of the fish population by capturing individuals hidden in dense clusters, effectively mitigating “survivor bias” in school-level health assessments.
However, the current method still has two limitations. First, as shown in our quantitative results, while our method significantly accelerates inference over traditional bottom-up methods by simplifying their complex post-processing steps, it still has a relatively high parameter count and computational cost. This limits its efficient deployment on resource-constrained edge devices (ideally requiring parameters to be reduced to approximately 8–10 M and GFLOPs to below 25 for real-time edge performance), but this issue can be effectively addressed in future work using established techniques like network pruning, quantization, and knowledge distillation. Second, the existing model only relies on single-frame images for pose estimation. Integrating temporal data from video sequences would offer significant gains in temporal consistency and provide the potential to infer keypoint positions during brief inter-individual occlusions by leveraging trajectory modeling (e.g., Kalman filtering) from preceding frames. Importantly, the added computational overhead of tracking would not be substantial, as our bottom-up approach identifies individual “pose instances” that allow for efficient inter-frame association based on OKS. By utilizing these pose instances as robust identity descriptors, tracking can be performed by applying the Hungarian algorithm to solve the assignment problem across frames based on OKS-based similarity. This enables the system to reliably maintain fish identities and transform discrete static detections into continuous behavioral trajectories. Transitioning from static pose estimation to robust pose tracking remains a key direction for our future research to further support long-term behavioral analysis.

5. Conclusions

In this paper, we propose AHSC-Net, a high-precision fish pose estimation model, to address the key challenges of underwater fish pose estimation in intensive aquaculture. Three core optimizations are introduced to improve the model’s detection performance and robustness: the Stochastic Local Centroid Sampling strategy for occluded targets, the Spatial-Awareness Enhanced Pose Structural Constraint for reasonable pose generation, and the Adaptive Kernel Modulation Module for precise keypoint regression. Experiments on the self-built largemouth bass dataset show that AHSC-Net outperformed mainstream state-of-the-art methods including HRNet, HigherHRNet, DEKR and YOLO-Pose, with 92.0% AP and 94.6% AR. The proposed method can be directly integrated into underwater vision-based intelligent farming systems to support fish behavior analysis, health monitoring, and automated management. It provides a practical and effective technical solution for intelligent perception in precision aquaculture and promotes the development of automated and intelligent aquaculture technology.

Author Contributions

Conceptualization, X.P. and X.C.; methodology, X.P., R.L. and X.C.; software, R.L. and Z.X.; validation, X.P., R.L., Z.X. and X.C.; formal analysis, R.L. and Z.X.; investigation, R.L.; resources, X.C.; data curation, R.L.; writing—original draft preparation, X.P. and R.L.; writing—review and editing, X.C.; visualization, R.L.; supervision, X.P. and X.C.; project administration, X.C.; funding acquisition, X.P. and X.C. All authors have read and agreed to the published version of the manuscript.

Funding

This research was funded by the National Key R&D Program of China, grant number 2024YFC3308004; the Guangdong Intelligence Platform of Prawn Modern Seed Industry, grant number 2022GCZX001; Program for Scientific Research Start-up funds of Guangdong Ocean University, grant number 060302102305; Guangdong Provincial Key Laboratory of Intelligent Equipment for South China Sea Marine Ranching, grant number 2023B1212030003; 2025 Annual Zhanjiang Science and Technology Plan Project, grant number 2025B01091 and 2025B01102; and the Research and application demonstration of key technologies for intelligent prawn breeding, grant number 2023ZDZX4012.

Institutional Review Board Statement

Not applicable.

Informed Consent Statement

Not applicable.

Data Availability Statement

The data that support the findings of this study are available from the corresponding author upon reasonable request.

Conflicts of Interest

The authors declare that there are no known conflicts of interest or personal relationships that could have appeared to influence the work reported in this paper.

References

  1. Chu, Y.I.; Wang, C.M.; Park, J.C.; Lader, P.F. Review of Cage and Containment Tank Designs for Offshore Fish Farming. Aquaculture 2020, 519, 734928. [Google Scholar] [CrossRef]
  2. Zhang, H.; Guo, Y.; Xie, Y.; Zheng, Z. An Integrated Method for Non-Intrusive Underwater Fish Measurement Based on Keypoint Detection and Stereo Vision. Aquacult. Int. 2025, 33, 605. [Google Scholar] [CrossRef]
  3. Cao, D.; Guo, C.; Shi, M.; Liu, Y.; Fang, Y.; Yang, H.; Cheng, Y.; Zhang, W.; Wang, Y.; Li, Y.; et al. A Method for Custom Measurement of Fish Dimensions Using the Improved YOLOv5-Keypoint Framework with Multi-Attention Mechanisms. Water Biol. Secur. 2024, 3, 100293. [Google Scholar] [CrossRef]
  4. Wu, G. Measuring the Three-Dimensional Kinematics of a Free-Swimming Koi Carp by Video Tracking Method. J. Bionic Eng. 2010, 7, 49–55. [Google Scholar] [CrossRef]
  5. Wu, X.; Huang, J.; Wang, L. Pose Estimation-Based Visual Perception System for Analyzing Fish Swimming. IEEE Sens. J. 2024, 24, 13293–13303. [Google Scholar] [CrossRef]
  6. Chen, S.; Wang, B.; Ni, M.; Cao, Z.; Wang, S.; Feng, J.; Fang, Q.; Zhou, J.; Xia, X.-Q.; Shi, M.; et al. FHA-MTT: A Fish Health Assessment Method Based on Multi-Target Tracking. Smart Agric. Technol. 2026, 13, 101830. [Google Scholar] [CrossRef]
  7. He, Q.; Yu, H.; Qin, H.; Mei, Y.; Xu, L.; Chai, Y.; Li, C.; Song, L.; Li, D.; Chen, Y. Deep Learning-Based Computer Vision for Fish Behavior Recognition in Intensive Aquaculture: A Comprehensive Review. Comput. Sci. Rev. 2026, 60, 100896. [Google Scholar] [CrossRef]
  8. Zhao, S.; Cai, K.; Dong, Y.; Feng, G.; Wang, Y.; Pang, H.; Liu, Y. Fish Feeding Behavior Recognition via Lightweight Two Stage Network and Satiety Experiments. Sci. Rep. 2025, 15, 30025. [Google Scholar] [CrossRef]
  9. Hao, M.; Yu, H.; Li, D. The Measurement of Fish Size by Machine Vision—A Review. In International Conference on Computer and Computing Technologies in Agriculture; Springer: Cham, Switzerland, 2016; pp. 15–32. [Google Scholar]
  10. Zhang, S.; Li, J.; Tang, F.; Wu, Z.; Dai, Y.; Fan, W. Research Progress on Fish Farming Monitoring Based on Deep Learning Technology. Trans. Chin. Soc. Agric. Eng. 2024, 40, 1–13. [Google Scholar]
  11. Yang, L.; Liu, Y.; Yu, H.; Fang, X.; Song, L.; Li, D.; Chen, Y. Computer Vision Models in Intelligent Aquaculture with Emphasis on Fish Detection and Behavior Analysis: A Review. Arch. Comput. Methods Eng. 2021, 28, 2785–2816. [Google Scholar] [CrossRef]
  12. Jia, B.; Wang, X.; Shi, Y.; Zhang, X.; Xu, Z.; Wang, J.; Yang, H.; Qian, D. Efficient and Lightweight Model for Detecting Juvenile Fish Feeding Behavior Using Feed Pellet Key Point Analysis. Comput. Electron. Agric. 2026, 240, 111141. [Google Scholar] [CrossRef]
  13. Liu, W.; Bao, Q.; Sun, Y.; Mei, T. Recent Advances of Monocular 2D and 3D Human Pose Estimation: A Deep Learning Perspective. ACM Comput. Surv. 2023, 55, 80. [Google Scholar] [CrossRef]
  14. Zheng, C.; Wu, W.; Chen, C.; Yang, T.; Zhu, S.; Shen, J.; Kehtarnavaz, N.; Shah, M. Deep Learning-Based Human Pose Estimation: A Survey. ACM Comput. Surv. 2024, 56, 11. [Google Scholar] [CrossRef]
  15. Natesan, B.; Liu, C.-M.; Ta, V.-D.; Liao, R. Advanced Robotic System with Keypoint Extraction and YOLOv5 Object Detection Algorithm for Precise Livestock Monitoring. Fishes 2023, 8, 524. [Google Scholar] [CrossRef]
  16. Tseng, C.-H.; Hsieh, C.-L.; Kuo, Y.-F. Automatic Measurement of the Body Length of Harvested Fish Using Convolutional Neural Networks. Biosyst. Eng. 2020, 189, 36–47. [Google Scholar] [CrossRef]
  17. Sun, K.; Xiao, B.; Liu, D.; Wang, J. Deep High-Resolution Representation Learning for Human Pose Estimation. In Proceedings of the IEEE/CVF Conference on Computer Vision and Pattern Recognition; IEEE: Piscataway, NJ, USA, 2019; pp. 5693–5703. [Google Scholar]
  18. Li, H.; Zheng, R.; Jiang, W.; Man, X.; Ma, X. Fish Length Estimation Based on Stereo Vision and Keypoint Detection. In 2024 36th Chinese Control and Decision Conference (CCDC); IEEE: Piscataway, NJ, USA, 2024; pp. 1747–1752. [Google Scholar]
  19. Peng, Q.; Li, W.; Liu, Y.; Li, Z. High-Precision Fish Pose Estimation Method Based on Improved HRNet. Smart Agric. 2025, 7, 160–172. [Google Scholar]
  20. Cui, H.; Qin, C.; Ma, Z. Fish key feature point detection and sign identification based on deep learning. J. Chin. Agric. Mech. 2024, 45, 201–207. [Google Scholar]
  21. Jocher, G.; Chaurasia, A.; Qiu, J. Ultralytics YOLO. 2023. Available online: https://github.com/ultralytics/ultralytics (accessed on 20 May 2024).
  22. Li, J.; Zhang, S.; Li, P.; Dai, Y.; Wu, Z. Research on Measuring the Bodies of Underwater Fish with Inclined Positions Using the YOLOv8 Model and a Line-Laser System. Fishes 2024, 9, 206. [Google Scholar] [CrossRef]
  23. Tian, Y.; Liao, W.; Xu, Z.; Wang, W. A Binocular Vision Fish Body Length Measurement Method Based on Improved YOLOv8-Pose. In 2024 5th International Symposium on Computer Engineering and Intelligent Communications (ISCEIC); IEEE: Piscataway, NJ, USA, 2024; pp. 622–625. [Google Scholar]
  24. Wang, L.; Zou, H. Fish Identification and Tracking Based on Pose Estimation. In 2024 IEEE 19th Conference on Industrial Electronics and Applications (ICIEA); IEEE: Piscataway, NJ, USA, 2024; pp. 1–6. [Google Scholar]
  25. Jin, J.; Chen, N.; Ju, Q.; Wu, Z.; Liu, Y.; Li, S. Research progress of fish behavior and its application in intelligent aquaculture. J. Intell. Agric. Mech. 2025, 6, 73. [Google Scholar]
  26. Xue, N.; Wu, T.; Xia, G.-S.; Zhang, L. Learning Local-Global Contextual Adaptation for Multi-Person Pose Estimation. In Proceedings of the IEEE/CVF Conference on Computer Vision and Pattern Recognition; IEEE: Piscataway, NJ, USA, 2022; pp. 13065–13074. [Google Scholar]
  27. Zhong, Z.; Zheng, L.; Kang, G.; Li, S.; Yang, Y. Random Erasing Data Augmentation. In Proceedings of the AAAI Conference on Artificial Intelligence; IEEE: Piscataway, NJ, USA, 2020; Volume 34, pp. 13001–13008. [Google Scholar]
  28. Chen, P.; Liu, S.; Zhao, H.; Wang, X. GridMask Data Augmentation. arXiv 2020, arXiv:2001.04086. [Google Scholar]
  29. Luo, Z.; Wang, Z.; Huang, Y.; Wang, L.; Tan, T.; Zhou, E. Rethinking the Heatmap Regression for Bottom-up Human Pose Estimation. In Proceedings of the IEEE/CVF Conference on Computer Vision and Pattern Recognition; IEEE: Piscataway, NJ, USA, 2021; pp. 13264–13273. [Google Scholar]
  30. Cheng, B.; Xiao, B.; Wang, J.; Shi, H.; Huang, T.S.; Zhang, L. Higherhrnet: Scale-Aware Representation Learning for Bottom-up Human Pose Estimation. In Proceedings of the IEEE/CVF Conference on Computer Vision and Pattern Recognition; IEEE: Piscataway, NJ, USA, 2020; pp. 5386–5395. [Google Scholar]
  31. Geng, Z.; Sun, K.; Xiao, B.; Zhang, Z.; Wang, J. Bottom-up Human Pose Estimation via Disentangled Keypoint Regression. In Proceedings of the IEEE/CVF Conference on Computer Vision and Pattern Recognition; IEEE: Piscataway, NJ, USA, 2021; pp. 14676–14686. [Google Scholar]
  32. Pan, C.-H.; Qu, Y.; Yao, Y.; Wang, M.-J.-S. HybridGNN: A Self-Supervised Graph Neural Network for Efficient Maximum Matching in Bipartite Graphs. Symmetry 2024, 16, 1631. [Google Scholar] [CrossRef]
Figure 1. Keypoint Connection and Annotation Example.
Fishes 11 00308 g001
Figure 2. Pipeline of the proposed AHSC-Net algorithm.
Fishes 11 00308 g002
Figure 3. Illustration of bounding box center shift: (a) The bounding box center of a complete fish body; (b) The bounding box center of an incomplete fish body. This introduces significant bias to the model’s center point supervision signal at the location of the fish body.
Fishes 11 00308 g003
Figure 4. Illustration of assigning coordinates to the feature map.
Fishes 11 00308 g004
Figure 5. (a) The original keypoint prediction heatmap; (b) The improved prediction heatmap. The comparison reveals that in the improved heatmap, the response ranges of the nine keypoints are more concentrated and refined, which contributes to enhanced prediction accuracy. Simultaneously, the response area of the central point is significantly enlarged, indicating that the model can identify the fish based on a richer set of features.
Fishes 11 00308 g005
Figure 6. Results of the proposed keypoint detection method.
Fishes 11 00308 g006
Table 1. Details of keypoint annotations.
IndexNameDefinition
1MouthMouth of the fish
2EyeEye of the fish
3Dorsal_FinMidpoint between the insertion points of the first and second dorsal fin spines on the body wall
4Caudal_Fin_FBase of the caudal fin
5Caudal_Fin_TTip of the upper caudal lobe
6Caudal_Fin_BPosterior margin of the caudal fin
7Caudal_Fin_DTip of the lower caudal lobe
8Anal_FinOrigin of the anal fin
9Ventral_FinOrigin of the ventral fin
Table 2. Comparison of the AHSC-Net Model with Other Approaches.
MethodAP/%AR/%Params/MGFLOPsTime/ms
HigherHRNet89.190.428.6447.80247.5
HRNet89.391.428.5441.19217.1
DEKR82.289.329.4243.55108.5
Ours92.094.634.77142.0058.41
Table 3. Comparison of the AHSC-Net Model with YOLO series.
MethodAP/%AR/%Params/MGFLOPsTime/ms
Yolov8m-pose87.789.226.4281.210.2
Yolov8l-pose88.389.744.46169.113.4
Yolov8x-pose88.890.469.46263.215.9
Yolov11m-pose85.487.220.8871.412.2
Yolov11l-pose87.088.826.1790.316.7
Yolov11x-pose88.590.058.79202.717.7
Ours92.094.634.77142.058.4
Table 4. Ablation experiments of AHSC-Net.
SLCSSAPSCAKMMAP/%AP50/%AP75/%AR/%AR50/%AR75/%
90.696.591.592.097.692.9
91.597.193.893.198.695.1
91.395.792.593.397.694.1
91.596.793.192.997.994.6
91.596.892.793.398.194.8
91.696.392.493.898.694.4
92.096.093.194.698.895.1
Disclaimer/Publisher’s Note: The statements, opinions and data contained in all publications are solely those of the individual author(s) and contributor(s) and not of MDPI and/or the editor(s). MDPI and/or the editor(s) disclaim responsibility for any injury to people or property resulting from any ideas, methods, instructions or products referred to in the content.