Article

Development of Organoclay as an Artificial Micro Substrate for Chemoautotrophic Biofloc Aquaculture Systems (BFT)


by
Talita Ribeiro Gagliardi
1,
Maria Helena de Araujo Mendes
1,
Claudia Machado
1,
Loic Hilliou
2,
Wilson Wasielesky, Jr.
3 and
Felipe Boéchat Vieira
1,*
1
Laboratory of Marine Shrimp, Department of Aquaculture, Federal University of Santa Catarina, Florianópolis 88040-900, SC, Brazil
2
Institute for Polymers and Composites (IPC), University of Minho, 4800-058 Guimarães, Portugal
3
Marine Aquaculture Station, Institute of Oceanography, Federal University of Rio Grande, Rio Grande 96210-030, RS, Brazil
*
Author to whom correspondence should be addressed.
Fishes 2026, 11(2), 94; https://doi.org/10.3390/fishes11020094
Submission received: 17 December 2025 / Revised: 27 January 2026 / Accepted: 31 January 2026 / Published: 4 February 2026

Abstract

This study investigated the characterization and application of organoclay formulations in a chemoautotrophic biofloc system. Organoclays were produced using the calcination method and bentonite, chitosan, corn, and tapioca starches as ingredients. Thermogravimetric analysis confirmed the high thermal stability of bentonite, whereas biopolymers (tapioca, chitosan, and corn starch) exhibited greater thermal sensitivity and a lower residual mass. Scanning electron microscopy revealed that organoclays had increased porosity (4–21 µm) compared to bentonite, while energy-dispersive spectroscopy confirmed the retention of key chemical elements. X-ray diffraction and Fourier-transform infrared spectroscopy indicated structural modifications due to thermal processing. In aqueous conditions, bentonite and organoclays disaggregated into particles with sizes between 0.76 and 1.24 μm. Based on these physicochemical properties, three formulations were selected for nitrification trials due to their stability in water, O1 (bentonite + tapioca), O2 (bentonite + tapioca + chitosan), and O6 (bentonite + corn starch), along with a 100% bentonite treatment and a control group (C) supplemented with inorganic salts and artificial Needlona® substrates. All treatments achieved full nitrification within 37 days, with O1 exhibiting the best performance by maintaining ammonia and nitrite levels within safe thresholds. These findings suggest that organoclays, particularly O1, can enhance nitrification stability, providing a promising strategy for water quality management in intensive aquaculture systems.
Key Contribution: This study shows that organoclays can act as a stable, sustainable substrate to enhance chemoautotrophic nitrification in biofloc systems by keeping ammonia and nitrite within safe thresholds without artificial substrates.

1. Introduction

The sustainable intensification of aquaculture is essential to meet the growing global demand for high quality protein. Nowadays, aquaculture supplies more than 50% of the fish consumed by humans [1]. However, the main challenge in intensive aquaculture systems is maintaining water quality, particularly managing inorganic nitrogen compounds, which can reach toxic levels and compromise animal performance [2].
Biofloc Technology (BFT) has gained significant attention due to its potential for continuous nutrient recycling and utilization within the culture environment [3]. BFT has been studied in recent years, focusing on developing specific microbial communities to facilitate nutrient recycling, particularly dissolved nitrogen, and to maintain water quality [4,5,6,7,8,9]. BFT systems can be classified into two types based on the dominant microbial pathway for nitrogen assimilation: heterotrophic and chemoautotrophic systems. In heterotrophic-based systems, nitrogen control is achieved by stimulating the rapid growth of heterotrophic bacteria through the addition of a carbon source, promoting the assimilation of ammonia into microbial biomass [10]. In contrast, chemoautotrophic-based systems rely on nitrifying bacteria, such as ammonia-oxidizing and nitrite-oxidizing bacteria, to convert toxic nitrogenous compounds into less harmful forms, primarily nitrate [11,12,13,14].
A crucial challenge in BFT is the rapid establishment of a stable system to prevent peaks in nitrogen compounds and ensure good zootechnical performance in shrimp farming. An alternative is the reuse of system water through multiple cycles, utilizing the established microbial community to maintain water quality [15,16]. The initial use of chemoautotrophic bacteria can provide additional advantages, as these microorganisms help to prevent excessive sludge formation and nitrogen compound spikes, which are common issues in immature BFT systems [16].
The fertilization of tanks with salts such as ammonium chloride (NH4Cl) and sodium nitrite (NaNO2) is another alternative for chemoautotrophic bacteria, thus avoiding reliance on the natural accumulation of ammonia and nitrite [8,13,17]. In this way, Ferreira et al. [12] tested various water preparation strategies for biofloc systems, including heterotrophic (addition of carbon source), chemoautotrophic (addition of inorganic salts), and mature (inoculation from an established BFT system) methods. Heterotrophic systems experienced ammonia and nitrite spikes, while both chemoautotrophic and mature methods maintained low levels of these compounds without the need for additional carbon. Furthermore, the chemoautotrophic system showed a lower abundance of Vibrionaceae bacteria, resulting in better shrimp performance [8,12]. In addition, artificial substrates can be combined with inorganic salts to increase the tank surface area and provide more space for nitrifying bacteria [12,13,18].
In another research, Costa Rezende et al. [19] observed that artificial substrates controlled suspended solids without altering the metabolism of nitrogen compounds. While these substrates increase surface area for microbial attachment, their limited role in nitrogen transformation, combined with higher system complexity, potential interference with hydrodynamics, and increased operational costs and management, restricts their practical application at commercial scales [18,20,21].
Bentonite can be used to produce organoclays with high porosity. These materials have potential applications in BFT systems due to the ability to remain stable in the water column which can favor biofloc formation, resolving the complexity problems of artificial substrates [22,23,24]. Du et al. [25] developed organoclays by mixing bentonite with corn starch, chitosan, and water, followed by drying at 190 °C for 30 min and calcination at 550 °C for 4 h to produce homogeneous and highly porous materials. Porous materials based on bentonite and biopolymers can retain their flocculating characteristics even after high-temperature processing [26,27]. To date, no study has explored the application of these materials in BFT systems. Therefore, this study aims to produce, characterize, and evaluate the potential of organoclays based on bentonite and biopolymers for biofloc formation and the growth of chemoautotrophic bacteria.

2. Materials and Methods

2.1. Raw Materials

Bentonite (CP31-Bentonisa, PB, Brazil) was used as the clay. Chitosan with a deacetylation degree of 85.3% was acquired from Polymar Ltda. (CE, Brazil). Tapioca (Supp, SC, Brazil) was purchased from the local market, while corn starch was obtained directly from (Indústria de Alimentos Jureia, SC, Brazil). Reverse osmosis water was used as the solvent.

2.2. Thermal Stability of Raw Materials

The thermal stability of bentonite, chitosan, tapioca, and corn starch was studied using a thermogravimetric balance (STA 449 F3 Jupiter, Netzsch, Selb, Germany). Raw materials (8.8 ± 1.5 mg) were heated from 20 °C to 600 °C, using a heating rate of 10 °C min−1 and a platinum pan as a reference. Thermogravimetric analysis was performed using a flow of 20 mL min−1 of dry N2 [28]. Furthermore, the residual mass of raw materials was analyzed after burning samples in a muffle (Elo Scientific, São Paulo, SP, Brazil) at 550 °C for 4 h (see Section 2.3).

2.3. Organoclay Production

Organoclays were produced by a mixture of bentonite with chitosan and tapioca or corn starch in the presence of water (Table 1). Firstly, bentonite was manually dispersed in water and blended with tapioca or corn starch. In sequence, the mixtures were dried using an oven (Marconi) with forced air circulation at 105 °C for 24 h. After that, dried samples were burned at 550 °C for 4 h using a muffle (Elo Scientific, São Paulo, SP, Brazil). Finally, burned samples named organoclays (O) were obtained. They were then milled and stored in desiccators containing silica gel (relative humidity of ≈0%) until analysis.

2.4. Physicochemical Characterization

2.4.1. Visual Aspect and Color

The visual aspect of raw materials and organoclays was verified, and photos were taken using a digital camera (Nikon AF-S DX Nikkor 18–55 mm 1:3.5–5.6 G VR II, 0.28 m/0.92 ft ø 52) coupled to an illumination diffusing chamber with a white standard plate [29].
A color characterization of the raw materials and organoclays was performed using a colorimeter (Delta Vista 450 G, Delta Color, São Leopoldo, RS, Brazil), with the CIELab coordinates represented by the lightness index (L*); redness-greenness index, represented by the tonalities from green (−a*) to red (+a*) color; and yellowness-blueness index, represented by the tonalities from blue (−b*) to yellow (+b*) color [30].

2.4.2. Morphology and Chemical Composition

The morphology of the raw materials and organoclays was analyzed using scanning electron microscopy (SEM, JSM-6390LV, JEOL, Tokyo, Japan) at accelerating voltage of 10 kV. Samples were fixed on aluminum stubs by carbon tape and then coated with a thin gold layer before SEM analyses. Micrographs were taken at random sample spots at 100× and 1000× magnification.
Furthermore, morphological analyses at 2500× magnification were done in an Ultra-high resolution Field Emission Gun Scanning Electron Microscope (FEG-SEM), NOVA 200 Nano SEM, FEI Company. Topographic images were performed in low vacuum mode at an acceleration voltage of 15 kV, using a Low-Vacuum Detector (LVD).
Chemical analyses of samples were performed with the Energy-Dispersive Spectroscopy (EDS) technique, at 20 kV, using an EDAX Si(Li) detector with an ultra-thin window (SUTW). Qualitative and quantitative acquisition and analysis of X-ray spectra (B-U) were realized using a ZAF correction matrix and the Delphi Software of the equipment.

2.4.3. Particle Size and Surface Charge

Particle size and surface charge of the bentonite and organoclays were determined using a LUMiSizer (LUM GmbH, Berlin, Germany) and a Zetasizer Nano ZS (Malvern, UK), respectively. For the particle size measurements, powders were dispersed in deionized water (0.03% w v−1, pH = 8.0) and sonicated for 30 min at 40 KHz, using a sonicator bath (Ultracleaner 1650, Unique, SP, Brazil) [31].

2.4.4. Crystalline Structure and Chemical Bonds

X-ray Diffraction (XRD) of the raw materials and organoclays was performed using an X-ray diffractometer (Bruker D8 Discover, Bremen, Germany), operating at 40 kV and 15 mA (CuKα 1 = 1.5406 Å radiation). Diffractograms were obtained at 20 °C in the diffraction range (2θ) between 2° and 70°, with a scan rate of 5° min−1 and a step size of 0.01°. The Bragg’s law equation (Equation (1)) was used to calculate interplanar distance, d (nm), associated with the angle of diffraction at the maximum intensity of the peak found in the diffractogram as follows:
n × λ = 2 × d × sin ( θ )
where λ is the wavelength (nm), and n is the reflection order (n = 1, dimensionless).
The chemical bonds of the raw materials and organoclays were studied using a Fourier-transform infrared (FTIR) spectrophotometer (FTIR, Cary 660, Agilent, Santa Clara, CA, USA) equipped with Universal Attenuated Total Reflection (ATR). FTIR spectra were obtained in the infrared region between 4000 and 400 cm−1 with 20 scans, a resolution of 4 cm−1, and using KBr pellets [30].

2.5. Experimental Design

The experiment was conducted at the Marine Shrimp Laboratory (LCM), Federal University of Santa Catarina (UFSC), Florianópolis, Brazil. The clay application trial was carried out using 15 tanks, each with a working volume of 60 L (31 × 56 × 36 cm). The experimental design included four treatments (O1, O2, O6, bentonite—B) and a control (C) group, with three replicates for each condition. Water temperature was maintained at 28 ± 1 °C using a Full Gauge thermostat with 100 W titanium heaters (HOPAR, H-386, GD, China). Aeration was provided by an Aero-tube® system, consisting of a pair of microperforated hoses powered by a 7.5 HP blower (Ibram Indústria Brasileira de Máquinas e Equipamentos, SP, Brazil), installed in all experimental units.
To increase the surface area available for the natural colonization of nitrifying bacteria, three artificial substrates (25 × 36 cm, needlona®, DE, Germany) were used to increase the surface area (100% front and back) per tank, which was added only to the control group, as described in [12].
The tanks were kept in an isolated room and subjected to no exposure to light. To maintain the total alkalinity above 140 mg L−1, sodium bicarbonate was added. Water losses due to evaporation were replaced with fresh water. The experiment was conducted for 37 days.

2.5.1. Nitrification Test

Filtered seawater (50 L) was added to the tanks, which was fertilized daily with 1 mg L−1 of sodium nitrite (NaNO2, Neon Commercial, SP, Brazil) and 1 mg L−1 of ammonium chloride (NH4Cl, Neon Commercial, São Paulo, SP) [12,13]. In the control group, three artificial substrates (needlona®) per tank were inserted [12,13]. In groups O1, O2, and O6, 150 mg L−1 of each corresponding organoclay was added only on the first day based on a preliminary test. In group B, 150 mg L−1 of pure bentonite (CP-31-Bentonisa, PB, Brazil) was added.

2.5.2. Monitoring of Water Quality Parameters

Temperature (°C), dissolved oxygen (DO, mg L−1, YSI® EcoSense DO200A), pH (Tecnal Tec-5, SP, Brazil), salinity (YSI 30 Digital Salinity Meter, OH, USA), total ammonia (N-NH3, mg L−1) and nitrite (NO2-N, mg L−1) were measured daily. Alkalinity (mg L−1) was analyzed three times a week. When alkalinity was below 140 mg L−1, adjustments were made with the application of sodium bicarbonate (NaHCO3), following [32].
Nitrate (NO3-N, mg L−1), Orthophosphate (P-PO4−3, mg L−1), and Total Suspended Solids (TSS, mg L−1) were measured weekly. Volatile Suspended Solids (VSS) were measured only at the beginning and end of the experiment.
The concentrations of total ammonia nitrogen (TAN), nitrite, nitrate, and orthophosphate were determined using colorimetric methods according to the procedure described by Strickland & Parsons [33].

2.6. Statistical Analysis

All tests were performed in triplicate, and the results are expressed as means ± standard deviation. Water quality data were tested for normality and homoscedasticity using the Shapiro–Wilk and Bartlett tests, respectively (with significance at the 5% level). For these data, a repeated measures analysis of variance (ANOVA) was applied, followed by the Tukey test to assess significant differences among treatments. When necessary, data were log-transformed to meet parametric assumptions. Analyses were performed using the TIBCO Statistica software, version 13.5.0.17.

3. Results

3.1. Thermal Stability of Raw Materials

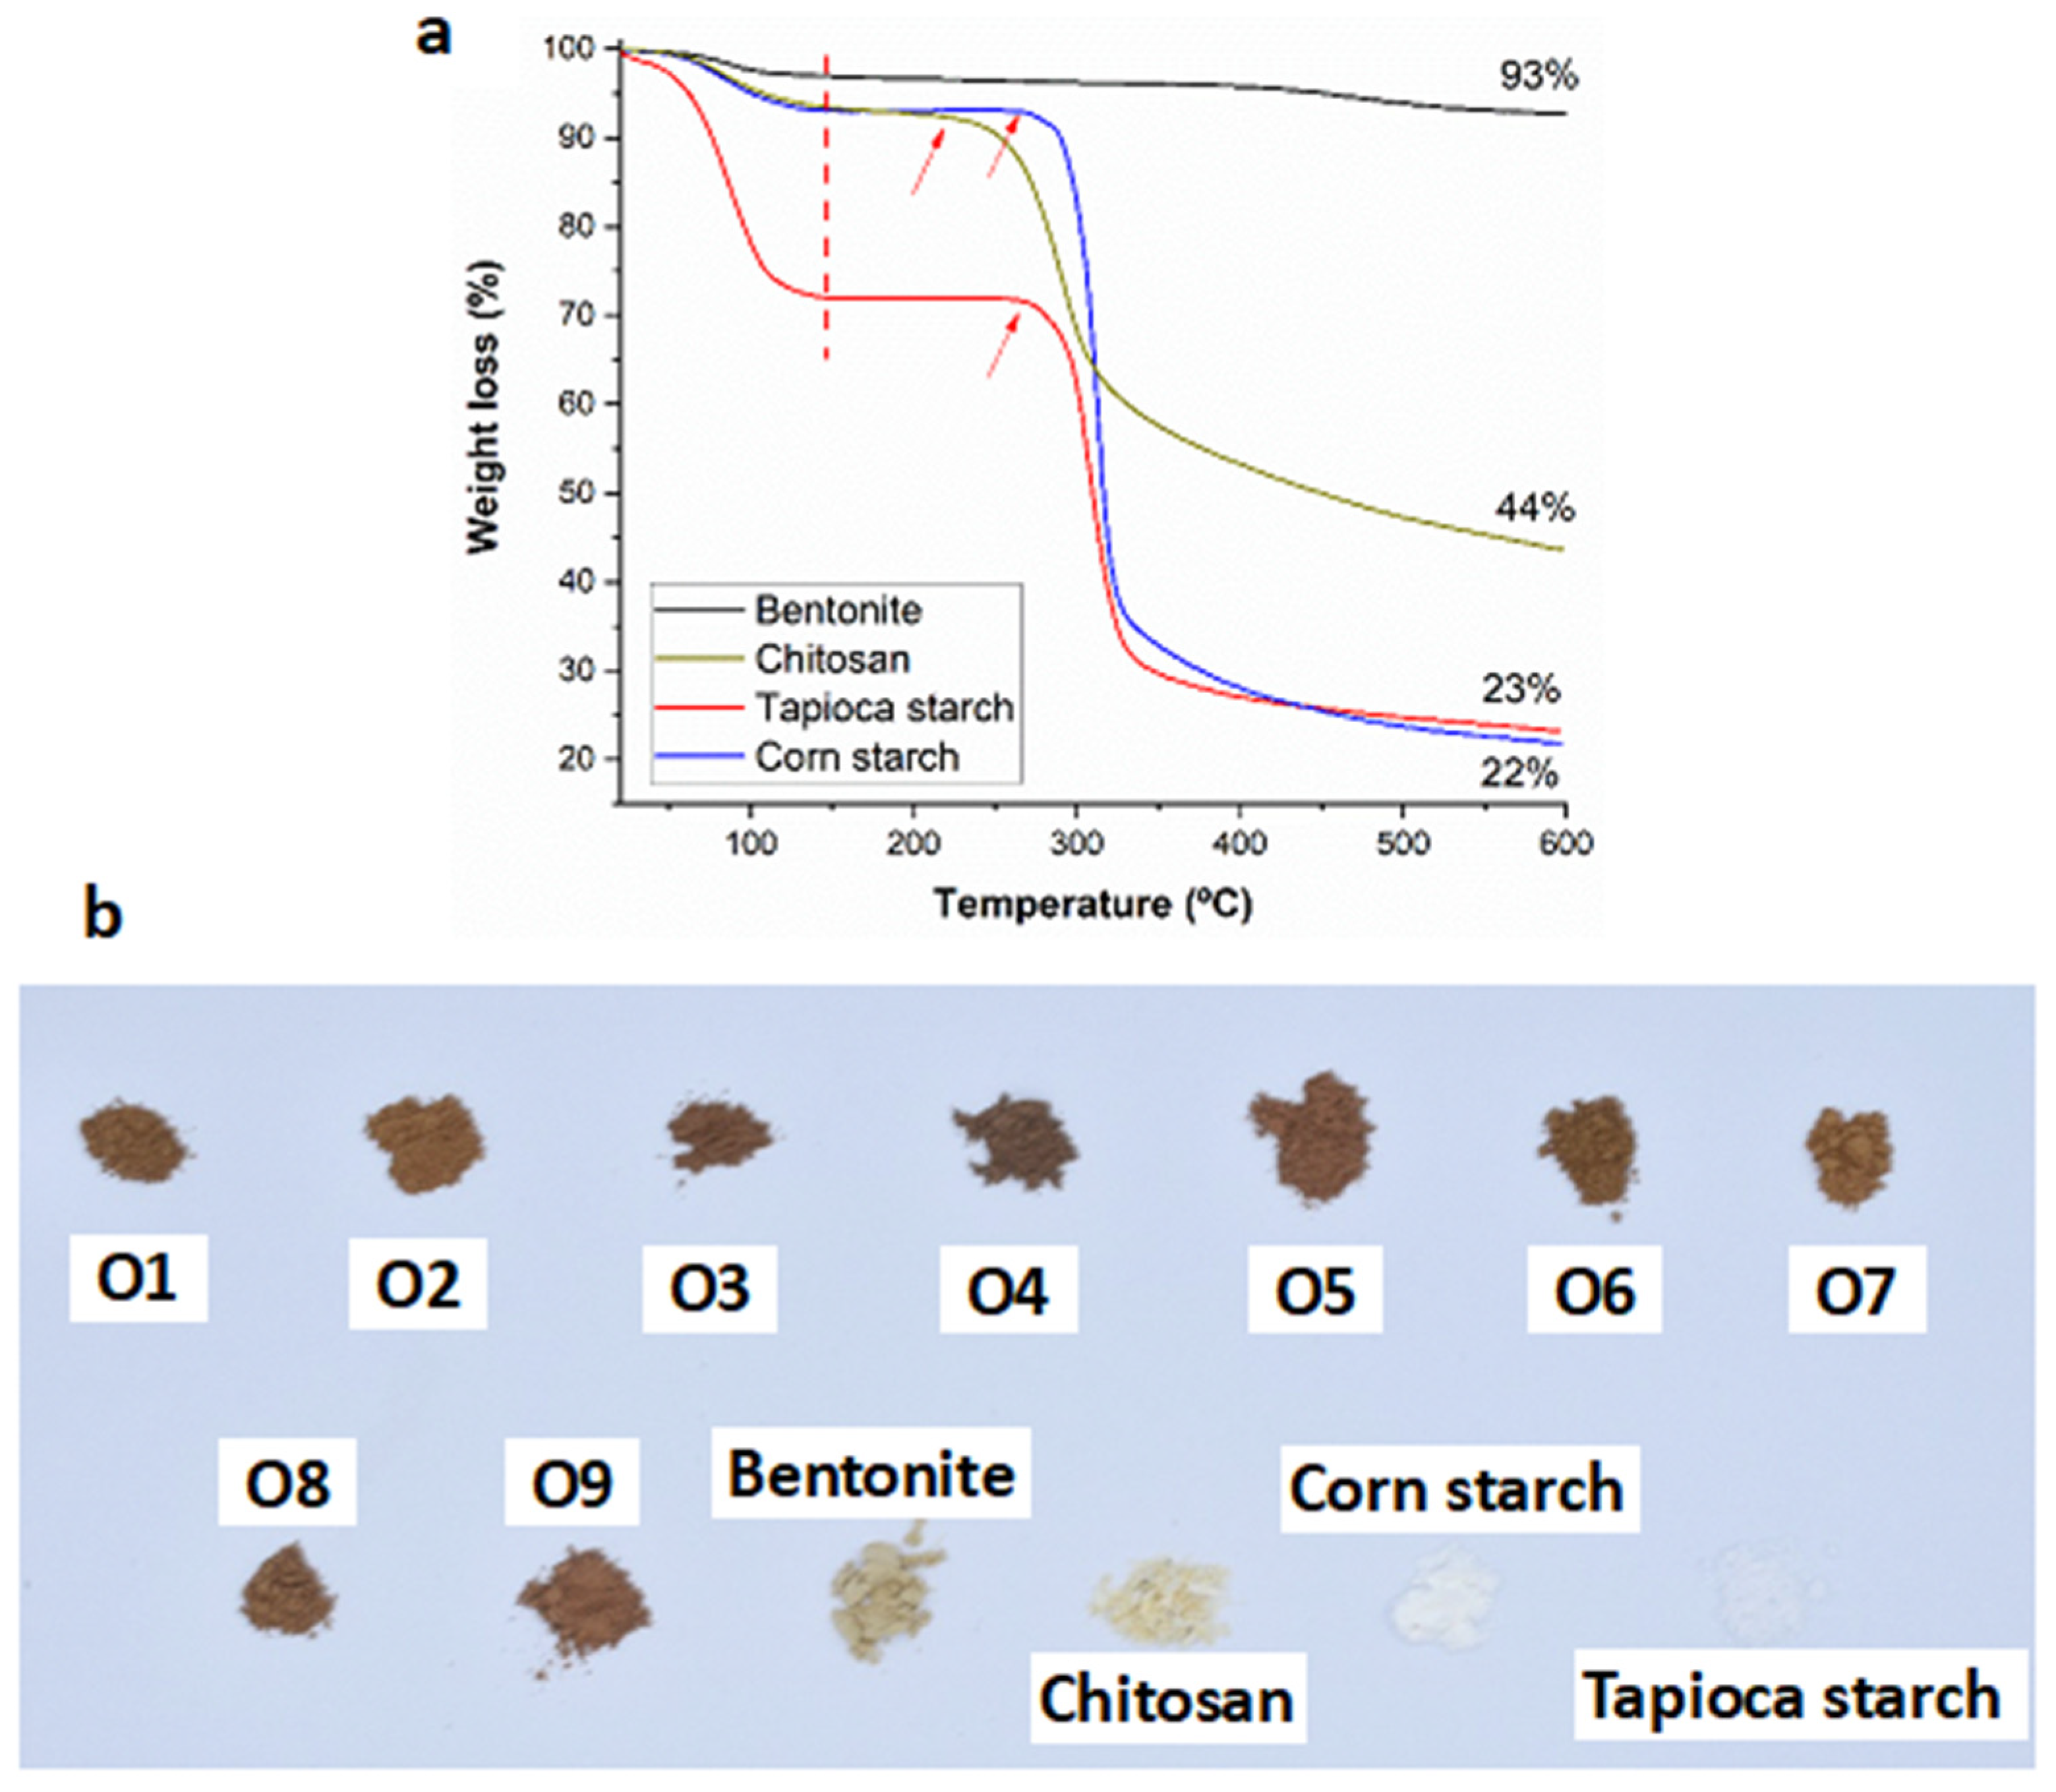
The thermal stability of raw materials was investigated using thermogravimetry (TGA). Bentonite had TGA curves typical of stable materials under the studied temperature range (≤600 °C). In contrast, chitosan, tapioca, and corn starches displayed TGA curves typical of biopolymers sensitive to heating (Figure 1a).
From TGA results, bentonite decomposition involved one stage associated with the loss of surface-adsorbed water and the dihydroxylation of the bentonite phase [34]. Finally, bentonite had a residual mass (RM) of approximately 93% (Figure 1a). Chitosan, tapioca, and corn starches displayed three decomposition stages associated with water evaporation (≤150 °C), depolymerization or thermal degradation between 150 °C and 217 °C for chitosan, and between 150 °C and 263 °C for the tapioca and corn starches (see arrows in Figure 1a). Finally, the formation of inert carbonaceous residues was observed in chitosan and starches at temperatures higher than 325 °C [35,36]. The RM of chitosan, tapioca and corn starch was circa 44%, 23%, and 22%, respectively (Figure 1a) and was correlated with the presence of inorganic compounds in the biopolymers [35,36].
RM after burning the raw materials in the muffle was 3 × 10⁻³%, 6.47% ± 0.69, and 88.54% ± 3.52 for both starches, chitosan, and bentonite, respectively. Bentonite had comparable RM in TGA curves and after burning in the muffle, suggesting that this material has high thermal stability. In contrast, all biopolymers had lower RM values after burning in the muffle when compared with the RM observed by thermogravimetry, indicating that the inorganic fraction of these ingredients was sensitive to a prolonged burning time (550 °C for 4 h). The RM values obtained after burning the samples in the muffle were used to develop a mathematical model to predict the organoclay mass ( w o r g ) obtained after the calcination of raw materials. This model was based on the RM calculated by a burning test in the muffle and the initial mass (w) of each raw material:
w o r g =   R M α w α +   R M β w β +   R M γ w γ
where α, β, and γ denote bentonite, chitosan, and tapioca or potato starch, respectively.
The mathematical model was able to predict w o r g , with a discrepancy oscillating between 2–8% with respect to the experimental values (see Appendix A, Table A1). This result suggests that the mathematical model can be used to predict w o r g in production systems.

3.2. Visual Aspect and Color

All raw materials displayed a powder appearance with pale brown (bentonite and chitosan) and white (starches) colors, whereas organoclays had a dark color (Figure 1b).
Colorimetric analyses were carried out on the raw materials and organoclays for identifying the samples’ color based on the CIELab scale. Bentonite and chitosan had medium lightness (L*) and red-green (a*) values, and b* values that tended to be yellow (Table 2) [37]. In contrast, starches showed high L* values, as well as a* and b* values, which tend to be zero, typical of samples with a white color [38].
The organoclays produced after calcination of raw materials had lower L* values and higher a* and b* values when compared with raw materials (Table 2).

3.3. Morphology and Chemical Composition

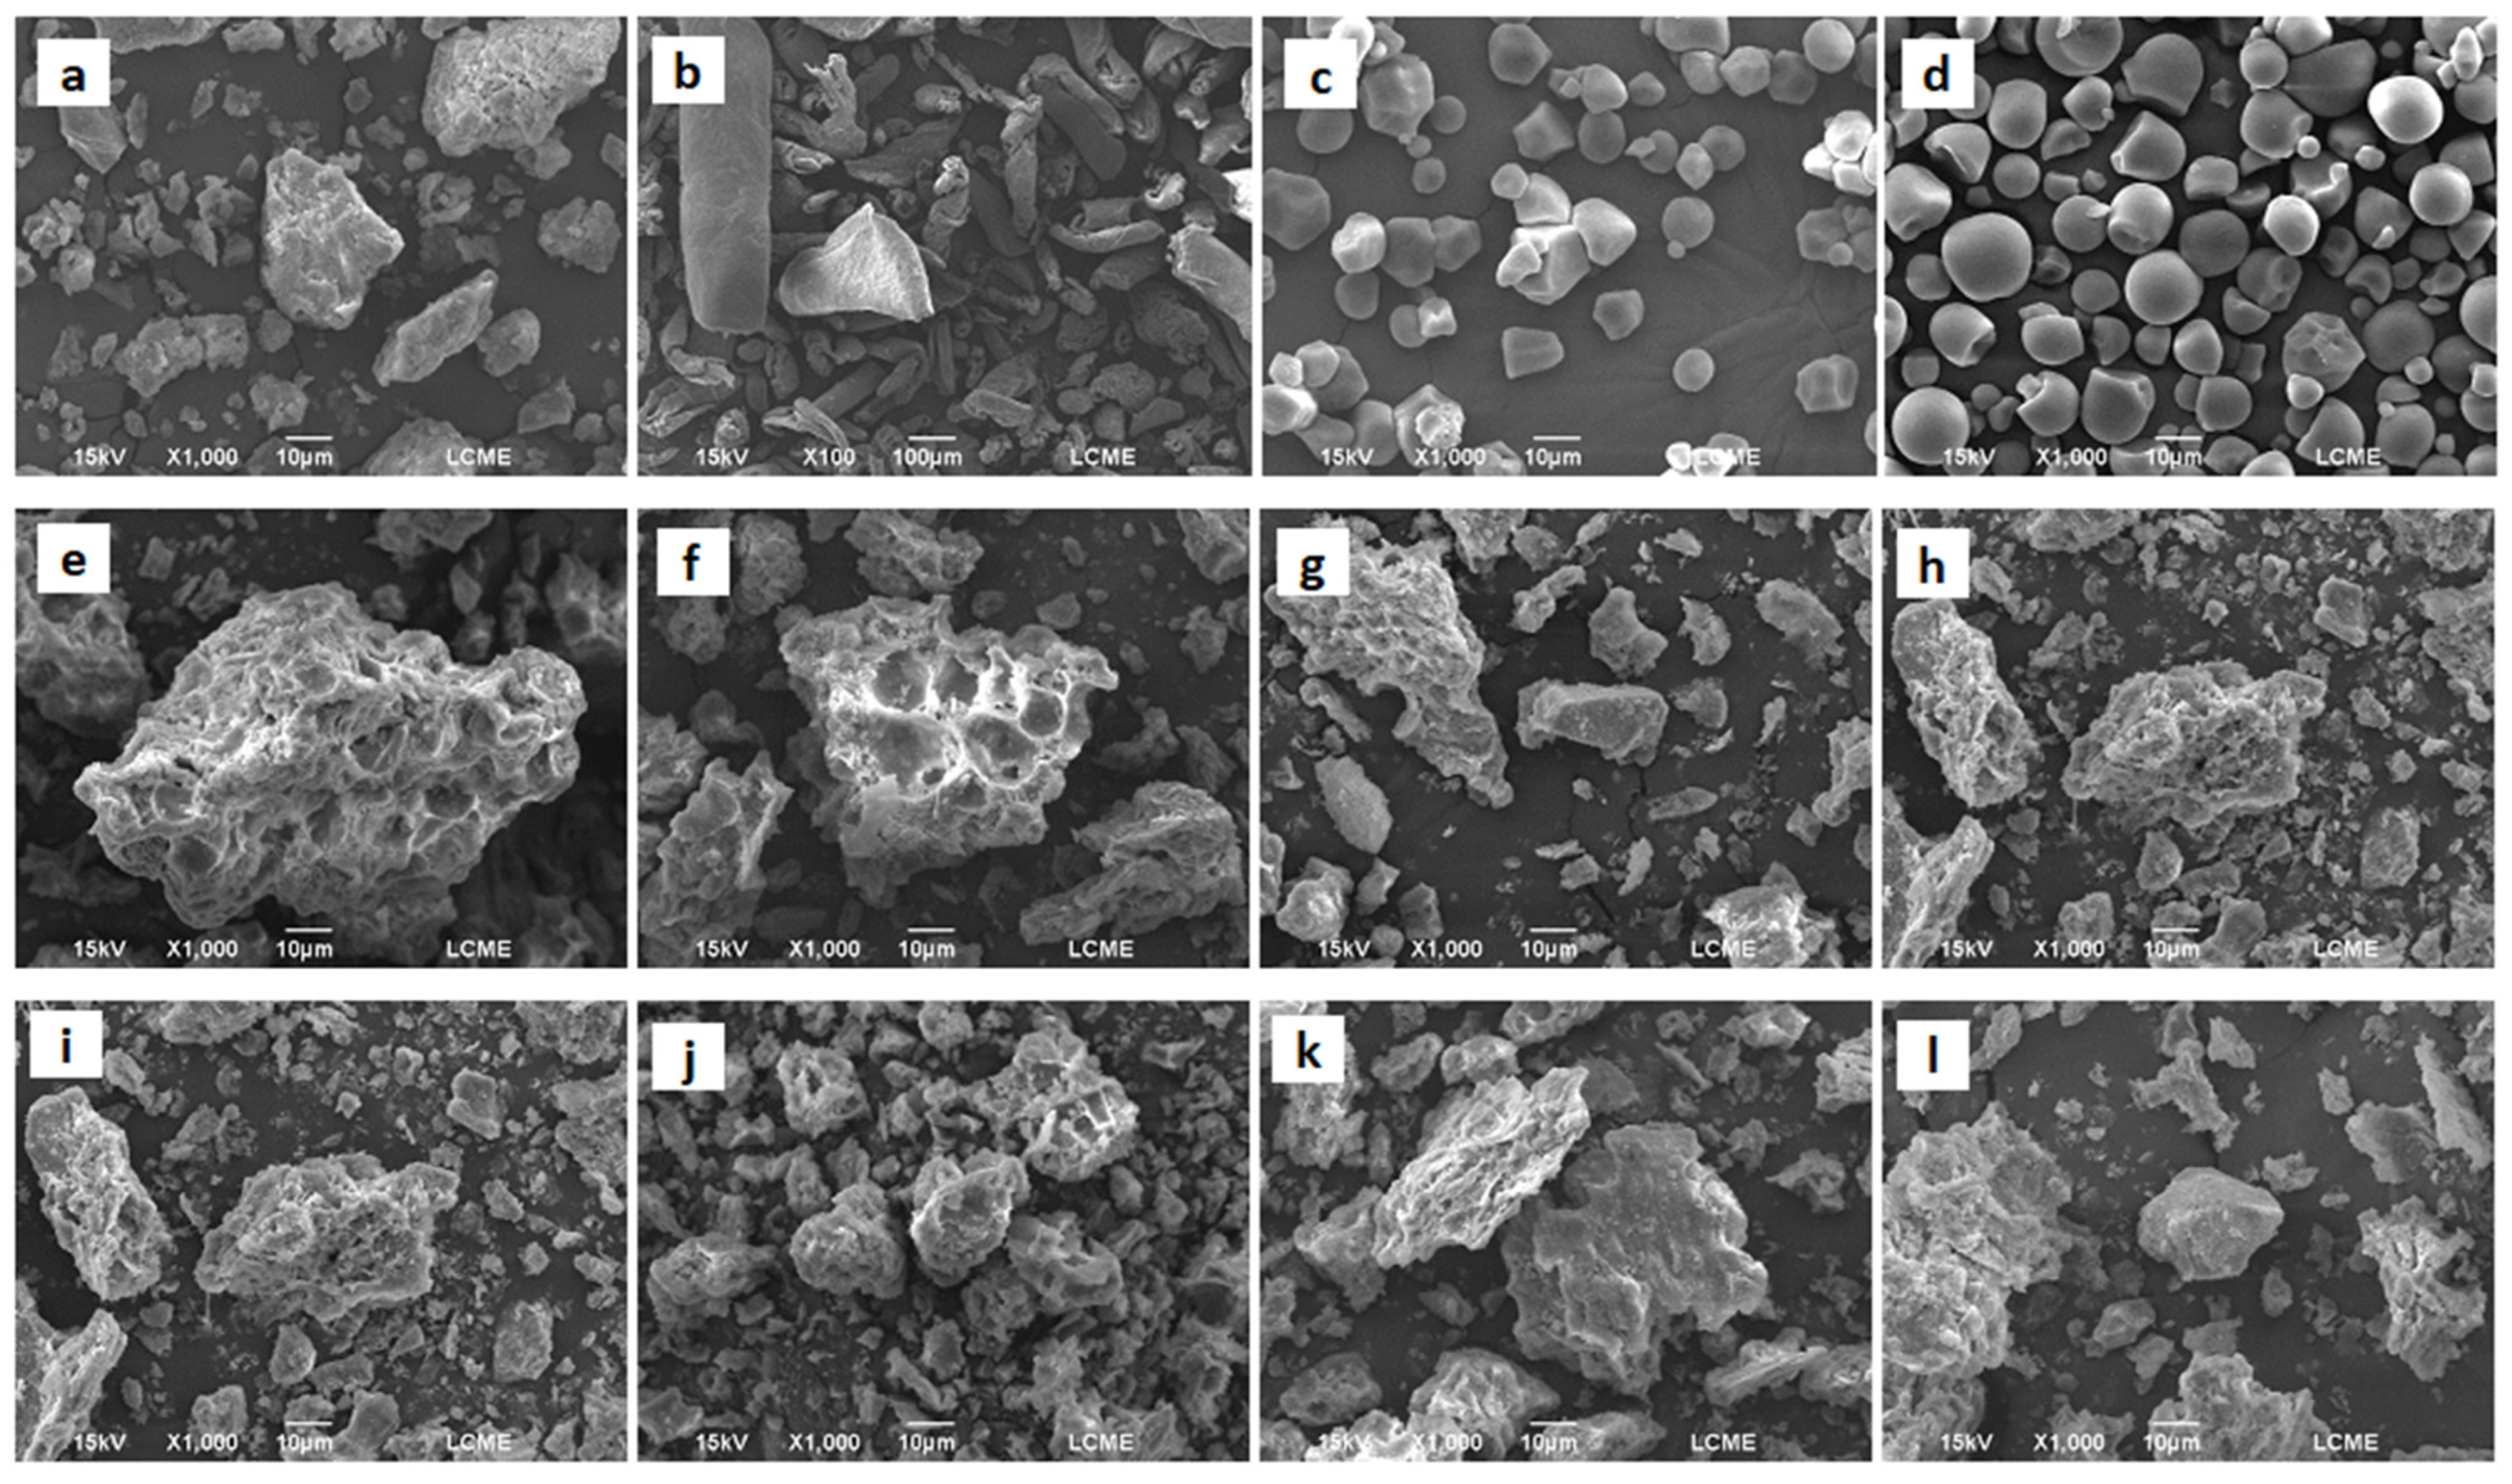
Scanning electron microscopy (SEM) revealed that bentonite is made of large micrometer agglomerates with irregular sizes and shapes (Figure 2a), being that these agglomerates consist of stacked plate-like objects, as previously informed in clay materials [39,40]. Similarly, SEM micrographs of chitosan showed the presence of particles with irregular shapes (Figure 2b), as well as oval and spherical shapes, typical of tapioca and potato starches (Figure 2c,d) [41,42], all at the micrometrical scale.
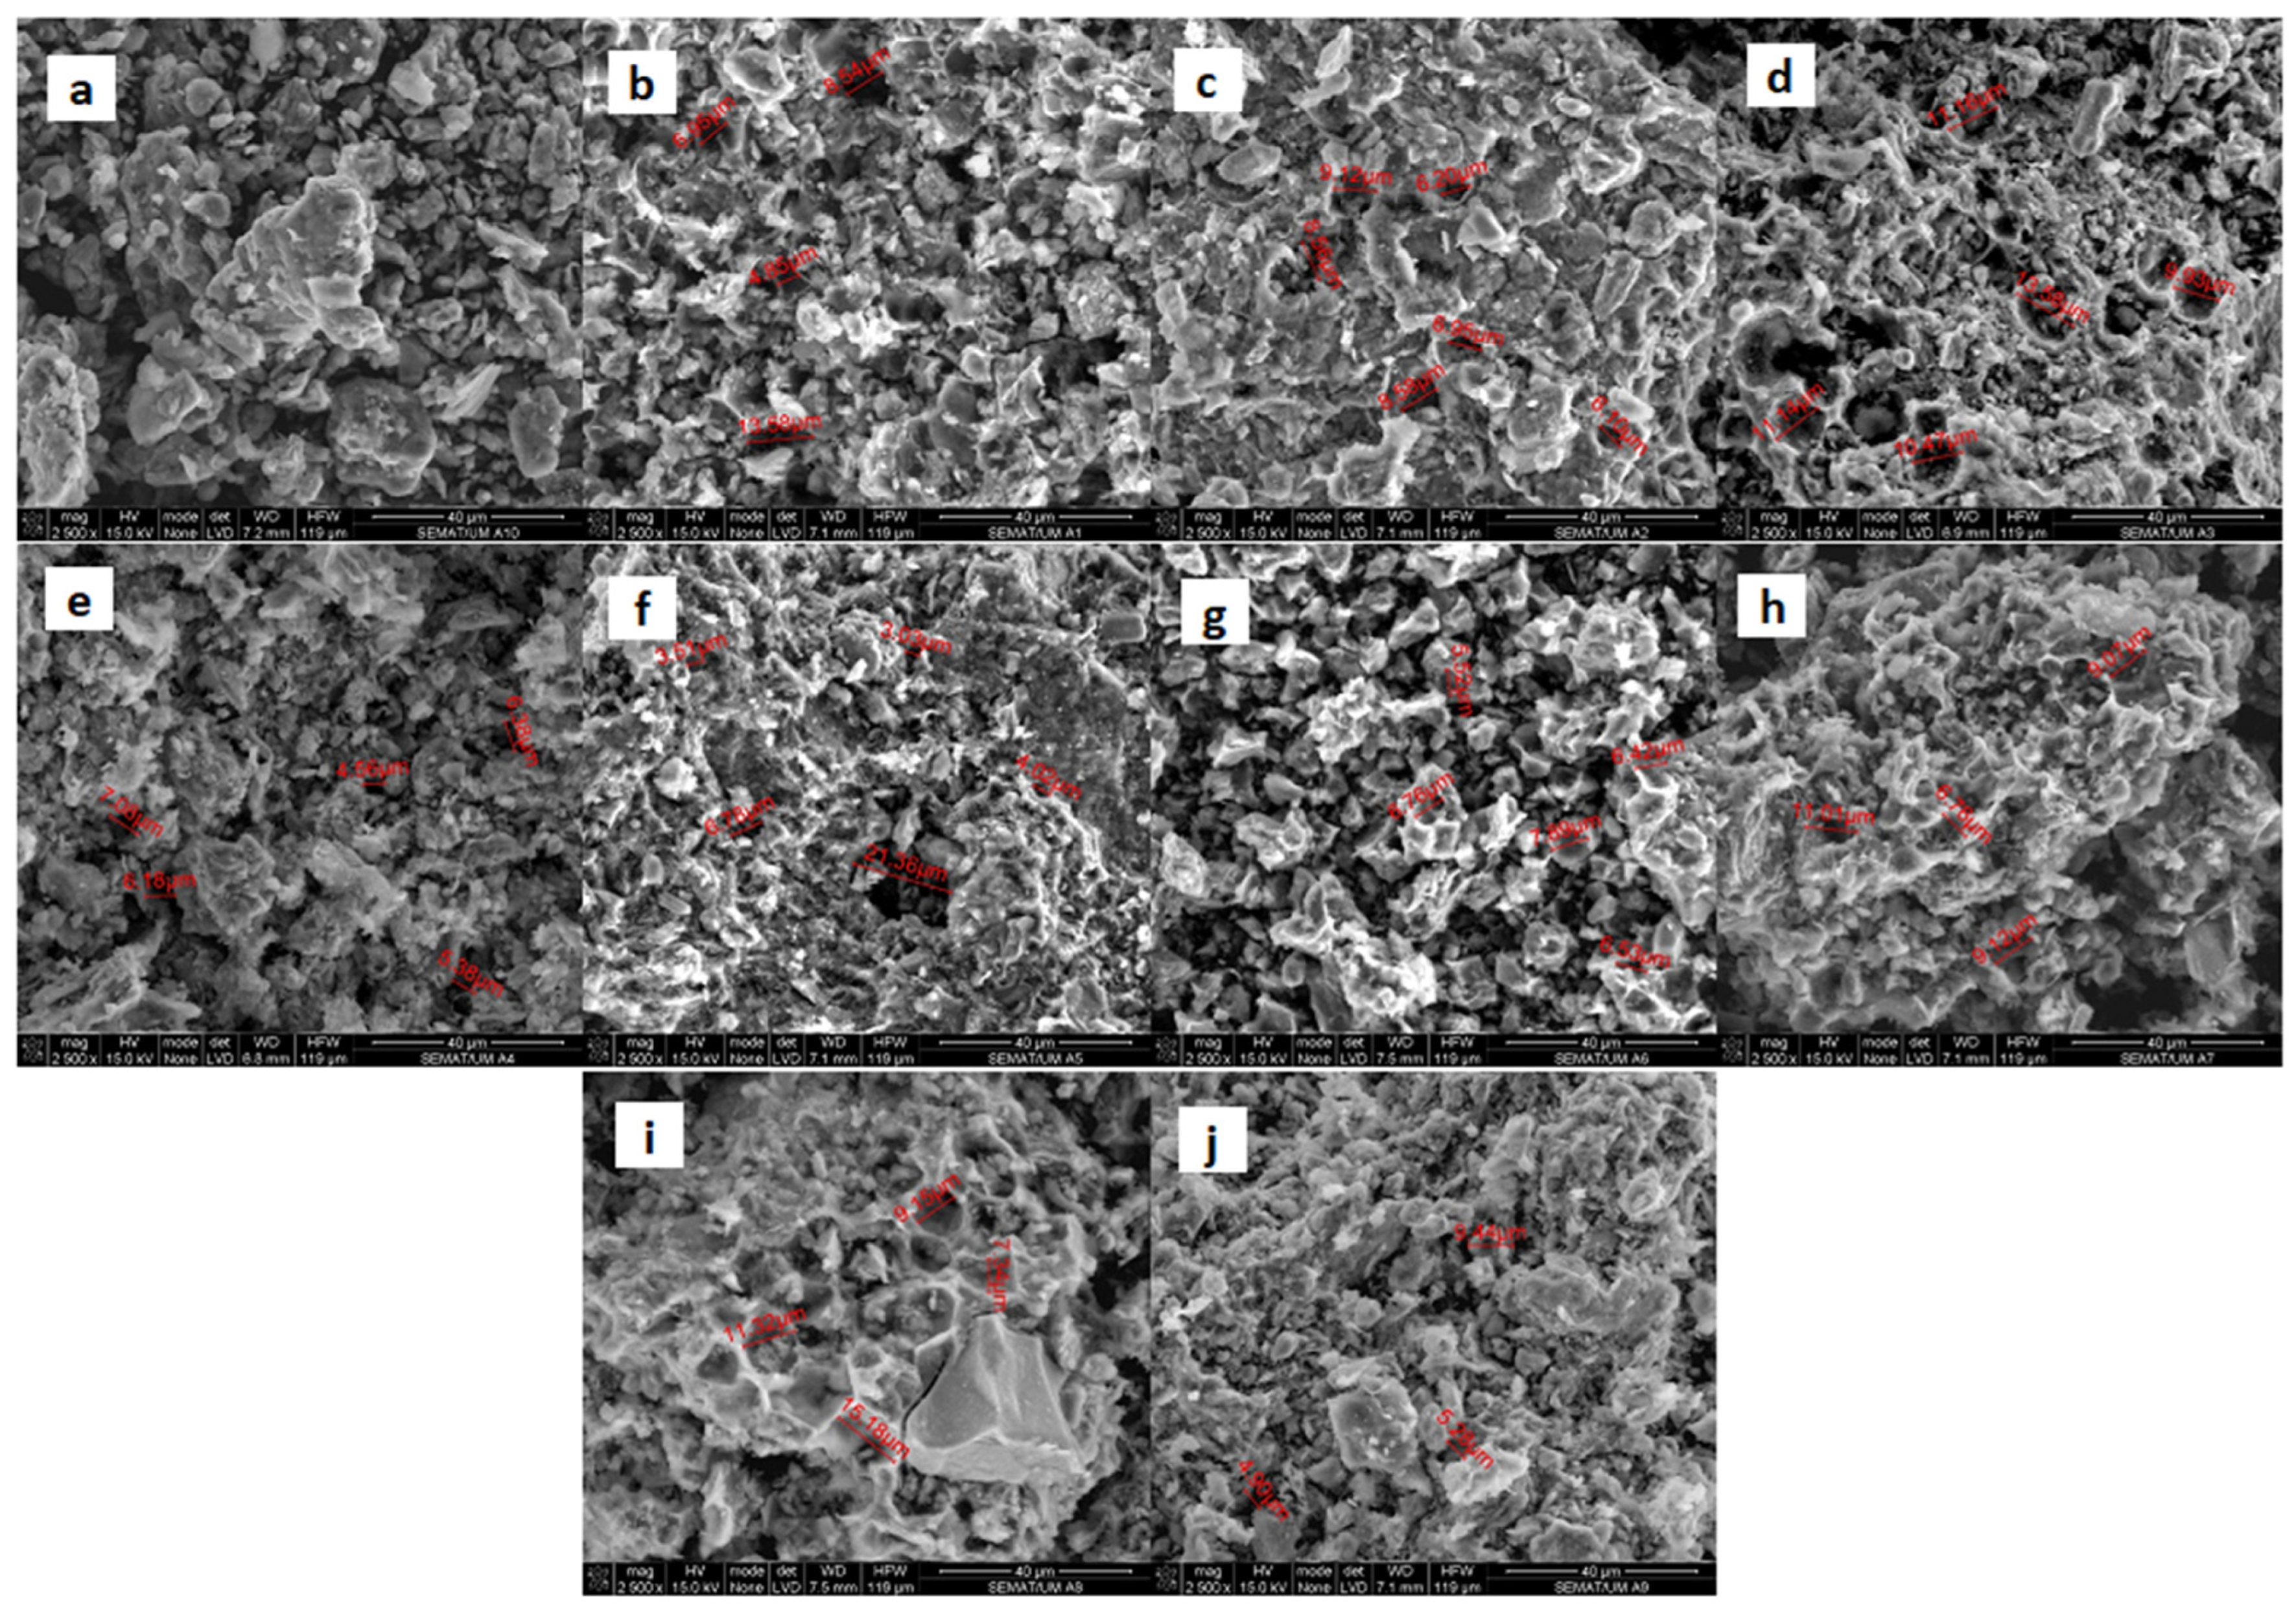
Organoclays had particles with irregular morphologies forming agglomerates (Figure 2e–l). Interestingly, these materials had higher surface roughness when compared with bentonite (Figure 2a). SEM micrographs at 2500× magnification revealed that bentonite is composed of dense particles, whereas organoclays have porous surfaces with pore sizes between 4 and 21 μm as highlighted by the red arrows inserted in Figure 3.
The EDS results reveal the presence of chemical elements such as Na, Mg, Al, and Si in bentonite (Table 3), which are typical of this clay [43]. Other chemical elements, such as Ti, K, and Fe, were also identified in bentonite and correlated with the presence of TiO2, K2O, and Fe2O3 [44]. Organoclays had chemical elements associated with the presence of bentonite and inorganic compounds from biopolymers (Table 3).

3.4. Particle Size and Surface Charge

Bentonite and organoclays should have the capacity of disaggregation in the presence of water. However, bentonite dispersed in distilled water had a mean particle size of 0.76 μm, whereas the particle size of organoclays dispersed in the same solvent oscillated between 0.76 and 1.24 μm (Table 2). In the current research, the particle size of bentonite and organoclays was similar to that reported for clay minerals dispersed in water [45].
The stability of dispersions containing bentonite and organoclays can be evaluated by means of surface charge analyses. In general, systems with a surface charge higher than ±30 mV are considered stable [46]. In this way, bentonite dispersions can be considered stable in water, and this stability decreased in organoclays, except for O1 (Table 2).

3.5. Crystalline Structure and Chemical Bonds

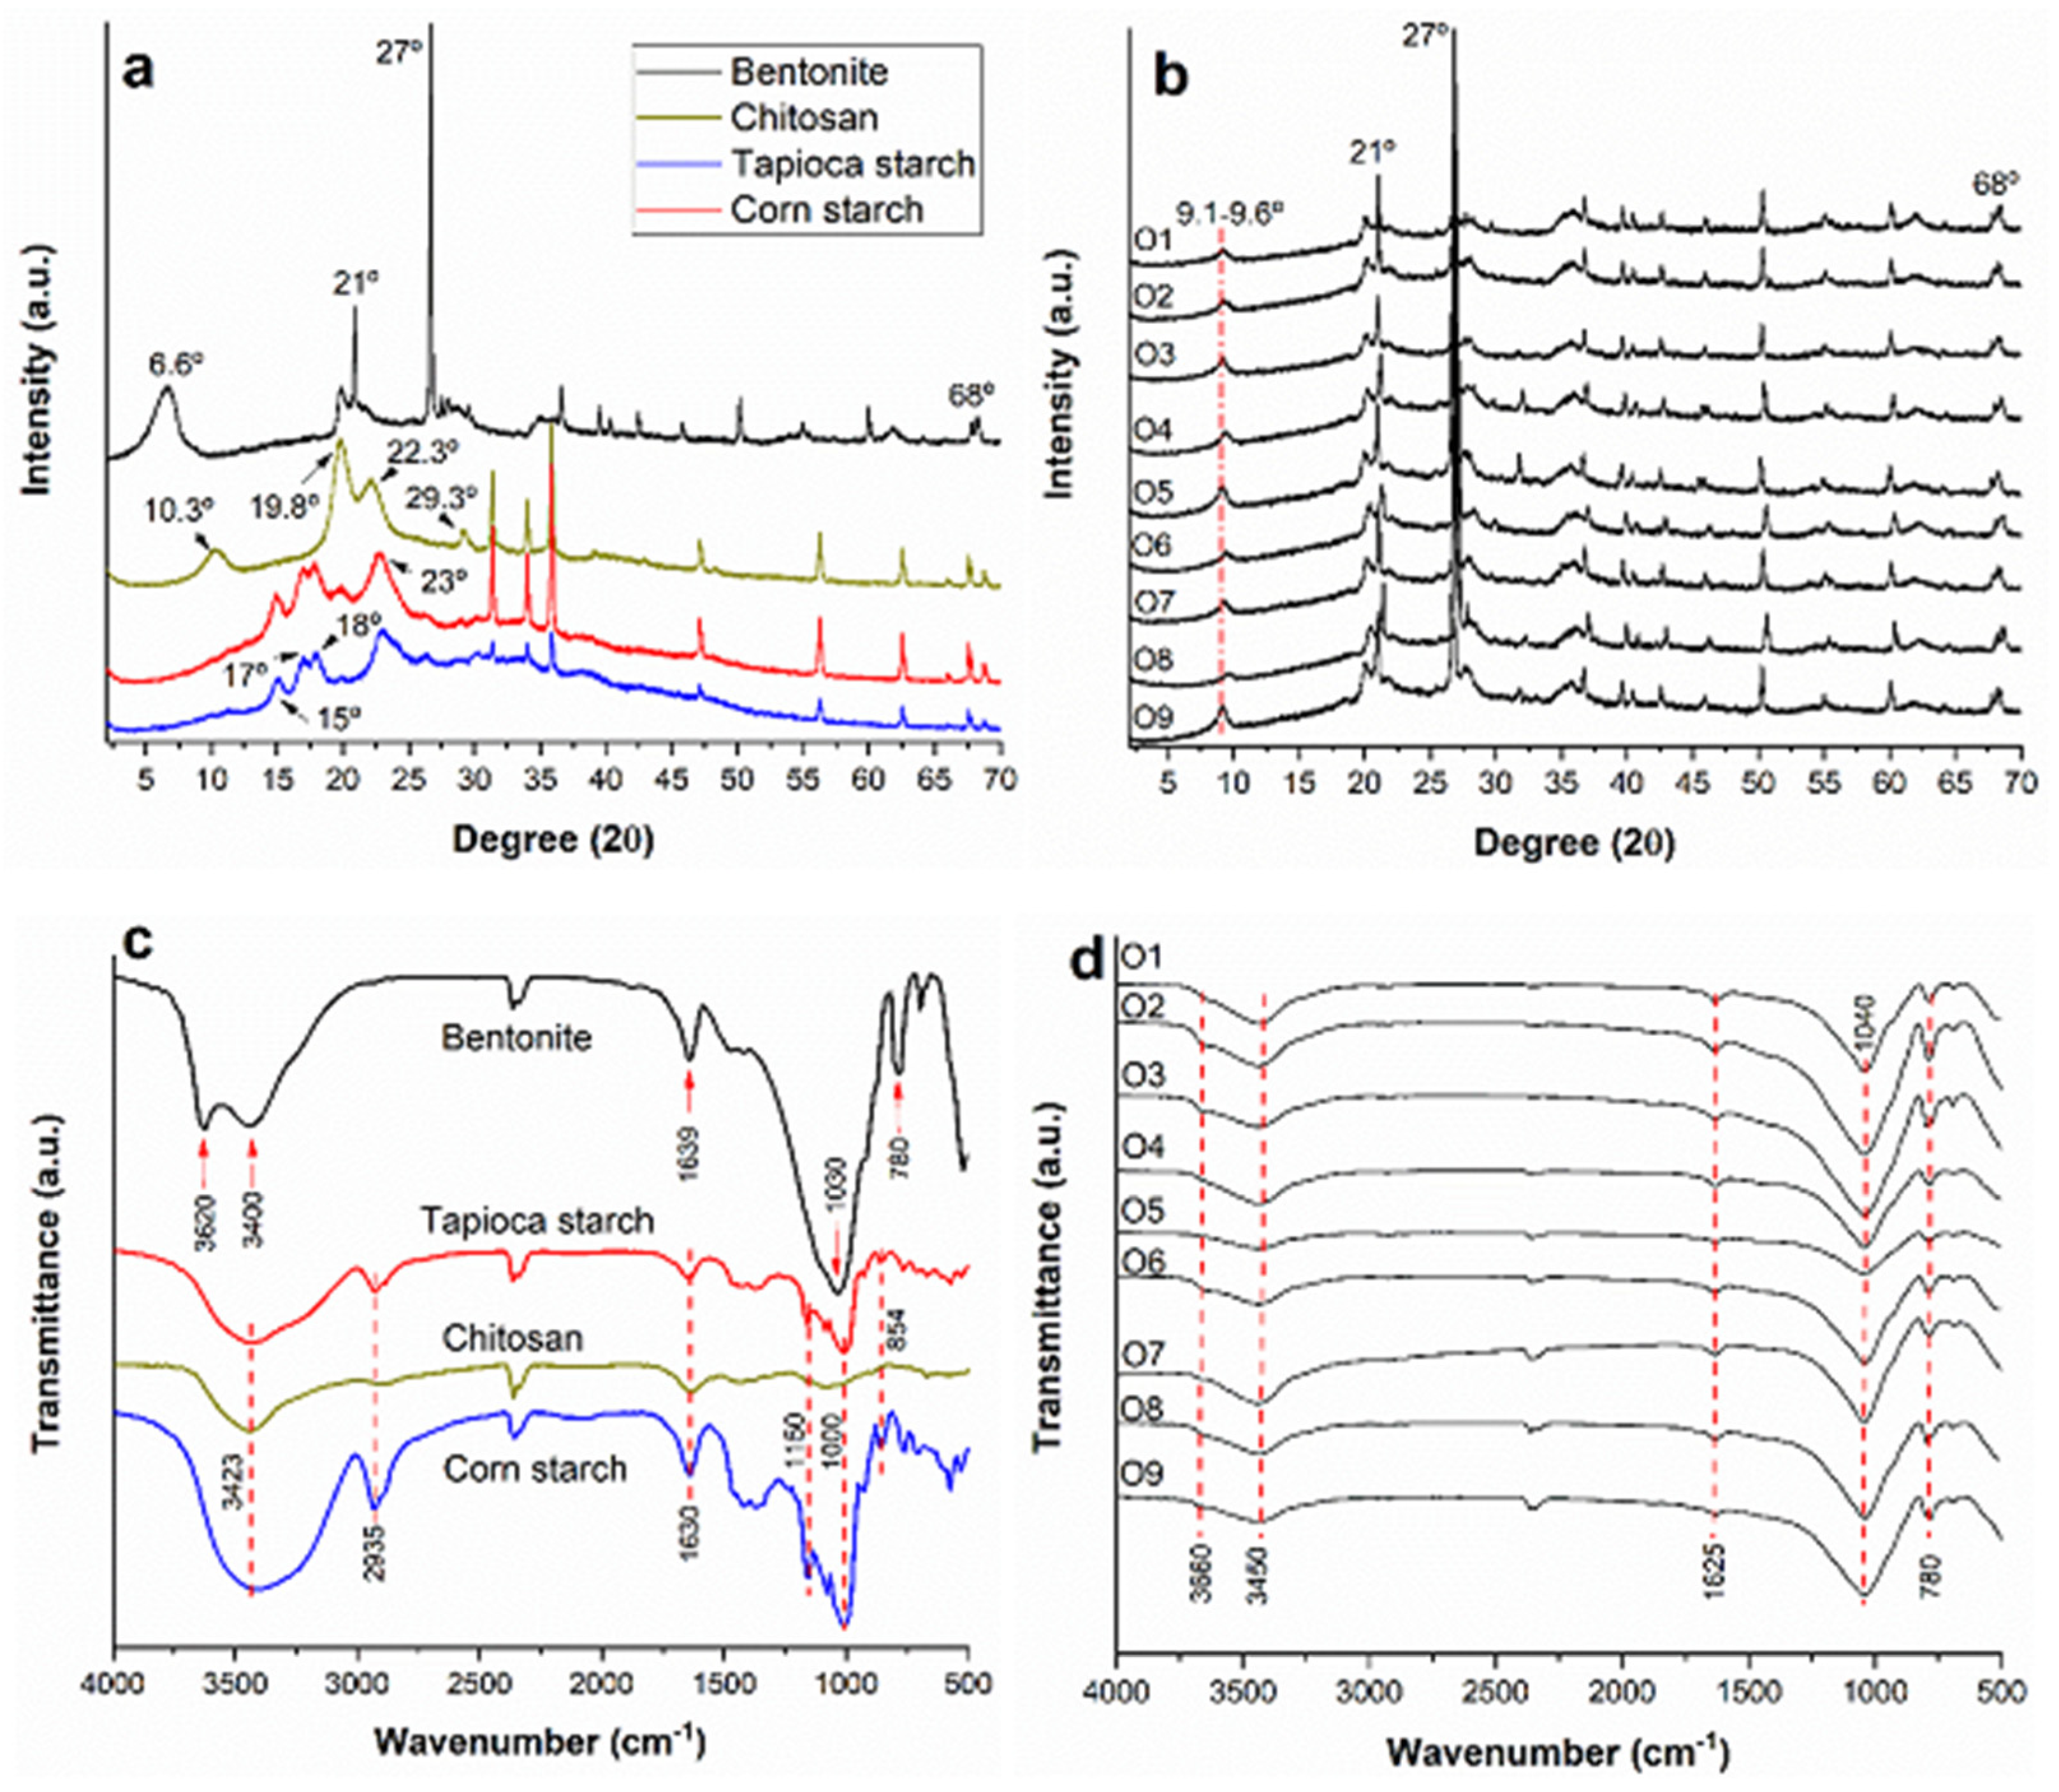
Bentonite displayed X-ray diffractograms typical of crystalline materials, with diffraction peaks centered at 2θ = 6.6° (d = 13.4 Å), 21° (d = 4.2 Å), 27° (d = 3.3 Å), and 68° (d = 1.4 Å) (Figure 4a). These peaks were correlated with the presence of silica and quarts in bentonite [47]. In the same way, chitosan and starch commercial powders displayed diffraction peaks between 2θ = 10° and 30°, correlated with the presence of crystalline structures in these macromolecules (Figure 4a) [41,48].
Organoclays had diffraction patterns typical of bentonite, with only a displacement of the peak from 2θ = 6.6° (bentonite) to 2θ = 9.1–9.6° (d = 9.6–9.7 Å) (Figure 4b).
Bentonite displayed five bands in the FTIR spectra, typical of clay minerals (Figure 4c). In this way, the stretching of Mg3OH (3620 cm−1), –OH (3400 and 1639 cm−1), and Si–O–Si (1030 and 780 cm−1) groups was observed [34,49,50].
FTIR spectra of chitosan, tapioca, and corn starches revealed the presence of six bands, typical of biopolymers (Figure 4c): stretching of –OH (3423 cm−1) and –CH (2935 cm−1) bonds, vibration of –OH groups of water present in the biopolymers (1630 cm−1), CO bond stretching of carbohydrates (1150 cm−1), intramolecular hydrogen bonding of the hydroxyl group at C-6 (1000 cm−1), and symmetric elongation of C–O–C groups (854 cm−1) [38,48].
FTIR spectra of organoclays revealed the same bands previously observed in bentonite; however, small shifts in the vibration of these groups were observed (Figure 4d).

3.6. Nitrification Test and Water Quality

Materials with high absolute surface charge values have the availability to remain stable in water. In this way, bentonite and organoclays O1, O2, and O6 were chosen based on surface charge results (Table 2) to carry out a nitrification test. Additionally, a control group with artificial substrate was included. During the 37-day experimental period, the mean temperature varied between 26 °C and 28 °C in the treatments. Dissolved oxygen was maintained above 5.5 mg L−1, with an average pH of 8.3 and salinity maintained at 31 ppm in all treatments. Total suspended solids (TSS) averaged 166 mg L−1, with volatile suspended solids (VSS) accounting for 70% of the total. No statistically significant differences were observed among the treatments for these water quality parameters (Table 4).
To correct alkalinity, calcium bicarbonate was added to the experimental tanks in different amounts: 17.7 g in the O1 and control treatments, 18.0 g in O3, 18.6 g in bentonite, and 18.9 g in the O2 treatment.
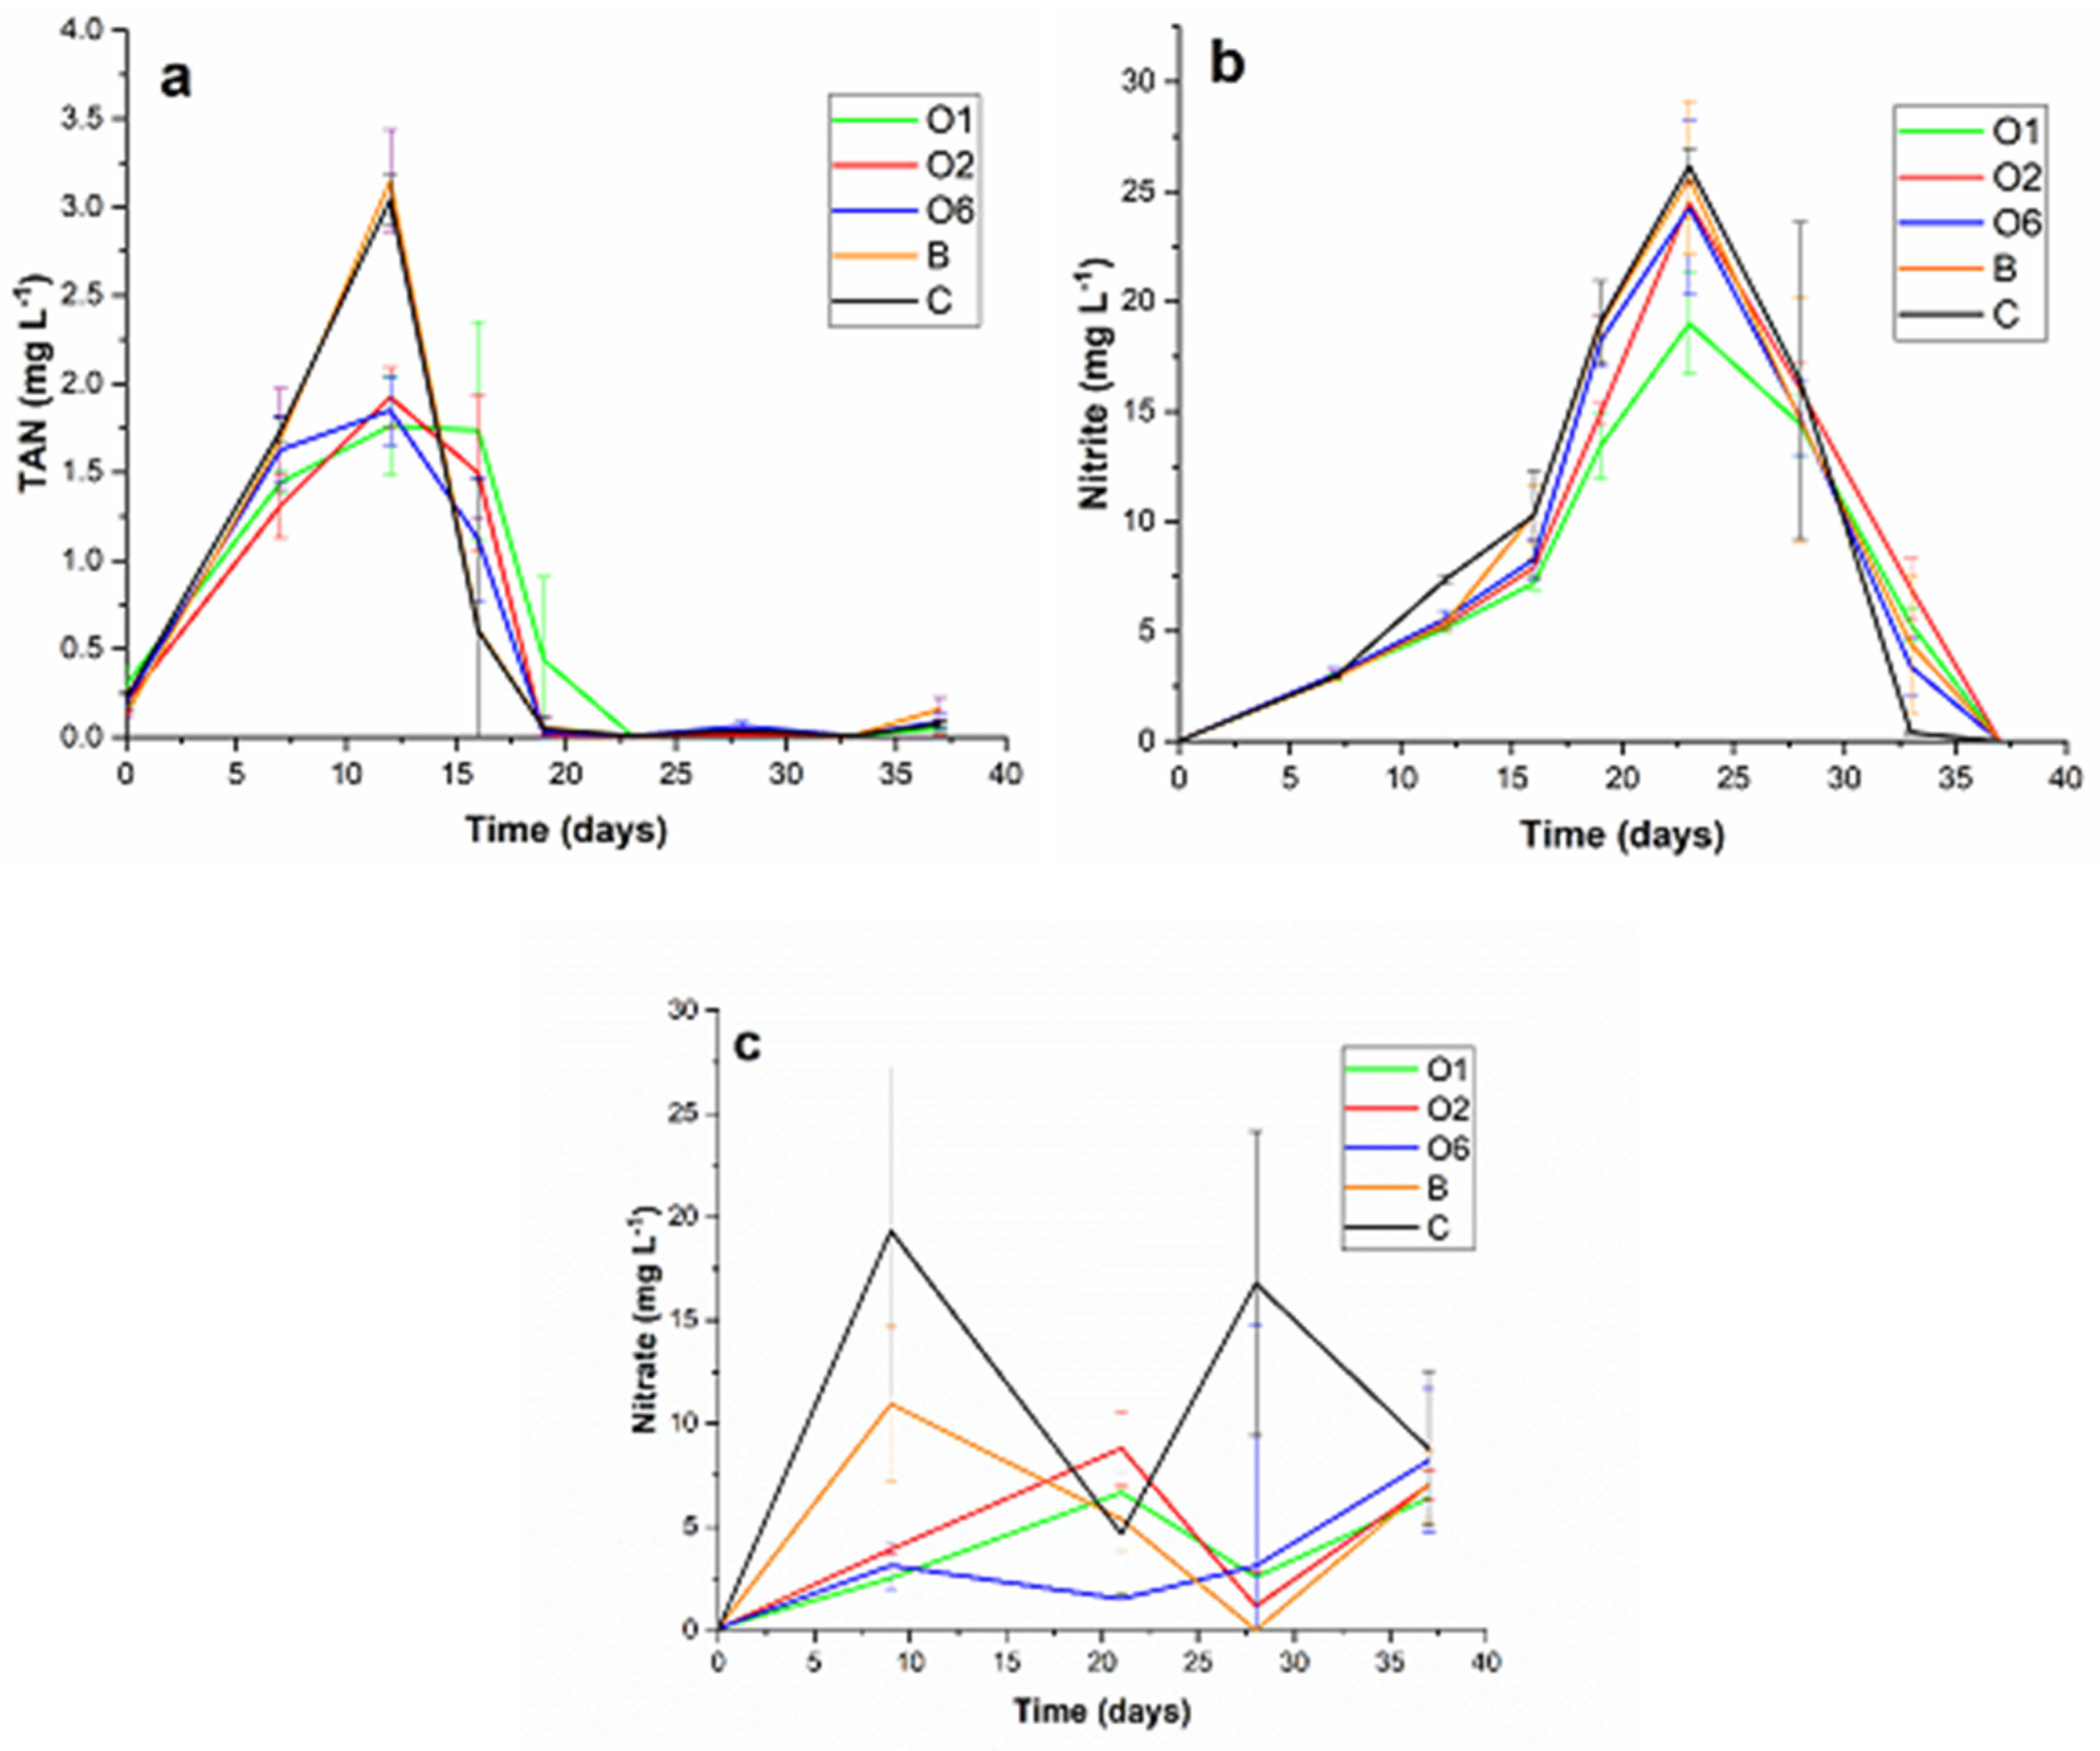
The TAN levels peaked in the 12 days in the bentonite (3.15 ± 0.29 mg L−1), control (3.04 ± 0.13 mg L−1), O2 (1.92 ± 0.16 mg L−1), and O6 (1.85 ± 0.19 mg L−1) treatments. In contrast, the organoclay O1 treatment reached its highest value on the 14th day, 1.82 ± 0.05 mg L−1, demonstrating greater efficiency in reducing and stabilizing TAN levels (Figure 5).
For NO2-N, concentrations increased during the first 22 days of the experiment, reaching peak values of 29.8 ± 1.44 mg L−1 in the control, 27.5 ± 2.15 mg L−1 in the bentonite, 22.9 ± 1.69 mg L−1 in the O6, 22.14 ± 0.42 mg L−1 in the O2, and 19.08 ± 4.42 mg L−1 in the O1 treatment. After this period, nitrite levels stabilized in all treatments (Figure 5).
The concentration of NO3-N exhibited a gradual increase over the 37-day experimental period, reaching significantly different concentrations (p < 0.05) at the end of the experiment. The highest concentration was observed in the control treatment at 8.58 mg L−1, followed by O2 at 7.11 mg L−1, O6 at 6.99 mg L−1, bentonite at 6.72 mg L−1, and O1 at 6.58 mg L−1.
Orthophosphate concentrations were low across all groups, indicating no significant phosphorus accumulation during the experiment. However, a statistically significant difference (p ≥ 0.05) was observed among the treatments (Table 4).
These results indicate the establishment of a well-defined nitrification system across all treatments, as demonstrated by the observed trends in TAN, NO2-N and NO3-N concentrations, as presented in Figure 5 and Table 4. Particularly, the surface charge of O1 was higher when compared with O2 and O6, allowing for better water stability, which could improve the stabilization of chemoautotrophic bacteria.

4. Discussion

TGA curves revealed the high thermal stability of bentonite. In parallel, it is possible to conclude that the biopolymers used in the current research were degraded after the heating process. In this way, bentonite and inert carbonaceous residues formed after biopolymer degradation are the main organoclay components.
The mathematical model based on the RM and w of each raw material composing organoclay formulation (Equation (2)) can be used to predict w o r g , with a margin of error of approximately 20%. Discrepancies between the experimental and theoretical w o r g values can be credited to differences in sample moisture of the raw materials and losses during organoclay preparation.
The visual aspect and colorimetric results confirm the presence of inert carbonaceous residues in organoclays; therefore, these materials displayed low L* values and a* ≈ 0 and b* ≈ 0, typical of samples with a dark color [51]. Color analysis is used for material characterization, and it can be correlated with product quality [52]. In this way, the color results reported in the current research could be used as standard values to control organoclay color after production.
In general, the presence of these macromolecules impacted the morphology of organoclays. Organoclays containing tapioca starch had surfaces with higher holes when compared with organoclays containing corn starch. Tapioca starch has a higher particle size (7–25 μm) when compared with corn starch (4–15 μm), allowing for the creation of large holes in the surface of bentonite during the heating process (chard). The presence of chitosan did not alter the morphology of organoclays. All organoclays showed morphologies at the micrometric scale, typical of aggregates of particles, as previously observed in bentonite [40].
Independent of the type of starch used in the formulation, all organoclays had small pores (4–21 μm), which were probably formed during water evaporation and thermal degradation of biopolymers [35,36].
Organoclays had the ability to desegregate in the presence of water-like bentonite. In this way, the particle size of organoclays dispersed in distilled water oscillated between 0.76 and 1.24 μm. Bentonite had a particle size of 0.76 μm, suggesting that the presence of inert carbonaceous residues from biopolymers increased the particle size of organoclays. Similarly, the presence of inert carbonaceous residues impacted the stability of particle size. Organoclays containing tapioca starch had higher surface charge values when compared with bentonite and other organoclays. This could be due to the presence of most negative groups on the tapioca starch granules (surface charge ≈ −43.97 mV) when compared with starches isolated from other botanical sources (surface charge ≈ −12.5 mV), as previously informed by Alves et al. [53]. Furthermore, the presence of chitosan in the formulations reduced the organoclay stability when dispersed in water. This behavior could be due to the presence of chemical groups with positive charges in chitosan (–NH2) [54].
The chemical composition of organoclay containing only tapioca starch (O1) was similar to that observed for bentonite. In contrast, organoclays containing only chitosan or corn starch (O5 and O6) had a different chemical composition with respect to Na/P/Cl/Fe and P/Cl when chitosan and corn starch were used in the formulations, respectively. Similarly, the presence of chitosan impacted the chemical composition of organoclays formulated with both macromolecules (starch and chitosan). These results could explain the difference previously observed in surface charge results of organoclays.
Independent of formulation, the pH of all organoclays increased from 8.01 (deionized water) to 8.53−8.80, a behavior typical of bentonite when dispersed in water [55]. In general, the suitable range of water pH for aquaculture is 6.5−9.0 [56], suggesting that the use of these nanomaterials does not alter the water pH in aquaculture applications.
X-ray diffraction and FTIR spectra results confirm the presence of bentonite in organoclays. The modification of diffraction peaks from 2θ = 6.6° (bentonite) to 2θ = 9.1–9.6° (organoclays) could be due to the water remotion from layered sheets from bentonite [57]. The absence of diffraction peaks and bands typical of chitosan and starches confirmed that these ingredients were completely degraded during the heating process. Furthermore, shifts of bands related to the vibration of chemical groups of organoclays when compared with bentonite could be due to the heating process.
Water quality parameters were maintained within the optimal range for the nitrification process across all treatments, with temperature ranging from 26 °C to 28 °C, dissolved oxygen levels exceeding 5.5 mg L−1, and an average pH of 8.3. These values align with the recommended conditions for sustaining nitrifying bacterial communities and facilitating efficient nitrogen assimilation in aquaculture systems [3,58]. The stability of pH throughout the experimental period can be attributed to the addition of calcium bicarbonate, which counteracted the alkalinity depletion associated with nitrification, thereby preventing significant pH reductions [11,59].
The availability of dissolved oxygen (DO) is a critical factor influencing both the metabolic activity of cultured organisms and the efficiency of nitrification. According to Van Wyk and Scarpa [58], optimal DO levels should be maintained between 5 and 9 mg L−1 to support shrimp respiration and sustain bacterial metabolism involved in nitrogen transformation. In this study, DO concentrations remained above 5 mg L−1 in all treatments, ensuring favorable conditions for nitrifying bacteria. Additionally, the presence of well-developed microbial flocs likely contributed to the stabilization of TAN and nitrite concentrations, reducing fluctuations in water quality and promoting a more balanced environment for shrimp cultivation [60,61].
The nitrogen dynamics exhibited distinct variations among treatments. TAN concentrations peaked on day 12 in most treatments, whereas the O1 organoclay treatment displayed a delayed peak on day 14, with lower overall accumulation. This delay suggests that O1 could facilitate more efficient bacterial colonization, enhancing ammonia oxidation to nitrite. In aquaculture systems, TAN primarily originates from shrimp excretion and the decomposition of organic matter, particularly uneaten feed [11,61]. Substrates with high adsorption capacity may reduce ammonia concentrations in the water column, thereby promoting bacterial oxidation [23,62].
Nitrite (NO2-N) accumulation was most pronounced during the first 22 days of the experiment, with the highest concentrations recorded in the control (29.8 mg L−1) and bentonite (27.5 mg L−1) treatments. In contrast, organoclay treatments, particularly O1 (19.08 mg L−1), exhibited lower NO2-N concentrations, indicating a more efficient nitrite-to-nitrate conversion. Nitrite accumulation is a common challenge in aquaculture systems, as ammonia-oxidizing bacteria (Nitrosomonas) proliferate more rapidly than nitrite-oxidizing bacteria (Nitrobacter and Nitrospira), particularly in saline environments [12,63].
The presence of specific substrates plays a pivotal role in influencing nitrification efficiency. Previous studies have demonstrated that nitrite-oxidizing bacteria (NOB) activity can be limited by several environmental factors, including variations in organic matter concentrations, alkalinity, pH, temperature, and dissolved oxygen availability [64]. In the present study, the lower NO2-N concentrations observed in the organoclay treatments suggest that these substrates provided a more suitable environment for NOB proliferation, thereby facilitating a more rapid nitrite oxidation process.
The final accumulation of nitrate (NO3-N) over the 37-day period confirmed that nitrification was successfully established in all treatments. The results further indicate that substrate selection significantly influenced nitrogen transformations within the system, with O1 demonstrating the highest efficiency in stabilizing nitrogenous compounds. In biofloc technology (BFT) systems, nitrifying bacterial communities typically require approximately 20 days to establish, during which temporary nitrogen peaks are commonly observed [13]. The improved performance observed in the O1 treatment suggests that this substrate could enhance bacterial colonization and promote a more efficient nitrogen cycle, reducing nitrite accumulation. Furthermore, O1 is a dispersible water material which can be applied in a single dose, dismissing management practices when compared with artificial substrates (Needlona®).
In the current research, the O1 treatment exhibited superior performance in TAN removal and the conversion of NO2-N to NO3-N, contributing to a more stable environment for nitrifying bacteria (Figure 5). According to the literature, optimizing the nitrogen cycle is crucial for preventing toxic nitrogen compound accumulation and minimizing the need for water exchanges and chemical adjustments in intensive aquaculture systems [3]. Therefore, the new materials developed in this research have potential aquaculture applications.
These results highlight the potential of organoclays, particularly O1, as a promising alternative for improving water quality in intensive shrimp culture. Future research should further investigate: (a) the interactions between modified substrates and microbial communities; (b) the impact on animal performance and overall system efficiency; (c) operational aspects of organoclays, including optimal dose, material persistence, removal, or management after use; and (d) economical aspects and environmental impacts.

5. Conclusions

The use of tapioca allows for the production of organoclays with higher porosity, particularly in the formulation O1 (bentonite 8.3% + tapioca 8.4%), resulting in materials with low particle size (0.8 µm) and high absolute surface charge (−38.7 mV), which facilitated the water stabilization of this material, resulting in better nitrification stability in chemoautotrophic BFT. Nevertheless, the other formulations also yielded promising results, achieving complete nitrification within 37 days in all treatments, suggesting that different combinations of clay and starch can be viable strategies to optimize nitrification and, consequently, biofloc culture systems.

Author Contributions

Conceptualization, T.R.G. and F.B.V.; methodology, T.R.G., W.W.J., F.B.V. and C.M.; validation, T.R.G., M.H.d.A.M. and C.M.; formal analysis, T.R.G.; investigation, T.R.G.; resources, F.B.V. and L.H.; data curation, T.R.G.; writing—original draft preparation, T.R.G.; writing—review and editing, T.R.G., L.H., W.W.J. and F.B.V.; supervision, W.W.J. and F.B.V.; project administration, W.W.J. and F.B.V.; funding acquisition, W.W.J. and F.B.V. All authors have read and agreed to the published version of the manuscript.

Funding

This research was funded by the National Council for Scientific and Technological Development, grant number CNPq 409832/2025-1. W.W.J. and F.B.V. hold CNPq Research Productivity Fellowships.

Institutional Review Board Statement

Not applicable.

Data Availability Statement

The original contributions presented in this study are included in the article. Further inquiries can be directed at the corresponding author.

Acknowledgments

The authors gratefully acknowledge CAPES code 001 (Coordination for the Improvement of Higher Education Personnel) for a doctoral fellowship to the first author and the Central Chemical Analysis of Chemical Engineering and Food Engineering (EQA), Central Laboratory of Electronic Microscopy (LCME) and Interdisciplinary Laboratory for Nanostructures Development (LINDEN), for the analyses.

Conflicts of Interest

The authors declare no conflicts of interest.

Appendix A

Table A1. Comparison between theoretical organoclay mass ( w o r g t ), calculated using Equation (2), and experimental organoclay mass ( w o r g e ).
w o r g t (g) w o r g e (g)
22.2023.00
22.5022.10
22.9921.86
23.4623.02
23.7722.11
22.2021.40
22.5120.84
22.9921.04
23.4621.86

References

  1. FAO. The State of World Fisheries and Aquaculture 2024; FAO: Rome, Italy, 2024. [Google Scholar]
  2. Crab, R.; Avnimelech, Y.; Defoirdt, T.; Bossier, P.; Verstraete, W. Nitrogen Removal Techniques in Aquaculture for a Sustainable Production. Aquaculture 2007, 270, 1–14. [Google Scholar] [CrossRef] [Scilit]
  3. Khanjani, M.H.; Mohammadi, A.; Emerenciano, M.G.C. Water Quality in Biofloc Technology (BFT): An Applied Review for an Evolving Aquaculture. Aquac. Int. 2024, 32, 9321–9374. [Google Scholar] [CrossRef] [Scilit]
  4. Xu, W.J.; Morris, T.C.; Samocha, T.M. Effects of C/N Ratio on Biofloc Development, Water Quality, and Performance of Litopenaeus Vannamei Juveniles in a Biofloc-Based, High-Density, Zero-Exchange, Outdoor Tank System. Aquaculture 2016, 453, 169–175. [Google Scholar] [CrossRef] [Scilit]
  5. Avnimelech, Y. Biofloc Technology: A Practical Guide Book, 2nd ed.; Avnimelech, Y., Ed.; World Aquaculture Society: Baton Rouge, LA, USA, 2012; Volume 1. [Google Scholar]
  6. Abakari, G.; Luo, G.; Kombat, E.O. Dynamics of Nitrogenous Compounds and Their Control in Biofloc Technology (BFT) Systems: A Review. Aquac. Fish. 2021, 6, 441–447. [Google Scholar] [CrossRef] [Scilit]
  7. Ray, A.J.; Seaborn, G.; Leffler, J.W.; Wilde, S.B.; Lawson, A.; Browdy, C.L. Characterization of Microbial Communities in Minimal-Exchange, Intensive Aquaculture Systems and the Effects of Suspended Solids Management. Aquaculture 2010, 310, 130–138. [Google Scholar] [CrossRef] [Scilit]
  8. Ferreira, G.S.; Santos, D.; Schmachtl, F.; Machado, C.; Fernandes, V.; Bögner, M.; Schleder, D.D.; Seiffert, W.Q.; Vieira, F.N. Heterotrophic, Chemoautotrophic and Mature Approaches in Biofloc System for Pacific White Shrimp. Aquaculture 2021, 533, 736099. [Google Scholar] [CrossRef] [Scilit]
  9. Zhang, M.; Li, Y.; Xu, D.-H.; Qiao, G.; Zhang, J.; Qi, Z.; Li, Q. Effect of Different Water Biofloc Contents on the Growth and Immune Response of Gibel Carp Cultured in Zero Water Exchange and No Feed Addition System. Aquac. Res. 2018, 49, 1647–1656. [Google Scholar] [CrossRef] [Scilit]
  10. Avnimelech, Y. Carbon/Nitrogen Ratio as a Control Element in Aquaculture Systems. Aquaculture 1999, 176, 227–235. [Google Scholar] [CrossRef] [Scilit]
  11. Ebeling, J.M.; Timmons, M.B.; Bisogni, J.J. Engineering Analysis of the Stoichiometry of Photoautotrophic, Autotrophic, and Heterotrophic Removal of Ammonia–Nitrogen in Aquaculture Systems. Aquaculture 2006, 257, 346–358. [Google Scholar] [CrossRef] [Scilit]
  12. Ferreira, G.S.; Silva, V.F.; Martins, M.A.; da Silva, A.C.C.P.; Machado, C.; Seiffert, W.Q.; do Nascimento Vieira, F. Strategies for Ammonium and Nitrite Control in Litopenaeus vannamei Nursery Systems with Bioflocs. Aquac. Eng. 2020, 88, 102040. [Google Scholar] [CrossRef] [Scilit]
  13. Otoshi, C.; Rodriguez, N.; Moss, S.M. Establishing Nitrifying Bacteria in Super-Intensive Biofloc Shrimp Production. 2011 Global Seafood Alliance. Available online: https://www.globalseafood.org/advocate/establishing-nitrifying-bacteria-in-super-intensive-biofloc-shrimp-production/ (accessed on 2 December 2025).
  14. Avnimelech, Y.; Kochba, M. Evaluation of Nitrogen Uptake and Excretion by Tilapia in Bio Floc Tanks, Using 15N Tracing. Aquaculture 2009, 287, 163–168. [Google Scholar] [CrossRef] [Scilit]
  15. Zhang, X.; Li, M.; Tao, X.; Yang, Y.; Sun, P.; Jin, M.; Zhou, Q.; Jiao, L. Effects of Dietary Montmorillonite Supplementation on the Growth Performance, Antioxidant Capacity, Intestinal Barrier and Microbiota Composition in Marsupenaeus japonicus. Aquaculture 2022, 557, 738330. [Google Scholar] [CrossRef] [Scilit]
  16. Krummenauer, D.; Samocha, T.; Poersch, L.; Lara, G.; Wasielesky, W. The Reuse of Water on the Culture of Pacific White Shrimp, Litopenaeus vannamei, in BFT System. J. World Aquac. Soc. 2014, 45, 3–14. [Google Scholar] [CrossRef] [Scilit]
  17. Lara, G.; Honda, M.; Poersch, L.; Wasielesky, W. The Use of Biofilm and Different Feeding Rates in Biofloc Culture System: The Effects in Shrimp Growth Parameters. Aquac. Int. 2017, 25, 1959–1970. [Google Scholar] [CrossRef] [Scilit]
  18. Ferreira, L.M.H.; Lara, G.; Wasielesky, W.; Abreu, P.C. Biofilm versus Biofloc: Are Artificial Substrates for Biofilm Production Necessary in the BFT System? Aquac. Int. 2016, 24, 921–930. [Google Scholar] [CrossRef] [Scilit]
  19. Costa Rezende, P.; Dias Schleder, D.; Ventura da Silva, H.; Morais Henriques, F.; de Lorenzo, M.A.; Quadros Seiffert, W.; Roberto Andreatta, E.; Nascimento Vieira, F.D. Prenursery of the Pacific White Shrimp in a Biofloc System Using Different Artificial Substrates. Aquac. Eng. 2018, 82, 25–30. [Google Scholar] [CrossRef] [Scilit]
  20. Olier, B.S.; Tubin, J.S.B.; Mello, G.L.d.; Martínez-Porchas, M.; Emerenciano, M.G.C. Does vertical substrate could influence the dietary protein level and zootechnical performance of the Pacific white shrimp Litopenaeus vannamei reared in a biofloc system? Aquac. Int. 2020, 28, 1227–1241. [Google Scholar] [CrossRef] [Scilit]
  21. Hargreaves, J.A. Biofloc Production Systems for Aquaculture; Southern Regional Aquaculture Center: Stoneville, MS, USA, 2013. [Google Scholar]
  22. Paiva, L.B.; Morales, A.R.; Valenzuela Díaz, F.R. Organoclays: Properties, Preparation and Applications. Appl. Clay Sci. 2008, 42, 8–24. [Google Scholar] [CrossRef] [Scilit]
  23. Xavier, M.; Júnior, W.W.; Hostins, B.; Bequé, E.; Krummenauer, D. The Use of a Flocculant Additive and Its Effect on Biofloc Formation, Nitrification, and Zootechnical Performance during the Culture of Pacific White Shrimp Penaeus vannamei (Boone, 1931) in a BFT System. Lat. Am. J. Aquat. Res. 2022, 50, 181–196. [Google Scholar] [CrossRef] [Scilit]
  24. Uddin, F. Clays, Nanoclays, and Montmorillonite Minerals. Metall. Mater. Trans. A 2008, 39, 2804–2814. [Google Scholar] [CrossRef] [Scilit]
  25. Du, J.; Chadalavada, S.; Naidu, R. Synthesis of Porous Bentonite Organoclay Granule and Its Adsorption of Tributyltin. Appl. Clay Sci. 2017, 148, 131–137. [Google Scholar] [CrossRef] [Scilit]
  26. Polat, T.G.; Duman, O.; Tunç, S. Agar/κ-Carrageenan/Montmorillonite Nanocomposite Hydrogels for Wound Dressing Applications. Int. J. Biol. Macromol. 2020, 164, 4591–4602. [Google Scholar] [CrossRef] [Scilit]
  27. Kahraman, H.T. Development of an Adsorbent via Chitosan Nano-Organoclay Assembly to Remove Hexavalent Chromium from Wastewater. Int. J. Biol. Macromol. 2017, 94, 202–209. [Google Scholar] [CrossRef] [Scilit] [PubMed]
  28. Capello, C.; Leandro, G.C.; Campos, C.E.M.; Hotza, D.; Carciofi, B.A.M.; Valencia, G.A. Adsorption and Desorption of Eggplant Peel Anthocyanins on a Synthetic Layered Silicate. J. Food Eng. 2019, 262, 162–169. [Google Scholar] [CrossRef] [Scilit]
  29. César, L.T.; Soares, L.S.; Farias, M.P.D.; Sá, D.M.A.T.; Valencia, G.A.; Monteiro, A.R. Chitosan and Acerola (Malpighia emarginata) Fruit Based Active Coating Can Control the Melanosis of Refrigerated Shrimps (Litopenaeus vannamei). J. Food Process Preserv. 2022, 46, e16983. [Google Scholar] [CrossRef] [Scilit]
  30. Chacon, W.D.C.; dos Santos Araujo, E.; de Matos Fonseca, J.; Monteiro, A.R.; Valencia, G.A. Understanding the Interaction Between Gelatin and a Layered Silicate and Its Impact on the Physicochemical Properties of Films Produced by Casting. J. Polym. Environ. 2024, 32, 3687–3697. [Google Scholar] [CrossRef] [Scilit]
  31. Santos Alves, M.J.; de Sousa, M.H.O.; de Moura, N.F.; Cesca, K.; Verruck, S.; Monteiro, A.R.; Valencia, G.A. Starch Nanoparticles Containing Phenolic Compounds from Green Propolis: Characterization and Evaluation of Antioxidant, Antimicrobial and Digestibility Properties. Int. J. Biol. Macromol. 2024, 255, 128079. [Google Scholar] [CrossRef] [Scilit]
  32. Furtado, P.S.; Poersch, L.H.; Wasielesky, W. Effect of Calcium Hydroxide, Carbonate and Sodium Bicarbonate on Water Quality and Zootechnical Performance of Shrimp Litopenaeus vannamei Reared in Bio-Flocs Technology (BFT) Systems. Aquaculture 2011, 321, 130–135. [Google Scholar] [CrossRef] [Scilit]
  33. Strickland, J.D.H.; Parsons, T.R. DFO—A PRACTICAL HANDBOOK OF SEAWATER ANALYSIS. Ottawa, 1972. Available online: https://epic.awi.de/id/eprint/39262/1/Strickland-Parsons_1972.pdf (accessed on 15 July 2025).
  34. Marsh, A.; Heath, A.; Patureau, P.; Evernden, M.; Walker, P. Alkali Activation Behaviour of Un-Calcined Montmorillonite and Illite Clay Minerals. Appl. Clay Sci. 2018, 166, 250–261. [Google Scholar] [CrossRef] [Scilit]
  35. Chacon, W.D.C.; Valencia, G.A.; Rojas, G.M.A.; Henao, A.C.A. Mathematical Models for Prediction of Water Evaporation and Thermal Degradation Kinetics of Potato Starch Nanoparticles Obtained by Nanoprecipitation. Starch/Stärke 2019, 71, 1800081. [Google Scholar] [CrossRef] [Scilit]
  36. Kumar, S.; Koh, J. Physiochemical, Optical and Biological Activity of Chitosan-Chromone Derivative for Biomedical Applications. Int. J. Mol. Sci. 2012, 13, 6102–6116. [Google Scholar] [CrossRef] [Scilit]
  37. Christidis, G.E.; Makri, P.; Perdikatsis, V. Influence of Grinding on the Structure and Colour Properties of Talc, Bentonite and Calcite White Fillers. Clay Miner. 2004, 39, 163–175. [Google Scholar] [CrossRef] [Scilit]
  38. Valencia, G.A.; Moraes, I.C.F.; Lourenço, R.V.; Bittante, A.M.Q.B.; Sobral, P.J.d.A. Physicochemical, Morphological, and Functional Properties of Flour and Starch from Peach Palm (Bactris gasipaes K.) Fruit. Starch/Stärke 2015, 67, 163–173. [Google Scholar] [CrossRef] [Scilit]
  39. Bippus, L.; Jaber, M.; Lebeau, B. Laponite and Hybrid Surfactant/Laponite Particles Processed as Spheres by Spray-Drying. New J. Chem. 2009, 33, 1116–1126. [Google Scholar] [CrossRef] [Scilit]
  40. González-Santamaría, D.E.; Justel, A.; Fernández, R.; Ruiz, A.I.; Stavropoulou, A.; Rodríguez-Blanco, J.D.; Cuevas, J. SEM-EDX Study of Bentonite Alteration under the Influence of Cement Alkaline Solutions. Appl. Clay Sci. 2021, 212, 106223. [Google Scholar] [CrossRef] [Scilit]
  41. Valencia, G.A.; Djabourov, M.; Sobral, P.J.d.A. Water Desorption of Cassava Starch Granules: A Study Based on Thermogravimetric Analysis of Aqueous Suspensions and Humid Powders. Carbohydr. Polym. 2016, 147, 533–541. [Google Scholar] [CrossRef] [Scilit] [PubMed]
  42. Kim, H.-S.; Lee, S.-H.; Eun, C.-J.; Yoo, J.; Seo, Y.-S. Dispersion of Chitosan Nanoparticles Stable over a Wide PH Range by Adsorption of Polyglycerol Monostearate. Nanomater. Nanotechnol. 2020, 10, 184798042091726. [Google Scholar] [CrossRef] [Scilit]
  43. Komatsu, L.G.H.; Oliani, W.L.; Lugao, A.B.; Parra, D.F. Nanocomposites of Irradiated Polypropylene with Clay Are Degradable? Radiat. Phys. Chem. 2016, 118, 11–15. [Google Scholar] [CrossRef] [Scilit]
  44. Damian, G.; Damian, F.; Szakács, Z.; Iepure, G.; Aştefanei, D. Mineralogical and Physico-Chemical Characterization of the Oraşu-Nou (Romania) Bentonite Resources. Minerals 2021, 11, 938. [Google Scholar] [CrossRef] [Scilit]
  45. Karimi, L.; Salem, A. The Role of Bentonite Particle Size Distribution on Kinetic of Cation Exchange Capacity. J. Ind. Eng. Chem. 2011, 17, 90–95. [Google Scholar] [CrossRef] [Scilit]
  46. Sharma, S.; Shukla, P.; Misra, A.; Mishra, P.R. Interfacial and Colloidal Properties of Emulsified Systems. In Colloid and Interface Science in Pharmaceutical Research and Development; Elsevier: Amsterdam, The Netherlands, 2014; pp. 149–172. [Google Scholar]
  47. Olopade, B.K.; Oranusi, S.; Nwinyi, O.C.; Njobeh, P.B.; Lawal, I.A. Characterization of Nanoformulations from Montmorillonite Clay for the Decontamination of Zearalenonein Cereals Using X-Ray Diffraction Technique. J. Phys. Conf. Ser. 2019, 1299, 012107. [Google Scholar] [CrossRef] [Scilit]
  48. Zhang, Y.; Xue, C.; Xue, Y.; Gao, R.; Zhang, X. Determination of the Degree of Deacetylation of Chitin and Chitosan by X-Ray Powder Diffraction. Carbohydr. Res. 2005, 340, 1914–1917. [Google Scholar] [CrossRef] [Scilit]
  49. Negrete; Letoffe, J.-M.; Putaux, J.-L.; David, L.; Bourgeat-Lami, E. Aqueous Dispersions of Silane-Functionalized Laponite Clay Platelets. A First Step toward the Elaboration of Water-Based Polymer/Clay Nanocomposites. Langmuir 2004, 20, 1564–1571. [Google Scholar] [CrossRef] [Scilit]
  50. Pálková, H.; Madejová, J.; Zimowska, M.; Serwicka, E.M. Laponite-Derived Porous Clay Heterostructures: II. FTIR Study of the Structure Evolution. Microporous Mesoporous Mater. 2010, 127, 237–244. [Google Scholar] [CrossRef] [Scilit]
  51. Dimitrov, T.I.; Ibreva, T.H.; Zaichuk, A.V.; Markovska, I.G.; Amelina, A.A.; Karasik, E.V. Synthesis and Study of Low-Temperature Ferrum-Willemite Ceramic Pigments. Voprosy Khimii Khimicheskoi Tekhnologii 2019, 6, 69–73. [Google Scholar] [CrossRef] [Scilit]
  52. Luo, M.R. CIELAB. In Encyclopedia of Color Science and Technology; Springer: Berlin, Germany, 2015; pp. 1–7. [Google Scholar]
  53. Santos Alves, M.J.d.; Calvo Torres de Freitas, P.M.; Monteiro, A.R.; Ayala Valencia, G. Impact of the Acidified Hydroethanolic Solution on the Physicochemical Properties of Starch Nanoparticles Produced by Anti-Solvent Precipitation. Starch-Stärke 2021, 73, 2100034. [Google Scholar] [CrossRef] [Scilit]
  54. Barbosa, H.F.G.; Francisco, D.S.; Ferreira, A.P.G.; Cavalheiro, É.T.G. A New Look towards the Thermal Decomposition of Chitins and Chitosans with Different Degrees of Deacetylation by Coupled TG-FTIR. Carbohydr. Polym. 2019, 225, 115232. [Google Scholar] [CrossRef] [Scilit]
  55. Kelessidis, V.C.; Tsamantaki, C.; Dalamarinis, P. Effect of PH and Electrolyte on the Rheology of Aqueous Wyoming Bentonite Dispersions. Appl. Clay Sci. 2007, 38, 86–96. [Google Scholar] [CrossRef] [Scilit]
  56. Boyd, C.E.; Tucker, C.S.; Somridhivej, B. Alkalinity and Hardness: Critical but Elusive Concepts in Aquaculture. J. World Aquac. Soc. 2016, 47, 6–41. [Google Scholar] [CrossRef] [Scilit]
  57. Valencia, G.A.; Djabourov, M.; Carn, F.; Sobral, P.J.A. Novel Insights on Swelling and Dehydration of Laponite. Colloids Interface Sci. Commun. 2018, 23, 1–5. [Google Scholar] [CrossRef] [Scilit]
  58. Van Wyk, P.; Davis-Hodgkins, M.; Laramore, R.; Main, K.L.; Mountain, J.; Scarpa, J. Farming Marine Shrimp in Recirculating Freshwater Systems; Harbor Branch Oceanographic Institution: Fort Pierce, FL, USA, 1999. [Google Scholar]
  59. Wasielesky, W.; Atwood, H.; Stokes, A.; Browdy, C.L. Effect of Natural Production in a Zero Exchange Suspended Microbial Floc Based Super-Intensive Culture System for White Shrimp Litopenaeus Vannamei. Aquaculture 2006, 258, 396–403. [Google Scholar] [CrossRef] [Scilit]
  60. Lin, Y.-C.; Chen, J.-C. Acute Toxicity of Ammonia on Litopenaeus Vannamei Boone Juveniles at Different Salinity Levels. J. Exp. Mar. Biol. Ecol. 2001, 259, 109–119. [Google Scholar] [CrossRef] [Scilit] [PubMed]
  61. Lin, Y.-C.; Chen, J.-C. Acute Toxicity of Nitrite on Litopenaeus Vannamei (Boone) Juveniles at Different Salinity Levels. Aquaculture 2003, 224, 193–201. [Google Scholar] [CrossRef] [Scilit]
  62. Koops, H. Distribution and Ecophysiology of the Nitrifying Bacteria Emphasizing Cultured Species. FEMS Microbiol. Ecol. 2001, 37, 1–9. [Google Scholar] [CrossRef]
  63. Madigan, M.T.; Martinko, J.M.; Bender, K.S.; Buckley, D.H.; Stahl, D.A.; Brock, T. Microbiologia de Brock, 14th ed.; Artmed: Porto Alegre, Brazil, 2016. [Google Scholar]
  64. Robles-Porchas, G.R.; Gollas-Galván, T.; Martínez-Porchas, M.; Martínez-Cordova, L.R.; Miranda-Baeza, A.; Vargas-Albores, F. The Nitrification Process for Nitrogen Removal in Biofloc System Aquaculture. Rev. Aquac. 2020, 12, 2228–2249. [Google Scholar] [CrossRef] [Scilit]
Figure 1. Thermogravimetric curves of raw materials used to produce the organoclays. (a) Visual aspect of organoclays and raw materials. (b) The red dashed line denotes the end of the stage associated with the loss of surface-adsorbed water. Red arrows denote the onset of thermal degradation. (For interpretation of the references to color in this figure legend, the reader is referred to the Web version of this article).
Fishes 11 00094 g001
Figure 2. Scanning electron micrographs of bentonite (a), chitosan (b), corn starch (c), tapioca starch (d) and organoclays: O1 (e), O2 (f), O3 (g), O4 (h), O5 (i), O6 (j), O7 (k), and O8 (l).
Fishes 11 00094 g002
Figure 3. Scanning electron micrographs of bentonite (a) and organoclays: O1 (b), O2 (c), O3 (d), O4 (e), O5 (f), O6 (g), O7 (h), O8 (i), and O9 (j). Red arrows were automatically generated by the SEM–EDS software, making it impossible to be edited.
Fishes 11 00094 g003
Figure 4. X-ray diffractograms of raw materials (a) and organoclays (b). FTIR spectra of raw materials (c) and organoclays (d). (For interpretation of the references to color in this figure legend, the reader is referred to the Web version of this article).
Fishes 11 00094 g004
Figure 5. Mean variation of: (a) total ammonia nitrogen (TAN); (b) nitrite nitrogen (NO2-N); (c) nitrate nitrogen (NO3-N), for each experimental group (O1, O2, O6, B, and control) over the 37-day period.
Fishes 11 00094 g005
Table 1. Organoclay (O) formulations expressed in mass fraction.
FormulationBentonite (%)Tapioca (%)Corn Starch (%)Chitosan (%)Water (%)
O18.38.40083.3
O28.36.701.783.3
O38.34.204.283.3
O48.31.706.783.3
O58.3008.383.3
O68.308.4083.3
O78.306.71.783.3
O88.304.24.283.3
O98.301.76.783.3
Table 2. Color parameter (L*, a*, and b*), particle size, and surface charge of raw materials and organoclays (O).
Formulation L * a * b * Particle Size (μm)Surface Charge (mV)
Bentonite49.29 ± 0.02 C3.85 ± 0.10 K16.03 ± 0.09 G0.76 ± 0.09 B−28.1 ± 0.4 E
Chitosan61.92 ± 0.02 B0.64 ± 0.05 L15.03 ± 0.04 JN.d.N.d.
Corn starch77.18 ± 0.03 A0.42 ± 0.02 N1.32 ± 0.04 LN.d.N.d.
Tapioca starch77.18 ± 0.03 A0.42 ± 0.02 M1.32 ± 0.04 MN.d.N.d.
O126.53 ± 0.28 K8.60 ± 0.08 H15.13 ± 0.24 I0.80 ± 0.08 B−38.7 ± 1.1 F
O233.34 ± 0.05 J10.15 ± 0.04 F18.48 ± 0.18 D0.95 ± 0.11 AB−24.9 ± 0.7 D
O333.58 ± 0.31 J10.76 ± 0.08 E17.19 ± 0.10 F1.24 ± 0.14 A−16.2 ± 1.1 B
O437.08 ± 0.05 H8.52 ± 0.10 I15.79 ± 0.20 H1.08 ± 0.13 AB−19.3 ± 1.0 C
O542.18 ± 0.05 F7.63 ± 0.05 J10.63 ± 0.09 K1.14 ± 0.30 AB−13.1 ± 0.4 A
O640.41 ± 0.05 G11.93 ± 0.14 C20.93 ± 0.14 C0.82 ± 0.07 AB−24.1 ± 1.3 D
O742.99 ± 0.02 E13.53 ± 0.07 A23.58 ± 0.13 A0.76 ± 0.24 B−16.9 ± 0.9 BC
O844.86 ± 0.06 D13.27 ± 0.07 B22.84 ± 0.05 B0.90 ± 0.07 AB−16.1 ± 0.4 B
O936.12 ± 0.08 I11.62 ± 0.11 D17.66 ± 0.21 E1.18 ± 0.04 AB−14.8 ± 0.6 AB
N.d.: not determined. All values were expressed as means ± standard errors (n = 3). Means in the same column followed by different superscripts are significantly different (p < 0.05).
Table 3. Chemical composition (wt. %) of bentonite and organoclays (O) obtained by Energy Dispersive Spectroscopy.
ElementBentoniteO1O2O3O4O5O6O7O8O9
Na2.1 ± 0.52.0 ± 0.11.8 ± 0.12.7 ± 0.32.9 ± 0.74.3 ± 2.61.9 ± 0.13.1 ± 0.62.5 ± 1.42.8 ± 0.6
Mg1.8 ± 0.12.0 ± 0.11.8 ± 0.11.8 ± 0.21.8 ± 0.21.6 ± 0.11.9 ± 0.12.0 ± 0.11.7 ± 0.21.6 ± 0.3
Al8.7 ± 0.4 a8.6 ± 0.4 a8.7 ± 0.4 a7.6 ± 0.5 ab7.3 ± 0.1 b7.2 ± 0.5 b8.7 ± 0.3 a8.4 ± 0.5 ab7.9 ± 0.5 ab7.8 ± 0.1 b
Si34.3 ± 1.634.5 ± 0.534.6 ± 2.232.1 ± 0.530.8 ± 1.030.4 ± 3.133.4 ± 1.433.1 ± 0.433.0 ± 1.233.9 ± 3.4
K44.0 ± 1.341.4 ± 3.139.3 ± 4.142.2 ± 3.839.8 ± 2.742.4 ± 2.743.4 ± 2.942.8 ± 0.842.9 ± 0.939.3 ± 4.3
PN.i.N.i.N.i.0.3 ± 0.00.4 ± 0.10.4 ± 0.10.4 ± 0.0N.i.0.3 ± 0.00.4 ± 0.1
ClN.i.N.i.0.4 ± 0.00.9 ± 0.22.0 ± 0.53.0 ± 2.71.0 ± 0.00.5 ± 0.01.4 ± 1.11.6 ± 1.3
Ti0.5 ± 0.11.0 ± 0.21.0 ± 0.20.7 ± 0.10.7 ± 0.10.7 ± 0.00.7 ± 0.20.6 ± 0.00.6 ± 0.10.8 ± 0.1
Fe6.4 ± 0.98.5 ± 2.79.2 ± 3.27.9 ± 2.5 8.4 ± 1.85.5 ± 0.77.6 ± 2.56.5 ± 0.27.0 ± 0.98.3 ± 3.5
N.i.: not identified. All values were expressed as means ± standard errors (n = 3). Means in the same row followed by different superscripts are significantly different (p < 0.05). The absence of superscripts indicates no statistical significance.
Table 4. Average values (37 days) of water quality parameters monitored during the nitrification experiment under different substrate treatments.
Water Quality ParametersTreatment
Tapioca (O1)Tapioca + Chitosan (O2)Cornstarch (O6)Bentonite (B)Control (C)
Temperature (°C)27.0 ± 0.9227.2 ± 0.3027.3 ± 0.3927.1 ± 0.5727.2 ± 0.40
Salinity (g L−1)31.7 ± 0.7631.6 ± 0.7531.9 ± 0.8031.6 ± 0.8231.4 ± 0.82
DO (mg L−1)6.70 ± 0.576.64 ± 0.646.55 ± 0.616.58 ± 0.616.50 ± 0.61
pH8.38 ± 0.038.39 ± 0.038.39 ± 0.038.38 ± 0.038.38 ± 0.03
TAN (mg L−1)0.23 ± 0.800.08 ± 0.790.10 ± 0.760.11 ± 1.100.07 ± 1.08
NO2-N (mg L−1)5.49 ± 6.726.74 ± 8.245.58 ± 8.656.11 ± 9.137.35 ± 9.78
NO3-N (mg L−1)3.51 ± 2.38 ab3.90 ± 2.94 ab2.67 ± 3.72 b4.33 ± 4.29 ab7.84 ± 8.42 a
P-PO43− (mg L−1)0.06 ± 0.02 b0.06 ± 0.02 b0.07 ± 0.02 ab0.06 ± 0.02 b0.09 ± 0.01 a
Alkalinity (mg L−1)131.3 ± 7.25130.6 ± 6.67131.3 ± 8.14129.3 ± 7.24130 ± 6.82
TSS (mg L−1)160 ± 25.6158.1 ± 39.3162.3 ± 29.1182.3 ± 46.6167.9 ± 39.6
VSS (%)72.0 ± 9.7869.1 ± 5.5272.1 ± 1.1568.4 ± 3.4672.6 ± 2.55
All values are expressed as means ± standard errors (n = 3). Means in the same row followed by different superscripts are significantly different (p < 0.05). The absence of superscripts indicates no statistical significance. DO: dissolved oxygen; TAN: total ammonia nitrogen; NO2-N: nitrite nitrogen; NO3-N: nitrate nitrogen; P-PO43−: orthophosphate; TSS: total suspended solids; VSS: volatile suspended solids.
Disclaimer/Publisher’s Note: The statements, opinions and data contained in all publications are solely those of the individual author(s) and contributor(s) and not of MDPI and/or the editor(s). MDPI and/or the editor(s) disclaim responsibility for any injury to people or property resulting from any ideas, methods, instructions or products referred to in the content.