1. Introduction
Extreme natural disasters impose abrupt and multidimensional shocks on food production systems by simultaneously damaging physical infrastructure, disrupting biological processes, constraining market access, and tightening financial liquidity [
1,
2,
3,
4]. In biologically rigid and capital-intensive systems, such shocks sharply limit producers’ ability to respond through investment-led technological upgrading. As a result, post-disaster production decisions are dominated by short-term survival concerns, heightened uncertainty, and binding capital constraints rather than long-run optimization behavior [
5,
6].
A large empirical literature has examined productivity and efficiency in agriculture and aquaculture using frontier-based methods such as Data Envelopment Analysis (DEA) and stochastic frontier models [
7,
8]. In aquaculture, efficiency differentials are commonly linked to feed management, stocking density, labor organization, and input quality [
9,
10]. However, the applicability of these findings to post-disaster contexts remains limited, as most studies implicitly assume gradual adjustment processes and stable infrastructural conditions. Large-scale natural disasters disrupt production systems by simultaneously damaging physical assets, constraining liquidity, and increasing uncertainty. Under such conditions, observed productivity changes are more likely to reflect recovery-related adjustment rather than conventional growth dynamics [
8,
11].
In post-disaster environments, observed productivity changes may reflect recovery-related adjustment rather than conventional growth dynamics, particularly when investment decisions are postponed due to irreversibility and heightened uncertainty [
5,
12]. Under such conditions, productivity recovery is more plausibly driven by movements toward the existing production frontier rather than by frontier-shifting technological progress [
13,
14].
These challenges are especially pronounced in inland aquaculture systems, which are characterized by biological rigidity, fixed production cycles, and high working-capital requirements. Feed regimes, water flows, stocking densities, and biological growth processes cannot be rapidly adjusted without jeopardizing fish survival and output [
9,
15]. Consequently, recovery after large exogenous shocks is more likely to depend on the reorganization of existing inputs and operational routines within an unchanged technological frontier than on frontier-shifting innovation.
From a resilience economics perspective, recovery from extreme shocks may occur through absorptive, adaptive, or transformative mechanisms [
16,
17,
18]. Adaptive resilience, which involves reorganization within existing system structures, is particularly relevant in contexts where technological transformation is constrained by uncertainty and capital scarcity [
19,
20,
21,
22]. In this study, adaptive efficiency is not conceptualized as a directly measurable adjustment capability, but rather as an inferred outcome based on observed changes in efficiency scores and production frontier movements following a major shock [
23,
24]. Despite its relevance, adaptive efficiency remains difficult to observe directly and is rarely examined empirically in post-disaster food production systems.
The 6 February 2023 earthquake in Eastern Türkiye provides a natural setting to examine these issues. The earthquake caused widespread damage to inland aquaculture infrastructure, disrupted water and energy supply, increased fish mortality, and impaired transportation networks. Operating costs rose sharply, particularly for feed delivery and market access, while uncertainty regarding reconstruction timelines constrained investment decisions. Despite these challenges, many inland aquaculture enterprises continued operating under severe biological, logistical, and financial constraints.
Specifically, this study addresses the following research questions:
- (i)
whether post-disaster productivity recovery is driven primarily by improvements in technical efficiency rather than technological change;
- (ii)
how access to liquidity shapes adaptive efficiency under post-disaster constraints; and
- (iii)
whether observed efficiency gains reflect adaptive reorganization among surviving farms rather than selection alone.
This study is intentionally designed to capture short- to medium-term post-disaster adjustment dynamics rather than long-run growth dynamics. The two observation points (2023 and 2025) are used to distinguish immediate post-earthquake adjustment from a more stabilized recovery phase [
25], which is the relevant horizon for identifying resilience and adaptive efficiency mechanisms under binding uncertainty and capital constraints.
By reframing liquidity as a resilience enabler rather than a direct productivity input and by explicitly conditioning recovery on firm survival, the study offers a conceptually grounded interpretation of post-disaster efficiency dynamics.
Efficiency change is interpreted as an outcome consistent with adaptive responses under post-disaster constraints, ensuring conceptual clarity and avoiding over-interpretation of frontier-based indicators. Despite a large literature on efficiency and productivity in aquaculture and agriculture, existing studies largely examine performance under stable production environments and long-run technological change. Empirical evidence on post-disaster recovery dynamics remains limited, particularly in biologically rigid aquaculture systems where investment-led technological upgrading is constrained. Moreover, adaptive efficiency is rarely examined explicitly as a recovery mechanism, and liquidity is typically treated as a direct productivity input rather than a resilience enabler. This study fills this gap by examining short- to medium-term post-disaster recovery in inland aquaculture, focusing on adaptive efficiency, frontier stability, and the role of liquidity under extreme constraints. Accordingly, adaptive efficiency is not treated as a directly observable behavior, but is interpreted through observed efficiency change and productivity recovery patterns that are consistent with adaptive responses under post-disaster constraints. The analysis does not causally identify adaptation; rather, it documents efficiency and productivity patterns that are consistent with adaptive behavior under post-earthquake constraints.
2. Materials and Methods
2.1. Study Area and Data Collection
The empirical analysis focuses on inland trout farms located in Elazığ, Malatya, and Kahramanmaraş provinces, which together constitute a major inland aquaculture cluster in Eastern Türkiye. The region offers favorable ecological conditions for cold-water aquaculture, including spring-fed systems, dam reservoirs, and regulated river flows, but was severely affected by the 6 February 2023 earthquake.
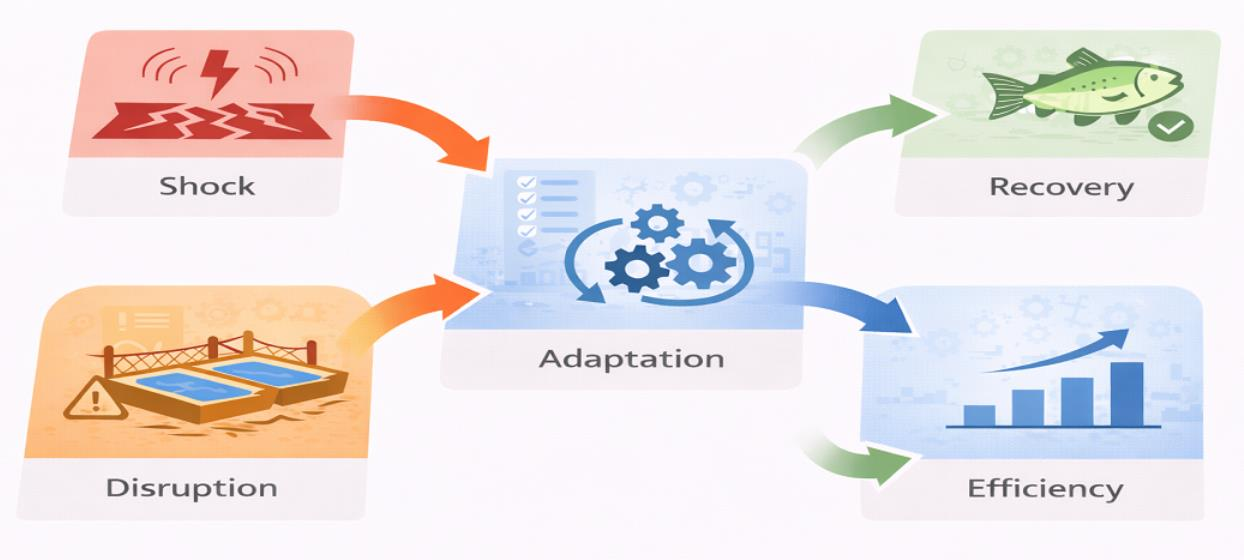
Farm-level data were collected through structured face-to-face surveys conducted in 2025 with 290 inland aquaculture enterprises (174 in Elazığ, 66 in Malatya, and 50 in Kahramanmaraş). To capture post-disaster recovery dynamics, respondents provided retrospective information for two reference periods: 2023, representing the immediate post-earthquake adjustment phase, and 2025, representing a more stabilized recovery phase. The exclusion of 2024 from the analysis is intentional and reflects the study’s focus on distinguishing immediate post-shock adjustment from a more stabilized recovery phase. Field evidence indicated that 2024 constituted a highly transitional year characterized by ongoing reconstruction, incomplete production cycles, elevated mortality, and severe measurement noise, particularly for cost variables. Including 2024 would therefore blur the distinction between short-run adjustment and medium-run recovery and would increase the risk of conflating transitory disruption effects with recovery dynamics. Accordingly, the two-point design (2023–2025) is deliberately chosen to isolate recovery-consistent efficiency and productivity changes rather than to describe a continuous growth trajectory. The temporal structure of the analysis is summarized schematically in
Figure 1 to clarify the distinction between immediate post-shock adjustment and the subsequent recovery phase.
Because part of the 2023 information was collected retrospectively, recall bias and measurement error may arise, particularly for minor expenditures. To mitigate this risk, the survey prioritized record-based variables such as production volumes, feed quantities, and transportation costs, and used anchoring questions linked to the earthquake period and the production cycle. While retrospective data collection may introduce recall bias, production volumes, feed use, stocking quantities, and mortality rates were largely based on farm records rather than recall. Cost-related variables are therefore interpreted cautiously as relative inputs rather than exact accounting measures. Recall bias is likely asymmetric, as production volumes and biological variables are typically recorded or easier to recall, whereas monetary cost items are more fragmented and prone to measurement error. Where available, survey responses were cross-checked with farm records and local administrative documentation to enhance data reliability. These records included feed purchase invoices, farm logbooks, cooperative delivery notes, and other locally available documentation when accessible. Accordingly, the analysis interprets the results as recovery-consistent performance dynamics rather than exact accounting outcomes. Moreover, efficiency change and productivity recovery are derived from relative distance functions rather than from absolute input or output levels. As a result, recall-related measurement noise is unlikely to systematically bias intertemporal comparisons, particularly when the analysis focuses on within-farm changes conditional on survival.
While conditioning on survival may bias absolute efficiency levels upward, intertemporal efficiency change remains informative about within-farm adaptive reorganization among surviving enterprises, yielding a balanced panel dataset. This design allows consistent intertemporal comparison while explicitly conditioning the recovery analysis on firm survival, thereby distinguishing post-disaster performance restoration from initial shock absorption.
2.2. Output and Input Variables
Total fish production (kg) is used as the single output variable in the efficiency and productivity analyses. Inland trout production is characterized by biological rigidity and fixed production cycles, which limit short-run output flexibility. Accordingly, production volume provides an appropriate and comprehensive indicator of farm performance under post-disaster conditions. This specification is consistent with standard aquaculture efficiency studies [
7,
9,
10].
The input set includes feed use (kg), labor input (hours), transportation costs (TRY), veterinary and medication expenses (TRY), water use (m3), juvenile fish stocked (number), and other operating costs (TRY). These variables jointly capture the biological, managerial, financial, and logistical dimensions of inland trout farming and are consistent with input specifications commonly employed in aquaculture efficiency studies.
All monetary variables are expressed in nominal Turkish Lira values corresponding to the respective production years. Price deflation is not applied for two reasons. First, Data Envelopment Analysis (DEA) is conducted separately for each year, and efficiency scores are derived from contemporaneous relative input-output relationships rather than from intertemporal cost comparisons. Second, the Malmquist productivity index relies on distance functions and ratios of efficiency measures, which are invariant to uniform price-level changes across farms within each period. Because DEA is conducted separately for each year and the Malmquist index is based on relative distance functions, uniform inflationary shocks do not affect inter-farm comparability within each period. A full multi-specification sensitivity analysis is beyond the scope of this study; however, a supplementary specification excluding monetary inputs is provided to assess robustness. As a result, inflation does not bias efficiency estimates or productivity change measures, provided that relative price structures across farms remain comparable within each year. This assumption is evaluated empirically through a supplementary specification excluding monetary inputs, which yields qualitatively similar results.
The analysis focuses on within-farm intertemporal comparisons conditional on survival, rather than on absolute cost levels. Consequently, nominal monetary values are sufficient for capturing recovery-consistent performance dynamics, and deflation is not required for valid inference in the DEA-Malmquist framework employed in this study. The dimensionality of the DEA model remains acceptable given the sample size (n = 290), satisfying standard rules of thumb for nonparametric efficiency analysis and mitigating concerns related to over-parameterization.
2.3. Descriptive Statistics
Descriptive statistics for output and input variables are reported in
Table 1. Substantial heterogeneity is observed across farms and provinces in both production scale and input use, satisfying a key requirement for Data Envelopment Analysis [
8]. Average production levels and cost structures reflect uneven recovery trajectories and persistent infrastructure and market-access constraints during the post-disaster period.
Feed use remained relatively stable across periods, suggesting that producers prioritized biological continuity despite post-earthquake disruptions. In contrast, transportation costs increased markedly, reflecting damaged road networks, longer supply routes, and higher fuel expenses. Labor use declined on average, consistent with workforce displacement and labor-saving adjustments commonly observed following natural disasters.
2.4. Measurement of Technical Efficiency
Technical efficiency is estimated using an input-oriented Data Envelopment Analysis (DEA) framework. An input-oriented specification is appropriate in post-disaster environments where producers have limited control over output due to biological rigidity and infrastructural damage, but retain discretion over input allocation.
Under the assumption of constant returns to scale (CRS), the input-oriented DEA model is specified as:
subject to:
where
and
denote the input and output vectors of farm
,
and
represent the matrices of inputs and outputs for all farms,
is a vector of intensity variables, and
is the efficiency score. A value of
indicates full technical efficiency, while
reflects inefficiency.
To allow for variable returns to scale (VRS), the convexity constraint
is added to the model. Comparison of CRS and VRS efficiency scores enables the decomposition of overall technical efficiency into pure technical efficiency and scale efficiency.
2.5. Bias Correction Using Bootstrap DEA
DEA efficiency scores are bias-corrected using the bootstrap procedure proposed by Simar and Wilson [
26,
27]. Productivity change is assessed using the Malmquist Total Factor Productivity index, decomposed into efficiency change (EC) and technological change (TC) components [
13,
14]. This framework allows short-run adaptive movements toward the frontier to be distinguished from frontier shifts associated with technological progress [
28].
Let
denote the original DEA efficiency estimate for farm
. The bias-corrected estimator is given by:
where
denotes the efficiency estimate obtained from the
bootstrap replication, and
is the number of bootstrap iterations. In this study, 2000 bootstrap replications are employed to ensure stable inference.
2.6. Productivity Change and Malmquist Index
Changes in productivity between 2023 and 2025 are assessed using the Malmquist Total Factor Productivity (TFP) index. The Malmquist index measures productivity change between two periods
and
is defined as:
The Malmquist index is decomposed into efficiency change (EC) and technological change (TC) components:
In the post-disaster context, efficiency change is interpreted as an indicator consistent with adaptive reorganization toward the existing production frontier, while technological change captures shift in the frontier itself. Values of TC close to unity are interpreted as frontier stability that may reflect delayed or constrained investment behavior under uncertainty, rather than technological stagnation [
5]. The purpose of the Malmquist analysis in this study is not to capture long-run productivity trends, but to isolate short- to medium-term recovery mechanisms following an extreme shock. The use of two observation points does not aim to capture long-run technological trajectories. Rather, it is intentionally designed to isolate short- to medium-term recovery mechanisms following an extreme shock. In such contexts, the absence of frontier shifts is theoretically consistent with rational investment postponement under uncertainty, rather than with technological stagnation.
2.7. Interpretation of Efficiency Change as Adaptive Efficiency
In this study, adaptive efficiency is not treated as a directly observable behavioral variable. Instead, it is interpreted through observed changes in technical efficiency and productivity that are consistent with adaptive responses under post-disaster constraints. This interpretive approach follows the conceptualization of adaptive efficiency in the institutional and resilience literature, where adaptation is reflected in the reorganization and recombination of existing resources rather than in frontier-shifting technological innovation.
Adaptive efficiency is not treated as a directly observable behavioral variable in this study. Instead, it is inferred through recovery-consistent patterns in efficiency change observed under binding uncertainty, biological rigidity, and capital constraints. This study does not causally identify adaptive behavior. Instead, efficiency change is interpreted as an outcome consistent with adaptive responses under binding post-disaster constraints, rather than as a direct measure of adaptive behavior.
In the post-earthquake context examined here, firms faced binding uncertainty, capital scarcity, biological rigidity, and infrastructure damage, which severely constrained investment-led technological upgrading. Under such conditions, improvements in performance are more plausibly attributed to operational reorganization, scale adjustment, and improved coordination of existing inputs than to technological change. The empirical dominance of efficiency change over technological change in the Malmquist decomposition, combined with the observed stability of the production frontier, provides indirect but systematic evidence consistent with adaptive efficiency-driven recovery.
Importantly, efficiency change is interpreted conditional on firm survival and within-farm intertemporal comparison, thereby reducing the likelihood that observed improvements merely reflect selection effects. While this approach does not identify adaptive behavior at the micro-decision level, it allows for a theoretically grounded interpretation of post-disaster recovery dynamics that is consistent with resilience economics and investment under uncertainty. Accordingly, efficiency change is used as an indicator consistent with adaptive efficiency, rather than as a direct measure of adaptive behavior. Adaptive efficiency, as interpreted in this study, should not be conflated with learning-by-doing or incremental technological improvement. The recovery period examined is too short, and investment conditions too constrained, for systematic learning effects or endogenous innovation to materialize. Instead, adaptive efficiency refers to short-run operational reorganization, coordination of existing inputs, and scale adjustment undertaken under heightened uncertainty and capital constraints. Accordingly, efficiency change is interpreted as a recovery-consistent outcome rather than as evidence of technological learning or innovation.
2.8. Second-Stage Analysis: Adaptive Efficiency and Resilience
To identify factors associated with adaptive efficiency recovery, efficiency change obtained from the Malmquist decomposition is regressed on a composite Resilience Capacity Index (RCI) using the truncated regression approach proposed by Simar and Wilson [
6]. This method accounts for the bounded nature of efficiency measures and corrects for serial correlation between first-stage DEA estimates and second-stage regressors.
The RCI is constructed to proxy farms’ capacity to absorb and adapt to post-disaster constraints rather than to measure direct production inputs or managerial quality. Following resilience economics and farming systems frameworks, resilience capacity is treated as a multidimensional construct combining (i) financial and liquidity capacity, (ii) biological vulnerability, and (iii) logistical and market-access constraints.
Accordingly, access to credit is included as an indicator of short-run liquidity and working-capital availability, which is crucial for maintaining biological continuity (e.g., feed regimes, veterinary interventions, and input coordination) under heightened uncertainty. Mortality rate captures biological vulnerability and irreversible losses that directly constrain adaptive reorganization. Distance to markets reflects spatial and logistical constraints affecting transaction costs, input delivery reliability, and output market access during recovery. The infrastructure damage index proxies the severity of physical constraints that restrict operational flexibility during the recovery process.
All indicators are normalized to the [0, 1] interval prior to aggregation. Equal weighting is adopted to avoid imposing arbitrary dominance across dimensions in the absence of strong theoretical or empirical guidance on relative importance under post-disaster conditions; the index is intended as a transparent summary measure of multidimensional resilience capacity rather than an optimized weighting scheme.
To avoid mechanical correlation and potential endogeneity, the indicators used to construct the RCI are not simultaneously reintroduced as individual control variables in the baseline regression. Instead, we report two complementary specifications: (i) a baseline model using the composite RCI with province fixed effects and theoretically independent macro-level controls, and (ii) an alternative “channels” model in which the composite index is replaced by its individual components to examine heterogeneous mechanisms of influence.
The baseline truncated regression model is specified as:
where
denotes efficiency change for farm
,
is the Resilience Capacity Index,
is a vector of macro-level and spatial controls (e.g., regional damage intensity),
denotes province fixed effects, and
is an error term assumed to follow a truncated normal distribution.
The index aggregates normalized indicators capturing financial, biological, and logistical dimensions of resilience, with higher values indicating greater adaptive capacity. All components of the Resilience Capacity Index are equally weighted due to the absence of strong theoretical or empirical justification for differential weighting in post-disaster contexts. This approach avoids imposing arbitrary dominance among resilience dimensions and is consistent with exploratory resilience measurement frameworks.
Inference is conducted using a bootstrap procedure consistent with the first-stage DEA estimation, ensuring statistically valid standard errors and hypothesis tests.
3. Results
3.1. Technical Efficiency Under Post-Disaster Conditions
Bias-corrected technical efficiency scores obtained under constant returns to scale (CRS) and variable returns to scale (VRS) are reported in
Table 2. Across all provinces, average CRS efficiency increased between the immediate post-earthquake period (2023) and the recovery phase (2025), indicating an overall improvement in farms’ ability to convert inputs into output under post-disaster constraints.
In Elazığ, mean CRS efficiency increased markedly, approaching the production frontier in the recovery phase. VRS efficiency was already high in 2023 and improved further in 2025, suggesting that recovery was driven primarily by improvements in pure technical efficiency rather than by scale adjustment. Scale efficiency remained close to unity in both periods.
In Malatya, CRS efficiency levels were substantially lower than VRS efficiency in both periods, indicating pronounced scale inefficiencies. Between 2023 and 2025, improvements in CRS efficiency were accompanied by gains in scale efficiency, suggesting that recovery involved both managerial reorganization and scale adjustment. VRS efficiency exhibited only modest improvement, remaining consistently high across periods.
In Kahramanmaraş, efficiency gains were more moderate. Both CRS and scale efficiency improved between periods, while VRS efficiency remained relatively stable. This pattern indicates a recovery process characterized by gradual movement toward a more efficient scale of operation rather than significant changes in pure technical efficiency.
Overall, the efficiency results reveal substantial heterogeneity in recovery paths across provinces, reflecting differences in operational constraints, infrastructure conditions, and adjustment capacity following the earthquake.
3.2. Productivity Change and Decomposition
Productivity dynamics between 2023 and 2025 were examined using the Malmquist Total Factor Productivity index. The decomposition of productivity changes into efficiency change (EC) and technological change (TC) is presented in
Table 3.
Across all provinces, total factor productivity increased during the recovery period. However, productivity growth was overwhelmingly driven by efficiency change rather than technological change. Efficiency change exceeded unity in all provinces, indicating systematic improvements in relative performance over time.
Bootstrap-based confidence intervals for EC and TC are sensitive to short time horizons and therefore omitted to avoid spurious inference.
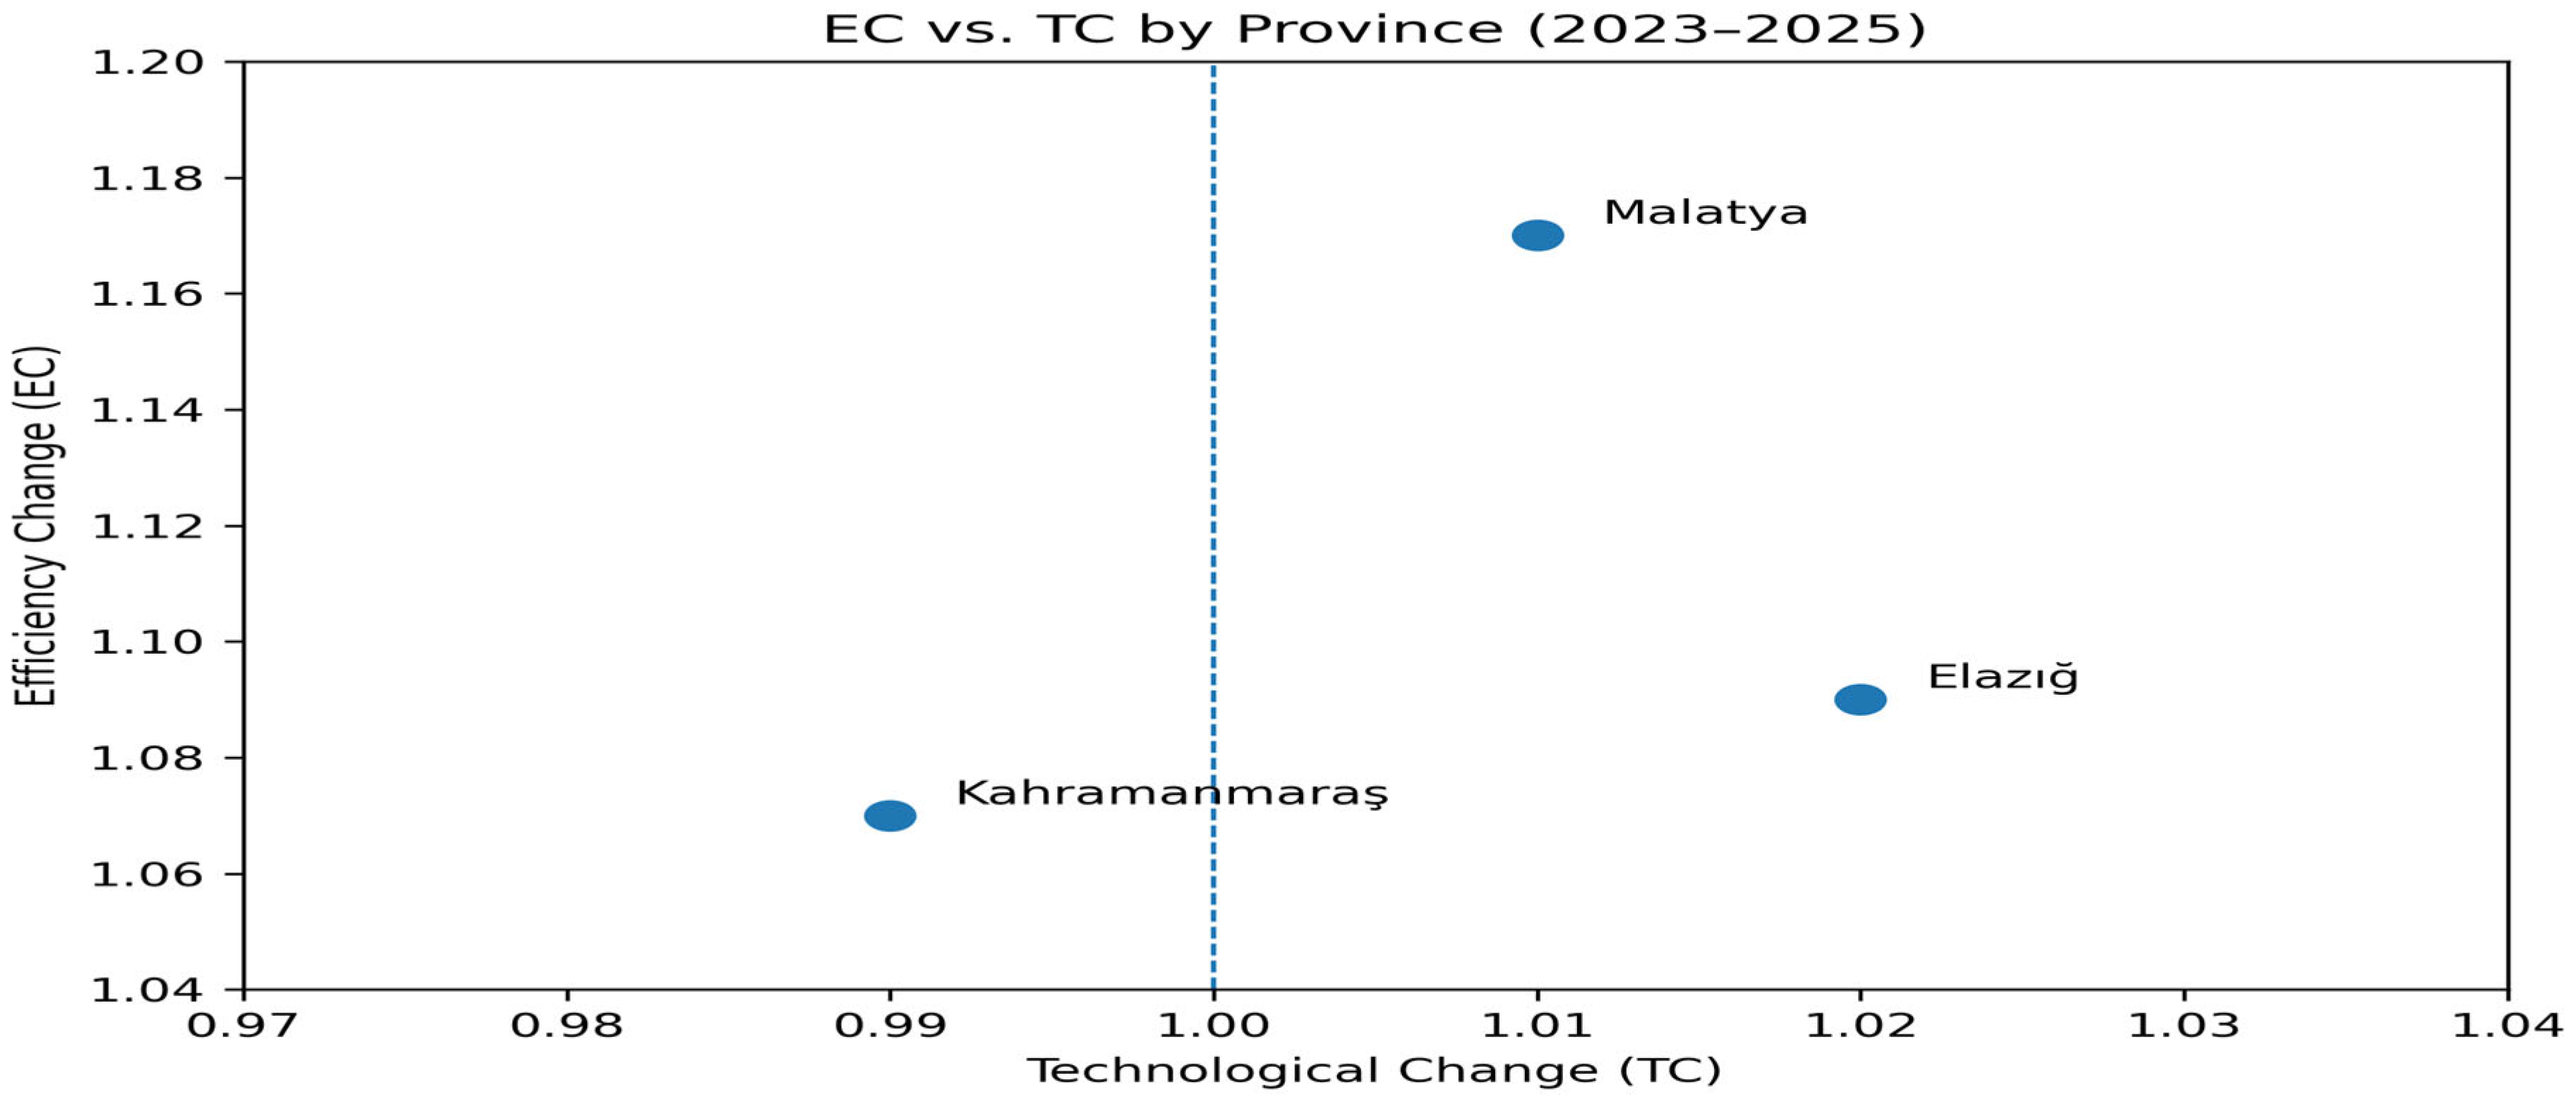
The figure illustrates relative efficiency and frontier patterns between the two observation points and does not represent a continuous or causal recovery path. As visualized in
Figure 1, all provinces exhibit EC > 1, indicating that productivity recovery is predominantly associated with improvements in relative efficiency (catch-up). In contrast, TC values cluster around unity, consistent with short-run frontier stability. However, the possibility that TC ≈ 1 partly reflects the limited sensitivity of DEA-Malmquist indices over a short two-period window cannot be ruled out. The combination of EC-driven recovery and near-unity TC is interpreted descriptively as recovery through operational reorganization under binding constraints, while acknowledging that short observation windows may limit the sensitivity of DEA–Malmquist indices to frontier shifts.
It should be noted that TC values close to unity may partly reflect the limited sensitivity of DEA–Malmquist indices to frontier shifts over short observation windows. Accordingly, TC is interpreted descriptively rather than inferentially, and no formal statistical test of TC ≠ 1 is conducted. This limitation reflects the nonparametric nature of the DEA–Malmquist framework and the short temporal horizon of the analysis. In contrast, technological change values were close to unity across provinces, with only minor deviations. Specifically, technological change indices clustered tightly around unity, indicating that the estimated production frontier did not exhibit statistically meaningful shifts during the post-disaster recovery period. This finding indicates that the production frontier remained largely stable between periods, with no evidence of widespread frontier-shifting technological progress during the recovery phase. In the post-disaster context examined here, frontier stability should be interpreted as rational investment postponement under heightened uncertainty rather than as evidence of technological stagnation.
Elazığ and Malatya exhibited the largest efficiency gains, which translated into higher overall productivity growth. In Kahramanmaraş, productivity growth was more modest and closely aligned with smaller efficiency improvements and near-zero technological change.
These results demonstrate that post-disaster productivity recovery occurred primarily through movements toward the existing production frontier rather than through technological upgrading. Importantly, this interpretation remains unchanged when monetary input variables are excluded from the DEA–Malmquist specification, as shown in the supplementary sensitivity analysis.
3.3. Resilience Capacity and Farm-Level Heterogeneity
Descriptive statistics for the Resilience Capacity Index (RCI) and its components are reported in
Table 4. Considerable heterogeneity is observed across farms in terms of liquidity access, biological risk exposure, and logistical constraints.
The distribution of the RCI indicates that while some farms possessed relatively strong adaptive capacity, a substantial share operated under severe financial, biological, or spatial constraints during the recovery period. This variation provides a basis for examining the relationship between resilience capacity and efficiency recovery in the second-stage analysis.
3.4. Determinants of Adaptive Efficiency Recovery
To address potential endogeneity arising from overlapping measurement, we report two specifications: a baseline model using the composite Resilience Capacity Index (RCI) and an alternative channels model replacing the index with its individual indicators.
Results from the Simar-Wilson truncated regression linking efficiency change to resilience capacity are reported in
Appendix A. The estimated coefficient on the Resilience Capacity Index is positive and statistically significant (
p < 0.10), indicating that farms with higher resilience capacity experienced stronger efficiency recovery during the post-disaster period.
Among the individual components, access to credit is positively but not statistically significantly associated with efficiency change, while higher mortality rates and greater distance to markets are negatively and statistically significantly associated with recovery. These results suggest that liquidity may facilitate adaptive reorganization, whereas biological losses and logistical constraints robustly hinder efficiency recovery.
Province fixed effects remain significant, suggesting that unobserved regional characteristics-such as infrastructure quality and market integration-also influence recovery outcomes.
3.5. Summary of Key Empirical Findings
Three main empirical findings emerge from the results. First, technical efficiency improved across all provinces during the recovery phase, although the sources of improvement differed by region. Second, productivity recovery was driven almost entirely by efficiency change, with negligible technological change, indicating frontier stability. Third, efficiency recovery is systematically associated with farm-level resilience capacity, particularly biological risk management and logistical conditions, with liquidity playing a suggestive enabling role.
These findings provide a coherent empirical basis for interpreting post-disaster recovery as an adaptive process occurring largely within existing technological constraints. The implications of these results are discussed in the following section.
4. Discussion
The dominance of efficiency change over technological change is consistent with the concept of adaptive efficiency, which emphasizes adjustment within existing institutional and technological constraints rather than innovation-driven growth [
23,
24]. Similar interpretations have been emphasized in resilience and regional recovery studies, where short- to medium-term recovery is governed primarily by reorganization and coordination rather than technological upgrading [
19,
20,
21,
22].
In aquaculture systems, biological rigidity and risk exposure further reinforce this pattern. Liquidity enables continuity in feed regimes, veterinary services, and operational coordination, thereby supporting adaptive reorganization under extreme constraints [
15,
29,
30]. The absence of frontier-shifting technological change can be interpreted as consistent with rational investment postponement under uncertainty, among other plausible explanations [
5,
12].
4.1. Adaptive Efficiency as the Dominant Recovery Mechanism
The predominance of efficiency change over technological change in the Malmquist decomposition indicates that farms restored performance mainly by moving closer to the existing production frontier. An alternative interpretation of technological change (TC) values close to unity is that the DEA-Malmquist framework may exhibit limited sensitivity to frontier shifts over short observation windows. This methodological possibility cannot be ruled out, particularly in contexts with only two temporal observations. However, in the post-disaster environment examined here-characterized by heightened uncertainty, irreversible investment decisions, biological rigidity, and capital constraints-frontier stability is also consistent with rational investment postponement rather than technological stagnation. The interpretation adopted in this study therefore reflects a context-dependent reading of frontier dynamics rather than a definitive claim about technological behavior. Formal statistical tests assessing whether TC differs significantly from unity are limited in nonparametric frontier settings; accordingly, TC values are interpreted descriptively rather than inferentially in this study. Given the short observation window and the study’s focus on recovery-consistent patterns, additional formal testing would not meaningfully improve inference. Notably, other recent DEA-based evidence in freshwater aquaculture finds that extreme events can coincide with measurable declines in technical progress, suggesting that TC ≈ 1 should be interpreted cautiously and contextually rather than as a universal post-shock pattern [
31]. These studies typically examine longer horizons or systems with greater scope for capital renewal, whereas the present analysis focuses on short-run adjustment in a biologically rigid production context. Importantly, the interpretation of efficiency change as adaptive efficiency is grounded in the temporal proximity to the earthquake, the presence of binding uncertainty, and the irreversibility of investment decisions, which jointly limit learning-by-doing or discretionary technological upgrading during the recovery period. From a theoretical perspective, this pattern is consistent with the concept of adaptive efficiency, which emphasizes reorganization and recombination of existing resources under changing constraints rather than innovation-driven frontier shifts [
23,
24]. In post-disaster environments characterized by heightened uncertainty and capital scarcity, such adaptive responses are often economically rational. In biologically rigid aquaculture systems, adaptive efficiency is closely linked to the continuity of biological processes. Liquidity and operational coordination allow producers to maintain feed regimes, water quality, and veterinary interventions, thereby preventing biological discontinuities that would otherwise amplify productivity losses.
This finding aligns with resilience theory, which distinguishes adaptive resilience from transformative resilience [
16,
17]. The results suggest that adaptive resilience dominated the recovery process in inland aquaculture, as farms adjusted operational routines, input coordination, and scale of operation within unchanged technological constraints. The absence of substantial technological change should therefore not be interpreted as stagnation, but as evidence of rational investment postponement under uncertainty [
5]. This interpretation suggests caution in overemphasizing innovation-centric recovery strategies in the short to medium term, particularly under conditions of heightened uncertainty, biological rigidity, and binding capital constraints. This implication is suggestive rather than causal and does not rely on counterfactual policy evidence.
4.2. Positioning Within the Empirical Literature
The results complement and extend previous efficiency and productivity studies in aquaculture, which typically emphasize long-run technological progress under stable conditions [
7,
9,
10]. While these studies document substantial heterogeneity in farm performance, they provide limited insight into recovery dynamics following extreme shocks. By focusing explicitly on a post-disaster context, this study demonstrates that productivity recovery can occur in the absence of frontier-shifting technological change.
The findings are also consistent with evidence from disaster and development economics, which shows that recovery is often constrained by liquidity shortages, infrastructure damage, and heightened risk rather than by lack of technical knowledge [
11,
32]. In this study, the coefficient on access to credit is positive but not statistically significant, and should therefore be interpreted as suggestive rather than conclusive. This pattern is consistent with the view that liquidity may function as a resilience enabler by supporting biological continuity and operational coordination, rather than as a direct driver of productivity. This distinction is critical, as it reframes financial access as a mechanism that allows producers to maintain biological continuity and avoid inefficient input disruptions.
At the same time, the negative association between efficiency recovery and mortality rates underscores the biological constraints inherent in aquaculture systems. Elevated mortality directly undermines the scope for adaptive reorganization by reducing effective output and increasing operational risk. Similarly, greater distance to markets limits recovery by increasing transportation costs and logistical uncertainty, reinforcing the importance of spatial connectivity in post-disaster food systems.
4.3. Conditional Recovery and Survivorship
An important feature of the analysis is that recovery is examined conditional on firm survival. While survivorship may bias absolute efficiency levels upward, the consistent dominance of efficiency change across provinces suggests that adaptive reorganization played a substantive role beyond simple selection effects. The analysis does not aim to describe sector-wide average performance, but rather to identify recovery dynamics conditional on survival. While absolute efficiency levels may be upward biased, intertemporal efficiency change remains informative about within-farm adaptive adjustment among surviving enterprises. This distinction is often overlooked in post-disaster efficiency studies, which tend to conflate survival with recovery.
By explicitly conditioning on survival, the study isolates performance restoration as a distinct stage of the resilience process. This perspective is consistent with recent resilience frameworks that conceptualize recovery as a multi-stage process, in which surviving enterprises face new constraints that require adaptive responses rather than mere persistence [
17]. Importantly, the dominance of efficiency change in the Malmquist decomposition indicates that observed recovery reflects within-farm adaptive reorganization over time, rather than being driven solely by between-farm selection effects. While absolute efficiency levels may be upward biased, intertemporal efficiency change remains informative about within-farm adjustment.
4.4. Policy Implications for Post-Disaster Aquaculture Recovery
The findings have clear implications for post-disaster policy design in aquaculture and other biologically constrained food systems. First, recovery strategies that focus exclusively on technological upgrading or physical reconstruction may overlook the mechanisms that actually drive short- to medium-term recovery. When uncertainty and capital constraints are binding, adaptive efficiency supported by liquidity, biological risk management, and logistical access becomes more critical than innovation. Innovation-oriented recovery policies may be ineffective or even counterproductive in the short to medium term when uncertainty, biological rigidity, and liquidity constraints dominate production decisions.
Second, liquidity support mechanisms-such as emergency credit, working-capital grants, or deferred repayment schemes-can play a central role in enabling adaptive reorganization. By allowing producers to maintain feed quality, veterinary services, and input continuity, such measures indirectly support efficiency recovery without requiring immediate technological change. Premature technology-push recovery policies may crowd out adaptive recovery mechanisms by diverting scarce financial resources away from operational continuity and biological risk management [
33].
Third, policies aimed at reducing biological losses and logistical bottlenecks are likely to yield substantial recovery benefits. Disease management support, mortality risk mitigation, and targeted investments in transportation infrastructure can enhance the effectiveness of adaptive responses and accelerate recovery trajectories.
Finally, the results suggest that resilience-oriented policies should be explicitly time-sensitive. In the short to medium term, supporting adaptive efficiency may be more effective than promoting technological transformation. Over longer horizons, however, the transition from adaptive to transformative resilience may become necessary to enhance long-term robustness. The results are specific to biologically rigid inland trout farming systems operating under severe post-disaster constraints and should not be directly generalized to other aquaculture or agricultural production systems. These policy implications should be interpreted as context-specific rather than universally applicable. The findings are derived from biologically rigid inland trout farming systems operating under extreme post-disaster constraints and do not imply that technological innovation is unimportant in other aquaculture systems or over longer recovery horizons.
4.5. Interpretation Boundaries
As with most frontier-based analyses, the study does not directly observe adaptive behavior at the farm level. Instead, changes in efficiency are interpreted as outcomes consistent with adaptive responses under post-disaster constraints. While this interpretation is theoretically grounded and empirically supported by the regression results, caution is warranted in attributing causality.
Accordingly, the results should be interpreted as evidence on recovery-consistent performance dynamics rather than as direct identification of adaptive behavior. Future research combining efficiency analysis with qualitative evidence, experimental designs, or longer recovery horizons could further illuminate the micro-level processes underlying adaptive efficiency and resilience in aquaculture systems. More generally, the DEA-Malmquist framework provides a relative, nonparametric assessment of efficiency and productivity change, and its results are sensitive to sample composition, time horizon, and input-output specification. In post-disaster contexts, where production conditions are unstable and adjustment processes are non-linear, frontier-based measures should be interpreted with particular caution. Accordingly, the findings of this study are best understood as documenting recovery-consistent performance patterns rather than precise estimates of technological progress or behavioral adaptation.
5. Conclusions
This study examined post-disaster recovery mechanisms in inland aquaculture by analyzing efficiency and productivity dynamics following the 2023 earthquake in Eastern Türkiye. Using bias-corrected efficiency analysis, productivity decomposition, and resilience-oriented regression, the study provides evidence on how biologically rigid and capital-constrained food production systems restore performance under extreme shocks. It is important to distinguish clearly between the empirical findings of the study and the normative policy implications discussed above. The policy discussion is intended to illustrate how the documented recovery-consistent efficiency patterns may inform post-disaster support design, rather than to prescribe a universally optimal recovery strategy.
The results show that short- to medium-term productivity recovery was driven primarily by improvements in technical efficiency rather than by technological change. Farms moved closer to the existing production frontier through operational reorganization and scale adjustment, while the frontier itself remained largely stable. This pattern indicates that recovery occurred mainly through adaptive responses within existing technological constraints, rather than through investment-led innovation.
By linking efficiency recovery to resilience-related factors, the study demonstrates that adaptive efficiency constitutes a central recovery mechanism in post-disaster aquaculture systems. Access to liquidity emerged as a key resilience enabler in a suggestive sense, facilitating continuity in biological processes and input use under post-disaster constraints. These findings underscore the importance of financial, biological, and logistical conditions in shaping post-disaster adjustment paths.
The analysis further contributes by framing recovery as conditional on firm survival, thereby distinguishing performance restoration from initial shock absorption. This perspective clarifies that observed efficiency gains among surviving farms reflect adaptive reorganization rather than selection alone.
From a policy perspective, the findings suggest that effective post-disaster recovery strategies in aquaculture should extend beyond physical reconstruction and technological upgrading. These policy considerations are illustrative and derive from the documented empirical patterns rather than from causal policy evaluation. In the short to medium term, policies that enhance adaptive efficiency-such as liquidity support, mortality risk management, and targeted measures to alleviate logistical constraints-are likely to be more effective in accelerating recovery. Over longer horizons, these adaptive mechanisms may provide the foundation for subsequent technological transformation and improved system robustness.
While the empirical analysis focuses on inland trout aquaculture in Eastern Türkiye, the recovery mechanisms identified in this study are likely to be relevant for other biologically rigid and capital-intensive aquaculture systems exposed to extreme shocks. Future research could extend this framework by examining longer recovery periods, integrating environmental performance indicators, and comparing adaptive and transformative resilience pathways across different institutional and ecological settings. The results are specific to biologically rigid inland trout farming systems operating under severe post-disaster constraints and should not be directly generalized to other aquaculture or agricultural production systems with different biological, technological, or institutional characteristics.