Article

Expression Profiles of Growth-Related Genes in CRISPR/Cas9-Mediated MRF4-Crispant Nile Tilapia

1
Department of Fisheries Science, Chonnam National University, Yeosu 59626, Republic of Korea
2
Division of Marine Bioscience, National Korea Maritime and Ocean University, Busan 49112, Republic of Korea
*
Author to whom correspondence should be addressed.
Fishes 2026, 11(1), 52; https://doi.org/10.3390/fishes11010052
Submission received: 19 December 2025 / Revised: 11 January 2026 / Accepted: 12 January 2026 / Published: 14 January 2026
(This article belongs to the Special Issue Genetics and Breeding of Fishes)

Abstract

Genome editing of late myogenic regulators provides a way to dissect the mechanisms through which transcriptional programs and growth-related signaling pathways shape muscle gene expression programs in farmed fish. This study disrupted myogenic regulatory factor 4 (MRF4) in Nile tilapia using CRISPR/Cas9 to examine downstream transcriptional changes in fast skeletal muscle across the trunk, belly, and head regions. Adult F0 crispants carried a frameshift mutation that truncated the basic helix–loop–helix domain and showed an approximate 80–85% reduction in MRF4 mRNA across the trunk, belly, and head muscles. The expression of 23 genes representing myogenic regulatory factors, MEF2 paralogs, structural and contractile components, non-myotomal regulators, cell adhesion and fusion-related transcripts, and growth-related genes within the GH–IGF–MSTN axis was quantified and compared between wild-type and MRF4-crispants. Expressions of major structural genes remained unchanged despite MRF4 depletion, whereas MyoG and MyoD were upregulated together with MEF2B and MEF2D, indicating strong transcriptional compensation. Twist1, ID1, PLAU, CDH15, CHRNG, NCAM1, MYMK, GHR, and FGF6 were also significantly elevated, while IGF1 was reduced, and MSTN remained stable. Together, these results show that MRF4 loss is associated with coordinated transcriptional changes in regulatory and growth-related pathways, while major fast-muscle structural and contractile transcript levels remain stable, thereby highlighting candidate transcriptional targets for future studies that will evaluate links to muscle phenotype and growth performance in Nile tilapia.
Key Contribution: This study demonstrates that CRISPR/Cas9-mediated loss of MRF4 in Nile tilapia is associated with coordinated transcriptional compensation, including altered mRNA expression of MyoG, MEF2B, MEF2D, multiple cell adhesion and fusion-related transcripts, and growth-related signaling genes (GHR, FGF6, and IGF1) in muscle. In contrast, the steady-state expression of major fast-muscle structural and contractile transcripts remained largely unchanged, consistent with preservation of a fast-muscle transcriptional identity. These findings identify specific transcriptional targets that may be prioritized for future studies of muscle growth in an important aquaculture species.

1. Introduction

Nile tilapia (Oreochromis niloticus) is one of the most widely farmed freshwater fish worldwide and is a cornerstone species for food security, particularly in low- and middle-income countries. Meanwhile, global tilapia production has expanded rapidly over the last two decades and now exceeds several million tons per year, with Nile tilapia accounting for the dominant share of farmed tilapia [1,2]. However, since skeletal muscle constitutes the main edible portion of the fish, understanding the genetic and growth-regulatory pathways that regulate myogenesis and muscle growth is relevant to aquaculture traits such as fillet yield, growth rate, and feed efficiency. Teleost skeletal muscle exhibits a high degree of plasticity and continues to grow throughout much of the life cycle through a combination of fiber hypertrophy and recruitment of new fibers supported by satellite cells [3,4,5]. This prolonged post-larval myogenesis provides a useful framework for investigating how transcriptional networks and growth-factor signaling pathways are regulated in teleost muscles.
Myogenic regulatory factors (MRFs) and myocyte enhancer factors (MEF2s) form the core transcriptional machinery that drives skeletal muscle lineage specification, differentiation, and maintenance. The MRF family, which includes MyoD, Myf5 (MRF5), myogenin (MyoG), and MRF4, consists of basic helix–loop–helix (bHLH) transcription factors that bind E-box elements and activate muscle-specific genes [6,7,8]. MyoD and MRF5 are primarily involved in myogenic determination, whereas MyoG and MRF4 act later during terminal differentiation and the postnatal maturation of muscle fibers [7,9,10,11]. Studies in mice have shown that these factors have partially redundant functions, since the loss of one MRF can be compensated for by the activity of others, including upregulation of MyoG and MyoD in MRF4-null backgrounds, and overlapping requirements for MyoG and MRF4 during late myogenesis [9,10,12,13,14,15]. MEF2 transcription factors (MEF2A, MEF2B, MEF2C, and MEF2D) cooperate with MRFs to activate large batteries of structural, metabolic, and excitation–contraction coupling genes, as well as key regulators of both embryonic myogenesis and adult muscle plasticity [8,16,17]. In rodent muscles, MRF4 knockout induces hypertrophy and broad activation of MEF2 target genes, establishing MRF4 as a negative regulator of MEF2 activity and highlighting the importance of MRF4-MEF2 cross-talk in controlling muscle growth [8,15].
Compared with mammals, the role of individual MRFs and MEF2 isoforms in teleost muscles are less well characterized, despite the economic importance of farmed fish. Teleost genomes have undergone an additional round of whole genome duplication and subsequent gene retention, which may have diversified the functions and regulatory interactions of myogenic transcription factors [5,18]. Recent work on Nile tilapia has begun to address this gap by cloning MRF4, analyzing the associated spatiotemporal expression, and generating CRISPR/Cas9-mediated MRF4-crispant fish that exhibit strongly reduced MRF4 transcription in adult skeletal muscle [14]. That prior work strongly suggests that MyoG and specific MEF2 paralogs can compensate for MRF4 loss at the transcriptional level; however, a systematic analysis of the downstream structural genes, non-myotomal regulators, and endocrine growth pathways in different axial muscle regions has not been undertaken.
Muscle growth in fish is also tightly regulated by endocrine and paracrine factors, most notably through the growth hormone–insulin-like growth factor (GH–IGF) axis, fibroblast growth factors (FGFs), and myostatin (MSTN). The GH–IGF system is the principal driver of post-larval muscle growth in teleosts, modulating both fiber hypertrophy and hyperplasia through endocrine GH and locally produced IGF1 [19,20]. FGF6 is expressed in developing and regenerating muscles and contributes to myotome patterning in MRF4-null mice [21]. MSTN, a TGF-β family member, acts as a negative regulator of skeletal muscle mass in many vertebrates; meanwhile, the disruption of MSTN in several fish species by CRISPR/Cas9 altered the body composition and promoted increased muscle growth [22,23,24,25,26]. In addition, myoblast fusion and muscle remodeling depend on cell adhesion and neuromuscular junction components such as M-cadherin (CDH15), neural cell adhesion molecule (NCAM), and the fetal acetylcholine receptor gamma subunit (CHRNG), as well as the muscle-specific fusogen myomaker (MYMK) [27,28,29,30,31]. Regulatory factors such as Twist1, ID1, Pax1, and urokinase-type plasminogen activator (PLAU) further influence the balance between mesenchymal plasticity, extracellular matrix remodeling, and commitment to the myogenic program [32,33,34,35,36].
The present study used MRF4-crispant Nile tilapia generated by CRISPR/Cas9 editing to dissect how the loss of this late myogenic regulator reshapes transcriptional networks and growth-related pathways in adult fast skeletal muscle. Building on our previous characterization of MRF4 mutations [14], we aimed to quantify the expression of 23 genes grouped into functional categories that include MRFs, MEF2 paralogs, structural and contractile proteins, non-myotomal regulators, cell adhesion and fusion molecules, and components of the GH–IGF–MSTN axis across trunk, belly, and head muscles. By integrating these gene expression profiles across distinct axial regions and functional gene modules, this work intends to clarify the mechanisms through which MRF4 interacts with MEF2 factors and growth-related signaling transcripts to shape axial muscle gene expression in a major aquaculture species and to identify the regulatory candidates that may be prioritized for future validation toward genetic improvements of production traits.

2. Materials and Methods

2.1. Maintenance and Breeding of Nile Tilapia

Reproductively mature Nile tilapia were collected from Docheon Tilapia & Aquaculture Farm, Changnyeong-gun, Republic of Korea. The broodstock consisted of both male and female Nile tilapia with an average body weight of 402 ± 2.30 g and standard length of 27.84 ± 1.89 cm. Fish were reared in a semi-closed recirculating system of the Tilapia rearing facility in the Laboratory of Molecular Physiology, Chonnam National University, Yeosu, South Korea. The water temperature was maintained at 26 °C with a 14:10 light:dark cycle, and tilapia pellets were administered as feed. Breeding and embryo collection were performed according to the previously described protocol [37]. After fertilization, one-cell embryos were collected to generate the MRF4-crispants.

2.2. Generation of MRF4-Crispants

2.2.1. Preparation of Single-Guide RNA and Cas9 Protein

Single-guide RNA (sgRNA: CACGATAATGTCCCGTCCGGTGG) was designed from exon 1 in the genomic sequence of Nile tilapia MRF4 (NM_001282891) using the CRISPRscan online tool (https://www.crisprscan.org/; accessed on 6 June 2023). The sgRNA was synthesized using the AccuToolTM gRNA Synthesis service at Bioneer (Yuseong-gu, Daejeon, Republic of Korea). The Cas9 protein was purchased from Bioneer (Yuseong-gu, Daejeon, Republic of Korea).

2.2.2. Microinjection of RNP Complex and Rearing and Maintenance of Embryos

The Ribonucleoprotein (RNP) complex was prepared in a 300 μL tube with a final concentration of 250 ng/μL sgRNA and 500 ng/μL Cas9 protein. The RNP complex was incubated at 37 °C for 10 min. Nile tilapia embryos were then microinjected with the RNP complex using a microinjection device (WPI, Sarasota, FL, USA). Embryos were incubated in a glass incubator with continuous aeration. After hatching, the Nile tilapia larvae were transferred to the aquarium, and after reaching the post-larval stage, they were moved to a 400 L tank and reared until adulthood. A set of untreated embryos was maintained separately as a wild-type (WT) control.

2.2.3. Mutation Analysis

Fin samples from adult Nile tilapia were collected from both groups (crispant and WT). Genomic DNA was extracted using the AccuPrep Genomic DNA Extraction kit (Bioneer, Yuseong-gu, Daejeon, Republic of Korea). A 402 bp region containing the gRNA target site was amplified using gene-specific primers (MRF4_Fw: TTGCGCTATCTGGAGGAAGC and MRF4_Rv: CTCCTGCAGCCTCTCTATGT) and Phusion® High-Fidelity DNA Polymerase kit (New England Biolabs Inc., Ipswich, MA, USA). For the mutation analysis, the amplified fragments were ligated into the pTOP blunt vector, transformed into DH5α competent cells, and sequenced by Macrogen (Geumcheon-gu, Seoul, Republic of Korea). These mutation results have been reported previously [14].

2.3. Growth-Related Gene Expression Analysis

2.3.1. Tissue Collection, Total RNA Extraction and cDNA Synthesis

Skeletal trunk muscle, belly (ventral abdominal musculature/region) muscle, and head (cephalic/cranial musculature) muscle, as well as gonad tissue, were collected from WT and MRF4-crispant Nile tilapia (n = 5 per group; mixed sex; 6 months post-hatch; average body weight 223 ± 2.27 g and standard length 21.89 ± 2.04 cm). Each sample was processed independently and treated as biological replicate. Gonad tissue was collected to generate the calibrator sample used for 2–ΔΔCT analysis (Section 2.3.4). WT controls were non-injected, age-matched siblings from the same spawning batch as the microinjected embryos and were reared under identical conditions; tissues were collected at 6 months post-hatch for gene expression analysis. The samples were immediately frozen in liquid nitrogen and stored in –80 °C. Total RNA was extracted using the ISOSPIN Cell & Tissue RNA kit (Nippon Gene, Tokyo, Japan), and first-strand cDNA was synthesized using the Superscript III First-strand cDNA Synthesis kit (Invitrogen, Carlsbad, CA, USA) according to the manufacturer’s instructions.

2.3.2. Selection and Classification of Growth-Related Genes

A total of 23 growth-related genes in Nile tilapia were retrieved from the NCBI nucleotide database (https://www.ncbi.nlm.nih.gov/nuccore/?term=txid8128[Organism:noexp]; accessed on 11 June 2025). These genes were subsequently categorized by biological functions, as summarized in Table 1.

2.3.3. Primer Design from Nile Tilapia Growth-Related Genes

Gene-specific forward and reverse primers were designed to target the functional domains of each gene and were verified using the Oligonucleotide Properties Calculator (https://oligocalc.eu/; accessed on 12 June 2025). The primer details are summarized in Table 2.

2.3.4. qRT-PCR Analysis

The relative levels of different growth-related genes in MRF4-crispants and WT Nile tilapia were quantified by quantitative real-time PCR (qRT-PCR). Reactions were performed using the 2× qPCRBIO SyGreen Mix Lo-Rox (PCR Biosystems Ltd., London, UK) on a LightCycler® 96 platform (Roche, Mannheim, Germany), following previously established procedures [38]. Each 20 μL reaction mixture contained 10 μL of SyGreen master mix, 1 μL each of the forward and reverse primers at a final concentration of 0.5 μM each, 1 μL of cDNA template, and 7 μL of nuclease-free water. The amplification protocol consisted of an initial denaturation at 95 °C for 3 min, followed by 40 cycles of 95 °C for 15 s, 60 °C for 20 s, and 72 °C for 15 s. Fluorescence data were processed using the LightCycler® 96 software package. Relative expression values were calculated using the 2–ΔΔCT method, with EF1a gene expression as the internal control. Ct values were normalized to the EF1a to obtain ΔCT. ΔΔCT values were calculated using a pooled WT gonad cDNA sample (set to 1) for each gene, and relative expression in each muscle region was computed as 2–ΔΔCT. The gonad calibrator was used as a consistent non-myotomal reference point to compare relative transcript abundance across sampled muscle regions.

2.4. Statistical Analysis

All quantitative mRNA expression data are presented as the mean ± standard error of the mean (SEM). For each tissue or muscle region, differences in relative expression between WT and MRF4-crispant Nile tilapia were evaluated using two-tailed Welch’s t-test (unequal variances). To account for multiple comparisons, raw p-values were adjusted using the Benjamini–Hochberg false discovery rate (FDR) procedure, and FDR-adjusted q-values are reported. Statistical analyses and graph generation were conducted using GraphPad Prism software version 9.1.1 (GraphPad software, San Diego, CA, USA). Statistical significance is denoted on graphs as q < 0.05 (*), q < 0.01 (**), q < 0.001 (***) and q < 0.0001 (****), while “ns” indicates not significant after FDR correction. Raw p-values and FDR-adjusted q-values for all comparisons are provided in Supplementary Table S1.

3. Results

3.1. Generation of Nile Tilapia MRF4-Crispants

Mutation analysis of the targeted MRF4 locus confirmed that microinjection of embryos with the Cas9-sgRNA complex generated two types of edits, as described in detail in our previous manuscript [14]. One allele carried a deletion of 15 bp in-frame deletion that removed five amino acids from the encoded protein within a conserved domain region of MRF4 protein; meanwhile, the other contained a single-nucleotide deletion that caused a frameshift and introduced a premature stop codon, which is predicted to truncate the protein and disrupt the conserved bHLH region [14].

3.2. Expression Profiles of Myogenic Regulatory Factors (MRFs) in WT and Crispants

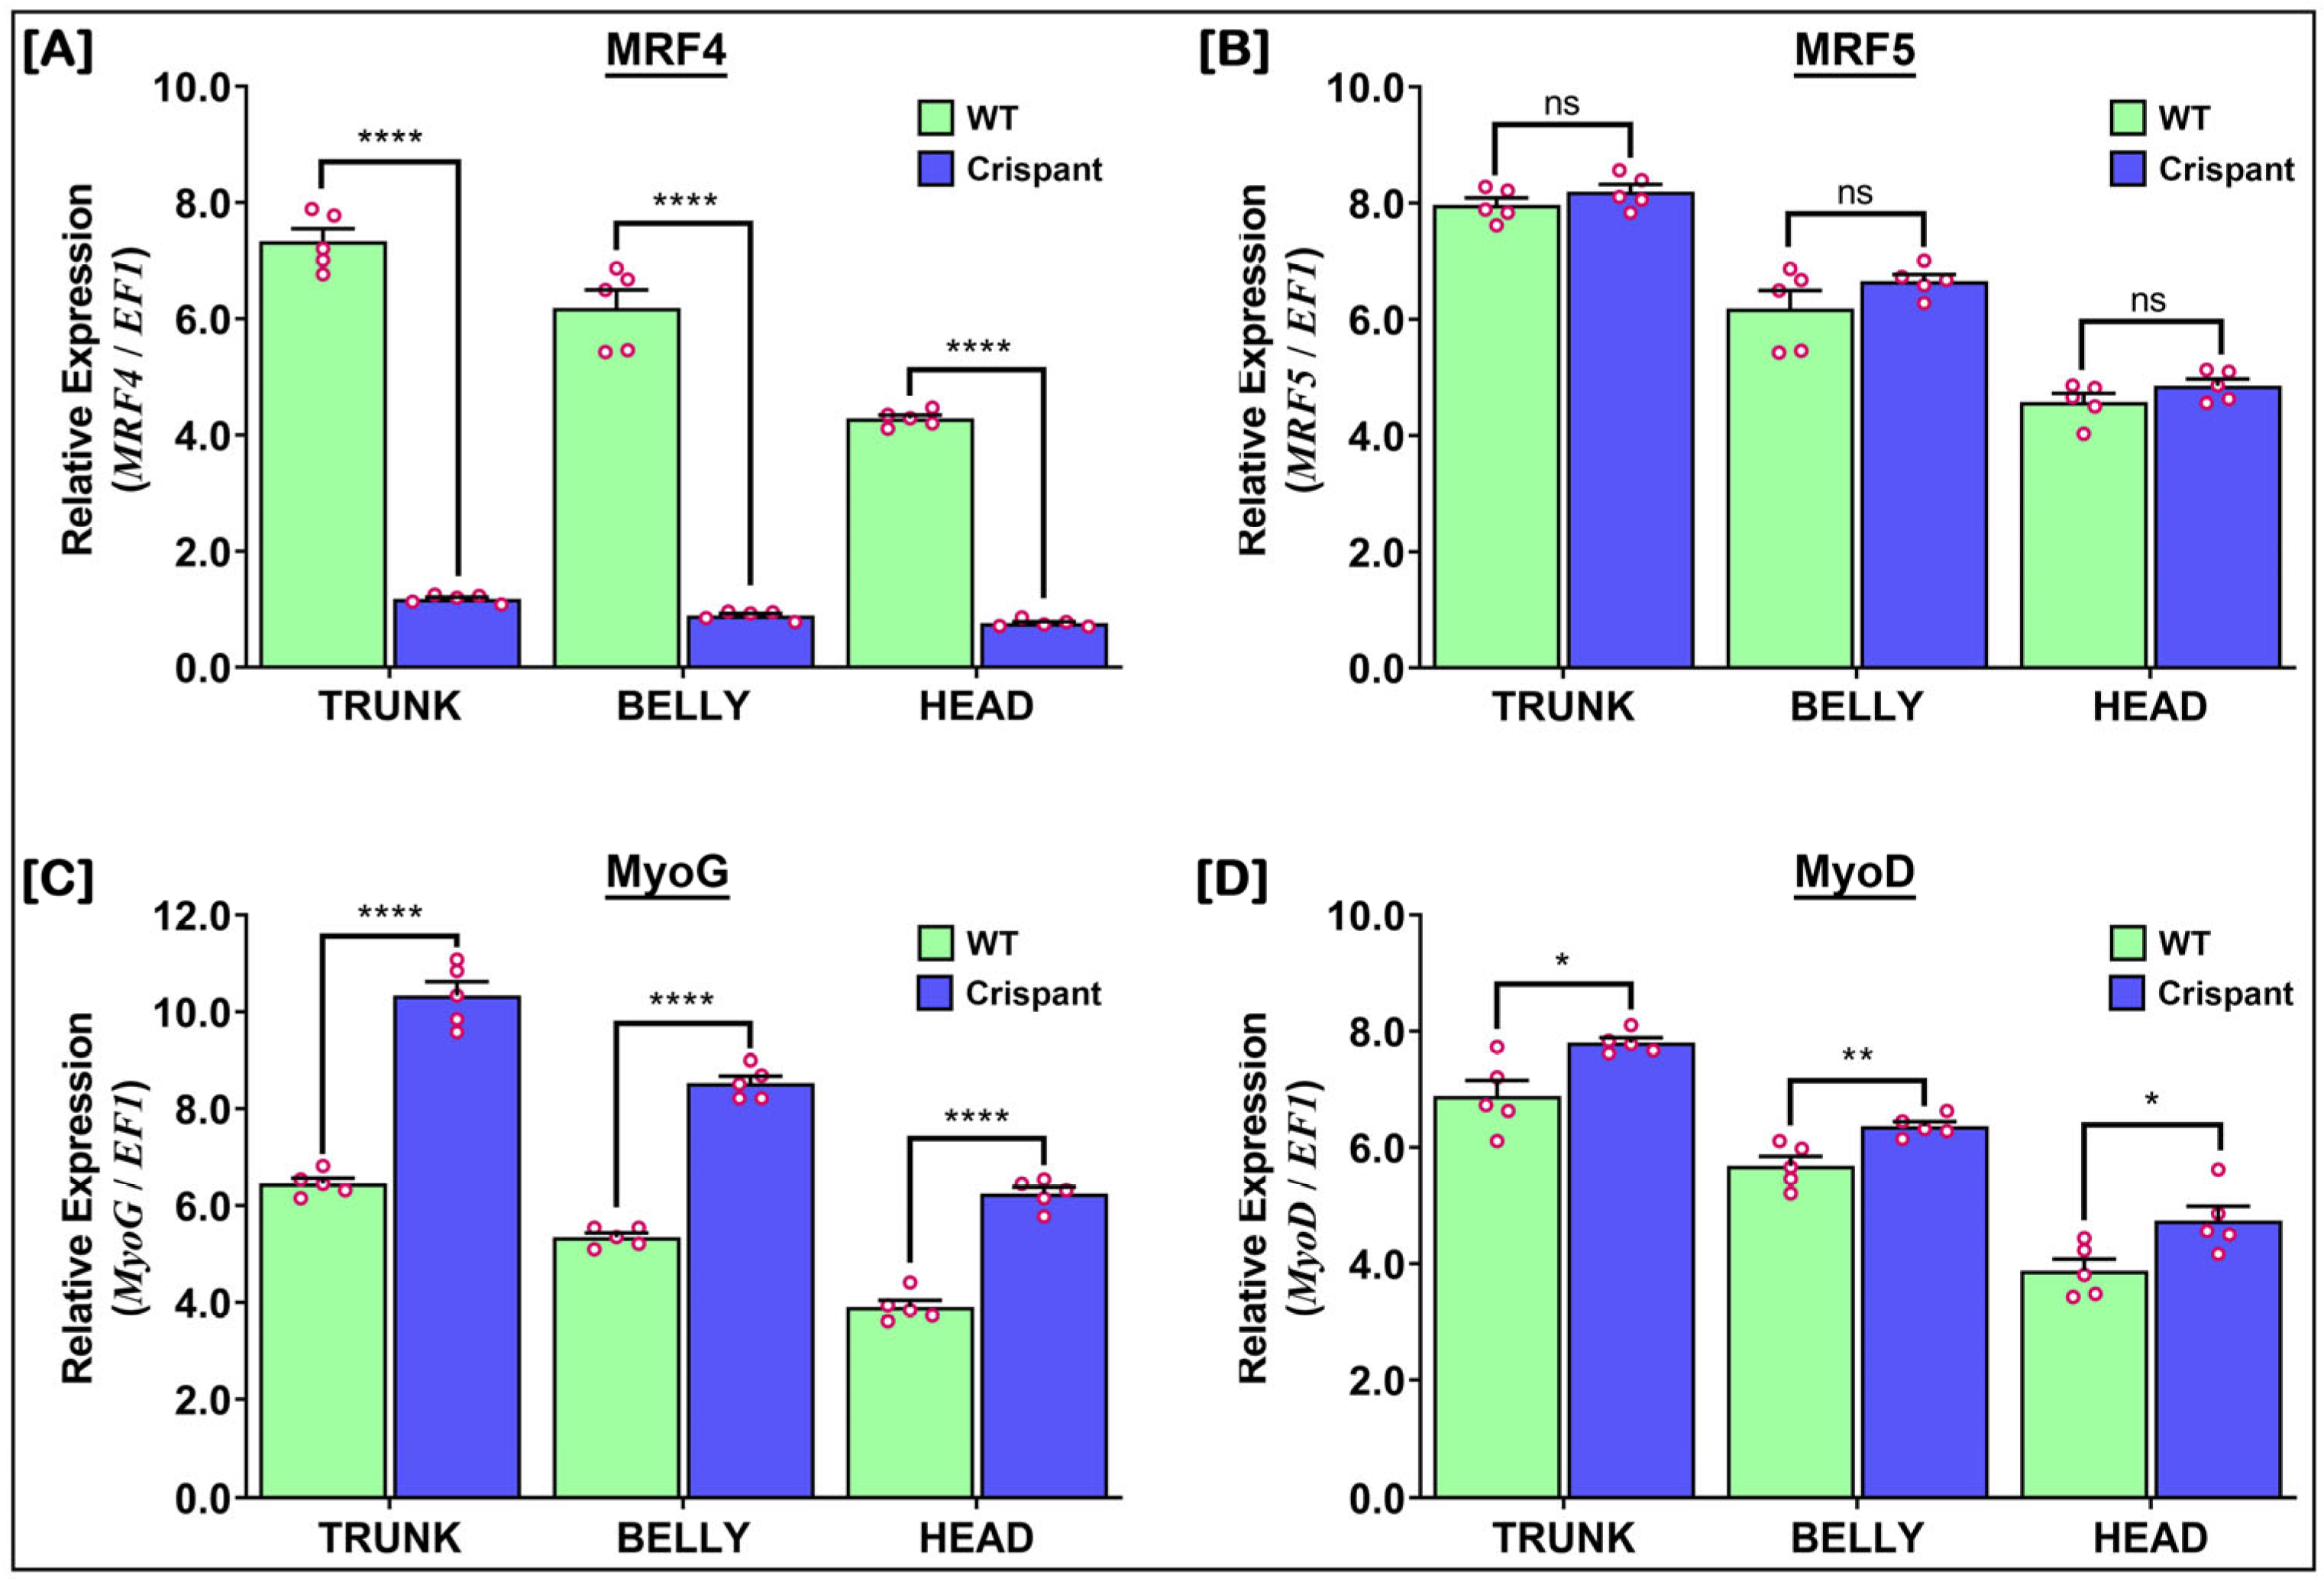
The expression profiles of the major MRFs were compared between the WT and MRF4-crispant Nile tilapia across the trunk, belly, and head muscle (Figure 1). MRF4 expression was markedly reduced in all muscle regions of the crispant (Figure 1A). In the trunk muscle, the crispants exhibited a reduction of approximately 80–85% compared to WT Nile tilapia (FDR-adjusted q < 0.001). Similar decreases were observed in the belly and head muscles. This uniform and severe reduction confirms the highly efficient disruption of MRF4. In contrast, MRF5 expression levels remained unchanged between the WT and crispants (Figure 1B; q > 0.05). No significant differences were observed in the trunk muscle while comparable non-significant patterns were observed in the belly and head muscles. Interestingly, MyoG expression was significantly upregulated across all examined muscle regions in the crispants compared to the WT (Figure 1C). Indeed, the MRF4-crispants showed a 1.7-fold increase in trunk, belly, and head muscles (q < 0.001). MyoD showed a modest increase in trunk and belly muscles (approximately 1.12–1.13-fold; q > 0.05), whereas the increase in head muscle (approximately 1.22-fold) was nominal (raw p = 0.0269) and did not remain significant after tissue-wide FDR correction (q = 0.0546) (Figure 1D).

3.3. Expressions of Myocyte Enhancer Factor 2 (MEF2) Genes in WT and Crispants

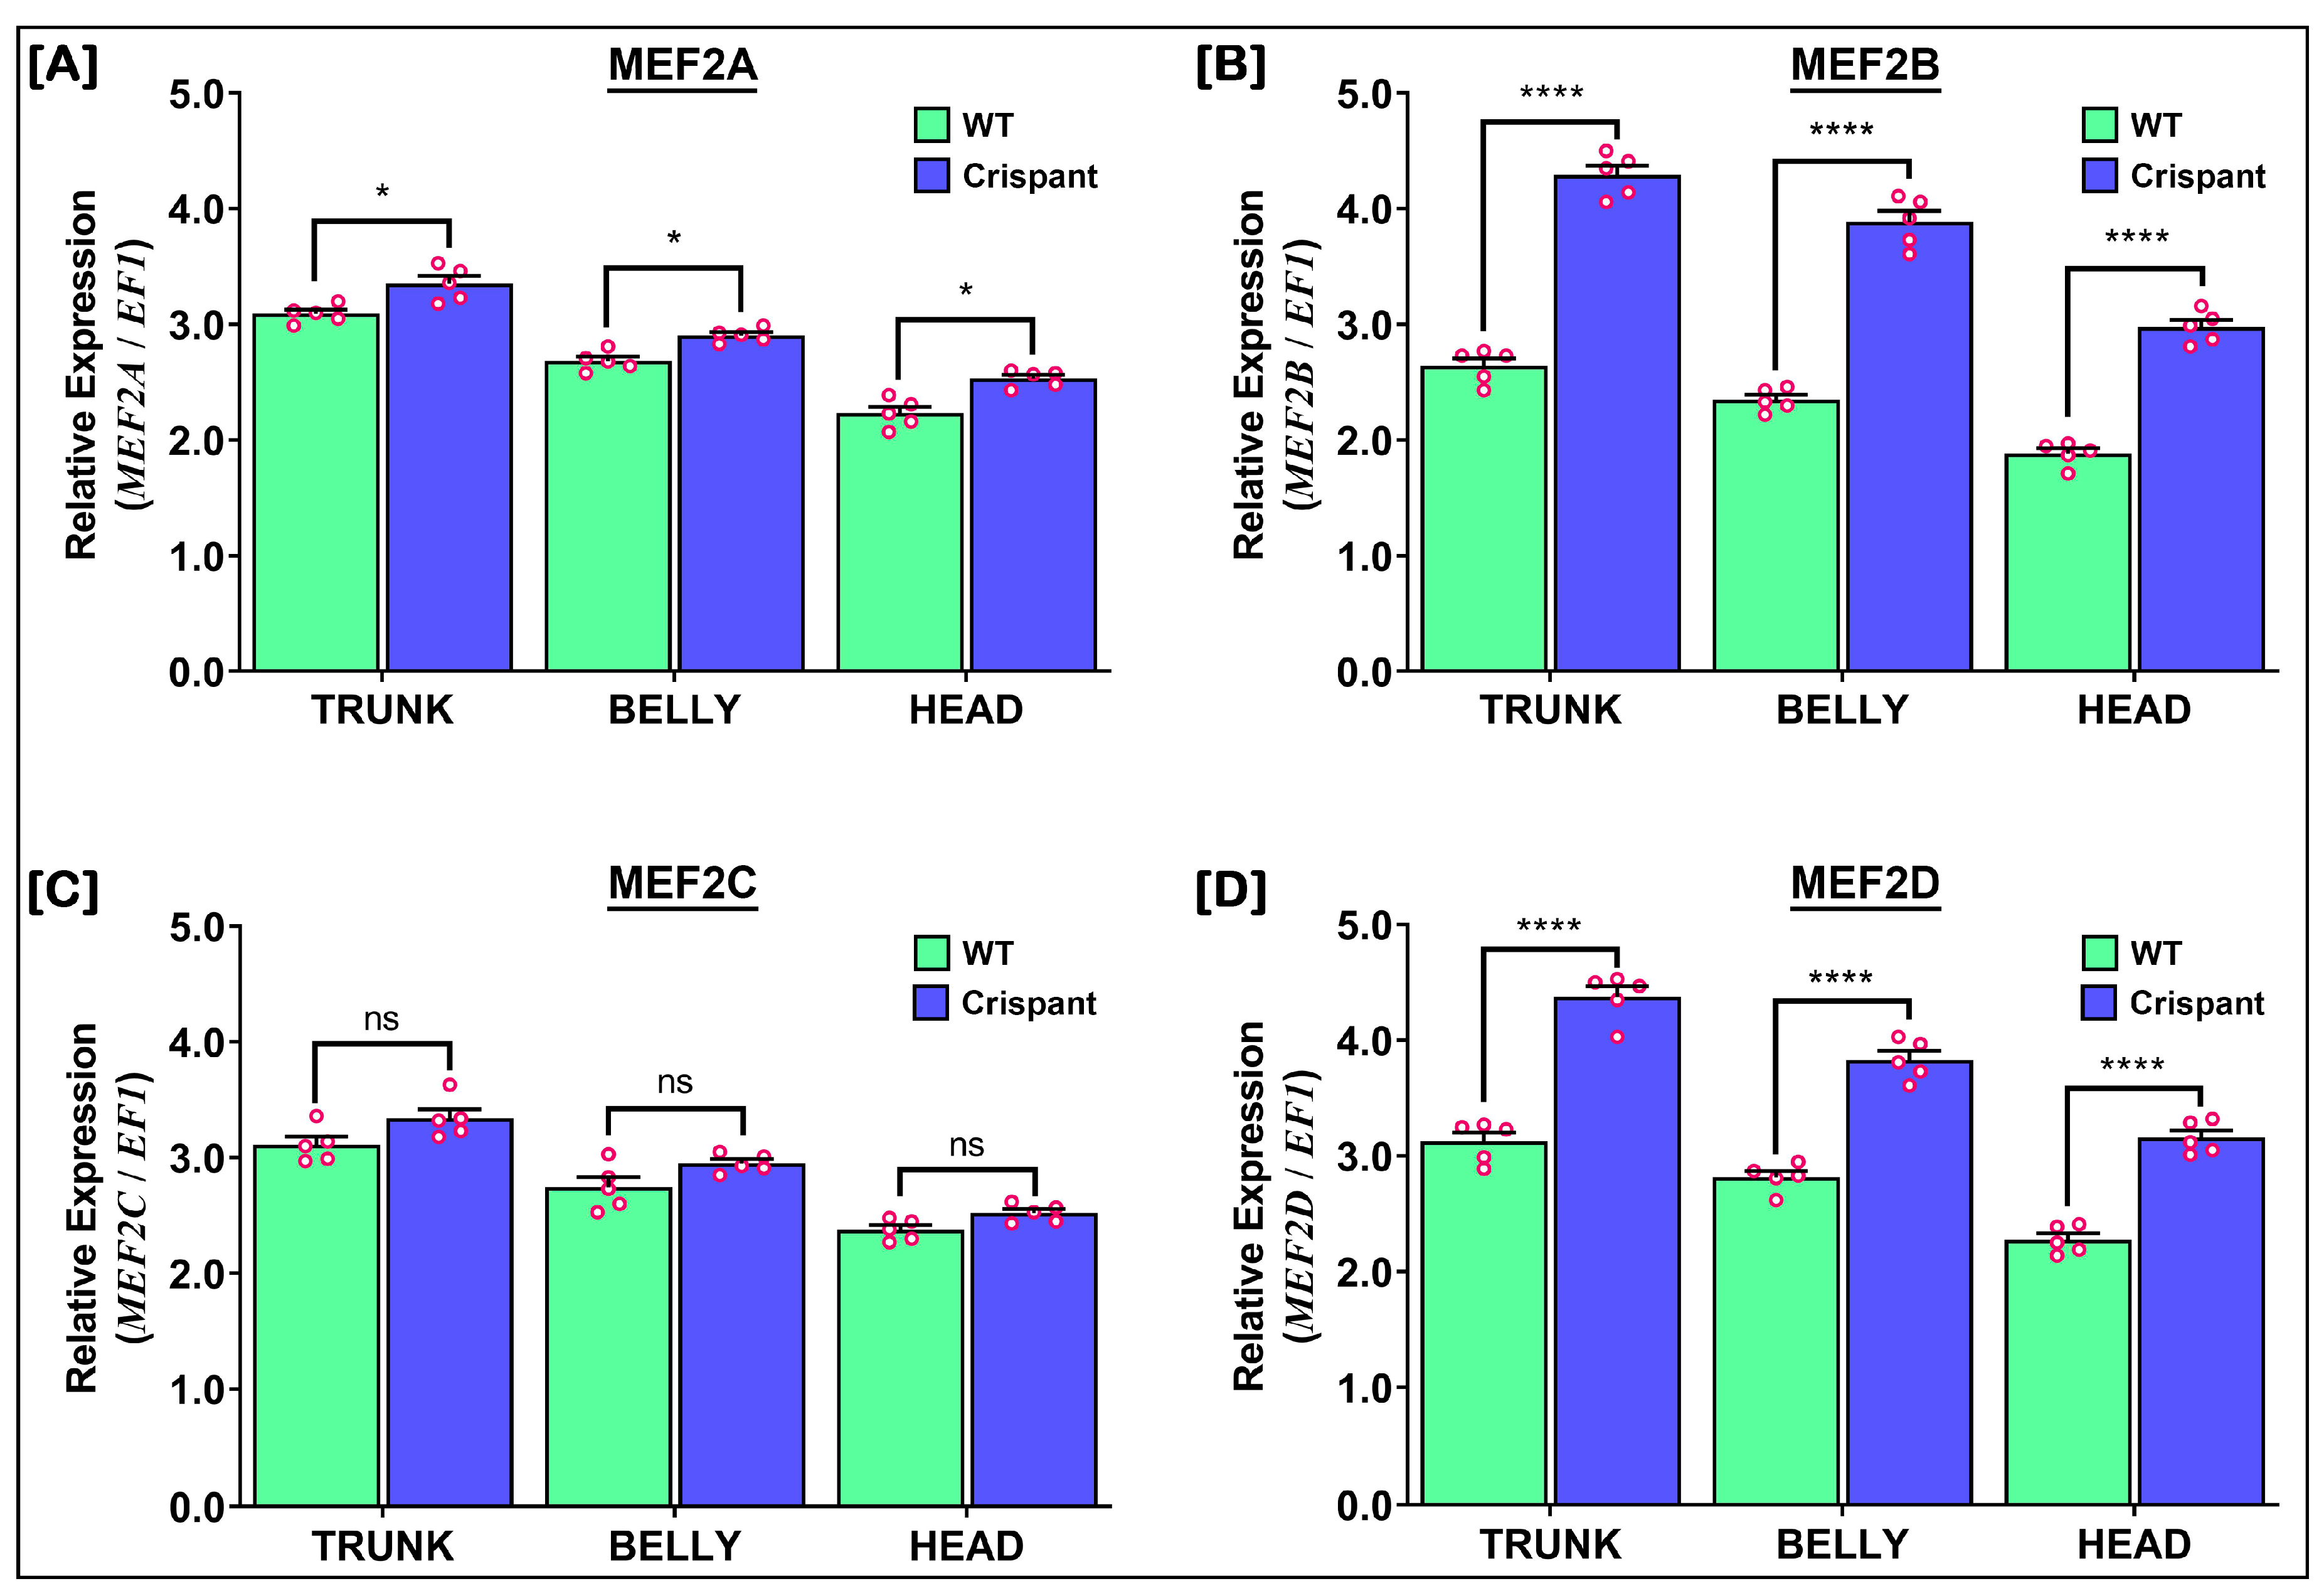
The relative mRNA expression levels of myocyte enhancer factor 2 genes (MEF2A, MEF2B, MEF2C, and MEF2D) were examined in trunk, belly, and head muscles of WT and MRF4-crispant Nile tilapia to evaluate coordinated transcriptional responses following MRF4 disruption (Figure 2). The expression of MEF2A was modestly but significantly elevated in all three muscle regions of the crispants compared to WT (Figure 2A) and, exhibited approximately 1.08–1.13-fold increases (FDR-adjusted q < 0.05), consistent with mild transcriptional compensation. In contrast, MEF2B showed robust upregulation across all anatomical regions, with an approximately 1.58–1.66-fold increase relative to WT (FDR-adjusted q < 0.001; Figure 2B), suggesting that MEF2B is a major compensatory regulator responding to MRF4 loss. The expression of MEF2C did not show significant differences between WT and crispants in any muscle region after FDR correction (FDR-adjusted q > 0.05) (Figure 2C), indicating that this paralog remains transcriptionally stable. Meanwhile, MEF2D was significantly elevated in the crispants, showing approximately 1.36–1.40-fold increase (FDR-adjusted q < 0.014) across the trunk, belly, and head muscles (Figure 2D). These findings indicate that MEF2B and MEF2D serve as the strongest transcript-level compensatory paralogs following MRF4 disruption, whereas MEF2A showed mild induction and MEF2C remained transcriptionally stable (Supplementary Table S1).

3.4. Expressions of Muscle Structural and Contractile Related Genes in WT and Crispants

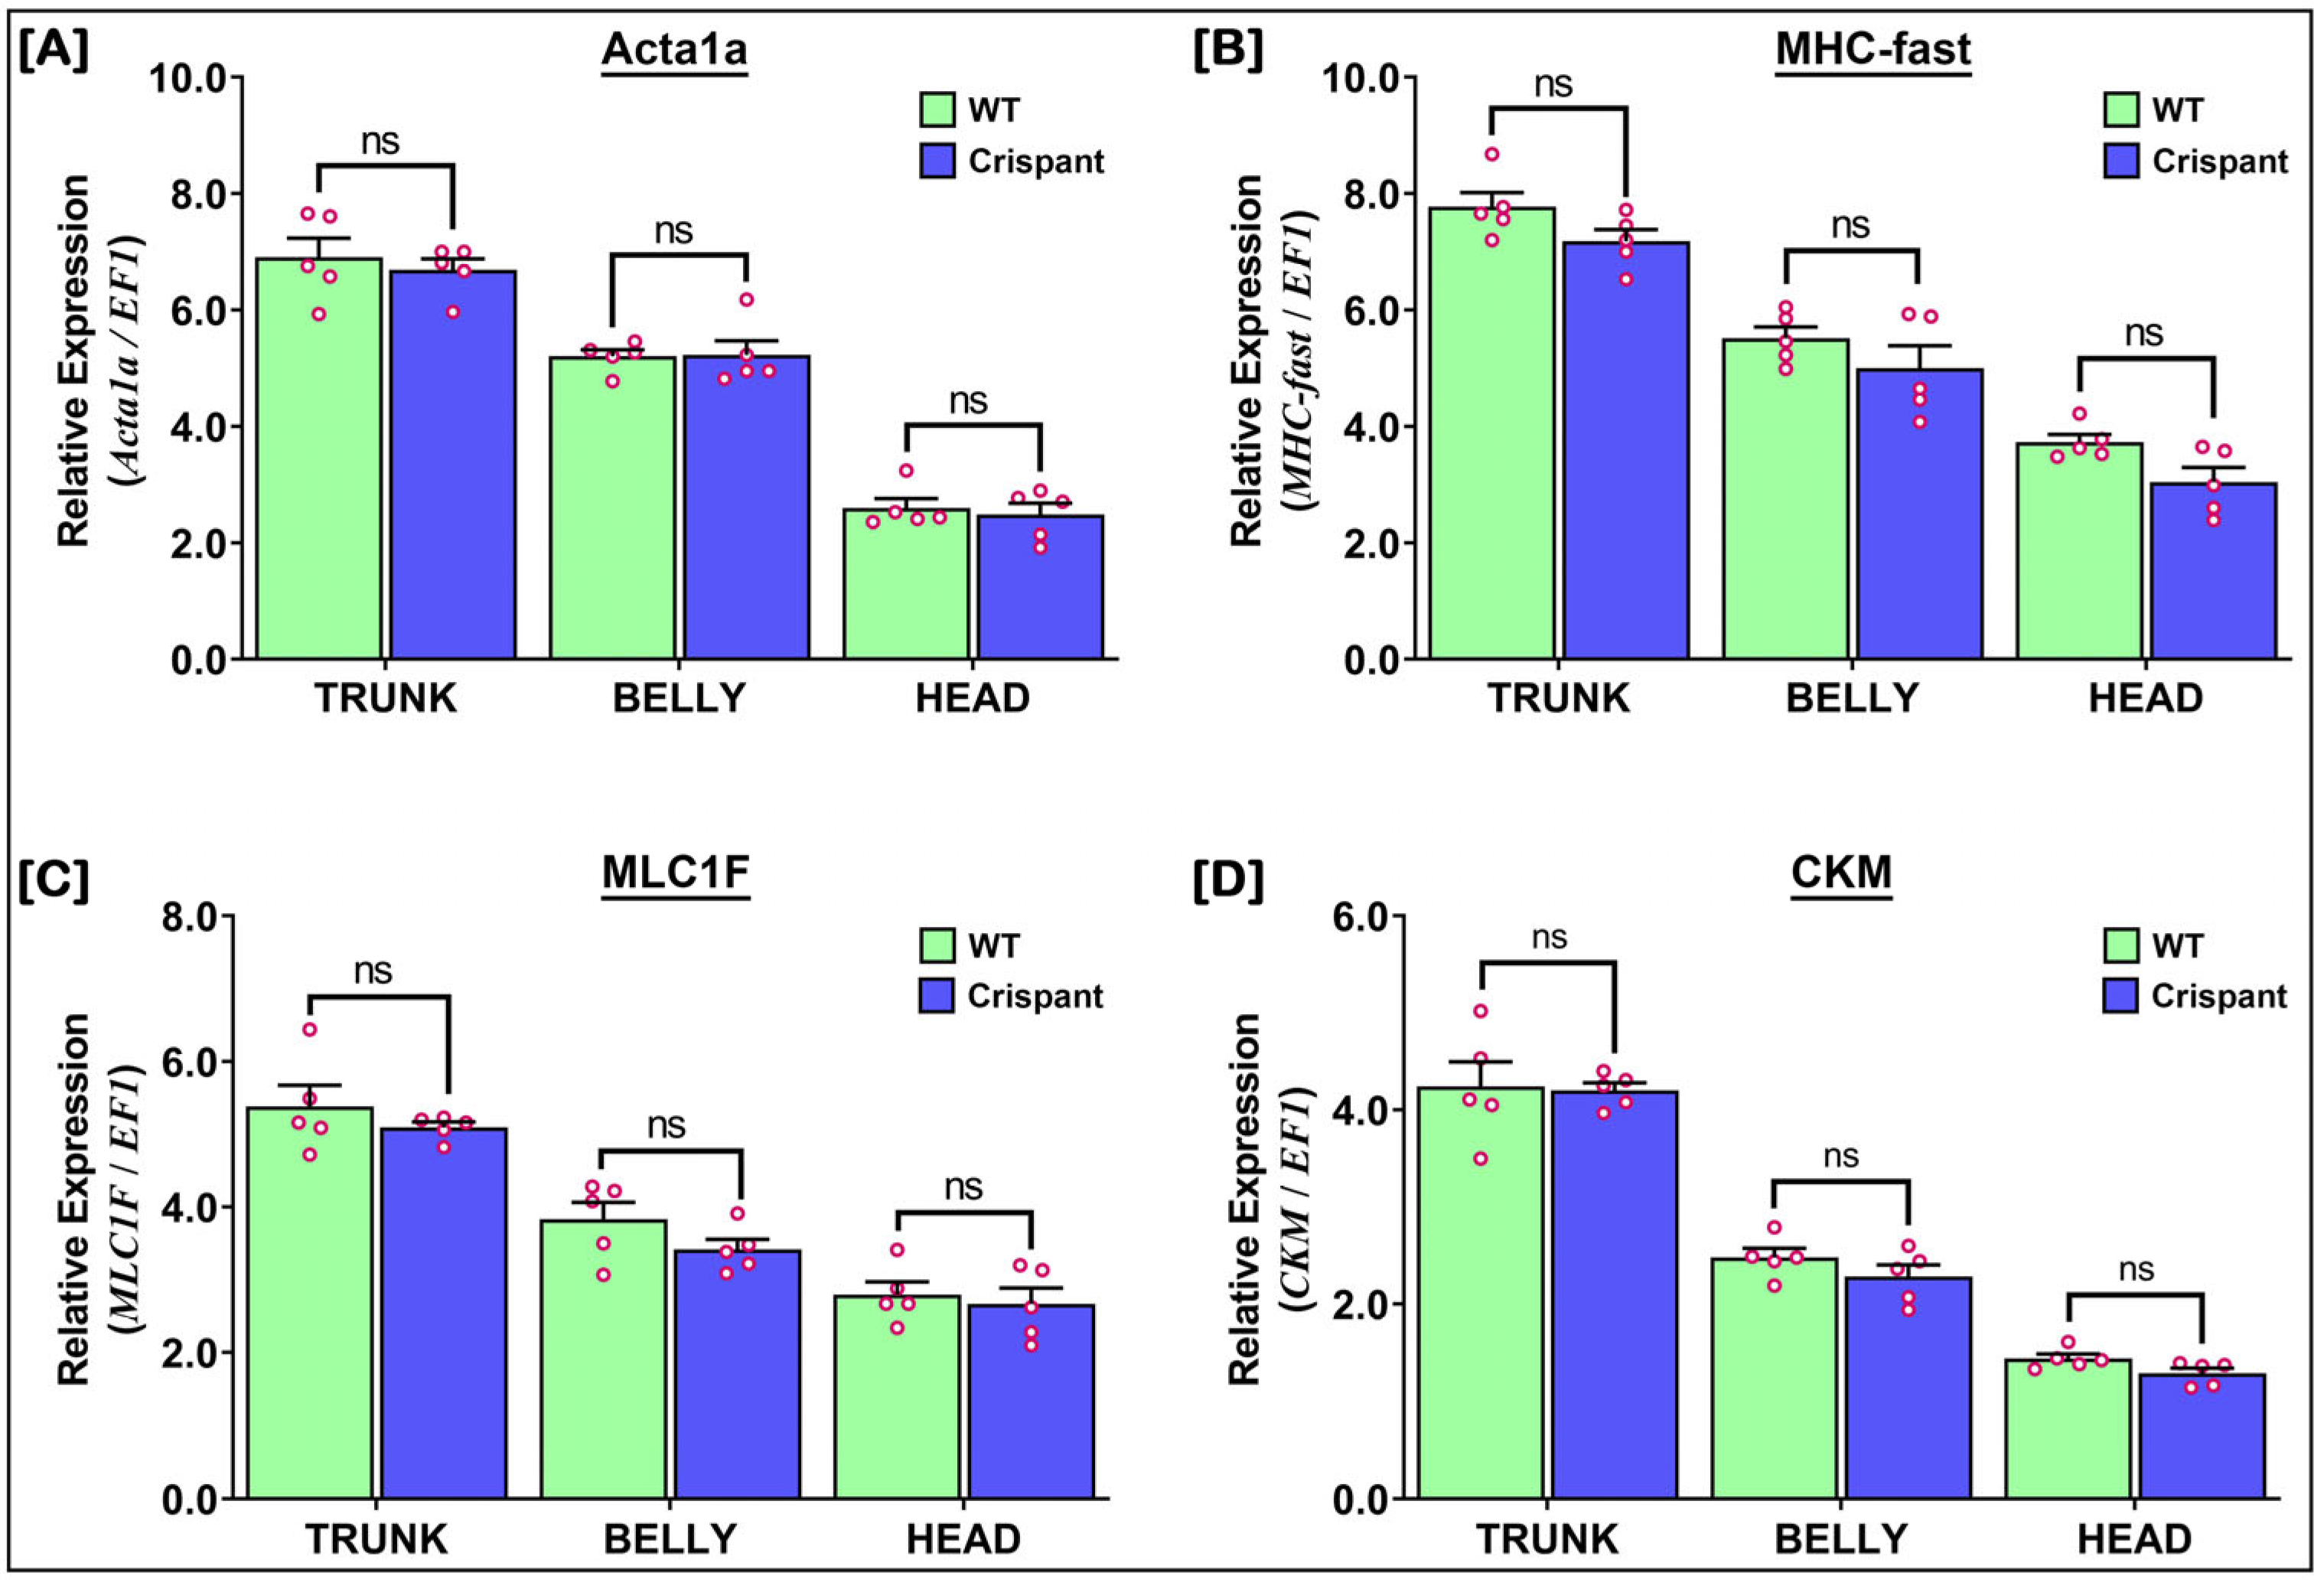
The relative mRNA levels of major muscle structural and contractile related genes (Acta1a, MHC-fast, MLC1F, and CKM) were compared between WT and MRF4-crispant Nile tilapia across trunk, belly, and head muscles (Figure 3). Overall, transcript abundance for these markers was broadly comparable between genotypes in each muscle region, and no comparisons remained statistically significant after multiple-testing correction (FDR-adjusted q > 0.05). Across both genotypes, Acta1a and MHC-fast transcripts showed a consistent axial pattern with higher mean expression in the trunk muscles and lower mean expression in head muscle; however, within each region, differences between WT and crispants were modest (Figure 3A,B). A similar pattern was observed for MLC1F and CKM, with no significant differences among the WT and crispants in any of the examined trunk, belly, or head muscles after FDR correction (Figure 3C,D), although a modest reduction was observed in head muscle for CKM and MHC-fast that did not remain significant after correction (Supplementary Table S1). These data indicate that disrupting MRF4 does not markedly alter the steady-state abundance of transcripts encoding major structural and contractile components of fast skeletal muscles along the body axis.

3.5. Expressions of Non-Myotomal Regulatory Genes in WT and MRF4-Crispants

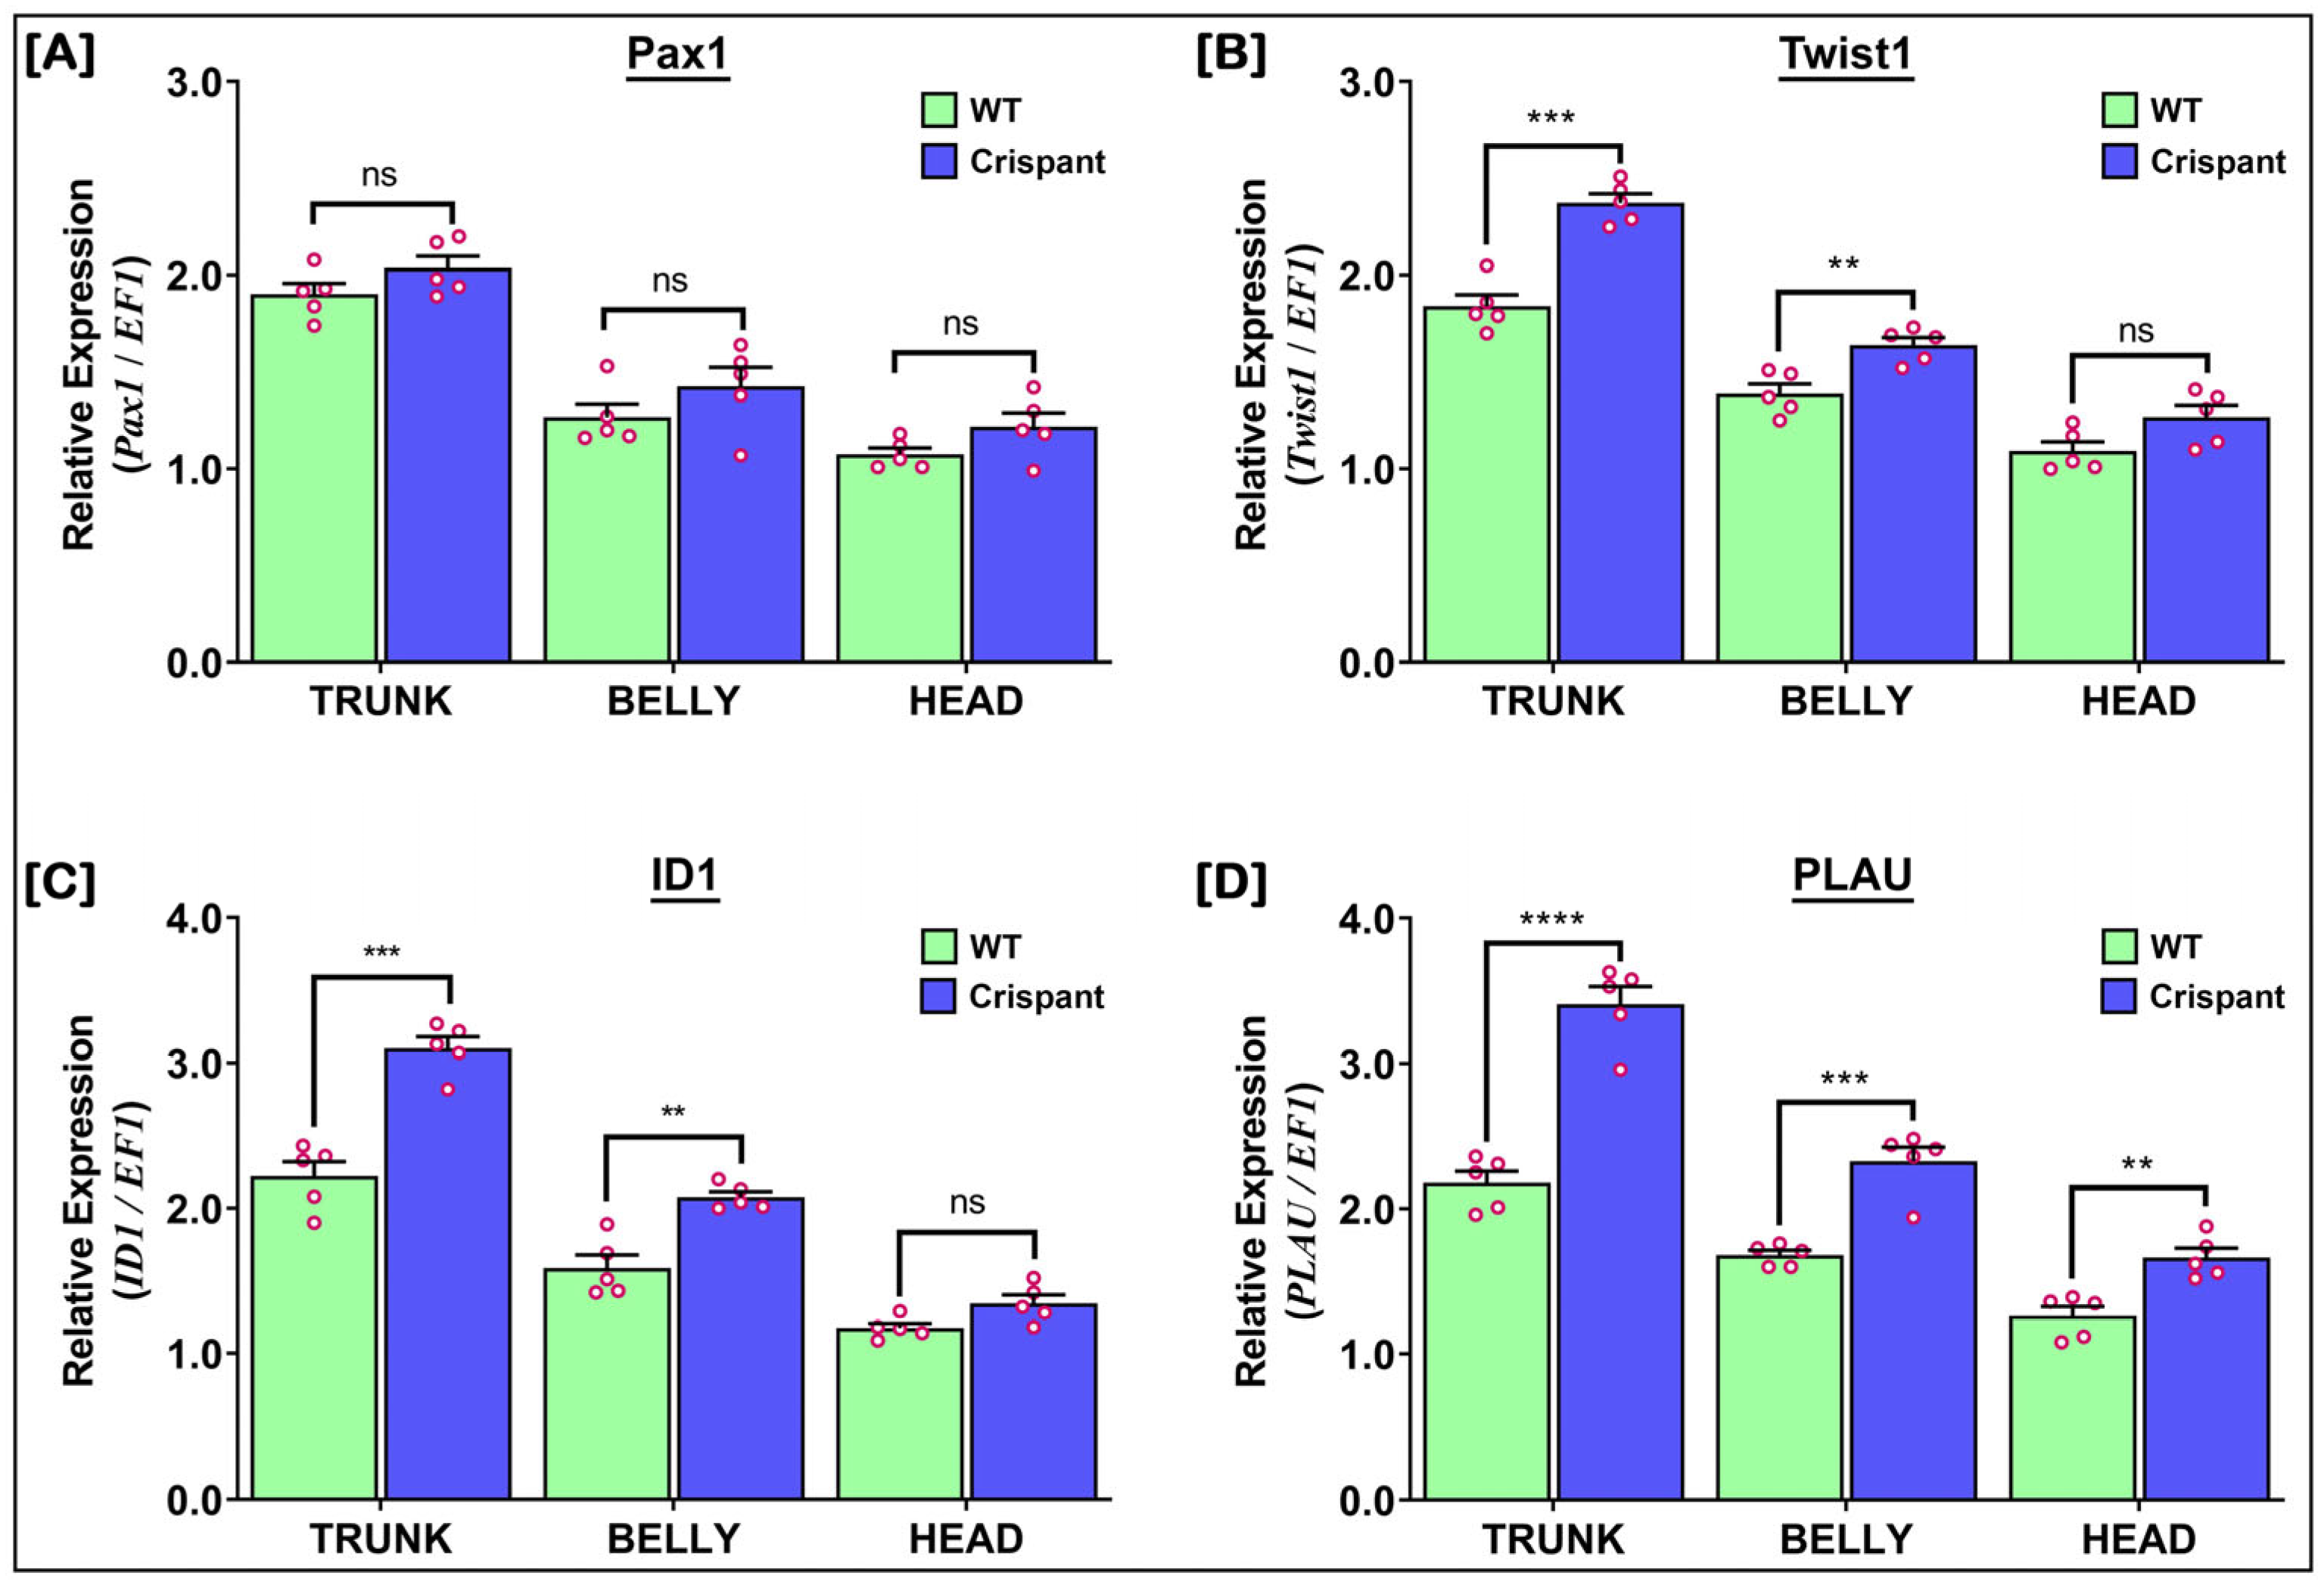
The expression profiles of the non-myotomal regulatory genes were compared between WT and MRF4-crispant Nile tilapia across trunk, belly, and head muscles (Figure 4). Pax1 transcript levels were comparable between genotypes in all muscle regions, with no significant differences detected after FDR correction (Figure 4A; FDR-adjusted q > 0.05). In contrast, Twist1 expression was significantly elevated in crispants in trunk and belly muscles (approximately 1.29-fold and 1.18-fold, respectively; FDR-adjusted q < 0.01), whereas the differences in head muscle did not remain significant after FDR correction (FDR-adjusted q > 0.05) (Figure 4B). ID1 was significantly upregulated in trunk and belly muscles (approximately 1.40-fold and 1.31-fold; FDR-adjusted q < 0.01), while the changes in head muscle was modest and not significant after FDR correction (FDR-adjusted q > 0.05) (Figure 4C). The strongest induction was observed for PLAU, which exhibited significantly higher expression in crispants across trunk, belly, and head muscles (approximately 1.56-fold, 1.38-fold, and 1.32-fold, respectively; FDR-adjusted q < 0.05) (Figure 4D). These data indicate that MRF4 disruption is selectively associated with increased expression of Twist1, ID1, and PLAU, whereas Pax1 remains transcriptionally stable (Supplementary Table S1).

3.6. Expressions of Cell Adhesion and Fusion-Related Genes in WT and MRF4-Crispants

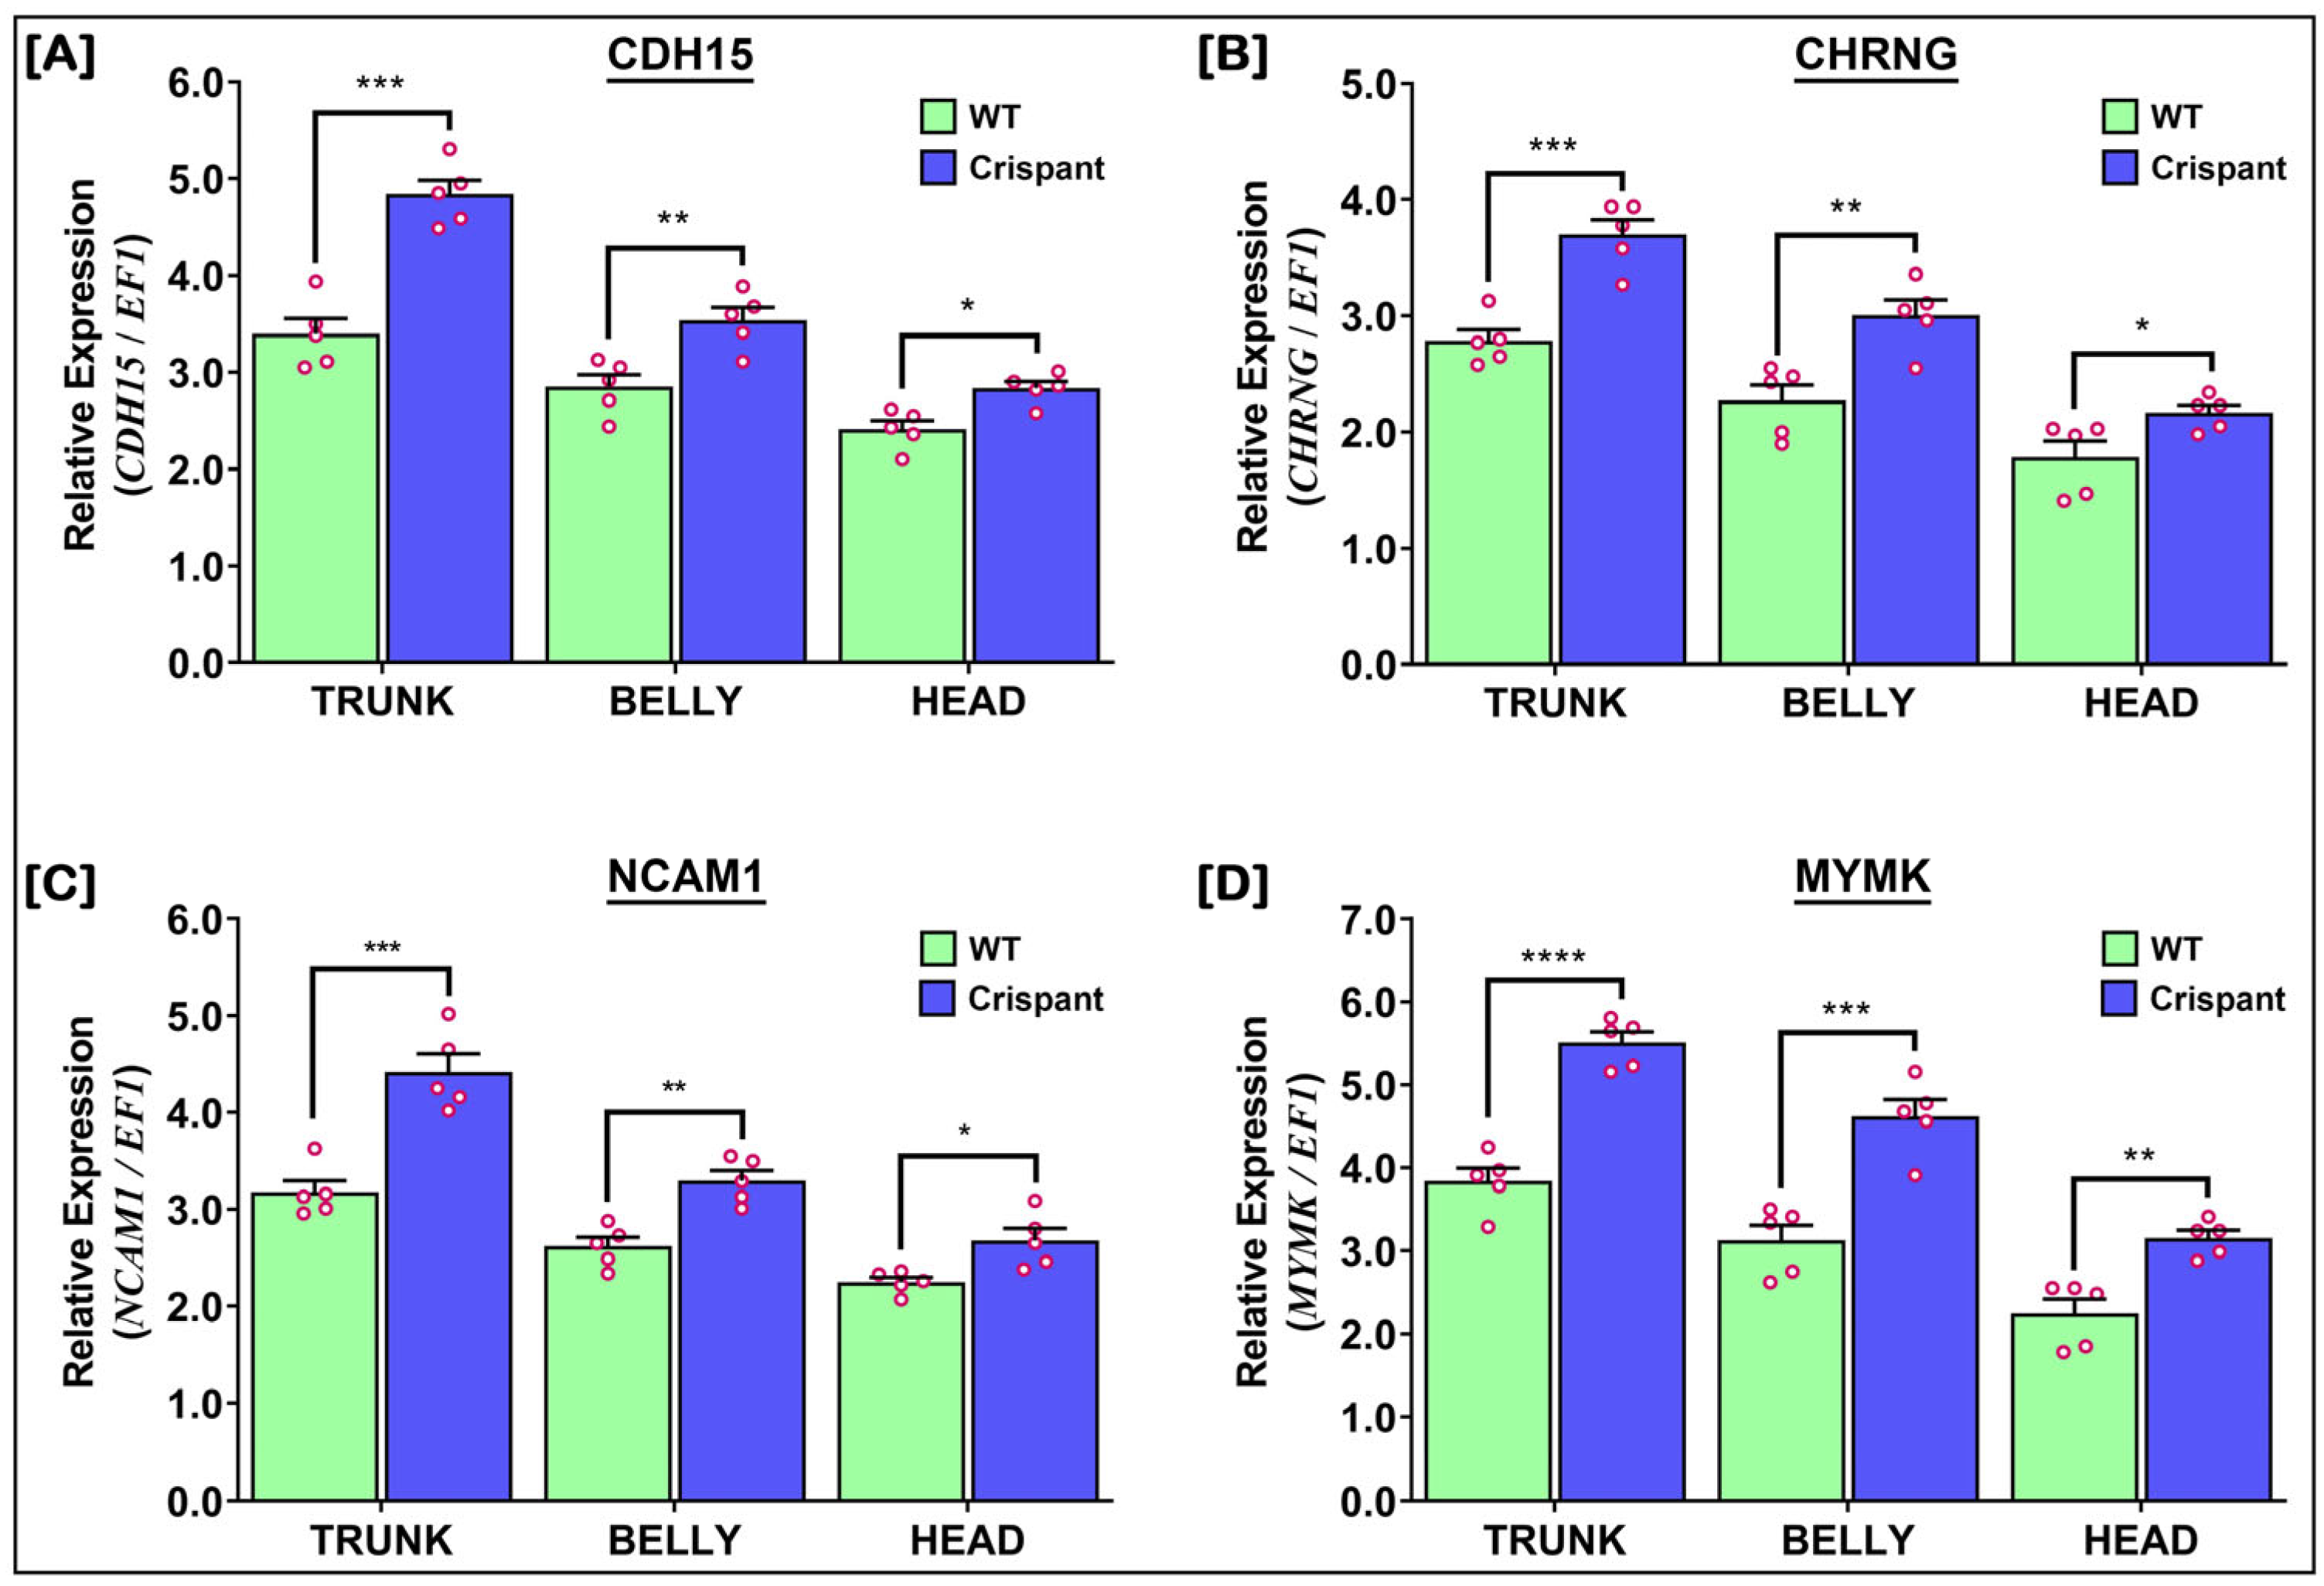
Transcripts encoding cell adhesion and fusion-related factors were compared between WT and MRF4-crispant Nile tilapia across trunk–belly–head axis (Figure 5). Overall, CDH15, CHRNG, NCAM1, and MYMK showed coordinated increases in mRNA abundance in crispants relative to WT, with most comparisons remaining significant after FDR correction (Supplementary Table S1). The CDH15 mRNA levels were elevated in crispants across all muscle regions, with the largest increase observed in trunk muscle (approximately 1.4-fold) and more modest increase in belly and head muscles (approximately 1.3-fold and 1.2-fold, respectively) (Figure 5A). The CHRNG expression followed a similar pattern, with higher transcript levels in the crispants by roughly 1.3–1.4-fold in the trunk and belly muscles and by 1.3-fold in the head muscles compared to WT (Figure 5B). The NCAM1 transcripts were also significantly elevated in all three regions, with crispants exhibiting approximately 1.3–1.4-fold higher levels than WT (Figure 5C). The fusion-related factor MYMK showed one of the strongest transcript-level responses, increasing by approximately 1.4–1.5-fold in trunk and belly muscles, and by approximately 1.3-fold in the head muscles compared to WT (Figure 5D). These findings indicate coordinated upregulation of transcripts associated with cell adhesion and fusion-related processes, consistent with altered regulation of pathways, previously implicated in myoblast fusion, while not providing direct evidence of increased fusion at the cellular or tissue levels.

3.7. Expressions of Growth and Proliferation Regulatory Genes in WT and MRF4-Crispants

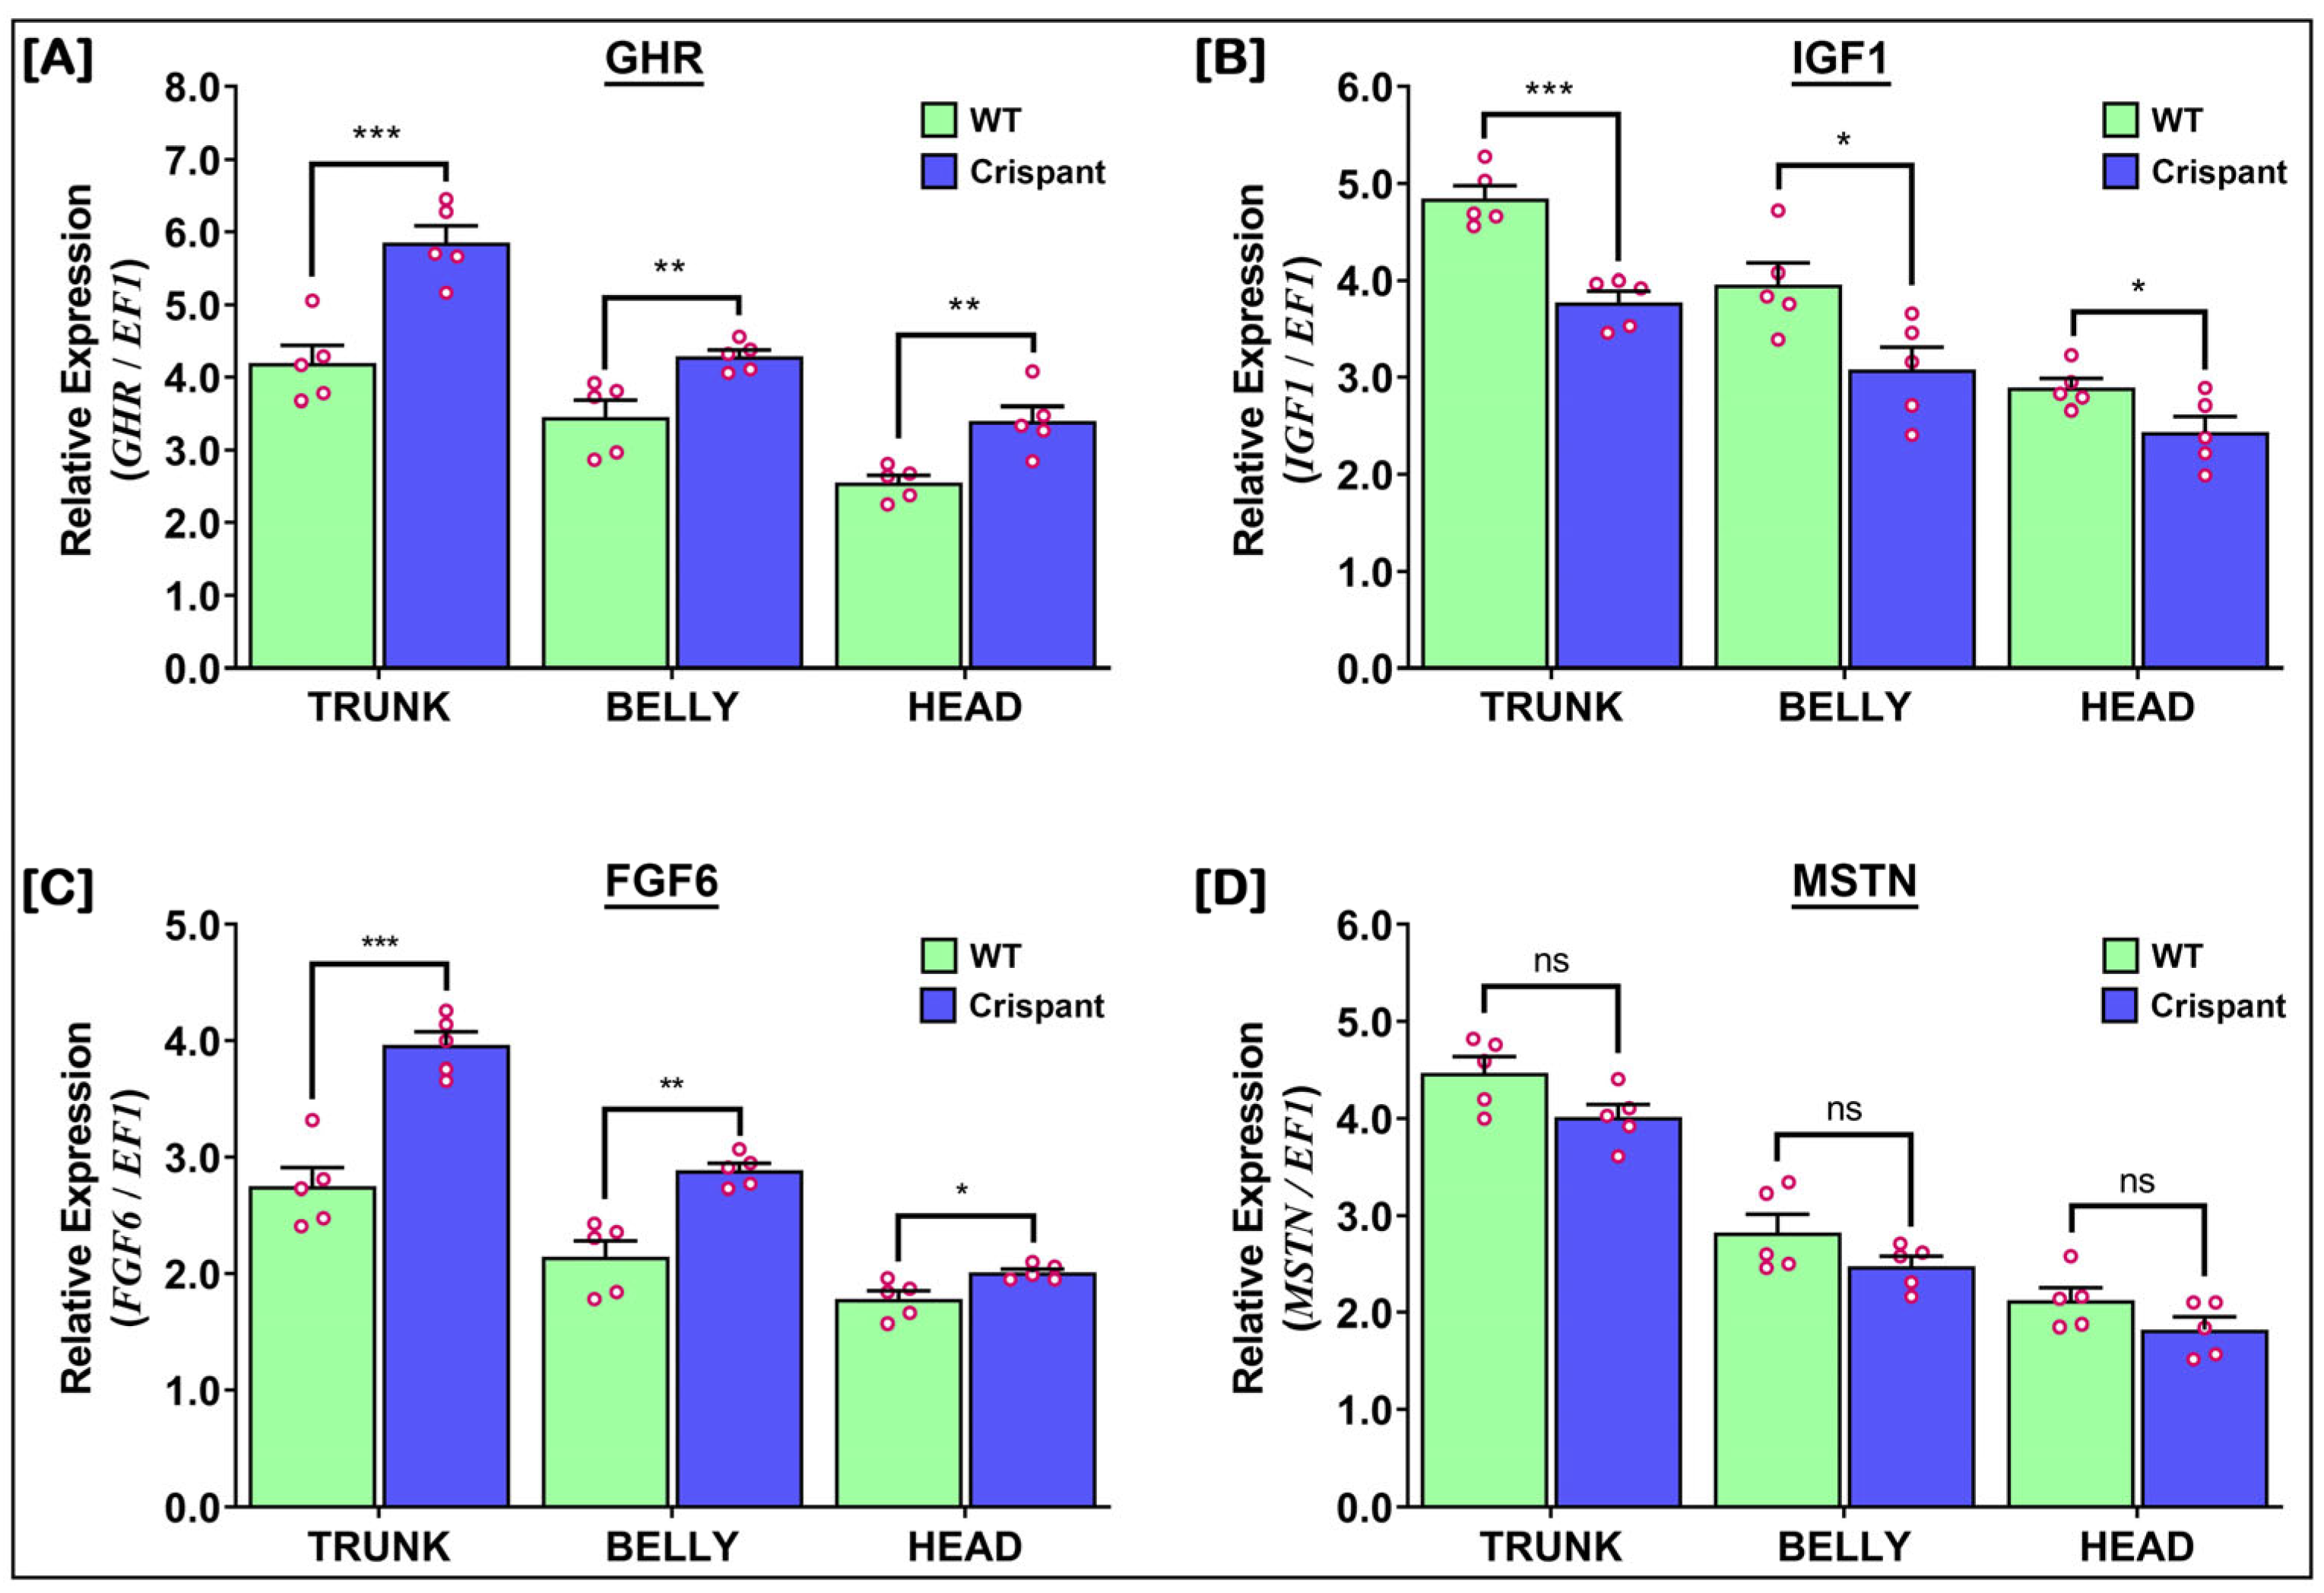
Growth-related signaling transcripts (GHR, IGF1, FGF6, and MSTN) were quantified in trunk, belly, and head muscles of WT and MRF4-crispant Nile tilapia (Figure 6). GHR mRNA levels were significantly elevated in all muscle regions in the crispants, with increases of approximately 1.4–1.6-fold compared to WT (Figure 6A). In contrast, IGF1 transcripts were reduced in the crispants compared to WT across the trunk, belly, and head muscles with the magnitude of reduction varying by region (Figure 6B). The myogenic mitogen FGF6 was also significantly upregulated in the crispants across the three muscle regions (Figure 6C). By comparison, the MSTN mRNA showed a trend toward lower expression in the crispants, but differences between the genotypes did not remain statistically significant after FDR correction in any muscle region (Figure 6D; Supplementary Table S1). These results indicate coordinated transcript-level changes in growth-related signaling genes within skeletal muscle following MRF4 disruption, characterized by increased GHR and FGF6 expression and reduced IGF1 expression, while MSTN expression remains largely unchanged.

3.8. Summary Schematic of Transcript-Level Responses to MRF4 Disruption

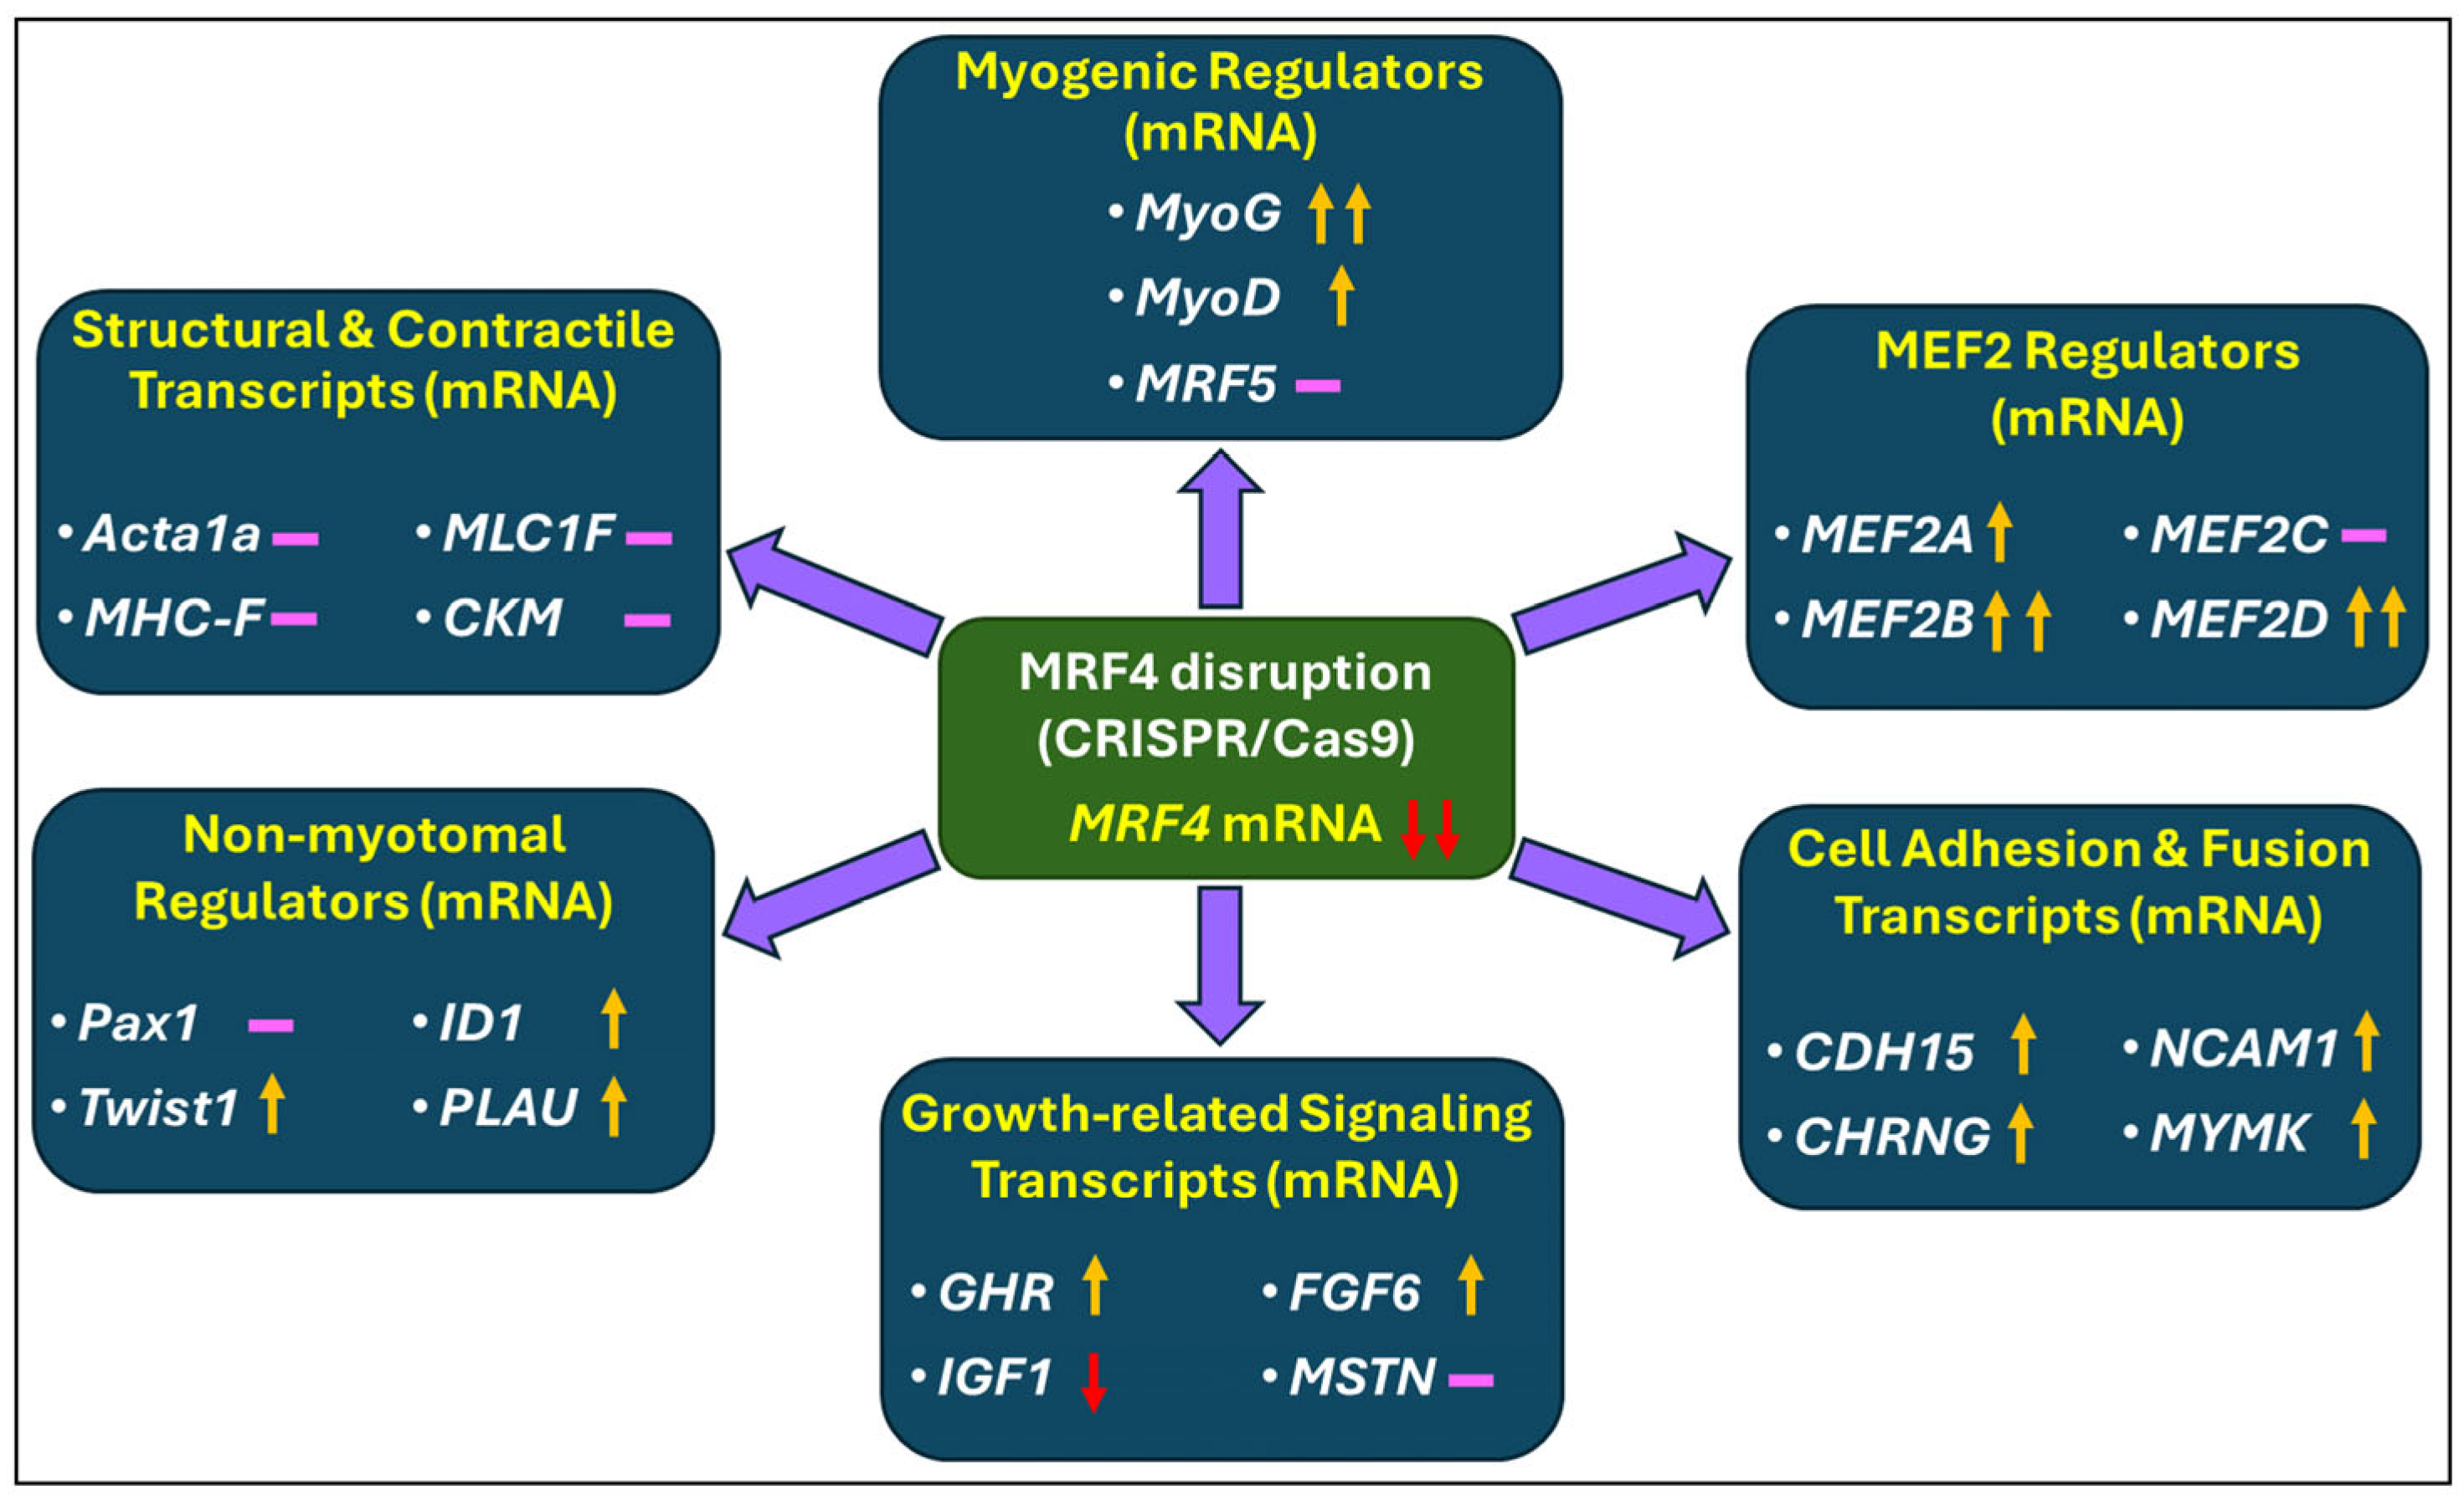
To integrate the major transcript-level findings across gene categories, a schematic summary of the coordinated mRNA changes following MRF4 disruption was generated (Figure 7). The diagram consolidates changes in myogenic regulators, MEF2 regulators, non-myotomal regulators, cell adhesion and fusion-related transcripts, and growth-related signaling transcripts, while highlighting the largely stable expression of major structural and contractile transcripts. This schematic is intended as a visual summary of observed mRNA expression patterns and does not demonstrate validated regulatory interactions or functional outcomes.

4. Discussion

The present study extends our previous work on CRISPR/Cas9 disruption of MRF4 in Nile tilapia by examining transcriptional programs and growth-related signaling transcripts in F0 crispants carrying an MRF4 mutation [14]. During CRISPR/Cas9-mediated disruption of MRF4, a frameshift mutation was identified that generated a premature stop codon. The edits remove the canonical bHLH domain and strongly reduce MRF4 expression in adult muscle, similar to the disruption of the coding region encompassing the bHLH domain described in mouse MRF4 mutants [21]. Together with the marked knockdown of MRF4 mRNA observed in all axial areas (trunk, belly, and head muscles), these data reinforce the view that the edited fish effectively model an operative loss-of-function state for this late myogenic regulator.
The strong suppression of MRF4 mRNA, accompanied by compensatory changes in other MRFs, is consistent with current models of redundancy among myogenic regulatory factors in vertebrates. MyoG and MRF4 are among the MRFs considered key regulators of the later stages of myogenesis and postnatal muscle growth [9,39]. Genetic and transgenic studies have further indicated that these genes can partially substitute for one another under specific conditions: MRF4 expressed from the myogenin locus or in myogenin-null embryonic stem cells can rescue aspects of the myogenin-deficient phenotype [9,40]. In mammals, MyoD and MRF5 act as primary determination factors, whereas MyoG and MRF4 function predominantly during terminal differentiation and postnatal maturation. It was also reported that the differentiation function of MRF4 is redundantly compensated by other myogenic factors, such as MyoG and MyoD, in mice to compensate for the loss of MRF4 and to maintain normal muscle development and maintenance [41]. Among the MRFs, MyoG and MRF4 are key regulators of late myogenesis [12,42], and studies have shown that MRF4 and MyoG can functionally substitute for one another during this process [13]. Genetic studies in MRF4-null mice revealed multiple waves of myogenesis within the myotome and showed that later programs can partially compensate for MRF4-dependent changes [21]. The present findings show that despite profound depletion of MRF4 expression, fast skeletal muscle maintains normal expression of major structural genes while exhibiting robust upregulation of MyoG and modest induction of MyoD in MRF4-crispants. In this context, the robust upregulation of MyoG and the moderate increase in MyoD expression observed in MRF4-crispant Nile tilapia support the idea that the MyoG–MyoD axis acts as a compensatory module that preserves the myogenic differentiation program when MRF4 activity is compromised, thereby allowing normal expression of major structural genes and preservation of a fast-muscle transcriptional program.
The MEF2 family plays a central role in integrating upstream MRF4 signals into the transcription of structural and metabolic muscle genes, adding a second, tightly interconnected layer to this compensatory network. MEF2 proteins are known to regulate the function of bHLH genes, including MyoG and MRF4, and play a key role in skeletal muscle development during embryogenesis and in the maturation and remodeling of adult muscle [16,17,43]. Consistent with this, the acute knockdown of MRF4 in adult rat muscle was demonstrated to lead to robust activation of a broad MEF2 target gene set, including sarcomeric, excitation–contraction coupling, and metabolic genes; meanwhile a dominant-negative MEF2 completely abolishes this hypertrophic program and can be mimicked by a constitutively active MEF2 construct [15]. These data established MRF4 as a negative regulator of MEF2 transcriptional activity in adult skeletal muscle, acting at least in part by stabilizing of a repressor complex containing histone deacetylase 4 and associated co-repressors on MEF2-responsive promoters. In this context, the graded compensatory response among MEF2 paralogs in MRF4-crispant Nile tilapia, with MEF2B and MEF2D showing the strongest induction, MEF2A being modestly upregulated, and MEF2C remaining unchanged along the trunk–belly–head axis, is consistent with a conserved MRF4–MEF2 regulatory module adapted to the teleost genome architecture. It is also consistent with an isoform-specific division of labor in the mammalian system, where MEF2 is more critical for early developmental myogenesis and regeneration. In contrast, MEF2A, MEF2B, and MEF2D contribute more prominently to adult muscle plasticity and hypertrophic remodeling [8,17,44,45]. These results support the idea that individual MEF2 isoforms act as flexible nodes that stabilize the myogenic transcriptional network when MRF4 activity is reduced, with MEF2B and MEF2D assuming a predominant compensatory role in teleost fast muscle. The lack of detectable changes in MEF2C is comparable with an isoform-specific division of labor, whereby MEF2C contributes mainly to early myogenesis and regeneration rather than to adult fiber plasticity and hypertrophic remodeling [17].
Despite pronounced remodeling of regulatory factors, the steady-state expression of key sarcomeric and metabolic genes such as Acta1a, MHC-fast, MLC1F, and CKM remained remarkably stable across genotypes along the trunk–belly–head muscle axis. This pattern is consistent with previous work in teleosts showing that large changes in muscle mass and growth rate occur without a major shift in the transcript abundance of the major abundant myofibrillar proteins because these genes are already expressed at high levels; moreover, muscle growth is largely driven by changes in fiber number and size rather than wholesale reprogramming of structural genes [3,5,46]. In models of compensatory or recovery growth, transcriptomic studies further indicate that gene expression changes are concentrated in regulatory, metabolic, and translational pathways, where most myofibrillar genes show relatively modest variation during rapid muscle accretion [4,5]. In this context, the preserved expression of Acta1a, MHC-fast, MLC1F, and CKM in MRF4-crispants suggests that compensatory MRF-MEF2 activity is sufficient to maintain the baseline transcriptional program required for sarcomere assembly and a fast-muscle gene expression signature, even though upstream regulatory architecture has been substantially rewired.
In contrast with the stable structural gene program, non-myotomal regulatory genes showed selective changes in MRF4-crispant Nile tilapia. Twist1 and ID1 were consistently upregulated along the trunk–belly–head axis. Twist1 is a bHLH transcription factor that inhibits myogenic differentiation by interfering with MyoD DNA binding and reducing MEF2 activity; meanwhile, ID1 acts as a dominant-negative HLH protein that sequesters E proteins and prevents activation of myogenic bHLH factors [36,47,48]. Therefore, the coordinated increase in these proteins is compatible with a shift in a subset of muscle-associated cells toward greater mesenchymal plasticity and delayed commitment to terminal differentiation, even though the main structural gene program remains unchanged. The strong induction of urokinase-type plasminogen activator PLAU in trunk muscle further supports a remodeling-oriented state. The plasminogen activation system, with uPA as a central component, provides pericellular proteolytic activity that is crucial for extracellular matrix remodeling, inflammatory cell recruitment, and effective skeletal muscle regeneration [34,49]. Furthermore, uPA promotes myoblast proliferation through hepatocyte growth factor activation and facilitates macrophage damage to muscle tissue, thereby coordinating cellular and matrix responses during repair [34,50]. In contrast, Pax1 expression did not differ between WT and MRF4-crispant muscles in any region. Pax1 is classically associated with sclerotome and vertebral and intervertebral disc development rather than myotome differentiation [33,51,52]. Therefore, the stable expression of Pax1 suggests that the MRF4 lesion does not strongly impact Pax1-dependent axial or connective-tissue compartments in the muscles, and that the main effects of MRF4 loss are concentrated in regulatory networks controlling plasticity, matrix remodeling, and satellite-cell behavior rather than in the Pax1-driven patterning process.
The pronounced induction of cell adhesion and fusion-related genes in MRF4-crispants supports a transcriptional pattern associated with pathways involved in myogenesis and repair. NCAM1, and CDH15 (M-cadherin) are key mediators of myoblast recognition, alignment, and fusion during myogenesis and repair, and the blockade of NCAM1 markedly reduces myotube formation in avian and mammalian systems [27,28,29]. CHRNG encodes the gamma subunit of the fetal acetylcholine receptor, which is required for proper neuromuscular junction formation and early synaptic transmission, and mutations in CHRNG cause congenital myasthenic and multiple pterygium syndromes characterized by impaired neuromuscular connectivity [53,54]. Myomaker (MYMK) is a muscle-specific membrane protein that is absolutely required for myoblast fusion in mice and zebrafish, and the expression of MYMK is tightly controlled by MyoD and MyoG [30,55]. Thus, the loss of MYMK produces a complete block in myofiber formation and severely compromises muscle regeneration [31]. Therefore, the coordinated upregulation of CDH15, CHRNG, NCAM1, and MYMK along the trunk–belly–head axis in MRF4-crispants is consistent with increased expression of factors implicated in myoblast fusion and neuromuscular junction development during myogenesis and repair. However, functional validation was not performed in this study, and effects on fusion, myonuclear accretion, or neuromuscular remodeling remain to be tested. These transcriptional changes occur without major alterations in structural genes expression, suggesting that MRF4 influences the transcriptional regulation of pathways linked to myonuclear accretion, cell–cell adhesion, and synaptic remodeling rather than the baseline expression program of the contractile apparatus.
Altered muscle mRNA levels of GHR, IGF1, FGF6, and MSTN observed in this study further highlight coordinated changes among growth-related signaling transcripts alongside myogenic regulators in adult fast skeletal muscle. The GH–IGF system is a principal driver of post-larval muscle growth in teleosts, supporting both myofiber hypertrophy and hyperplasia through endocrine, paracrine, and autocrine mechanisms involving IGF1 and its receptor [5,19]. In the present study, increased expression of GHR and FGF6, together with reduced IGF1 mRNA and unchanged MSTN levels, indicates differential regulation of growth-related signaling transcripts within muscle tissues. Similar uncoupling between GHR and IGF1 expressions has been reported in teleost models of fasting, refeeding, and compensatory growth, where muscle growth is sustained through changes in receptor abundance and downstream signaling rather than the simple upregulation of the IGF1 transcript levels [19,56]. As circulating hormone levels (for example GH or IGF) or downstream signaling activity were not measured in this experiment, these findings should be interpreted as local transcriptional changes rather than evidence of systemic endocrine regulation. In the context of MRF4 loss, these transcriptional differences may co-occur with transcriptional compensation by MyoG and MEF2 paralogs and may be relevant to growth regulation, although functional outcomes remain to be tested. This association between MRF4 deficiency and altered FGF6 expression in Nile tilapia is also consistent with observations in MRF4-null mice, in which FGF6 is dysregulated in the myotome [21].
Taken together, the present data support a model in which MRF4 acts as a central node that constrains MEF2 activity, transcripts encoding fusion-related factors, and selected growth-related signaling transcripts (e.g., GHR and FGF6) in adult fast skeletal muscle. Loss of MRF4 leads to a coordinated transcriptional remodeling program that includes upregulation of MyoG, MEF2B, MEF2D, Twist1, ID1, PLAU, CDH15, CHRNG, NCAM1, MYMK, GHR, and FGF6, while preserving the basal expression of major structural and contractile transcripts as well as MSTN. Overall, these results indicate coordinated transcriptional reconfiguration of regulatory and adhesion-related transcriptional programs together with altered expression of growth-related signaling transcripts without broad shifts in baseline structural/contractile gene expression. This study quantifies mRNA abundance in adult fast skeletal muscle and therefore supports transcriptional associations rather than demonstrated functional outcomes. Histological analyses, quantitative morphometry, protein-level assays, cellular measurements of myoblast fusion or satellite-cell activity, or growth and performance phenotypes were not performed. Accordingly, whether the observed transcriptional patterns translate into changes in muscle cellularity, remodeling, or aquaculture-relevant traits remains to be determined. Future work using stable genome-edited lines, quantitative morphometry, satellite-cell lineage tracing, and functional performance assays will be required to determine how these molecular changes translate into long-term effects on muscle cellularity, fiber-type composition, and aquaculture relevant production traits in Nile tilapia.

5. Conclusions

This study demonstrates that CRISPR/Cas9-mediated disruption of MRF4 in Nile tilapia induces a robust compensatory response in the myogenic transcriptional network without altering the steady-state mRNA abundance of transcripts encoding major structural and contractile genes. MRF4-crispants showed strong upregulation of MyoG and moderate induction of MyoD, together with isoform-specific activation of MEF2B and MEF2D, indicating that these factors collectively buffer the loss of a late myogenic regulator and help maintain the baseline fast-muscle structural/contractile transcriptional program along the trunk–belly–head axis. Non-myotomal regulators, cell adhesion and fusion-related transcripts, and growth-related signaling transcripts (GHR, IGF1, and FGF6) also showed altered expression, whereas MSTN remained stable, pointing to a coordinated adjustment of regulatory and extracellular programs with changes in growth-related signaling at the transcript level rather than wholesale reprogramming of structural gene expression. These findings identify MRF4, MyoG, MEF2B, MEF2D, and the GHR and FGF6 transcriptional changes as part of key growth-related transcriptional modules in Nile tilapia. In broader aquaculture context, the results provide a mechanistic framework that may guide future genome editing or selective breeding strategies that prioritize regulatory factors rather than structural genes, to enhance muscle production while preserving fundamental aspects of fast-muscle identity in farmed fish.

Supplementary Materials

The following supporting information can be downloaded at: https://www.mdpi.com/article/10.3390/fishes11010052/s1, Table S1. Summary statistics and multiple-testing–corrected differential expression for qRT-PCR targets in WT and MRF4-crispant Nile tilapia.

Author Contributions

Conceptualization, Z.P.S. and K.H.K.; methodology, Z.P.S. and K.H.K.; validation, K.H.K. and C.Y.C.; investigation, Z.P.S., Y.C. and D.C.; data curation, Z.P.S., Y.C. and D.C.; formal analysis, Z.P.S.; visualization, Z.P.S.; writing—original draft preparation, Z.P.S.; writing—review and editing, K.H.K. and C.Y.C.; resources, K.H.K.; supervision, K.H.K.; project administration, K.H.K.; funding acquisition, K.H.K. All authors have read and agreed to the published version of the manuscript.

Funding

This research was supported by the Regional Innovation System & Education (RISE) program through the Jeollanamdo RISE center, funded by the Ministry of Education (MOE) and the Jeollanam-do Provincial Government, Republic of Korea [2025-RISE-14-007].

Institutional Review Board Statement

This study was conducted in accordance with the guidelines of the Institutional Animal Care and Use Committee of Chonnam National University (CNU IACUC), under approval number of CNU IACUC-YS-2025-13 (Approval date: 20 October 2025), and in accordance with the 14th Article of the Korean Animal Protection Law. Fish were cared for in accordance with the Guidelines for Animal Experiments of Chonnam National University.

Data Availability Statement

The original contributions presented in this study are included in the article/Supplementary Material. Further inquiries can be directed to the corresponding author.

Conflicts of Interest

The authors declare no conflicts of interest.

References

  1. FAO. Species Analysis: Tilapia. FAO GLOBEFISH. 2025. Available online: https://www.fao.org/in-action/globefish/species-analysis/tilapia/en (accessed on 10 November 2025).
  2. El-Sayed, A.-F.M.; Fitzsimmons, K. From Africa to the world: The journey of Nile tilapia. Rev. Aquac. 2023, 15, 1887–1916. [Google Scholar] [CrossRef] [Scilit]
  3. Rescan, P.Y. Muscle growth patterns and regulation during fish ontogeny. Gen. Comp. Endocrinol. 2005, 142, 111–116. [Google Scholar] [CrossRef] [Scilit]
  4. Rescan, P.Y.; Montfort, J.; Rallière, C.; Le Cam, A.; Esquerré, D.; Hugot, K. Dynamic gene expression in fish muscle during recovery growth induced by a fasting-refeeding schedule. BMC Genom. 2007, 8, 438. [Google Scholar] [CrossRef] [Scilit]
  5. Johnston, I.A.; Bower, N.I.; Macqueen, D.J. Growth and the regulation of myotomal muscle mass in teleost fish. J. Exp. Biol. 2011, 214, 1617–1628. [Google Scholar] [CrossRef] [Scilit] [PubMed]
  6. Wright, W.E.; Sassoon, D.A.; Lin, V.K. Myogenin, a factor regulating myogenesis, has a domain homologous to MyoD. Cell 1989, 56, 607–617. [Google Scholar] [CrossRef] [Scilit] [PubMed]
  7. Braun, T.; Gautel, M. Transcriptional mechanisms regulating skeletal muscle differentiation, growth and homeostasis. Nat. Rev. Mol. Cell Biol. 2011, 12, 349–361. [Google Scholar] [CrossRef] [Scilit] [PubMed]
  8. Potthoff, M.J.; Arnold, M.A.; McAnally, J.; Richardson, J.A.; Bassel-Duby, R.; Olson, E.N. Regulation of skeletal muscle sarcomere integrity and postnatal muscle function by Mef2c. Mol. Cell Biol. 2007, 27, 8143–8151. [Google Scholar] [CrossRef] [Scilit]
  9. Hasty, P.; Bradley, A.; Morris, J.H.; Edmondson, D.G.; Venuti, J.M.; Olson, E.N.; Klein, W.H. Muscle Deficiency and Neonatal Death in Mice with a Targeted Mutation in the Myogenin Gene. Nature 1993, 364, 501–506. [Google Scholar] [CrossRef] [Scilit]
  10. Venuti, J.M.; Morris, J.H.; Vivian, J.L.; Olson, E.N.; Klein, W.H. Myogenin is required for late but not early aspects of myogenesis during mouse development. J. Cell Biol. 1995, 128, 563–576. [Google Scholar] [CrossRef] [Scilit]
  11. Ganassi, M.; Badodi, S.; Wanders, K.; Zammit, P.S.; Hughes, S.M. Myogenin is an essential regulator of adult myofibre growth and muscle stem cell homeostasis. eLife 2020, 9, e60445. [Google Scholar] [CrossRef] [Scilit]
  12. Vivian, J.L.; Olson, E.N.; Klein, W.H. Thoracic skeletal defects in myogenin- and MRF4-deficient mice correlate with early defects in myotome and intercostal musculature. Dev. Biol. 2000, 224, 29–41. [Google Scholar] [CrossRef] [Scilit] [PubMed]
  13. Zhu, Z.; Miller, J.B. MRF4 can substitute for myogenin during early stages of myogenesis. Dev. Dyn. 1997, 209, 233–241. [Google Scholar] [CrossRef]
  14. Sukhan, Z.P.; Cho, Y.; Hossen, S.; Cho, D.H.; Kho, K.H. Molecular characterization, expression analysis, and CRISPR/Cas9 mediated gene disruption of myogenic regulatory factor 4 (MRF4) in Nile tilapia. Curr. Issues Mol. Biol. 2024, 46, 13725–13745. [Google Scholar] [CrossRef] [Scilit] [PubMed]
  15. Moretti, I.; Ciciliot, S.; Dyar, K.A.; Abraham, R.; Murgia, M.; Agatea, L.; Akimoto, T.; Bicciato, S.; Forcato, M.; Pierre, P.; et al. MRF4 negatively regulates adult skeletal muscle growth by repressing MEF2 activity. Nat. Commun. 2016, 7, 12397. [Google Scholar] [CrossRef] [Scilit]
  16. Black, B.L.; Olson, E.N. Transcriptional control of muscle development by myocyte enhancer factor-2 (MEF2) proteins. Annu. Rev. Cell Dev. Biol. 1998, 14, 167–196. [Google Scholar] [CrossRef] [Scilit]
  17. Taylor, M.V.; Hughes, S.M. Mef2 and the skeletal muscle differentiation program. Semin. Cell Dev. Biol. 2017, 72, 33–44. [Google Scholar] [CrossRef] [Scilit]
  18. Macqueen, D.J.; Johnston, I.A. A well-constrained estimate for the timing of the salmonid whole genome duplication reveals major decoupling from species diversification. Proc. Biol. Sci. 2014, 281, 20132881. [Google Scholar] [CrossRef] [Scilit]
  19. Fuentes, E.N.; Valdés, J.A.; Molina, A.; Björnsson, B.T. Regulation of skeletal muscle growth in fish by the growth hormone–insulin-like growth factor system. Gen. Comp. Endocrinol. 2013, 192, 136–148. [Google Scholar] [CrossRef] [Scilit]
  20. Vélez, E.J.; Lutfi, E.; Azizi, S.; Montserrat, N.; Riera-Codina, M.; Capilla, E.; Navarro, I.; Gutiérrez, J. Contribution of in vitro myocytes studies to understanding fish muscle physiology. Comp. Biochem. Physiol. B Biochem. Mol. Biol. 2016, 199, 67–73. [Google Scholar] [CrossRef] [Scilit]
  21. Patapoutian, A.; Yoon, J.K.; Miner, J.H.; Wang, S.; Stark, K.; Wold, B. Disruption of the mouse MRF4 gene identifies multiple waves of myogenesis in the myotome. Development 1995, 121, 3347–3358. [Google Scholar] [CrossRef] [Scilit]
  22. Khalil, K.; Elayat, M.; Khalifa, E.; Daghash, S.; Elaswad, A.; Miller, M.; Abdelrahman, H.; Ye, Z.; Odin, R.; Drescher, D.; et al. Generation of myostatin gene-edited channel catfish (Ictalurus punctatus) via zygote injection of CRISPR/Cas9 system. Sci. Rep. 2017, 7, 7301. [Google Scholar] [CrossRef] [Scilit] [PubMed]
  23. Kishimoto, K.; Washio, Y.; Yoshiura, Y.; Toyoda, A.; Ueno, T.; Fukuyama, H.; Kinoshita, M. Production of a breed of red sea bream Pagrus major with an increase of skeletal muscle mass and reduced body length by genome editing with CRISPR/Cas9. Aquaculture 2018, 495, 415–427. [Google Scholar] [CrossRef] [Scilit]
  24. Ou, M.; Wang, F.; Li, K.; Wu, Y.; Huang, S.; Luo, Q.; Liu, H.; Zhang, X.; Fei, S.; Chen, K.; et al. Generation of myostatin gene-edited blotched snakehead (Channa maculata) using CRISPR/Cas9 system. Aquaculture 2023, 563, 738988. [Google Scholar] [CrossRef] [Scilit]
  25. Sun, T.; Meng, X.; Li, Y.; Zhang, H.; He, R.; He, R.; Liu, T.; Lv, W.; Xu, X.; Shen, Y.; et al. CRISPR/Cas9-mediated myostatin b knockout enhances growth performance and muscle hypertrophy in grass carp (Ctenopharyngodon idella). Aquaculture 2025, 613, 743355. [Google Scholar] [CrossRef] [Scilit]
  26. Kho, K.H.; Sukhan, Z.P.; Cho, Y.; Cho, D.; Choi, C.Y. Genome-Edited Fish in the Field. Curr. Issues Mol. Biol. 2025, 47, 1013. [Google Scholar] [CrossRef] [Scilit]
  27. Mege, R.M.; Goudou, D.; Diaz, C.; Nicolet, M.; Garcia, L.; Geraud, G.; Rieger, F. N-cadherin and N-CAM in myoblast fusion: Compared localisation and effect of blockade by peptides and antibodies. J. Cell Sci. 1992, 103, 897–906. [Google Scholar] [CrossRef] [Scilit]
  28. Cifuentes-Diaz, C.; Nicolet, M.; Goudou, D.; Rieger, F.; Mège, R.M. N-cadherin and N-CAM-mediated adhesion in development and regeneration of skeletal muscle. Neuromuscul. Disord. 1993, 3, 361–365. [Google Scholar] [CrossRef] [Scilit]
  29. Charlton, C.A.; Mohler, W.A.; Blau, H.M. Neural cell adhesion molecule (NCAM) and myoblast fusion. Dev. Biol. 2000, 221, 112–119. [Google Scholar] [CrossRef] [Scilit]
  30. Millay, D.P.; O’Rourke, J.R.; Sutherland, L.B.; Bezprozvannaya, S.; Shelton, J.M.; Bassel-Duby, R.; Olson, E.N. Myomaker is a membrane activator of myoblast fusion and muscle formation. Nature 2013, 499, 301–305. [Google Scholar] [CrossRef] [Scilit]
  31. Millay, D.P.; Sutherland, L.B.; Bassel-Duby, R.; Olson, E.N. Myomaker is essential for muscle regeneration. Genes Dev. 2014, 28, 1641–1646. [Google Scholar] [CrossRef] [Scilit]
  32. Benezra, R.; Davis, R.L.; Lockshon, D.; Turner, D.L.; Weintraub, H. The protein Id: A negative regulator of helix-loop-helix DNA binding proteins. Cell 1990, 61, 49–59. [Google Scholar] [CrossRef] [Scilit]
  33. Wallin, J.; Wilting, J.; Koseki, H.; Fritsch, R.; Christ, B.; Balling, R. The role of Pax-1 in axial skeleton development. Development 1994, 120, 1109–1121. [Google Scholar] [CrossRef] [Scilit]
  34. Suelves, M.; Vidal, B.; Ruiz, V.; Baeza-Raja, B.; Diaz-Ramos, A.; Cuartas, I.; Lluis, F.; Parra, M.; Jardi, M.; Lopez-Alemany, R.; et al. The plasminogen activation system in skeletal muscle regeneration: Antagonistic roles of urokinase-type plasminogen activator (uPA) and its inhibitor (PAI-1). Front. Biosci. 2005, 10, 2978–2985. [Google Scholar] [CrossRef] [Scilit] [PubMed]
  35. Philippou, A.; Maridaki, M.; Koutsilieris, M. The role of urokinase-type plasminogen activator (uPA) and transforming growth factor beta 1 (TGFβ1) in muscle regeneration. Vivo 2008, 22, 735–750. [Google Scholar]
  36. Qin, Q.; Xu, Y.; He, T.; Qin, C.; Xu, J. Normal and disease-related biological functions of Twist1 and underlying molecular mechanisms. Cell Res. 2012, 22, 90–106. [Google Scholar] [CrossRef] [Scilit] [PubMed]
  37. Li, M.; Dai, S.; Liu, X.; Xiao, H.; Wang, D. A detailed procedure for CRISPR/Cas9-mediated gene editing in tilapia. Hydrobiologia 2021, 848, 3865–3881. [Google Scholar] [CrossRef] [Scilit]
  38. Sukhan, Z.P.; Cho, Y.; Hossen, S.; Yang, S.W.; Hwang, N.Y.; Lee, W.K.; Kho, K.H. Functional characterization of three GnRH isoforms in small yellow croaker Larimichthys polyactis maintained in captivity: Special emphasis on reproductive dysfunction. Biology 2022, 11, 1200. [Google Scholar] [CrossRef] [Scilit]
  39. Nabeshima, Y.; Hanaoka, K.; Hayasaka, M.; Esumi, E.; Li, S.; Nonaka, I.; Nabeshima, Y. Myogenin gene disruption results in perinatal lethality because of severe muscle defect. Nature 1993, 364, 532–535. [Google Scholar] [CrossRef] [Scilit]
  40. Lazure, F.; Blackburn, D.M.; Corchado, A.H.; Sahinyan, K.; Karam, N.; Sharanek, A.; Nguyen, D.; Lepper, C.; Najafabadi, H.S.; Perkins, T.J.; et al. Myf6/MRF4 is a myogenic niche regulator required for the maintenance of the muscle stem cell pool. EMBO Rep. 2020, 21, e49499. [Google Scholar] [CrossRef] [Scilit]
  41. Hinterberger, T.J.; Sassoon, D.A.; Rhodes, S.J.; Konieczny, S.F. Expression of the muscle regulatory factor MRF4 during somite and skeletal myofiber development. Dev. Biol. 1991, 147, 144–156. [Google Scholar] [CrossRef] [Scilit]
  42. Arnold, H.H.; Winter, B. Muscle differentiation: More complexity to the network of myogenic regulators. Curr. Opin. Genet. Dev. 1998, 8, 539–544. [Google Scholar] [CrossRef] [Scilit] [PubMed]
  43. Potthoff, M.J.; Olson, E.N. MEF2: A central regulator of diverse developmental programs. Development 2007, 134, 4131–4140. [Google Scholar] [CrossRef] [Scilit] [PubMed]
  44. Estrella, N.L.; Desjardins, C.A.; Nocco, S.E.; Clark, A.L.; Maksimenko, Y.; Naya, F.J. MEF2 transcription factors regulate distinct gene programs in mammalian skeletal muscle differentiation. J. Biol. Chem. 2015, 290, 1256–1268. [Google Scholar] [CrossRef] [Scilit] [PubMed]
  45. Pon, J.R.; Marra, M.A. MEF2 transcription factors: Developmental regulators and emerging cancer genes. Oncotarget 2016, 7, 2297–2312. [Google Scholar] [CrossRef] [Scilit]
  46. Rescan, P.Y. New insights into skeletal muscle development and growth in teleost fishes. J. Exp. Zool. B Mol. Dev. Evol. 2008, 310, 541–548. [Google Scholar] [CrossRef] [Scilit]
  47. Spicer, D.B.; Rhee, J.; Cheung, W.L.; Lassar, A.B. Inhibition of myogenic bHLH and MEF2 transcription factors by the bHLH protein Twist. Science 1996, 272, 1476–1480. [Google Scholar] [CrossRef] [Scilit]
  48. Roschger, C.; Cabrele, C. The Id-protein family in developmental and cancer-associated pathways. Cell Commun. Signal. 2017, 15, 7. [Google Scholar] [CrossRef]
  49. DiPasquale, D.M.; Cheng, M.; Billich, W.; Huang, S.A.; van Rooijen, N.; Hornberger, T.A.; Koh, T.J. Urokinase-type plasminogen activator and macrophages are required for skeletal muscle hypertrophy in mice. Am. J. Physiol. Cell Physiol. 2007, 293, C1278–C1285. [Google Scholar] [CrossRef] [Scilit]
  50. Sisson, T.H.; Nguyen, M.H.; Yu, B.; Novak, M.L.; Simon, R.H.; Koh, T.J. Urokinase-type plasminogen activator increases hepatocyte growth factor activity required for skeletal muscle regeneration. Blood 2009, 114, 5052–5061. [Google Scholar] [CrossRef] [Scilit]
  51. Furumoto, T.A.; Miura, N.; Akasaka, T.; Mizutani-Koseki, Y.; Sudo, H.; Fukuda, K.; Maekawa, M.; Yuasa, S.; Fu, Y.; Moriya, H.; et al. Notochord-dependent expression of MFH1 and PAX1 cooperates to maintain the proliferation of sclerotome cells during the vertebral column development. Dev. Biol. 1999, 210, 15–29. [Google Scholar] [CrossRef] [Scilit]
  52. Sivakamasundari, V.; Kraus, P.; Sun, W.; Hu, X.; Lim, S.L.; Prabhakar, S.; Lufkin, T. A developmental transcriptomic analysis of Pax1 and Pax9 in embryonic intervertebral disc development. Biol. Open 2017, 6, 187–199. [Google Scholar] [CrossRef] [Scilit]
  53. Morgan, N.V.; Brueton, L.A.; Cox, P.; Greally, M.T.; Tolmie, J.; Pasha, S.; Aligianis, I.A.; van Bokhoven, H.; Marton, T.; Al-Gazali, L.; et al. Mutations in the embryonal subunit of the acetylcholine receptor (CHRNG) cause lethal and Escobar variants of multiple pterygium syndrome. Am. J. Hum. Genet. 2006, 79, 390–395. [Google Scholar] [CrossRef] [Scilit]
  54. Michalk, A.; Stricker, S.; Becker, J.; Rupps, R.; Pantzar, T.; Miertus, J.; Botta, G.; Naretto, V.G.; Janetzki, C.; Yaqoob, N.; et al. Acetylcholine receptor pathway mutations explain various fetal akinesia deformation sequence disorders. Am. J. Hum. Genet. 2008, 82, 464–476. [Google Scholar] [CrossRef] [Scilit]
  55. Luo, W.; Li, E.; Nie, Q.; Zhang, X. Myomaker, regulated by MYOD, MYOG and miR-140-3p, promotes chicken myoblast fusion. Int. J. Mol. Sci. 2015, 16, 26186–26201. [Google Scholar] [CrossRef] [Scilit]
  56. Hinits, Y.; Osborn, D.P.; Hughes, S.M. Differential requirements for myogenic regulatory factors distinguish medial and lateral somitic, cranial and fin muscle fibre populations. Development 2009, 136, 403–414. [Google Scholar] [CrossRef] [Scilit]
Figure 1. Relative mRNA expression of myogenic regulatory factor (MRF) genes in trunk, belly, and head muscles of wild-type (WT) and MRF4-crispant Nile tilapia. (A) MRF4, (B) MRF5, (C) MyoG, and (D) MyoD. The red circles in each graph represent individual data points, serving as biological replicates. Asterisks above the bars indicate FDR-adjusted significance (* q < 0.05; ** q < 0.01; **** q < 0.0001), whereas ‘ns’ denotes not significant.
Fishes 11 00052 g001
Figure 2. Relative mRNA expression levels of Myocyte Enhancer Factor 2 (MEF2) genes in the trunk, belly, and head muscles of WT and MRF4-crispant Nile tilapia. (A) MEF2A, (B) MEF2B, (C) MEF2C, and (D) MEF2D. The red circles in each bar graph represent individual data points, serving as biological replicates. Asterisks above the bars denote FDR-adjusted significance (* q < 0.05; **** q < 0.0001), and ‘ns’ indicates not significant.
Fishes 11 00052 g002
Figure 3. Relative mRNA expression levels of structural and contractile related genes in the trunk, belly, and head muscles of wild-type (WT) and MRF4-crispant Nile tilapia. (A) Acta1a, (B) MHC-fast, (C) MLC1F, and (D) CKM. The red circles in each bar graph represent individual data points, serving as biological replicates. “ns” above the bars indicates no significant differences between WT and MRF4-crispants within each muscle region after FDR correction (FDR-adjusted q > 0.05).
Fishes 11 00052 g003
Figure 4. Relative mRNA expression levels of non-myotomal regulatory genes in the trunk, belly, and head muscles of wild-type (WT) and MRF4-crispant Nile tilapia. (A) Pax1, (B) Twist1, (C) ID1, and (D) PLAU. The red circles in each bar graph represent individual data points, serving as biological replicates. Asterisks above the bars denote FDR-adjusted significance ** q < 0.01; *** q < 0.001; **** q < 0.0001, and ‘ns’ indicates not significant.
Fishes 11 00052 g004
Figure 5. Relative mRNA expression levels of cell-adhesion and fusion-related genes in the trunk, belly, and head muscles of WT and MRF4-crispant Nile tilapia. (A) CDH15, (B) CHRNG, (C) NCAM1, and (D) MYMK. The red circles in each bar graph represent individual data points, serving as biological replicates. Asterisks above the bars denote FDR-adjusted significance (* q < 0.05; ** q < 0.01; *** q < 0.001; **** q < 0.0001).
Fishes 11 00052 g005
Figure 6. Relative mRNA expression levels of growth and proliferation regulatory genes in the trunk, belly, and head muscles of WT and MRF4-crispant Nile tilapia. (A) GHR, (B) IGF1, (C) FGF6, and (D) MSTN. The red circles in each bar graph represent individual data points, serving as biological replicates. Asterisks above the bars denote FDR-adjusted significance (* q < 0.05; ** q < 0.01; *** q < 0.001), and ‘ns’ indicates not significant.
Fishes 11 00052 g006
Figure 7. Regulator network schematic summarizing transcript-level responses to MRF4 disruption in Nile tilapia skeletal muscle. CRISPR/Cas9-mediated disruption of MRF4 is associated with coordinated changes in mRNA abundance across myogenic regulators, MEF2 regulators, non-myotomal regulators, cell adhesion and fusion transcripts, and growth-related signaling transcripts, while major structural and contractile transcripts remain largely unchanged. Symbols indicate direction of change (↑ upregulated, ↓ downregulated, — no significant change). Arrows denote putative associations inferred from coordinated mRNA patterns and known gene functions; this schematic does not represent experimentally validated regulatory interactions or functional phenotypic outcomes.
Fishes 11 00052 g007
Table 1. Functional classification of growth-related genes analyzed in WT and MRF4-crispant fish.
Functional GroupRepresentative GenesPrimary Functional Role
  • Myogenic regulatory factors (MRFs)
Myogenic regulatory factor 4 (MRF4),
Myogenic regulatory factor 5 (MRF5),
Myogenin (MyoG),
Myoblast determination protein (MyoD)
Core transcription factors driving myogenic lineage determination, differentiation, and maintenance of mature myofibers.
2.
Myocyte enhancer factors (MEF2 family)
Myocyte enhancer factor 2A (MEF2A),
Myocyte enhancer factor 2B (MEF2B),
Myocyte enhancer factor 2C (MEF2C),
Myocyte enhancer factor 2D (MEF2D)
Transcriptional co-activators that coordinate expression of structural and contractile genes function synergistically with MRFs during late myogenesis.
3.
Structural/Contractile Genes
Actin alpha 1, skeletal muscle (Acta1a),
Myosin heavy chain, fast skeletal muscle (MHC-fast)
Myosin light chain 1, fast skeletal muscle (MLC1F),
Creatine kinase, muscle-type (CKM)
Encode sarcomeric actin and myosin isoforms and energy-buffering enzymes essential for muscle contraction and muscle fiber identity.
4.
Non-myotomal/somatic genes
Paired box gene 1 (Pax1),
Twist family bHLH transcription factor 1 (Twist1),
Inhibitor of DNA binding 1 (ID1),
Urokinase-type plasminogen activator (PLAU)
Expressed mainly in sclerotome-derived or connective tissues; regulate progenitor maintenance, ECM remodeling, and non-myogenic cell lineages.
5.
Cell adhesion and fusion molecules
Cadherin 15 (CDH15),
Cholinergic receptor nicotinic gamma subunit (CHRNG),
Neural cell adhesion molecule 1 (NCAM1),
Myomaker (MYMK)
Mediate myoblast recognition, adhesion, and membrane fusion; support neuromuscular junction formation and reinnervation during growth or repair.
6.
Growth and Proliferation Regulators
Growth hormone receptor (GHR),
Insulin-like growth factor 1 (IGF1),
Fibroblast growth factor 6 (FGF6),
Myostatin (MSTN)
Control hyperplasia and hypertrophy via the GH–IGF and FGF pathways; MSTN acts as a negative feedback inhibitor of muscle growth.
Table 2. Primer details that are used in the qRT-PCR gene expression analysis.
Primer NameSequence (5′–3′)Accession No.Length (bp)
MRF4-FwTGGCAATGACAGCCCACTGPQ497691178
MRF4-RvCTTACGTCTATCCGTGGGAG
MyoG-FwTGTTGGAGTTGGAGTGACAGGU246725171
MyoG-RvCGTCTCTTCTCCCTCAGTGT
MRF5-FwTCCAGTACATCGAGAGCCTGXM_005456634172
MRF5-RvCCGTTGCTGTAGTTTGCATTC
MyoD-FwCAAGAGGAAGACGACCAACGGU246715170
MyoD-RvCGATGTAGCTGATGGCGTTG
MEF2a-FwTCATGGACGAAAGGAACAGGXM_025908678170
MEF2a-RvCAGCAACACTTTGTCCATGTC
MEF2b-FwGACCAGAGAAATAGACAGGTGXM_005478988160
MEF2b-RvGAACTTTGTCCATGTCTGTGC
MEF2c-FwAGATCACGCGGATTATGGATGXR_003213332173
MEF2c-RvCTTGTCCATGTCTGTGCTGG
MEF2d-FwCAGAGGATCACTGACGAACGXM_025911272171
MEF2d-RvGACCTTGTCCATGTCAGTGC
Acta1a-FwCACCAACTGGGATGACATGGXM_003454107173
Acta1a-RvCATACATGGCAGGGACATTG
MHC-FwCAGCATGGGTCAGATTACTGXM_003439446172
MHC-RvCTCACGCTGCTTCTGCTTGA
MLC1F-FwCCAGATTGCTGACATCATGCXM_003445298183
MLC1F-RvCATCCTCTTGTCCTGCCATG
CKM-FwGTGACGAGGAGTCCTATGAGXM_003449801185
CKM-RvCTTGATGCTGCGACCAGTAC
Pax1-FwAGCGAGGTACAACGAGACTGXM_003446220192
Pax1-RvCTAACCGACGGGACATTGTA
M-twist-FwTCATTCGACGACCTGCAGACXM_005462015201
M-twist -RvCAGCTCGTCGCTTTGTAGAAC
ID1-FwAGCCTGACCATCTCCAAGTGXM_003442650180
ID1-RvCTGCAGGTCCCAGATGTAGT
PLAU-FwCAGCTACCTGTGGATACAGCXM_013269037186
PLAU-RvGTGAGCTGCAGTGAGAATCC
CDH15-FwCTGCATTTGATGGAGACCTGMN641108187
CDH15-RvCCTGAGTCCGTGATTATGATG
CHRNG-FwTGCAATGGTGCGACTACAGGXM_005476216197
CHRNG-RvCCAGTACACACAGCCATCAG
NCAM1-FwTGAGGAGCCTGATTCAATGGXM_005458467166
NCAM1-RvGGACATCCTGACCTCATATG
MYMK-FwTCGCTGTGAGGATCTACCAGXM_013270882191
MYMK-RvCAGCATTAGAGCGAGAGCAC
GHR-FwCGATGAGACAGAGGATGTAGNM_001279601182
GHR-RvCTTCAGGGAGATCTGTGTTG
IGF1-FwTAGCCACACCCTCTCACTACAY919869210
IGF1-RvCAGCTTTGGAAGCAGCACTC
MSTN-FwTGACTTAGCTGTGACCTTCGKT987208177
MSTN-RvCCAAAGTCCTCGAAGTCCAC
FGF6-FwGCATCGGGTTTCACCTTCAGXM_003447051177
FGF6-RvCTGTCGTTCCGTATAACCTC
EF1a-FwGGTGTGAAGCAGCTCATCGAB075952187
EF1a-RvCACTGGTCTCCAGCATGTTG
Disclaimer/Publisher’s Note: The statements, opinions and data contained in all publications are solely those of the individual author(s) and contributor(s) and not of MDPI and/or the editor(s). MDPI and/or the editor(s) disclaim responsibility for any injury to people or property resulting from any ideas, methods, instructions or products referred to in the content.