Article

First Hybrid Genome Assembly of the Teleost Fish Red Cusk-Eel (Genypterus chilensis) from Oxford Nanopore and Illumina Reads: Comparative Genomic Analysis of Genypterus Species and Long Non-Coding RNA Tissue-Specific Expression


by
Phillip Dettleff
1,*,
Marcia Arriagada-Solimano
2,
Vania Fuentealba
1,2,
Karina Tobar
1,2,
Millaray Sáez
1,2,
Claudio Olave
1,
Juan Manuel Estrada
3 and
Juan Antonio Valdés
4,5
1
Escuela de Medicina Veterinaria, Facultad de Agronomía y Sistemas Naturales, Facultad de Ciencias Biológicas y Facultad de Medicina, Pontificia Universidad Católica de Chile, Santiago 7820436, Chile
2
Escuela de Medicina Veterinaria, Facultad de Ciencias Médicas, Universidad Bernardo O’Higgins, Santiago 8370993, Chile
3
Centro de Investigación Marina Quintay (CIMARQ), Universidad Andrés Bello, Quintay 2340000, Chile
4
Facultad de Ciencias de la Vida, Universidad Andrés Bello, Santiago 8370186, Chile
5
Interdisciplinary Center for Aquaculture Research—Applied Research (INCAR2), Concepción 4030000, Chile
*
Author to whom correspondence should be addressed.
Fishes 2026, 11(4), 244; https://doi.org/10.3390/fishes11040244
Submission received: 13 February 2026 / Revised: 14 April 2026 / Accepted: 15 April 2026 / Published: 17 April 2026
(This article belongs to the Special Issue Genetics and Breeding of Fishes)

Abstract

The red cusk-eel (Genypterus chilensis) is an endemic Chilean teleost fish of significant importance to fisheries and aquaculture; however, no reference genome is available for this species. In this study, we present the first hybrid genome assembly of G. chilensis using Nanopore long-reads and Illumina short-reads, integrated with structural and functional annotations from RNA-seq data of the intestine and head kidney. The resulting genome assembly was 439.89 Mb in size, with an N50 of 7.96 Mb, containing 35,029 coding genes. Comparative genomics with G. blacodes revealed high similarity in genome size and completeness. Additionally, 14,681 lncRNAs were annotated, with 641 lncRNAs and 7323 coding genes differentially expressed in a tissue-specific expression pattern. These findings provide a high-quality genomic resource that enhances the understanding of lncRNA regulation and genome structure in the Genypterus genus. This study establishes a foundation for future research on commercial traits, conservation, and the evolution of the Ophidiiformes order.
Key Contribution: In this study, we generate the first genome assembly of Genypterus chilensis, and the second genome of a Genypterus species worldwide. The functional annotation and long non-coding RNA annotation provide a better understanding of the genome structure in Genypterus species and the expression patterns in the intestine and head kidney.

1. Introduction

The red cusk-eel (Genypterus chilensis) is a teleost fish of the Ophidiiformes order, which includes 151 species of deep-sea fish [1], but despite its diversity, the order has few available genomes. The Ophidiiformes order includes the Genypterus genus, which has species that inhabit the Chilean, South African, New Zealand, Australian coasts, and the Atlantic coast of South America [2]. These species are relevant to artisanal fisheries and have become relevant to aquaculture in the last decade. In this sense, G. chilensis is part of the Chilean aquaculture diversification program, considering its high commercial value and its condition as an endemic species [3]. The complete biological cycle of this species has already been elucidated [4], as has the biological knowledge associated with growth, reproduction, immune response, and stress response [5,6,7,8]. However, its available genomic reference data is limited. There are currently only assemblies of different reference transcriptomes for this species, including reference transcriptomes for the skeletal muscle, liver, head kidney, and gills [8,9,10], but there is no reference genome, while only one reference genome is available for the Genypterus genus.
Next-generation sequencing technology has increased the capacity to generate new reference genomes in vertebrates, including several fish species [11]; at present, there are more than ~5300 available genomes for Gnathostomata species, though only seven of these are representative of the Ophidiiformes order. The availability of reference genomes and comparative genomics provides the resources for understanding genetic factors in fish, including commercial traits, reproduction, adaptability, disease resistance, and genome evolution [12]. Additionally, the availability of genome sequences allows the identification of molecular markers to evaluate genomic traits of relevance; it also allows population structure and species differentiation to be determined, on top of other genetic parameters of relevance [13,14,15,16,17]. Additionally, obtaining the reference genome of a species allows for the annotation of coding genes, as well as repetitive elements, including transposable elements and tandem repeats, and non-coding RNAs, such as microRNAs or lncRNAs [18,19]. LncRNAs are long non-coding RNAs (>200 nt) with key roles in biological processes, regulating gene expression at many levels [20], and they present less conservation across species, showing more specific cell/tissue patterns of expression [21]. Previous studies have examined the expression of lncRNAs in G. chilensis [22]; however, there is no genome annotation for lncRNAs in this species or knowledge of the pattern of expression in the intestine and its difference from that in the head kidney. In the present study, we generated an integrated genome assembly of G. chilensis with short and long reads, annotating coding, non-coding, and repetitive elements. Additionally, we evaluated the coding and lncRNA expression patterns in two relevant tissues, the intestine and head kidney, to understand how lncRNAs participate in coding regulation in a tissue-specific way in this species.

2. Materials and Methods

2.1. Genypterus chilensis Sampling, DNA and RNA Extraction

This study and all the procedures performed with G. chilensis individuals were approved by the ethical committee of animal care and the security in research committee of Pontificia Universidad Católica de Chile, as well as the bioethical committee of Andres Bello University (022/2023), following the guidelines of the National Research and Development Agency (ANID) of Chile.
To obtain genomic DNA for genome assembly, we used individuals of G. chilensis maintained in the Center of Marine Investigation of Quintay (CIMARQ). The fish were maintained under standard conditions (14 °C) with natural photoperiod conditions (12:12). A selected fish (69 cm in size and 1785 g in weight) was euthanized with an overdose of Benzocaine (Veterquimica, Santiago, Chile), and several samples of the skeletal muscle were collected. Additionally, the intestine and head kidney of this fish and five other fish were collected for posterior RNA extraction and transcriptome sequencing. All samples were collected in DNA/RNA shield (Zymo Research, Irvine, CA, USA) and maintained at −80 °C until DNA/RNA extraction.
Genomic DNA was extracted from the skeletal muscle samples using the Quick-DNA HMW MagBead Kit (Zymo Research), and integrity was evaluated via 1% agarose gel electrophoresis and quantified on a Qubit 4 fluorometer with the Qubit dsDNA BR Assay Kit (Invitrogen, Carlsbad, CA, USA). The extracted genomic DNA was used for sequencing with two approaches: long-read sequencing by Oxford Nanopore technology and short-read sequencing using Illumina technology.
RNA extraction was performed with the RNeasy Plus Universal Mini Kit (Qiagen, Hilden, Germany). Total RNA was quantified on a Qubit 4 fluorometer with the Qubit RNA BR Assay Kit (Invitrogen), and integrity was determined using a Fragment Analyzer (Advanced Analytical Technologies, Ankeny, IA, USA) with the Standard Sensitivity RNA analysis kit (Advanced Analytical Technologies) with RQN ≥ 8 and then used for library preparation.

2.2. DNA Illumina Sequencing, Genome Size Estimation and K-mer Analysis

The HMW DNA sample was used for short-read sequencing. Library preparation was performed using the TruSeq DNA Nano library preparation kit (Illumina, San Diego, CA, USA), library fragment size was determined with Fragment Analyzer with the HS NGS fragment analysis kit (Advanced Analytical Technologies), and the sequencing was conducted on a NovaSeq6000 platform (Illumina) by an external service provider, Macrogen Korea, with 150 bp paired-end sequencing, using a target coverage of 50x.
The quality of the sequenced reads was evaluated with FastQC [23] and filtered by fastp software [24] to remove adaptors, low-quality reads (length = min 30, phred quality = 30, Ns allowed in a read = 5), and low-quality bases (phred quality = 25). The filtered reads were used for estimation of genome size in G. chilensis with the K-mer-based method, a methodology used in several other species of fish, such as Squaliobarbus curriculus and Silurus lanzhouensis [12,25]. For K-mer determination of the genome, we used the paired-end short-reads of Illumina sequencing with the software Meryl v.1.3 [26], and graphical profiling was generated with GenomeScope v2.0 [27].

2.3. Whole Genome Sequencing with Oxford Nanopore

To generate an integrated genome assembly with short and long reads, the HMW DNA sample was used for library construction with the Ligation Sequencing Kit V14 (Oxford Nanopore, Oxford, UK), with a fragment size of 20 kb for long-read sequencing on a GridION platform (Oxford Nanopore) at the sequencing facility at Pontificia Universidad Católica de Chile. To avoid low-quality reads, the sequenced reads were filtered by fastplong [24], removing reads with adapter contamination, low-quality bases, and low-quality sequences considering previous parameters of quality, and a default length = min 200. After quality control, the remaining clean reads were used for subsequent analysis.

2.4. RNA Library Preparation and Sequencing

To improve genome annotation after genome assembly, we used the total RNA of the intestine and head kidney of five biological replicates to construct RNA-seq libraries with the TruSeq stranded mRNA kit (Illumina), and paired-end sequencing (150 bp) was conducted on a NovaSeq6000 platform (Illumina) by an external service (Macrogen Korea). The quality of fastq raw reads was evaluated with FastQC [23] and filtered by Trimmomatic software v0.39 [28] to remove the remaining adaptors, low-quality reads, and low-quality bases (min length 50; sliding window 4:20; seed mismatch 2; simple clip threshold 10).

2.5. Hybrid Genome Assembly with Long and Short Reads

To generate a high-quality contig assembly, we used a hybrid genome assembly approach, including Illumina paired-end short reads and Nanopore long reads. First, we performed the genome assembly using filtered long reads with the Flye assembler v2.9.6 [29] (option nano-raw, with automatic min. overlap determination), and then evaluated the genome assembly quality with Quast software v5.3 [30]. After assessing the initial quality of the long-read genome assembly, this was polished in a first step with Racon software v1.5 [31] using the Nanopore long reads (minimap2 with map-ont). The Racon output of the long-read-assembled contig was used for the second step of polishing using the Nanopore long-read data with Medaka software v1.7.2 [32] (model used = r941_min_high_g360; inference batch size = 100). Finally, the third step of polishing was performed using the Illumina paired-end short reads with Racon software v1.5 [31]. The quality of the polished genome assembly was evaluated with Quast software v5.3 [30]. Additionally, soft masking of the genome assembly was performed with Repeatmasker software v4.1.5 [33]. Non-target contaminants were removed using Kraken2 software v2.1.1 [34] with a confidence score of 0.3 considering the PlusPF database, as well as exclusion using class as taxonomic level, and remanent mitochondrial DNA was evaluated for removal, using blastn alignment (identity 95%, query coverage > 60%) and the mitochondrial genome data available at NCBI (RefSeq Mitochondrion database, release 230).

2.6. Structural and Functional Annotation with Transcriptome Sequencing

To generate the structural annotation of the genome assembly, we first used the RNA-seq data previously generated for the intestine and head kidney, mapping the libraries against the soft-masked and cleaned (from contaminants) genome assembly using RNAstar software v2.7.8 [35]. The generated BAM files were used to create the structural annotation using the Funannotate predict annotation module of Funannotate software v1.8.17 [36], with the latest version of Funannotate and the UniProtKb/SwissProt database (03-2025), prefiltering protein hits with Diamond v2.1.22, and also using in silico gene predictors Augustus v3.5.0 [37] and GeneMark-ETP v1.0 [38].
Functional annotation of the G. chilensis assembled genome was generated using eggNOG Mapper v2.1.8 [39] with database v5.0.2 and the BLOSUM62 matrix for protein functional annotation, Gene Ontology (GO), EC numbers, and KEGG identifiers. Additionally, functional annotation of protein families, including GO, was annotated with InterProScan v5.5 (database 5.59–91.0) [40]. The structural and functional annotations of the genome were integrated using the Funannotate functional module of Funannotate software v1.8.17 with the database eukaryota_odb10 [36], incorporating the GeneBank format annotation generated by the Funannotate predict annotation tool, eggNOG annotation, and InterProScan annotation, generating the final version of the annotated assembly of the G. chilensis genome.
To evaluate the quality of the assembled genome and its annotation, we used Benchmarking Universal Single-Copy Orthologs (BUSCO) software v5.4.6 [41], determining complete and single-copy, complete and duplicated, and fragmented and missing orthologous annotations.

2.7. Long Non-Coding RNA Annotation and Tissue-Specific Expression

In our study, we identified previous [22] and novel lncRNAs in the genome assembly of G. chilensis. For this, the unannotated transcripts, considering the mRNA output of the assembly, were used for a subsequent lncRNA identification pipeline. We applied several filters to remove protein-coding sequences, including removal of contigs with coverage below 50; removal of contigs with predicted open reading frames (ORFs) > 200 bp; evaluation of the coding potential of the remaining transcripts using the Coding Potential Assessment Tool (CPAT) v3.0.0 [42], removing those transcripts with CPAT scores > 0.38; identification of other classes of noncoding RNAs (such as tRNAs, rRNAs, snRNAs, and snoRNAs) in the remaining transcripts by searching against the Rfam v13.0 database [43]; and elimination of contigs annotated as coding in the protein annotation with Funannotate. The parameters used were previously determined as optimal in fishes of the Actinopterygii class (Danio rerio, Carassius Carassius, Oncorhynkus kisutch and Salmo salar) [44,45,46,47,48] and validated previously in G. chilensis [22]. A final set of lncRNAs was determined after this pipeline.
To determine the expression pattern of coding and lncRNAs, we mapped the intestine and head kidney RNA filtered reads against the annotated genome of G. chilensis, including the final set of lncRNA discovered, using RNA STAR software v2.7.11 [35], and evaluated the mapping for each individual/tissue with MultiQC v1.1 [49]. The expression values of unique reads were used as input for differential expression analysis with DESeq2 software v2.11.40 [49], which is based on a negative binomial distribution. We used a single model considering tissue as a factor to identify differentially expressed genes between the intestine and head kidney, with a log2 Fold Change > 2 and an adjusted p-value after false discovery rate (FDR) determination (adj. p-value < 0.05).
The enrichment analysis of differentially expressed genes was determined using the gene annotations with ShinyGO 0.85.1 [50], and those with FDR < 0.05 were determined as enriched processes.

2.8. Functional Comparison of Genypterus Genomes

To understand genomic differences within the Genypterus genus, we compared structural values and gene orthologs between the genome of G. blacodes available at NCBI (GCA_046128005.1), and the genome assembly of G. chilensis generated in this study. The comparison included total genome length, N50, number of contigs, number of scaffolds, and gene ortholog integrity using the BUSCO annotation of each genome.

3. Results

3.1. Hybrid Draft Genome Assembly of Genypterus chilensis

In our study, we conducted genome assembly of G. chilensis using long and short paired-end reads. The genome size estimation performed with Illumina DNA paired-end reads showed via the K-mer analysis (k = 21) (Figure S1) an estimated haploid genome size of ~483.8 Mb with a heterozygosity of 0.59% and repeat content of 19.81% (Table S1). For the genome assembly, a total of 7.77 Gb of Oxford Nanopore reads was generated, with a fragment size of 20 Kb. For the Illumina DNA sequencing, a total of 42.2 Gb of paired-end sequences was generated (150 bp), with 50x coverage. After filtering, a total of 619,684 long reads were obtained for Nanopore sequencing, and 268,450,288 paired-end reads were obtained for Illumina DNA sequencing (Table 1), generating 269 million of reads of total filtered data for the genome assembly.
The size of the hybrid assembled genome was 439.89 Mb, with 381 scaffolds. The final genome had 44.66% GC, with an N50 of 7.96 Mb (Table S2), representing a similar or higher value compared to some other teleost genome assemblies, such as Pagrus major (N50 = 2.8 Mb), Acanthopagrus latus (N50 = 2.6 Mb), Sparidentex hasta (N50 = 80 Kb), and G. blacodes (N50 = 4.8 Mb) [11,51,52].
The BUSCO (Benchmarking Universal Single-Copy Orthologs) analysis, considering Vertebrata and Actinopterygii databases, showed that 98.05% and 98.3% of the complete BUSCOs were present in the genome assembly of G. chilensis. This included 96.51% and 97.01% of the complete and single-copy BUSCOs, with 1.54% and 1.29% of duplicated genes using the Vertebrata and Actinopterygii databases, respectively (Table 2).
The data used for the assembly is available under Bioproject PRJNA1268014 (paired-end sequencing Illumina reads under SRR33710654, and long-sequencing Nanopore reads under SRR33710653), and genome assembly is available in DDBJ/ENA/GenBank under the accession JBWDHU000000000.

3.2. Repeat Identification, Masking, Gene Prediction, and Annotation of G. chilensis Genome

In our study, the repeated sequence analysis of the hybrid assembly of G. chilensis showed a total length of repetitive sequences of ~44.8 Mb, corresponding to 10.9% of the genome assembly. The single repeats represented 5.28% (51.8% of the repeated elements), and the interspersed repeats represented 4.22% (41.4% of the repeated elements). Among the most common interspersed repeats were DNA transposons (1.95%), long terminal repeats (LTRs) (0.58%), long interspersed elements (LINEs) (0.85%), and short interspersed elements (SINEs) (0.1%). The complete list of repeats in the genome is shown in Table 3.
The annotation of functional elements based on gene prediction and RNA-seq, as well as ortholog protein sequence-based predictions, showed a total of 35,029 genes (including 32,109 mRNAs coding for proteins, and 2920 coding for tRNA). There were 264,510 total exons, with an average size of 159.31 bp and an average size of the protein of 454.71 amino acids. The protein-coding genes were also functionally annotated in several databases, including 20,935 Gene Ontology (GO) annotations, 23,337 annotations with InterProScan, and 25,328 annotations with eggNOG.

3.3. Tissue-Specific Expression of Annotated Genes in G. chilensis

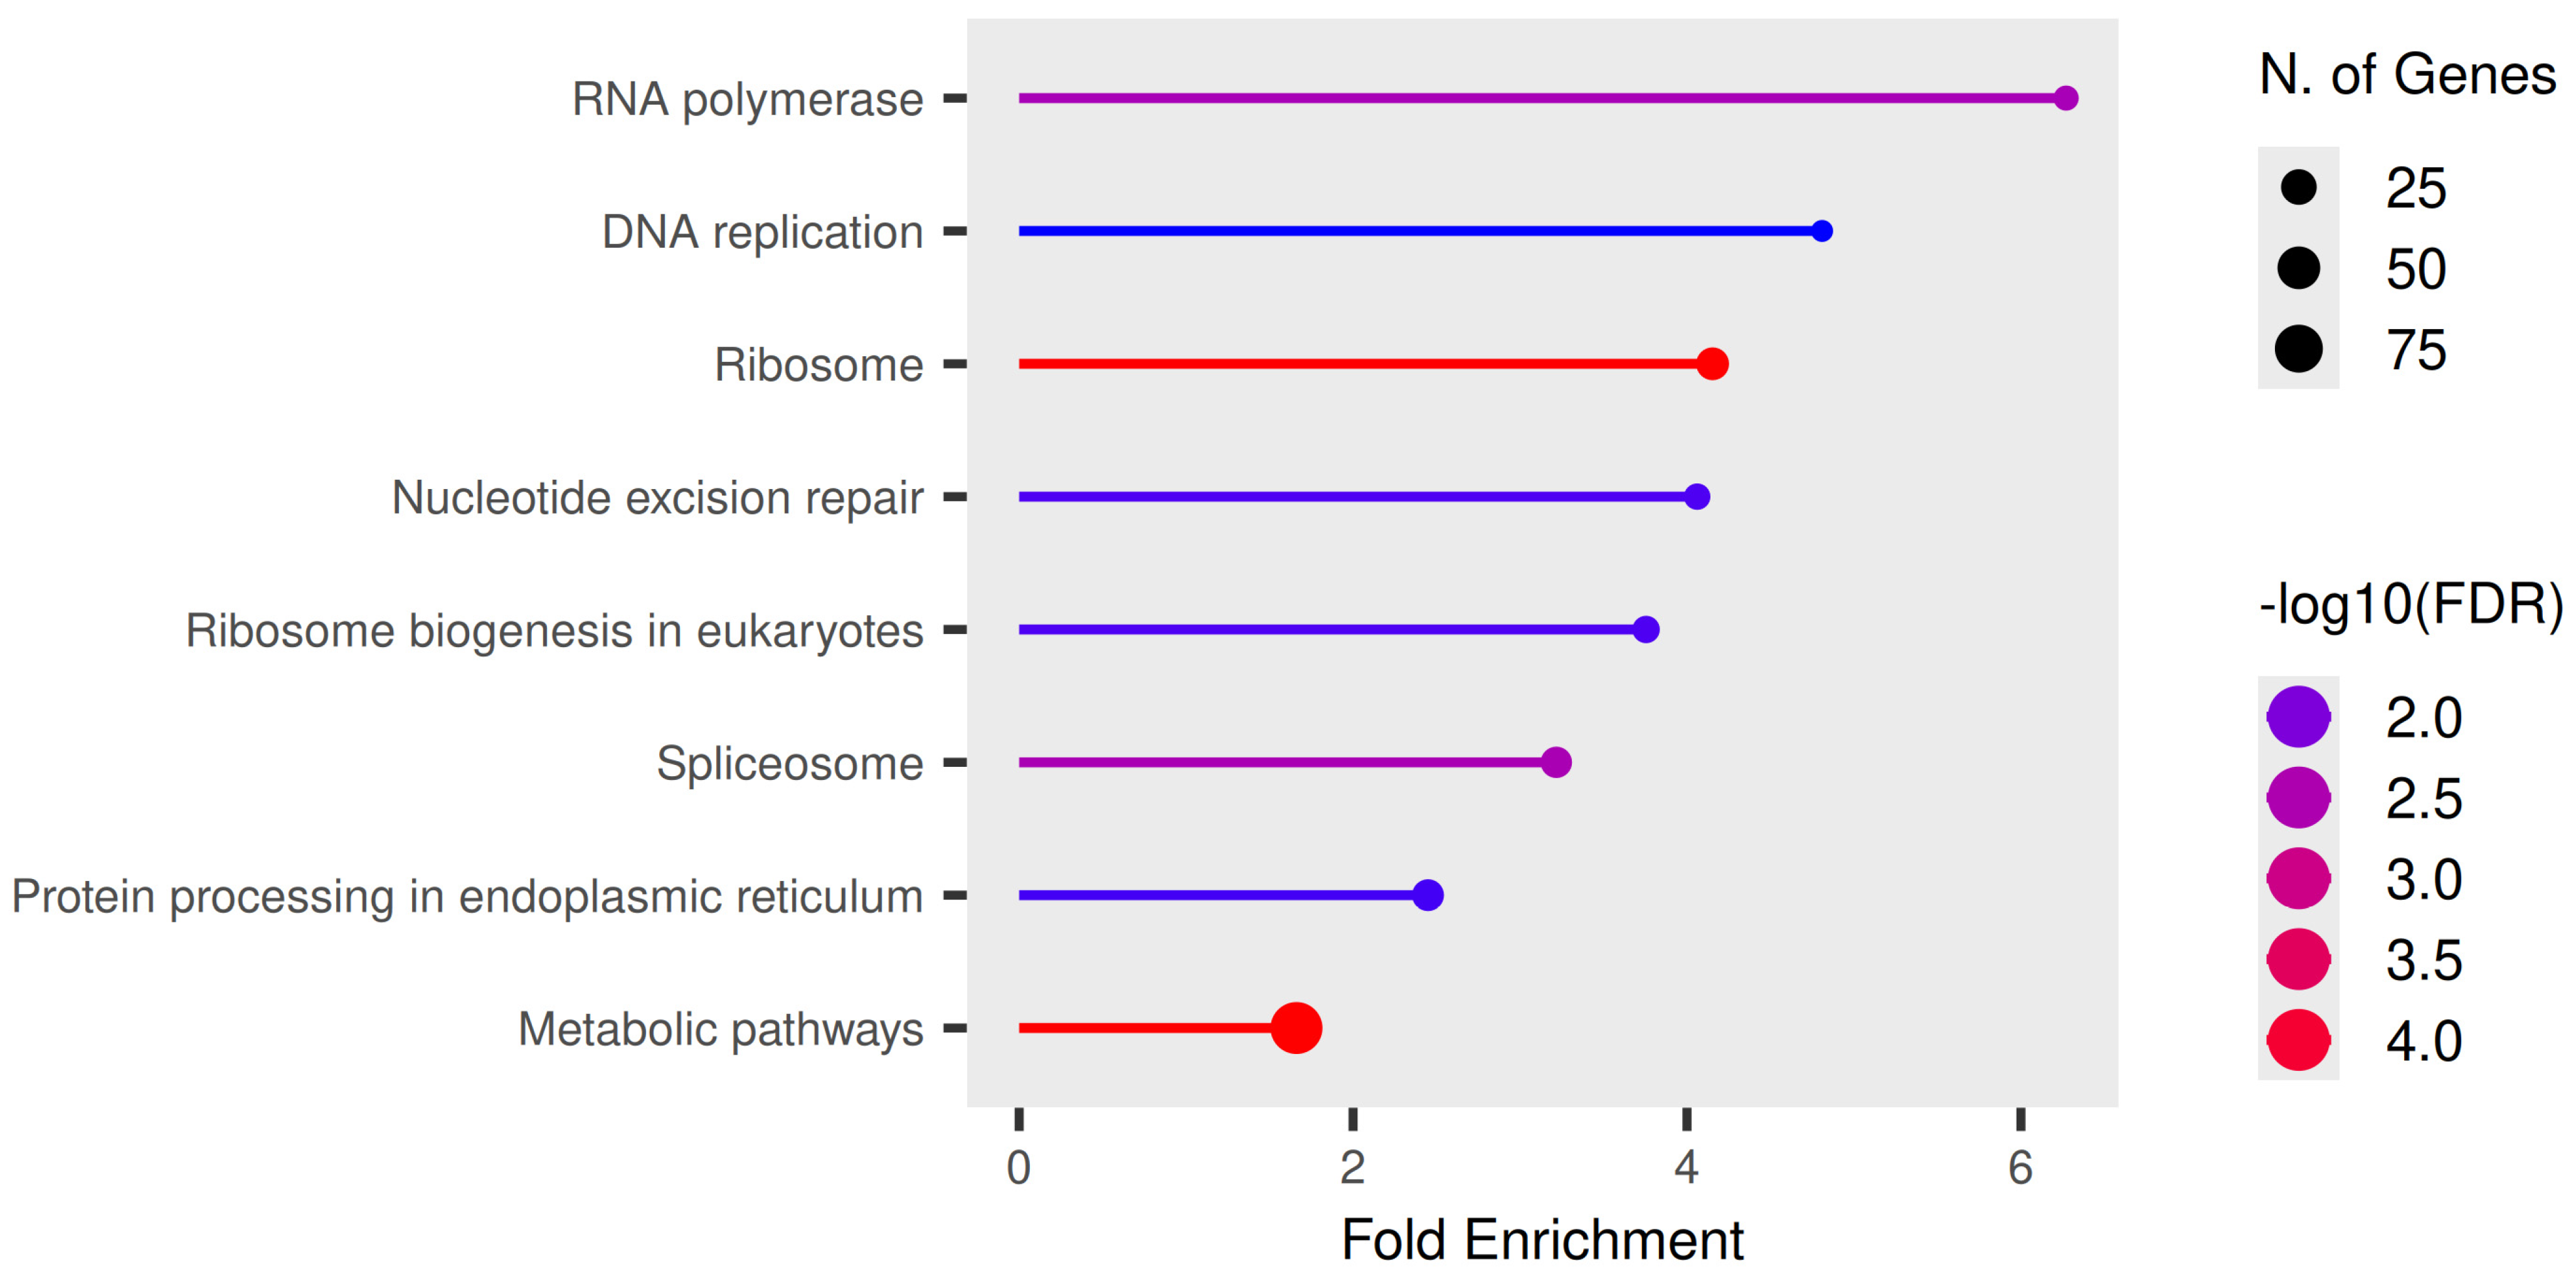
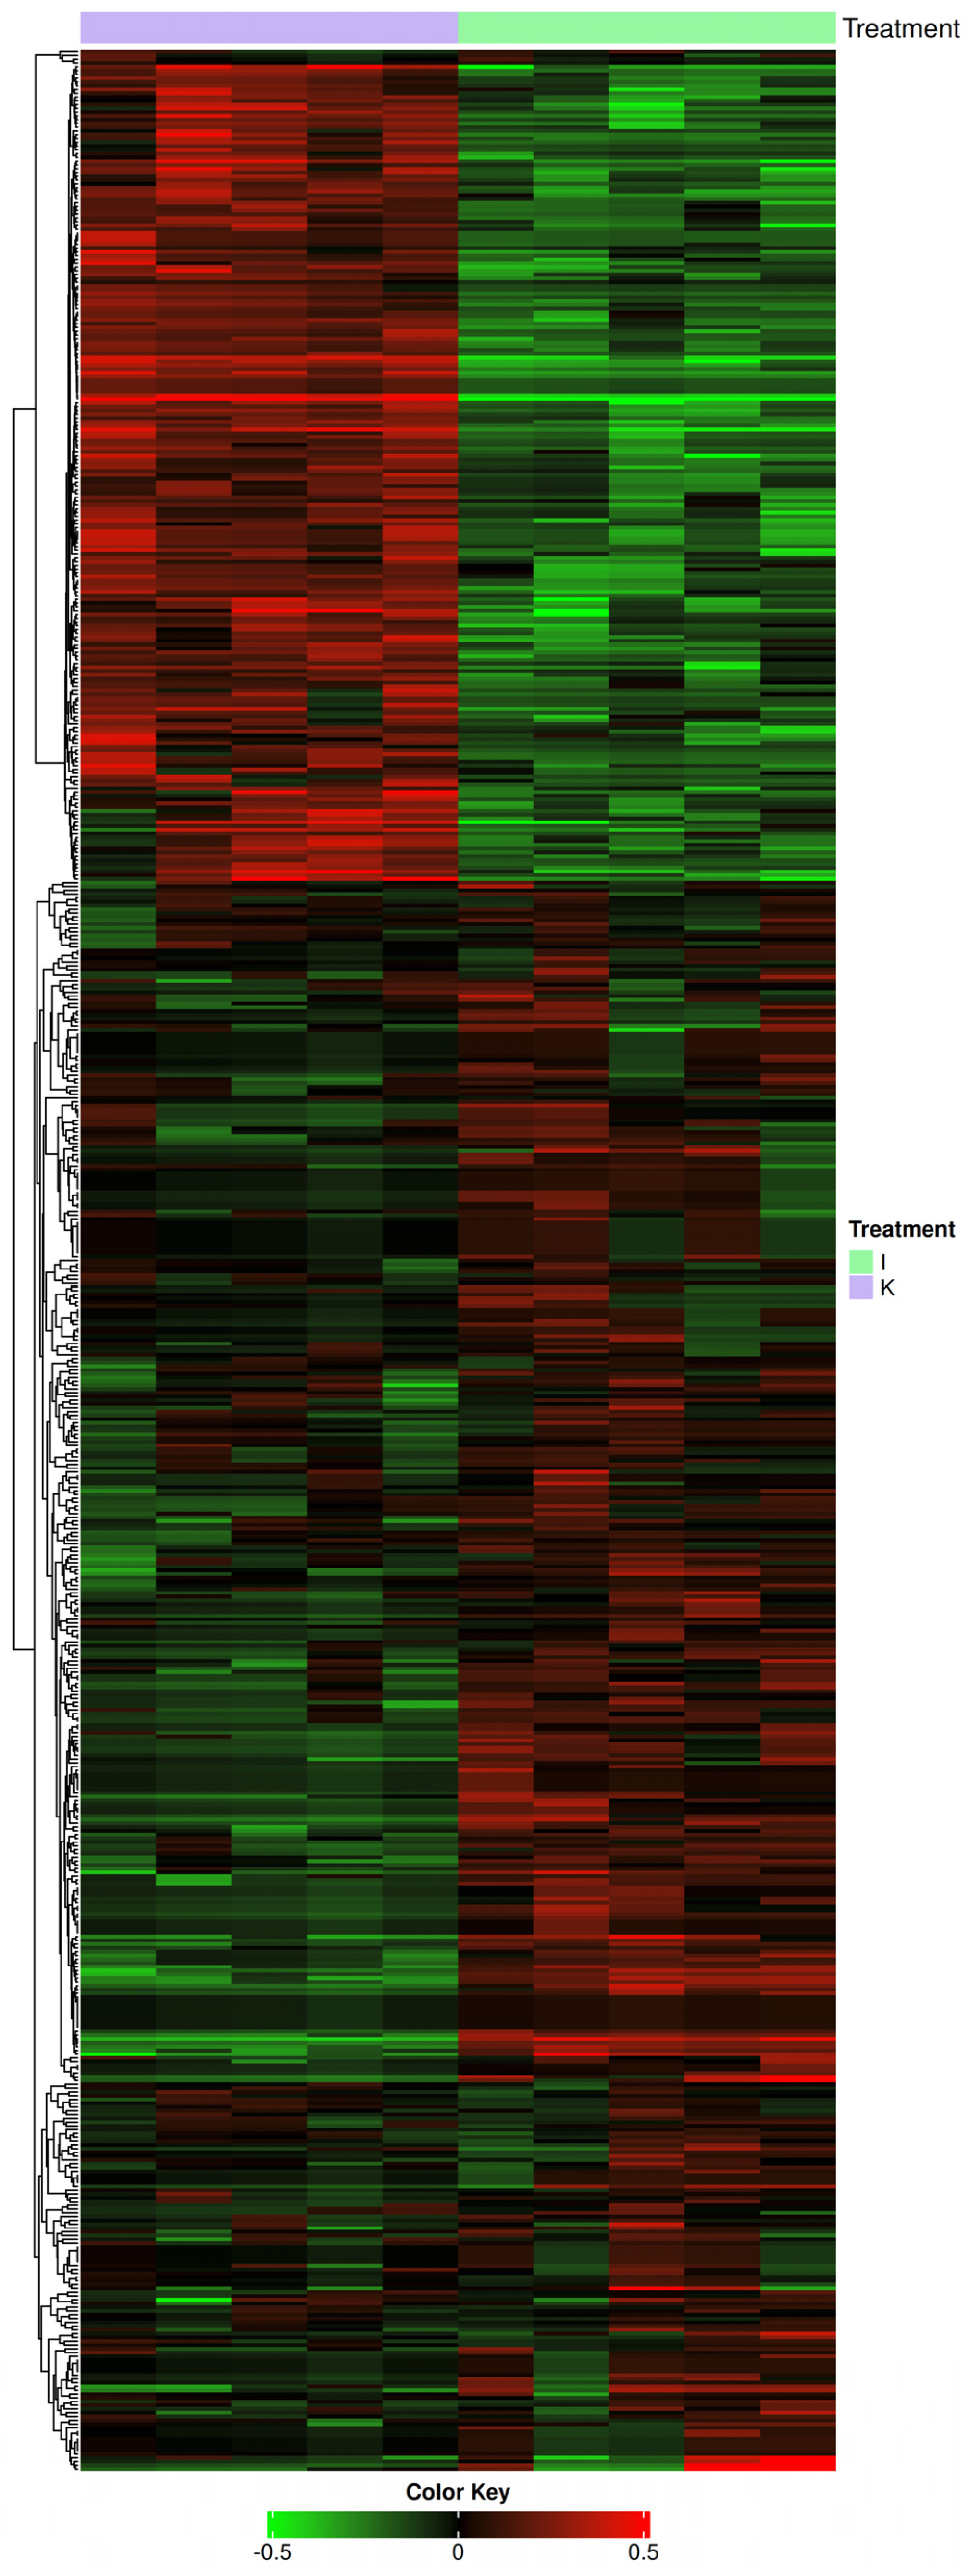
We determine the coding genes expressed in the intestine and head kidney. A total of 27,077 coding genes of the 35,029 annotated genes of the genome were expressed in these tissues. When we observe the tissue-specific pattern of expression, we found 7323 differentially expressed coding genes between the intestine and head kidney, with 4459 up-regulated and 2864 down-regulated in the head kidney compared to the intestine (Figure 1). Enrichment analysis of the differentially expressed genes showed eight enriched processes related to DNA replication, ribosome structure and biogenesis, DNA repair and splicing, and protein processing, among others, as shown in Figure 2. Several differentially expressed coding genes were expressed in these pathways, as observed for the KEGG pathways of DNA replication (Figure S2), nucleotide excision repair (Figure S3), protein processing in the endoplasmic reticulum (Figure S4), ribosome (Figure S5), RNA polymerase (Figure S6), and spliceosome (Figure S7). RNA-seq raw data for the intestine and head kidney are available at the NCBI under BioProject PRJNA1444003 and PRJNA1443391.

3.4. Long Non-Coding Annotation and Tissue-Specific Expression in the Intestine and Head Kidney of G. chilensis

The lncRNA annotation pipeline showed a total of 14,681 annotated lncRNAs in the genome assembly. These lncRNAs presented a tissue-specific expression pattern, with 3827 lncRNAs expressed on the intestine and head kidney. The differential expression analysis showed a total of 641 differentially expressed lncRNAs between the intestine and head kidney, with 427 being up-regulated and 214 down-regulated in the head kidney compared to the intestine (Figure 3).

3.5. Functional Comparison of Genypterus chilensis and Genypterus blacodes Genomes

In the Genypterus genus, only the genome of one species, G. blacodes, has been sequenced. To understand the availability and functional differences in genomes within the Genypterus genus, we compared the genome of G. blacodes with the de novo genome assembly of G. chilensis generated in this study. A general comparison of the genome assemblies showed a similar genome size in both species, with relatively higher values of statistics related to genome assembly quality for G. chilensis (Table 4).
The completeness of gene orthologs between the two genomes’ assemblies showed similar results for Actinopterygii annotations, with ~98% completes orthologs for both species (Table 4).

4. Discussion

G. chilensis is a native Chilean species relevant to fisheries and aquaculture diversification [8], but despite its relevance, there is no reference genome for this species. In the present study, the genome assembly of G. chilensis was obtained by integrating Oxford Nanopore long-reads and Illumina paired-end reads.
It is crucial to have a reference genome for fish species, which account for only 30% of available reference genomes in vertebrates [53]. This could impact the conservation efforts of native and threatened species, due to the low available percentage of species with reference genomes [54]. Additionally, the availability of reference genomes could impact the management of commercial fish species, including fishery populations, considering that high population sizes in some fishery species could have low genetic differentiation at neutral markers, requiring larger sets of neutral markers to differentiate fish populations to manage marine stocks; furthermore, possessing a reference genome is crucial for whole-genome resequencing technologies [55]. In aquaculture, reference genomes could be used to improve genomic selection for relevant productive traits [53]. Despite the high number of reference genomes available for other fishes, in the Ophidiiforme order (to which G. chilensis belongs), only 7 reference genomes are available [53], out of a total of 542 reported species in this order. The species with reference genomes include Lucifuga dentata (GCA_014773175.1), Brotula barbata (GCA_900303265.1), Carapus acus (GCA_900312935.1), Lamprogrammus exutus (GCA_900312555.1), Bassozetus sp. 1 (GCA_048565435.1), Bassozetus sp. 2 (GCA_048564805.1), and Genypterus blacodes (GCF_046128005.1), which is the only Genypterus species genome available to date.
The hybrid assembled genome of G. chilensis presented a higher value of N50, and a lower number of contigs. These values represent some of the best values for these parameters considering the available genomes of Ophiidiformes species (Table 5), showing the lowest number of contigs and the second highest N50 after Bassozetus sp. 2 (with 30.3 MB), suggesting the completeness of the assembled genome for G. chilensis [25,56,57,58]. In addition, the GC content was similar to the average obtained for species in this order (44.6% compared to the average of 43.2% for Ophiidiformes species). Regarding genome size, the G. chilensis genome presented a similar value (with a difference of only 5.4%) to the G. blacodes genome (Table 4), both being species of the Genypterus genus. This low variation in genome size for species in the same genus is consistent with that in previous studies examining other species [18,59]. In terms of differences in genome size between different genera within the Ophiidiformes order, we observed differences ranging from 387 to 680 Mb in genome size (Table 5). This variation between species of the same order has been previously observed in other fish orders, including Characiformes, with a genome size ranging from 0.85 to 2.02 pg [60]. The differences in genome size between species of the same order could be related to technical differences, including differences in the assembly strategy [61], or due to structural factors, including the representation of repetitive elements in the genome. This could partly explain the differences with some species of the Ophiidiformes order, such as L. dentata, whose genome is larger by 190.81 Mb and presents 16.3% of repetitive elements, with 5.4% more repetitive elements compared to the G. chilensis genome [62]. Genome size has previously been associated with genetic diversity related to life-history traits and genomics factors [63], showing an association with the trophic niche, with omnivorous and piscivorous species in the Characiformes order showing a reduced genome size [60]. However, there is no information on how the trophic niche of Ophiidiformes species could be related to genome size.
The genome of G. chilensis was characterized by a relatively low value of repetitive elements (retroelements, DNA transposons, and simple repeats), accounting for 10.9% of the genome assembly compared to other species. Yuan et al. [18] studied the repetitive elements of 52 fish genomes and observed that the percentage of repetitive elements varied between 9 and 59% on fish genomes. They also found that class II transoposons are more abundant in marine species of the orders Perciformes, Gasterosteiformes, Tetraodontiformes, Scorpaeiformes, Pleuronectiformes, Clupeiformes, Coelacanthiformes, and Gadiformes than in freshwater species, where microsatellites are more abundant. However, contrary to this tendency, in G. chilensis, class II transposons were found to be more abundant than microsatellites, which could be a pattern associated with Ophiidiformes species, or more specifically to the Genypterus genus. The global level of transposable elements in G. chilensis is consistent with the lower-intermediate level observed in teleosts [60]. Additionally, similarly to what was observed by Yuan et al., class I transposons are less abundant in bony fish, compared to cartilaginous fish [18].
The Genypterus genus is a relevant group of eel-like species for fisheries and aquaculture, with several species living along the South Pacific coast [8,64,65]. In this group, the G. chilensis assembled genomes were found to have similar statistics to the G. blacodes genome, with a similar assembly span and GC% content. In terms of gene orthologs, similar values were obtained for BUSCO statistics, with G. chilensis showing a slightly lower Complete BUSCO% (98.1 and 98.6), the same value for Complete and Single copy% (97 in both species), and a slightly higher Fragmented BUSCO % (0.4 vs. 0.7). This indicates similarities in the genome assemblies of the two species, with minor differences that could be explained by different assembly strategies, and completeness of the assembly, also considering scaffold and contigs statistics of these species. Additionally, when we compared the functional elements between Genypterus species, we find a higher number of coding genes in G. chilensis compared to G. blacodes (35,029 and 29,502), with a similar median gene length (4821 bp and 4292 bp, respectively). The Ophiidiformes order is a diverse group with more than 289 known species, but only seven species have available genomes [1]. When we compared the Genypterus species with other species of the Ophiidiformes order in terms of functional elements, we observed a similar number of annotated genes for L. dentata (29,968 genes), but no annotation publicly available for the other Ophiidiformes species. This number of genes in Genypterus species is similar to that observed in some teleosts’ genomes, including Sparus aurata and Pagrus major (30,500 and 28,300 genes, respectively) [11,66], but higher than in other teleosts such as Acanthopagrus latus (19,600 genes), Silurus lanzhouensis (23,093 genes), and Squaliobarbus curriculus (25,779 genes) [12,25,51]. Some teleosts present a higher number of genes than Genypterus species, including the Sparidentex hasta with 41,201 genes [52], showing that the genomes of Genypterus species do not present extreme (lower or higher) numbers of genes.
LncRNAs are non-coding RNA transcripts longer than 200 nucleotides with no protein-coding potential [67]. The understanding of their role in regulating gene expression has increased in the last decade, particularly regarding how they participate in transcriptional, post-transcriptional, translational, and post-translational regulation [68]. In Genypterus species, we previously identified lncRNAs using de novo transcriptome assembly, showing that this type of non-coding molecule participates in the gene expression regulation of G. chilensis [22]. In the genome assembly of G. chilensis, more than ~14,000 lncRNAs were annotated, evidencing that this type of non-coding RNA is well represented at the genome level, improving the lncRNA knowledge in this species. This finding is consistent with the number of lncRNAs annotated in Astyanax mexicanus (~19,000 lncRNAs) [44], but different compared to other teleost species, including salmonids such as Salmo salar (~7000 lncRNAs), Oncorhynkus kisutch (~5000 lncRNAs), or Oncorhynchus mykiss (~30,000 lncRNAs) [48,69], as well as Oreochromis niloticus (~70,000) [70]. Additionally, we evaluated the tissue-specific expression of lncRNAs and coding RNAs in the intestine and head kidney of G. chilensis, and observed a tissue-specific pattern for lncRNAs, with 641 lncRNAs differentially expressed between the two tissues, revealing differences in the coding expression of DNA replication, ribosome structure and biogenesis, DNA repair, splicing, and protein processing pathways. This tissue-specific expression pattern of lncRNA has been previously observed in G. chilensis in other tissues, including the liver, head kidney, and skeletal muscle, indicating that the intestine exhibits greater differences in lncRNA expression than in previous studies [22]. It is relevant to consider the limitations of this study, with the evaluation of lncRNA expression in G. chilensis in only two tissues; therefore, tissue-specific expression patterns should be evaluated in other relevant tissues in future studies. The tissue-specific expression pattern observed in this study has also been observed in other teleost species, including S. salar and O. kisutch, with differences in the expression patterns between the skin and the head kidney [48]. In addition, tissue-specific expression patterns of lncRNAs were observed in O. niloticus in the testis, blood, brain, gill, gonad, heart, intestine, kidney, liver, skin, ovary, and spleen. Particularly in O. niloticus, the intestine and kidney showed high differences in their lncRNA expression patterns [70], which is consistent with our observation in G. chilensis.

5. Conclusions

In this study, we successfully generated the first assembly and annotation of the G. chilensis genome using a hybrid sequencing approach with Illumina short reads and Nanopore long reads. The assembled genome presents high-quality values within the Ophidiformes order, evidencing similarities and differences within the Genypterus genus. The lncRNA annotation and evaluation showed that this type of non-coding RNA participates in coding regulation in a tissue-specific pattern in this species, with relevant differences between the intestine and head kidney. This study provides valuable genomic information for future studies of Genypterus chilensis and other species of the Ophidiformes order.

Supplementary Materials

The following supporting information can be downloaded at https://www.mdpi.com/article/10.3390/fishes11040244/s1, Figure S1: Genome size estimation of the genome assembly of Genypterus chilensis; Figure S2: Differentially expressed genes between the intestine and head kidney of Genypterus chilensis in the DNA replication KEGG pathway; Figure S3: Differentially expressed genes between the intestine and head kidney of Genypterus chilensis in the nucleotide excision repair KEGG pathway; Figure S4: Differentially expressed genes between the intestine and head kidney of Genypterus chilensis in the protein processing in endoplasmic reticulum KEGG pathway; Figure S5: Differentially expressed genes between the intestine and head kidney of Genypterus chilensis in the ribosome KEGG pathway; Figure S6: Differentially expressed genes between the intestine and head kidney of Genypterus chilensis in the RNA polymerase KEGG pathway; Figure S7: Differentially expressed genes between the intestine and head kidney of Genypterus chilensis in the spliceosome KEGG pathway; Table S1. Statistics for genome size estimation; Table S2. Assembly statistics of the Genypterus chilensis genome.

Author Contributions

Conceptualization, P.D., and J.A.V.; methodology, P.D., M.A.-S., V.F., K.T., M.S., C.O., and J.M.E.; software, P.D.; validation, P.D., M.A.-S., and V.F.; formal analysis, P.D., and V.F.; investigation, P.D., J.M.E., and J.A.V.; resources, P.D., and J.A.V.; data curation, P.D.; writing—original draft preparation, P.D.; visualization, P.D.; project administration, P.D., and J.A.V.; funding acquisition, P.D., and J.A.V. All authors have read and agreed to the published version of the manuscript.

Funding

This study was supported by ANID FONDECYT Inicio, grant number 11230153 (to Phillip Dettleff), and ANID INCAR2 CIA250009 (to Juan Antonio Valdés).

Institutional Review Board Statement

The study adhered to animal welfare procedures, and the protocol was approved by the Ethical Committee of Animal Care of Pontificia Universidad Católica de Chile, Universidad Andres Bello and the National Commission for Scientific and Technological Research of the Chilean government (protocol code 022-2023 and 220318018, approved on 19 May 2023).

Data Availability Statement

The data used for the assembly is available in the Bioproject PRJNA1268014 (paired-end sequencing Illumina reads at SAMN48739897, and long-sequencing Nanopore reads at SAMN48739897), in the NCBI database. This Whole Genome Shotgun project has been deposited at DDBJ/ENA/GenBank under the accession JBWDHU000000000. The version described in this paper is version JBWDHU010000000. RNA-seq raw data for the intestine and head kidney are available at NCBI under BioProject PRJNA1444003 and PRJNA1443391.

Acknowledgments

We acknowledge the CIMARQ center for the use of facilities and are grateful for the contribution of Italo Barrios, who provided assistance with the fish.

Conflicts of Interest

The authors declare no conflicts of interest.

References

  1. Wong, M.K.; Chen, W.J. Exploring the phylogeny and depth evolution of cusk eels and their relatives (Ophidiiformes: Ophidioidei). Mol. Phylogenetics Evol. 2024, 199, 108164. [Google Scholar] [CrossRef] [Scilit]
  2. Santaclara, F.J.; Perez-Martin, R.I.; Sotelo, C.G. Developed of a method for the genetic identification of ling species (Genypterus spp.) in seafood products by FINS methodology. Food Chem. 2014, 143, 22–26. [Google Scholar] [CrossRef] [Scilit]
  3. Vega, R.; Estrada, J.M.; Ramirez, D.; Flores, C.; Zamorano, J.; Encina, F.; Mardones, A.; Valdebenito, I.; Dantagnan, P. Growth of cusk eel Genypterus chilensis juveniles in culture conditions. Lat. Am. J. Aquat. Res. 2015, 43, 344–350. [Google Scholar] [CrossRef] [Scilit]
  4. Vega, R.; Pradenas, M.; Estrada, J.M.; Ramirez, D.; Valdebenito, I.; Mardones, A.; Dantagnan, P.; Alfaro, D.; Encina, F.; Pichara, C. Evaluation and comparison of the efficiency of two incubation systems for Genypterus chilensis (Guichenot, 1848) eggs. Lat. Am. J. Aquat. Res. 2012, 40, 187–200. [Google Scholar] [CrossRef] [Scilit]
  5. Dettleff, P.; Zuloaga, R.; Fuentes, M.; Estrada, J.M.; Molina, A.; Valdes, J.A. Temperature effect on oxidative stress and egg quality-related genes on post-ovulatory eggs and ovary of red cusk-eel (Genypterus chilensis). J. Fish Biol. 2021, 98, 1475–1480. [Google Scholar] [CrossRef] [Scilit] [PubMed]
  6. Dettleff, P.; Zuloaga, R.; Fuentes, M.; González, J.; Aedo, J.; Estrada, J.M.; Molina, A.; Valdés, J.A. Physiological and molecular responses to thermal stress in red cusk-eel (Genypterus chilensis) juveniles reveals atrophy and oxidative damage in skeletal muscle. J. Therm. Biol. 2020, 94, 102750. [Google Scholar] [CrossRef] [Scilit]
  7. Dettleff, P.; Zuloaga, R.; Fuentes, M.; Gonzalez, P.; Aedo, J.; Estrada, J.M.; Molina, A.; Valdes, J.A. High-Temperature Stress Effect on the Red Cusk-Eel (Geypterus chilensis) Liver: Transcriptional Modulation and Oxidative Stress Damage. Biology 2022, 11, 990. [Google Scholar] [CrossRef] [Scilit]
  8. Dettleff, P.; Toloza, C.; Fuentes, M.; Aedo, J.; Zuloaga, R.; Estrada, J.M.; Molina, A.; Valdes, J.A. Gills de novo assembly reveals oxidative stress, unfolded protein, and immune response on red cusk-eel (Genypterus chilensis) under thermal stress. Mar. Environ. Res. 2024, 196, 106440. [Google Scholar] [CrossRef] [Scilit]
  9. Aedo, J.E.; Maldonado, J.; Estrada, J.M.; Fuentes, E.N.; Silva, H.; Gallardo-Escarate, C.; Molina, A.; Valdes, J.A. Sequencing and de novo assembly of the red cusk-eel (Genypterus chilensis) transcriptome. Mar. Genom. 2014, 18 Pt B, 105–107. [Google Scholar] [CrossRef] [Scilit]
  10. Aballai, V.; Aedo, J.E.; Maldonado, J.; Bastias-Molina, M.; Silva, H.; Meneses, C.; Boltana, S.; Reyes, A.; Molina, A.; Valdes, J.A. RNA-seq analysis of the head-kidney transcriptome response to handling-stress in the red cusk-eel (Genypterus chilensis). Comp. Biochem. Phys. D 2017, 24, 111–117. [Google Scholar] [CrossRef] [Scilit]
  11. Shin, G.H.; Shin, Y.; Jung, M.; Hong, J.M.; Lee, S.; Subramaniyam, S.; Noh, E.S.; Shin, E.H.; Park, E.H.; Park, J.Y.; et al. First Draft Genome for Red Sea Bream of Family Sparidae. Front. Genet. 2018, 9, 643. [Google Scholar] [CrossRef] [Scilit] [PubMed]
  12. Yang, Y.H.; Zhang, Y.M.; Li, F.G.; Wen, S.; Wang, L.; Lan, G.Z.; Zhou, J.S.; Li, Y.; Zhu, Z.L. Comparative Genomic Analysis Unveils Potential Factors Contributing to the Endangerment of Silurus lanzhouensis. Fishes 2023, 8, 613. [Google Scholar] [CrossRef] [Scilit]
  13. Pritchard, J.K.; Stephens, M.; Donnelly, P. Inference of population structure using multilocus genotype data. Genetics 2000, 155, 945–959. [Google Scholar] [CrossRef] [Scilit]
  14. Nugroho, E.; Ferrell, D.J.; Smith, P.; Taniguchi, N. Genetic divergence of kingfish from Japan, Australia and New Zealand inferred by microsatellite DNA and mitochondrial DNA control region markers. Fish. Sci. 2001, 67, 843–850. [Google Scholar] [CrossRef] [Scilit]
  15. Sun, C.; Yan, Y.; Zhang, Y.; Dong, J.; Chen, X.; Gao, F.; Zhang, H.; Wang, Z.; Wu, C.; Ye, X.; et al. Genome loci with selection signatures revealed in a domesticated mandarin fish population. BMC Genom. 2025, 26, 947. [Google Scholar] [CrossRef] [Scilit]
  16. Martinez, V.; Dettleff, P.; Zamorano, P.; Galarce, N.; Borie, C.; Naish, K. Host-pathogen interaction involving cytoskeleton changes as well as non-coding regulation as primary mechanisms for SRS resistance in Atlantic salmon. Fish Shellfish. Immunol. 2023, 136, 108711. [Google Scholar] [CrossRef] [Scilit]
  17. Dettleff, P.; Hernandez, E.; Partridge, G.; Lafarga-De la Cruz, F.; Martinez, V. Understanding the population structure and reproductive behavior of hatchery-produced yellowtail kingfish (Seriola lalandi). Aquaculture 2020, 522, 734948. [Google Scholar] [CrossRef] [Scilit]
  18. Yuan, Z.; Liu, S.; Zhou, T.; Tian, C.; Bao, L.; Dunham, R.; Liu, Z. Comparative genome analysis of 52 fish species suggests differential associations of repetitive elements with their living aquatic environments. BMC Genom. 2018, 19, 141. [Google Scholar] [CrossRef] [Scilit]
  19. Saha, C.; Saha, S.; Bhattacharyya, N.P. LncRNAOmics: A Comprehensive Review of Long Non-Coding RNAs in Plants. Genes 2025, 16, 765. [Google Scholar] [CrossRef] [Scilit]
  20. Zhou, Z.; Leng, C.; Wang, Z.; Long, L.; Lv, Y.; Gao, Z.; Wang, Y.; Wang, S.; Li, P. The potential regulatory role of the lncRNA-miRNA-mRNA axis in teleost fish. Front. Immunol. 2023, 14, 1065357. [Google Scholar] [CrossRef] [Scilit] [PubMed]
  21. Abo-Al-Ela, H.G. The emerging regulatory roles of noncoding RNAs in immune function of fish: MicroRNAs versus long noncoding RNAs. Mol. Genet. Genom. 2021, 296, 765–781. [Google Scholar] [CrossRef] [Scilit] [PubMed]
  22. Dettleff, P.; Hormazabal, E.; Aedo, J.; Fuentes, M.; Meneses, C.; Molina, A.; Valdes, J.A. Identification and Evaluation of Long Noncoding RNAs in Response to Handling Stress in Red Cusk-Eel (Genypterus chilensis) via RNA-seq. Mar. Biotechnol. (NY) 2020, 22, 94–108. [Google Scholar] [CrossRef] [Scilit]
  23. Andrews, S. FastQC: A Quality Control Tool for High Throughput Sequence Data. 2010. Available online: https://www.babraham.ac.uk/ (accessed on 30 August 2025).
  24. Chen, S. Ultrafast one-pass FASTQ data preprocessing, quality control, and deduplication using fastp. iMeta 2023, 2, e107. [Google Scholar] [CrossRef] [Scilit]
  25. Zhang, B.D.; Sun, Y.L.; Liu, Y.; Song, X.J.; Wang, S.; Xiao, T.Y.; Nie, P. Chromosome-Level Genome Assembly and Comparative Genomic Analysis of the Barbel Chub (Squaliobarbus curriculus) by Integration of PacBio Sequencing and Hi-C Technology. Fishes 2024, 9, 327. [Google Scholar] [CrossRef] [Scilit]
  26. Miller, J.R.; Delcher, A.L.; Koren, S.; Venter, E.; Walenz, B.P.; Brownley, A.; Johnson, J.; Li, K.; Mobarry, C.; Sutton, G. Aggressive assembly of pyrosequencing reads with mates. Bioinformatics 2008, 24, 2818–2824. [Google Scholar] [CrossRef] [Scilit]
  27. Ranallo-Benavidez, T.R.; Jaron, K.S.; Schatz, M.C. GenomeScope 2.0 and Smudgeplot for reference-free profiling of polyploid genomes. Nat. Commun. 2020, 11, 1432. [Google Scholar] [CrossRef] [Scilit]
  28. Bolger, A.M.; Lohse, M.; Usadel, B. Trimmomatic: A flexible trimmer for Illumina sequence data. Bioinformatics 2014, 30, 2114–2120. [Google Scholar] [CrossRef] [Scilit] [PubMed]
  29. Kolmogorov, M.; Yuan, J.; Lin, Y.; Pevzner, P.A. Assembly of long, error-prone reads using repeat graphs. Nat. Biotechnol. 2019, 37, 540–546. [Google Scholar] [CrossRef] [Scilit]
  30. Gurevich, A.; Saveliev, V.; Vyahhi, N.; Tesler, G. QUAST: Quality assessment tool for genome assemblies. Bioinformatics 2013, 29, 1072–1075. [Google Scholar] [CrossRef] [Scilit] [PubMed]
  31. Vaser, R.; Sovic, I.; Nagarajan, N.; Sikic, M. Fast and accurate de novo genome assembly from long uncorrected reads. Genome Res. 2017, 27, 737–746. [Google Scholar] [CrossRef] [Scilit]
  32. Nanopore, O. Medaka: Sequence Correction Provided by ONT Research, Oxford Nanopore. 2018. Available online: https://github.com/rrwick/Unicycler (accessed on 15 May 2025).
  33. Bedell, J.A.; Korf, I.; Gish, W. MaskerAid: A performance enhancement to RepeatMasker. Bioinformatics 2000, 16, 1040–1041. [Google Scholar] [CrossRef] [Scilit]
  34. Ravelo-Mendez, W.; Escobar-Velasquez, C.; Linares-Vasquez, M. Kraken 2.0: A platform-agnostic and cross-device interaction testing tool. Sci. Comput. Program 2023, 225, 102897. [Google Scholar] [CrossRef] [Scilit]
  35. Dobin, A.; Davis, C.A.; Schlesinger, F.; Drenkow, J.; Zaleski, C.; Jha, S.; Batut, P.; Chaisson, M.; Gingeras, T.R. STAR: Ultrafast universal RNA-seq aligner. Bioinformatics 2013, 29, 15–21. [Google Scholar] [CrossRef] [Scilit]
  36. Palmer, J.; Stajich, J. Funannotate v1.8.1: Eukaryotic Genome Annotation. 1.8.17. 2020. Available online: https://zenodo.org/records/4054262 (accessed on 10 September 2025).
  37. Stanke, M.; Morgenstern, B. AUGUSTUS: A web server for gene prediction in eukaryotes that allows user-defined constraints. Nucleic Acids Res. 2005, 33, W465–W467. [Google Scholar] [CrossRef] [Scilit] [PubMed]
  38. Bruna, T.; Lomsadze, A.; Borodovsky, M. GeneMark-ETP significantly improves the accuracy of automatic annotation of large eukaryotic genomes. Genome Res. 2024, 34, 757–768. [Google Scholar] [CrossRef] [Scilit] [PubMed]
  39. Huerta-Cepas, J.; Szklarczyk, D.; Forslund, K.; Cook, H.; Heller, D.; Walter, M.C.; Rattei, T.; Mende, D.R.; Sunagawa, S.; Kuhn, M.; et al. eggNOG 4.5: A hierarchical orthology framework with improved functional annotations for eukaryotic, prokaryotic and viral sequences. Nucleic Acids Res. 2016, 44, D286–D293. [Google Scholar] [CrossRef] [Scilit]
  40. Jones, P.; Binns, D.; Chang, H.Y.; Fraser, M.; Li, W.; McAnulla, C.; McWilliam, H.; Maslen, J.; Mitchell, A.; Nuka, G.; et al. InterProScan 5: Genome-scale protein function classification. Bioinformatics 2014, 30, 1236–1240. [Google Scholar] [CrossRef] [Scilit]
  41. Manni, M.; Berkeley, M.R.; Seppey, M.; Simao, F.A.; Zdobnov, E.M. BUSCO Update: Novel and Streamlined Workflows along with Broader and Deeper Phylogenetic Coverage for Scoring of Eukaryotic, Prokaryotic, and Viral Genomes. Mol. Biol. Evol. 2021, 38, 4647–4654. [Google Scholar] [CrossRef] [Scilit] [PubMed]
  42. Wang, L.; Park, H.J.; Dasari, S.; Wang, S.Q.; Kocher, J.P.; Li, W. CPAT: Coding-Potential Assessment Tool using an alignment-free logistic regression model. Nucleic Acids Res. 2013, 41, e74. [Google Scholar] [CrossRef] [Scilit]
  43. Kalvari, I.; Argasinska, J.; Quinones-Olvera, N.; Nawrocki, E.P.; Rivas, E.; Eddy, S.R.; Bateman, A.; Finn, R.D.; Petrov, A.I. Rfam 13.0: Shifting to a genome-centric resource for non-coding RNA families. Nucleic Acids Res. 2018, 46, D335–D342. [Google Scholar] [CrossRef] [Scilit]
  44. Batista da Silva, I.; Aciole Barbosa, D.; Kavalco, K.F.; Nunes, L.R.; Pasa, R.; Menegidio, F.B. Discovery of putative long non-coding RNAs expressed in the eyes of Astyanax mexicanus (Actinopterygii: Characidae). Sci. Rep. 2023, 13, 12051. [Google Scholar] [CrossRef] [Scilit] [PubMed]
  45. Winklhofer, M.; Nilsson, G.E.; Lefevre, S. Long non-coding RNA transcripts in crucian carp Brain—Annotation and expression patterns in anoxia and reoxygenation. RNA Biol. 2026, 23, 1–21. [Google Scholar] [CrossRef] [Scilit] [PubMed]
  46. Boltana, S.; Valenzuela-Miranda, D.; Aguilar, A.; Mackenzie, S.; Gallardo-Escarate, C. Long noncoding RNAs (lncRNAs) dynamics evidence immunomodulation during ISAV-Infected Atlantic salmon (Salmo salar). Sci. Rep. 2016, 6, 22698. [Google Scholar] [CrossRef] [Scilit]
  47. Tarifeno-Saldivia, E.; Valenzuela-Miranda, D.; Gallardo-Escarate, C. In the shadow: The emerging role of long non-coding RNAs in the immune response of Atlantic salmon. Dev. Comp. Immunol. 2017, 73, 193–205. [Google Scholar] [CrossRef] [Scilit]
  48. Valenzuela-Munoz, V.; Valenzuela-Miranda, D.; Gallardo-Escarate, C. Comparative analysis of long non-coding RNAs in Atlantic and Coho salmon reveals divergent transcriptome responses associated with immunity and tissue repair during sea lice infestation. Dev. Comp. Immunol. 2018, 87, 36–50. [Google Scholar] [CrossRef] [Scilit] [PubMed]
  49. Ewels, P.; Magnusson, M.; Lundin, S.; Kaller, M. MultiQC: Summarize analysis results for multiple tools and samples in a single report. Bioinformatics 2016, 32, 3047–3048. [Google Scholar] [CrossRef] [Scilit]
  50. Ge, S.X.; Jung, D.; Yao, R. ShinyGO: A graphical gene-set enrichment tool for animals and plants. Bioinformatics 2020, 36, 2628–2629. [Google Scholar] [CrossRef] [Scilit]
  51. Zhu, K.C.; Zhang, N.; Liu, B.S.; Guo, L.; Guo, H.Y.; Jiang, S.G.; Zhang, D.C. A chromosome-level genome assembly of the yellowfin seabream (Acanthopagrus latus; Hottuyn, 1782) provides insights into its osmoregulation and sex reversal. Genomics 2021, 113, 1617–1627. [Google Scholar] [CrossRef] [Scilit]
  52. Karam, Q.; Kumar, V.; Shajan, A.B.; Al-Nuaimi, S.; Sattari, Z.; El-Dakour, S. De-novo genome assembly and annotation of sobaity seabream Sparidentex hasta. Front. Genet. 2022, 13, 988488. [Google Scholar] [CrossRef] [Scilit]
  53. Liu, Z.; Gao, D. Current State of Fish Reference Genome and Pangenome: Methodologies, Sampling Strategies, Quality Assessment and Future Perspectives to Aquaculture Breeding. Mar. Biotechnol. (NY) 2025, 27, 158. [Google Scholar] [CrossRef] [Scilit]
  54. Brandies, P.; Peel, E.; Hogg, C.J.; Belov, K. The Value of Reference Genomes in the Conservation of Threatened Species. Genes 2019, 10, 846. [Google Scholar] [CrossRef] [Scilit]
  55. Andersson, L.; Bekkevold, D.; Berg, F.; Farrell, E.D.; Felkel, S.; Ferreira, M.S.; Fuentes-Pardo, A.P.; Goodall, J.; Pettersson, M. How Fish Population Genomics Can Promote Sustainable Fisheries: A Road Map. Annu. Rev. Anim. Biosci. 2024, 12, 1–20. [Google Scholar] [CrossRef] [Scilit] [PubMed]
  56. Yang, J.; Chen, X.; Bai, J.; Fang, D.; Qiu, Y.; Jiang, W.; Yuan, H.; Bian, C.; Lu, J.; He, S.; et al. The Sinocyclocheilus cavefish genome provides insights into cave adaptation. BMC Biol. 2016, 14, 1. [Google Scholar] [CrossRef] [Scilit]
  57. Chen, Z.; Omori, Y.; Koren, S.; Shirokiya, T.; Kuroda, T.; Miyamoto, A.; Wada, H.; Fujiyama, A.; Toyoda, A.; Zhang, S.; et al. De novo assembly of the goldfish (Carassius auratus) genome and the evolution of genes after whole-genome duplication. Sci. Adv. 2019, 5, eaav0547. [Google Scholar] [CrossRef] [Scilit]
  58. Sun, L.; Gao, T.; Wang, F.; Qin, Z.; Yan, L.; Tao, W.; Li, M.; Jin, C.; Ma, L.; Kocher, T.D.; et al. Chromosome-level genome assembly of a cyprinid fish Onychostoma macrolepis by integration of nanopore sequencing, Bionano and Hi-C technology. Mol. Ecol. Resour. 2020, 20, 1361–1371. [Google Scholar] [CrossRef] [Scilit]
  59. Kushwaha, B.; Nagpure, N.S.; Srivastava, S.; Pandey, M.; Kumar, R.; Raizada, S.; Agarwal, S.; Singh, M.; Basheer, V.S.; Kumar, R.G.; et al. Genome size estimation and its associations with body length, chromosome number and evolution in teleost fishes. Gene 2023, 864, 147294. [Google Scholar] [CrossRef] [Scilit]
  60. Dos Santos Melo, R.C.; Farias, M.C.L.; Pontes, A.I. Phylogenetic and ecological processes shape genome size variation in the order Characiformes. Environ. Biol. Fishes 2026, 109, 9. [Google Scholar] [CrossRef] [Scilit]
  61. Hjelmen, C.E. Genome size and chromosome number are critical metrics for accurate genome assembly assessment in Eukaryota. Genetics 2024, 227, iyae099. [Google Scholar] [CrossRef] [Scilit]
  62. Policarpo, M.; Fumey, J.; Lafargeas, P.; Naquin, D.; Thermes, C.; Naville, M.; Dechaud, C.; Volff, J.N.; Cabau, C.; Klopp, C.; et al. Contrasting Gene Decay in Subterranean Vertebrates: Insights from Cavefishes and Fossorial Mammals. Mol. Biol. Evol. 2021, 38, 589–605. [Google Scholar] [CrossRef] [Scilit]
  63. Reinar, W.B.; Torresen, O.K.; Nederbragt, A.J.; Matschiner, M.; Jentoft, S.; Jakobsen, K.S. Teleost genomic repeat landscapes in light of diversification rates and ecology. Mob. DNA 2023, 14, 14. [Google Scholar] [CrossRef] [Scilit] [PubMed]
  64. Becerra, S.; Arriagada-Solimano, M.; Escobar-Aguirre, S.; Palomino, J.; Aedo, J.; Estrada, J.M.; Barra-Valdebenito, V.; Zuloaga, R.; Valdes, J.A.; Dettleff, P. High temperature induces oxidative damage, immune modulation, and atrophy in the gills and skeletal muscle of the teleost fish black cusk-eel (Genypterus maculatus). Dev. Comp. Immunol. 2025, 164, 105332. [Google Scholar] [CrossRef] [Scilit]
  65. Canales-Aguirre, C.B.; Ferrada, S.; Hernandez, C.E.; Galleguillos, R. Population structure and demographic history of Genypterus blacodes using microsatellite loci. Fish. Res. 2010, 106, 102–106. [Google Scholar] [CrossRef] [Scilit]
  66. Pauletto, M.; Manousaki, T.; Ferraresso, S.; Babbucci, M.; Tsakogiannis, A.; Louro, B.; Vitulo, N.; Quoc, V.H.; Carraro, R.; Bertotto, D.; et al. Genomic analysis of Sparus aurata reveals the evolutionary dynamics of sex-biased genes in a sequential hermaphrodite fish. Commun. Biol. 2018, 1, 119. [Google Scholar] [CrossRef] [Scilit] [PubMed]
  67. Kour, S.; Rath, P.C. Long noncoding RNAs in aging and age-related diseases. Ageing Res. Rev. 2016, 26, 1–21. [Google Scholar] [CrossRef] [Scilit] [PubMed]
  68. Kim, C.; Kang, D.; Lee, E.K.; Lee, J.S. Long Noncoding RNAs and RNA-Binding Proteins in Oxidative Stress, Cellular Senescence, and Age-Related Diseases. Oxid. Med. Cell Longev. 2017, 2017, 2062384. [Google Scholar] [CrossRef] [Scilit] [PubMed]
  69. Al-Tobasei, R.; Paneru, B.; Salem, M. Genome-Wide Discovery of Long Non-Coding RNAs in Rainbow Trout. PLoS ONE 2016, 11, e0148940. [Google Scholar] [CrossRef] [Scilit]
  70. Li, B.J.; Jiang, D.L.; Meng, Z.N.; Zhang, Y.; Zhu, Z.X.; Lin, H.R.; Xia, J.H. Genome-wide identification and differentially expression analysis of lncRNAs in tilapia. BMC Genom. 2018, 19, 729. [Google Scholar] [CrossRef] [Scilit]
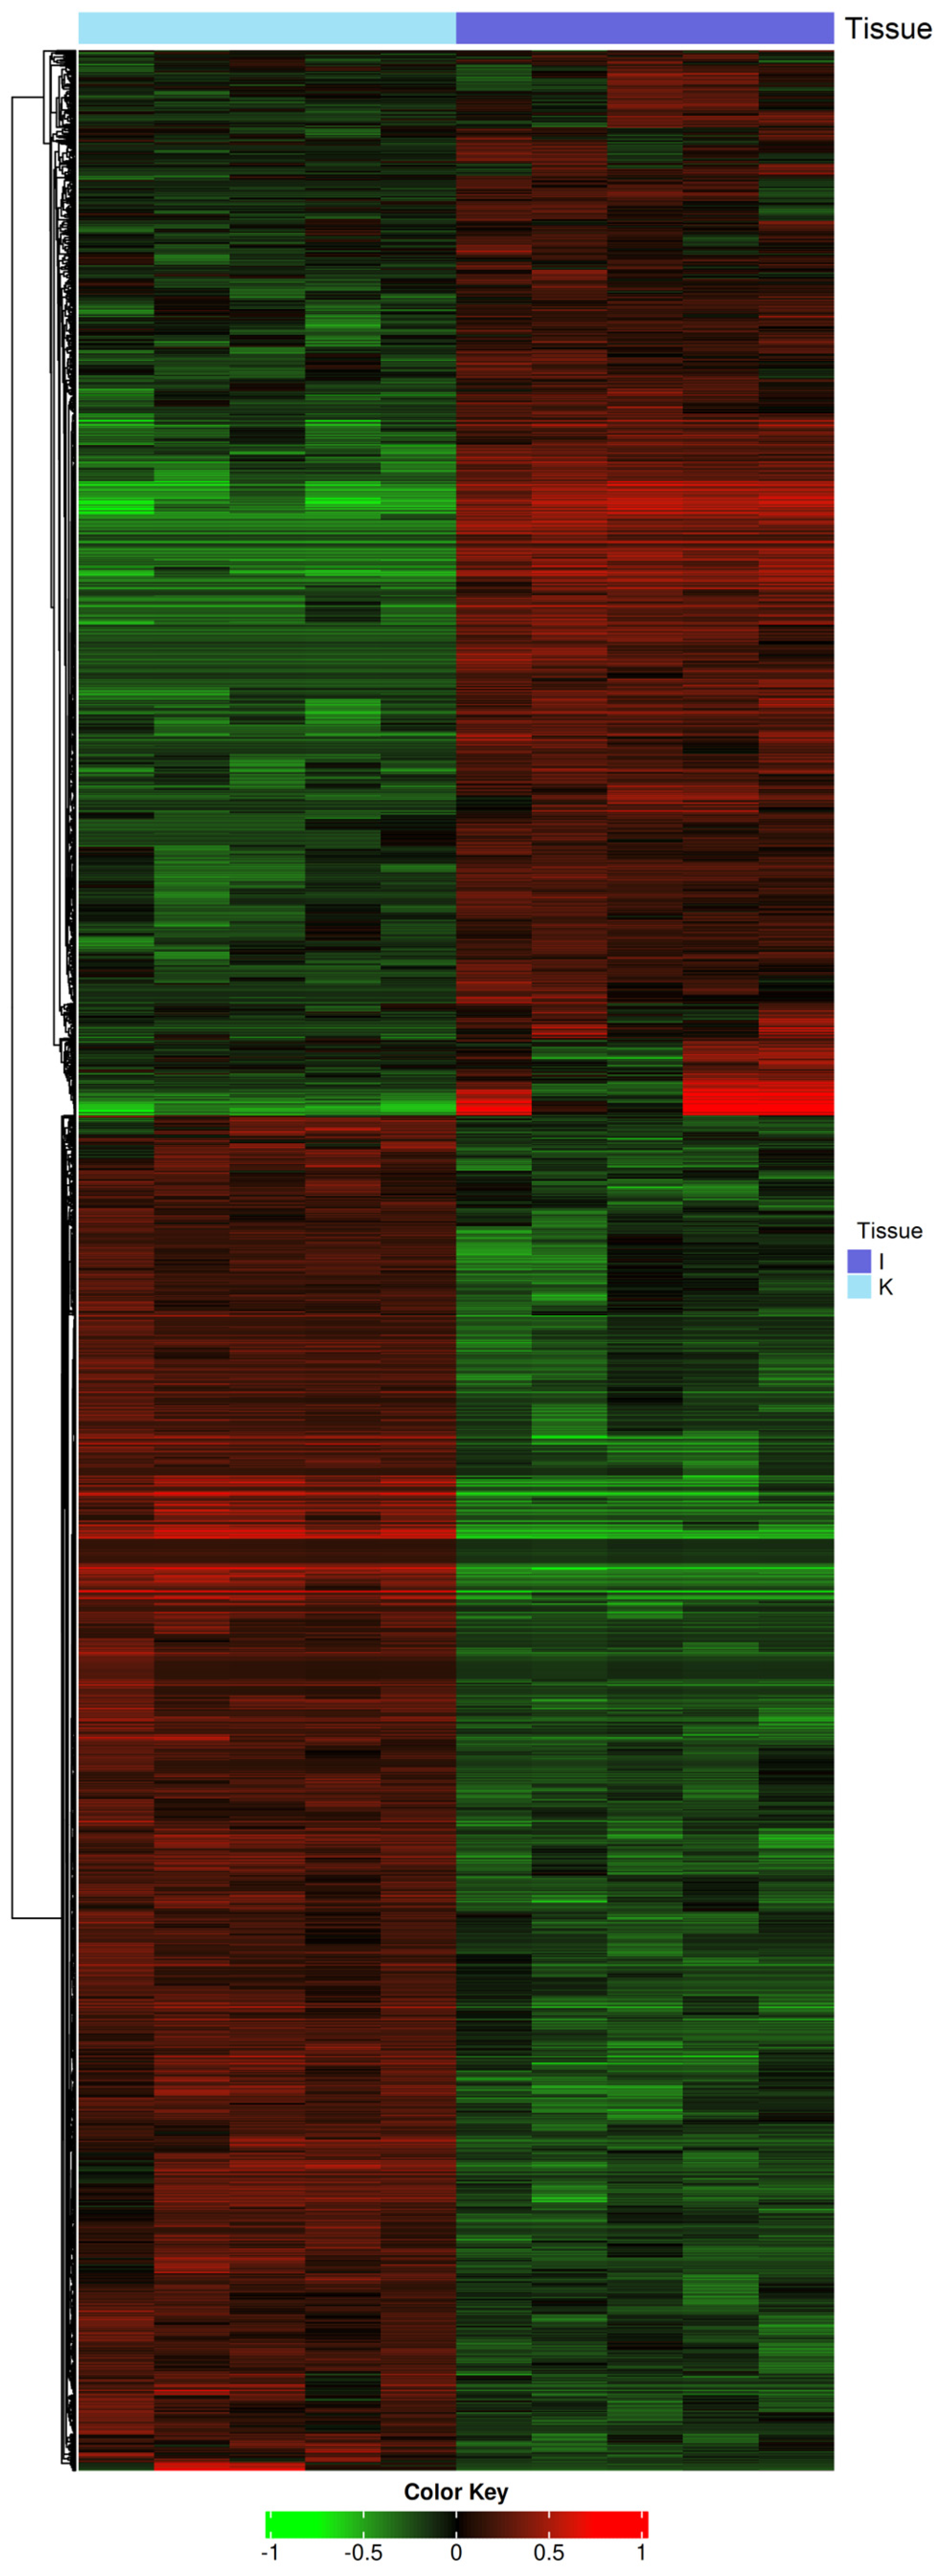
Figure 1. Differentially expressed coding genes between intestine and head kidney of Genypterus chilensis. The heatmap plot presents the differentially expressed coding genes between head kidney (K) and intestine (I) groups. The number indicates the sample library of K and I groups. Differentially expressed coding genes are considered to have an adjusted p-value < 0.05.
Fishes 11 00244 g001
Figure 2. Gene Ontology analysis of the enriched process between intestine and head kidney of Genypterus chilensis. Bubble plot of the GO enriched process in the differentially expressed coding genes between K and I groups. The horizontal axis represents the fold enrichment ratio, the dot size indicates the coding genes count, and the color scale indicates log10 of the FDR for the enrichment analysis.
Fishes 11 00244 g002
Figure 3. Differentially expressed long non-coding genes between intestine and head kidney of Genypterus chilensis. The heatmap plot presents the differentially expressed long non-coding genes between head kidney (K) and intestine (I) groups. The number indicates the sample library of K and I groups. Differentially expressed long non-coding genes are considered to have an adjusted p-value < 0.05.
Fishes 11 00244 g003
Table 1. Sequencing and filtering statistics of Illumina DNA, Oxford Nanopore, and Illumina RNA sequencing used for de novo genome assembly and gene expression analysis of Genypterus chilensis.
Sequencing LibrariesLibrary Size (bp)Sequencing PlatformTotal Data (Gb)Raw ReadsFiltered Reads
Illumina reads370Illumina NovaSeq−600042.2280,605,756268,450,288
Oxford Nanopore long reads20,000GridION platform7.77772,614619,684
Illumina RNA-seq intestine and head kidney transcriptome *300Illumina NovaSeq−600039.6262,062,772242,364,056
Total 90543,441,142511,434,028
* Considering all the RNA libraries sequenced for the intestine (n = 5) and head kidney (n = 5).
Table 2. Summary of BUSCO statistics of the genome assembly of Genypterus chilensis.
BUSCO StatisticsVertebrataActinopterygii
Number of Genes%Number of Genes%
Complete BUSCOs356998.05%357898.30%
Complete and single-copy BUSCOs351396.51%353197.01%
Complete Duplicated BUSCOs561.54%471.29%
Fragmented BUSCOs10.03%140.38%
Missing BUSCOs701.92%481.32%
Total BUSCO groups searched3640100%3640100%
Table 3. Statistics of repeated elements in the genome assembly of Genypterus chilensis.
Type of RepeatsNumber of ElementsLength (bp)Percentage of Sequence
Total interspersed repeats 18,584,8494.22%
Retroelements 65,4626,714,1731.53%
SINEs: 8381435,0340.1%
LINEs: 28,4303,748,1810.85%
L2/CR1/Rex14,7142,338,9240.53%
R1/LOA/Jockey52144,7090.01%
R2/R4/NeSL455105,9000.02%
RTE/Bov-B5567500,2600.11%
L1/CIN44612532,0820.12%
LTR elements: 28,6512,530,9580.58%
BEL/Pao1101229,2950.05%
Ty1/Copia24267,5590.02%
Gypsy/DIRS19380951,9900.22%
Retroviral3492282,7170.06%
DNA transposons 131,7208,566,7101.95%
hobo-Activator47,1292,981,6930.68%
Tc1-IS630-Pogo 21,6212,029,0420.46%
En-Spm 000%
MULE-MuDR 57331,2270.01%
PiggyBac 883102,3470.02%
Tourist/Harbinger 4770306,5920.07%
Other (Mirage, P-element, Transib)19990710%
Unclassified 34,2323,303,9660.75%
Rolling-circles 6859386,1290.09%
Small RNA 2761216,0830.05%
Satellites 5255334,2940.08%
Simple repeats 436,62023,219,4275.28%
Low complexity 35,6532,080,1410.47%
SINE = short interspersed element; LINE = long interspersed element; LTR = long terminal repeat.
Table 4. Comparative structural and gene ortholog statistics between Genypterus blacodes and Genypterus chilensis genome assemblies.
Genypterus blacodesGenypterus chilensis
Genome size (Mb)463.8439.89
Number of scaffolds598381
Scaffold N50 (Mb)4.87.96
Number of contigs598437
Contig N50 (Mb)4.86.98
GC percent44.5
Complete BUSCOs (%)98.698.1
Complete and single-copy BUSCOs (%)9797
Complete Duplicated BUSCOs (%)1.61.3
Fragmented BUSCOs (%)0.70.4
Table 5. Comparative statistics of available references’ genomes assemblies of Ophiidiformes.
Genome Size (Mb)Number of ScaffoldsScaffold N50Number of ContigsGC Content (%)
Genypterus chilensis439.893817.96 Mb43744.66
Genypterus blacodes463.85984.8 Mb59844.5
Lucifuga dentata630.721,240120.9 Kb31,17139
Brotula barbata485.129,85445.8 Kb59,40242.5
Carapus acus387.846,69916.9 Kb70,74747
Lamprogrammus exutus492.9120,9375.5 Kb145,53642
Bassozetus sp. 1645.6462,8094.2 Kb462,80943
Bassozetus sp. 2680.814330.3 Mb44743
Disclaimer/Publisher’s Note: The statements, opinions and data contained in all publications are solely those of the individual author(s) and contributor(s) and not of MDPI and/or the editor(s). MDPI and/or the editor(s) disclaim responsibility for any injury to people or property resulting from any ideas, methods, instructions or products referred to in the content.