Article

The Effects of Early Temperature and Live Feeds on the Development of White Muscle in Greater Amberjack (Seriola dumerili)

by
Rafael Angelakopoulos
1,†,
Andreas Tsipourlianos
1,†,
Alexia E. Fytsili
1,
Nikolaos Mitrizakis
2,
Themistoklis Giannoulis
3,
Nikos Papandroulakis
2 and
Katerina A. Moutou
1,*
1
Laboratory of Genetics, Comparative and Evolutionary Biology, Department of Biochemistry and Biotechnology, University of Thessaly, Biopolis, 41500 Larissa, Greece
2
AquaLabs, Institute of Aquaculture, Hellenic Centre for Marine Research, Gournes, 71500 Heraklion, Greece
3
Laboratory of Biology, Genetics and Bioinformatics, Department of Animal Science, University of Thessaly, Gaiopolis, 41334 Larissa, Greece
*
Author to whom correspondence should be addressed.
These authors contributed equally to this work.
Fishes 2025, 10(7), 360; https://doi.org/10.3390/fishes10070360
Submission received: 10 June 2025 / Revised: 11 July 2025 / Accepted: 18 July 2025 / Published: 20 July 2025
(This article belongs to the Special Issue Growth, Metabolism, and Flesh Quality in Aquaculture Nutrition)

Abstract

Greater amberjack (Seriola dumerili) shows potential for Mediterranean aquaculture due to its swift growth, consumer appeal, and commercial value. However, challenges in juvenile production, such as growth dispersion and unsynchronized development, impede further expansion. This study explores the impact of rearing temperature and live feed types on early white muscle development in greater amberjack larvae. Findings reveal substantial effects of temperature and diet on larval development, highlighting that the combination of 24 °C and a copepod + rotifer co-feeding scheme resulted in the highest axial growth rate, whereas rotifer-fed larvae at 20 °C exhibited a slower pace. Incorporating both histological and gene expression analyses, the study underscores temperature’s significant influence on white muscle development. Among larvae reared at 24 °C, the two live feed types led to phenotypic variations at metamorphosis, with rotifers supporting longer larvae featuring a smaller total cross-sectional area compared to copepods. Gene expression analysis indicates heightened mylpfb and myog expression at 24 °C during early larval stages, suggesting increased hyperplasia and myoblast differentiation. This study highlights the necessity of considering both temperature and feed type in larval rearing practices for optimal muscle development, and further research exploring combined diets during rearing could offer insights to enhance amberjack aquaculture sustainability.
Key Contribution: The study demonstrates that both the rearing temperature and live feed type significantly influence early white muscle development in greater amberjack (Seriola dumerili) larvae. By integrating histological and gene expression analyses, it identifies the combination of 24 °C and copepod + rotifers scheme diet as optimal for promoting muscle hyperplasia and accelerated axial growth.

1. Introduction

Greater amberjack (Seriola dumerili) is a cosmopolitan species found throughout the temperate zone and has high growth rates; consumer appreciation and commercial value make it a highly promising candidate for the diversification of the Mediterranean aquaculture. Greater amberjack has the potential to reach 6 kg in 2.5 years under culture conditions, and it grows in a wide temperature range, varying from 15 to 27 °C [1]. Hormonally induced spawning is a well-developed process, yet there are still many limiting factors for the further expansion of greater amberjack farming [2,3]. Growth dispersion at the hatchery stages and unsynchronized development are major drawbacks in intensifying juvenile production, as the size variation reaches up to 200 or 300%, imposing serious management problems in the industrial production of the species [4]. Early in development, this variation often stems from differential growth rates and feeding efficiency among otherwise similarly sized larvae, which can rapidly lead to the formation of dominant individuals and subordinate classes. The introduction of live feeds such as Artemia has been repeatedly linked to the onset of aggressive behaviors and cannibalism, particularly in carnivorous species like greater amberjack (Seriola dumerili), yellowtail kingfish (S. lalandi), and Japanese yellowtail (S. quinqueradiata) [5]. Larger individuals may chase, nip, or even partially consume smaller siblings, leading to injuries, chronic stress, and suppressed feeding in the latter [6]. These interactions amplify size heterogeneity, decrease overall survival, compromise juvenile quality, and increase production costs due to the need for size grading and intensified management [7]. Inevitably, this variation in size has negative effects on production performance, the quality of juveniles and of the final product, and the cost of production.
During development, the alimentary shift from endogenous to exogenous feeding is accompanied by a significant increase in muscle mass. White muscle accounts for 70% of total body mass and is the fastest-developing tissue [8]. It consists of muscle fibers, multinucleated cells that result from recurrent events of hyperplasia (the creation of new muscle fibers) and have the ability to increase in size (hypertrophy) by synthesizing and accumulating contractile proteins of the sarcomere [9]. Muscle fiber recruitment occurs in three distinct phases during development: (1) embryonic myogenesis; (2) stratified hyperplasia, which adds new white muscle fibers at the dorsal and ventral apical zones; and (3) mosaic hyperplasia, which mainly progresses by fusing myogenic progenitor cells to form new myotubes [8]. The latter results in mature musculature with fibers of varying diameters, which is responsible for a mosaic appearance. In species that reach large adult sizes, post-larval hyperplastic growth continues, forming new fibers around the mature, large fibers, further contributing to the mosaic appearance of the muscle [10].
The number of muscle fibers in fish is directly related to the individual’s size. Even the large growth rate recorded in fish that have been genetically modified to produce greater amounts of growth hormone is due to the greater production of muscle fibers [11]. Consequently, smaller individuals are expected to have a smaller number of muscle fibers than larger ones, and the factors responsible for the phenomenon are expected to affect the mechanisms of hyperplasia and hypertrophy [12]. At the same time, tissue remodeling plays a key role in development, modulating myogenesis—the formation of muscle fibers—which is essential for locomotion and prey capture. This aligns with the concurrent process of skeletal development, encompassing ossification and cartilage formation, which contributes to the establishment of a functional skeletal system, providing crucial support for muscle growth [13].
Temperature is one of the main factors affecting embryo and larval development in fish, which is a basic feature of their poikilotherm nature. In the genus Seriola, the longfin yellowtail (Seriola rivoliana) exhibited an accelerated developmental pace with increasing constant (16–32 °C) egg incubation temperatures, and the hatched larvae at 20 °C had the highest yolk sac and oil drop volume. Larvae length and morphological traits were also variably affected by the egg incubation temperature [14]. The effect of the incubation temperature (20–30 °C) on the size of–the lipid droplet and the content of triacylglycerides at the egg stage was confirmed in a subsequent study [15], in addition to the impact of the early rearing temperature (16–32 °C) on the hatching rate, larvae survival and growth, yolk sac and oil droplet consumption, protein and lipid contents, notochord size, and mouth opening [16]. Similarly, the egg incubation and larvae rearing temperature (22, 26, and 28 °C) significantly affected the expression of key molecules in the hypothalamic–pituitary–thyroid axis and their ontogenetic profile in early longfin yellowtail larva, without evidence of endocrine disruption [17].
In the advent of climate change, the effects of early temperature on Seriola development gain perspective beyond aquaculture, as the genus includes circumglobal species. When the effects of the projected future temperature and carbon dioxide (CO2) levels on survival, growth, morphological development, and swimming performance on the early life stages of the yellowtail kingfish Seriola lalandi were studied in cross-factored treatments from fertilization to 25 days post-hatching (dph), temperature had the greatest effect on survival, growth, and development. The critical swimming speed (Ucrit) was increased by elevated temperatures but reduced by elevated pCO2, indicating the importance of early events in life traits critical in fish stock dynamics [18].
Along with temperature, feed type and quality are crucial for a successful transition from endogenous to exogenous feeding, and the benefits from accelerated development at higher temperatures should be balanced with adequate nutrient supply. Zooplankton is the primary natural food supply for larval and young fish in the wild [19], and in order to simulate natural feed chains, rotifers (Brachionus sp.) and Artemia nauplii have traditionally been the principal live feed utilized in marine aquaculture [20]. Although larval rearing has been accomplished in greater amberjack by feeding Artemia and rotifers, their fatty acid profile is unavoidably enriched due to a lack of key fatty acids [21]. Marine copepods, which are a well-established element of the food chain in natural habitats, offer another feeding option, and previous studies have shown that copepods may meet Seriola dumerili’s exceptionally high needs during the larval stage [22]. In addition, experiments exploring how rearing temperatures affect feeding rate in S. lalandi larvae revealed that the quantity of rotifers and Artemia ingested can be optimized via temperature manipulation [23].
In search of the mechanisms underlying size variation at the early stages in S. dumerili, in this study, we investigated how the combination of two different temperatures during the autotrophic stages and two different live feeds (rotifers and copepods) affected larvae ontogeny and the process of myogenesis up to metamorphosis. The expression of marker genes at major developmental stages was coupled with histological measurements of the white myotomal area to infer the effects on white muscle hyperplasia and hypertrophy.

2. Materials and Methods

2.1. Ethics Statement

Fish were reared at the Hellenic Center of Marine Research (HCMR) in Crete, Greece. The HCMR aquaculture facilities are certified by the national veterinary authority (code GR94FISH0001) and are licensed for operations of breeding and experimentation with fish issued by the Region of Crete, General Directorate of Agricultural & Veterinary, No. 3989/1 March 2017 (approval codes EL91-BIObr-03 and EL91-BIOexp-04). The experimental protocol was approved by the Veterinarian Authority of the Region of Crete in the 255,332/29 November 2017 document. Animal experiments were carried out in accordance with the EU Directive 2010/63/EU.

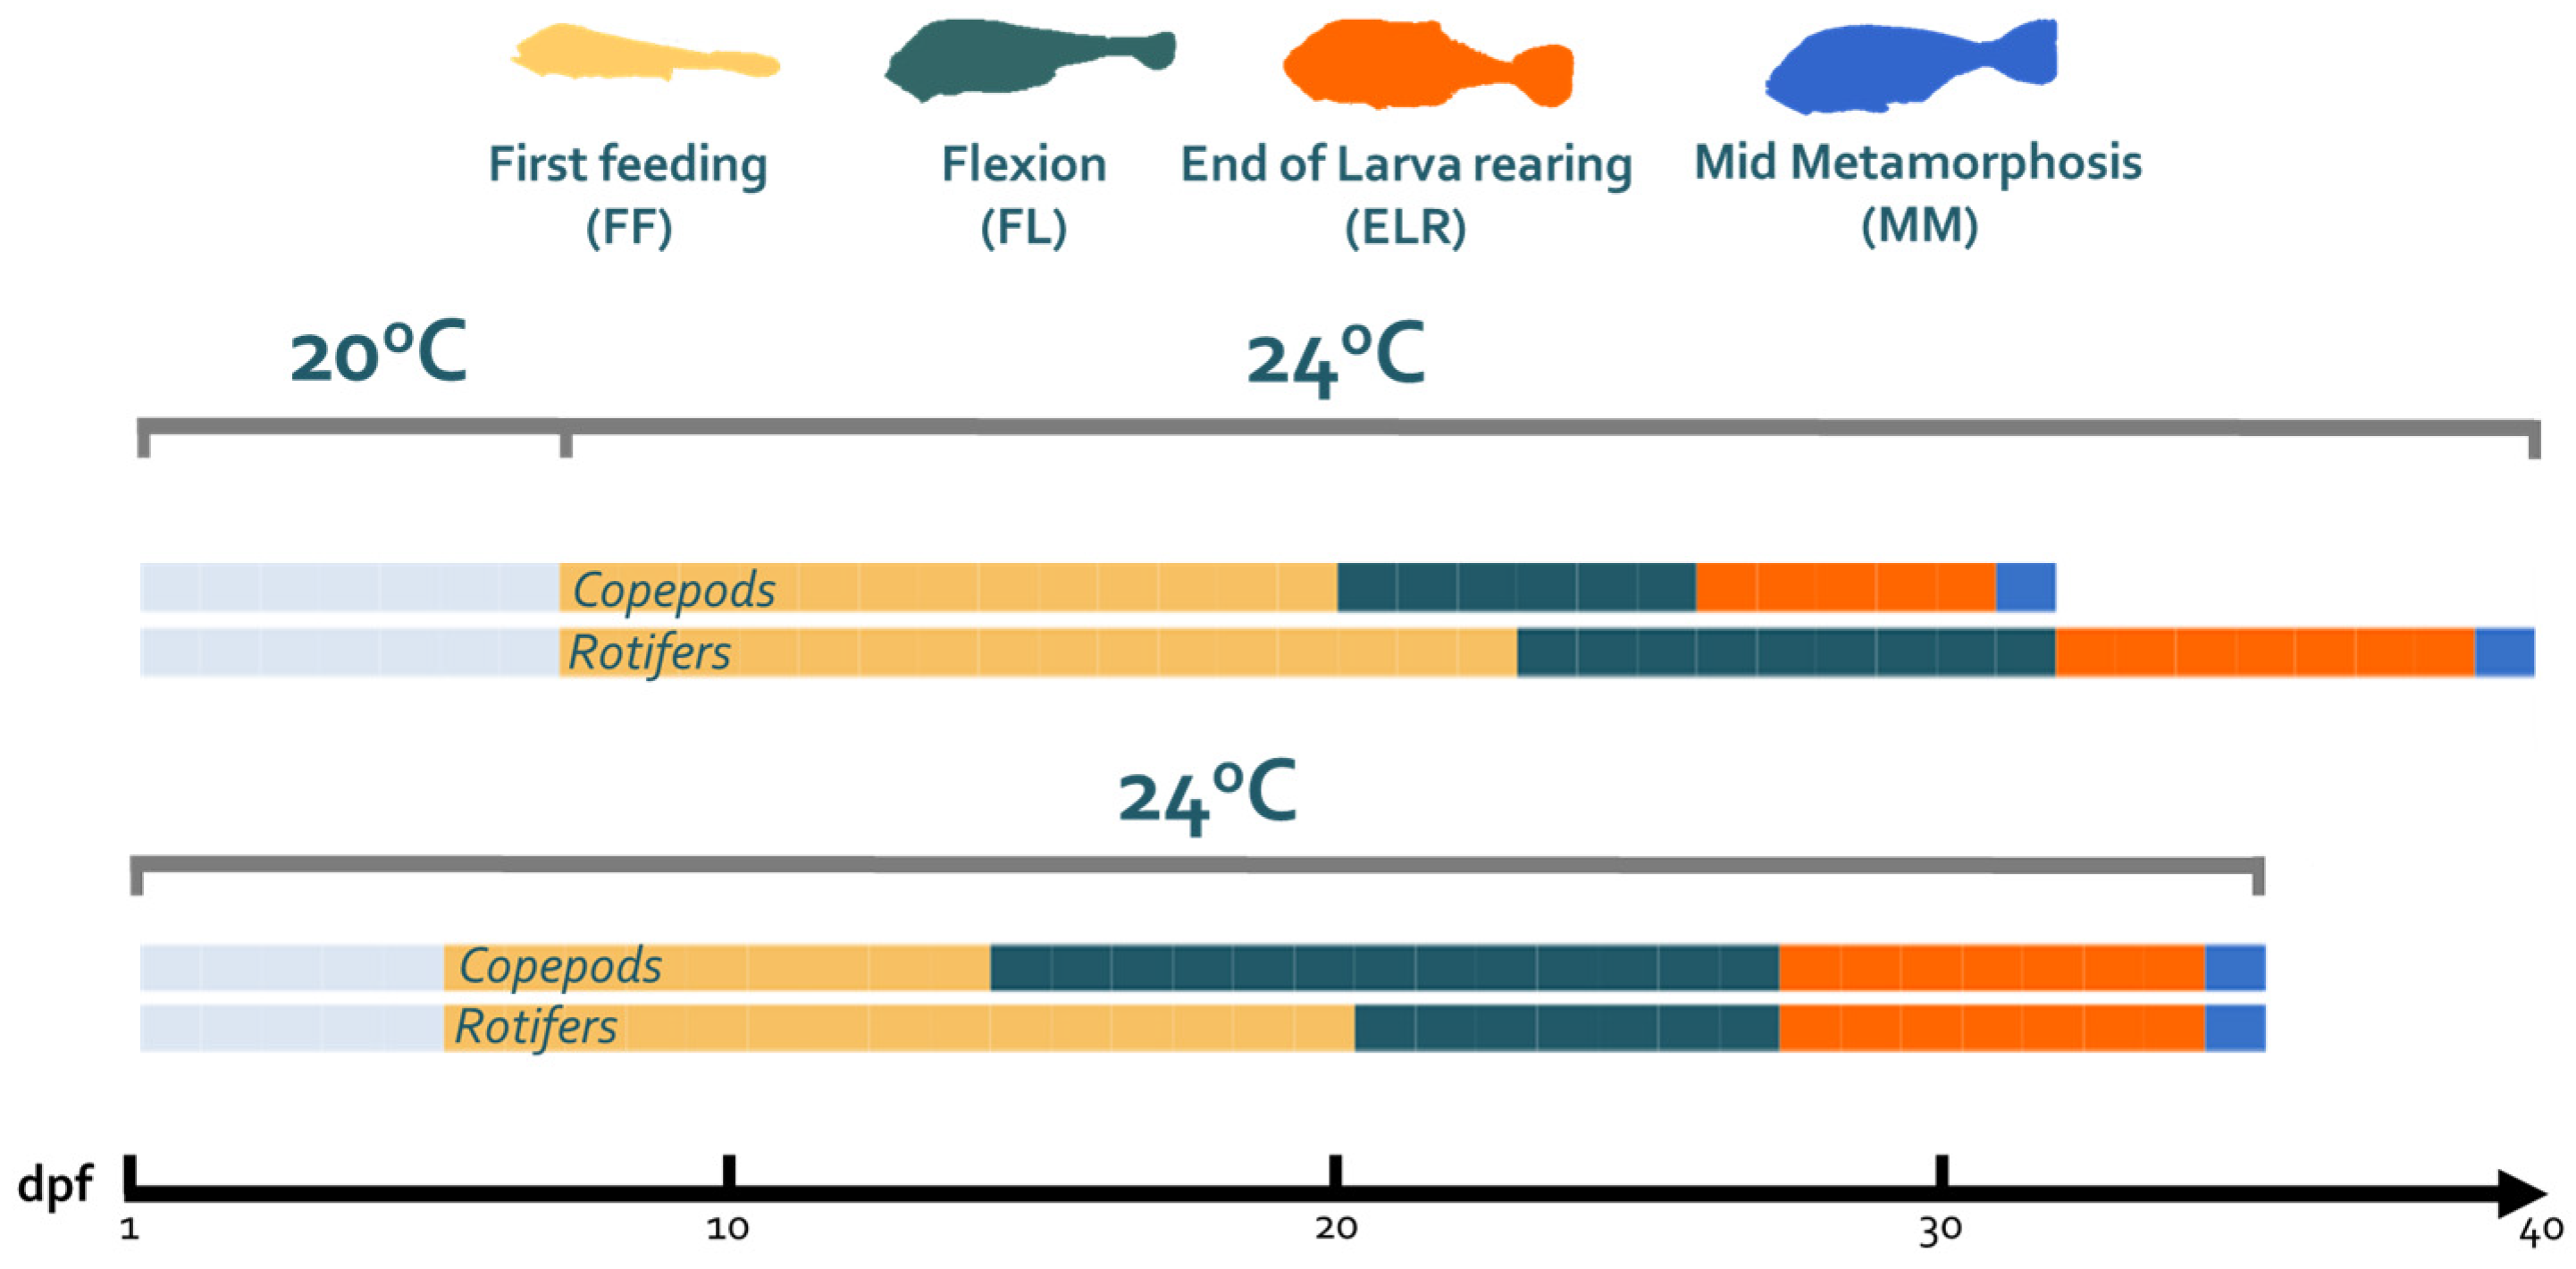
2.2. Experimental Rearing

Larval rearing trials were performed in the facilities of the Institute of Marine Biology, Biotechnology and Aquaculture at the Hellenic Centre for Marine Research (HCMR, Crete, Greece). Greater amberjack eggs from a hormone-induced spawn of captive breeders were subjected to a 2 × 2 rearing experiment, where fertilized eggs were incubated either at 20 °C or 24 °C throughout the autotrophic stage. From first feeding onwards and throughout the larval stages up to metamorphosis, the water temperature was maintained at 24 °C. At first feeding, larvae were fed with either rotifers or rotifers combined with copepods (Table 1). This design resulted in four experimental groups: 20R (20 °C, rotifers), 20C (20 °C, rotifers + copepods), 24R (24 °C, rotifers), and 24C (24 °C, rotifers + copepods).
Eggs were incubated in 500 L cylindroconical tanks (80 eggs L−1) with a white internal wall and underwater light. For each treatment, two independent RAS (recirculating aquaculture system) tanks were used, ensuring biological replication at the tank level. The tanks were connected to a closed water recirculating system coupled to a biological filter. Tanks were filled with borehole 35 psu water, pH ranged from 7.8 to 8.2, and the dissolved oxygen was maintained between 4.9 and 7.2 mg/L. During embryogenesis, egg hatching, and the autotrophic larval stage, water circulation was achieved through a biological filter at a rate of 15% of tank volume per hour. After the first feeding, water circulation was maintained for each tank by means of an airlift pump. The water in the biological filter was used for renewal in the larval rearing tanks at a rate of 3% daily until 9 dph and then increased gradually to 50% until 25 dph. The photoperiod was 00L:24D during the autotrophic stage, switched to 24L:00D (constant light) from mouth opening until 20 dph, and kept at 18L:06D for the remaining experimental period.
Two feeding schemes were applied at each temperature group. The types of diet used in each feeding scheme and the time of application are shown in Table 1. Copepods were obtained from C-Feed (Norway), and they were reared according to the manufacturer’s instructions. Rotifers (Brachionus sp.) enriched with DHA Protein Selco (INVE S.A., Dendermonde, Belgium) were added daily to the rearing tanks from 2 dph to 17 dph. Instar I AF Artemia nauplii (9 to 19 dph) and instar II EG Artemia nauplii (12 to 35 dph) enriched with A1 DHA Selco (INVE S.A., Dendermonde, Belgium) were offered to the larvae at a starting concentration of 0.05 to 0.35 nauplii mL−1. Enrichment in all cases was performed according to the manufacturer’s instructions. Prey concentrations were carefully adjusted to match larval developmental needs. In the rotifer-only (R) treatment, rotifers were administered at a density of 5 individuals/mL, three times daily. In the rotifer + copepod (C) treatment, during the co-distribution phase (2–8 dph), copepods and rotifers were provided at 5 and 2 individuals/mL, respectively, also three times daily. From 9 dph onward, rotifers were increased to 5 individuals/mL. AF Artemia were introduced at 0.5 individuals/mL, three times daily. EG Artemia were initially administered at 0.1 individuals/mL on the first day of use, gradually increasing to 1 individual/mL by 20 dph and then to 2 individuals/mL by 25 dph, a level that was maintained thereafter. Minor adjustments to prey densities were made throughout the trial in response to larval consumption.
Microalgae [2 L Chlorella sp. (density: 80 M*mL−1) and 1 L Isochrysis sp. (density: 50 M*mL−1)] produced in HCMR installations were added daily to the tanks. All tanks were equipped with a surface skimmer for removing buoyant organic material up to 13 dph, and microdiets were added in both feeding schemes, starting with the smallest size available (NRD 1/2, grain size 100–200 μm, INVE S.A., Dendermonde, Belgium). The distribution of the microdiets was manual at the beginning (a few times daily) and performed with an automatic feeder from 16 dph onwards.
Larval samples were collected at three key developmental stages: notochord flexion (FL), the end of larval rearing (ELR), and middle metamorphosis (MM). These stages were selected due to their biological and practical significance for hatchery operations. The criteria used to define each stage followed standard hatchery practices. Specifically, the FL stage corresponded to the point at which notochord flexion was observed in at least 50% of the individuals within each tank. The ELR stage, a hatchery-derived term, often referred to as the “all fins” stage, was defined by the presence of all fins in 50% of the larvae. Finally, the MM stage was reached when 50% of the individuals exhibited juvenile characteristics and had completed metamorphosis. For histological analysis, white muscle samples were used. Ten individuals per stage for each condition were placed in cold Serra’s (ethanol, formaldehyde, and glacial acetic acid) fixative and kept at 4 °C. For gene expression analysis, eight individuals per stage for each condition were sampled and stored in RNA later at −20 °C until further analysis.

2.3. Quantitative Histology

Samples were processed using a carousel tissue processor (MTP, SLEE medical, Nieder-Olm, Germany). They were first dehydrated in graded ethanol to minimize distortion. Xylene was then used to displace ethanol and partially remove lipids, facilitating paraffin infiltration. Infiltration involved replacing xylene with liquid paraffin. For embedding, specimens were oriented in stainless-steel molds filled with molten paraffin (58 °C). Serial transverse sections (6 μm) were prepared by using a microtome (Leica Biosystems, Nussloch, Germany R2125), placed on glass slides, and dried at room temperature overnight [24]. Sections were stained with Ehrlich hematoxylin and 1% eosin [25] after the dewaxing of the sections in xylene (two changes for 15 min), rehydration through a graded ethanol series (100%, 95%, and 70%), and washes in distilled water. Following staining, re-dehydration was performed with increasing concentrations of ethanol washes (70%, 95%, and 100%) [24]. The sections were then mounted with DPX mounting medium. Stained sections of 10 individuals per group were observed by using a light microscope (Leica Microsystems, Nussloch, Germany, DM2000) coupled with a digital camera, and captured images were analyzed using ImageJ software (NIH, Bethesda, MD, USA, software version: 1.53u 15 October 2022). The samples were classified by total length (TL) by group age and chosen at random for embedding. Each specimen was studied in one dorsal epaxial quadrant of the myotome placed in the vent region, and the total cross-sectional area (TCSA) of this quadrant was measured in three different cross-sections. Sections of the FF group were omitted due to poor quality.

2.4. RNA Extraction and Reverse Transcription

Total RNA was extracted using E.Z.N.A.® Total RNA Kit I (Omega Bio-Tek, Norcross, GA, USA) according to the manufacturer’s protocol and was further treated with DNAfree DNA Removal kit (Thermo Scientific, Waltham, MA, USA) to remove any DNA residuals. RNA quantity and quality were assessed using a Qubit™ RNA BR Assay Kit. cDNA synthesis was performed using the High-Capacity cDNA Reverse Transcription Kit with RNase Inhibitor (Thermo Scientific, Waltham, MA, USA), 1 μg of DNAse-treated total RNA, and a combination of oligodTs and random primers according to the kit’s manual. cDNA samples were further diluted (1:20 for all samples) and were stored at −80 °C until further use.

2.5. Relative Quantification of Gene Expression Determined Using Real-Time Quantitative Polymerase Chain Reaction Analysis

The gene expression levels of genes implicated in hypertrophy (myosin light chain, phosphorylatable, fast skeletal muscle a, mylpfa), hyperplasia (myosin light chain, phosphorylatable, fast skeletal muscle b, mylpfb), the coordination of myogenesis (myogenin, myog), and tissue and bone remodeling (cathepsin S, ctss2.1), were detected using the Real time PCR method. Primers were designed using Primer3 (v.0.4.0) and Beacon Designer software, and all primers were designed to span the coding sequences of the transcripts (Table 2). QPCR efficiency was calculated using a standard curve using serial dilutions of all samples (pooled cDNA sample, 1/5, 1/10, 1/20, 1/50, 1/100, 1/200) [26].
A real-time polymerase chain reaction was conducted in a StepOne PCR System (Thermo Scientific, Waltham, MA, USA) in duplicates by using the KAPA SYBR FAST qPCR (2×; KAPA Biosystems, Wilmington, MA, USA, KK4602). All reactions contained 200 nmol/L of each primer and 2 μg/μL cDNA in a reaction volume of 10 μL. The following PCR conditions were used: an initial denaturation step at 95 °C for 5 min and 40 cycles of amplification (each cycle was 20 s at 95 °C, and 20 s at 60 °C), followed by the melting curve step (15 s at 95 °C, 1 min at 50 °C, 15 s at 95 °C) to verify the specificity of the reaction.
A series of housekeeping genes (ef1α, b-actin, rpl13a, and rps18) were validated for use and were rated using the geNorm VBA applet [27]. The most stable housekeeping genes used for normalization were rps18 and rpl13a.

2.6. Statistical Analysis

From the obtained Ct values, R0 was calculated using R0 = Threshold/(1 + efficiency) ct, and was normalized using the geometric mean of the two most stable expressed housekeeping genes [27,28]. Both morphometric and expression data failed to fit the Shapiro–Wilks test for normality and were analyzed using a non-parametric test. Significant differences between the expression level of each gene under different conditions were analyzed using the Wilcoxon signed-rank test. Kendall’s rank correlation was performed to assess the statistical dependence of the two variables. Statistical analyses were performed in R.

3. Results

3.1. Temperature and Live Feed Effect on Larvae Developmental Pace

The larval developmental transitions appear to be affected by both the feed type and temperature (Figure 1). The combination of 20 °C with a copepod + rotifers scheme resulted in the fastest developmental rate (32 days to the MM stage), whereas feeding on rotifers resulted in the slowest (40 days to the MM stage). Despite the differences in transitioning from stage to stage between the two feeding schemes at 24 °C, the larvae of both groups reached the MM stage on the same day (35). The transition to the exogenous feeding (FF) stage appeared to be temperature-dependent, since the 24 °C groups transitioned earlier, which is indicative of the sensitivity of this developmental stage to temperature fluctuations. Finally, the diet type appeared to influence the transition from the FL to ELR stage in either temperature, where a delay was observed in the groups fed with rotifers.
The axial-specific growth rate throughout development up to metamorphosis was the highest in the 20C group (0.42 mm/day) and the lowest in the 20R group (0.22 mm/day). However, no such difference in the axial SGR was observed between the 24C (0.35 mm/day) and 24R (0.33 mm/day) groups.

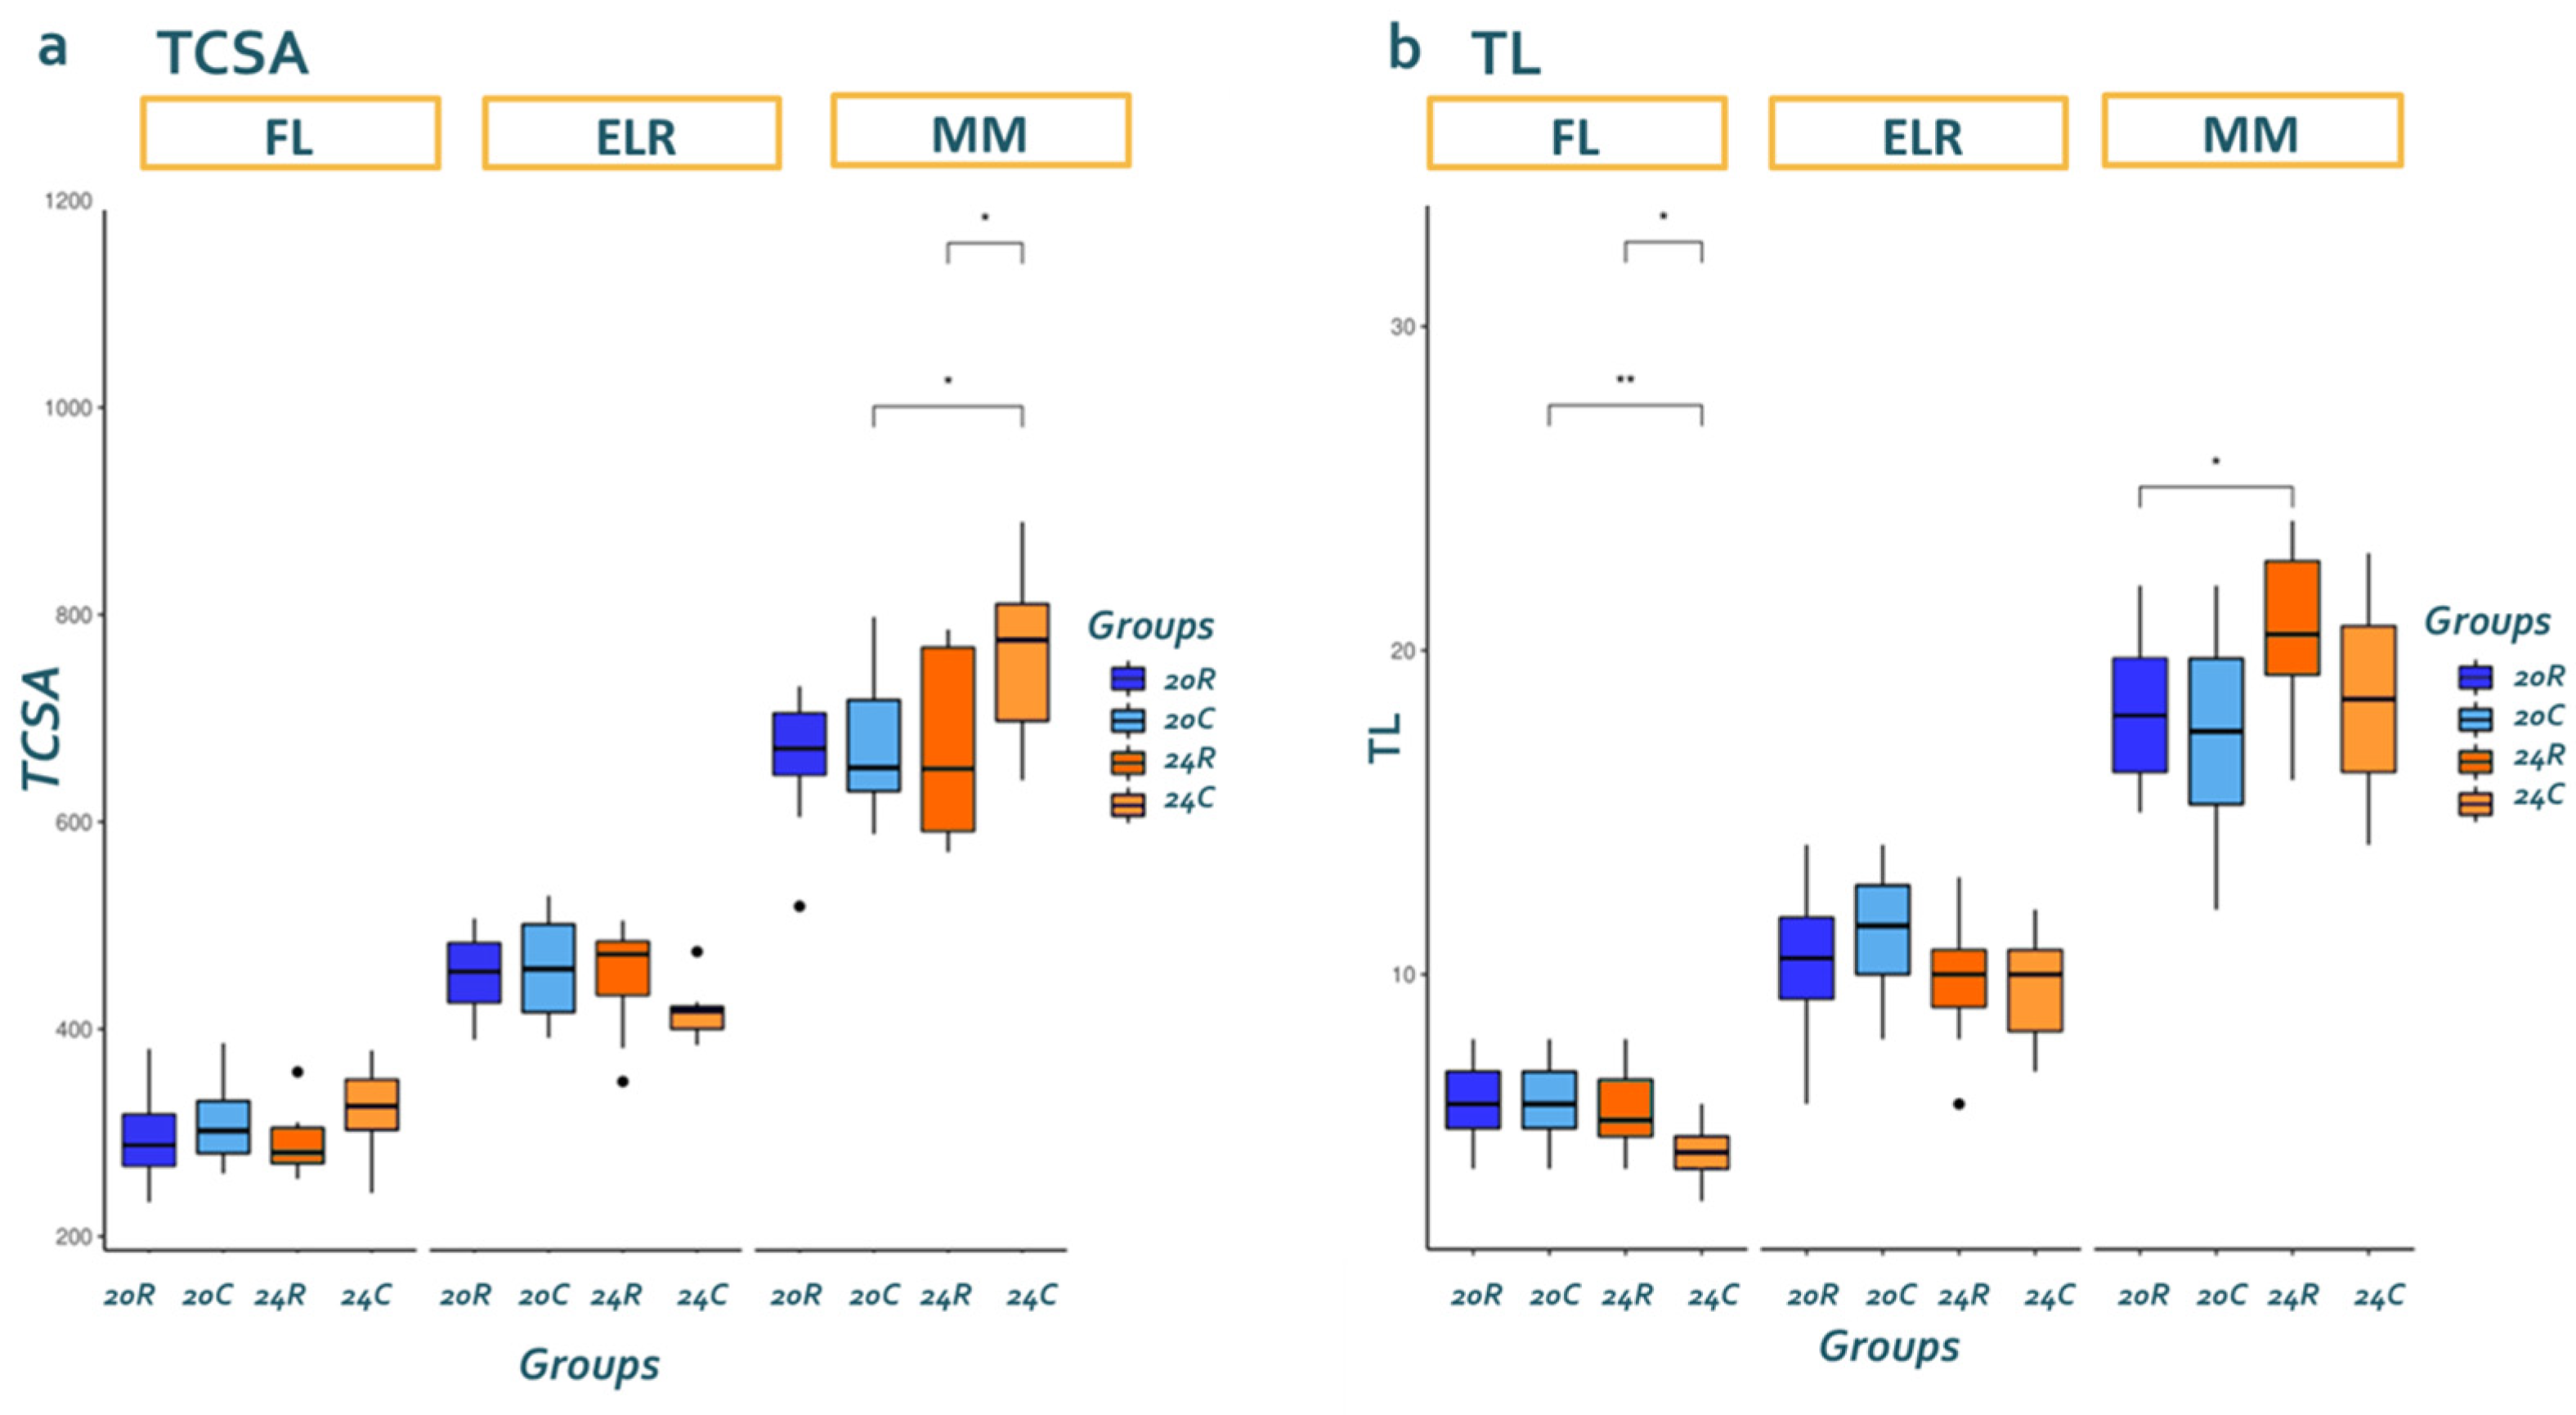
3.2. Stereological Analysis

Total length (TL) exhibited linear growth after hatching, and the TCSA of dorsal white muscle increased continuously between stages. The combined effect of temperature x live feed significantly affected larval growth (p = 0.037), whereas TCSA was strongly affected by the type of live feed (p = 0.039). At MM, the largest dorsal epaxial quadrant was observed in the larvae reared in the 24C group (p < 0.05). TCSA increased at different paces in the four groups, with 24C exhibiting the smallest TCSA at ELR and ending with the largest at MM. Interestingly, the 24C group had the shortest overall TL. Group 24R, on the other hand, exhibited high axial growth throughout the rearing phase. Overall, rearing at 24 °C appeared to favor axial and white muscle growth (Figure 2a,b). Representative histological sections for each group are shown in Supplementary Figure S1.

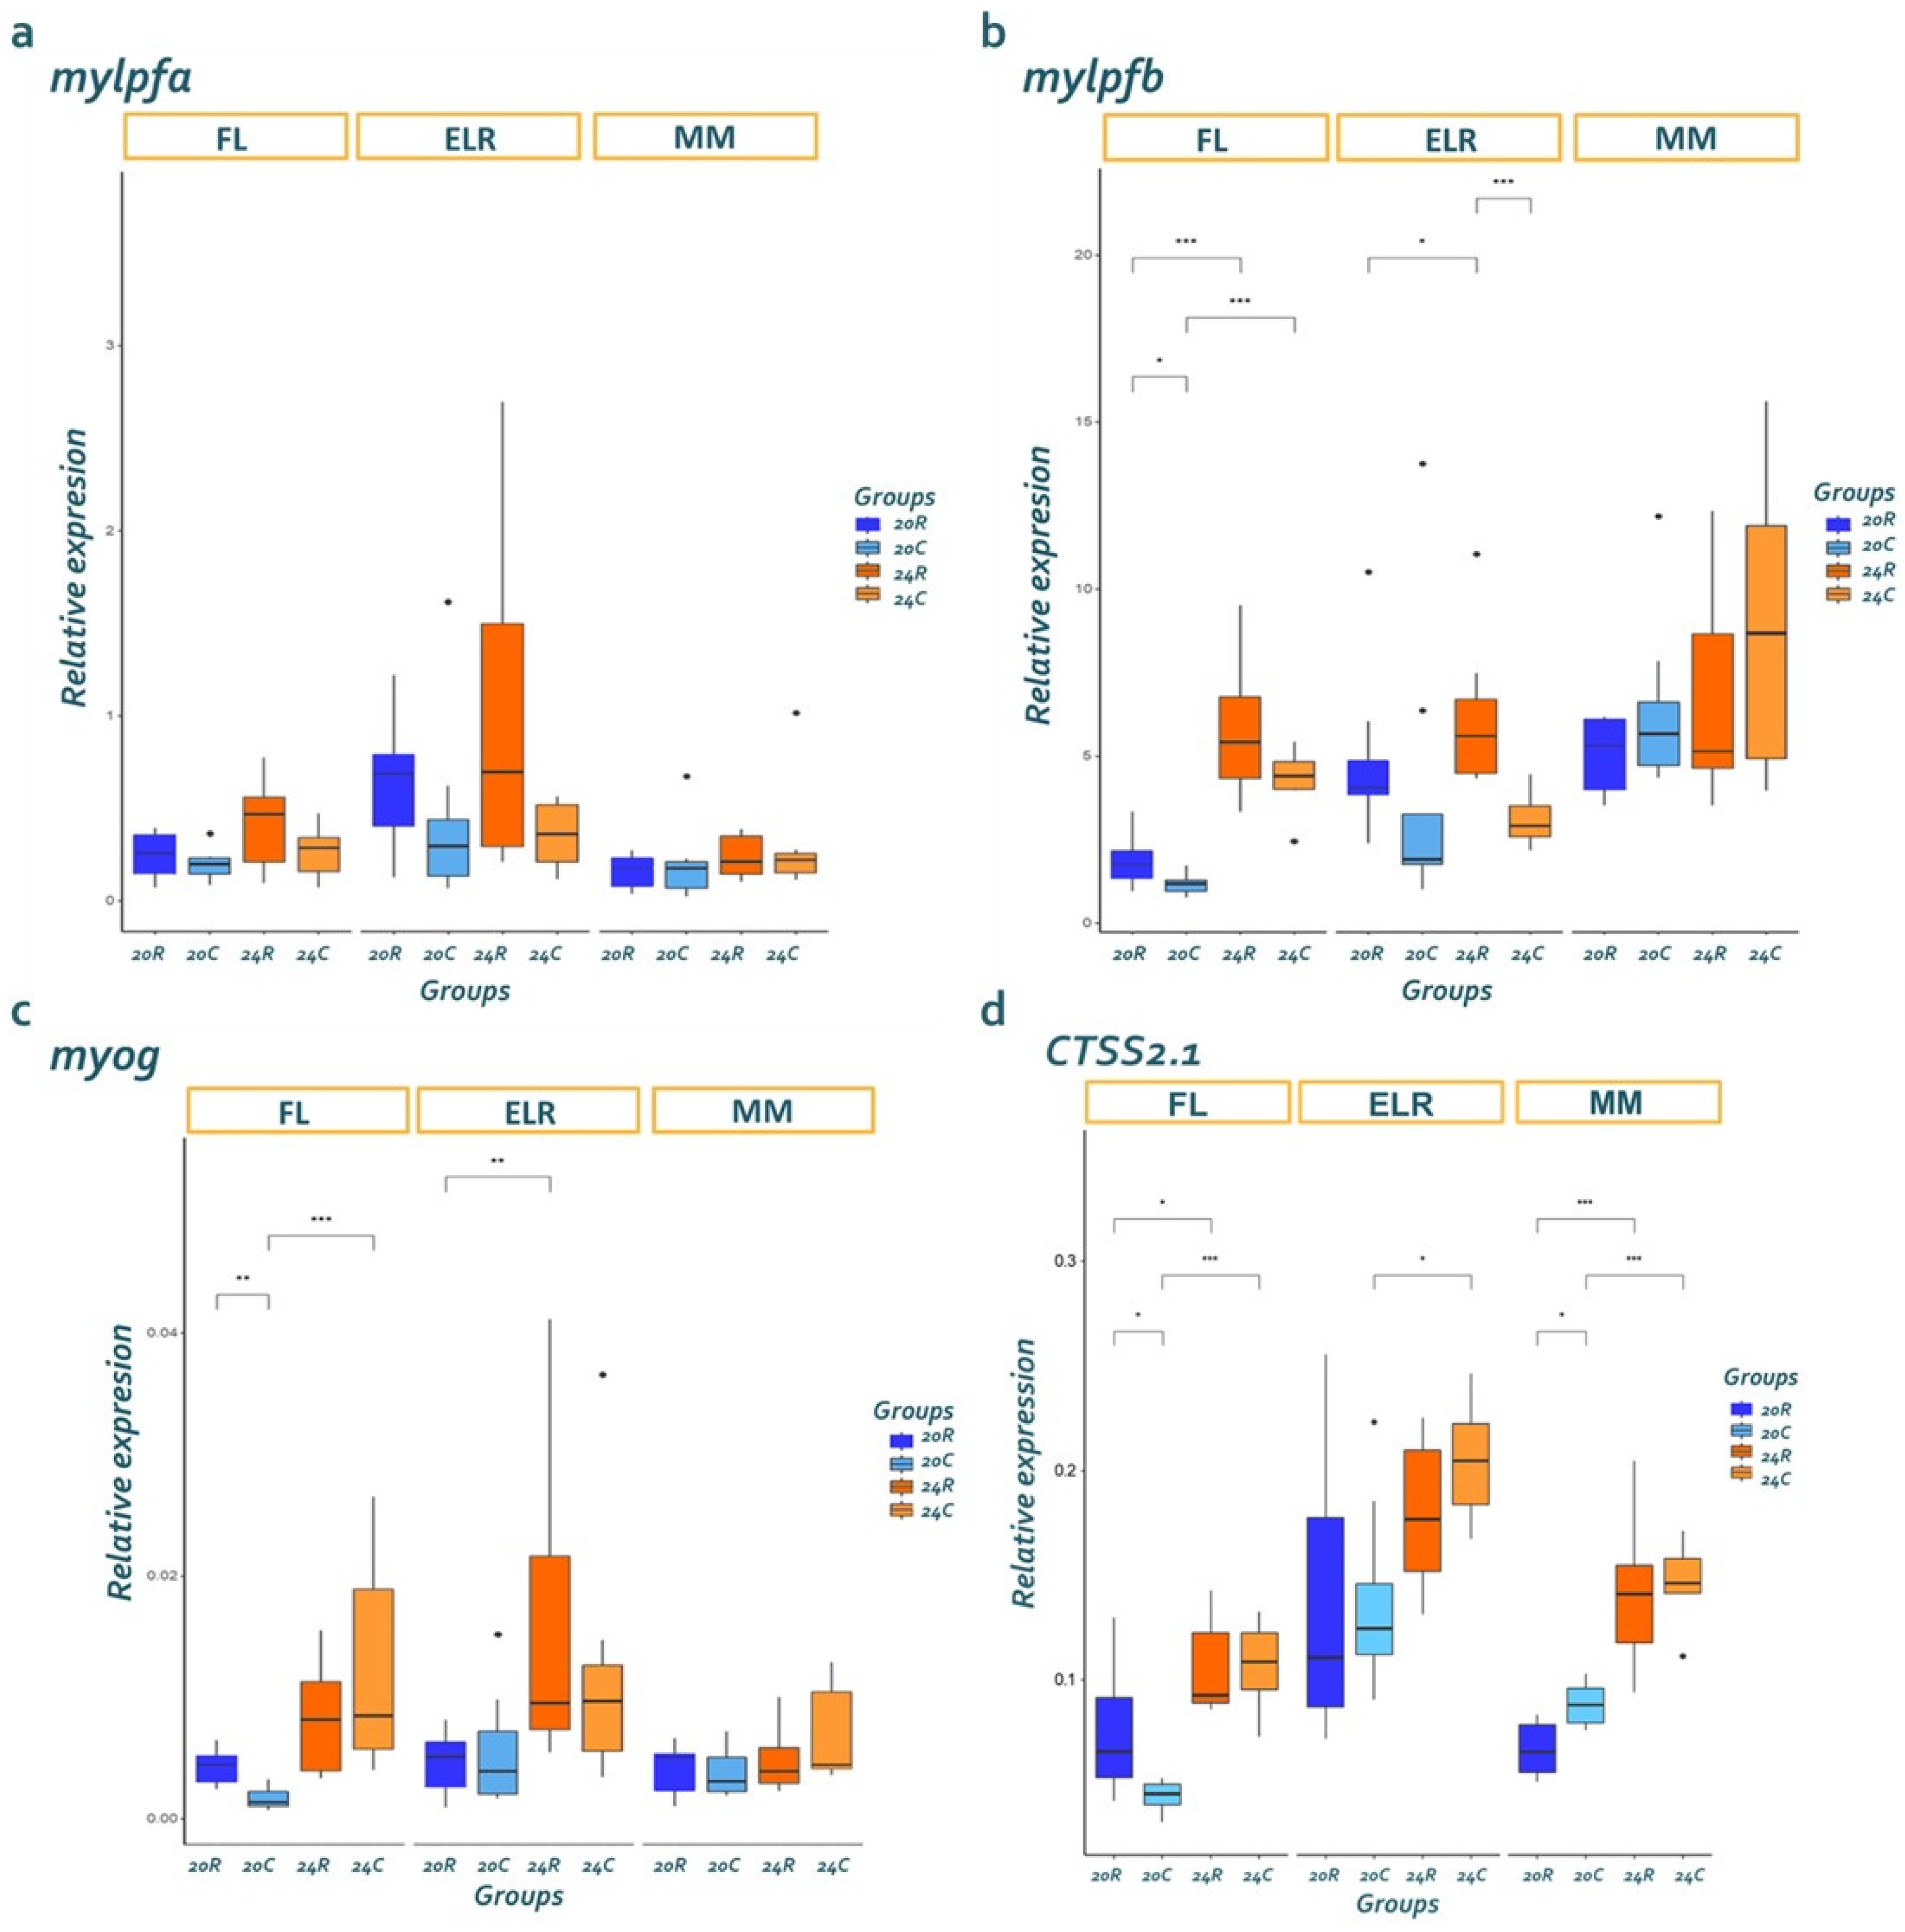
3.3. Gene Expression

The expression levels of the mylpfa gene did not differentiate with temperature and live feed (Figure 3a). Significant differences were identified in the expression of mylpfb (Figure 3b) and myog (Figure 3c) genes between the four groups at the stages of FL and ELR. At FL, the expression of myog, which drives myocyte differentiation, and mylpfb, which signifies hyperplasia, was higher in larvae reared at 24 °C. By ELR, group 24R exhibited the highest myog and mylpfb expression. At MM, mylpfb expression was highly dispersed in larvae reared at 24 °C, regardless of the type of live feed.
The expression levels of the ctss2.1 gene exhibited temperature-dependent alterations, with an increase in temperature associated with higher expression. The impact of live feed on the gene expression pattern was not uniform and varied across developmental stages. During the ELR stage, R groups exhibited higher expression levels than C groups. However, a notable shift occurred at the mid metamorphosis (MM) stage, where, at 20 °C, the gene expression levels in the rotifer-fed group were lower than those in the copepod-fed group (Figure 3d).

4. Discussion

Based on the results, both the rearing temperature and live feed type influenced the developmental pace and muscle development in greater amberjack larvae. Differences were observed in the time required to reach metamorphosis as well as in the transition pace between stages (Figure 1). The shift from larvae to juveniles depends on the proper deployment of hyperplastic and hypertrophic processes during the early phases of muscle development.
Diet plays an important role in muscle development by providing the necessary amino acids (e.g., lysine, methionine, and threonine) for muscle growth. As noted by Luís E. C. Conceição et al., rotifers and Artemia may contain suboptimal levels of certain amino acids, vitamins, and minerals. The specific amino acid composition of the diet is essential not only for efficient nutrient utilization but also for the regulation of gene expression involved in muscle metabolism [20]. Additionally, the ratio of essential to non-essential amino acids can influence protein turnover and the balance between protein synthesis and degradation [29]. Therefore, optimizing the amino acid composition of the diet is crucial for promoting muscle growth and development. The inclusion of alternative live feeds, such as copepods, may contribute to this goal by providing a more balanced nutrient profile.
White muscle development after hatching is mainly based on the formation of new muscle fibers. In gilthead sea bream, the early stages of hyperplasia are marked by the expression of the phosphorylatable myosin light chain b (mylpfb), which appears to be replaced by the phosphorylatable myosin light chain a (mylpfa) during hypertrophic muscle fiber growth [24]. The same two genes were identified in the genome of S. dumerili, and their ontogenetic profile matched that of gilthead sea bream; the expression of mylpfb was higher than the expression of mylpfa and increased with metamorphosis (Figure 3a,b). Based on our results, it seems that temperature had a minimal impact on white muscle hypertrophy (mylpfa), whereas it had a high impact on hyperplasia (mylpfb), with the highest expression levels observed at 24 °C for both live feeds studied. Similarly, a higher developmental temperature induced higher myogenin (myog) expression at FF and ELR stages. Myogenin is the transcription factor driving myocyte differentiation, and its upregulation precedes the upregulation of structural muscle-specific genes, such as the phosphorylatable myosin light chains [30].
It is well known that the environment, especially temperature and dissolved oxygen concentrations, has a significant impact on teleost embryonic development [8]. Muscles can have a role in behavior and locomotor performance in the early-life stages, which is directly linked to the survival ability of larvae. Additionally, the duration and intensity of myotube production during the adult stages, as well as the growth of skeletal muscle in some species, can be affected by the embryonic temperature regime [31]. Several species displayed varied patterns of muscle formation and growth in response to variations in temperature, indicating that the plasticity of larval myogenesis in teleost species due to temperature is a complicated and multifaceted phenomenon [32]. Higher temperatures tend to speed up metabolism and growth, which can result in higher rates of both hyperplasia and hypertrophy. Several studies in different species have shown the plastic response of myogenesis to temperature. A variety of responses for fast muscle morphology have been noted at high versus low egg incubation temperatures, with species-specific adaptations ranging from no alterations in muscle cellularity [33,34] to a transition toward either hypertrophy [35,36,37] or hyperplasia [38,39]. In greater amberjack, the plastic response of myogenesis to temperature was shown to be mainly driven by hyperplasia rather than hypertrophy (Figure 3a,b). These observations are in accordance with the findings for Atlantic herring and Atlantic cod [8].
Myoblast fusion is a multistep process involving myoblast recognition, adhesion, membrane breakdown, and actin cytoskeleton remodeling, as in other vertebrates [40]. In teleosts, subsequent myotube elongation involves extensive nuclear accretion through repeated myoblast–myotube fusion, with the new nuclei integrating into the syncytium and contributing to muscle fiber growth [41]. Concurrently, early teleost development features tissue remodeling linked to morphological changes. Cathepsin S, a key gene in tissue remodeling and bone formation [42], showed increased expression with rising temperature (Figure 3d). Across all groups, ctss2.1 peaked at the ELR stage, coinciding with major morphological transitions such as fin and scale development. At 20 °C, live feed influenced ctss2.1 expression, potentially reflecting the role of dietary composition, particularly phosphorus availability, in ossification and growth, as supported by previous studies [43,44,45,46,47]. Interestingly, the 24C group, despite exhibiting comparable growth rates to other groups and a significant increase in myomeres, had a shorter length compared to larvae reared with rotifers. Ossification has been associated with length increase in fish larvae [48,49], and our findings follow a pattern previously described in copepod-fed larvae, which exhibited a delay in ossification, despite experiencing substantial growth [48].
It is noteworthy that total length variation at metamorphosis was comparable between all four groups (Figure 2b). However, variation in TCSA was higher in the groups reared at 24 °C, as it involved the variation in mylpfb (Figure 2a and Figure 3b), which can be indicative of broader size variation later on. These results make muscle development mechanisms possible contributors to the size disparity often observed in greater amberjack, and a higher rearing temperature is a driver of size disparity, which should be further investigated before a link can be established.

5. Conclusions

The development of white muscle in greater amberjack larvae is influenced by a variety of factors, including the rearing temperature and feed type. In summary, the 24C group had the fastest axial growth, while the 20R group had the slowest growth. The groups given copepods transitioned faster from the FF to the FL stage at both rearing temperatures. Our study, which involved both histological and gene expression analyses, found that temperature had a significant impact on white muscle development, with larvae reared at 24 °C exhibiting a higher rate of muscle development compared to those reared at 20 °C. Interestingly, among larvae reared at 24 °C, the type of live feed used was associated with phenotypic variance at metamorphosis (MM), with rotifers supporting longer larvae with a smaller total cross-sectional area (TCSA) compared to copepods. A faster pace of development was associated with greater variation in gene expression levels, but not with greater variation in total length (TL). These findings provide valuable insights into the factors that affect the development of white muscle in greater amberjack larvae and underscore the importance of considering both temperature and feed type during larval rearing. Rearing at 24 °C promoted muscle growth in great amberjack larvae, along with higher individual variation in TCSA, which might be linked to broader size disparity.

Supplementary Materials

The following supporting information can be downloaded at: https://www.mdpi.com/article/10.3390/fishes10070360/s1, Figure S1: A: Representation of the dorsal epaxial quadrant of the myotome located in the ventral region of the specimen. The total cross-sectional area (TCSA) was measured within this defined quadrant to assess muscle growth. B: Histological sections for each group. The sections are stained with H&E. 20R: group reared at 20 °C fed rotifers, 20C: group reared at 20 °C fed copepods, 24R: group reared at 24 °C fed rotifers, 24C: group reared at 24 °C fed copepods.

Author Contributions

Conceptualization, K.A.M.; methodology, R.A., A.T., A.E.F. and T.G.; sampling, N.M. and A.T.; investigation, R.A., A.T. and A.E.F.; data curation, N.P. and T.G.; writing—original draft preparation, R.A., A.T. and A.E.F.; writing—review and editing, T.G. and K.A.M.; visualization, R.A. and A.T.; supervision, K.A.M.; project administration, K.A.M. and N.P. All authors have read and agreed to the published version of the manuscript.

Funding

This research was co-financed by Greece and the European Union, the European Maritime and Fisheries Fund, in the context of the implementation of the Greek Operational Programme for Fisheries, Priority Axis “Innovation in Aquaculture”, project title “Investigation of size variability in reared juveniles of greater amberjack towards improved production and husbandry practices”, MIS 5010923.
Fishes 10 00360 i001

Institutional Review Board Statement

Fish were reared at the Hellenic Center of Marine Research (HCMR) in Crete, Greece. The HCMR aquaculture facilities are certified by the national veterinary authority (code GR94FISH0001) and are licensed for operations of breeding and experimentation with fish issued by the Region of Crete, General Directorate of Agricultural & Veterinary, No. 3989/1 March 2017 (approval codes EL91-BIObr-03 and EL91-BIOexp-04). The experimental protocol was approved by the Veterinarian Authority of the Region of Crete with the 255,332/29 November 2017 document. Animal experiments were carried out in accordance with the EU Directive 2010/63/EU.

Data Availability Statement

All data are provided in the article.

Conflicts of Interest

The authors declare no conflicts of interest.

References

  1. Nakada, M. Yellowtail Culture Development and Solutions for the Future. Rev. Fish. Sci. 2010, 10, 559–575. [Google Scholar] [CrossRef]
  2. Fernández-Montero, A.; Caballero, M.J.; Torrecillas, S.; Tuset, V.M.; Lombarte, A.; Ginés, R.R.; Izquierdo, M.; Robaina, L.; Montero, D. Effect of Temperature on Growth Performance of Greater Amberjack (Seriola dumerili Risso 1810) Juveniles. Aquac. Res. 2018, 49, 908–918. [Google Scholar] [CrossRef]
  3. Fakriadis, I.; Sigelaki, I.; Papadaki, M.; Papandroulakis, N.; Raftopoulos, A.; Tsakoniti, K.; Mylonas, C.C. Control of Reproduction of Greater Amberjack Seriola dumerili Reared in Aquaculture Facilities. Aquaculture 2020, 519, 734880. [Google Scholar] [CrossRef]
  4. Pérez, J.A.; Papadakis, I.E.; Papandroulakis, N.; Cruces, L.; Cotou, E.; Gisbert, E.; Lorenzo, A.; Mylonas, C.C.; Rodríguez, C. The Ontogeny of Greater Amberjack Digestive and Antioxidant Defence Systems under Different Rearing Conditions: A Histological and Enzymatic Approach. Aquac. Nutr. 2020, 26, 1908–1925. [Google Scholar] [CrossRef]
  5. Moran, D. Size Heterogeneity, Growth Potential and Aggression in Juvenile Yellowtail Kingfish (Seriola lalandi Valenciennes). Aquac. Res. 2007, 38, 1254–1264. [Google Scholar] [CrossRef]
  6. Kestemont, P.; Jourdan, S.; Houbart, M.; Mélard, C.; Paspatis, M.; Fontaine, P.; Cuvier, A.; Kentouri, M.; Baras, E. Size Heterogeneity, Cannibalism and Competition in Cultured Predatory Fish Larvae: Biotic and Abiotic Influences. Aquaculture 2003, 227, 333–356. [Google Scholar] [CrossRef]
  7. Papandroulakis, N.; Mylonas, C.C.; Maingot, E.; Divanach, P. First Results of Greater Amberjack (Seriola dumerili) Larval Rearing in Mesocosm. Aquaculture 2005, 250, 155–161. [Google Scholar] [CrossRef]
  8. Johnston, I.A. Environment and Plasticity of Myogenesis in Teleost Fish. J. Exp. Biol. 2006, 209, 2249–2264. [Google Scholar] [CrossRef] [PubMed]
  9. Alami-Durante, H.; Wrutniak-Cabello, C.; Kaushik, S.J.; Médale, F. Skeletal Muscle Cellularity and Expression of Myogenic Regulatory Factors and Myosin Heavy Chains in Rainbow Trout (Oncorhynchus mykiss): Effects of Changes in Dietary Plant Protein Sources and Amino Acid Profiles. Comp. Biochem. Physiol. Part A Mol. Integr. Physiol. 2010, 156, 561–568. [Google Scholar] [CrossRef] [PubMed]
  10. Rowlerson, A.; Mascarello, F.; Radaelli, G.; Veggetti, A. Differentiation and Growth of Muscle in the Fish Sparus aurata (L): II. Hyperplastic and Hypertrophic Growth of Lateral Muscle from Hatching to Adult. J. Muscle Res. Cell Motil. 1995, 16, 223–236. [Google Scholar] [CrossRef] [PubMed]
  11. Pitkänen, T.I.; Xie, S.Q.; Krasnov, A.; Mason, P.S.; Mölsä, H.; Stickland, N.C. Changes in Tissue Cellularity Are Associated with Growth Enhancement in Genetically Modified Arctic Char (Salvelinus alpinus L.) Carrying Recombinant Growth Hormone Gene. Mar. Biotechnol. 2001, 3, 188–197. [Google Scholar] [CrossRef] [PubMed]
  12. Alami-Durante, H.; Fauconneau, B.; Rouel, M.; Escaffre, A.M.; Bergot, P. Growth and Multiplication of White Skeletal Muscle Fibres in Carp Larvae in Relation to Somatic Growth Rate. J. Fish Biol. 1997, 50, 1285–1302. [Google Scholar] [CrossRef]
  13. Rauner, M.; Föger-Samwald, U.; Kurz, M.F.; Brünner-Kubath, C.; Schamall, D.; Kapfenberger, A.; Varga, P.; Kudlacek, S.; Wutzl, A.; Höger, H.; et al. Cathepsin S Controls Adipocytic and Osteoblastic Differentiation, Bone Turnover, and Bone Microarchitecture. Bone 2014, 64, 281–287. [Google Scholar] [CrossRef] [PubMed]
  14. Pacheco-Carlón, N.; Guerrero-Tortolero, D.A.; Cervantes-Montoya, L.B.; Racotta, I.S.; Campos-Ramos, R. The Effects of Constant and Oscillating Temperature on Embryonic Development and Early Larval Morphology in Longfin Yellowtail (Seriola rivoliana Valenciennes). Aquac. Res. 2021, 52, 77–93. [Google Scholar] [CrossRef]
  15. Pacheco-Carlón, N.; Salgado-García, R.L.; Guerrero-Tortolero, D.A.; Kraffe, E.; Campos-Ramos, R.; Racotta, I.S. Biochemical Composition and Adenylate Energy Charge Shifts in Longfin Yellowtail (Seriola rivoliana) Embryos during Development under Different Temperatures. J. Therm. Biol. 2023, 112, 103470. [Google Scholar] [CrossRef] [PubMed]
  16. Viader-Guerrero, M.; Guzmán-Villanueva, L.T.; Spanopoulos-Zarco, M.; Estrada-Godínez, J.A.; Maldonado-García, D.; Gracia-López, V.; Omont, A.; Maldonado-García, M. Effects of Temperature on Hatching Rate and Early Larval Development of Longfin Yellowtail Seriola rivoliana. Aquac. Rep. 2021, 21, 100843. [Google Scholar] [CrossRef]
  17. Campos-Ramos, R.; Vázquez-Islas, G.; Calixto-Heredia, L.M.; Guerrero-Tortolero, D.A. Gene Expression in the Hypothalamic-Pituitary-Thyroid Axis in Seriola rivoliana Early Larvae Development at Different Temperatures. Gen. Comp. Endocrinol. 2024, 358, 114615. [Google Scholar] [CrossRef] [PubMed]
  18. Watson, S.A.; Allan, B.J.M.; McQueen, D.E.; Nicol, S.; Parsons, D.M.; Pether, S.M.J.; Pope, S.; Setiawan, A.N.; Smith, N.; Wilson, C.; et al. Ocean Warming Has a Greater Effect than Acidification on the Early Life History Development and Swimming Performance of a Large Circumglobal Pelagic Fish. Glob. Chang. Biol. 2018, 24, 4368–4385. [Google Scholar] [CrossRef] [PubMed]
  19. Lomartire, S.; Marques, J.C.; Gonçalves, A.M.M. The Key Role of Zooplankton in Ecosystem Services: A Perspective of Interaction between Zooplankton and Fish Recruitment. Ecol. Indic. 2021, 129, 107867. [Google Scholar] [CrossRef]
  20. Conceição, L.E.C.; Yúfera, M.; Makridis, P.; Morais, S.; Dinis, M.T. Live Feeds for Early Stages of Fish Rearing. Aquac. Res. 2010, 41, 613–640. [Google Scholar] [CrossRef]
  21. Karlsen, Ø.; van der Meeren, T.; Rønnestad, I.; Mangor-Jensen, A.; Galloway, T.F.; Kjørsvik, E.; Hamre, K. Copepods Enhance Nutritional Status, Growth and Development in Atlantic Cod (Gadus morhua L.) Larvae—Can We Identify the Underlying Factors? PeerJ 2015, 2015, e902. [Google Scholar] [CrossRef] [PubMed]
  22. Miki, T.; Nakatsukasa, H.; Takahashi, N.; Murata, O.; Ishibashi, Y. Aggressive Behaviour and Cannibalism in Greater Amberjack, Seriola Dumerili : Effects of Stocking Density, Feeding Conditions and Size Differences. Aquac. Res. 2011, 42, 1339–1349. [Google Scholar] [CrossRef]
  23. Ma, Z. Food Ingestion, Prey Selectivity, Feeding Incidence, and Performance of Yellowtail Kingfish Seriola lalandi Larvae under Constant and Varying Temperatures. Aquac. Int. 2014, 22, 1317–1330. [Google Scholar] [CrossRef]
  24. Georgiou, S.; Alami-Durante, H.; Power, D.M.; Sarropoulou, E.; Mamuris, Z.; Moutou, K.A. Transient Up- and down-Regulation of Expression of Myosin Light Chain 2 and Myostatin MRNA Mark the Changes from Stratified Hyperplasia to Muscle Fiber Hypertrophy in Larvae of Gilthead Sea Bream (Sparus aurata L.). Cell Tissue Res. 2016, 363, 541–554. [Google Scholar] [CrossRef] [PubMed]
  25. Alami-Durante, H.; Olive, N.; Rouel, M. Early Thermal History Significantly Affects the Seasonal Hyperplastic Process Occurring in the Myotomal White Muscle of Dicentrarchus labrax Juveniles. Cell Tissue Res. 2007, 327, 553–570. [Google Scholar] [CrossRef] [PubMed]
  26. Pfaffl, M.W. A New Mathematical Model for Relative Quantification in Real-Time RT-PCR. Nucleic Acids Res. 2001, 29, E45. [Google Scholar] [CrossRef] [PubMed]
  27. Vandesompele, J.; De Preter, K.; Pattyn, F.; Poppe, B.; Van Roy, N.; De Paepe, A.; Speleman, F. Accurate Normalization of Real-Time Quantitative RT-PCR Data by Geometric Averaging of Multiple Internal Control Genes. Genome Biol. 2002, 3, research0034-1. [Google Scholar] [CrossRef] [PubMed]
  28. Čikoš, Š.; Bukovská, A.; Koppel, J. Relative Quantification of MRNA: Comparison of Methods Currently Used for Real-Time PCR Data Analysis. BMC Mol. Biol. 2007, 8, 113. [Google Scholar] [CrossRef] [PubMed]
  29. Guerrero-Tortolero, D.A.; Vázquez-Islas, G.; Campos-Ramos, R. A Transcriptome Insight During Early Fish Larval Development Followed by Starvation in Seriola rivoliana. Mar. Biotechnol. 2021, 23, 749–765. [Google Scholar] [CrossRef] [PubMed]
  30. Koganti, P.; Yao, J.; Cleveland, B.M. Molecular Mechanisms Regulating Muscle Plasticity in Fish. Anim. 2021, 11, 61. [Google Scholar] [CrossRef] [PubMed]
  31. Nemova, N.N.; Kantserova, N.P.; Lysenko, L.A. The Traits of Protein Metabolism in the Skeletal Muscle of Teleost Fish. J. Evol. Biochem. Physiol. 2021, 57, 626–645. [Google Scholar] [CrossRef]
  32. Johnston, I.A.; Bower, N.I.; Macqueen, D.J. Growth and the Regulation of Myotomal Muscle Mass in Teleost Fish. J. Exp. Biol. 2011, 214, 1617–1628. [Google Scholar] [CrossRef] [PubMed]
  33. Ayala, M.D.; López-Albors, O.; Gil, F.; Latorre, R.; Vázquez, J.M.; García-Alcázar, A.; Abellán, E.; Ramírez, G.; Moreno, F. Temperature Effect on Muscle Growth of the Axial Musculature of the Sea Bass (Dicentrarchus labrax L.). Anat. Histol. Embryol. 2000, 29, 235–242. [Google Scholar] [CrossRef] [PubMed]
  34. López-Albors, O.; Ayala, M.D.; Gil, F.; García-Alcázar, A.; Abellán, E.; Latorre, R.; Ramírez-Zarzosa, G.; Vázquez, J.M. Early Temperature Effects on Muscle Growth Dynamics and Histochemical Profile of Muscle Fibres of Sea Bass Dicentrarchus labrax L., during Larval and Juvenile Stages. Aquaculture 2003, 220, 385–406. [Google Scholar] [CrossRef]
  35. Stickland, N.C.; White, R.N.; Mescall, P.E.; Crook, A.R.; Thorpe, J.E. The Effect of Temperature on Myogenesis in Embryonic Development of the Atlantic Salmon (Salmo salar L.). Anat. Embryol. 1988, 178, 253–257. [Google Scholar] [CrossRef] [PubMed]
  36. Calvo, J.; Johnston, I.A. Influence of Rearing Temperature on the Distribution of Muscle Fibre Types in the Turbot Scophthalmus Maximus at Metamorphosis. J. Exp. Mar. Bio. Ecol. 1992, 161, 45–55. [Google Scholar] [CrossRef]
  37. Brooks, S.; Johnston, I.A. Influence of Development and Rearing Temperature on the Distribution, Ultrastructure and Myosin Sub-Unit Composition of Myotomal Muscle-Fibre Types in the Plaice Pleuronectes Platessa. Mar. Biol. 1993, 117, 501–513. [Google Scholar] [CrossRef]
  38. Vieira, V.I.A.; Johnston, I.A. Influence of Temperature on Muscle-Fibre Development in Larvae of the Herring Clupea Harengus. Mar. Biol. 1992, 112, 333–341. [Google Scholar] [CrossRef]
  39. Hall, T.E.; Johnston, I.A. Temperature and Developmental Plasticity during Embryogenesis in the Atlantic Cod Gadus morhua L. Mar. Biol. 2003, 142, 833–840. [Google Scholar] [CrossRef]
  40. Richardson, B.E.; Nowak, S.J.; Baylies, M.K. Myoblast Fusion in Fly and Vertebrates: New Genes, New Processes and New Perspectives. Traffic 2008, 9, 1050–1059. [Google Scholar] [CrossRef] [PubMed]
  41. García-Pérez, I.; Molsosa-Solanas, A.; Perelló-Amorós, M.; Sarropoulou, E.; Blasco, J.; Gutiérrez, J.; de la Serrana, D.G. The Emerging Role of Long Non-Coding RNAs in Development and Function of Gilthead Sea Bream (Sparus aurata) Fast Skeletal Muscle. Cells 2022, 11, 428. [Google Scholar] [CrossRef] [PubMed]
  42. Manchanda, M.; Fatima, N.; Chauhan, S.S. Physiological and Pathological Functions of Cysteine Cathepsins. In Proteases in Physiology and Pathology; Springer: Singapore, 2017; pp. 217–256. [Google Scholar] [CrossRef]
  43. Baeverfjord, G.; Prabhu, P.A.J.; Fjelldal, P.G.; Albrektsen, S.; Hatlen, B.; Denstadli, V.; Ytteborg, E.; Takle, H.; Lock, E.J.; Berntssen, M.H.G.; et al. Mineral Nutrition and Bone Health in Salmonids. Rev. Aquac. 2019, 11, 740–765. [Google Scholar] [CrossRef]
  44. Suarez-Bregua, P.; Pirraco, R.P.; Hernández-Urcera, J.; Reis, R.L.; Rotllant, J. Impact of Dietary Phosphorus on Turbot Bone Mineral Density and Content. Aquac. Nutr. 2021, 27, 1128–1134. [Google Scholar] [CrossRef]
  45. Fraser, T.W.K.; Witten, P.E.; Albrektsen, S.; Breck, O.; Fontanillas, R.; Nankervis, L.; Thomsen, T.H.; Koppe, W.; Sambraus, F.; Fjelldal, P.G. Phosphorus Nutrition in Farmed Atlantic Salmon (Salmo salar): Life Stage and Temperature Effects on Bone Pathologies. Aquaculture 2019, 511, 734246. [Google Scholar] [CrossRef]
  46. Cotti, S.; Huysseune, A.; Koppe, W.; Rücklin, M.; Marone, F.; Wölfel, E.M.; Fiedler, I.A.K.; Busse, B.; Forlino, A.; Witten, P.E. More Bone with Less Minerals? The Effects of Dietary Phosphorus on the Post-Cranial Skeleton in Zebrafish. Int. J. Mol. Sci. 2020, 21, 5429. [Google Scholar] [CrossRef] [PubMed]
  47. Witten, P.E.; Fjelldal, P.G.; Huysseune, A.; McGurk, C.; Obach, A.; Owen, M.A.G. Bone without Minerals and Its Secondary Mineralization in Atlantic Salmon (Salmo Salar): The Recovery from Phosphorus Deficiency. J. Exp. Biol. 2019, 222, jeb188763. [Google Scholar] [CrossRef] [PubMed]
  48. Malzahn, A.M.; Ribičić, D.; Hansen, B.H.; Sarno, A.; Kjørsvik, E.; Aase, A.S.N.; Musialak, L.A.; García-Calvo, L.; Hagemann, A. First Feed Matters: The First Diet of Larval Fish Programmes Growth, Survival, and Metabolism of Larval Ballan Wrasse (Labrus bergylta). Aquaculture 2022, 561, 738586. [Google Scholar] [CrossRef]
  49. Tseng, Y.; Eryalçın, K.M.; Sivagurunathan, U.; Domínguez, D.; Hernández-Cruz, C.M.; Boglione, C.; Philip, A.J.P.; Izquierdo, M. Effects of the Dietary Supplementation of Copper on Growth, Oxidative Stress, Fatty Acid Profile and Skeletal Development in Gilthead Seabream (Sparus aurata) Larvae. Aquaculture 2023, 568, 739319. [Google Scholar] [CrossRef]
Figure 1. Developmental stage transition in the four combinations of live feeds and temperatures applied in the experiment.
Fishes 10 00360 g001
Figure 2. Effect of temperature and live feed per developmental stage at (a) total cross-section area (TCSA) of one dorsal epaxial quadrant and (b) total length (TL) of fish. 20R: group reared at 20 °C fed rotifers, 20C: group reared at 20 °C fed copepods, 24R: group reared at 24 °C fed rotifers, 24C: group reared at 24 °C fed copepods. Superscripts indicate statistically significant differences between each group (n = 10), (ns: p > 0.05, *: p < 0.05, **: p < 0.01).
Fishes 10 00360 g002
Figure 3. Relative expression of genes involved in muscle development and degradation at each developmental stage; (a) mylpfa, (b) mylpfb, (c) myog, (d) cathepsin S. FL: flexion, ELR: end of larvae rearing, MM: mid-metamorphosis. 20R: group reared at 20 °C fed rotifers, 20C: group reared at 20 °C fed rotifers + copepods, 24R: group reared at 24 °C fed rotifers, 24C: group reared at 24 °C fed rotifers + copepods. Superscripts indicate statistically significant differences between groups within each developmental stage (n = 8). Statistical significance is denoted as follows: *: p < 0.05, **: p < 0.01, ***: p < 0.001.
Fishes 10 00360 g003
Table 1. Feeding schemes applied during larvae rearing.
Feeding Scheme
Diet TypeRotifers (R)Rotifers + Copepods (C)
Rotifers2–17 dph2–17 dph
Copepods-2–8 dph
AF Artemia9–19 dph9–19 dph
EG Artemia12–35 dph12–35 dph
Microdiet13 dph onwards13 dph onwards
Table 2. Primers sequences and product size for each gene.
GeneGene IDForward PrimerReverse PrimerProduct SizeEfficiency (%)
elf1ENSSDUG00000008198CACCCCAAGTTCGTCAAGTCGACCAAGGGGAGCGTAGTTG100 bp103.7
rps18ENSSDUG00000012209ATCGCCTTCGCCATCACTGGCTCCCCAGCCCTCTTGTTG100 bp99
rpl13ENSSDUG00000001262TTGCCCCACAAAACCAAGAGGGACAACCATGCGCTTCCTC100 bp101.6
actbENSSDUG00000018712CGTGGCTACTCCTTCACCACTACCCATCTCCTGCTCGAAG100 bp97.2
fauENSSDUG00000009474TGAGGGGACAGACACCCAAGACGTTCACAAAGCGCCTGTT100 bp99.1
mylpfaENSSDUG00000022124TCCTCTTCTTCCTCCCTGCTCCGTCTCCTGTGTCATTGTG95 bp97.6
mylpfbENSSDUG00000022903CAAACCCATACCCGCTCCACCTGGCAAGGGGAAAGAAAGG99 bp96.9
myogENSSDUG00000001886GAGGAGCACCCTGATGAACCTCGCTTGACGACAACACTCT186 bp99.3
ctss2.1ENSSDUG00000002074TTTCAGTGGGGATTGACGCCGCCCTGGTCTCCGAAAGTAG182 bp98.3
Disclaimer/Publisher’s Note: The statements, opinions and data contained in all publications are solely those of the individual author(s) and contributor(s) and not of MDPI and/or the editor(s). MDPI and/or the editor(s) disclaim responsibility for any injury to people or property resulting from any ideas, methods, instructions or products referred to in the content.

