Article

Correlation and Path Analysis of Morphological Traits and Body Mass in Perca schrenkii

1
College of Life Science and Technology, Tarim University, Alar 843300, China
2
Xinjiang Production & Construction Corps Key Laboratory of Protection and Utilization of Biological Resources in Tarim Basin, Alar 843300, China
3
Tarim Rare Fish Research Center, Alar 843300, China
4
Bingtuan Fisheries Technology Promotion Station, Alar 843300, China
5
Alar Changxin Fisheries Company Limited, Alar 843300, China
*
Authors to whom correspondence should be addressed.
Fishes 2025, 10(7), 359; https://doi.org/10.3390/fishes10070359
Submission received: 12 June 2025 / Revised: 14 July 2025 / Accepted: 17 July 2025 / Published: 20 July 2025
(This article belongs to the Special Issue Vantage Points in the Morphology of Aquatic Organisms)

Abstract

Perca schrenkii populations are experiencing significant declines, yet comprehensive morphological studies are still lacking. Understanding the relationship between morphological traits and body weight is crucial for conservation and breeding programs. We analyzed 13 morphological traits in 100 P. schrenkii specimens from Hamsigou Reservoir using correlation analysis, path analysis, and principal component analysis (PCA). Body weight exhibited the highest variability (CV = 39.76%). Strong correlations were observed between body weight and body length (R = 0.942), total length, and body width. A four-variable regression model explained 94.1% of body weight variation, with body length showing the strongest direct effect (path coefficient = 0.623). The first three principal components accounted for 76.687% of the total variance. Our findings demonstrate that BL, BW, BD, and ES can effectively predict body weight, providing valuable insights for the conservation and selective breeding of P. schrenkii.
Key Contribution: A correlation and path analysis of 13 morphological traits and body mass in Perca schrenkii revealed that body length had the greatest direct effect on body mass, while body width, body depth, and interorbital distance exerted indirect effects through body length. A four-variable regression equation was established to estimate body mass based on body length, body width, body depth, and interorbital distance, clarifying the determination degree of each morphological trait on body mass and principal component characteristics.

1. Introduction

Perca schrenkii, a cold-water fish endemic to Central Asia, is primarily distributed in the Balkhash-Alakol Lake system and the Ili-Emin River basins in China. In recent decades, natural populations of this species have declined dramatically due to multiple stressors, including habitat degradation caused by arid climate-induced water resource overexploitation, intensified aquaculture activities, and its classification as a “harmful species”, leading to targeted control measures [1,2]. Currently, wild populations in China are scarce and restricted to fragmented reservoirs within these basins, with observed reductions in individual body size, placing the species at risk of local extinction. These trends highlight the urgent need for comprehensive studies on its morphological characteristics and adaptive strategies to inform conservation and management efforts [2].
Morphological traits are critical indicators of a species ecological adaptation and growth performance, directly reflecting its ability to survive, forage, and reproduce in specific environments [3]. For fish, the relationship between morphological traits and body mass is particularly informative, as it can reveal growth patterns, resource allocation strategies, and potential responses to environmental changes. Such insights are invaluable for developing selective breeding programs, assessing population health, and designing effective conservation measures [4]. However, existing research on P. schrenkii has primarily focused on hybridization and age structure [5], with limited in-depth analyses of morphological variations and their associations with growth-related traits like body weight.
The following references, principal component and path analysis of morphological traits on body mass of Opsariichthy sbiodens [6], correlation and path analysis of morphological traits and body mass in Epinephelus fuscoguttatus [7], and correlation and path analysis of morphological traits and body mass in Takifugu obscurus [8], all employed multivariate statistical methods such as principal component analysis (PCA) and path analysis to explore the correlations between morphological traits and body mass in fish, which are highly consistent with the research methods used in this study. The key findings from these studies form cross-species comparisons with the present research, highlighting both the commonalities and specificities in the morphological–body mass relationships among fish species. Research on the morphological–body mass relationship of P. schrenkii has been relatively scarce.
To address the knowledge gaps regarding P. schrenkii, this study focuses on 13 key morphological traits measured from individuals in Hamsigou Reservoir. Specifically, we aim to characterize the morphological variation of P. schrenkii in this habitat, quantify correlations between morphological traits and body weight, identify the primary traits influencing body weight using path analysis, and determine the optimal regression models describing these relationships. The findings will not only enhance our understanding of the species’ biological characteristics but also provide a scientific basis for its conservation and management, with broader implications for morphological studies of endangered fish in arid and semi-arid regions.

2. Materials and Methods

2.1. Materials

Specimens of P. schrenkii were collected randomly from the Hamsigou Reservoir in July 2024 using cage traps with a mesh size of 2a = 2 cm [9]. The specimens were euthanized with MS−222, morphological trait data were measured, and subsequently, the specimens were preserved in 4% formalin. A total of 100 individuals were sampled, with body lengths ranging from 53.24 to 93.40 mm and body weights ranging from 2.90 to 15.70 g. The samples were transported to the laboratory and immersed in a 4% formalin solution for further processing. A summary of these sampling details, including length and weight ranges, is presented in Table 1. The sampling site is shown in Figure 1. All procedures complied with the Chinese Laboratory Animal Administration Regulations and were approved by the Ethics Committee of Tarim University (approval number: PB20250605001, approval date: 5 June 2025).

2.2. Methods

In this study, we employed the traditional method for measuring external morphological characteristics to measure the measurable traits of the samples [10]. The 14 measurable indicators included body mass (BM), total length (TL), body length (BL), eye diameter (ED), snout length (SL), length behind the eye (LBE), head length (HL), eye spacing (ES), mouth cleft wide (MCW), mouth cleft high (MCH), body depth (BD), body width (BW), caudal peduncle length (CPL), and caudal peduncle height (CPH).
We performed measurements using a Deli vernier caliper (precision: 0.01 mm; Ningbo Deli Stationery Co., Ltd., Ningbo, Zhejiang, China). For each morphological parameter, the caliper was carefully aligned with the corresponding anatomical structures of the specimens to ensure measurement accuracy. Body mass was recorded using a pre-calibrated Delixi electronic balance (accuracy: 0.01 g; Delixi Electric Co., Ltd., Linyi, Shandong, China) to minimize measurement errors.
The measurements of these 13 morphological parameters are visually presented in Figure 2.

2.3. Data Processing

Microsoft Excel 2021 was used to calculate the maximum value, minimum value, coefficient of variation, and mean value ± standard deviation of 13 measurable morphological traits [11]. These descriptive statistics provide a basic understanding of the data distribution and variability, which is fundamental for subsequent in-depth analyses. In fish morphology research, if parametric statistical analysis of body weight data is required, the Shapiro–Wilk test can first be used to verify the normality of the data. If the p-value is greater than 0.05, it can be considered that the data meets the normality assumption, and the results of subsequent analyses will be more reliable. Using SPSS 27.0, we first performed the Kaiser–Meyer–Olkin (KMO) and Bartlett tests on the correlations of 13 indicators. The KMO test measures the sampling adequacy of the data for factor analysis, with values above 0.50 generally indicating that the data is suitable for such analysis. The Bartlett test of sphericity assesses whether the correlation matrix is an identity matrix [12]. If its p-value is <0.05, it implies that the variables are inter-correlated and thus suitable for principal component analysis.
Subsequent analysis was carried out according to the scree plot of the number of components and the total variance explained. The scree plot helps in determining the optimal number of components to retain, typically by looking for an “elbow” point where the rate of variance explained by additional components starts to level off. The total variance explained by the retained components provides an indication of how much of the original data variability is accounted for in the new principal components. Net weight data of the fish underwent a Shapiro–Wilk normality test. Normality of data is a crucial assumption for many statistical tests, such as parametric correlation and regression analyses. Establishing the normality of the net weight data is necessary to ensure the validity of subsequent statistical procedures.
The correlations between 13 traditional morphological traits and body weight were analyzed. Based on collinearity analysis results, appropriate morphological parameters were chosen as independent variables. A multiple regression equation was then established with net weight as the dependent variable for path analysis. In path analysis, we aimed to decompose the total effect of each independent morphological trait on the net weight into direct and indirect effects. The determination coefficient obtained from this analysis will quantify the proportion of the variance in net weight that can be explained by the selected morphological traits [13]. In general, correlation analysis only considers direct relationships between variables while ignoring mutual influences and indirect relationships among variables, which may lead to one-sided results. Therefore, it is necessary to conduct more in-depth path analysis and multiple regression analysis based on correlation analysis [4]. To overcome multicollinearity interference in multivariate studies, a stepwise inclusion–exclusion method is typically used to remove independent variables with non-significant partial regression sums of squares, and the retained morphological traits are gradually introduced into the model. In multiple regression equations, based on correlation analysis between morphological traits and fish net weight, further path analysis is meaningful only when the total determination coefficient of independent variables exceeds 0.850.
Path analysis is a statistical method used to reveal relationships between independent and dependent variables, quantifying the direct and indirect effects of independent variables on the dependent variable through path coefficients [14].
The resulting principal components were ranked by the amount of variance they explained and represent uncorrelated linear combinations of the original variables. The first principal component captures the largest proportion of variation, while subsequent components explain progressively smaller amounts of residual variation under the constraint of orthogonality. This approach reduces data dimensionality while preserving maximum variability and minimizing redundancy.

3. Results

3.1. Morphological Analysis of P. schrenkii

Conduct descriptive statistics on 13 basic morphological parameters of P. schrenkii [15]. The measurements are presented in Table 2. It is evident that the three groups of data with the greatest degree of dispersion are mouth cleft width (27.51 percent), mouth cleft height (24.53 percent), and body width (22.97 percent), while the three groups of data with the smallest degree of dispersion are total length (11.36 percent), eye diameter (12.30 percent), and body length (12.63 percent). These differences in the degree of dispersion among morphological parameters may provide insights into the variability of the species in different aspects of its body structure. Understanding such variability is essential for our overall research goal of assessing the population characteristics and ecological adaptability of P. schrenkii [15]. The CV for body mass is 39.76%.

3.2. Correlation Analysis

The correlation between the morphological shape data of P. schrenkii and its body weight [16] measurements is given in Table 3. The correlation coefficients between the measured phenotypic data and the body weight ranged from 0.288 to 0.942. There was a total of four morphological traits that had an extremely significant correlation with the body weight, and four morphological traits that had a significant correlation with the body weight. Among them, the three traits with the largest correlation coefficients were body length, head length, and total length, while the three traits with the smallest correlation coefficients were interorbital distance, mouth cleft height, and caudal peduncle height. Among the parameters of the morphological traits of the P. schrenkii, the strongest correlation was between the body weight and the body length, with a correlation coefficient of 0.942. The weakest correlation was between the interorbital distance and the snout length, with a correlation coefficient of −0.222. The interorbital distance and the snout length were significantly negatively correlated; that is, as the interorbital distance increases, the snout length decreases, and vice versa.

3.3. Path Analysis

Measurements are given in Table 4. During the process of increasing the number of independent variables from 1 to 4, the correlation coefficient of the multiple regression equation increased from 0.942 to 0.964. At the same time, the standard error of estimation decreased from 0.89619 to 0.71879. The optimization of the model made the obtained equation more accurate [17].
The results are shown in Table 5. The ratio of the mean square between groups to the mean square within groups, F = 314.254, and the p-value <0.001, both indicate that the regression equation reaches an extremely significant level. At the same time, the mean square value of the residuals is relatively small (0.517), which also shows that the regression equation has a good predictive and testing effect [13].
The results of the regression coefficients of the independent variables are shown in Table 6. The optimized regression equation retained four independent variables, namely body length, body width, body height, and interorbital distance [18]. The regression coefficients of these four independent variables all reached an extremely significant level for the model fitting (p < 0.001), and the variance inflation factors (VIFs) were all less than 10, indicating that there was no multicollinearity among the variables. Thus, the quaternary regression equation established is as follows:
Y = −13.165 + 0.188 × BL + 0.251 × BW + 0.166 × BD + 0.253 × ED.
Through path analysis, as shown in Table 7, the effects of the four traits on the body weight of P. schrenkii can be divided into direct and indirect effects. As can be seen from the above table, among these four traits [19], body length has the greatest direct effect (0.632) on the body weight of P. schrenkii, and this direct effect is greater than its indirect effects; that is, the direct effect of body length on the body weight of P. schrenkii is the most obvious. In terms of indirect path coefficients, body height has the maximum value, with an indirect effect of 0.438 on the fish’s body weight through body length. Next is body width, which has an indirect effect of 0.430 on the body weight of P. schrenkii through body length.
The results of the integrated analysis of the direct and indirect effects, that is, calculating the determination coefficients of various morphological traits on the body weight of P. schrenkii, are shown in Table 8. Among the four traits [20], the trait with the largest individual determination coefficient is body length (0.388), followed by body width (0.045), body height (0.041), and interorbital distance (0.025). The combined determination coefficient of body length and body width is the largest (0.182), which indicates that the combined effect of body length and body width has the greatest determining degree on the body weight of P. schrenkii. In addition, the combined determination coefficient of body height and interorbital distance is −0.001. The total determination coefficient of body length, body width, body height, and interorbital distance on the body weight of P. schrenkii is 0.941. From this, the remaining determination coefficient can be calculated as 0.059, and the remaining factor is 0.243. The remaining factor indicates that, except for the above four traits, the effects of other factors on the body weight of P. schrenkii are relatively small [21].
Using four morphological traits including BL, BW, BD, and ES as independent variables, and BM as the dependent variable, curve model fitting was conducted through multiple regression equations. The fitting results are as follows: all models showed extremely significant correlation. The best fitting model between the four morphological traits and BM was a quadratic function, and the model equations are shown in Table 9:
BM = 0.3002e 0.0436BL
BM= − 11.953 + 2.707BW − 0.078BW2
BM= 13.866 − 1.588BD + 0.066BD2
BM= 7.813 − 1.045ES + 0.136ES2
where the corresponding R-squared values are 0.921, 0.675, 0.711, and 0.091, respectively.

3.4. Principal Component Analysis of Morphological Traits

A common factor variance analysis was conducted on the 13 morphological traits. The results showed that the communalities of these 13 variables were all greater than 0.5, and most of them were close to or exceeded 0.9. This indicates that the extracted common factors, that is, the selected morphological parameters, can well reflect the main information of the P. schrenkii [22].
A principal component analysis was carried out on the data of 13 morphological parameters, as shown in Table 10. The results show that the contribution rates of the first, second, and third factors in explaining the morphological parameters are 53.554%, 12.947%, and 9.437%, respectively, with a cumulative contribution rate of 75.938%. This indicates that these three factors can account for more than 75% of the total variance. Principal component factor 1 has a strong positive correlation with body length, total length, and caudal peduncle height, with loading coefficients of 0.942, 0.908, and 0.817, respectively, all of which are above 0.80. This indicates the overall changes in the morphology of P. schrenkii. Principal component factor 2 has a relatively strong positive correlation with the eye spacing and the length behind the eye, respectively, with loading coefficients of 0.901 and 0.567, reflecting the changes in the interorbital distance and head length of the head of P. schrenkii. Principal component factor 3 has a relatively strong positive correlation with the mouth cleft height, with a loading coefficient of 0.669, indicating the changes in the gape of the head of P. schrenkii [23].
Based on the analysis of the aforementioned loading coefficient data, parameters such as total length, body length, caudal peduncle height, length behind the eye, eye spacing, and mouth cleft width can reveal the most significant morphological variation characteristics of the P. schrenkii.
We used the scree plot to verify whether the selected three principal components are reasonable. The judgment criterion of the scree plot is to select the turning point where the trend of eigenvalue change shifts from steep to gentle. According to the analysis results of the scree plot in Figure 3, all are relatively obvious turning points. Therefore, it is reasonable to select the first three principal components [24].
From the distribution of morphological traits on PC1 and PC2 in Figure 4, it can be concluded that the contribution value of PC1 is 53.6%, which has a positive correlation with the loading values of each parameter. The contribution value of PC2 is 12.9%, and it has a two-way correlation with the loading values of each parameter factor, as shown in the results of the scatter plot [25].

4. Discussion

4.1. Discussion on Morphological Traits

Growth performance is a key selection criterion in fish breeding programs, with body weight often serving as a primary indicator. Morphological traits exhibiting high coefficients of variation (CVs) are considered to have greater potential for selective improvement. In this study, body weight in P. schrenkii showed the highest CV (39.76%), significantly higher than that of other morphological traits, suggesting considerable potential for artificial selection.
This pattern has been observed in other fish species as well. For example, body weight exhibited the highest CV among 31 measured traits in Thymallus arcticus (27.14%) and among 17 traits in Pelteobagrus vachelli (19.10%) [26]. Similarly, in Oncorhynchus masou, body weight displayed higher variability than other morphological traits at both 6 and 18 months of age [27]. These findings align with those of the present study on P. schrenkii, indicating a consistent trend across species [28]. Pelteobagrus vachelli the coefficients of variation (CVs) for each trait were ranked in descending order as follows: body weight (Y) > adipose fin base length (X9) > caudal peduncle length (X15) > distance between posterior dorsal fin and anterior adipose fin (X8) > pre-pectoral fin length (X11) > dorsal fin base length (X7) > body height at anus (X4) > distance between adipose fin end and caudal fin base (X10) > caudal peduncle depth (X5) > head depth (X16) > head width (X17) > pre-pelvic fin length (X13) > maximum body depth (X3) > distance between snout and anterior dorsal fin (X6) > pre-dorsal fin length (X12) > pre-anal fin length (X14) > total length (X2) > standard length (X1). Notably, body weight (Y) exhibited the highest CV of 19.1% [27].
However, measuring body mass under natural conditions can be prone to errors due to environmental or behavioral factors. As a result, using morphological traits strongly correlated with body mass as proxies has become a widely adopted approach in aquaculture research.

4.2. Discussion on the Correlation of Morphological Traits

Results obtained concur with findings reported in other fish species. For example, in cultured female Cheilinus undulatus, body length, body height, anal fin length, and tail length had the greatest influence on body weight [29]. In small-sized individuals (<120 mm) of both sexes of Protosalanx hyalocranius, body length, total length, and body width showed significant effects on body weight [30]. In Leptobarbus hoevenii, the order of correlation coefficients between body weight and morphological traits was as follows: body length (0.952) > total length (0.936) > trunk length (0.919) > body height (0.890) > body width (0.734) > head length (0.700) [31].
These findings are consistent with previous studies, which have shown that species, growth stage, environmental factors, and sex can all influence morphological traits and thereby affect body weight.

4.3. Discussion on Path Analysis

In the natural survival environments of fish, path analysis is widely applied to analyze the impacts of morphological traits at different growth stages on body weight. The results of path analysis in this study indicate that P. schrenkii body length has the strongest direct effect on body weight, while body width, body height, and interorbital width exert indirect effects on body weight. The results obtained concur with findings reported in other fish species. For juvenile Takifugu obscurus, seven morphological traits were retained: total length, snout length, mouth cleft, interorbital width, trunk length, body height, and caudal peduncle length [8]. For 6-month-old Hexagrammos agrammus, five traits with extremely significant differences in partial regression coefficients (p < 0.01)—body length, body width, total length, head length, and body height—were selected as independent variables [21]. For 4-month-old Opsariichthys bidens, five morphological traits, including total length, body length, body height, body width, and head length, are the main factors influencing body mass [32]. For juvenile Lateolabrax maculatus, four morphological traits—total length, body height, eye diameter, and body width—are the most critical morphological traits affecting body mass [33].
The establishment of a multiple regression equation can quantify the relationship between independent and dependent variables. In this study, the multiple linear regression analysis of 13 morphological traits all reached extremely significant levels in the significance test of coefficients. In this experiment, the method of multiple linear regression equations was used. As independent variables were introduced, the correlation coefficient of the equation increased. Subsequently, a four-variable linear regression equation for the P. schrenkii was established, quantifying the comprehensive relationship between morphological traits and body weight. For the P. schrenkii, none of the direct effects of morphological traits on body weight were negative. In terms of indirect effects, the order was as follows: body height (0.438) > body width (0.430) > interocular distance (0.157), all acting indirectly on body weight through body length. The sum of the indirect effects of body height, body width, and interocular distance was greater than the direct effects of each morphological trait on body mass. For 4-month-old Maccullochella peelii juveniles, the indirect effect of caudal peduncle height on body weight through body length was the largest. Moreover, the combined indirect effects of caudal peduncle height and eye diameter were greater than their direct effects on body weight, indicating that these two traits indirectly affect body weight through body length. Therefore, in breeding selection, body length should be considered a key trait, while caudal peduncle height and eye diameter should be considered auxiliary traits [34]. Previous studies have obtained similar results; for example, for 4-month-old Rachycentron canadum juveniles, there were differences in the direct effects of body length, head length, and post-eye head length on body mass. The direct effects of these three traits were all smaller than their indirect effects through other morphological traits, indicating that multiple morphological traits collectively influence body mass. Analysis of the indirect effects revealed that the indirect effect of head length on body mass through body length was relatively large, with an indirect path coefficient of 0.381; similarly, the indirect effect of post-eye head length on body weight through body length was also significant, with an indirect path coefficient of 0.360 [35]. For Leiocassis longirostris, the direct effect of total length was the largest (p < 0.01), reaching 0.322. Additionally, the direct effects of total length and head width in farmed long-snouted catfish were extremely significant (p < 0.01), while the direct effects of body length, snout length, and caudal peduncle height were significant (p < 0.05). Among these, the direct effects of total length, body length, head width, snout length, and caudal peduncle height were all smaller than their indirect effects [36].
Among the four morphological traits, body length had the highest individual determination coefficient (0.388), indicating the most significant impact on the body weight of P. schrenkii. Additionally, the combined determination coefficient of body length and body width was the largest (0.182), demonstrating the strongest interactive effect between these two traits in influencing body mass, with a joint contribution significantly higher than other trait combinations. The residual determination coefficient of P. schrenkii was 0.059, corresponding to a residual factor of 0.243, indicating a low degree of unexplained variation in the model.
These results are consistent: the total determination coefficient of five morphological traits for body mass in 2-month-old Amphiprion ocellaris reached 0.962, among which the sum of the individual and combined determination coefficients of body height was 0.779, confirming that body height is the most critical factor affecting body weight [37]. In 13-month-old farmed Schizothorax prenanti, the individual determination coefficients of five morphological traits—body length, body height, body width, snout length, and caudal peduncle length—were 0.369, 0.103, 0.008, 0.005, and 0.005, respectively [38]. The sum of individual determination coefficients and pairwise combined determination coefficients was 0.925, indicating that these five traits are the main factors influencing body weight. Notably, the combined determination coefficient of body length and body height was the largest (0.337), while the combined determination coefficients of caudal peduncle length with body length, body height, and body width were negative, suggesting extremely weak negative effects on body mass. In 6-month-old Epinephelus akaara, the combined determination coefficient of total length and head length (0.4137) had the most prominent impact on body mass. The sum of determination coefficients of all phenotypic traits was 0.9241, and the determination coefficient of the error term was only 0.0759, indicating that the model had effectively captured the main phenotypic traits affecting body weight with a low error contribution [39].
To elucidate the univariate relationships between body weight and major morphological traits in P. schrenkii, we conducted curve model fitting for body length, caudal peduncle height, eye diameter, and other traits with body weight [40]. Our results demonstrated that body length exhibited a linear relationship with body weight (R2 = 0.921, p < 0.01), whereas body width, body height, and interocular distance showed quadratic relationships with body mass (R2 values were 0.675, 0.711, p < 0.01 for body width and body height; interocular distance R2 = 0.091, p = 0.091). These findings suggest that body length, body width, and body height have substantial predictive power for body mass in P. schrenkii. Comparisons with previous studies on other fish species revealed notable differences in the relationships between morphological traits and body mass. In 5-month-old Epinephelus fuscoguttatus, six curve models fitted for four morphological traits and body weight all reached highly significant levels (p < 0.01). Specifically, body height and body width exhibited the best fit with body weight using exponential functions, interocular distance showed the optimal fit with a power function, and caudal peduncle height had the highest fit with a linear function [41]. These results highlight that different growth patterns of morphological traits require distinct curve models for accurate representation. For juvenile barramundi Lates calcarifer, eight curve models fitted for five morphological traits (X4, X5, X6, X11, X12) and body weight were all significant, validating the effectiveness of these models in capturing the relationships between morphological traits and body mass [42]. In Murray cod larvae Maccullochella peelii, body length, caudal peduncle height, and eye diameter were best fitted with quadratic functions. However, the goodness of fit (R2 < 0.85) for caudal peduncle height and eye diameter indicated limited explanatory power when considered individually, suggesting they are more suitable as auxiliary indicators [34]. In contrast, body length had a higher goodness of fit (R2 ≥ 0.85), making it a key morphological indicator for predicting body mass.
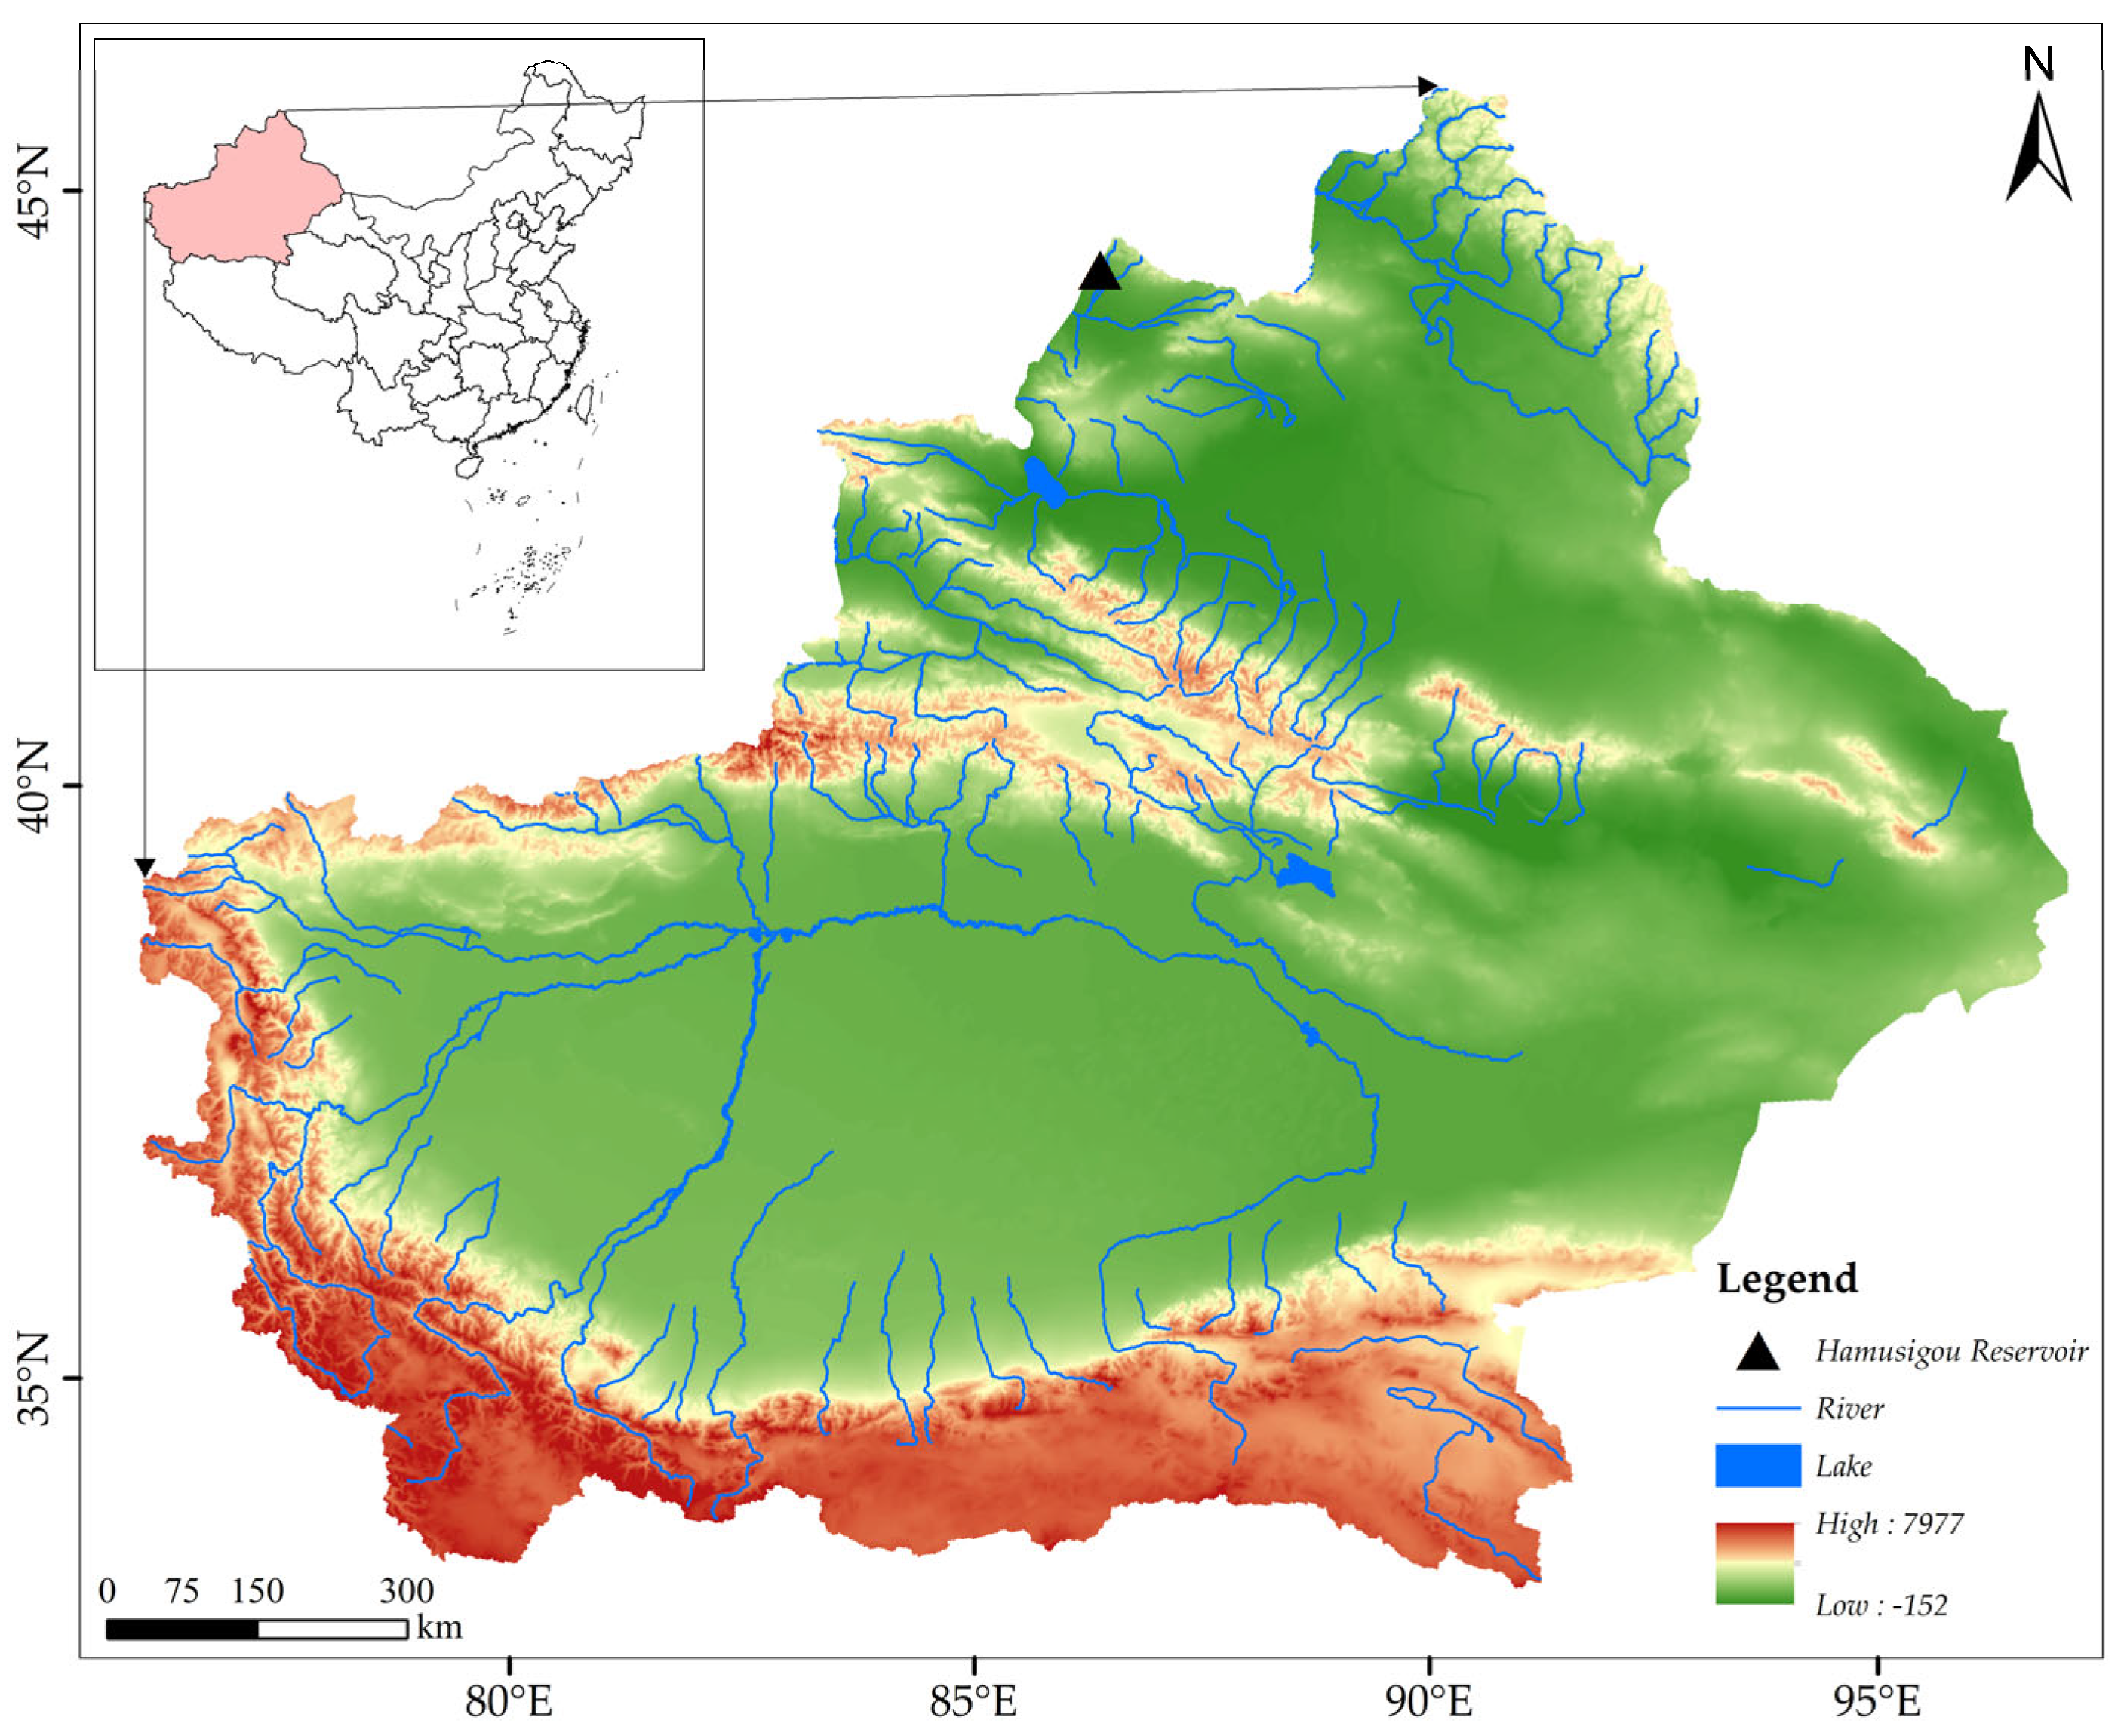
It is important to note that body mass in P. schrenkii is influenced not only by morphological traits but also by environmental factors such as water temperature, dissolved oxygen, food availability, hydrological conditions, and human activities. Future studies should consider these multidimensional variables to provide a more comprehensive understanding of the factors influencing body mass. Additionally, different fish species within the same water body exhibit distinct growth characteristics. Therefore, we recommend further correlation studies on other fish species in the Hamsigou Reservoir in Xinjiang to elucidate species-specific patterns. Given that the samples in this study had not reached sexual maturity and individual sexes could not be distinguished, our conclusions are somewhat limited. We suggest collecting sexually mature samples during the breeding season for future research to address this limitation.

4.4. Discussion on Principal Component Analysis

Principal component analysis (PCA) is a widely used multivariate technique in fish morphology research, particularly when multiple morphological traits are measured [43]. It provides an effective means to simplify and interpret complex inter-relationships among variables. In this study, PCA was conducted following Pearson correlation analysis to explore trait associations [44].
In P. schrenkii, three principal components were extracted, cumulatively explaining 75.938% of the total variance. Similar results were observed in other studies. PCA was applied to 17 directly measured morphological traits of Acrossocheilus hemispinus, and the cumulative contribution of the first three components reached 83.014%, reflecting overall body size and caudal characteristics [22]. For Triplophysa tenuis, the first, second, and third principal components explained 21.15%, 16.33%, and 12.95% of the variance, respectively, with a cumulative contribution rate of 50.44%. The dominant loadings were as follows: The first component was characterized by the ratio of head length to caudal peduncle length. The second component was primarily defined by body length/interorbital width and caudal peduncle length/caudal peduncle height ratios. The third component was mainly influenced by body length/body width and body length/body height ratios [45]. While PCA provided meaningful insights into the morphological structure of the studied species, some limitations should be acknowledged. The reliability of PCA outcomes is highly dependent on data quality, sample representativeness, and measurement accuracy. Therefore, interpretations should consider these factors, especially when generalizing findings across populations or developmental stages.

5. Conclusions

This study analyzed the relationship between 13 morphological traits and body mass (BM) in 100 specimens of P. schrenkii from Hamsigou Reservoir. Body length (BL) showed the strongest correlation with body mass (r = 0.942) and exerted the greatest direct effect (path coefficient = 0.623). Body width (BW), body depth (BD), and eye spacing (ES) mainly affected body mass indirectly through body length. The four-variable regression model (incorporating BL, BW, BD, and ES) explained 94.1% of the variation in body mass, providing a reliable tool for non-destructive body mass estimation. The first three principal components cumulatively accounted for 76.687% of the variation, representing overall body size (PC1), head characteristics (PC2), and mouth traits (PC3), respectively, which simplified the application of complex morphological data. It provides a scientific basis for the selective breeding and germplasm conservation of P. schrenkii.
All samples were immature individuals, making it impossible to analyze sexual dimorphism. Additionally, environmental factors such as water temperature and food supply were not included, which limited the comprehensive understanding of body mass variation. Future studies are suggested to integrate environmental variables to deepen the understanding of the ecological adaptation mechanisms of P. schrenkii and support systematic conservation strategies.

Author Contributions

Conceptualization, Q.J.; methodology, Q.J.; software, Z.W. and H.L.; formal analysis, H.H. and S.M.H.; data curation, Q.X. and W.Z.; validation, T.A. and Z.H.; writing—original draft preparation, J.W.; writing—review and editing, Z.N. All authors have read and agreed to the published version of the manuscript.

Funding

This research was funded by the following projects: the project of the Science and Technology Bureau of the Xinjiang Production and Construction Corps, “Technical Research and Demonstration on the Cultivation of Large-sized Seedlings of Salt-alkali Tolerant Fishes (P. schrenkii, Cyprinus auratus gibelio, Lateolabrax maculatus, Trachinotus ovatus)” [2025YD016], the project of the National Natural Science Foundation of China, “Analysis of the Species Validity and Cryptic Diversity of Schizothoracinae Fishes in Xinjiang Based on Morphology and DNA Barcoding Technology” (32460920), the sub-task of the sub-project of the National Key Research and Development Program, “Integration of Characteristic Aquaculture Technologies in Saline-alkali Land in the Inland Northwest Region and Construction of the Model of Using Fisheries to Reduce Salt and Improve Alkalinity” [2023YFD2401004], and the special topic of the Third Comprehensive Scientific Investigation of Xinjiang, “Investigation of the Macrophytes Community in Key Lakes of Xinjiang” [2022xjkk150403]; Sub-task “Mode of Improving Grain, Cash Crop and Forage Yield through Collaborative Irrigation and Drainage for Obstacle Removal and Quality Enhancement in Saline-Alkali Land of Southern Xinjiang” under the Topic “Technology Verification for Comprehensive Improvement and Utilization of Saline-Alkali Land in Western China” of the Project “Science and Technology Support for Comprehensive Improvement and Utilization of Saline-Alkali Land” of the “Seizing High Ground and Tackling Key Issues” Special Program of the Chinese Academy of Sciences: [GJ050401]. Section when you and the co-authors finish the proofreading.

Institutional Review Board Statement

All procedures compliled with the Chinese Laboratory Animal Administration Reg-ulations and were approved by the Ethics Committee of Tarim University (approval number: PB20250605001, approval date: 5 June 2025).

Data Availability Statement

Because the project is not finalized, a link to the data has not been made public.

Acknowledgments

Here we would like to express our sincere gratitude to Jian Shen. We appreciate his generous provision of P. schrenkii for this research and his great dedication during the sample collection process. His professionalism and dedication have laid a solid foundation for this study. At the same time, we also sincerely thank Xuefeng Pu, an employee of Jian Shen, for his hard work in the fishing operation of P. schrenkii. With his proficient skills and serious attitude, he ensured the smooth completion of the sample collection. The strong support from the two of them has provided indispensable assistance for the smooth progress of this research, and we hereby express our gratitude.

Conflicts of Interest

Mr. Zhaohua Huang was employed by Alar Changxin Fisheries Company Limited. Mr. Zhaohua Huang was responsible for validation the manuscript during the research. The remaining authors declare that the research was conducted in the absence of any commercial or financial relationships that could be construed as a potential conflict of interest.

References

  1. Xiaoli, H.; Aiyelihan, H. Biological Characteristics of Fishes in the Genus Perca and the Status of Germplasm Resources within China. Fish. Heilongjiang Prov. 2020, 39, 26–28. [Google Scholar]
  2. Aishan, Y.; Muyiti, M. Analysis of the Causes of Resource Decline of Perca schrenkii River. Jiangxi Agric. 2019, 04, 118. [Google Scholar]
  3. Zhu, Z.Y.; Yang, T.Y.; Wang, S.G. Relations between morphological traits and body weight of shortbelly eel, Dysomma anguillare (Actinopterygii: Anguilliformes: Synaphobranchidae), from coastal waters of Zhoushan, East China Sea, determined by multivariate analyses. Acta Ichthyol. Piscat. 2024, 54, 27–36. [Google Scholar] [CrossRef]
  4. Zhang, M.; Ma, X.; Jia, Z.; Chen, D.; Qiao, Z.; Wang, L.; Jiang, H.; Yu, M.; Li, Y.; Kong, X.; et al. Effects of Morphological Traits on Body Weight of Largemouth Bass Micropterus salmoides (Centrarchidae) at Three Growth Stages. J. Ichthyol. 2025, 65, 33–43. [Google Scholar] [CrossRef]
  5. Chen, H.; Liao, W.; Ma, J.; Yang, H. Study on the Age and Growth of Perca fluviatilis in the Emin River, Xinjiang. J. Shihezi Univ. Nat. Sci. 2000, 04, 289–294. [Google Scholar]
  6. Liu, L.; Wei, L.; Gan, B.; Teng, Z.; Ye, X.; Liu, K.; Liang, K. Principal Component and Path Analysis of Morphological Traits on Body Mass of Rhodeus sericeus. Jiangxi Fish. Sci. Technol. 2025, 03, 1–6. [Google Scholar]
  7. Chen, C.; Shang, X.; Ma, C.; Wang, Q.; Yu, Y.; Jia, L. Correlation and Path Analysis of Morphological Traits and Body Mass in Epinephelus fuscoguttatus. Agric. Sci. Tianjin 2024, 30, 49–54. [Google Scholar]
  8. Sun, Z.; Zong, W.; Han, S.; Wu, A.; Ye, J. Correlation and Path Analysis of Morphological Traits and Body Mass in Takifugu obscurus. Aquaculture 2024, 45, 1–6+28. [Google Scholar]
  9. Zhang, M.; Du, W.; Wu, Y.; Liu, C.; Fu, Y.; Zhang, X.; Wang, Y. Comprehensive Performance Evaluation Method of SBS Modified Asphalt Based on SPSS 26.0 Statistical Analysis. Mater. Rev. 2024, 38, 199–203. [Google Scholar]
  10. Long, Y.; Zhang, S.; Yang, B.; Wei, L.; Lu, Y.; Mo, F.; Gan, B.; Liu, K. Relationship Between Morphological Traits and Body Weight of Scatophagus argus at Different Sizes. Jiangxi Fish. Sci. Technol. 2024, 03, 1–5. [Google Scholar]
  11. Zhao, Y.; Yan, J.; Xue, B.; Yan, S.; Lan, R.; Wang, D.; Guo, X.; Guo, Y. Correlation Analysis of Serum Biochemical, Antioxidant, and Immune Indexes with Milk Yield and Milk Composition in Dairy Cows at Different Lactation Stages. Feed. Res. 2025, 10, 56–61. [Google Scholar]
  12. Jing, Y.; Wang, M.; Zhuang, Y.; Li, D.; Liu, J.; Liang, C. Effects of Mint Extract on Postharvest Quality of Bartlett Pears. J. Nucl. Agric. Sci. 2025, 39, 983–990. [Google Scholar]
  13. Sun, L.; Lu, Z.; Yuan, C.; Guo, T.; Liu, J. Linear Regression and Correlation Analysis between Body Weight and Body Size in Tibetan Sheep. Chin. J. Anim. Husb. 2024, 60, 226–231. [Google Scholar]
  14. Chen, H.P.; Li, Z.Y.; Wang, Y.R.; Yang, W.; Shi, H.J.; Li, S.S.; Zhu, C.H.; Li, G.L. Relationship between Body Weight and Morphological Traits in Female and Male Spotted Scat (Scatophagus argus). Pak. J. Zool. 2022, 54, 1675–1683. [Google Scholar] [CrossRef]
  15. He, C.; Zhao, R.; Zhang, W.; Zhang, Z.; Wen, X.; Gu, X.; Zhuang, H.; Wang, B. Research on Clinical Data Sharing Methods of Traditional Chinese Medicine Based on Secure Multi-Party Computation and Blockchain Technology: A Case Study of Frequency Analysis and Descriptive Statistics. Chin. J. Tradit. Chin. Med. Pharm. 2025, 43, 18–25. [Google Scholar]
  16. Yu, A.; Deng, P.; Shi, Y.; Xu, J.; Liu, Y.; Yang, M. Correlation and Path Analysis between Morphological Traits and Body Weight in Cultured Leiocassis longirostris. Fish. Sci. Technol. Inf. 2025, 52, 69–75. [Google Scholar]
  17. Li, H.; Zhang, S.; Wei, L.; Mo, F.; Lu, Y.; Yang, B.; Gan, B.; Pang, H. Correlation and Path Analysis between Morphological Traits and Body Weight in Different Culture Populations of Siganus fuscescens. Jiangxi Fish. Sci. Technol. 2024, 05, 8–13. [Google Scholar]
  18. Zhou, Y.; Liu, F.; He, J.; Wu, D.; Li, Z.; Qiu, B. Research on Water Environment Prediction by Coupling Regression Analysis and Grey System. Environ. Monit. China 1999, 05, 41–45. [Google Scholar]
  19. Zhang, Y.; Wu, Z.; Zhu, X. Establishment of Multiple Linear Regression and Anabaena Prediction Models for Algae and Related Environmental Factors in Qiandao Lake. Environ. Monit. China 2002, 03, 37–41. [Google Scholar]
  20. Chen, D.; Wang, Z.; Hang, Y.; Ma, X.; Qiao, Z.; Wang, Y. Effects of Three Morphological Traits on Body Weight in 1-Month-Old Larval and Juvenile Largemouth Bass (Micropterus salmoides). Henan Fish. 2024, 05, 19–22. [Google Scholar]
  21. Wang, X.; Li, L.; Wang, X.; Jian, Y.; Gao, F.; Guo, W.; Song, Z.; Yue, X.; Hu, F. Correlation and Path Analysis between Morphological Traits and Body Weight in 6-Month-Old Agrammus agrammus. Fish. Res. 2022, 44, 52–59. [Google Scholar]
  22. Lai, M. Analysis of Morphological Differences between Male and Female Individuals of Acrossocheilus hemispinus. Fish. Res. 2023, 45, 119–126. [Google Scholar]
  23. Wu, S.; Luo, H.; Zhang, Z.; Zheng, L.; Wang, Q.; Lin, K.; Ge, H.; Jiang, S.; Qiu, F. Principal Component and Path Analysis of Phenotypic Traits in Epinephelus moara (Yunlong Grouper) at Different Monthly Ages. J. Dalian Ocean. Univ. 2019, 34, 680–687. [Google Scholar]
  24. Du, J.; Shi, C.; Ma, L.; Du, L. Principal Component Analysis of Aroma Components in Base Liquor of Baijiu. Chin. Brew. 2020, 39, 62–68. [Google Scholar]
  25. Wen, Y.; Huo, W.; Liu, L. Application of K-Means Clustering Algorithm Based on Principal Component Analysis in Real-Time Flood Forecasting. Hydrology 2025, 05, 1–14. [Google Scholar]
  26. Mao, Q.; Zhong, X.; Shan, Y.; Wang, S.; Zhu, Z.; Guo, Y.; Yang, T. Morphological Traits and Path Analysis of Body Weight in Thymallus arcticus from the Irtysh River in Xinjiang, and Phylogenetic Analysis Based on COI Gene Sequences. J. Aquat. Ecol. 2024, 45, 152–160. [Google Scholar]
  27. Duan, G.; Zhou, H.; Wang, H.; Ling, J.; Hu, Y.; Pan, T.; Yang, M.; Wu, L.; Jiang, H. Analysis of the Effects of Morphological Traits on Body Weight in a Selected Population of 60-day-old Pelteobagrus vachelli. J. Anhui Agric. Univ. 2023, 50, 78–85. [Google Scholar]
  28. Li, P.; Liu, W.; Wang, J.; Tang, F.; Cui, K.; Gao, W. Analysis of the Influence of Morphological Traits on Body Mass of Oncorhynchus masou. J. Dalian Ocean. Univ. 2018, 33, 600–606. [Google Scholar]
  29. Zhou, S.; Yu, G.; Ma, Z. Correlation and Path Analysis of Morphological Traits with Body Mass in Cultured Female Cheilinus undulatus. Mar. Sci. 2023, 47, 44–52. [Google Scholar]
  30. Li, P.; Lu, W.; Tang, F. Principal Component and Path Analysis of Morphological Trait Factors of Protosalanx hyalocranius in Dalong Lake, Heilongjiang Province. Wetl. Sci. 2022, 20, 86–93. [Google Scholar]
  31. Qu, Z.; Tang, Z.; Ma, Y.; Huang, T.; Xiao, J.; Chen, L.; Guo, Z.; Luo, Y.; Sun, Y. Correlation and Path Analysis of Morphological Traits with Body Mass in Leptobarbus hoevenii. J. South. Agric. 2023, 54, 2646–2653. [Google Scholar]
  32. Lian, Q.; Yuan, J.; Wu, Y.; Lu, J.; Guo, A.; Ni, M.; Liu, M.; Zheng, S. Path Analysis of Morphological Traits on Body Weight in 4-month-old Opsariichthys bidens. Hebei Fish. 2022, 01, 1–5+11. [Google Scholar]
  33. Dong, Y.; Sheng, W.; Yu, H.; Ma, Z.; Li, X.; Yang, T.; Zhang, Z.; Zhang, H.; Song, S. Path Analysis of the Influence of Morphological Traits on Body Weight in Juvenile Lateolabrax japonicus. J. Fish. 2021, 34, 29–34+39. [Google Scholar]
  34. Chen, A.; Dong, Y.; Lv, M.; Li, Q.; Li, M.; Shi, Y.; Liu, M. Path Analysis of Morphological Traits on Body Weight and Growth Curve Fitting in Larval Maccullochella peelii. Freshw. Fish. 2023, 53, 61–67. [Google Scholar]
  35. Huang, J.; Guo, Z.; Chen, G.; Zhang, J.; Cai, R.; Lu, Z. Correlation and Path Analysis of Morphological Traits and Body Weight in 4-month-old Juvenile Rachycentron canadum. Mar. Sci. 2019, 43, 72–79. [Google Scholar]
  36. Li, Z.; Jing, T.; Li, Y.; Lu, A.; Zhou, J.; Luo, H.; Ye, H. Effects of Morphological Traits on Body Weight in Leiocassis longirostris. Prog. Fish. Sci. 2021, 42, 98–105. [Google Scholar]
  37. Wang, H.; Ye, L.; Hu, Q.; Fu, M.; Xiao, Z. Correlation and Path Analysis of Morphological Traits and Body Weight in Amphiprion ocellaris. J. South. Agric. 2021, 52, 221–227. [Google Scholar]
  38. Yang, Y.; Xiang, M.; Liu, T.; Dai, B.; Luo, H.; Ye, H. Relationship between Morphological Traits and Body Weight of 13-month-old Farmed Schizothorax prenanti. J. Henan Agric. Sci. 2019, 48, 139–144. [Google Scholar]
  39. Zhou, S.; Huang, W.; Zhou, R.; Xie, Y.; Xia, D.; Shi, H. Correlative Analysis of Main Morphological Traits and Body Weight in 6-month-old Epinephelus akaara. J. Fish. 2015, 28, 48–51. [Google Scholar]
  40. Zeng, C.; Liu, B.S.; Zhu, K.C.; Guo, L.; Guo, H.Y.; Zhang, N.; Yang, Q.; Yang, J.W.; Zhang, D.C. Comparison of Body Height, Body Length, Full Length and Body Weight Growth Curves of the Longfin Batfish, Platax teira. Pak. J. Zool. 2021, 53, 661–667. [Google Scholar] [CrossRef]
  41. Zhao, W.; Yang, R.; Hu, J.; Yang, Q.; Ma, Z.; Yu, G. Path Analysis of the Influence of Morphological Traits on Body Weight in 5-month-old Epinephelus coioides. J. Dalian Ocean. Univ. 2017, 32, 557–562. [Google Scholar]
  42. Zhao, W.; Hu, J.; Ma, Z.; Yu, G.; Yang, R.; Wang, L. Path Analysis of the Influence of Morphological Traits on Body Weight and Growth Curve Fitting in Juvenile Lates calcarifer. J. South. Agric. 2017, 48, 1700–1707. [Google Scholar]
  43. He, H.; Zhou, J.; Wang, Z.; Wang, W. Growth Characteristics of Juvenile Glyptosternon maculatum. J. Gansu Agric. Univ. 2025, 60, 64–70. [Google Scholar]
  44. Li, P.; Liu, W.; Wang, J.; Tang, F. Principal Component and Discriminant Analysis of Phenotypic Traits of Oncorhynchus masou at Different Months of Age. Fish. Sci. 2017, 36, 707–713. [Google Scholar]
  45. Zhang, L. Study on the Individual Biology of Triplophysa tenuis in Muzat River, Xinjiang. Master’s Thesis, Tarim University, Aral, China, 2024. [Google Scholar]
Figure 1. Sample point.
Fishes 10 00359 g001
Figure 2. Traditional morphological measurement. Note: 1. total length; 2. body length; 3. eye diameter; 4. snout length; 5. length behind the eye; 6. head length; 7. caudal peduncle length; 8. caudal peduncle height; 9. body depth; 10. body width; 11. eye spacing; 12. mouth cleft wide; and 13. mouth cleft high.
Fishes 10 00359 g002
Figure 3. Analysis results of the scree plot.
Fishes 10 00359 g003
Figure 4. The distribution of morphological traits on PC1 and PC2.
Fishes 10 00359 g004
Table 1. Basic Information of P. schrenkii Samples.
ProjectRange
Sample sizeN = 100
Body mass range2.90 ~ 15.70 g
Mean body mass6.64 ± 2.64 g
Body length range53.24 ~ 93.40 mm
Mean body length69.20 ± 8.74 mm
Table 2. Statistical analysis results of P. schrenkii.
TraitRangeCV (%)(Mean ± SD)
TL/mm61.47~106.3711.3681.06 ± 9.21
BL/mm53.24~93.4012.6369.20 ± 8.74
ED/mm3.71~6.4312.304.96 ± 0.61
SL/mm3.75~11.5124.357.27 ± 1.77
LBE/mm5.59~16.5520.8511.51 ± 2.40
HL/mm12.97~31.3216.6822.60 ± 3.77
ES/mm3.03~8.6221.515.95 ± 1.28
MCW/mm3.46~12.6727.517.78 ± 2.14
MCH/mm3.91~13.6324.537.91 ± 1.94
BD/mm6.57~26.2618.8517.03 ± 3.21
BW/mm6.16~21.4322.949.72 ± 2.23
CPL/mm6.63~19.4218.2212.24 ± 2.23
CPH/mm4.28~9.0416.026.18 ± 0.99
Table 3. Results of the correlation analysis of P. schrenkii. Note: * correlation between variables is significant (p < 0.05); ** correlation between variables is highly significant (p < 0.01).
TraitBMTLBLEDSLLBEHLESMCWMCHBDBWCPLCPH
BM1
TL0.886 **1
BL0.942 **0.927 **1
ED0.539 **0.544 **0.622 **1
SL0.619 **0.631 **0.650 **0.575 **1
LBE0.586 **0.576 **0.615 **0.458 **0.458 **1
HL0.610 **0.628 **0.648 **0.532 **0.573 **0.927 **1
ES0.288 **0.219 *0.252 *−0.081 **−0.222 *0.473 **0.359 **1
MCW0.595 **0.669 **0.667 **0.442 **0.602 **0.302 **0.409 **−0.1601
MCH0.464 **0.560 **0.494 **0.0960.310 **0.249 *0.322 **0.0370.719 **1
BD0.740 **0.650 **0.703 **0.483 **0.648 **0.462 **0.500 **−0.0230.567 **0.372 **1
BW0.748 **0.645 **0.691 **0.440 **0.502 **0.337 **0.418 **0.0600.488 **0.348 **0.486 **1
CPL0.694 **0.648 **0.714 **0.432 **0.345 **0.373 **0.345 **0.2480.457 **0.393 **0.426 **0.538 **1
CPH0.702 **0.685 **0.732 **0.588 **0.6933 **0.511 **0.567 **−0.077 0.579 **0.264 **0.682 **0567 **0.497 **1
Table 4. Model selection. Note: the independent variable introduced in Model 1 is (TL); the independent variables introduced in Model 2 are 1 (BL) and 2 (BW); the independent variables introduced in Model 3 are 1 (BL), 2 (BW), and 3 (BD); and the independent variables introduced in Model 4 are 1 (BL), 2 (BW), 3 (BD), and 4 (ES).
ModelRR2Adjusted R-SquaredEstimated Standard Error
1BL0.9420.8870.8860.89619
2BW0.9510.9050.9030.82567
3BD0.9580.9170.9150.77609
4ES0.9640.9300.9270.71879
Table 5. Analysis of multiple regression equation.
IndexSum of SquaresdfMean SquareFp
Regression649.4424162.361314.254<0.001
Residual49.082950.517
In total698.52499
Table 6. Results of the regression coefficients.
ParameterUnstandardized CoefficientStandard ErrorStandardized CoefficienttpVIF
Constant−13.1650.612 −21.510<0.001
BL0.1880.0150.62312.338<0.0013.444
BW0.2510.0450.2125.557<0.0011.970
BD0.1660.0330.2025.044<0.0012.164
ES0.2530.0610.1234.113<0.0011.202
Table 7. Path analysis of the traits on the body mass.
TraitRPath CoefficientIndirect Path Coefficient
BLBWBDES
BL0.9420.623 0.1460.1420.0310.319
BW0.7480.2120.430 0.0980.0070.535
BD0.7400.2020.4380.103 −0.0030.538
ES0.2880.1230.1570.013−0.005 0.165
Table 8. The determination coefficient of traits on body mass.
TraitBLBWBDES
BL0.3880.1820.1770.039
BW 0.0450.0420.003
BD 0.041−0.001
ES 0.025
Total coefficient of determination0.941
Residual coefficient of determination0.059
Residual factor0.243
Table 9. Curve model fitting of morphological traits and body weight.
RegressionModelModel SummaryConstantCoefficient b1Coefficient b2
R2Fp
BL-BMLinear0.887771.9270−13.0680.285
Logarithm0.861605.4410−74.63919.219
Quadratic function0.916263.452011.106−0.4220.005
Power function0.918812.452002.984
Exponent0.9211342.56800.3000.044
BW-BMLinear0.559124.3130−1.9630.885
Logarithm0.632168.4720−15.94710.031
Quadratic function0.675100.5290−11.9532.707−0.078
Power function0.620159.97300.2131.494
Exponent0.515104.22401.7740.128
BD-BMLinear0.547118.4040−3.7510.610
Logarithm0.42873.2610−16.9918.393
Quadratic function0.711118.864013.886−1.5880.066
Power function0.44879.44000.1621.291
Exponent0.553168.84101.2760.092
ES-BMLinear0.08398.94503.1090.593
Logarithm0.07972.10800.7763.331
Quadratic function0.09151.47407.813−1.0450.136
Power function0.07571.07200.4882.601
Exponent0.07898.61403.6660.087
Table 10. Results of the principal component analysis of morphological traits.
ComponentInitial EigenvalueSum of Squared Loadings ExtractedTraitComponent
TotalPercentage of VarianceAccumulate/%TotalPercentage of VarianceAccumulate/%123
16.92653.55453.5546.96253.55453.554TL0.9080.0450.175
21.68312.94766.5011.68312.94766.501BL0.9420.0720.104
31.2279.43775.9381.2279.43775.938ED0.685−0.094−0.431
40.8686.67582.612 SL0.769−0.303−0.311
50.5133.94686.559 LBE0.7000.567−0.226
60.4653.57490.133 HL0.7630.430−0.246
70.3262.50792.640 ES0.1420.9010.259
80.2752.11394.753 MCW0.749−0.3900.295
90.2682.05896.811 MCH0.547−0.1710.669
100.1831.41098.221 BD0.772−0.169−0.112
110.1270.98199.202 BW0.713−0.1010.109
120.0580.44399.645 CPL0.6810.0930.317
130.0460.355100.000 CPH0.817−0.170−0.253
Disclaimer/Publisher’s Note: The statements, opinions and data contained in all publications are solely those of the individual author(s) and contributor(s) and not of MDPI and/or the editor(s). MDPI and/or the editor(s) disclaim responsibility for any injury to people or property resulting from any ideas, methods, instructions or products referred to in the content.

