Article

Multi-Omics Investigation of Fatty Acid Content Variations in Common Carp (Cyprinus carpio) Muscle: Integrating Genome, Transcriptome, and Lipid Profiling Data

1
National Demonstration Center for Experimental Fisheries Science Education, Shanghai Ocean University, Shanghai 201306, China
2
Key Laboratory of Aquatic Genomics, Ministry of Agriculture and Rural Affairs, Beijing Key Laboratory of Fishery Biotechnology, Chinese Academy of Fishery Sciences, Beijing 100141, China
*
Authors to whom correspondence should be addressed.
Fishes 2025, 10(5), 234; https://doi.org/10.3390/fishes10050234
Submission received: 7 April 2025 / Revised: 7 May 2025 / Accepted: 13 May 2025 / Published: 16 May 2025
(This article belongs to the Special Issue Molecular Design Breeding in Aquaculture)

Abstract

Fatty acids (FAs), especially the polyunsaturated fatty acids (PUFAs), play pivotal roles in growth and development. Fish possess a remarkable ability to synthesize PUFAs, rendering them a crucial and significant source of these essential FAs for human consumption. Despite extensive research on the metabolic processes of FAs, the primary processes underlying FA content variation and corresponding regulatory mechanisms remain largely unexplored. We quantified the muscular FA profiles of 304 common carp samples. High variation in muscle FA content among samples was observed, with the coefficients of variation ranging from 0.36 to 0.92. With genome-wide association studies (GWAS), we identified 1410 SNPs significantly associated with the FA content. The genetic variation at genes participating in oxidation, ubiquitination, and transcriptional factors was associated with the content of multiple FAs, while few variants were observed in the FA-synthesis genes. For the total PUFA (TPUFA) content, transcriptome analysis of groups with the highest and lowest TPUFA content identified 715 differentially expressed genes (DEGs), including genes involved in oxidation and ubiquitination. Using multiple genomic selection programs with the associated SNPs for FA content, we obtained high and positive correlations ranging from 0.65 to 0.92 between the real FA contents and estimated breeding values. These findings manifested the major-effect processes governing the differences in muscular FA content and their regulatory mechanisms. The optimal genomic selection programs provide novel and feasible perspectives to enhance FA content in common carp.
Key Contribution: This study suggests more contributions of oxidation, ubiquitination, and transcriptional factors to the differences in FA concentrations than in biosynthesis; revealing, via the integration of lipidome, genome, and transcriptome analysis, the primary processes regulating the FA content diversity in common carp. These findings deepen the understanding of the molecular mechanisms underlying the differences in fish FA content and offer guidance for GS to enhance fish fillet nutritional quality.

1. Introduction

Fatty acids (FAs) play indispensable roles in a multitude of physiological processes. They are crucial for energy storage [1], stabilizing membrane structure [2], and participating in multiple signaling pathways [3]. In particular, the poly-unsaturated fatty acids (PUFAs), such as eicosapentaenoic acid (EPA, C20:5n3) and docosahexaenoic acid (DHA, C22:6n3), are of utmost importance for the health, growth [4], and development of both humans and fish. Fish possess a remarkable ability to synthesize PUFAs and serve as a major dietary source of the PUFAs [5]. The muscular PUFA content varies significantly across fish species and even among strains within the same species [6]. Enhancing the endogenous PUFA synthesis capacity or decreasing PUFA consumption in fish can substantially reduce dependence on exogenous fish oil, elevate the quality of fish fillets, and confer health benefits [7,8]. Therefore, it is desirable to identify the primary processes influencing muscular FA content and elucidate regulatory mechanisms.
FA metabolism encompasses a series of intricate biological processes, including uptake, transport, synthesis, and oxidation. The FA translocase cluster of differentiation 36 (CD36) is a well-characterized receptor involved in the uptake of FAs [9]. The fatty acid-binding proteins (FABPs) [10], fatty acid transporter proteins (FATPs) [11], and free fatty acid receptors (FFARs) [12] are all integral to the FA transportation. FA synthesis requires stearoyl-CoA desaturases (SCDs), acetyl-CoA carboxylases (ACCs), fatty acid synthases (FASNs) [13], elongases of very long chain fatty acids (ELOVLs) [14], and fatty acid desaturases (FADs) [15]. The ELOVLs and FADs are essential for PUFA biosynthesis. In the mitochondria [16], β-oxidation involves a series of enzymes, including fatty-acid-CoA ligases (FACLs), acyl-CoA synthetases (ACSs), carnitine palmitoyltransferases (CPTs), acyl-CoA dehydrogenases (ACADs), enoyl-CoA hydratases (ECHs), hydroxy acyl-CoA dehydrogenases (HADHs), and acetyl-CoA acetyltransferases (ACATs), and NAD(P)H dehydrogenases (NDEs) [17]. For FA oxidation in the peroxisome, acyl-CoA oxidases (ACOXs) [18], enoyl-CoA reductases (ECRs) [19], and peroxisomal biogenesis factors (PEXs) are involved [20]. The ω-oxidation in the endoplasmic reticulum requires cytochrome P450 monooxygenases [21], alcohol dehydrogenases (ADHs), and aldehyde dehydrogenases (ALDHs). Beyond these primary processes, post-translational modifications of these proteins, including phosphorylation, methylation, acetylation, glycosylation, and ubiquitination, have a profound impact on FA metabolism [22,23]. Moreover, both transcriptional and post-transcriptional levels have been extensively explored to understand the regulatory mechanisms of FAs. Many transcription factors regulating the primary FA metabolism processes were identified, including the specificity protein (Sp) gene family [24], peroxisome proliferator-activated receptors (PPARs) [25], and sterol regulatory element binding proteins (SREBPs) [26]. Additionally, many microRNAs (miRNAs) and long non-coding RNAs (lncRNAs) have been found to regulate lipid metabolism at the post-transcriptional level [27,28]. Given that numerous metabolic pathways are intricately involved in FA metabolism, the key pathways regulating differences in the composition and content of muscular FAs among individuals remain elusive and have not been fully explored. Uncovering the major-effect genes and pivotal metabolic pathways, as well as clarifying their regulatory mechanisms on the differences in the FA concentrations, will provide novel and feasible directions to enhance the FA contents of fish fillets.
Common carp (Cyprinus carpio, Cypriniformes) is widely cultivated worldwide, accounting for approximately 10% of global freshwater aquaculture production [29]. Nutritionally valuable, this freshwater fish contains 11.8–18% protein and 6.8–12.4% fat, with n-6 fatty acids comprising 1.3–14.8% of its lipid content [30]. Carp, a freshwater species, undergoes de novo monounsaturated fatty acid (MUFA) lipogenesis of C18:1 from acetyl-CoA, as well as de novo polyunsaturated fatty acid (PUFA) lipogenesis of C18:3n-6 from C18:2n-6 and C18:4n-3 from C18:3n-3 [31]. Remarkably, their essential fatty acid requirements can be adequately met through plant-derived 18-carbon fatty acids [32]. Notably, carp culture has the potential to become a net producer of PUFA, benefiting human health if fish with a high capacity for fatty acid (FA) synthesis are selected.
As a tetraploid fish, common carp encodes more PUFA-synthesis enzymes than other diploid fishes. We have previously characterized the functions of two duplicated FAD2 and two duplicated ELOVL5 genes [33]. Our previous findings revealed significant diversity in FA contents among common carp individuals [34]. Scanning the SNPs in the promoters and coding regions of these four genes identified relatively few polymorphisms [33,34,35,36]. These results already suggested that the FA-synthesis genes are not the major-effect genes responsible for the differences in muscular FA content and that the presence of other genetic variants contributes to the differences in those. Multi-omics analysis, combining genome, transcriptome, or proteome, revealed the organism information of the whole genome, RNA transcript in tissues, and protein, and is a powerful tool to study the regulatory mechanisms of economic traits [37]. In this study, we combined genome, transcriptome, and FA profiles analysis to identify the major-effect genes and primary metabolic pathways and clarify their mechanisms regulating differences in FA content. Finally, we explored the predictive abilities of multiple Genomic Selection (GS) methods to select fish with fillet FA content. Our findings not only reveal the major-effect processes regulating differences in the muscle FA content but also contribute to the development of breeding strategies to improve the flesh quality of common carp.

2. Materials and Methods

2.1. Sampling

This study was conducted according to the guidelines of the Declaration of China for ethical review of laboratory animal welfare (GB/T 35892-2018) and was approved by the Animal Care and Use Committee of the Chinese Academy of Fishery Sciences (protocol code ACUC-CAFS-20201202, approval date 27 December 2020). All procedures adhered to established standards for the ethical care and use of animals in scientific research.
Juvenile common carp were reared in the same pond at the FangShan experimental base of the Chinese Academy of Fishery Sciences (Beijing, China) for one year. They were fed with a commercial diet (30% protein and 4% crude fat; TongWei, Sichuan, China) three times daily. After one year, 304 common carp individuals (one-year-old, body weight: 316.50 ± 5.86 g) were collected and euthanized with an MS222 solution (40 mg/L). Body weight was recorded for each fish. Fin tissue was collected for DNA extraction and genome resequencing. Muscle samples below the dorsal fin were obtained for FA quantification, and liver tissue was collected for transcriptome analysis.

2.2. FA Profiles Analysis of Common Carp Muscle

Muscle tissues were freeze-dried, ground, and weighed. The absolute crude fat content of the examined muscle was determined using the Soxhlet extraction method with a Soxtec™ 8000 apparatus (FOSS, Hilleroed, Denmark). FAs from each fish muscle sample were converted to fatty acid methyl esters (FAMEs), purified, and analyzed using gas chromatography (7890A, Agilent Technologies, Wilmington, DE, USA) equipped with a flame ionization detector (FID) and a DB–FFAP capillary column [36]. FA types were identified by comparing retention times with those of a Supelco 37 Component FAME standard mix (Nu-Chek Prep Inc., Elysian, MN, USA). The proportion of each FA was calculated as (area of one FA/total area of all FAs) × 100. The absolute content of each single FA was equal to its relative content multiplied by the absolute crude fat content. The total saturated FA (TSFA), total monounsaturated fatty acids (TMUFA), and total polyunsaturated fatty acids (TPUFA) contents were calculated by summing the respective single FA contents.
Stringent criteria were applied to exclude FAs and samples and minimize phenotypic errors: (1) FAs with content < 0.10 mg/g across all individuals were excluded. (2) Samples with fewer than 10 retained FAs were discarded. (3) Outliers (values exceeding the mean ± 3 times the standard deviation) were removed. Individuals with outliers in two or more FAs were excluded. After filtering off data from samples prone of these errors, Spearman correlation coefficients between any two types of FAs were calculated using the R ‘cor.test’ function and visualized using the R ‘heatmap’ function [37].

2.3. Genome Re-Sequencing, Genotyping, and Diversity Analysis

Genomic DNA was extracted from fin tissue using the DNeasy Blood and Tissue Kit (Qiagen, Hilden, Germany). DNA concentration and integrity were assessed using a NanoDrop 8000 spectrophotometer (NanoDrop Technologies, Wilmington, USA) and 1% agarose gel electrophoresis. Libraries with a 350-bp insert size were constructed and sequenced on a HiSeq platform in 150 bp paired-end mode. Reads were cleaned with Trimmomatic [38] and aligned to the common carp genome [39] using BWA [40] with default parameters. Alignments were ordered using SAMtools (v1.14) [41].
Two data filtration steps were applied to retain only high-quality SNPs. Duplicate alignments were marked using MarkDuplicates in GATK (v4.6.1.0) [42]. Variants were called using HaplotypeCaller and GenotypeGVCFs in GATK and then classified into SNPs and Indels using SelectVariants. SNPs were filtered using bcftools (v1.14) [41] with parameters: QD < 2, FS > 60, MQ < 30, haplotype score > 13, RankSum < −8, sequencing depths < 4, mapping qualities < 20. High-quality SNPs were retained using PLINK (v1.90) [43] with a missing rate < 10% and minor allele frequency (MAF) > 5%.
The genome was partitioned into non-overlapping 1Mb blocks, and the SNP density of each block was calculated. The functional effects of SNPs upon their closest genes were annotated using Annovar (v2020Jun08) [44]. SNPs were classified into nine types: 5′ untranslated region (5′ UTR), 3′ UTR, upstream region, downstream region, exonic, intronic, intergenic, non-coding RNA (ncRNA), and splicing mutation. Exonic SNPs were further classified as non-synonymous, synonymous, stop gain, and stop loss.
A population genetic diversity was assessed with VCFtools (v0.1.17) [45] and measured using nucleotide sequence diversity (π) and observed heterozygosity (Ho).

2.4. GWAS

Principal components (PCs) were estimated using PLINK (v1.90) [43] and the first five PCs were added as covariates into the fixed-effect model for association tests. Kinship coefficients were calculated using a centered relatedness matrix and included as covariates in GWAS. A mixed linear model (MLM) was performed with GEMMA (v0.98.5) [46].
Genome-wide suggestive and significance thresholds were determined by dividing 100 and 10 with the high-quality SNP number, respectively [47]. Manhattan and quantile-quantile (Q-Q) plots were generated using the rMVP (v1.3.5) package [48] in R Studio (v4.3.2) [37]. The SNPs with p-values below the suggestive threshold were considered to be associated with the trait. The proportion of variance explained (PVE) by a SNP was calculated using the formula [49]:
P V E = 2 β 2 M A F ( 1 M A F ) 2 β 2 M A F ( 1 M A F ) + ( s e ( β ) ) 2 2 N M A F ( 1 M A F )
where β is the SNP effect estimated with GEMMA.

2.5. Candidate Gene Identification and Enrichment Analysis

For each FA, candidate genes within 100 kb upstream and downstream of suggestive SNPs were identified using bedtools (v2.30.0) [50]. Gene Ontology (GO) enrichment analysis of the candidate genes was performed with TBtools (v2.15) [51]. All p-values were corrected using the Benjamini–Hochberg (BH) method [52]. Terms with corrected p-values < 0.05 were considered significant.

2.6. Conserved FA-Associated Genes Between Common Carp and Rainbow Trout

Blay et al. [53] genotyped rainbow trout samples using the 57 K SNP Axiom Trout Genotyping Array and discovered 338 candidate genes to be associated with the content of at least one of six FAs (LA, ARA, EPA, MUFA, PUFA, and n-6 PUFA). To identify conserved candidate genes associated with FA content between common carp and rainbow trout, we compared this gene set with our candidate genes using BLASTP (v2.12.0) [54] with an E-value of 10−6. Genes with sequence similarity > 50% and sequence coverage > 50% were considered conserved.

2.7. Identifying DEGs Related to TPUFA Content

From these 280 samples, we selected 30 fish with the highest total polyunsaturated fatty acid (TPUFA) content and another 30 fish with the lowest TPUFA content. Total RNA from the liver tissues of these 60 fish was isolated using TRIzol reagent (Qiagen, San Diego, CA, USA). RNA integrity was assessed using agarose gel electrophoresis. Sequencing libraries were constructed using the Stranded RNA Library Prep Kit (Illumina, San Diego, CA, USA) and sequenced on the Illumina Novaseq 6000 platform.
Raw RNA-seq reads were initially processed using fastp (v3.3) [55], aligned to the reference genome [39] using HISAT2 (v2.2.1) [56], and quantified using StringTie (v2.2.3) [57], with the expression level of each gene being represented as fragments per kilobase per million mapped reads (FPKMs). To identify DEGs, we employed the DESeq2 (v1.34.0) software [58] to compare the gene expression profile between the high-TPUFA group and the low-TPUFA group. DEGs were defined as those with an expression level fold-change ≥ 2 and a false discovery rate (FDR) ≤ 0.05. A volcano plot visualizing the expression patterns of the up-regulated or down-regulated DEGs was created using the ggplot2 package [59]. GO enrichment analysis of DEGs was conducted using TBtools (v2.15) to infer their inferred functions [51].

2.8. Quantitative Real-Time PCR Validation of the Core Genes Related to the TPUFA Content

We cross-referenced TPUFA-associated genes with the DEGs to identify the core genes. These genes were in proximity to the genetic variants associated with the TPUFA content and exhibited expression differences between groups with different TPUFA levels. Their expression patterns were validated with quantitative real-time PCR (qRT-PCR). Liver RNA from another ten fish (five with high TPUFA content and five with low TPUFA content) was extracted and reverse-transcribed into cDNA using the HiScript II Reverse Transcriptase kit (Vazyme, Nanjing, China). Primers for the candidate genes (Table S1) were designed using Primer-Premier 6 software (Premier Biosoft Interpairs, Palo Alto, CA, USA), with actin as the reference gene. The qPCR reaction was constructed using SYBR qPCR Master Mix (Vazyme, China) and operated on the QuantReady K9600 system (QuantGene, Shanghai, China). The 20-μL reaction system consisted of 11 μL 2× Universal SYBR qPCR mix, 0.4 μL each of forward and reverse primers, 1 μL cDNA template, and 7.20 μL ddH2O. The amplification program began with an initial denaturation at 95 °C for 1 min, followed by 42 cycles of denaturation at 95 °C for 5 s, and annealing at 60 °C for 30 s. Finally, a melt-curve analysis was conducted at 95 °C for 15 s, 60 °C for 1 min, and 95 °C for 15 s. The 2−ΔΔCT method was used to analyze the expression levels of DEGs [60]. For each gene, the expression difference between the two groups was compared using a one-tailed Wilcoxon rank-sum test [61]. A gene was confirmed as differentially expressed by qRT-PCR if the p-value was less than 0.05.

2.9. Genomic Selection for Content of Different FAs

The breeding values (BVs) for each single FA, TSFA, TMUFA, and TPUFA were estimated using BWGS (v0.2.1) [62]. This tool incorporates 12 breeding methods, including genomic best linear unbiased prediction (GBLUP) [63], empirical best linear unbiased prediction (EGBLUP), ridge regression (RR), LASSO, elastic net (EN), Bayesian ridge regression (BRR), Bayesian LASSO (BL), Bayes A (BA), Bayes B (BB), random forest regression (RF), support vector machine (SVM), and Bayes C (BC). For each method, 10 independent cross-validation replicates were performed. In each replicate, the 280 samples were randomly divided into a reference set (90%) and a validation set (10%). The genotypes and FA contents in the reference group were used to train the breeding method. The genotypes of the validation samples were input into the trained method to predict the BVs. To evaluate the predictive ability, for each replicate, Pearson correlation coefficient between the actual contents and the predicted BVs of the validation samples was calculated [64]. Mean correlation coefficients and their standard deviation (SD) were computed across 10 replicates. Mean squared error of prediction (MSEP) and corresponding SD-MSEP were also calculated.

3. Results

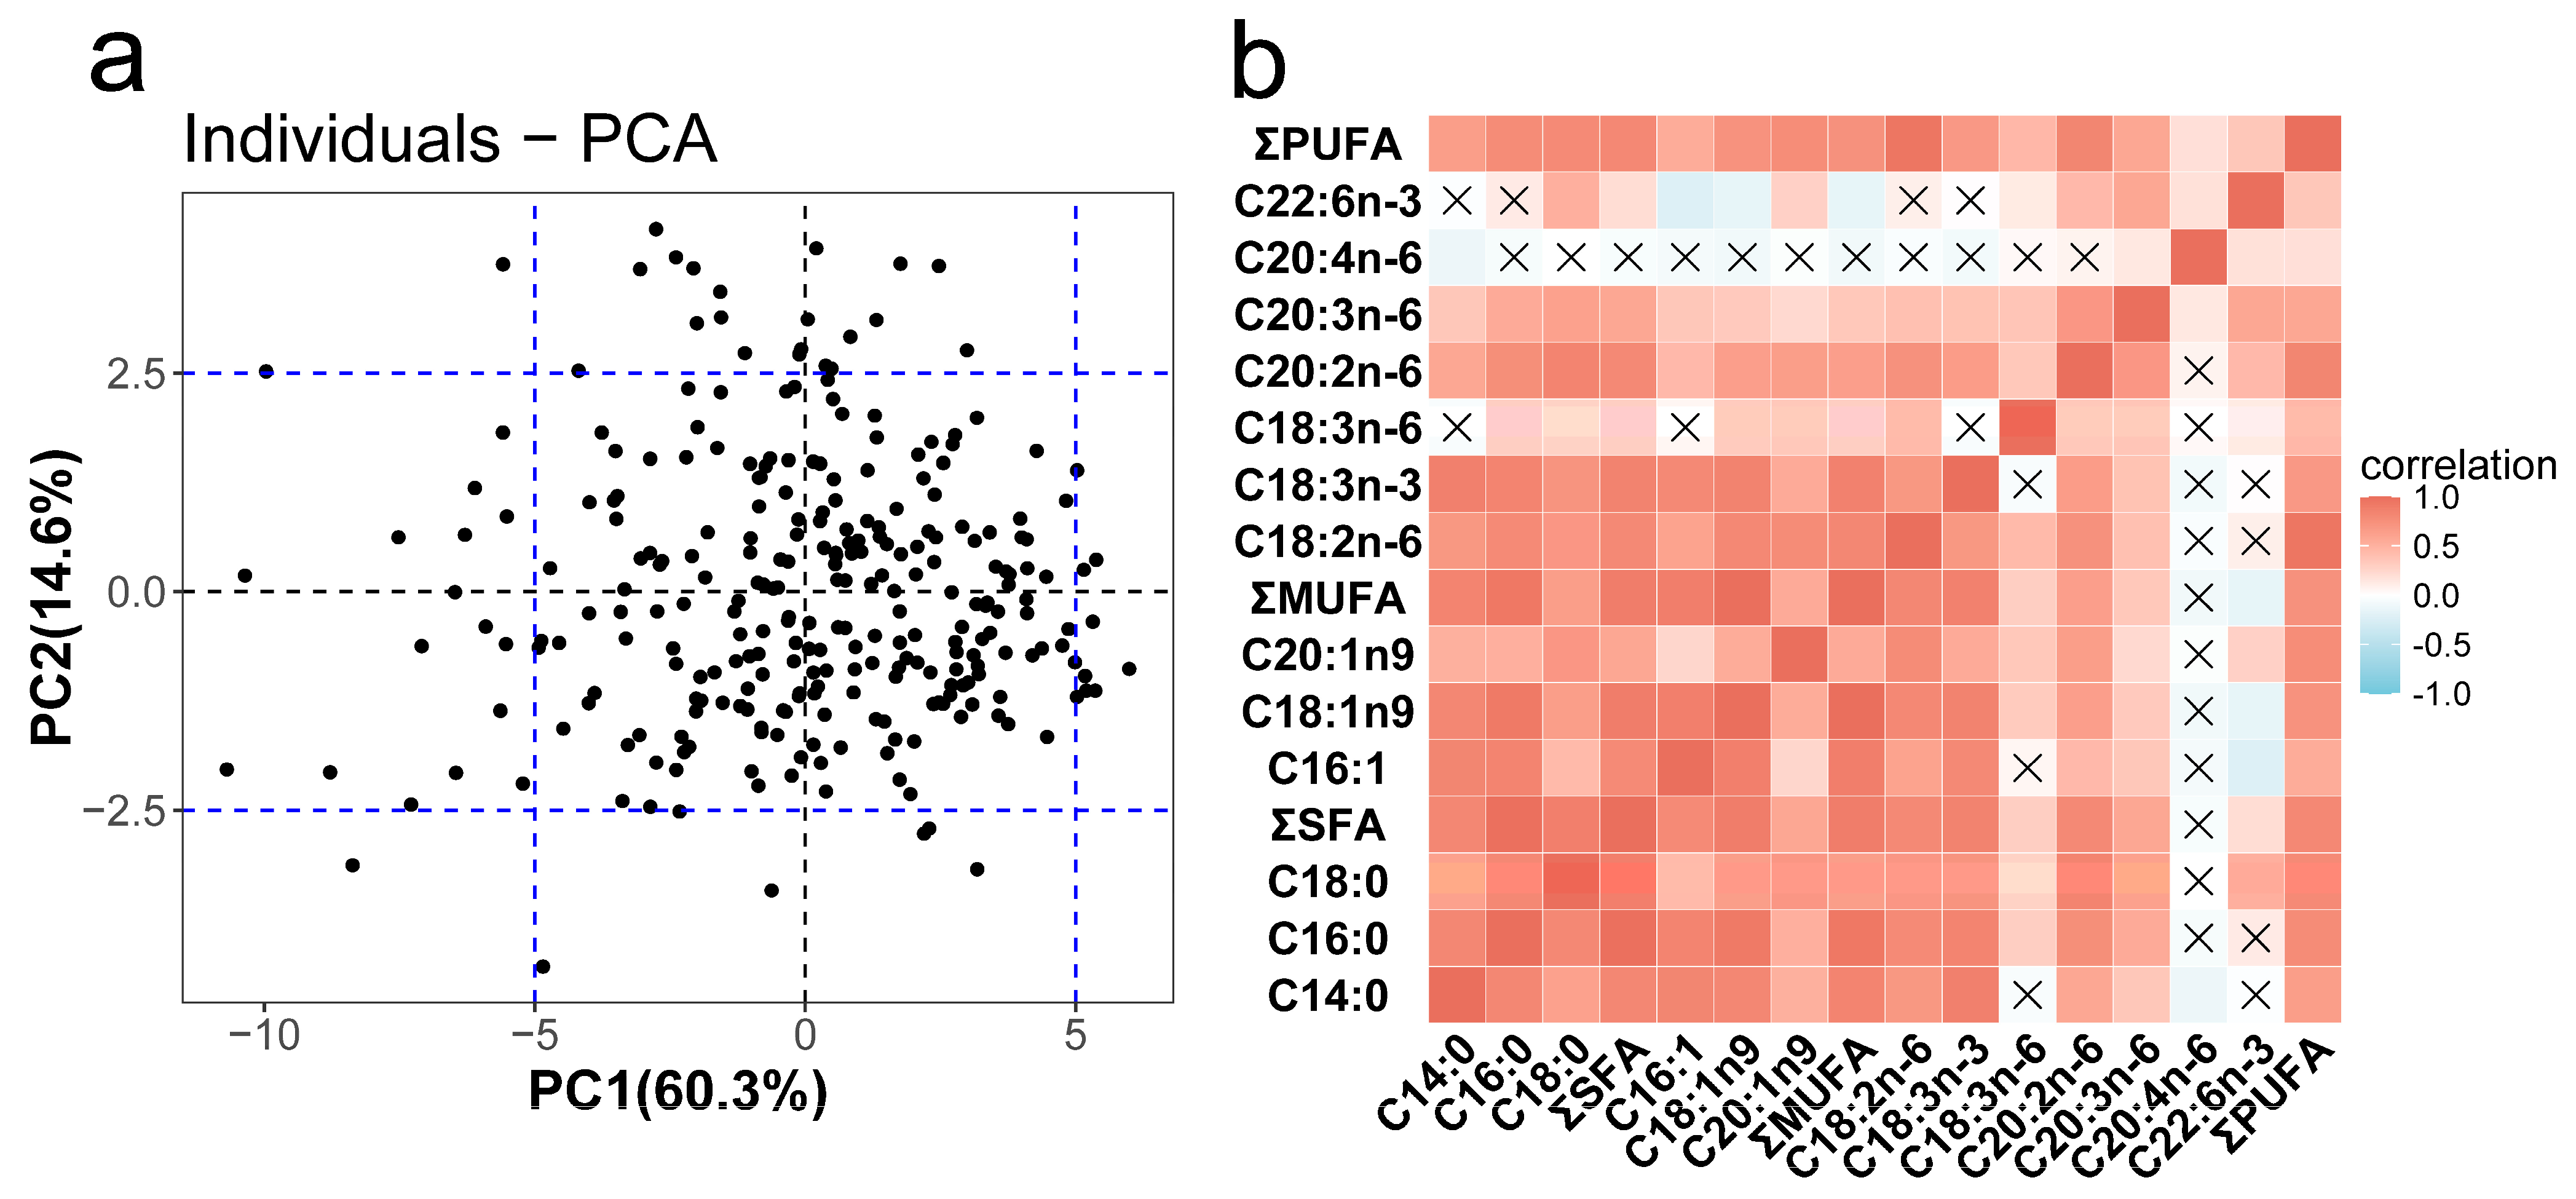
3.1. Diverse Muscular FA Contents

We quantified 21 types of FAs in common carp. After excluding FAs with contents below 0.10 mg/g, 13 high-content FAs were retained for subsequent analysis, including three SFAs, three MUFAs, and seven PUFAs (Table 1 and Table S2). After excluding 24 outlier samples due to apparent phenotypic measurement errors, 280 samples and their corresponding phenotypes were used for analysis. The average contents of TMUFA (7.82 mg/g) and TPUFA (6.48 mg/g) were higher than that of TSFA (5.19 mg/g), indicating a predominance of unsaturated FAs in common carp muscle.
The contents of different FAs varied significantly. C16:0 was the most abundant SFA (3.80 mg/g), C18:1n-9 was the major MUFA (6.89 mg/g), and C18:2n-6 was the most prevalent PUFA (4.66 mg/g). Among PUFAs, n-6 PUFAs were about seven times more abundant than n-3 PUFAs. Most n-3 PUFAs, except C18:3n-3 and C22:6n-3, were below the detection limit. Moreover, individual variation in FA contents was significant, with the coefficient of variation for detected FA contents ranging from 0.36 to 0.92. Principal component analysis (PCA) based on all phenotypic values showed that most individuals clustered together, but a few were more dispersed, demonstrating phenotypic diversity among samples (Figure 1a).
Among 120 pairs of FA traits for pair cross-calculation, 82.5% exhibited significantly positive correlations (correlation coefficients > 0.12, p ≤ 0.05), and 30% had high correlations > 0.70. Additionally, 18 pairs displayed no significant correlations. Notably, C20:4n-6 had no significant correlation with other FAs except C20:3n-6 (Figure 1b and Table S3), suggesting that its biosynthesis is closely linked only to C20:3n-6. In contrast, the content of C22:6n-3 was significantly negatively correlated with C16:1, C18:1n-9, and TMUFA.

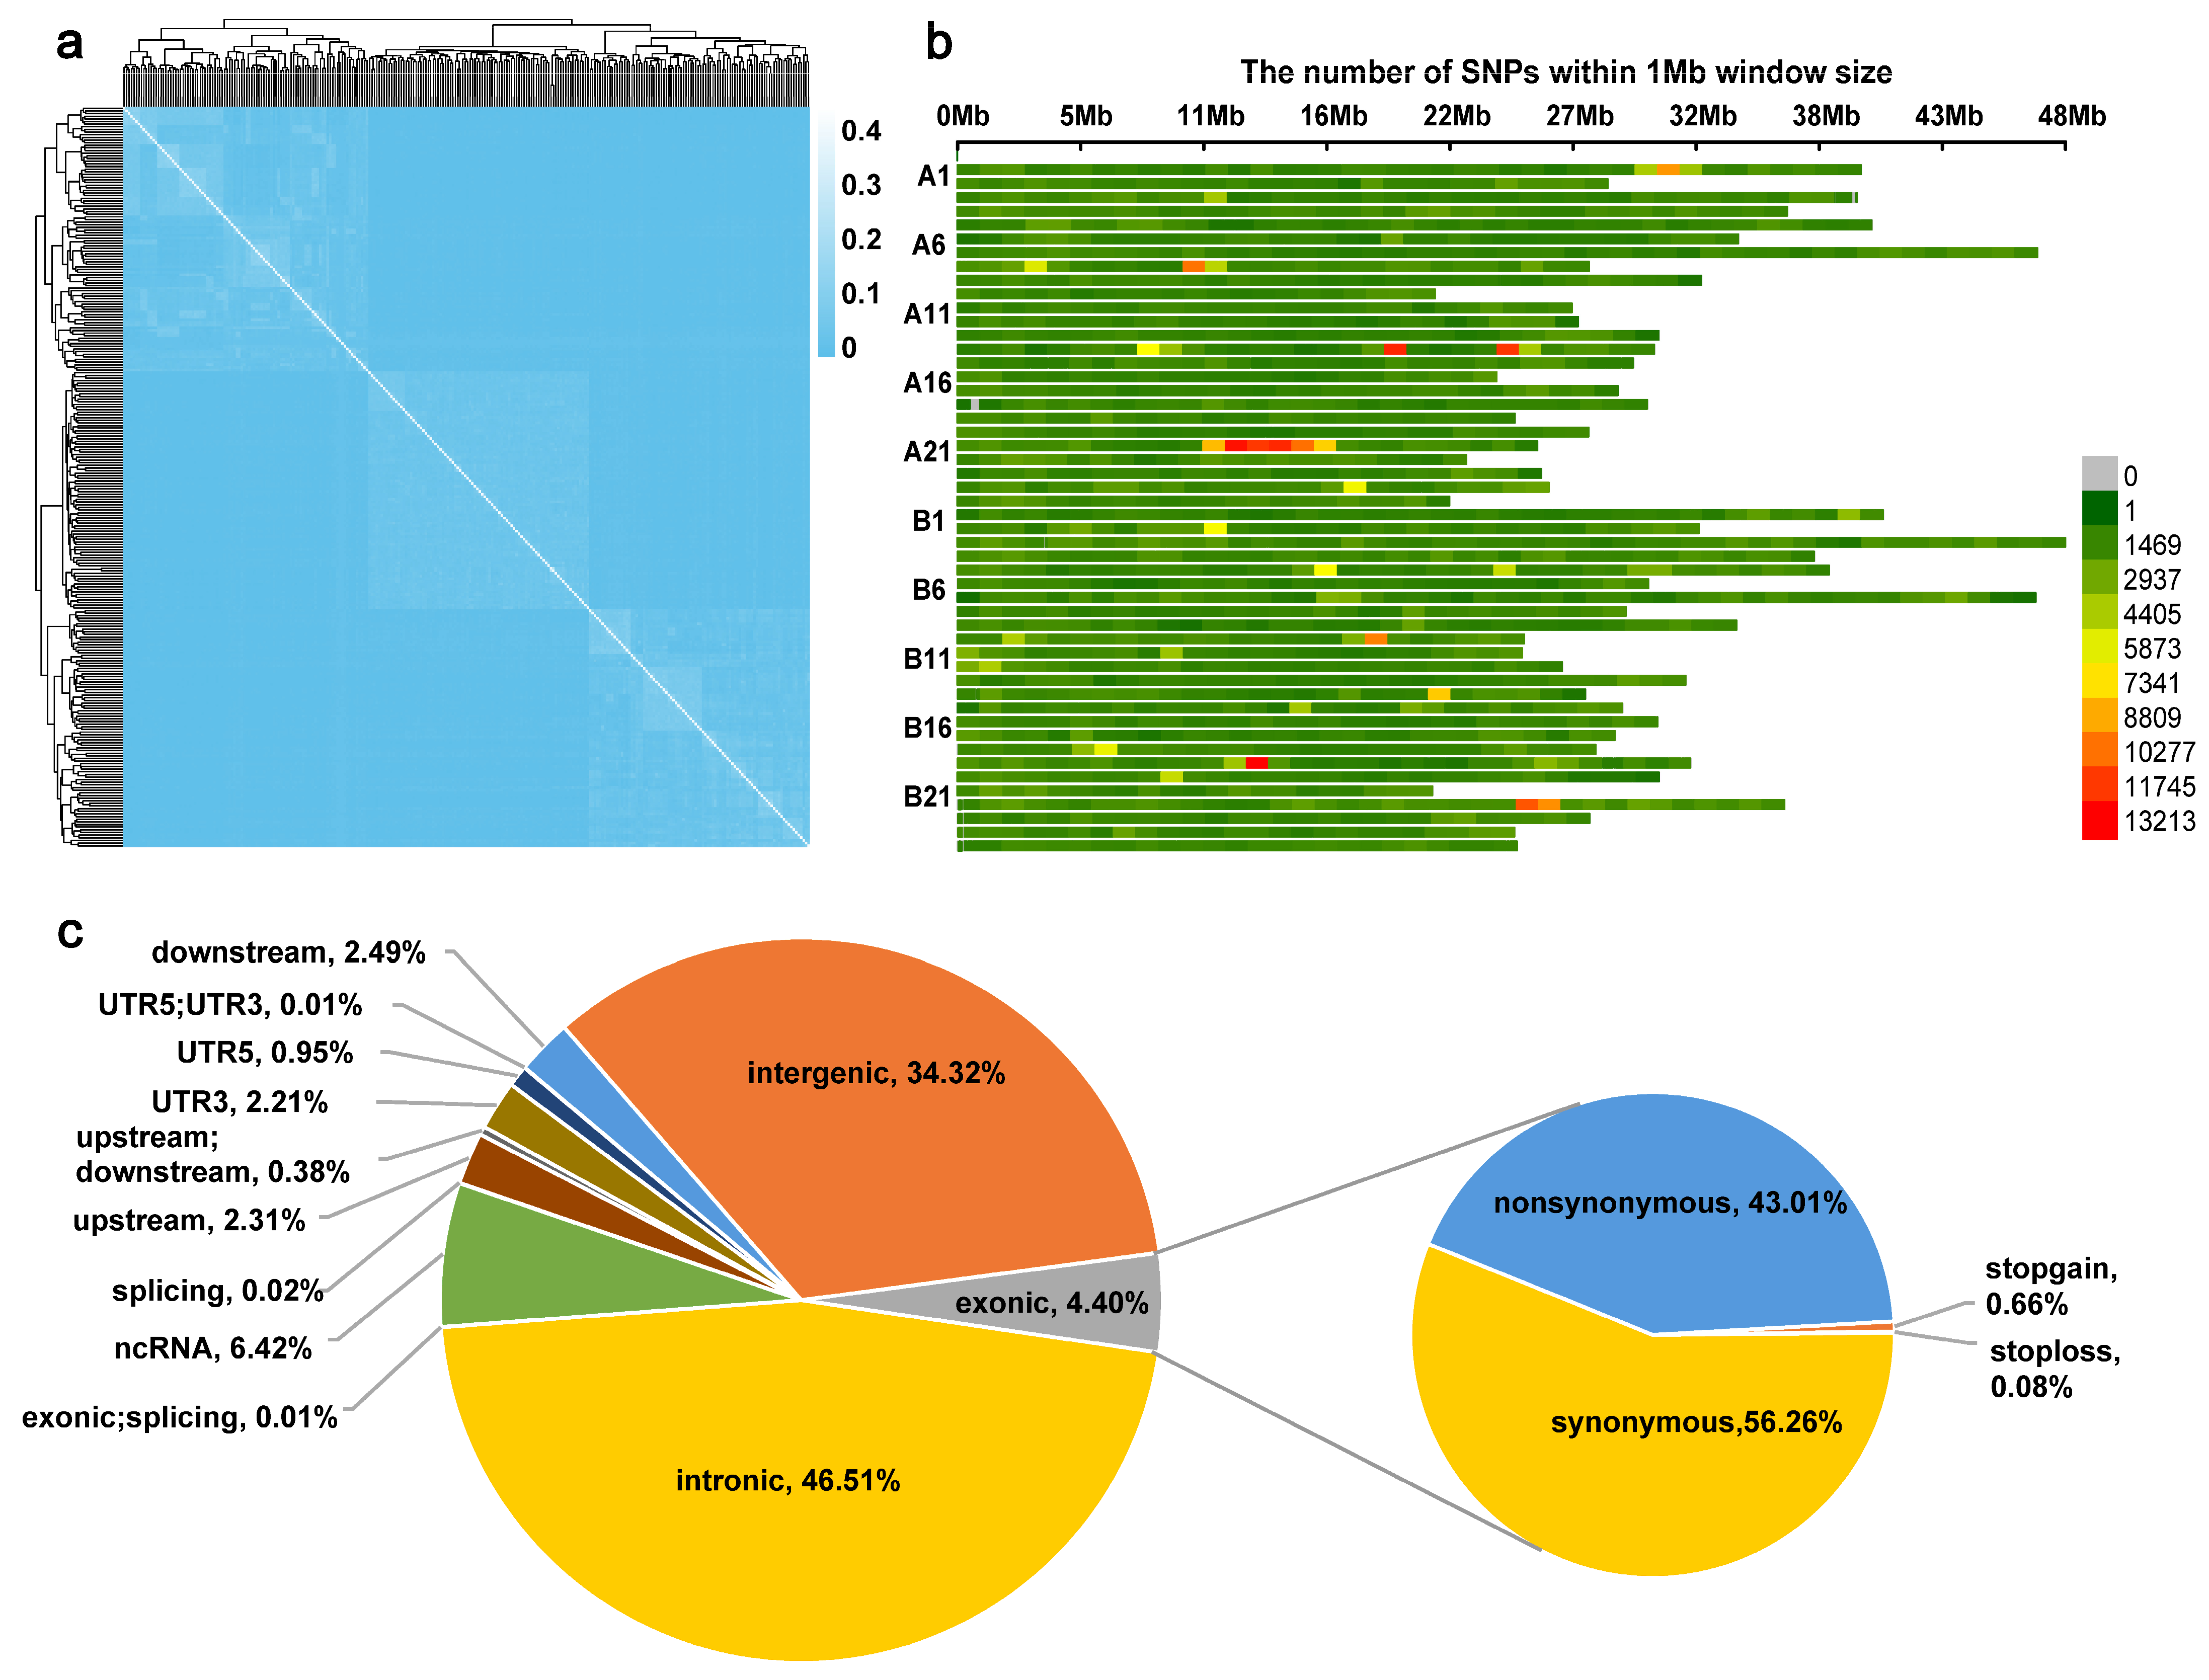
3.2. SNP Distribution Biases and Genetic Diversities

After processing the raw data, a total of 280 individuals collectively yielded 6.7 Tb of clean resequencing data, with more than 92.85% of the bases having a quality score surpassing Q30 (Table S4). The average clean data per sample was 22.05 Gb, and 98.37% of the reads were successfully mapped to the reference genome, accompanied by an average sequencing depth of 14.72-fold. We identified 2,757,424 high-quality SNPs, resulting in an average SNP density of 1.64 SNPs per kilobase across the entire genome. The nucleotide diversity (π) was 3.45 × 10⁻⁴, and the observed heterozygosity (Ho) was 0.27. With these SNPs, the subtle genetic kinship among the samples was uncovered (Figure 2a).
Notably, the distribution of SNPs exhibited two distinct biases. Firstly, the chromosomal distributions were uneven. Chromosomes A21 and B22 emerged as the hotspots, harboring the highest number of SNPs, with 94,134 and 85,038 SNPs, respectively. Specifically, chr A21 demonstrated the highest variant rate (3.71 SNPs per kb). The entire genome was divided into 1680 1M-length blocks. The average SNP density per block was 1640 SNPs. However, seven particular blocks stood out prominently, displaying extremely high SNP densities, exceeding 10,000 SNPs per 1 Mb (Figure 2b). Common carp is a heterotetraploid bony fish, and its genome can be split into two sets of subgenomes from ancestral diploids, each consisting of 25 chromosomes, named A subgenome and B subgenome. Secondly, the distributions of SNPs also showed a discernible bias; the majority of SNPs were located in intronic (46.51%) and intergenic regions (34.32%). Variants were also present in the upstream (2.31%) and downstream regions (2.49%), as well as regulatory regions such as the 5′ UTR, 3′ UTR, and splicing sites. Among the exonic SNPs, 43.01% were non-synonymous, while 56.26% were synonymous. Additionally, there were 0.66% of SNPs associated with description stop gain and 0.08% with stop loss (Figure 2c).

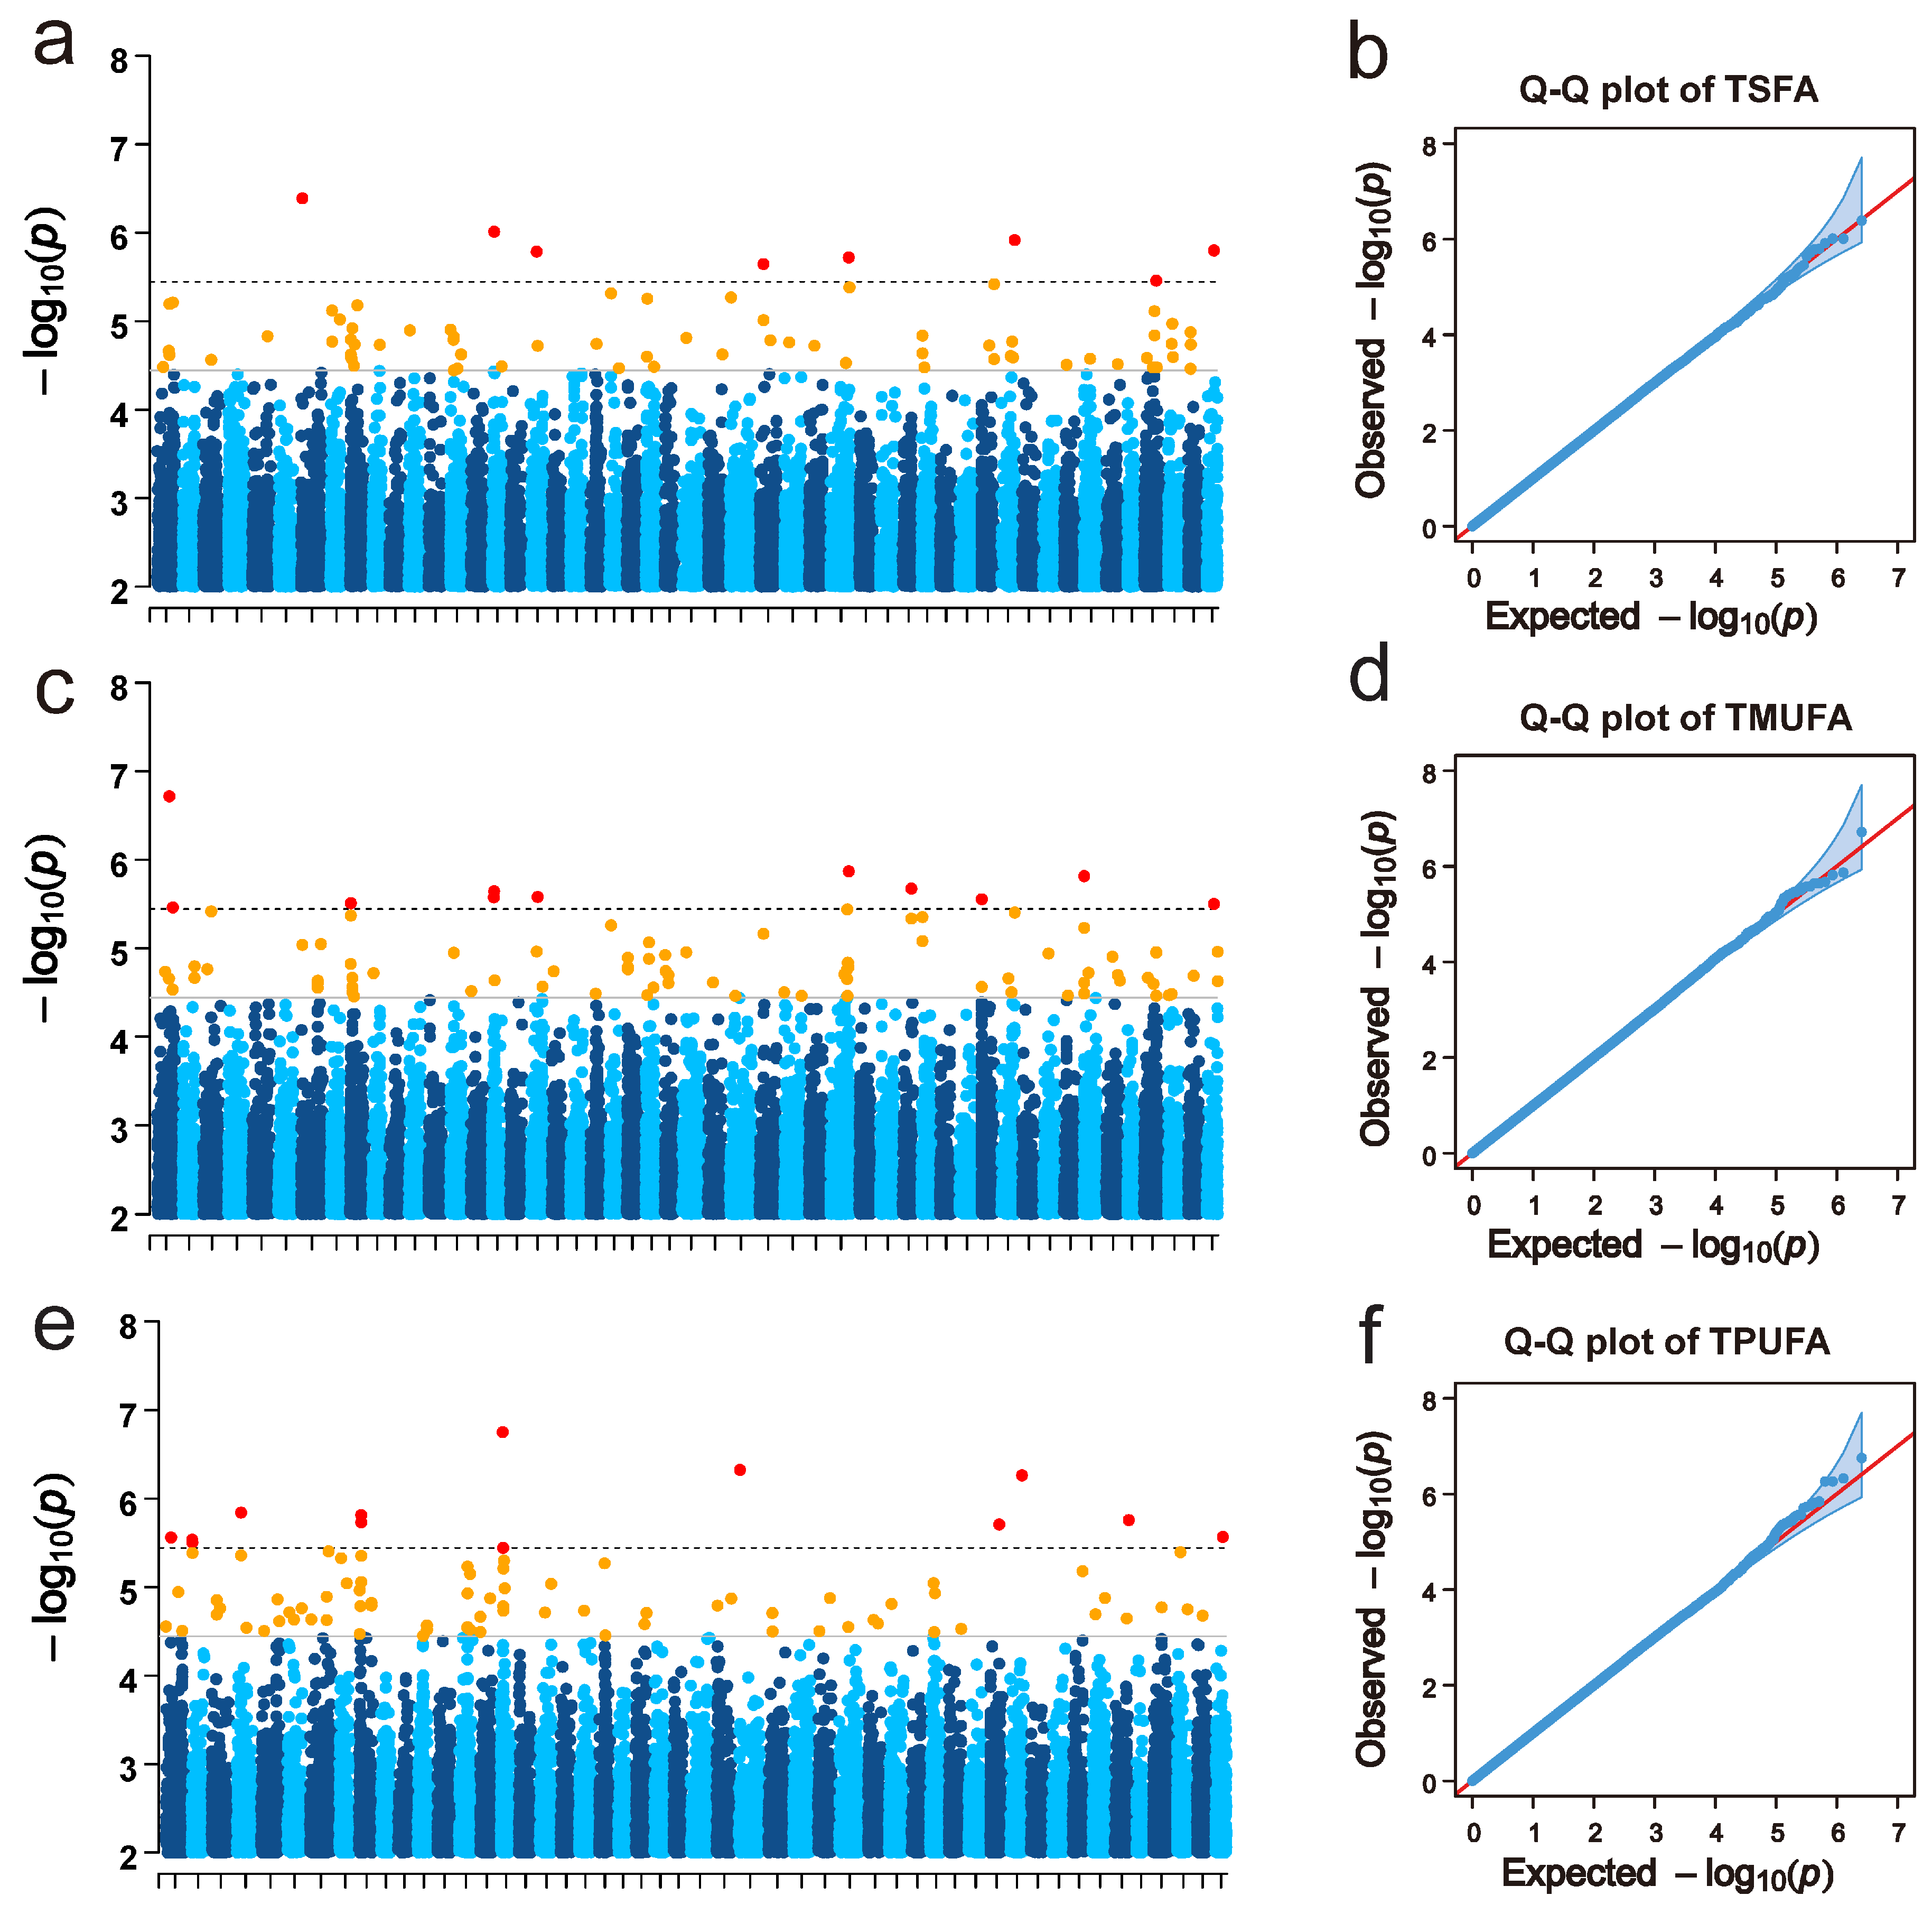
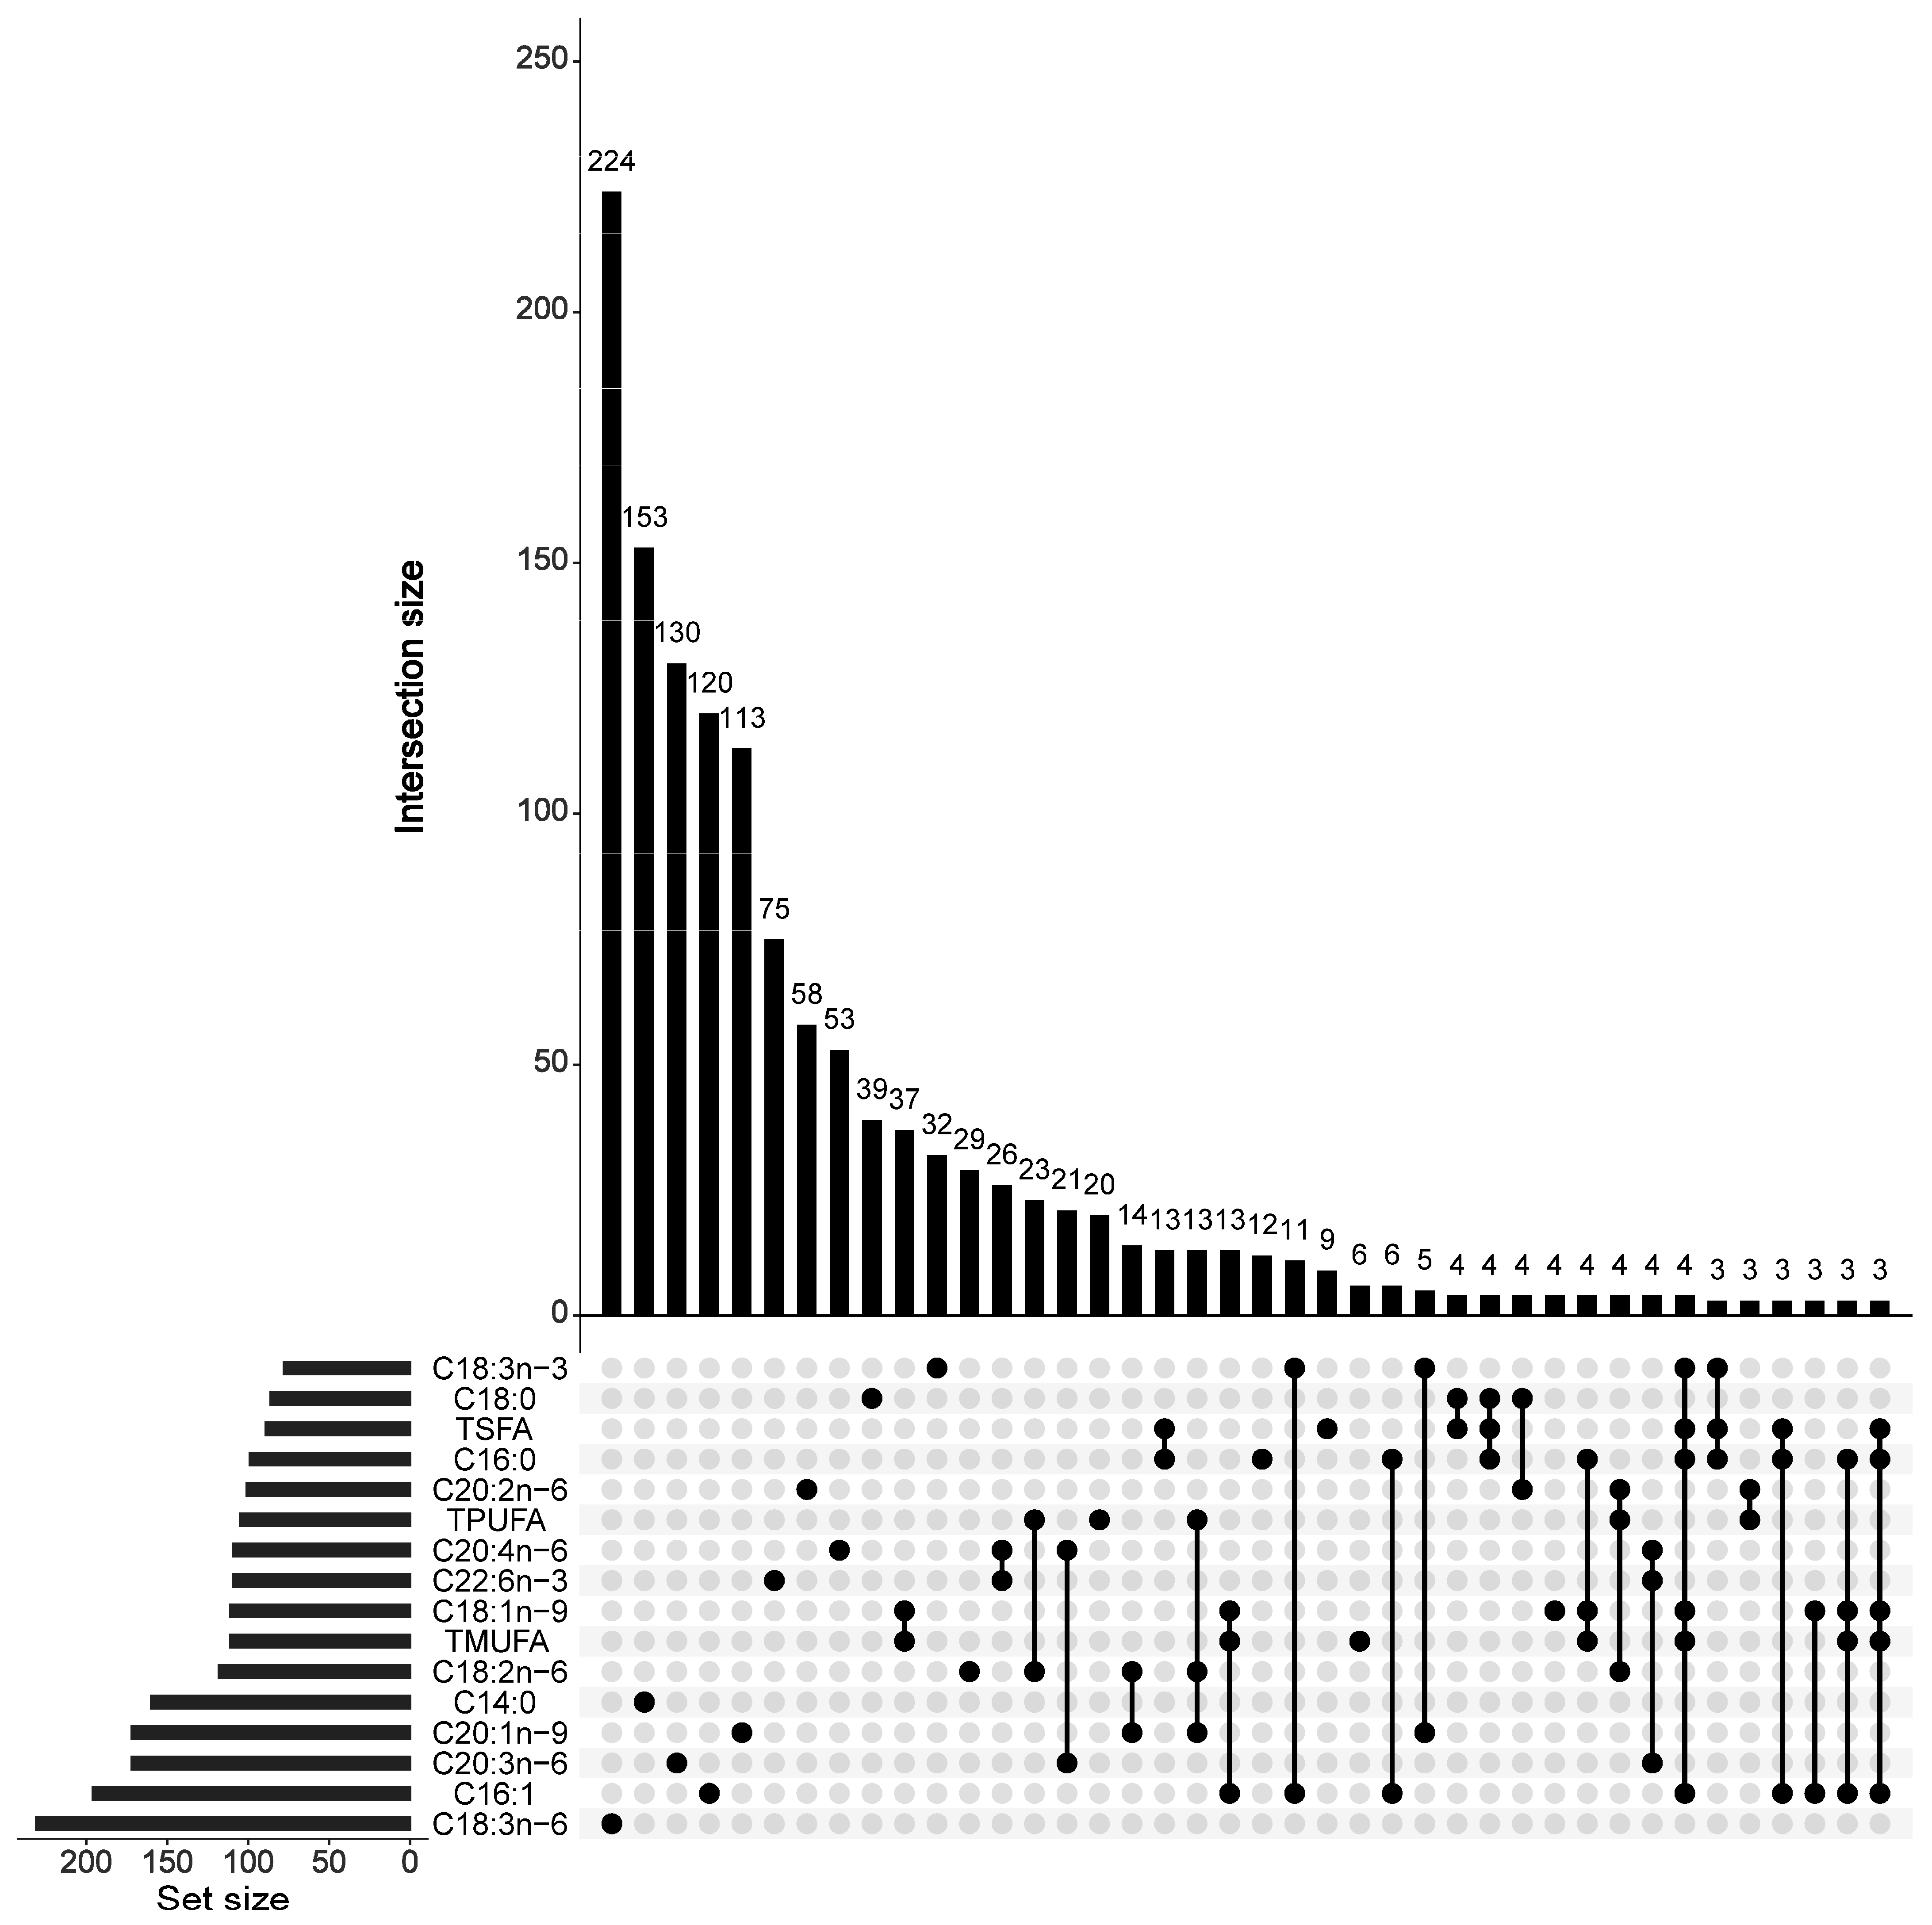
3.3. FA Content-Associated SNPs, Candidate Genes, and Inferred Functions

Utilizing a suggestive threshold of 3.63 × 10⁻⁵, we found that the contents of 13 single FAs (Figures S1 and S2), TSFA (Figure 3a,b), TMUFA (Figure 3c,d), and TPUFA (Figure 3e,f) had associated SNPs. Ultimately, a unique set of 1410 SNPs was identified, each associated with at least one FA content. Specifically, 686 SNPs were located within the A subgenome and 595 within the B subgenome. These 1410 SNPs were in close proximity to the genic, downstream, or upstream regions of 1391 genes (Table S5). By employing the bedtools software, we identified 7307 candidate genes within 100 kb upstream and downstream of these SNPs, each associated with at least one FA content (Tables S6 and S7). Among these SNPs, 333 pleiotropic SNPs were associated with at least two FA traits (Figure 4), highlighting their regulatory roles in multiple FA metabolic pathways.
In total, 332 SNPs and 1907 genes were associated with the content of three SFAs and TSFA at the suggestive threshold (Figure 3a,b and Table S8). The PVEs by these SNPs ranged from 5.93% to 9.99%. These candidate genes included many reported FA-related genes, which participated in β-oxidation (ACSs, FACLs, and NADH-quinone oxidoreductase subunit B), ubiquitination, transcriptional factors (Sp1, Sp5, and Sp6), and FA transporters (FABPs and FFARs). Additionally, for the C14:0 content, G protein-coupled amine receptor activity and G protein-coupled receptor (GPCR) activity were inferred for the candidate genes. FAs serve as ligand activators of specific GPCRs [65], the cascade reaction by which regulates glucose homeostasis and immune response [66,67]. For the C18:0 content, the candidate genes enhance Rho signal transduction and small GTPase-mediated signal transduction. The Rho signal transduction regulates the expression of many well-known FA-related genes, including PPARs and SREBPs [68,69] (Table S9). Small GTPase-mediated signal transduction was also demonstrated to regulate the expression of FA-related genes [70], FA uptake [71], and β-oxidation [72]. The potential genes and pathways we obtained in SFAs focus on four aspects: β-oxidation, ubiquitination, pathway factors, and transporters.
Regarding three MUFAs and TMUFA, 429 SNPs were found to be associated with their content, with PVEs ranging from 5.93% to 13.17% (Figure 3c,d and Table S10). A total of 2109 candidate genes were identified, each associated with the content of at least one MUFA. Many reported FA-related genes were detected, participating in processes like β-oxidation (ACADs, ACSs, and NDEs), ubiquitination, peroxisome oxidation (ECRs), ω-oxidation (ADHs and ALDHs), and transport (FABPs and FATPs). For the C16:1 content, the microfilament motor activity and response to reactive oxygen species (ROS) were inferred by the candidate genes. The microfilament-associated proteins 2 and 3 (ARP2 and ARP3) regulate FA synthesis by modulating the motility of lipid droplets [73]. FA β-oxidation is known to increase the level of mitochondrial ROS [74]. The microfilament motor activity was also inferred by the candidate genes associated with the C18:1n-9 content. Intriguingly, gated channel activity was specifically enriched for the candidate genes associated with the C20:1n-9 content. FAs can modulate the functions of voltage-gated and ligand-gated ion channels [75] (Table S11), suggesting that increasing FAs levels might enhance gated channel activities. It is worth noting that we specifically enriched ω oxidation and peroxisome oxidation in MUFAs.
Overall, 838 SNPs were associated with the content of seven individual PUFAs and TPUFA (Figure 3e,f and Table S12), where 4794 candidate genes were located around these SNPs. The genes involved in synthesis (ACC and FADS2), β-oxidation (HADHs, ACADs, and NDEs), transcriptional factors (Sp1, Sp3, Sp7, and PPARγ), ubiquitination, and FA transporters (FABPs) were identified to be associated with the contents of PUFAs. To pathway, polyunsaturated fatty acid 5-lipoxygenase (ALOX5), an enzyme catalyzing the peroxidation of PUFAs, was also identified. The anterior/posterior pattern specification, olfactory receptor activity, cell adhesion, and hydrolase activity were significantly associated with the contents of C18:2n-6, C18:3n-3, C18:3n-6, and C22:6n-3, respectively. The response to xenobiotic stimulus was observed to be related to C20:3n-6 content. This response might trigger PPARα expression [76]. For the C20:4n-6 content, the G-protein beta/gamma-subunit complex binding and plasma membrane region were inferred by the candidate genes. Finally, for TPUFA content, the cellular response to oxidative stress was enriched (Table S13). As surplus FA synthesis is known to increase oxidative stress in adipocytes and induce lipodystrophy [77], samples with high TPUFA content likely possess a higher capacity to respond to oxidative stress. We specifically annotated genes directly related to fatty acid synthesis in PUFAs, such as FADS2.

3.4. Conserved FA-Associated Genes Between Common Carp and Rainbow Trout

By comparing two sets of candidate genes associated with FA content, we found that 226 common carp candidate genes were homologous to 131 rainbow trout genes (Table S14). The genes regulating oxidation (cytochrome P450), ubiquitination (E3 ubiquitin ligases), and transport (FFARs) were discovered to be associated with FA content defined in both species. Additionally, genes such as NOD-like Receptor (NLR) family Caspase recruitment domain (CARD) domain-containing proteins, ras-related proteins, and guanine nucleotide-binding proteins, which modulate downstream signaling pathways or transcription factors and thus affect fatty acid metabolism, were also conserved in both fishes. Notably, most FA-associated rainbow trout genes were not encompassed in our candidate gene set, suggest that the genes for FA content diversity are species-specific.

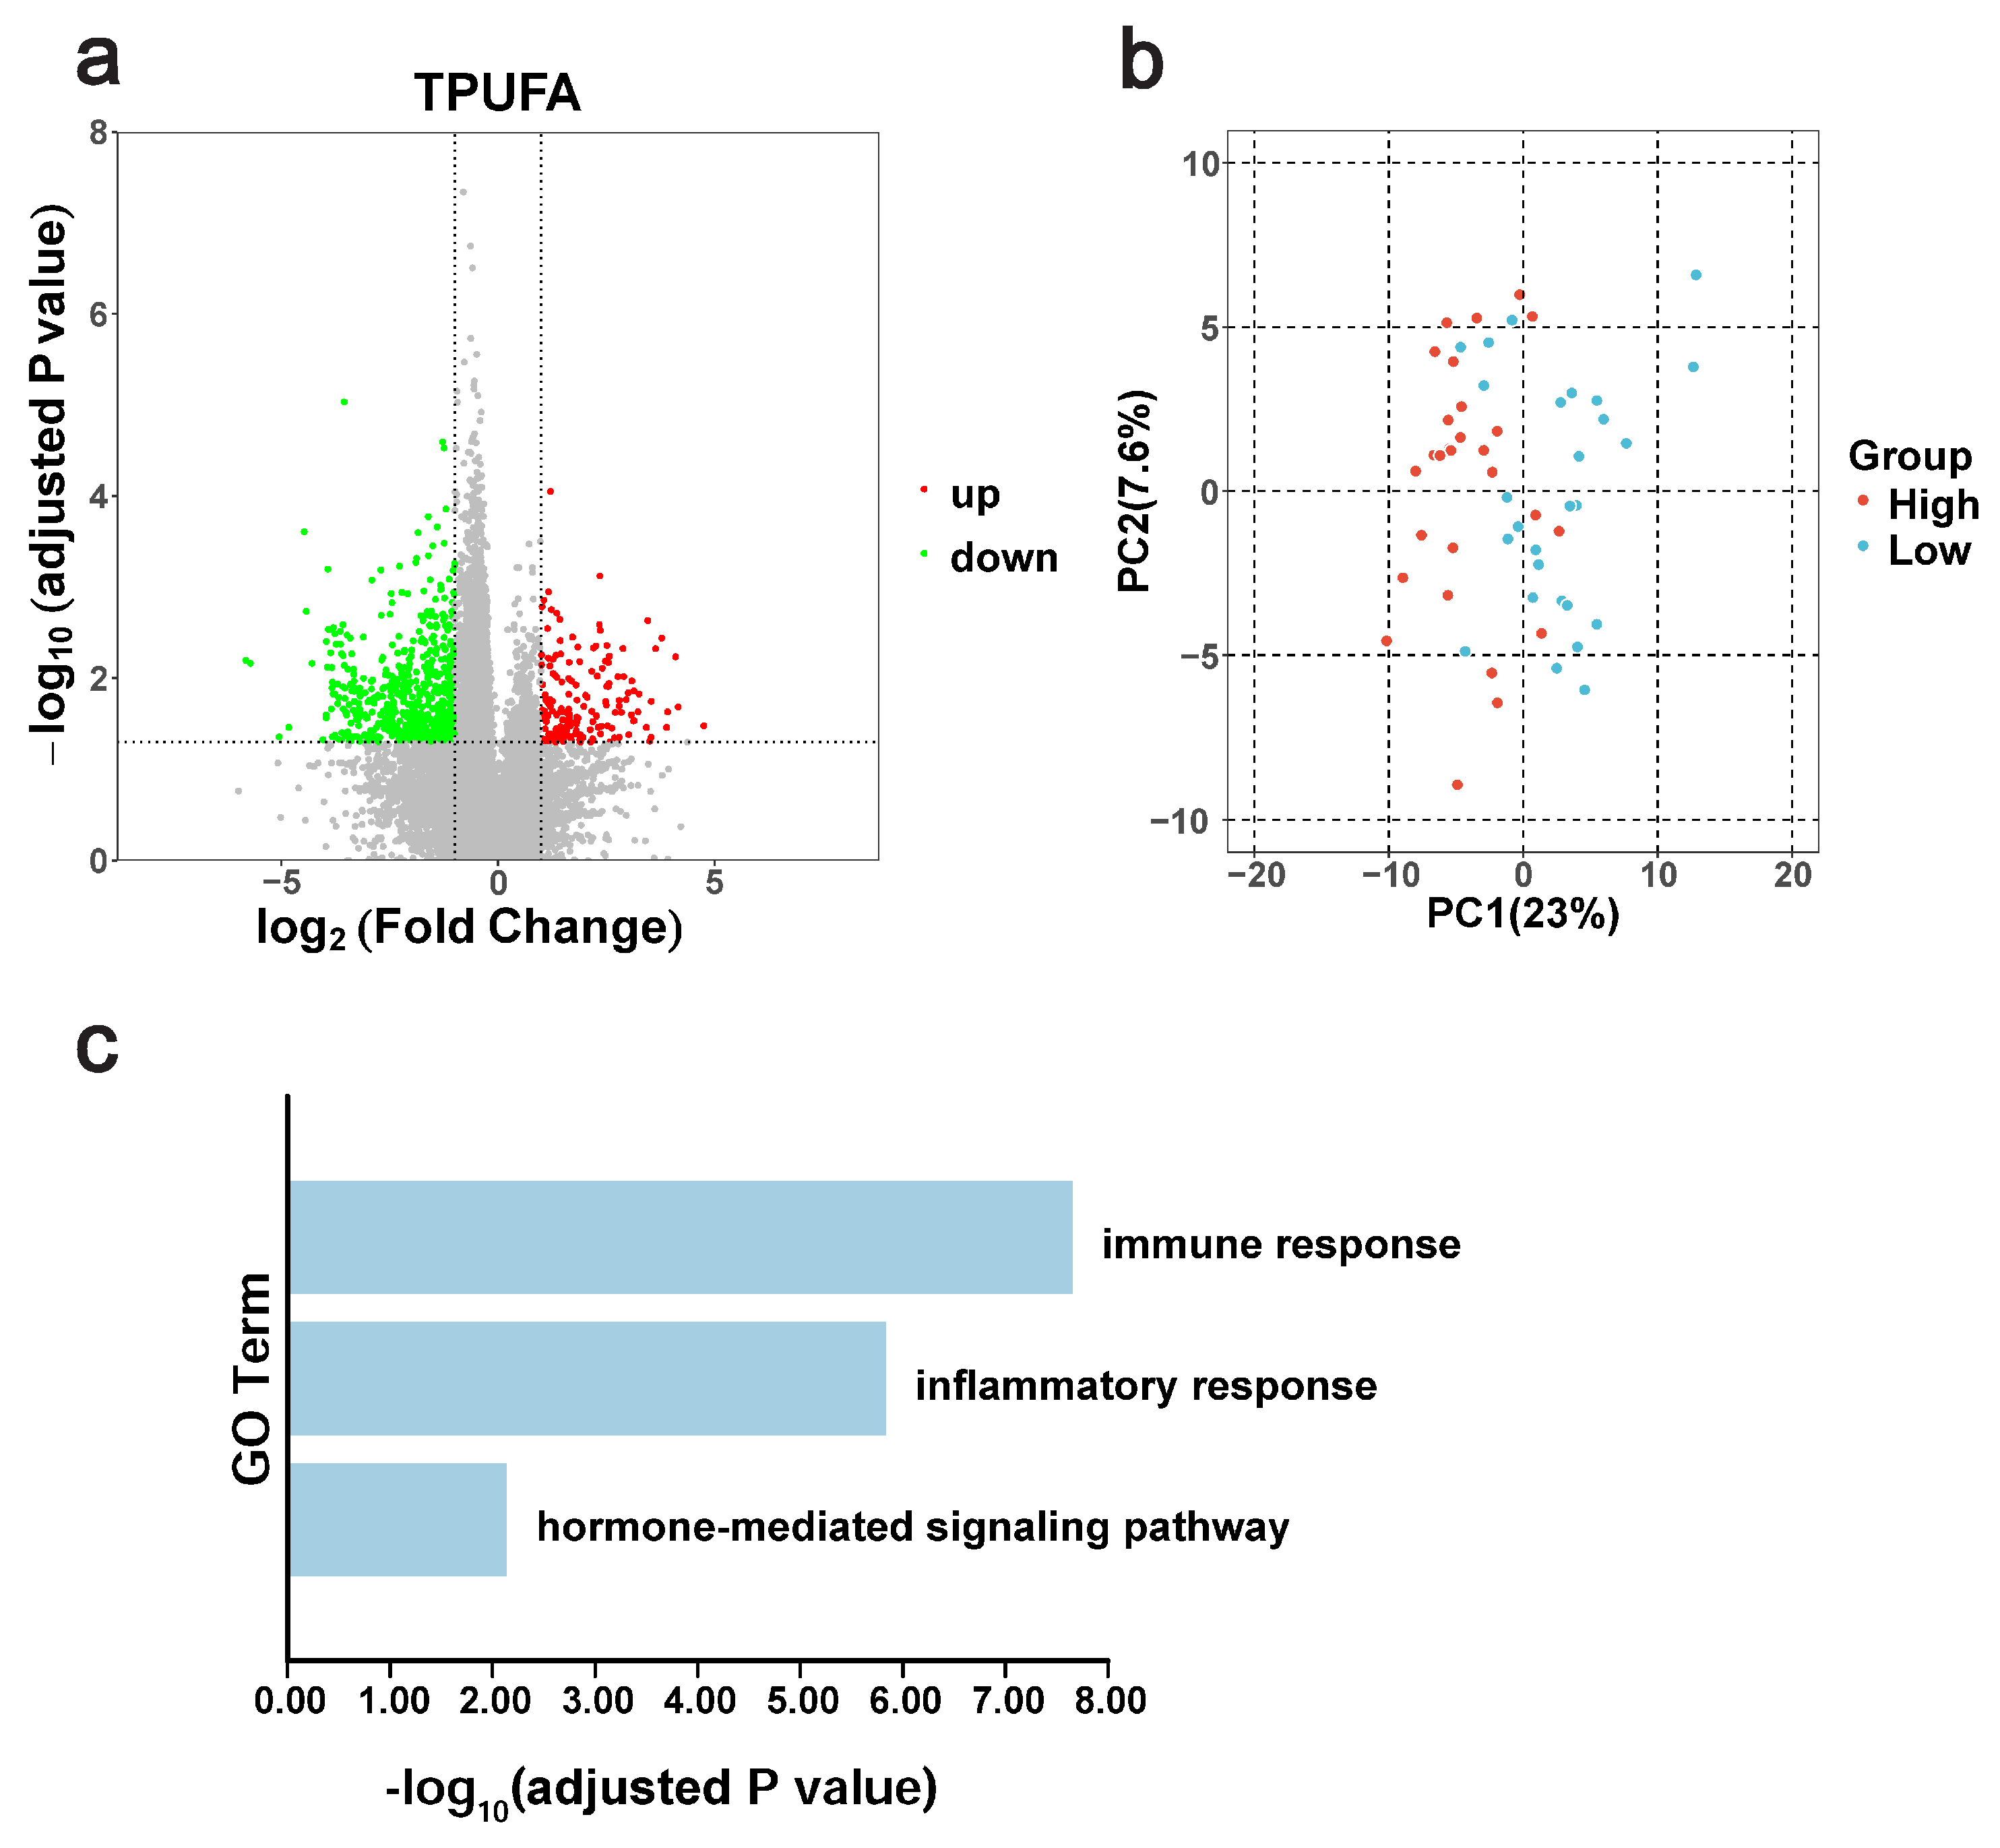
3.5. Differential Gene Expression Between the High-TPUFA and Low-TPUFA Groups

The average clean transcriptome data per sample among 60 samples was 6.18 Gb, and 85% of reads were successfully mapped to the reference genome (Table S15). A total of 715 DEGs were identified, including 162 up-regulated and 553 down-regulated DEGs in the high-TPUFA group (Figure 5a). Based on the expression levels of these DEGs, the PCA analysis of the 60 libraries showed a clear separation of two groups, indicating distinct gene expression patterns (Figure 5b).
The PUFA transporters (LDL receptor-related protein and LDL receptor adapter protein), releasers (fatty-acid amide hydrolase), and regulators (NLRP3 and PPARs) were up-regulated, while the inhibitors (rho GTPase-activating protein 20, and acyl-CoA thioesterase), peroxidase (ALOX5), β-oxidation (CPT1A), and ubiquitination (E3 ubiquitin ligase) were down-regulated (Table S16). GO analysis revealed significant enrichment in immune response, inflammatory response, and hormone-mediated signaling pathways (Figure 5c). PUFA metabolism is reported to be closely related to the immune response [78] and hormone-mediated signaling pathway [79]. Thus, increased muscular TPUFA content would impact immune response and hormone-mediated pathway activity.

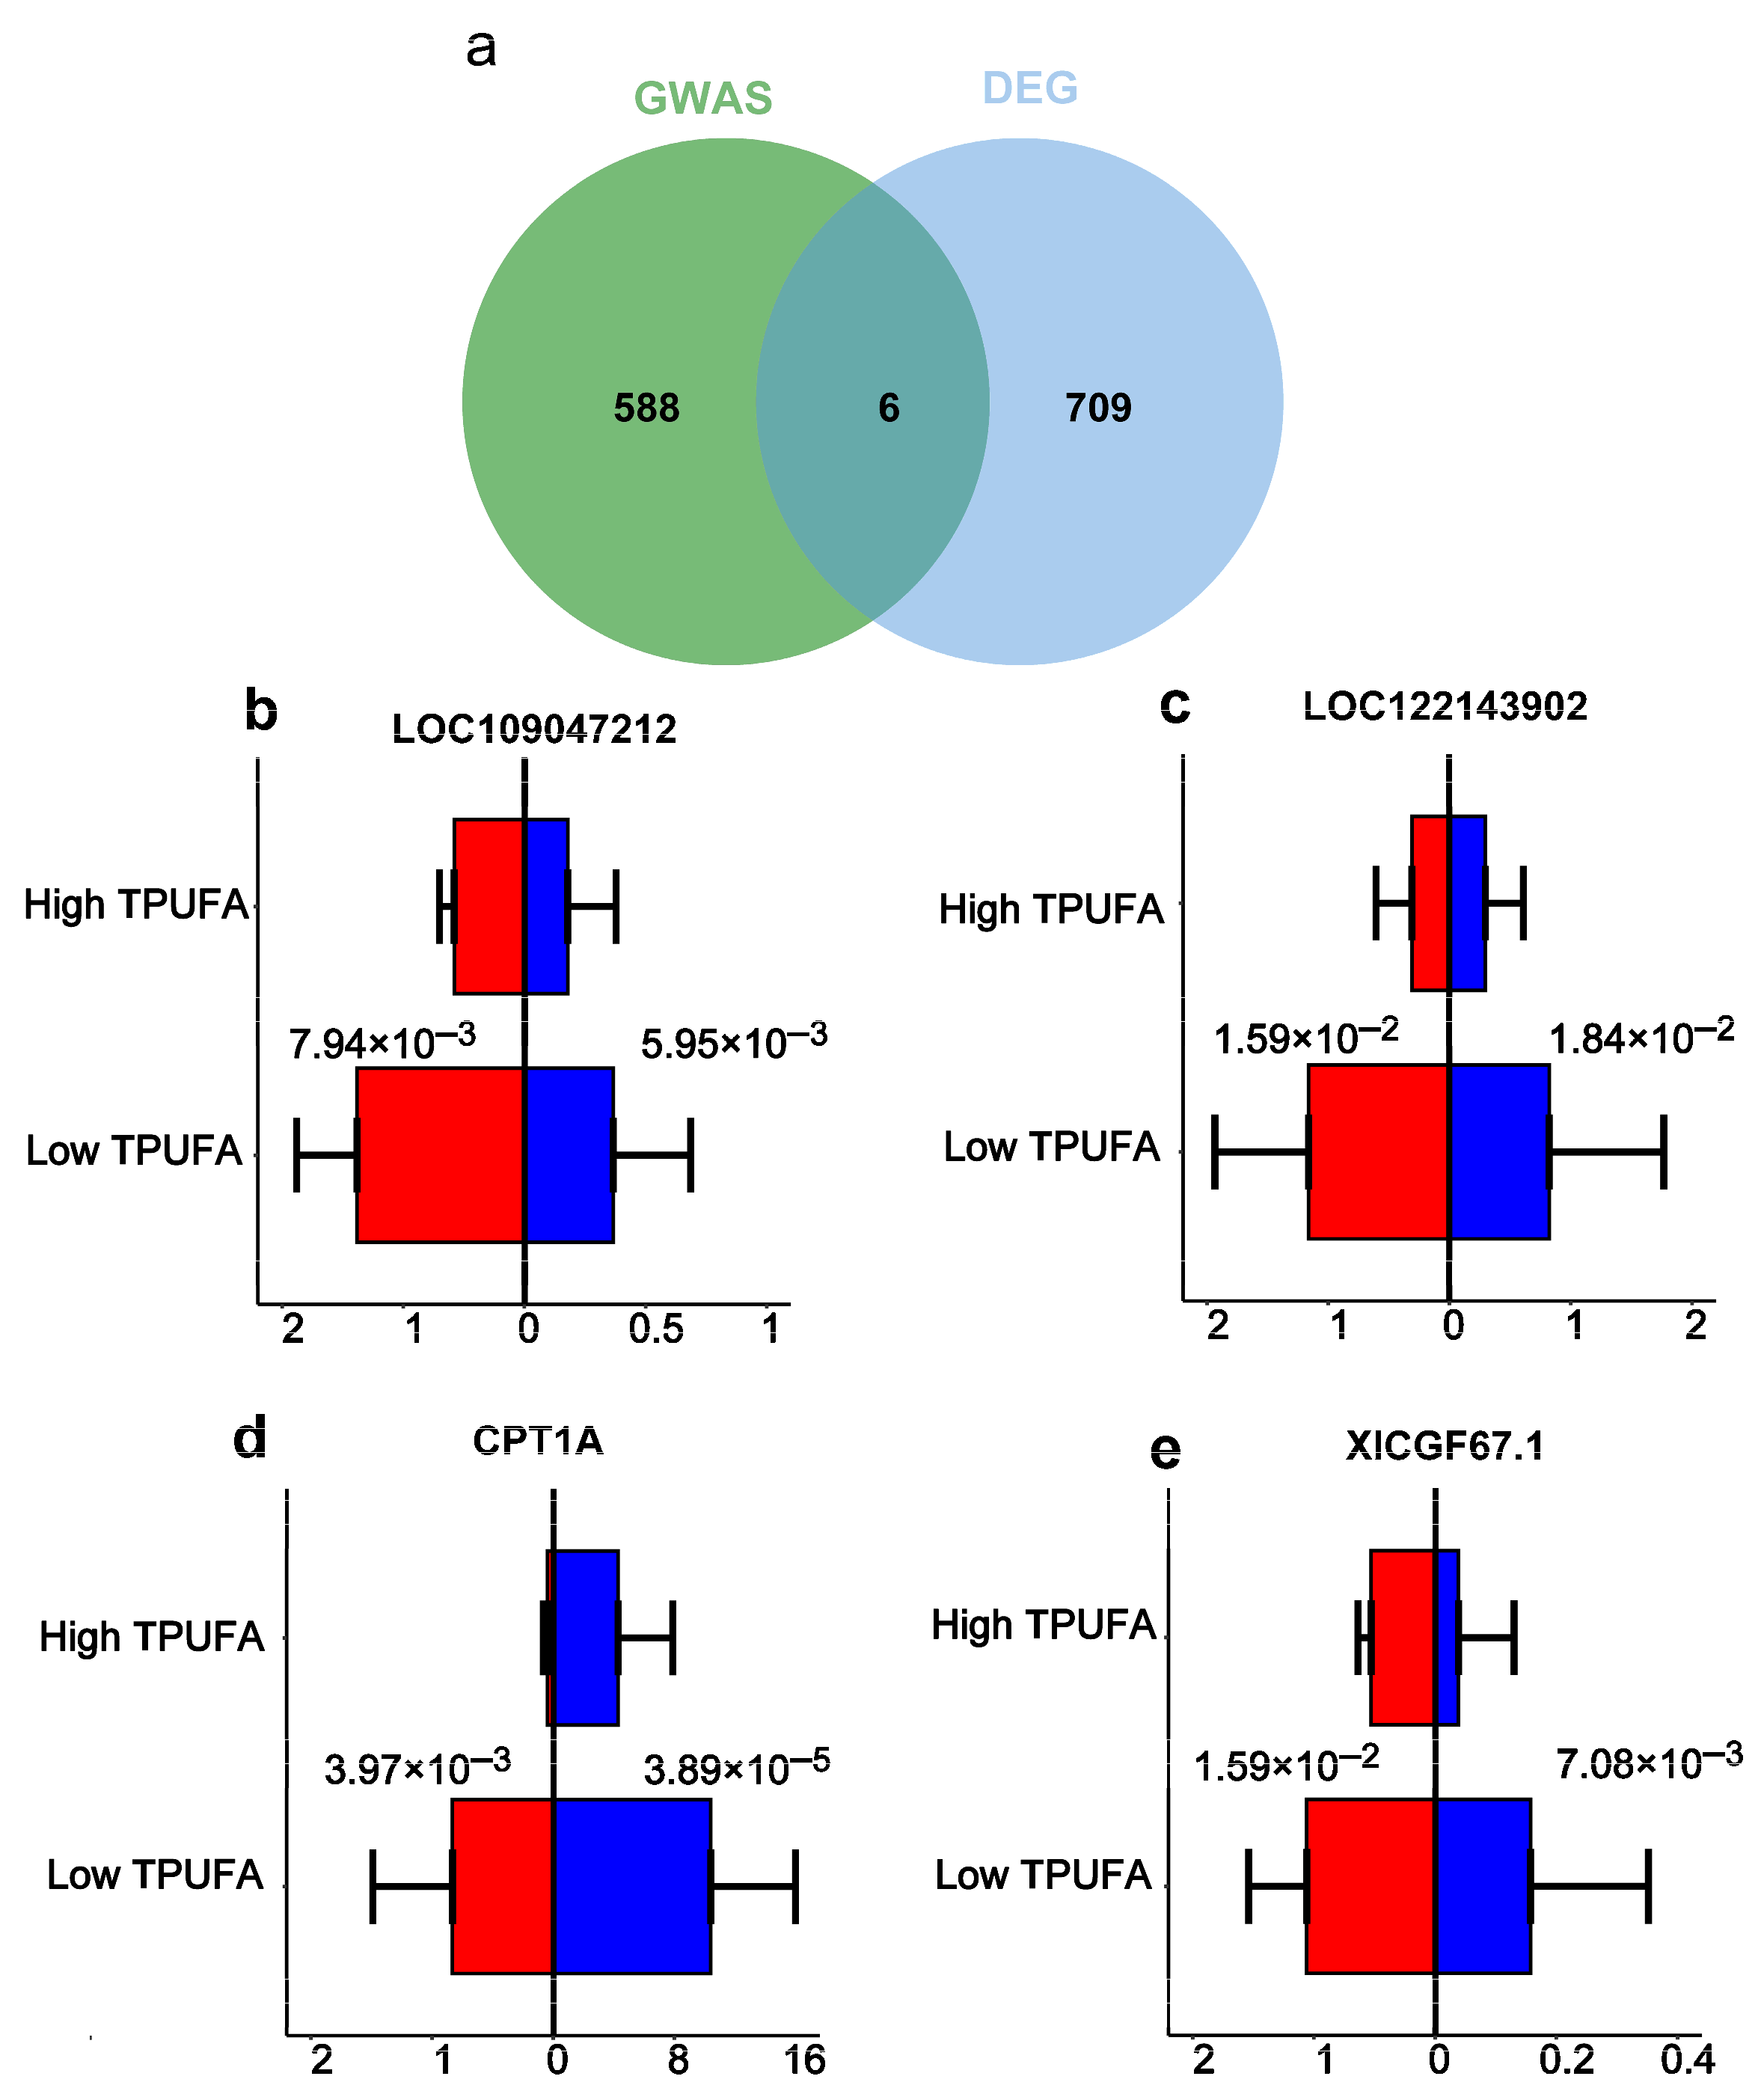
3.6. qRT-PCR Validated the Core Genes Related to TPUFA Content

To identify core genes associated with high TPUFA content, we compared the TPUFA-associated genes and DEGs. Among the 594 candidate genes related to TPUFA content, six genes were shared in the DEGs, including one up-regulated gene (focal adhesion kinase 1-like, FAK1) and five down-regulated genes (Figure 6a). These comprised two non-encoding RNAs (LOC109047212 and LOC122143902) and three protein-encoding genes, including gastrula zinc finger protein XlCGF67.1-like, carnitine O-palmitoyltransferase 1, liver isoform-like (CPT1A), and myosin, light chain kinase a (MYLKA). FAK1 activates the PI3K/Akt/mTOR signaling pathway, which further up-regulates FA synthesis-related enzymes [80,81]. Higher expression of FAK1 might boost PUFA synthesis. CPT1A catalyzes the transport of FA-CoA into mitochondria for the downstream β-oxidation. The down-regulated CPT1A expression in high-TPUFA samples might reduce β-oxidation activity and decrease PUFA oxidation.
Among these six core genes, we cannot design suitable primers for FAK1, and MYLKA had a low expression level, with an average FPKM value < 0.10. The qPCR was performed on the remaining four core genes. Their expression levels were significantly higher in the low-TPUFA group than in the high-TPUFA group. Their qPCR expression patterns match the RNA-seq results (Figure 6b), confirming the reliability of the RNA-seq data.

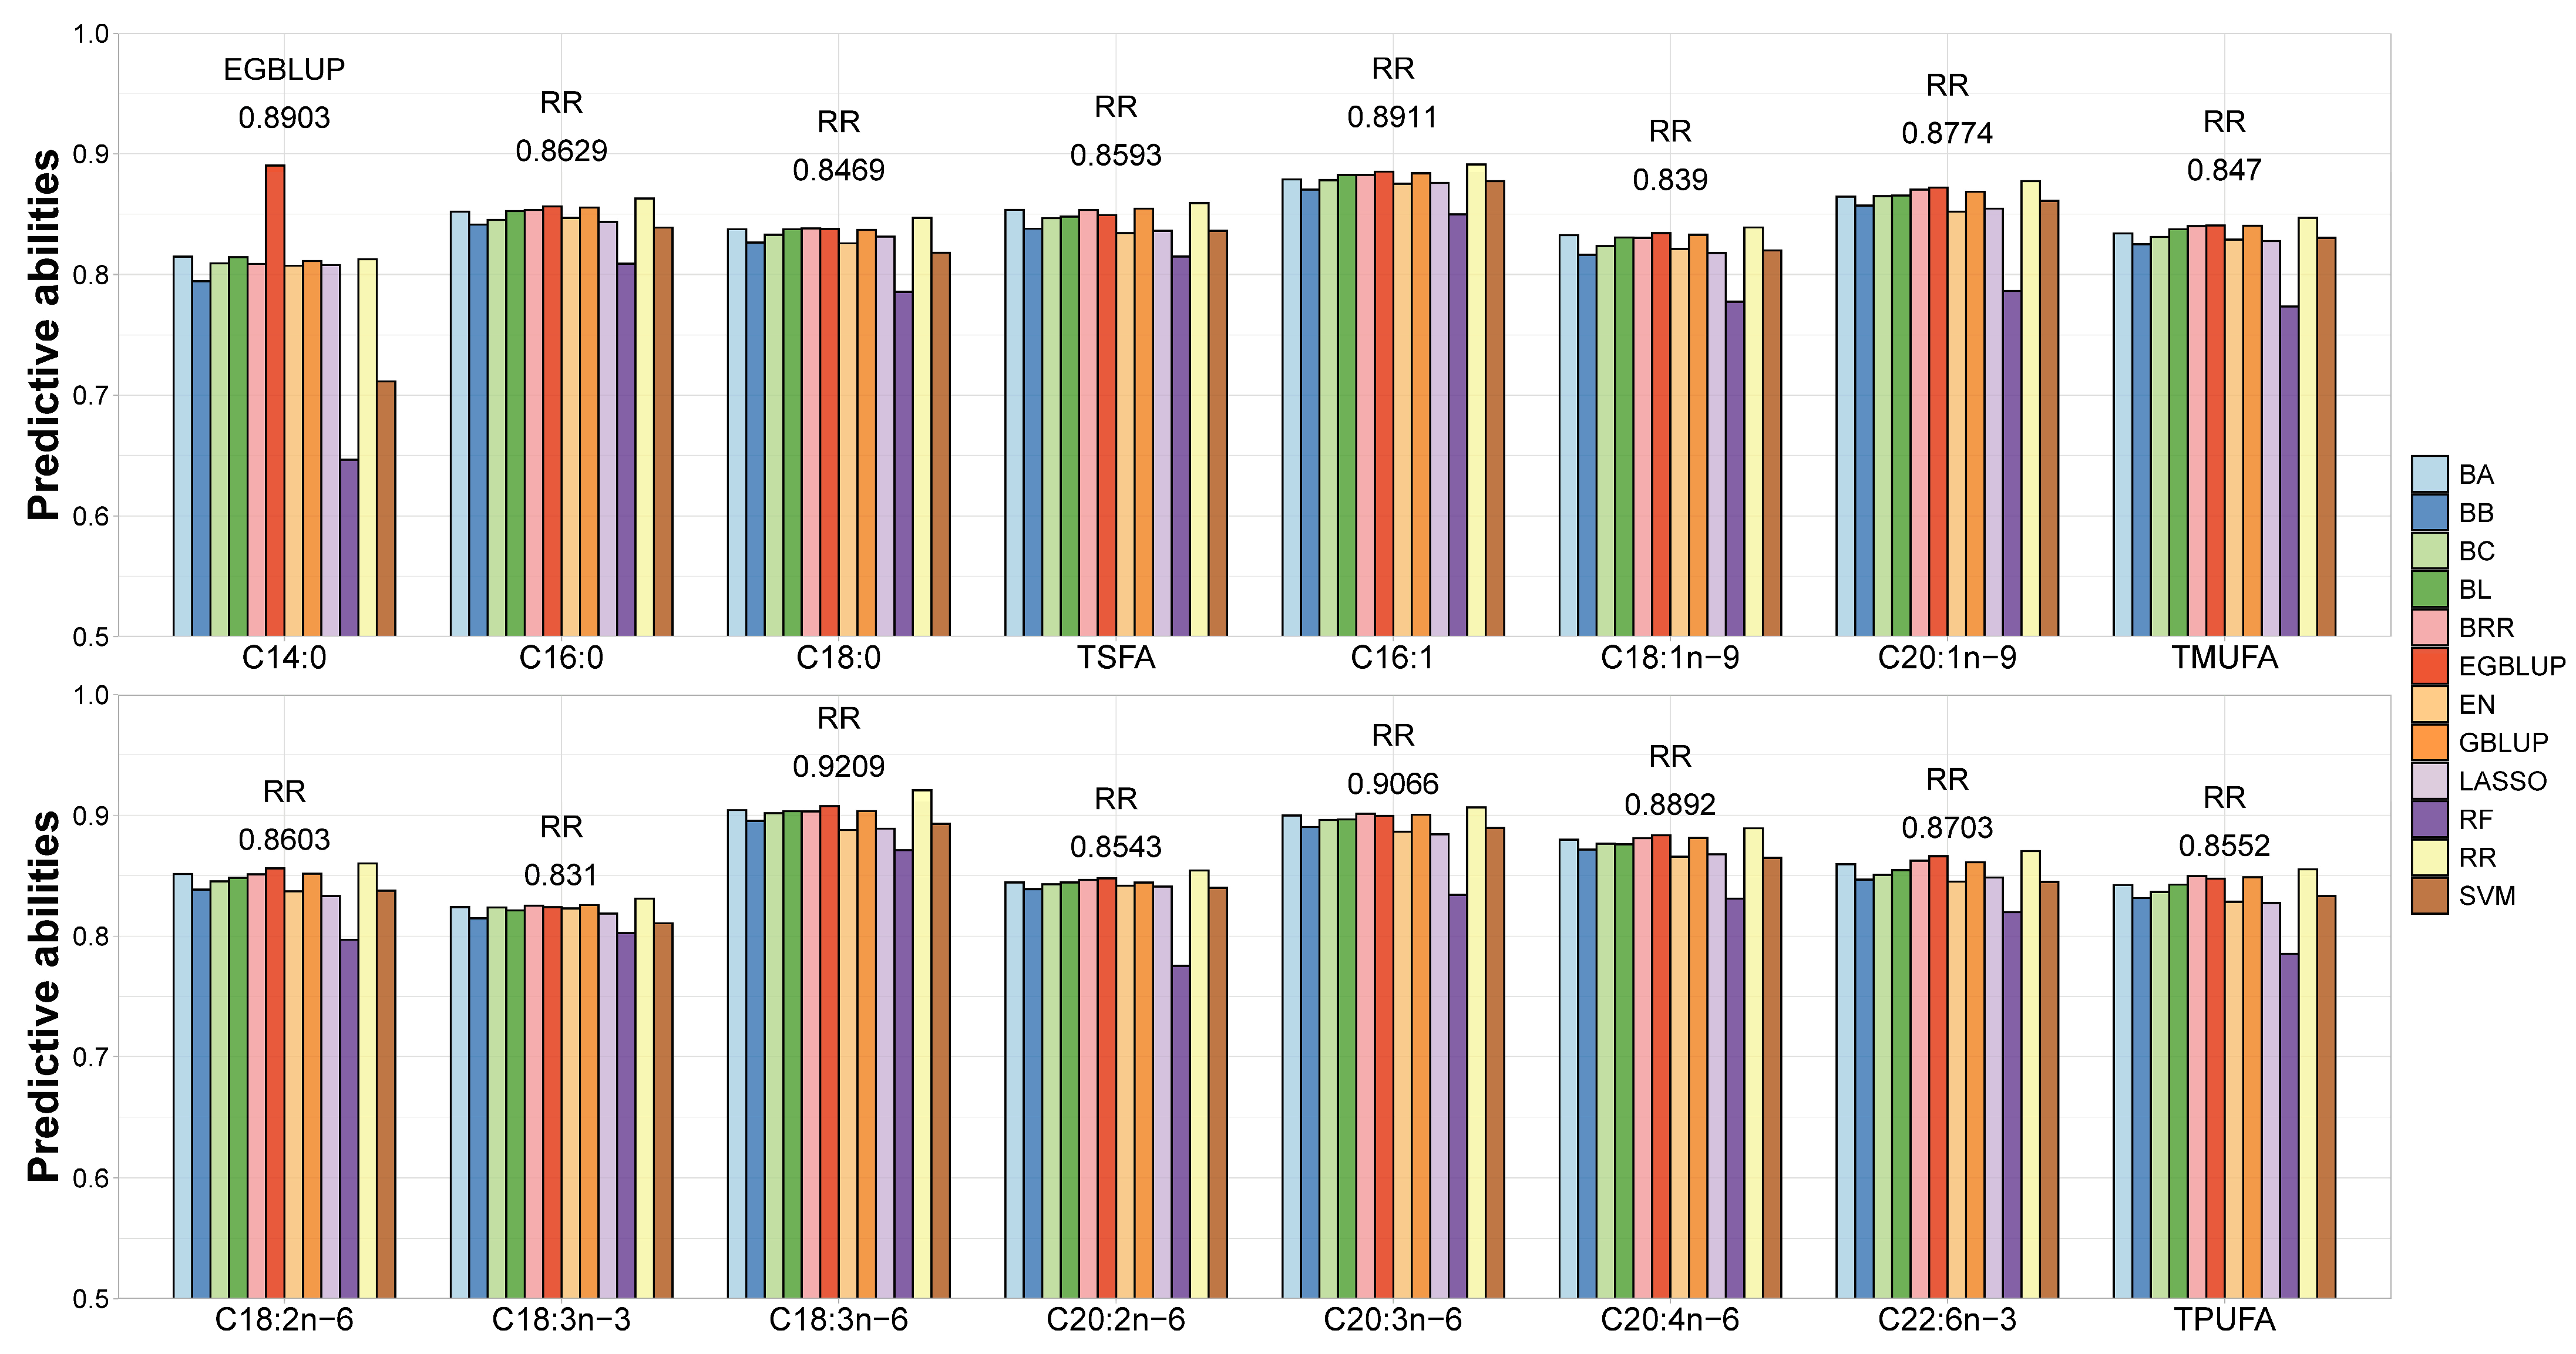
3.7. Using the Associated SNPs to Estimate FA Content

Twelve GS methods were applied to predict the breeding values for 13 single FAs, TSFA, TMUFA, and TPUFA (Figure 7). Overall, most predictions had correlation coefficients greater than 0.80. Each method exhibited similar predicted abilities. Even at the lowest accuracy level of accuracy, the GS method still reached 0.64. For C14:0, the EGBLUP method achieved the highest mean CV of 0.89, followed by the BA program with a CV of 0.81. For the remaining 15 FAs, the RR method generally outperformed other tools. Specifically, the EGBLUP program ranked second in 11 FAs, while the BRR method was the second-best for the other four FAs (C18:3n-3, C20:3n-6, TPUFA, and TSFA). These results indicate that the associated SNPs for each FA, combined with the optimal prediction tool, can be effectively used for genetic marker-assisted selection breeding.

4. Discussion

The limited availability of PUFAs derived from fish constitutes a bottleneck in the food industry, a challenge that numerous research institutions are vigorously working to overcome. Our research revealed that there were substantial differences in FA contents among individual common carp fed within the same pond. These data strongly indicate the presence of genetic variants responsible for these difference and suggest the viability of enhancing FA content in fish through genetic selected [82]. The integration of multiple previous omics data is conducive to our identification of the major-effect pathways and the associated regulatory mechanisms underlying the differences in muscular FA contents.
To explain the molecular mechanisms of FA metabolism, much previous attention was paid to investigate mutations or expression changes in the FA-synthesis genes [83,84]. We observed a few genetic variants or little expression change in the FA-synthesis genes. Conversely, more genetic variants and higher expression changes were detected in genes involved in oxidation, ubiquitination, transportation, and transcriptional factors. The FA oxidation processes encompass β-oxidation [16], ω-oxidation [21], peroxisome oxidation [19], and α-oxidation [85] (Figure 8), with the first three being the most prevalent. The core enzymes in β-oxidation, including ACSs, FACLs, NADH-quinone oxidoreductase subunit B, ACADs, NDEs, and HADHs, exhibited polymorphisms and were associated with the content of multiple FAs. CPT1A, a transporter for β-oxidation, was down-regulated in the high-TPUFA samples. These data indicated that the β-oxidation pathway has genomic variants and expression changes, ultimately influencing the level of muscular FAs. Mutations also occurred in the genes involved in the ω-oxidation (ECRs) and peroxisome oxidation (ADHs and ALDHs), and these were linked to the contents of MUFAs.
Ubiquitination, one of the most critical post-translational modifications, plays a pivotal role in regulating FA metabolism (Figure 8). The ubiquitin proteasome system (UPS) mediates the degradation of fatty acids [13]. Genes such as CD36, ACCs, FASNs, SCDs, PPARs, and adipose triglyceride lipases (ATGLs) are prime targets of ubiquitination. Loss of E3 ubiquitin ligases in the liver led to up-regulation of genes related to FA uptake and synthesis and down-regulation of β-oxidation-related genes in mice [86]. E3 ubiquitin ligases can regulate the ubiquitination of ATP-citrate lyase (ACLY), ACC, and FASN [87]. In our study, we observed lower expression levels of E3 ubiquitin ligase in the high-TPUFA group, suggesting a potential regulatory mechanism through which ubiquitination impacts TPUFA content. Beyond expression changes, genes within the UPS also show a multitude of variants.
Beyond PPAR families, the contributions of the SNPs within the Sp gene family to FA metabolism also merit attention (Figure 8). Sp1 can up-regulate the expression of FADs and ELOVLs in vertebrate liver [88,89]. SNPs in Sp1, Sp5, and Sp6 were associated with SFA content, and the SNPs in Sp1, Sp3, and Sp7 were linked to PUFA content. However, in our DEG study, the expressions of Sp genes were not significantly different between the high-TPUFA and low-PUFA groups. We hypothesize that Sp gene family members primarily regulate changes in FA content by altering non-synonymous mutations in substrate-binding domains and affecting genes associated with FA synthesis, rather than expression.
Some core genes were identified by comparing the TPUFA-associated genes and DEGs. Among them, FAK1 up-regulates the expression of enzymes related to fatty acid synthesis by activating signaling pathways such as mTOR [80], and its high expression may promote the synthesis of PUFA. CPT1A is responsible for catalyzing fatty acid-CoA into mitochondria for β-oxidation, and the down-regulation of this gene in high TPUFA samples may reduce the decomposition of PUFA by reducing the activity of β-oxidation. We found genetic variants within or in proximity to ncRNAs, where the variants were significantly associated with the content of multiple FAs. We also validated the differential expression of two ncRNAs between the two groups, having a significant difference in TPUFA content. These data suggested the potential involvement of ncRNAs in PUFA metabolism. NcRNAs have been demonstrated to regulate target genes involved in FA metabolism at transcriptional, post-transcriptional, translational, and post-translational levels [90]. In our study, only four genes were selected for qPCR validation because fewer candidate genes showed significantly different expression in the DEG analysis, likely due to sample sizes affecting the power to detect candidate genes. In future research, we will expand the sample size for transcriptome-wide association analysis and subsequent differential expression analysis in the TPUFA group to further investigate their specific mechanisms in fatty acid metabolism. Moreover, we will also adopt gene knockdown and overexpression to confirm these candidate genes’ function in FA metabolism.
Selectively breeding fish with higher contents of FAs, including PUFAs, holds promise for enhancing human nutrition and advancing the aquaculture industry. Although genome-editing techniques targeting specific FA-synthesis genes can effectively improve muscular PUFA levels [91], the release of edited animals was still strictly limited [92]. Genome selection (GS) is an optimal breeding strategy to improve agronomic traits with the trait-associated SNPs [93]. The GS method was applied in more than 20 species of aquaculture for disease, growth trait, time to sexual maturation, carcass quality traits, and tolerance to oxygen, etc. [94]. Compared to pedigree-based estimated breeding values, genomic selection showed more advantage with accuracy power, genetic diversity from different populations, and multi-environment [95]. However, it was also limited by the density of SNPs, sample number, population structure, and kinship in aquaculture. In our study, considering limitations of population structure, higher SNP density, and the same environment, most GS methods achieved predicted breeding value greater than 0.80, suggesting that the GS programs could enhance the muscle FA content in common carp.

5. Conclusions

We integrated genome, transcriptome and FA profile analysis to trace the primary processes regulating heterogeneit in the muscular FA contents of common carp. The FA profiles data showed high variation in muscular FA content among samples. Through GWAS, the genetic variations in the genes participating in the oxidation, ubiquitination, and transcriptional factors were identified to be associated with the contents of multiple FAs, while few variants were observed in FA-synthesis genes. The processes of oxidation, ubiquitination, and transcriptional factor activities play essential roles in diversifying the muscular TPUFA contents through the effect of genomic variations. The transcriptome analysis, conducted based on the grouping of samples with extreme TPUFA contents, identified DEGs that are closely linked to high TPUFA content in common carp. PUFA transporters, releasers, and regulators were up-regulated, while inhibitors, oxidation and ubiquitination were down-regulated in the high PUFA samples. The predictive abilities of multiple GS methods on FA contents were high and would be applied in future selection breeding for fillet nutrient quality. Overall, these findings provide deep an understanding of the molecular mechanisms underlying the discrepancies in fish FA contents and offer guidance for GS to enhance fish fillet nutritional quality.

Supplementary Materials

The following supporting information can be downloaded at: https://www.mdpi.com/article/10.3390/fishes10050234/s1. Figure S1: Manhattan plots of the contents of 13 FAs; Supplementary Figure S2: Q-Q plots of the contents of 13 FAs; Table S1: Primer sequences for qPCR; Table S2: The contents of 16 FAs in 280 individuals.xls; Table S3: Spearman correlations among the contents of 16 FAs .xls; Table S4: The quality of re-sequencing data; Table S5: Gene annotation of GWAS significant loci; Table S6: Gene annotation of 100k neighboring GWAS significant loci relating to 16 FAs traits; Table S7: SNPs and candidate genes associated with three types of SFAs; Table S8: Enrichment of genes in 100 k region neighboring significant loci relating to SFAs; Table S9: SNPs and candidate genes associated with three types of MUFAs using GWAS and gene annotation; Table S10: Enrichment of genes in 100 k region neighboring significant loci relating to MUFAs; Table S11: SNPs and candidate genes associated with seven types of PUFAs using GWAS and gene annotation; Table S12: Enrichment of genes in 100 k region neighboring significant loci relating to PUFAs; Table S13: Blast result of comparison between common carp and rainbow trout for candidate genes associated with FAs; Table S14: Blast result of comparison between two common carp populations for candidate genes associated with FAs; Table S15: Pearson correlation between the breeding values and the FAs contents based on corresponding suggestive SNPs to FAs; Table S16: Transcriptome data statistics for 60 samples of common carp.

Author Contributions

Conceptualization, J.L.; Writing-original draft, K.W.; Formal analysis, K.W., Q.W. and Y.C. (Yiming Cao); Data curation, K.W. and Y.C. (Yiming Cao); Validation, K.W.; Methodology, Q.W., Y.C. (Yiming Cao) and Y.Z.; Resources, Y.C. (Yingjie Chen), R.Z., S.Y. and X.S.; Visualization, Y.C. (Yingjie Chen); Writing-review & editing, Y.Z. and J.L.; Project administration, Y.Z.; Funding acquisition, J.L. All authors have read and agreed to the published version of the manuscript.

Funding

This work was supported by the National Key Research and Development Program (grant number 2023YFD2400203) and by the Special Scientific Research Funds for Central Non-profit Institutes, Chinese Academy of Fishery Sciences (grant number 2023TD25).

Institutional Review Board Statement

This study was approved by the Animal Care and Use Committee of the Chinese Academy of Fishery Sciences under the established recommendations for the care and use of animals (protocol code ACUC-CAFS-20231012).

Informed Consent Statement

Not applicable.

Data Availability Statement

The authors state that data supporting the results of this study are available in the article and Its Supplementary Information File.

Conflicts of Interest

The authors declare that they have no known competing financial interests or personal relationships that could have appeared to influence the work reported in this paper.

Abbreviations

The following abbreviations are used in this manuscript:
FAsFatty acids
PUFAspolyunsaturated fatty acids
GWASgenome-wide association studies
TPUFAtotal PUFA
DEGsdifferentially expressed genes
EPAeicosapentaenoic acid
DHAdocosahexaenoic acid
CD36cluster of differentiation 36
FABPsfatty acid-binding proteins
FATPsfatty acid transporter proteins
FFARsfree fatty acid receptors
SCDsstearoyl-CoA desaturases
ACCsacetyl-CoA carboxylases
FASNsfatty acid synthases
ELOVLselongases of very long chain fatty acids
FADsfatty acid desaturases
FACLsfatty-acid-CoA ligases
ACSsacyl-CoA synthetases
CPTsarnitine palmitoyltransferases
ACADsacyl-CoA dehydrogenases
ECHsenoyl-CoA hydratases
HADHshydroxy acyl-CoA dehydrogenases
ACATsacetyl-CoA acetyltransferases
NDEsNAD(P)H dehydrogenases
ACOXsacyl-CoA oxidases
ECRsenoyl-CoA reductases
PEXsperoxisomal biogenesis factors
ADHsalcohol dehydrogenases
ALDHsaldehyde dehydrogenases
PPARsperoxisome proliferator-activated receptors
SREBPssterol regulatory element binding proteins
lncRNAslong non-coding RNAs
MUFAmonounsaturated fatty acid
GSGenomic Selection
TSFAtotal saturated FA
TMUFAtotal monounsaturated fatty acids
ncRNAnon-coding RNA
Hoobserved heterozygosity
PCsPrincipal components
MLMmixed linear model
Q-Qquantile-quantile
PVEproportion of variance explained
GOGene Ontology
BHBenjamini-Hochberg
FPKMsfragments per kilobase per million mapped reads
FDRfalse discovery rate
qRT-PCRquantitative real-time PCR
BVsbreeding values
GBLUPgenomic best linear unbiased prediction
EGBLUPempirical best linear unbiased prediction
RRridge regression
ENLASSOelastic net
BRRBayesian ridge regression
BLBayesian LASSO
BABayes A
BBBayes B
RFrandom forest regression
SVMsupport vector machine
BCBayes C
SDstandard deviation
MSEPMean squared error of prediction
PCAPrincipal component analysis
GPCRG protein-coupled receptor
ROSresponse to reactive oxygen species
ARP2microfilament-associated proteins 2
ARP3microfilament-associated proteins 3
ALOX5polyunsaturated fatty acid 5-lipoxygenase
NLRNOD-like Receptor
CARDCaspase recruitment domain
CPT1Acarnitine O-palmitoyltransferase 1, liver isoform-like
MYLKAmyosin, light chain kinase a
UPSubiquitin proteasome system
ATGLsadipose triglyceride lipases
ACLYATP-citrate lyase

References

  1. Panov, A.V.; Mayorov, V.I.; Dikalov, S.I. Role of Fatty Acids Β-Oxidation in the Metabolic Interactions between Organs. Int. J. Mol. Sci. 2024, 25, 12740. [Google Scholar] [CrossRef] [PubMed]
  2. Casares, D.; Escribá, P.V.; Rosselló, C.A. Membrane Lipid Composition: Effect on Membrane and Organelle Structure, Function and Compartmentalization and Therapeutic Avenues. Int. J. Mol. Sci. 2019, 20, 2167. [Google Scholar] [CrossRef] [PubMed]
  3. Graber, R.; Sumida, C.; Nunez, E.A. Fatty Acids and Cell Signal Transduction. J. Lipid Mediat. Cell Signal. 1994, 9, 91–116. [Google Scholar] [PubMed]
  4. Kapoor, B.; Kapoor, D.; Gautam, S.; Singh, R.; Bhardwaj, S. Dietary Polyunsaturated Fatty Acids (Pufas): Uses and Potential Health Benefits. Curr. Nutr. Rep. 2021, 10, 232–242. [Google Scholar] [CrossRef]
  5. De Smet, S. Meat, Poultry, and Fish Composition: Strategies for Optimizing Human Intake of Essential Nutrients. Anim. Front. 2012, 2, 10–16. [Google Scholar] [CrossRef]
  6. Tocher, D.R. Omega-3 Long-Chain Polyunsaturated Fatty Acids and Aquaculture in Perspective. Aquaculture 2015, 449, 94–107. [Google Scholar] [CrossRef]
  7. Carr, I.; Glencross, B.; Santigosa, E. The Importance of Essential Fatty Acids and Their Ratios in Aquafeeds to Enhance Salmonid Production, Welfare, and Human Health. Front. Anim. Sci. 2023, 4, 1147081. [Google Scholar] [CrossRef]
  8. Li, X.; Liu, C.; Zhang, R.; Li, Y.; Ye, D.; Wang, H.; He, M.; Sun, Y. Biosynthetic Deficiency of Docosahexaenoic Acid Causes Nonalcoholic Fatty Liver Disease and Ferroptosis-Mediated Hepatocyte Injury. J. Biol. Chem. 2024, 300, 107405. [Google Scholar] [CrossRef]
  9. Samovski, D.; Jacome-Sosa, M.; Abumrad, N.A. Fatty Acid Transport and Signaling: Mechanisms and Physiological Implications. Annu. Rev. Physiol. 2023, 85, 317–337. [Google Scholar] [CrossRef]
  10. Storch, J.; Thumser, A.E. The Fatty Acid Transport Function of Fatty Acid-Binding Proteins. Biochim. Biophys. Acta 2000, 1486, 28–44. [Google Scholar] [CrossRef]
  11. Gimeno, R.E. Fatty Acid Transport Proteins. Curr. Opin. Lipidol. 2007, 18, 271–276. [Google Scholar] [CrossRef] [PubMed]
  12. Hara, T.; Kashihara, D.; Ichimura, A.; Kimura, I.; Tsujimoto, G.; Hirasawa, A. Role of Free Fatty Acid Receptors in the Regulation of Energy Metabolism. Biochim. Biophys. Acta (BBA)-Mol. Cell Biol. Lipids 2014, 1841, 1292–1300. [Google Scholar] [CrossRef] [PubMed]
  13. Loix, M.; Zelcer, N.; Bogie, J.F.J.; Hendriks, J.J.A. The Ubiquitous Role of Ubiquitination in Lipid Metabolism. Trends Cell Biol. 2024, 34, 416–429. [Google Scholar] [CrossRef] [PubMed]
  14. Wang, X.; Yu, H.; Gao, R.; Liu, M.; Xie, W. A Comprehensive Review of the Family of Very-Long-Chain Fatty Acid Elongases: Structure, Function, and Implications in Physiology and Pathology. Eur. J. Med. Res. 2023, 28, 532. [Google Scholar] [CrossRef]
  15. Los, D.A.; Murata, N. Structure and Expression of Fatty Acid Desaturases. Biochim. Biophys. Acta (BBA)-Lipids Lipid Metab. 1998, 1394, 3–15. [Google Scholar] [CrossRef]
  16. Houten, S.M.; Wanders, R.J. A General Introduction to the Biochemistry of Mitochondrial Fatty Acid Β-Oxidation. J. Inherit. Metab. Dis. 2010, 33, 469–477. [Google Scholar] [CrossRef]
  17. Kerner, J.; Hoppel, C. Fatty Acid Import into Mitochondria. Biochim. Biophys. Acta (BBA)-Mol. Cell Biol. Lipids 2000, 1486, 1–17. [Google Scholar] [CrossRef]
  18. Kashyap, I.; Deb, R.; Battineni, A.; Nagotu, S. Acyl Coa Oxidase: From Its Expression, Structure, Folding, and Import to Its Role in Human Health and Disease. Mol. Genet. Genom. 2023, 298, 1247–1260. [Google Scholar] [CrossRef]
  19. Poirier, Y.; Antonenkov, V.D.; Glumoff, T.; Hiltunen, J.K. Peroxisomal Β-Oxidation—A Metabolic Pathway with Multiple Functions. Biochim. Biophys. Acta (BBA)-Mol. Cell Res. 2006, 1763, 1413–1426. [Google Scholar] [CrossRef]
  20. Pratama, A.M.; Sharma, M.; Naidu, S.; Bömmel, H.; Prabhuswamimath, S.C.; Madhusudhan, T.; Wihadmadyatami, H.; Bachhuka, A.; Karnati, S. Peroxisomes and Ppars: Emerging Role as Master Regulators of Cancer Metabolism. Mol. Metab. 2024, 90, 102044. [Google Scholar] [CrossRef]
  21. Miura, Y. The Biological Significance of Ω-Oxidation of Fatty Acids. Proc. Jpn. Acad. Ser. B Phys. Biol. Sci. 2013, 89, 370–382. [Google Scholar] [CrossRef] [PubMed]
  22. Yang, Y.-H.; Wen, R.; Yang, N.; Zhang, T.-N.; Liu, C.-F. Roles of Protein Post-Translational Modifications in Glucose and Lipid Metabolism: Mechanisms and Perspectives. Mol. Med. 2023, 29, 93. [Google Scholar] [CrossRef]
  23. Zhu, Y.; Lin, X.; Zhou, X.; Prochownik, E.V.; Wang, F.; Li, Y. Posttranslational Control of Lipogenesis in the Tumor Microenvironment. J. Hematol. Oncol. 2022, 15, 120. [Google Scholar] [CrossRef]
  24. Zhu, J.; Sun, Y.; Luo, J.; Wu, M.; Li, J.; Cao, Y. Specificity Protein 1 Regulates Gene Expression Related to Fatty Acid Metabolism in Goat Mammary Epithelial Cells. Int. J. Mol. Sci. 2015, 16, 1806–1820. [Google Scholar] [CrossRef] [PubMed]
  25. Poulsen, L.l.C.; Siersbæk, M.; Mandrup, S. Ppars: Fatty Acid Sensors Controlling Metabolism. Semin. Cell Dev. Biol. 2012, 23, 631–639. [Google Scholar] [CrossRef] [PubMed]
  26. Jeon, T.-I.; Osborne, T.F. Srebps: Metabolic Integrators in Physiology and Metabolism. Trends Endocrinol. Metab. 2012, 23, 65–72. [Google Scholar] [CrossRef] [PubMed]
  27. Ahonen, M.A.; Taskinen, J.H.; Latorre, J.; Ortega, F.J.; Pa, N.H.; Olkkonen, V. Microrna-221-3p Alters Human Adipocyte Lipid Storage by Regulating Glucose and Lipid Metabolism. Atherosclerosis 2020, 315, e99. [Google Scholar] [CrossRef]
  28. Zhou, Q.; Kong, D.; Li, W.; Shi, Z.; Liu, Y.; Sun, R.; Ma, X.; Qiu, C.; Liu, Z.; Hou, Y.; et al. Lncrna Hoxb-As3 Binding to Ptbp1 Protein Regulates Lipid Metabolism by Targeting Srebp1 in Endometrioid Carcinoma. Life Sci. 2023, 320, 121512. [Google Scholar] [CrossRef]
  29. Xu, P.; Zhang, X.; Wang, X.; Li, J.; Liu, G.; Kuang, Y.; Xu, J.; Zheng, X.; Ren, L.; Wang, G.; et al. Genome Sequence and Genetic Diversity of the Common Carp, Cyprinus carpio. Nat. Genet. 2014, 46, 1212–1219. [Google Scholar] [CrossRef]
  30. Jiang, X.; Li, Y.; Tian, J.; Li, C.; Ge, Y.; Hu, X.; Cheng, L.; Shi, X.; Shi, L.; Jia, Z. Nutritional Components, Biochemical Characteristics, Enzyme Activities, and Growth Differences of Five Freshwater Fish Species? Fishes 2022, 7, 285. [Google Scholar] [CrossRef]
  31. Lee, J.-Y.; Kim, W.K.; Bae, K.-H.; Lee, S.C.; Lee, E.-W. Lipid Metabolism and Ferroptosis. Biology 2021, 10, 184. [Google Scholar] [CrossRef] [PubMed]
  32. Zhao, R.; Yang, C.-R.; Wang, Y.-X.; Xu, Z.-M.; Li, S.-Q.; Li, J.-C.; Sun, X.-Q.; Wang, H.-W.; Wang, Q.; Zhang, Y.; et al. Fads2b Plays a Dominant Role in ∆6/∆5 Desaturation Activities Compared with Fads2a in Common Carp (Cyprinus carpio). Int. J. Mol. Sci. 2023, 24, 10638. [Google Scholar] [CrossRef] [PubMed]
  33. Zhao, R.; Wang, Y.X.; Yang, C.R.; Li, S.Q.; Li, J.C.; Sun, X.Q.; Wang, H.W.; Wang, Q.; Zhang, Y.; Li, J.T. Dominant Elongase Activity of Elovl5a but Higher Expression of Elovl5b in Common Carp (Cyprinus carpio). Int. J. Mol. Sci. 2022, 23, 14666. [Google Scholar] [CrossRef] [PubMed]
  34. Zhang, Y.; Sun, X.Q.; Ye, Y.Q.; Wang, Q.; Li, Q.S.; Zhao, R.; Wang, H.W.; Li, J.T. Association between the Polymorphisms of Fads2a and Fads2b and Poly-Unsaturated Fatty Acids in Common Carp (Cyprinus carpio). Animals 2021, 11, 1780. [Google Scholar] [CrossRef]
  35. Zhang, Y.; Xu, Z.M.; Wang, Q.; Li, Q.S.; Sun, X.Q.; Li, J.T. The Promoter Snps Were Associated with Both the Contents of Poly-Unsaturated Fatty Acids (Pufas) and the Expressions of Pufa-Related Genes in Common Carp. Biology 2023, 12, 524. [Google Scholar] [CrossRef]
  36. Zhang, Y.; Li, Q.S.; Ye, Y.Q.; Wang, Q.; Sun, X.Q.; Zhao, R.; Li, J.T. Association Analysis between Genetic Variants of Elovl5a and Elovl5b and Poly-Unsaturated Fatty Acids in Common Carp (Cyprinus carpio). Biology 2022, 11, 466. [Google Scholar] [CrossRef]
  37. R Core Team, R: A Language and Environment for Statistical Computing; R Foundation for Statistical Computing: Vienna, Austria, 2014; Volume 1.
  38. Bolger, A.M.; Lohse, M.; Usadel, B. Trimmomatic: A Flexible Trimmer for Illumina Sequence Data. Bioinformatics 2014, 30, 2114–2120. [Google Scholar] [CrossRef]
  39. Li, J.-T.; Wang, Q.; Huang Yang, M.-D.; Li, Q.-S.; Cui, M.-S.; Dong, Z.-J.; Wang, H.-W.; Yu, J.-H.; Zhao, Y.-J.; Yang, C.-R.; et al. Parallel Subgenome Structure and Divergent Expression Evolution of Allo-Tetraploid Common Carp and Goldfish. Nat. Genet. 2021, 53, 1493–1503. [Google Scholar] [CrossRef]
  40. Li, H.; Durbin, R. Fast and Accurate Short Read Alignment with Burrows-Wheeler Transform. Bioinformatics 2009, 25, 1754–1760. [Google Scholar] [CrossRef]
  41. Danecek, P.; Bonfield, J.K.; Liddle, J.; Marshall, J.; Ohan, V.; Pollard, M.O.; Whitwham, A.; Keane, T.; McCarthy, S.A.; Davies, R.M.; et al. Twelve Years of Samtools and Bcftools. GigaScience 2021, 10, giab008. [Google Scholar] [CrossRef] [PubMed]
  42. McKenna, A.; Hanna, M.; Banks, E.; Sivachenko, A.; Cibulskis, K.; Kernytsky, A.; Garimella, K.; Altshuler, D.; Gabriel, S.; Daly, M.; et al. The Genome Analysis Toolkit: A Mapreduce Framework for Analyzing Next-Generation DNA Sequencing Data. Genome Res. 2010, 20, 1297–1303. [Google Scholar] [CrossRef] [PubMed]
  43. Purcell, S.; Neale, B.; Todd-Brown, K.; Thomas, L.; Ferreira, M.A.; Bender, D.; Maller, J.; Sklar, P.; de Bakker, P.I.; Daly, M.J.; et al. Plink: A Tool Set for Whole-Genome Association and Population-Based Linkage Analyses. Am. J. Hum. Genet. 2007, 81, 559–575. [Google Scholar] [CrossRef] [PubMed]
  44. Wang, K.; Li, M.; Hakonarson, H. Annovar: Functional Annotation of Genetic Variants from High-Throughput Sequencing Data. Nucleic Acids Res. 2010, 38, e164. [Google Scholar] [CrossRef]
  45. Danecek, P.; Auton, A.; Abecasis, G.; Albers, C.A.; Banks, E.; DePristo, M.A.; Handsaker, R.E.; Lunter, G.; Marth, G.T.; Sherry, S.T.; et al. The Variant Call Format and Vcftools. Bioinformatics 2011, 27, 2156–2158. [Google Scholar] [CrossRef]
  46. Zhou, X.; Stephens, M. Genome-Wide Efficient Mixed-Model Analysis for Association Studies. Nat. Genet. 2012, 44, 821–824. [Google Scholar] [CrossRef]
  47. Zhang, W.; Bin, Y.; Zhang, J.; Cui, L.; Ma, J.; Chen, C.; Ai, H.; Xiao, S.; Ren, J.; Huang, L. Genome-Wide Association Studies for Fatty Acid Metabolic Traits in Five Divergent Pig Populations. Sci. Rep. 2016, 6, 24718. [Google Scholar] [CrossRef]
  48. Yin, L.; Zhang, H.; Tang, Z.; Xu, J.; Yin, D.; Zhang, Z.; Yuan, X.; Zhu, M.; Zhao, S.; Li, X.; et al. Rmvp: A Memory-Efficient, Visualization-Enhanced, and Parallel-Accelerated Tool for Genome-Wide Association Study. Genom. Proteom. Bioinform. 2021, 19, 619–628. [Google Scholar] [CrossRef]
  49. Shim, H.; Chasman, D.I.; Smith, J.D.; Mora, S.; Ridker, P.M.; Nickerson, D.A.; Krauss, R.M.; Stephens, M. A Multivariate Genome-Wide Association Analysis of 10 Ldl Subfractions, and Their Response to Statin Treatment, in 1868 Caucasians. PLoS ONE 2015, 10, e0120758. [Google Scholar] [CrossRef]
  50. Quinlan, A.R.; Hall, I.M. Bedtools: A Flexible Suite of Utilities for Comparing Genomic Features. Bioinformatics 2010, 26, 841–842. [Google Scholar] [CrossRef]
  51. Chen, C.; Wu, Y.; Li, J.; Wang, X.; Zeng, Z.; Xu, J.; Liu, Y.; Feng, J.; Chen, H.; He, Y.; et al. Tbtools-Ii: A “One for All, All for One” Bioinformatics Platform for Biological Big-Data Mining. Mol. Plant 2023, 16, 1733–1742. [Google Scholar] [CrossRef] [PubMed]
  52. Benjamini, Y.; Hochberg, Y. Controlling the False Discovery Rate: A Practical and Powerful Approach to Multiple Testing. J. R. Stat. Soc. Ser. B (Methodol.) 2018, 57, 289–300. [Google Scholar] [CrossRef]
  53. Blay, C.; Haffray, P.; D’Ambrosio, J.; Prado, E.; Dechamp, N.; Nazabal, V.; Bugeon, J.; Enez, F.; Causeur, D.; Eklouh-Molinier, C.; et al. Genetic Architecture and Genomic Selection of Fatty Acid Composition Predicted by Raman Spectroscopy in Rainbow Trout. BMC Genom. 2021, 22, 788. [Google Scholar] [CrossRef] [PubMed]
  54. Altschul, S.F.; Gish, W.; Miller, W.; Myers, E.W.; Lipman, D.J. Basic Local Alignment Search Tool. J. Mol. Biol. 1990, 215, 403–410. [Google Scholar] [CrossRef]
  55. Chen, S.; Zhou, Y.; Chen, Y.; Gu, J. Fastp: An Ultra-Fast All-in-One Fastq Preprocessor. Bioinformatics 2018, 34, i884–i890. [Google Scholar] [CrossRef]
  56. Kim, D.; Paggi, J.M.; Park, C.; Bennett, C.; Salzberg, S.L. Graph-Based Genome Alignment and Genotyping with Hisat2 and Hisat-Genotype. Nat. Biotechnol. 2019, 37, 907–915. [Google Scholar] [CrossRef]
  57. Pertea, M.; Pertea, G.M.; Antonescu, C.M.; Chang, T.C.; Mendell, J.T.; Salzberg, S.L. Stringtie Enables Improved Reconstruction of a Transcriptome from Rna-Seq Reads. Nat. Biotechnol. 2015, 33, 290–295. [Google Scholar] [CrossRef]
  58. Love, M.I.; Huber, W.; Anders, S. Moderated Estimation of Fold Change and Dispersion for Rna-Seq Data with Deseq2. Genome Biol. 2014, 15, 550. [Google Scholar] [CrossRef]
  59. Ginestet, C. Ggplot2: Elegant Graphics for Data Analysis. J. R. Stat. Soc. Ser. A Stat. Soc. 2011, 174, 245–246. [Google Scholar] [CrossRef]
  60. Livak, K.J.; Schmittgen, T.D. Analysis of Relative Gene Expression Data Using Real-Time Quantitative Pcr and the 2(-Delta Delta C(T)) Method. Methods 2001, 25, 402–408. [Google Scholar] [CrossRef]
  61. Mann, H.B.; Whitney, D.R. On a Test of Whether One of Two Random Variables Is Stochastically Larger Than the Other. Ann. Math. Stat. 1947, 18, 50–60. [Google Scholar] [CrossRef]
  62. Charmet, G.; Tran, L.-G.; Auzanneau, J.; Rincent, R.; Bouchet, S. Bwgs: A R Package for Genomic Selection and Its Application to a Wheat Breeding Programme. PLoS ONE 2020, 15, e0222733. [Google Scholar] [CrossRef] [PubMed]
  63. Endelman, J.B. Ridge Regression and Other Kernels for Genomic Selection with R Package Rrblup. Plant Genome 2011, 4. [Google Scholar] [CrossRef]
  64. Zhuang, Z.; Wu, J.; Qiu, Y.; Ruan, D.; Ding, R.; Xu, C.; Zhou, S.; Zhang, Y.; Liu, Y.; Ma, F.; et al. Improving the Accuracy of Genomic Prediction for Meat Quality Traits Using Whole Genome Sequence Data in Pigs. J. Anim. Sci. Biotechnol. 2023, 14, 67. [Google Scholar] [CrossRef]
  65. Talukdar, S.; Olefsky, J.M.; Osborn, O. Targeting Gpr120 and Other Fatty Acid-Sensing Gpcrs Ameliorates Insulin Resistance and Inflammatory Diseases. Trends Pharmacol. Sci. 2011, 32, 543–550. [Google Scholar] [CrossRef]
  66. Oteng, A.-B.; Liu, L. Gpcr-Mediated Effects of Fatty Acids and Bile Acids on Glucose Homeostasis. Front. Endocrinol. 2023, 14, 1206063. [Google Scholar] [CrossRef]
  67. Alvarez-Curto, E.; Milligan, G. Metabolism Meets Immunity: The Role of Free Fatty Acid Receptors in the Immune System. Biochem. Pharmacol 2016, 114, 3–13. [Google Scholar] [CrossRef]
  68. Paintlia, A.S.; Paintlia, M.K.; Singh, A.K.; Singh, I. Modulation of Rho-Rock Signaling Pathway Protects Oligodendrocytes against Cytokine Toxicity Via Ppar-A-Dependent Mechanism. Glia 2013, 61, 1500–1517. [Google Scholar] [CrossRef]
  69. Jahani, V.; Kavousi, A.; Mehri, S.; Karimi, G. Rho Kinase, a Potential Target in the Treatment of Metabolic Syndrome. Biomed. Pharmacother. 2018, 106, 1024–1030. [Google Scholar] [CrossRef]
  70. Hasegawa, K.; Takenaka, N.; Yamamoto, M.; Sakoda, Y.; Aiba, A.; Satoh, T. Regulation of De Novo Lipid Synthesis by the Small Gtpase Rac1 in the Adipogenic Differentiation of Progenitor Cells from Mouse White Adipose Tissue. Int. J. Mol. Sci. 2023, 24, 4608. [Google Scholar] [CrossRef]
  71. Chan, M.P.; Takenaka, N.; Abe, Y.; Satoh, T. Insulin-Stimulated Translocation of the Fatty Acid Transporter Cd36 to the Plasma Membrane Is Mediated by the Small Gtpase Rac1 in Adipocytes. Cell. Signal. 2024, 117, 111102. [Google Scholar] [CrossRef] [PubMed]
  72. Enkler, L.; Szentgyörgyi, V.; Pennauer, M.; Prescianotto-Baschong, C.; Riezman, I.; Wiesyk, A.; Avraham, R.E.; Spiess, M.; Zalckvar, E.; Kucharczyk, R.; et al. Arf1 Coordinates Fatty Acid Metabolism and Mitochondrial Homeostasis. Nat. Cell Biol. 2023, 25, 1157–1172. [Google Scholar] [CrossRef] [PubMed]
  73. Zhao, P.; Han, H.; Wu, X.; Wu, J.; Ren, Z. Arp2/3 Regulates Fatty Acid Synthesis by Modulating Lipid Droplets’ Motility. Int. J. Mol. Sci. 2022, 23, 8730. [Google Scholar] [CrossRef] [PubMed]
  74. Wang, C.; Shao, L.; Pan, C.; Ye, J.; Ding, Z.; Wu, J.; Du, Q.; Ren, Y.; Zhu, C. Elevated Level of Mitochondrial Reactive Oxygen Species Via Fatty Acid Β-Oxidation in Cancer Stem Cells Promotes Cancer Metastasis by Inducing Epithelial-Mesenchymal Transition. Stem Cell Res. Ther. 2019, 10, 175. [Google Scholar] [CrossRef]
  75. Antollini, S.S.; Barrantes, F.J. Fatty Acid Regulation of Voltage- and Ligand-Gated Ion Channel Function. Front. Physiol. 2016, 7, 573. [Google Scholar] [CrossRef]
  76. Klotz, L.O.; Steinbrenner, H. Cellular Adaptation to Xenobiotics: Interplay between Xenosensors, Reactive Oxygen Species and Foxo Transcription Factors. Redox Biol. 2017, 13, 646–654. [Google Scholar] [CrossRef]
  77. Weng, L.; Tang, W.-S.; Wang, X.; Gong, Y.; Liu, C.; Hong, N.-N.; Tao, Y.; Li, K.-Z.; Liu, S.-N.; Jiang, W.; et al. Surplus Fatty Acid Synthesis Increases Oxidative Stress in Adipocytes and Induces Lipodystrophy. Nat. Commun. 2024, 15, 133. [Google Scholar] [CrossRef]
  78. Ferreira, A.V.; Alarcon-Barrera, J.C.; Domínguez-Andrés, J.; Bulut, Ö.; Kilic, G.; Debisarun, P.A.; Röring, R.J.; Özhan, H.N.; Terschlüsen, E.; Ziogas, A.; et al. Fatty Acid Desaturation and Lipoxygenase Pathways Support Trained Immunity. Nat. Commun. 2023, 14, 7385. [Google Scholar] [CrossRef]
  79. Phelan, N.; O’Connor, A.; Kyaw Tun, T.; Correia, N.; Boran, G.; Roche, H.M.; Gibney, J. Hormonal and Metabolic Effects of Polyunsaturated Fatty Acids in Young Women with Polycystic Ovary Syndrome: Results from a Cross-Sectional Analysis and a Randomized, Placebo-Controlled, Crossover Trial. Am. J. Clin. Nutr. 2011, 93, 652–662. [Google Scholar] [CrossRef]
  80. Paul, R.; Luo, M.; Mo, X.; Lu, J.; Yeo, S.K.; Guan, J.-L. Fak Activates Akt-Mtor Signaling to Promote the Growth and Progression of Mmtv-Wnt1-Driven Basal-Like Mammary Tumors. Breast Cancer Res. 2020, 22, 59. [Google Scholar] [CrossRef]
  81. Su, W.Y.; Tian, L.Y.; Guo, L.P.; Huang, L.Q.; Gao, W.Y. Pi3k Signaling-Regulated Metabolic Reprogramming: From Mechanism to Application. Biochim. Biophys. Acta Rev. Cancer 2023, 1878, 188952. [Google Scholar] [CrossRef] [PubMed]
  82. Mock, T.S.; Francis, D.S.; Jago, M.K.; Glencross, B.D.; Smullen, R.P.; Turchini, G.M. Endogenous Biosynthesis of N-3 Long-Chain Pufa in Atlantic Salmon. Br. J. Nutr. 2019, 121, 1108–1123. [Google Scholar] [CrossRef] [PubMed]
  83. Matsumoto, H.; Shimizu, Y.; Tanaka, A.; Nogi, T.; Tabuchi, I.; Oyama, K.; Taniguchi, M.; Mannen, H.; Sasazaki, S. The Snp in the Promoter Region of the Bovine Elovl5 Gene Influences Economic Traits Including Subcutaneous Fat Thickness. Mol. Biol. Rep. 2013, 40, 3231–3237. [Google Scholar] [CrossRef]
  84. Zhao, L.; Li, F.; Liu, T.; Yuan, L.; Zhang, X.; Zhang, D.; Li, X.; Zhang, Y.; Zhao, Y.; Song, Q.; et al. Ovine Elovl5 and Fasn Genes Polymorphisms and Their Correlations with Sheep Tail Fat Deposition. Gene 2022, 807, 145954. [Google Scholar] [CrossRef] [PubMed]
  85. Casteels, M.; Foulon, V.; Mannaerts, G.P.; Van Veldhoven, P.P. Alpha-Oxidation of 3-Methyl-Substituted Fatty Acids and Its Thiamine Dependence. Eur. J. Biochem. 2003, 270, 1619–1627. [Google Scholar] [CrossRef]
  86. Xu, M.; Tan, J.; Dong, W.; Zou, B.; Teng, X.; Zhu, L.; Ge, C.; Dai, X.; Kuang, Q.; Zhong, S.; et al. The E3 Ubiquitin-Protein Ligase Trim31 Alleviates Non-Alcoholic Fatty Liver Disease by Targeting Rhbdf2 in Mouse Hepatocytes. Nat. Commun. 2022, 13, 1052. [Google Scholar] [CrossRef]
  87. Zou, Y.; Zhang, Y.; Li, M.; Cao, K.; Song, C.; Zhang, Z.; Cai, K.; Geng, D.; Chen, S.; Wu, Y.; et al. Regulation of Lipid Metabolism by E3 Ubiquitin Ligases in Lipid-Associated Metabolic Diseases. Int. J. Biol. Macromol. 2024, 265, 130961. [Google Scholar] [CrossRef]
  88. Chen, S.; Hu, Z.; He, H.; Liu, X. Fatty Acid Elongase7 Is Regulated Via Sp1 and Is Involved in Lipid Accumulation in Bovine Mammary Epithelial Cells. J. Cell. Physiol. 2018, 233, 4715–4725. [Google Scholar] [CrossRef]
  89. Li, Y.; Zhao, J.; Dong, Y.; Yin, Z.; Li, Y.; Liu, Y.; You, C.; Monroig, Ó.; Tocher, D.R.; Wang, S. Sp1 Is Involved in Vertebrate Lc-Pufa Biosynthesis by Upregulating the Expression of Liver Desaturase and Elongase Genes. Int. J. Mol. Sci. 2019, 20, 5066. [Google Scholar] [CrossRef]
  90. Zong, Y.; Wang, X.; Cui, B.; Xiong, X.; Wu, A.; Lin, C.; Zhang, Y. Decoding the Regulatory Roles of Non-Coding Rnas in Cellular Metabolism and Disease. Mol. Ther. 2023, 31, 1562–1576. [Google Scholar] [CrossRef]
  91. Datsomor, A.K.; Olsen, R.E.; Zic, N.; Madaro, A.; Bones, A.M.; Edvardsen, R.B.; Wargelius, A.; Winge, P. Crispr/Cas9-Mediated Editing of Δ5 and Δ6 Desaturases Impairs Δ8-Desaturation and Docosahexaenoic Acid Synthesis in Atlantic Salmon (Salmo Salar L.). Sci. Rep. 2019, 9, 16888. [Google Scholar] [CrossRef] [PubMed]
  92. Hallerman, E.; Bredlau, J.; Camargo, L.S.A.; Dagli, M.L.Z.; Karembu, M.; Kovich, D.; Muia, A.N.; Murrone, M.L.; Rocha-Salavarrieta, P.J.; Romero-Aldemita, R.; et al. Enabling Regulatory Policy Globally Will Promote Realization of the Potential of Animal Biotechnology. CABI Agric. Biosci. 2024, 5, 1–28. [Google Scholar] [CrossRef]
  93. Alemu, A.; Åstrand, J.; Montesinos-López, O.; Sánchez, J.; Fernández-Gónzalez, J.; Tadesse, W.; Vetukuri, R.; Carlsson, A.; Ceplitis, A.; Crossa, J.; et al. Genomic Selection in Plant Breeding: Key Factors Shaping Two Decades of Progress. Mol. Plant 2024, 17, 552–578. [Google Scholar] [CrossRef]
  94. Yáñez, J.M.; Barría, A.; López, M.E.; Moen, T.; Garcia, B.F.; Yoshida, G.M.; Xu, P. Genome-Wide Association and Genomic Selection in Aquaculture. Rev. Aquac. 2023, 15, 645–675. [Google Scholar] [CrossRef]
  95. He, R.; Xue, H.; Pan, W. Statistical Power of Transcriptome-Wide Association Studies. Genet. Epidemiol. 2022, 46, 572–588. [Google Scholar] [CrossRef]
Figure 1. Summary of the diversities of FA contents. (a) Principal component analysis (PCA) of common carp samples for the content of 16 FAs. (b) A heatmap of the pairwise Pearson’s correlation among 16 FAs, where × represents no significant correlation between any two types of FAs.
Fishes 10 00234 g001
Figure 2. Genetic diversity revealed with high-quality SNPs. (a) Heat map of the marker-based kinship matrix among 280 common carp samples. (b) SNP density plot across 50 chromosomes of common carp, showing the SNP number per 1 Mb block. The horizontal axis represents the chromosome length in Mb. Different colors correspond to distinct SNP densities. (c) Functional annotation of SNPs to their closest genes.
Fishes 10 00234 g002
Figure 3. Genome-wide association analysis. Manhattan plot (a) and Q-Q plot (b) of GWAS for TSFA. Manhattan plot (c) and Q-Q plot (d) of GWAS for TMUFA. Manhattan plot (e) and Q-Q plot (f) of GWAS for TPUFA. The blue and dark blue points represent different chromosomes. The red points represent SNPs for which p-values were lower than the significance threshold. The orange points represent SNPs for which p-values were lower than the suggestive threshold.
Fishes 10 00234 g003
Figure 4. An upset plot showing the overlapping SNPs associated with the contents of 16 FAs. The vertical axis of the top histogram represents the number of SNPs, and the horizontal axis is the trait corresponding to the black dot below. The horizontal axis of the leftmost histogram represents the number of SNPs. The gray dots represent traits on the horizontal axis that do not intersect with the vertical axis.
Fishes 10 00234 g004
Figure 5. Summary of DEGs between the high-TPUFA samples and low-TPUFA samples identified by RNA-seq analysis. (a) Volcano plot of RNA-seq analysis. The red and green points indicate significantly up-regulated and down-regulated genes, respectively. The gray points represent genes with no significant differences. (b) PCA clustering of 60 samples with the expression levels of 715 DEGs. (c) GO term enrichment of DEGs.
Fishes 10 00234 g005
Figure 6. Expression patterns of four core genes between the high-TPUFA samples and low-TPUFA samples were validated with qPCR. (a) Core genes identified by both GWAS and DEGs. Results of qRT-PCR validation for four core genes in the low-TPUFA and high-TPUFA groups. Red is the qRT-PCR expression trends, blue is the RNA-seq expression trends. (b) LOC109047212; (c) LOC122143902; (d) CPT1A; (e) XICGF67.1.
Fishes 10 00234 g006
Figure 7. Predictive abilities of 12 GS methods for 16 FA contents.
Fishes 10 00234 g007
Figure 8. Fatty acid synthesis, oxidation, and the role of ubiquitination in fatty acid metabolism.
Fishes 10 00234 g008
Table 1. FA contents in common carp muscle (mg/g).
MeanSDMinMaxCV
C14:00.170.150.002.200.89
C16:03.801.510.9110.100.40
C18:01.180.450.243.130.38
TSFA5.191.991.2112.880.38
C16:10.530.350.012.010.66
C18:1n-96.893.151.6518.110.46
C20:1n-90.270.150.010.930.55
TMUFA7.823.522.0220.280.45
C18:2n-64.661.960.0211.310.42
C18:3n-30.300.150.000.710.50
C18:3n-60.100.070.000.470.68
C20:2n-60.130.050.000.370.42
C20:3n-60.250.150.001.010.58
C20:4n-60.570.400.002.250.69
C22:6n-30.480.440.002.380.92
TPUFA6.482.501.1314.010.39
Note: SD, standard deviation; Min, minimum; Max, maximum; CV, coefficient of variation.
Disclaimer/Publisher’s Note: The statements, opinions and data contained in all publications are solely those of the individual author(s) and contributor(s) and not of MDPI and/or the editor(s). MDPI and/or the editor(s) disclaim responsibility for any injury to people or property resulting from any ideas, methods, instructions or products referred to in the content.

