Abstract
Urban areas are rapidly expanding into natural habitats worldwide. When species are threatened with habitat loss, it is vital to understand how they will respond or adapt to the change in their environment. One primate species threatened by habitat loss is the fully arboreal Javan slow loris (Nycticebus javanicus). This non-leaping species not only relies on canopy continuity but is also subject to capture for illegal wildlife trade, especially in anthropogenic landscapes where they are easier to catch. We examine the use of urban areas by Javan slow lorises in terms of habitat use as well as feeding and terrestriality behaviours in the municipality of Cipaganti in West Java, Indonesia. For this study, we observed Javan slow lorises from May 2018 to April 2020 for two dry periods and two wet periods. We combined home ranges and core areas with a land cover classification of the area to understand the composition of the loris habitat. We also included feeding and terrestriality data to determine the ratio of these activities within each land cover class. We found that approximately half of their territory falls into natural areas (bamboo patches: 45–60%), and the other half is in human land use areas (agriculture, shade gardens, urban areas, and fallow land). Urban areas ranged from 0 to 54% of an individual loris’s habitat, with the proportion of urban land cover being higher in some individuals’ core areas than in their home ranges. Only urban areas showed a variation between periods, with p-values of 0.06 and 0.002 for home ranges and core areas, respectively, showing a significant increase usage during dry periods. Of all feeding observations, 4% occurred in urban areas with nectar being the most common feeding item. We recorded thirteen different food species in urban areas with Calliandra calothrysus being the most frequent. We found that 7% of terrestriality events occurred in urban areas. The findings from this study show that human land use areas cover a significant portion of the Javan slow lorises habitat in this region, further emphasising the need to consider the needs of these Critically Endangered primates when developing natural habitats into those of human managed landscapes. The same principles are true for the large number of species that are able to persist in urban areas in a world increasingly dominated by humans.
Keywords:
home range; core area; primate; land cover; classification; human land use; habitat loss; urbanisation; conservation 1. Introduction
The concept of habitat, the home of an organism, is one of the fundamental principles of ecology [1]. Habitat encompasses the environment utilised by a species for their specific resources and activities, such as food, water, shelter, and surroundings required for mating and reproduction [2]. Each species depends on their habitat for survival and reproductive success [3]. Due to anthropogenic development and activities, natural habitats have been extensively disturbed and encroached upon, leading to habitat fragmentation and decline [4]. As a result of this disturbance, global biodiversity is being significantly impacted, particularly in relation to tropical biomes where the rate of habitat loss is predicted to increase [5]. This has led to the extinction and global decline of many species, as they are no longer able to access vital resources they require to survive [6].
Urban environments have been expanding into natural habitats worldwide, namely human-dominated landscapes incorporating the transformation of natural areas into built areas [7]. Globally, urban growth could increase by up to almost six times over the next century, with the fastest expansion occurring in Asia and Africa [8]. Indonesia specifically has the fastest urbanisation growth in Asia, with an average growth of over 4% per year [9]. Wildlife in the affected region is forced to either adapt to these new anthropogenic surroundings or find novel ways to survive in their declining natural habitat [10]. When wild animals roam into urban areas, they are exposed to unfamiliar environmental complexities, including roads and walkways with vehicle and pedestrian traffic as well as noise, chemical, and light pollution [11]. The structures in these areas, including buildings and roads, present unusual surfaces for wildlife as well as hinder suitable climatic conditions due to the ‘heat island effect’, whereby the man-made surfaces absorb and emit more heat than natural environments [12]. The presence of animals within urban landscapes can also generate conflicts with humans themselves, such as causing traffic accidents, damage to buildings or belongings, attacking humans or domesticated animals, as well as zoonotic and sanitary risks [13]. Yet for some species, these new environmental conditions and resources can also present opportunities. Buildings may offer shelter and nesting sites, and food availability may increase due to waste disposal and ornamental flora as well as direct feeding by humans [10]. Although some species have been able to persist in urban surroundings, which traits and behaviours aid their adaptation is not clearly defined [14]. Several studies highlighted that behavioural plasticity in terms of diet, habitat use, migration, as well as diurnal and seasonal activity as being beneficial in adapting to urban environments [15,16]. The ability to tolerate a high level of pollutants and disturbance has also been documented as being necessary to be well-suited for urban habitats, with the suggestion that species with timid temperaments are likely to be at a disadvantage [10,17]. Other studies point towards associations on a genetic level, with a particular gene showing evidence of benefitting blackbirds (Turdus merula) in their colonisation of urban areas [18]. Primate studies, especially small-bodied arboreal primates, are much more common in their “natural” habitats as opposed to observation within human-dominated landscapes [19].
One primate species in particular that is under threat from urban habitats is the Javan slow loris (Nycticebus javanicus), which is included in the most recently updated World’s 25 Most Endangered Primates list [20]. They are classified as Critically Endangered by IUCN Red List and listed under CITES Appendix I. The Javan slow loris is a medium-sized nocturnal and venomous primate, which lives in monogamous family units as a paired adult female and adult male with a small number of offspring [21]. They disperse from the family group at anywhere between 16 months and three years, with home ranges up to 50 ha during dispersal [21]. Javan slow lorises are arboreal in nature with habitat that includes primary and secondary forests as well as bamboo forest [22]. Anthropogenic activities such as deforestation and the illegal wildlife trade are the main causes behind the Javan slow loris’s decline. As a result of habitat loss, previous studies have shown them to inhabit some anthropogenic landscapes, such as agricultural environments [22]. With Javan slow lorises roaming into human disturbed areas, further studies are required to understand why and to what extent they are active in these multi-use landscapes. This will in turn improve conservation efforts and wildlife management, as fragmentation of habitat can lead to a mortality increase in arboreal primates [23].
In the case of the Javan slow loris’s habitat use, few studies investigate their use of urban areas; this is potentially due to their low population density combined with their cryptic and nocturnal nature [22]. Therefore, the continued investigation of potentially suitable habitats is vital for the effective conservation of this globally threatened primate. Venturing into these anthropogenic landscapes can create a number of risks for the Javan slow loris, which they are less likely to encounter in undisturbed natural habitats. Within urban environments, there is less connectivity and many open and exposed areas, leaving them at a higher risk of resorting to descending to the ground (terrestriality). As the lorises are arboreal, they are not well adapted to terrestrial locomotion [24]. As well as traffic accidents, terrestriality can also leave the slow lorises more exposed to predators [25]. Both humans and domestic dogs (Canis familiaris) are amongst the loris’s main predators in this region. Javan slow lorises have been killed or injured by domestic dogs used by local farmers to guard their farms [24]. Although Javan slow lorises are a protected species, they are frequently illegally hunted by humans for the wildlife, medicinal and black magic trade, which is a major contribution to their decreasing population [26]. Therefore, their presence in urban environments could leave them particularly vulnerable to both of these predators.
When species are threatened with habitat loss, it is vital to understand how they will respond or adapt to the change in their environment. The Javan slow loris has demonstrated behavioural flexibility in certain human-disturbed landscapes such as agroforestry sites [27]. In relation to urban environments, there is evidence that they can adapt to areas where they are not hunted and have been recognised as using vegetation along roadsides [24]. With the rate of habitat loss predicted to increase in tropical regions, there is an urgent need to understand how the slow lorises are exploring these new and expanding urban spaces [5]. In this study, we aim to determine the extent that Javan slow lorises are using urban areas in the municipality of Cipaganti in West Java. We focus on the composition of urban areas within their core area and home ranges compared to other natural habitats. In addition, we investigate their behaviours when within these urban areas, including their food sources and terrestriality interactions. These findings will contribute towards a better understanding of the ecology and behaviour of Javan slow lorises in ever-growing human-dominated landscapes, which can aid the mitigation of human–wildlife conflicts and the development of urban environments that can be shared by both wildlife and humans alike.
2. Materials and Methods
2.1. Study Site and Study Species
The study was conducted from May 2018 to April 2020 in an area approximately 12 km2 in the municipality of Cipaganti, Garut District, West Java, Indonesia (7° S, 107° E, 1200 m a.s.l.) (Figure 1a). We have been working at this site continuously since 2012. It was originally selected for several reasons: anthropogenic landscapes border a more natural forest, allowing us to examine the ecological implications of these habitats; slow lorises were heavily hunted at this site in the past, making it an ideal area for conservation outreach; the mosaic structure of the habitat is characterised by frequent clumps of low trees, meaning we could catch the lorises, which do not enter traps, in order to radio collar them. The study site is a mixed composition of protected rainforest, bamboo strips, agricultural fields, agroforestry patches, and private gardens, as well as urban built-up areas (Figure 1b). It is characterised by three active volcanoes, with the most recent eruption in our study area having taken place in 2011. Several pioneer species thrive quickly post eruption. One group of these is bamboo species. Not only do these fast-growing grasses maintain soil stability, but they are used for countless purposes in local construction, farming, and other cultural aspects. We categorised bamboo areas as patches of natural forest where bamboo is the dominant species. Small streams are located beneath many of the bamboo strips, with the vegetation following the lines of the waterways where the bamboo is richer in abundance. Flora species in the area include giant bamboo (Dendrocalamus asper), clumping bamboo (Gigantochloa pseudoarundinacea), string bamboo (Gigantochloa atter), avocado (Persea americana), red fairy duster (Calliandra calothyrsus), rubber (Hevea brasiliensis), teak (Tectona grandis), Sumatran pine (Pinus merkusii), and Indonesian mahogany (Toona sureni) [27]. Other mammals present in the area are the Indian civet (Viverricula indica), Sunda leopard cat (Prionailurus javanensis), Javan palm civet (Paradoxurus musanga javanicus), Javan leopard (Panthera pardus melas), Wild boar (Sus scrofa), black-striped squirrel (Callosciurus nigrovittatus), Horsfield’s treeshrew (Tupaia javanica), and Javan mongoose (Herpestes javanicus).
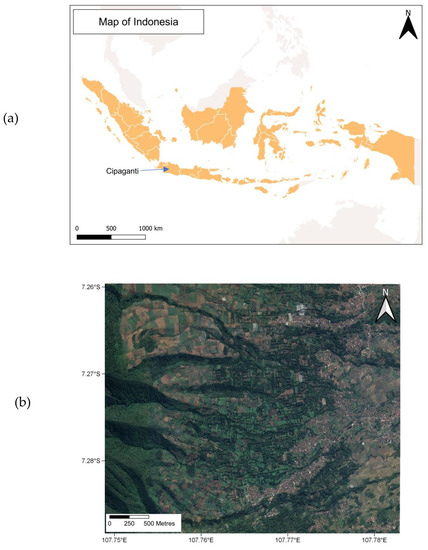
Figure 1.
The study location: (a) the West Java province in Indonesia where the municipality of Cipaganti is located, with (b) a satellite image of the study site showing the mixed landscape (coordinates are shown in decimal degrees).
The majority of the site is owned by approximately 700 private owners, consisting of farmers from the surrounding villages (Figure 1b). The region of Garut is amongst some of the largest contributors to the agricultural sector in Indonesia [28]. Agriculture is the primary source of income for these villages, with crops including coffee (Coffea arabica, C. canephora), tea (Camellia sinensis), tobacco (Nicotiana tabacum), chayote (Sechium edule), and sugar palm (Arenga pinnata) [29]. Deemed a tropical climate, there are two periods in Java: the wet period and the dry period. The dry period is considered May–October and the wet period is November–April [30], with both periods included in this study.
We focus on the habitat—including core areas and home ranges—feeding behaviour, and terrestriality of the Javan slow loris (Nycticebus javanicus). The population at the time of this study consisted of 29 collared individuals including 8 adult females, 4 juvenile females, 11 adult males, and 6 juvenile males. We define the home range as the area in which the loris spends their time, including their foraging and mating activities; therefore, the home ranges of several individuals can often overlap. We define the core area as an area inside the home range, in which most of their activities are more densely focused [31].
2.2. Data Collection and Collaring of Lorises
As part of a long-term study, we included observations from a population of Javan slow lorises at a study site in Cipaganti, Java, from 1 May 2018 to 30 April 2020 for two dry periods and two wet periods. The animals were subject to regular health checks and equipped with radio-collars (Lotek, Dorset, UK, 19 g, approximately 2% of their body weight) attached to their neck using a rubber-coated cable tie. The collars had a battery life of around one year; we additionally identified animals with a microchip (Microchip ID LTD). We tracked individuals using a six-element Yagi antenna and SIKA receiver (Lotek). In order to collar the lorises, they were caught by hand and placed in a clean cotton bag with no anaesthesia [32]. Since the onset of the Little Fireface Project (the name of the long-term study), no loris has been lost due to a capturing or collaring injury. Additionally, every six months, each animal had a health check to ensure the collar was causing no adverse effects on their health, including three-month check-ups for young animals to ensure their collars still comfortably fit. We also removed collars from four lorises who began to disperse outside of the study site, as any adverse effects could no longer be monitored. Due to the nocturnal nature of slow lorises, we collected activity data from 1800 to 0600 with the use of an established ethogram. During these night shifts, we used Clulite LED headlamps with a red filter (Cluson Engineering Ltd., Hampshire, UK), with no adverse effects on the loris behaviour found using red light [32]. We collected data points at five-minute intervals using instantaneous focal sampling [33], extending to instantaneous scan sampling if a second loris was present. Here, we also considered all occurrences of feeding and terrestriality. Feeding was defined as any occurrence where an item of food was being actively consumed by a loris, with terrestriality defined as any occurrence where a loris descended to the ground, The feeding was recorded in bouts, i.e., feeding on a particular species for that time duration as opposed to the amount that was eaten [30]. We recorded all terrestriality events measured as time spent on the ground (in seconds) as well as the distance travelled (in metres).
2.3. 2019 Land Cover Classification
The land cover classification used for cross-analysis to understand the land cover types with which the lorises are interacting was created as a supervised classification in April 2019 (Figure 2). We performed the classification on a high-resolution geo-rectified Enhanced Compression Wavelet file that contained only red, green, and blue (RGB) channels due to the limited availability of high-resolution satellite data in this region for the chosen time period. The original resolution of the raster, taken by the GeoEye-1 satellite and imported from the QuickMapServices tool in QGIS, was 50 cm, and we further resampled the selected image to 1 m resolution for simplification and faster processing. The workflow of the classification started with segmentation via the Orfeo ToolBox in QGIS. This segmentation generated areas of unsupervised polygons of each RGB channel based on pixel values, including not only their radiometric value but also the position and texture of the pixels. Following this, training data were determined in the form of polygons based on both local ground knowledge and visual image interpretation. We calculated the supervised classification using the Random Forest Algorithm due to it being considered a better performer at local scales. The number of trees used in the algorithm was set to 100, and six land cover classes were generated. The land cover classes included Agriculture (Croplands), Bamboo patches, Urban (Built-up), Fallow land (Uncultivated), Forest, and Shade grown gardens.
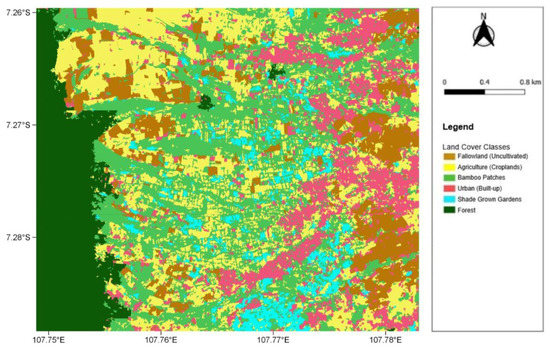
Figure 2.
The 2019 land cover classification map, depicting the six land cover classes across the entire study site (coordinates are shown in decimal degrees).
In order to investigate an unbiased performance accuracy of the land cover classification, we also calculated a confusion matrix using 400 randomly generated points in QGIS 3.10 to determine the reliability of the cross-analysis. We generated a producer accuracy, user accuracy, and overall accuracy—with the user accuracy being the chosen performance metric, as the classification will be used for analysis from the perspective of a “user”.
2.4. Habitat Mapping: Home Ranges and Core Areas
To map the habitat of the slow lorises, we determined their core areas and home ranges using the GPS data collected during instantaneous sample points. We imported these data into the Ranges 9 software with the home range size defined using 95% fixed kernel estimates and the core area being set at 50% [34]. We generate these using least square cross-validation, which is the recommended parameter for home range estimation [34].
We imported the generated shapefiles from Ranges 9 for the outline of the core areas and home ranges into QGIS 3.10 in order to calculate area statistics for each polygon, i.e., for each loris’s home range and core area.
2.5. Land Cover Types within Loris Habitat
To understand the composition of land cover types within the lorises’ home ranges and core areas, with a focus on urban areas, in QGIS 3.10, we used vector operators to intersect the classification, which were overlaid with the polygons individually. Once the intersection was generated, the combination of these class areas together with the polygon areas from Section 2.4 allowed for ratios to be generated that showed the percentage of each class area within each of the home ranges and core areas. We repeated this process for each of the polygons for both the home ranges and core areas, respectively, allowing for individual analyses of each loris’s home range and core area. This would provide an insight into the proportion of the lorises’ habitat that are comprised of urban areas, if any.
2.6. Behavioural Data: Feeding and Terrestriality
From the digitised behavioural data, the feeding data (item and species) as well as terrestriality data (duration and distance) including all linked GPS information were extracted and imported into QGIS 3.10 as point layers using the latitude and longitude from the GPS details. In QGIS 3.10, using the land cover classification, we then used intersections to determine the ratio of feeding and terrestriality behaviour within each land cover class. We then further categorised them into the count of each feeding item and species with a deeper focus for only the urban class. We determined all counts of terrestriality observations for each land cover class, with the distance and duration of these events further calculated for only those within the urban class.
2.7. Statistical Analysis
To test differences in the proportion of home ranges and core areas included in the different land cover classes between periods, we used generalised linear mixed models via the R package “glmmTMB” [35]. We tested the different families present in the package and selected the model based on the QQ plot residuals and residual vs. predicted plot from the package “DHARMa” [36]. We selected a beta distribution as family fit, and we included a zero-inflation term in most cases apart from core areas in urban class where the tweedie distribution was more suitable. We included individuals as random effect. We considered p = 0.05 as the level of significance.
3. Results
3.1. 2019 Land Cover Classification: Accuracy
From the accuracy assessment, the classification is of a high accuracy, with an overall producer accuracy of 92% and an overall user accuracy of 89% (Table A1). With the classification being used in this project from a “user” perspective, the majority of the classes had very high user accuracy. For the “Urban” class, it produced a 100% user accuracy, with the same result for both “Forest” classes, thus supporting any occurrences of the lorises in urban areas according to the classification. The land cover classes “Bamboo”, “Fallow land”, and “Agriculture” also scored highly with 96%, 93%, and 90% user accuracies, respectively; therefore, five out of the six classes performed extremely well. The lowest user accuracy resulted from “Shade gardens” with an accuracy of 53%. This consequentially reduced the overall user accuracy to 89% for all classes combined. The class most frequently misidentified as “Shade gardens” was that of “Bamboo”, with 31% (11 out of 36 points) being incorrectly classified—this naturally also affected the producer accuracy of “Bamboo”, resulting in the only land cover class to have a <90% producer accuracy. As urban areas are the primary focus of this project, the performance of “Shade gardens” will not affect those findings. Some brief initial statistics of the land cover classification also show that the largest class in the extent of the study site is that of bamboo patches, covering approximately 28% of the area (3.6 km2). Agriculture is the second most prevalent at 25% (3.1 km2) and forest is third at 17% (2.1 km2). Urban areas equate to around 13% of the entire study area (1.7 km2). Fallow land and shade gardens have the lowest portion of the study site with 11% (1.4 km2) and 6% (0.7 km2), respectively.
3.2. Habitat Mapping: Home Ranges and Core Areas
Whilst generating the home ranges and core areas of each of the lorises, some individuals were found to have more than one home range or core area during a period. Both dry and wet periods had a similar amount of home ranges and core areas, with an average of four habitats for each loris per period. Throughout the study duration, the size of the lorises’ home ranges varied from a minimum of 0.3 hectares to a maximum of 20.4 hectares, with an average size of 5.6 hectares (Tables A2, Tables S1 and S2). Across all periods, the average home range sizes were comparable, with averages of 5.6 hectares and 5.3 hectares for the dry and wet periods, respectively. Correspondingly, the core areas ranged from a minimum of 0.05 hectares to a maximum of 6.4 hectares, with an average size of 1.6 hectares throughout the study. Across both periods, the average core area sizes were also similar, with averages of 1.5 hectares and 1.6 hectares for the dry and wet periods, respectively.
3.3. Land Cover Classes within Loris Habitat
3.3.1. Composition of Habitat
Collectively for all lorises, the largest proportion of their home ranges and core areas were composed of “Bamboo Patches” (Figure 3), accounting for approximately half of their entire habitat across all periods (45–60%). Agriculture (cropland) also comprised a significant proportion of the lorises’ habitat ranging from an average of 24–32% of their core areas and home ranges. The lowest land cover usage across all periods for both home ranges and core areas was that of fallow land (uncultivated). Urban (built-up) has a proportion of the lorises’ home ranges and core areas across all periods, ranging 5–10% and 3–8% of the total composition of home ranges and core areas, respectively. Furthermore, urban areas were the only land cover class to show a variation across the periods. The overall results show that there is a trend during the two dry periods where the lorises frequent the urban areas more, with usage during the dry periods more than doubling in some cases. There was also a substantial variation amongst individual lorises within urban areas, with the majority comprising less than 20% and the full range from 0 to 54% (Table S2). The 54% proportion belonged to the loris “Lalit”, which was a juvenile male. This was attributed to the core area of Lalit’s habitat, showing that the majority of his activities, including sleeping and eating, were occurring in urban surroundings. This was presented as the case for several other individuals too, where the proportion of the urban land cover within their core area was higher than that of their home range.
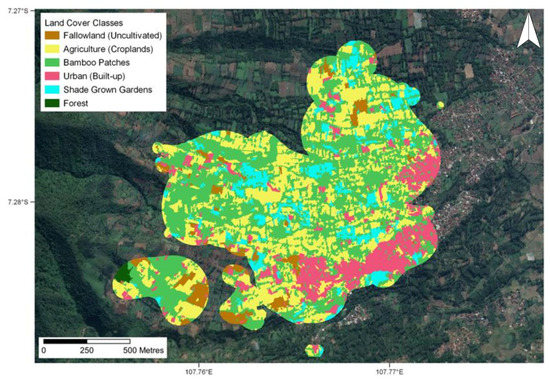
Figure 3.
Land cover classification intersected with home ranges and core areas. Intersection depicts all lorises collectively across entire study period (coordinates are shown in decimal degrees).
3.3.2. Home Ranges and Core Areas
We found no significant differences between the lorises’ use of land cover class and period except for one class (Table 1). The only land cover class that produced a variation between the two periods was that of urban (built-up), with p-values of 0.06 and 0.002 for home ranges and core areas, respectively (Table 1). These results produced negative estimates during the modelling of the wet period, suggesting a trend of higher usage during the dry periods. This trend in urban areas is subtle for the lorises’ home ranges and is highly significant for their core areas (Figure 4 and Figure 5).

Table 1.
Results of the generalised linear mixed models to understand differences in ranging patterns of lorises across different land cover classes between periods.
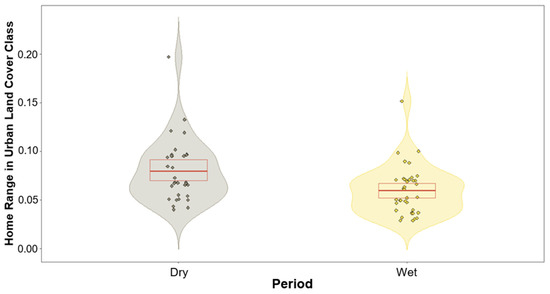
Figure 4.
Violin plot showing response variables based on the prediction of the model of urban land cover class within home range for both dry and wet periods. Dry period (left violin) depicting greater usage overall compared to wet period (right violin). Red box depicts the first and third quartiles, central red line the median.
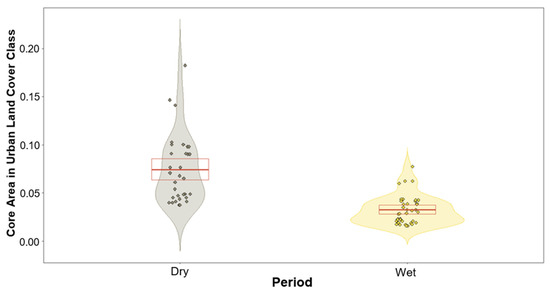
Figure 5.
Violin plot showing response variables based on the prediction of the model of urban land cover class within core areas for both dry and wet periods. Dry period (left violin) depicting much greater usage overall compared to wet period (right violin). Red box depicts the first and third quartiles, central red line the median.
3.4. Behavioural Data Analysis: Feeding and Terrestriality
3.4.1. Feeding Observations
Across all periods, we recorded 3700 feeding observations (Figure 6) with the majority of these (54%) occurring in bamboo patches (Table S3). A further 23% occurred in agricultural areas, and 17% occurred in shade gardens. A total of 136 occurred in urban areas, equating to around 4% of the total feeding observations. Of these 136 observations, nectar was the most common feeding item (n = 43), which was followed by fruits (n = 27), insects (n = 25), flowers (n = 19), gum (n = 13), bamboo shoots (n = 1), and “other” (n = 8). We recorded 13 species over 136 feeding observations in urban areas. The most frequently recorded species was Calliandra calothyrsus (n = 49), which was followed by Eucalyptus sp. (n = 20), Psidium guajava (n = 15), Acacia decurrens (n = 13), Persea americana (n = 10), Syzygium sp. (n = 10), Eriobotrya japonica (n = 6), Artocarpus heterophyllus (n = 4), Toona sinensis (n = 3), Gigantochloa cf. ater (n = 2), Calliandra sp. (n = 2), Maesopsis eminii (n = 1) and Sechium edule (n = 1).
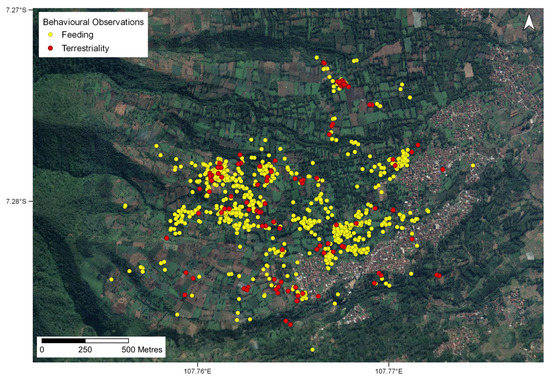
Figure 6.
All feeding and terrestriality observations of all lorises collectively across entire study period (coordinates are shown in decimal degrees). Yellow points depict feeding observations with red points depicting the terrestrial observations.
3.4.2. Terrestriality Observations
We observed 153 terrestriality events across all land cover types (Figure 6) including bamboo patches (43%), in agricultural areas (36%), shade gardens (10%), and fallow land (4%). Urban areas (7%) accounted for 11 of the 153 recorded events, with the mean distance spent on the ground being 4 m, with a mean duration of 30.5 s. Comments from the observer included “no connectivity in the direction the loris wanted to go”, “walking on the ground”, and “at least 20 s on the ground”. One loris in particular, a juvenile male, was on the ground in urban areas for a distance of 25 m for 225 s recorded from three separate terrestriality observations (Table S4).
4. Discussion
From the results of the mapped habitat from all of the slow lorises studied collectively in the Cipaganti region, we determined that on average, approximately half of their territory falls into human land use areas (agriculture, shade gardens, urban areas, and fallow-land) with the other half in natural areas (bamboo patches: 45–60%). Urban areas in particular contained a notable proportion of the slow lorises’ habitat, with it comprising more than half of one individual’s core area. These findings corroborate the outcomes of other studies that indicate the flexibility of the Javan slow loris in a human-modified landscape [27]. Here, we discuss these results in relation to the long-term persistence of these Critically Endangered primates in anthropogenic landscapes.
The high frequency of slow loris occurrences in the anthropogenic areas suggests their ability to persist in such spaces. The use of urban spaces as a core component for wildlife has been found worldwide with many other species. One of the most known examples is that of the red fox (Vulpes vulpes), which has widespread controversial studies into both the positive aspects for the fox population as well as the negative impact for the urban ecosystem [37]. Another mesocarnivore that is considered to be synanthropic is the raccoon (Procyon lotor), where one study found high population densities utilising urban open spaces as much as rural open spaces, with some individuals showing a preference for urban sites [38]. In relation to other primate species also from the family Lorisidae, one study found a population of at least 15 grey slender lorises (Loris lydekkerianus) inhabiting an urbanised area in Sri Lanka due to the presence of an inner-city Arboretum that was offered as a refuge [39]. Presence within urban landscapes has also been documented with many other primate species [40]. These new habitats can contribute to perceived stressors for each species. An urban population of the African lesser bushbaby (Galago moholi) was recorded as having significantly higher stress hormone levels to that of its rural counterpart, showing the considerable impact of urbanisation on not only the ecological aspects but also the physiological [41]. Further negative impacts on primates have been recorded in the city of Manaus in Brazil for the pied tamarin (Saguinus bicolor), whereby road incidents have been found to be responsible for the death of approximately 5% of the tamarin’s local population each year [42]. As with these other primates, it is not yet clear which specific traits benefit the Javan slow loris and to what extent when encountering these urban landscapes [14].
What is understood is that due to anthropogenic pressures, our study site is highly fragmented, resulting in open expanses with reduced corridors that impose difficulties and risks on the lorises’ movements due to their arboreal nature. One of the most widespread suggestions to protect biodiversity is to improve connectivity for wildlife by encouraging and forming networks to connect natural areas to each other—a conservation approach that is increasingly vital to mitigate the detrimental effects of climate change to natural habitats [4]. Restoring this connectivity has been successfully implemented in a number of fragmented habitats for various species worldwide through the use of both natural and artificial means such as canopy bridges [43]. A number of these implementations have had long-term monitoring that confirm the ongoing use of the bridges by numerous wildlife [44,45]. In relation to arboreal animals, several species in Singapore were documented as making successful crossings through the use of an artificial rope bridge to travel between forested areas intersected by roads [46]. Further artificial bridges were also proven to be effective in the UK for the hazel dormouse (Muscardinus avellanarius), which is an arboreal species that has been in decline due to the development of human infrastructure such as roads and railways [47]. Therefore, identifying the locations of slow lorises’ home ranges and understanding their habitat suitability and requirements is essential in creating suitable management systems together with the local land users and ultimately preserving the biodiversity value of this landscape [27]. Within the region, several local projects have already begun creating and facilitating corridor systems to connect bamboo patches in the area to allow safe movement for the lorises via the use of chayote frames (Sechium edule) and artificial canopy bridges [24]. Both of these implementations showed successful results for the habitat connectivity of the lorises as well as positive effects for the farmers involved [24], which together with the aforementioned studies highlights both the possibilities and value of human–wildlife design systems. Several of the lorises who had urban land cover comprised within their territory also showed a higher proportion of urban areas in their core area compared to their home range, suggesting that some of the lorises are not only using urban areas as fallback options for expanding into but also as an integral part of their current territory.
From the five different land cover classes within the lorises’ habitat, only urban areas showed a variation between the periods, with a higher usage during the dry periods: more than doubling in some cases. The statistical analysis substantiated this trend for urban land cover in both home ranges and core areas, showing a subtle trend in home ranges and a highly significant trend within core areas. This change of habitat across different periods has also been found in other primate species, such as the chimpanzee (Pan troglodytes verus), whose patterns of habitat use has been found to reflect the availability of resources during the dry and wet periods [48]. The variance found for the Javan slow loris in urban areas suggests a change of behaviour during the dry period, which also correlates with the fluctuation in food availability. As there are periods of decreased food availability during the dry periods, this species is known to increase their reliance during these times upon lower quality foods [30]. Furthermore, the Javan slow loris is documented as having no preference in terms of nutrients and instead opting for a diet strategy of optimising their nutrient intake [30]. This can be particularly burdensome for females, who bear reproductive efforts such as gestation and lactation that require them to consume enough protein and energy. Therefore, during the dry period, this strategy can lead them to adjusting their foraging approach, especially for females. This difference in foraging strategy amongst sexes has also been documented in other species such as the flying fox (Pteropus poliocephalus), where one study in an urban area of Australia found that females consistently foraged over longer distances than males [49]. Further exploration of the sex and climate differences of each individual loris would allow a clearer understanding of whether or not the female lorises in particular are increasing both their foraging and habitat usage of urban areas during the dry periods.
From all periods combined, a total of 3700 feeding events were observed from all of the lorises collectively, with approximately half of these events occurring in bamboo patches (54%). This coupled with their high usage of bamboo patches within their core areas and home ranges further substantiates the Javan slow lorises’ strong preference for bamboo within this mixed landscape—despite it being a human-dominated region. This has been documented in other primates, whereby despite their presence in urban areas, they show preference for green areas within these spaces. A study in the large Brazilian city of Belo Horizonte found that the local population of black-tufted marmosets (Callithrix penicillata) had become mainly limited to city parks and borders of forest fragments, with a strong avoidance of built-up areas [50]. In our study, we found approximately 4% of the total feeding events were observed in urban areas, with a sum of 136 observations. Combined with previous sightings of this species using vegetation along roadsides [24], this highlights evidence of the Javan slow loris not only moving through urban areas but also utilising resources. Interestingly, in terms of the highest count of feeding observations in urban areas across all periods, these belonged to juvenile males, which may help provide a better understanding of which traits allow the loris to persist in urban areas. For example, juvenile male Javan slow lorises have both a higher dispersal rate and further dispersal distance from their mother as opposed to females. Furthermore, juvenile males have higher levels of territorialism as well as larger home ranges compared to females [51]. This juvenile dispersal across urban areas has also been seen in other mammals within anthropogenic landscapes. A study of red squirrels (Sciurus vulgaris) in the city of Turku in Finland found that dispersing individuals would visit different sites in order to compare their quality, often revisiting sites until a suitable location was decided [52]. Interestingly, this study also found that the decision of the site was potentially mainly driven by the food availability and density of other red squirrels as opposed to the land composition. A study on the dispersal behaviour of root voles (Microtus oeconomus) found that preference and competition for high-quality habitats increased the animal’s fitness in terms of reproduction and survival [53]. Another study in Finland on grey wolves (Canis lupus) suggested that juvenile dispersal into human-dominated areas can even influence the animal’s personality traits moving forward [54]. These studies further highlight the physiological effects on animals when residing within urban spaces; therefore, the dispersal of Javan slow lorises in this landscape is open to a wide array of outcomes.
From the analysis of the feeding items within urban areas, the most common items were that of nectar (n = 43) and fruits (n = 27), with 32% and 20% of the urban occurrences, respectively. The latter is notable, since Javan slow lorises rarely eat fruits, suggesting a lack of preferred food in the urban areas. This has been observed in another primate species, the Barbary macaque (Macaca sylvanus), where a study found that a population living in a National Park beside the city of Bejaia in Algeria consumed a greater amount of fruit and seeds as well as more human foods and exotic plants than populations in other sites [55]. The authors also noted that the exploitation of these foods could encourage expansion of the macaque into the city centre where there are already associations with human–macaque conflicts. In our study, we identified 13 individual species for all of the feeding observations within urban areas, with Calliandra calothyrsus being the most frequent species consumed by the lorises for 49 observations. This plant is a large flowering shrub from the Fabaceae family with the nectar of the plant being eaten by the lorises, corroborating nectar as being the most common feeding item in urban areas. Interestingly, this particular plant species can be limited during the dry period, suggesting that the foraging of it may be a reason why some of the lorises are advancing into urban areas where this shrub is grown in private gardens as an ornamental plant. From previous studies, the lorises’ habitat selection has been documented as being positively influenced to a high extent by the presence of Calliandra calothyrsus in their habitat [56,57]. This multi-use plant is a resourceful species with a multitude of benefits in a mixed growing environment such as agroforestry, being particularly useful as a soil nitrogen fixer [58]. This plant species is invasive; therefore, it would be valuable to work together with local farmers in the region to investigate whether an increased use of a native ecological equivalent to this plant on their agricultural land is both possible and beneficial for them and the loris—further encouraging a human–wildlife design system.
We observed terrestriality events 153 times across all land cover types throughout the entire study period, with the largest portion of these occurring in bamboo patches, where the loris can also forage for insects on the ground. Eleven of the terrestriality observations occurred in urban areas, with almost double the terrestriality events in urban areas as opposed to fallow land. As fallow land has a number of similar risks to that of urban areas, such as open exposure to humans and dogs, the higher frequency of the lorises’ terrestriality in urban areas suggests that they potentially offer a larger reward to the loris than that of fallow land. In addition to unfamiliar surfaces and novel complexities, time spent in urban areas carries many risks for the Javan slow loris particularly when descending to the ground [11,25]. Hazards from vehicular traffic and pedestrian traffic as well as exposure to various predators and pollutants are all known threats to their safety and survival [25]. Illegal hunting by humans in particular is one the biggest contributors to the critical endangerment of the Javan slow loris. Additionally, domestic dogs are contributing to their decline, constituting a prevalent risk for lorises when venturing into urban areas. Although this region is mostly inhabited by farmers and communities that are aware of the protected status of the threatened Javan slow loris, including partaking in educational and local events for education and conservation, there is still risk from outsiders taking advantage of lorises venturing into these urban areas [27]. From a human perspective, when wildlife utilises urban areas, they can also cause damage to buildings and property, cause traffic accidents and attack humans or domesticated animals [13]. This can be problematic with Javan slow lorises, as they are a highly territorial and venomous primate. The loris’s bite can also lead to illness and even fatalities in humans [51]. Many wildlife species are also potential carriers of zoonotic viruses and pathogens that can cause human diseases [59]. Javan slow lorises are not known to carry diseases that can be transferred to humans [60].
The local communities partake in educational programmes offered by the project and are aware of the Javan slow loris’s presence in the area as well as the ongoing conservation efforts. Community-based strategies such as these have been developing worldwide over the last three decades, but they come with a number of challenges due to the consideration of the needs of both the species and the community as well as the continued sustainability of the project [61]. A case study in South America on several primate conservation projects found it essential to involve local communities in the design and planning of conservation schemes whilst considering both the political and socioeconomic factors at each unique location [62]. This approach has proved successful for a number of primate conservation projects. A study in India of the Endangered golden langur (Trachypithecus geei) implemented a number of community conservation tools that resulted in the increase in the total population of golden langurs as well as the control of poaching and illegal logging in two local forests [63]. Further studies show compelling evidence of the success of these community-based projects for primates, such as the yellow-tailed woolly monkey (Lagothrix flavicauda) in Peru, which showed population increases and significant increases in densities of infants following community conservation action [64]. Another study in Colombia that implemented community education and empowerment programs to conserve the cotton-top tamarin (Saguinus oedipus) resulted in not only stable economic incomes for the rural community and positive impact for the long-term survival of the tamarin but also a marked reduction in the number of harvested trees as well as a significant reduction in the amount of plastic waste in the area [65].
5. Conclusions
Many wildlife species are being forced to adapt to human-modified areas to depend on their survival and continued reproduction. What is evident from this study is that the Javan slow loris has a strong tendency for natural habitats. Although human land use areas cover a significant portion of the Javan slow loris’s habitat in this region, the lorises still show a strong preference for natural land. Due to the terrestriality risks, arboreal connectivity is a vital aspect for their safety, and this cannot be guaranteed in the existing design within urban areas. This further emphasises the need to consider wildife when developing natural habitats into those of human-managed landscapes. The local villages in the region are considered to be slow-growing and are without plans to encroach further onto the natural areas of land. Javan slow lorises are rarely sold in this area, and local hunting bans are heavily implemented in the region including penalties, particularly as the forest to the west of the study site is a protected area. With the vast majority of the study site already being dominated by humans and their land uses, further awareness and implementation of systems that can conserve the Javan slow loris are vital. For example, a number of sustainable agricultural projects in the area continue to develop [36].
Ecosystems including those of urban areas are evolving and complex systems in which humans play an integral aspect. The value of species-specific knowledge, particularly for primates within urban landscapes, combined with the understanding of anthropogenic disturbance has been highly emphasised in recent studies [40]. With more than 50% of primates facing extinction [6], what is clear is the critical need for a continual awareness of how humans and wildlife can co-exist. This can be implemented with sustainable development plans such as community-based strategies that incorporate the habitat and requirements of affected species with plans put in place to mitigate any negative effects and to support conservation. Measures such as greater connectivity, ensuring suitable food resources and sufficient nutrient availability, as well as habitat suitability should be at the forefront of existing human land use and any future development. Therefore, studies such as this that aim to understand the needs of individual species are vital in implementing such design systems that incorporate their requirements and ultimately in ensuring their conservation.
Supplementary Materials
The following supporting information can be downloaded at https://www.mdpi.com/article/10.3390/land12071349/s1, Table S1. Home range and core area sizes (all lorises, all periods); Table S2. Land cover class ratio results (all lorises, all periods); Table S3. All feeding observations across all land cover classes (all lorises, all periods); Table S4. All terrestriality events within only the urban class (all lorises, all periods).
Author Contributions
Conceptualization, L.K., M.C. and K.A.I.N.; methodology, L.K., M.C., K.H. and K.A.I.N.; software, L.K., M.C., S.R. and A.M.; validation, L.K., M.C., S.R. and A.M.; formal analysis, L.K., M.C., S.R., and A.M.; investigation, M.C. and K.H.; resources, K.A.I.N.; data curation, L.K., M.C., K.H. and K.A.I.N.; writing—original draft preparation, L.K.; writing—review and editing, M.C., M.A.I., S.R., A.M. and K.A.I.N.; visualization, L.K. and M.C.; supervision, M.C., M.A.I. and K.A.I.N.; project administration, M.C., K.H. and K.A.I.N.; funding acquisition, K.A.I.N. All authors have read and agreed to the published version of the manuscript.
Funding
This study was funded by Augsburg Zoo, Cleveland Zoo and Zoo Society, Conservation International Primate Action Fund and Margot Marsh Biodiversity Fund, Disney Worldwide Conservation Fund, International Primate Protection League, Lee Richardson Zoo, Memphis Zoo, Mohamed bin al Zayed Species Conservation Fund (152511813), Moody Gardens Zoo, National Geographic (GENFNE101-13), NaturZoo Rhein, Omaha’s Henry Doorly Zoo, People’s Trust for Endangered Species, Plumploris E.V., Shaldon Wildlife Trust, Sophie Danforth Conservation Biology Fund and Zoo De Lille.
Data Availability Statement
The data presented in this study are available in the Supplementary Materials.
Acknowledgments
We thank the Little Fireface Project field team for their help in radio tracking slow lorises, data collection, and aid in local logistics. We thank the Oxford Brookes University Loris Lab for their useful comments on previous versions of this paper.
Conflicts of Interest
The authors declare no conflict of interest. The funders had no role in the design of the study; in the collection, analyses, or interpretation of data; in the writing of the manuscript; or in the decision to publish the results.
Ethical Note
All research was approved by the Animal Care Subcommittee of Oxford Brookes University number OBURASC0911 and adhered to the ASAB/ABS Guidelines for the Use of Animals in Research. All necessary research permits were obtained from the Indonesian government. All research adhered to the legal and ethical guidelines of the Indonesian Institute of Sciences, Department of Wildlife and Department of Forestry.
Appendix A
Table A1.
Confusion Matrix Results for 2019 Land Cover Classification.
Table A1.
Confusion Matrix Results for 2019 Land Cover Classification.
| Ground Truth (Reference Data) | |||||||||
|---|---|---|---|---|---|---|---|---|---|
| Class | Agriculture | Bamboo | Urban | Fallow Land | Forest | Shade Gardens | Total Points | Producer’s Accuracy | |
| Random Forest Classification | Agriculture | 102 | 2 | 0 | 1 | 0 | 5 | 110 | 93% |
| Bamboo | 4 | 99 | 0 | 1 | 0 | 11 | 115 | 86% | |
| Urban | 1 | 0 | 54 | 2 | 0 | 1 | 58 | 93% | |
| Fallow Land | 4 | 0 | 0 | 53 | 0 | 0 | 57 | 93% | |
| Forest | 2 | 0 | 0 | 0 | 37 | 0 | 39 | 95% | |
| Shade Gardens | 0 | 2 | 0 | 0 | 0 | 19 | 21 | 90% | |
| Total Points | 113 | 103 | 54 | 57 | 37 | 36 | 400 | ||
| User Accuracy | 90% | 96% | 100% | 93% | 100% | 53% | |||
Table A2.
Median and interquartile range of home range and core area sizes of Javan slow lorises from May 2018 to April 2020 in the municipality of Cipaganti.
Table A2.
Median and interquartile range of home range and core area sizes of Javan slow lorises from May 2018 to April 2020 in the municipality of Cipaganti.
| Period | Sex | Home Range Size (ha) | Core Area Size (ha) |
|---|---|---|---|
| Dry | F | 2.6 (1.1–3.4) | 0.7 (0.3–1.0) |
| M | 5.9 (4.0–10.3) | 1.7 (1.1–2.9) | |
| Total | 4.0 (2.5–6.0) | 1.1 (0.6–1.9) | |
| Wet | F | 4.3 (2.4–6.2) | 1.3 (0.6–1.8) |
| M | 5.6 (4.5–6.3) | 1.4 (1.0–1.9) | |
| Total | 5.2 (2.7–6.3) | 1.4 (0.7–1.9) | |
| Total | F | 2.9 (2.0–4.4) | 0.9 (5.4–1.4) |
| M | 5.8 (4.1–8.9) | 1.5 (1.1–2.6) | |
| Total | 4.4 (2.5–6.3) | 1.2 (0.7–1.9) |
References
- Odum, E.P. Fundamentals of Ecology, 3rd ed.; W.B. Saunders Co.: Philadelphia, PA, USA, 1971. [Google Scholar]
- Hall, L.S.; Krausman, P.R.; Morrison, M.L. The habitat concept and a plea for standard terminology. Wildl. Soc. Bull. 1997, 25, 173–182. [Google Scholar]
- Krausman, P.R.; Morrison, M.L. Another plea for standard terminology. J. Wildl. Manag. 2016, 80, 1143–1144. [Google Scholar] [CrossRef]
- Popescu, O.C.; Tache, A.V.; Petrișor, A.I. Methodology for identifying ecological corridors: A spatial planning perspective. Land 2022, 11, 1013. [Google Scholar] [CrossRef]
- Sodhi, N.S.; Koh, L.P.; Brook, B.W.; Ng, P.K. Southeast Asian biodiversity: An impending disaster. Trends Ecol. Evol. 2004, 19, 654–660. [Google Scholar] [CrossRef]
- Estrada, A.; Garber, P.A.; Rylands, A.B.; Roos, C.; Fernandez-Duque, E.; Di Fiore, A.; Nekaris, K.A.I.; Nijman, V.; Heymann, E.W.; Lambert, J.E.; et al. Impending extinction crisis of the world’s primates: Why primates matter. Sci. Adv. 2017, 3, e1600946. [Google Scholar] [CrossRef]
- Weeks, J.R. Defining Urban Areas. In Remote Sensing of Urban and Suburban Areas; Remote Sensing and Digital Image Processing; Rashed, T., Jürgens, C., Eds.; Springer: Dordrecht, The Netherlands, 2010; Volume 10. [Google Scholar] [CrossRef]
- Gao, J.; O’Neill, B.C. Mapping global urban land for the 21st century with data-driven simulations and Shared Socioeconomic Pathways. Nat. Commun. 2020, 11, 2302. [Google Scholar] [CrossRef]
- Ahmed, Z.; Wang, Z.; Ali, S. Investigating the non-linear relationship between urbanization and CO2 emissions: An empirical analysis. Air Qual. Atmos. Health 2019, 12, 945–953. [Google Scholar] [CrossRef]
- Lowry, H.; Lill, A.; Wong, B.B. Behavioural responses of wildlife to urban environments. Biol. Rev. 2013, 88, 537–549. [Google Scholar] [CrossRef]
- Grimm, N.B.; Faeth, S.H.; Golubiewski, N.E.; Redman, C.L.; Wu, J.; Bai, X.; Briggs, J.M. Global change and the ecology of cities. Science 2008, 319, 756–760. [Google Scholar] [CrossRef] [PubMed]
- Oke, T.R. The energetic basis of the urban heat island. Q.J.R. Meteorol. Soc. 1982, 108, 1–24. [Google Scholar] [CrossRef]
- Bateman, P.W.; Fleming, P.A. Urban carnivores. J. Zool. 2012, 287, 1–23. [Google Scholar] [CrossRef]
- Santini, L.; González-Suárez, M.; Russo, D.; Gonzalez-Voyer, A.; von Hardenberg, A.; Ancillotto, L. One strategy does not fit all: Determinants of urban adaptation in mammals. Ecol. Lett. 2019, 22, 365–376. [Google Scholar] [CrossRef] [PubMed]
- Ritzel, K.; Gallo, T. Behavior Change in Urban Mammals: A Systematic Review. Front. Ecol. Evol. 2020, 8, 576665. [Google Scholar] [CrossRef]
- Caspi, T.; Johnson, J.R.; Lambert, M.R.; Schell, C.J.; Sih, A. Behavioral Plasticity Can Facilitate Evolution in Urban Environments. Trends Ecol. Evol. 2022, 37, 1092–1103. [Google Scholar] [CrossRef] [PubMed]
- Alter, E.S.; Tariq, L.; Creed, J.K.; Megafu, E. Evolutionary responses of marine organisms to urbanized seascapes. Evol. Appl. 2020, 14, 210–232. [Google Scholar] [CrossRef] [PubMed]
- Garroway, C.J.; Sheldon, B.C. Urban behavioural adaptation. Mol. Ecol. 2013, 22, 3430–3432. [Google Scholar] [CrossRef]
- Hockings, K.J.; McLennan, M.R.; Carvalho, S.; Ancrenaz, M.; Bobe, R.; Byrne, R.W.; Dunbar, R.I.; Matsuzawa, T.; McGrew, W.C.; Williamson, E.A.; et al. Apes in the Anthropocene: Flexibility and survival. Trends Ecol. Evol. 2015, 30, 215–222. [Google Scholar] [CrossRef]
- Mittermeier, R.A.; Reuter, K.E.; Rylands, A.B.; Jerusalinsky, L.; Schwitzer, C.; Strien, K.B.; Ratsimbazafy, J.; Humle, T. Primates in Peril the World’s 25 Most Endangered Primates 2022–2023, IUCN/SSC Primate Specialist Group (PSG), 2022nd ed.; International Primatological Society (IPS): Washington, DC, USA, 2022. [Google Scholar]
- Barrett, M.; Campera, M.; Morcatty, T.Q.; Weldon, A.V.; Hedger, K.; Maynard, K.Q.; Imron, M.A.; Nekaris, K.A.I. Risky business: The function of play in a venomous mammal—The Javan slow loris (Nycticebus javanicus). Toxins 2021, 13, 318. [Google Scholar] [CrossRef]
- Sodik, M.; Pudyatmoko, S.; Yuwono, P.S.H.; Tafrichan, M.; Imron, M.A. Better providers of habitat for Javan slow loris (Nycticebus javanicus E. Geoffroy 1812): A species distribution modeling approach in Central Java, Indonesia. Biodiversitas 2020, 21, 1890–1900. [Google Scholar]
- Al-Razi, H.; Maria, M.; Bin Muzaffar, S. Mortality of primates due to roads and power lines in two forest patches in Bangladesh. Zoologia 2019, 36, e33540. [Google Scholar] [CrossRef]
- Birot, H.; Campera, M.; Imron, M.; Nekaris, K.A.I. Artificial canopy bridges improve connectivity in fragmented landscapes: The case of Javan slow lorises in an agroforest environment. Am. J. Primatol. 2020, 82, e23076. [Google Scholar] [CrossRef] [PubMed]
- Eppley, T.M.; Hoeks, S.; Chapman, C.A.; Ganzhorn, J.U.; Hall, K.; Owen, M.A.; Adams, D.B.; Allgas, N.; Amato, K.R.; Andriamahaihavana, M.; et al. Factors influencing terrestriality in primates of the Americas and Madagascar. Proc. Natl. Acad. Sci. USA 2022, 119, e2121105119. [Google Scholar] [CrossRef] [PubMed]
- Nijman, V.; Spaan, D.; Rode-Margono, E.J.; Nekaris, K.A.I. Changes in the primate trade in Indonesian wildlife markets over a 25-year period: Fewer apes and langurs, more macaques and slow lorises. Am. J. Primatol. 2017, 79, e22517. [Google Scholar] [CrossRef]
- Nekaris, K.A.I.; Poindexter, S.A.; Reinhardt, K.D.; Sigaud, M.; Cabana, F.; Wirdateti, W.; Nijman, V. Coexistence between Javan slow lorises (Nycticebus javanicus) and humans in a dynamic agroforestry landscape in West Java, Indonesia. Int. J. Primatol. 2017, 38, 303–320. [Google Scholar] [CrossRef]
- Maryati, S.; Firman, T.; Siti Humaira, A.N.; Febriani, Y.T. Benefit distribution of community-based infrastructure: Agricultural roads in Indonesia. Sustainability 2020, 12, 2085. [Google Scholar] [CrossRef]
- Campera, M.; Budiadi, B.; Adinda, E.; Ahmad, N.; Balestri, M.; Hedger, K.; Imron, M.A.; Manson, S.; Nijman, V.; Nekaris, K.A.I. Fostering a wildlife-friendly program for sustainable coffee farming: The case of small-holder farmers in Indonesia. Land 2021, 10, 121. [Google Scholar] [CrossRef]
- Cabana, F.; Dierenfeld, E.; Wirdateti, W.; Donati, G.; Nekaris, K.A.I. The seasonal feeding ecology of the Javan slow loris (Nycticebus javanicus). Am. J. Phys. Anthropol. 2017, 162, 768–781. [Google Scholar] [CrossRef]
- Seaman, D.E.; Powell, R.A. An evaluation of the accuracy of Kernel Density Estimators for Home Range Analysis. Ecology 1996, 77, 2075–2085. [Google Scholar] [CrossRef]
- Nekaris, K.A.I.; Munds, R.; Pimley, E. Trapping, Collaring and Monitoring the Lorisinae of Asia (Loris, Nycticebus) and Perodicticinae (Arctocebus, Perodicticus) of Africa. In Evolution, Ecology and Conservation of Lorises and Pottos; Cambridge Studies in Biological and Evolutionary Anthropology; Nekaris, K.A.I., Burrows, A., Eds.; Cambridge University Press: Cambridge, UK, 2020; pp. 279–294. [Google Scholar]
- Altmann, J. Observational study of behaviour: Sampling methods. Behaviour 1974, 49, 227–266. [Google Scholar] [CrossRef] [PubMed]
- Horne, J.S.; Garton, E.O. Likelihood Cross-Validation versus Least Squares Cross-Validation for choosing the smoothing parameter in Kernel Home-Range Analysis. J. Wildl. Manag. 2006, 70, 641–648. [Google Scholar] [CrossRef]
- Brooks, M.E.; Kristensen, K.; van Benthem, K.J.; Magnusson, A.; Berg, C.W.; Nielsen, A.; Skaug, H.J.; Maechler, M.; Bolker, B.M. glmmTMB balances speed and flexibility among packages for zero-inflated Generalized Linear Mixed Modeling. R J. 2017, 9, 378–400. [Google Scholar] [CrossRef]
- Hartig, J. DHARMa: Residual Diagnostics for Hierarchical (Multi-Level/Mixed) Regression Models. Available online: https://cran.r-project.org/web/packages/DHARMa (accessed on 24 April 2023).
- Gloor, S.; Bontadina, F.; Hegglin, D.; Deplazes, P.; Breitenmoser, U. The rise of urban fox population in Switzerland. Mammal. Biol. 2001, 66, 155–164. [Google Scholar]
- Graser, W.H.; Gehrt, S.D., III; Hungerford, L.L.; Anchor, C. Variation in demographic patterns and population structure of raccoons across an urban landscape. J. Wildl. Manag. 2012, 76, 976–986. [Google Scholar] [CrossRef]
- Weerarathne, W.A.P.P.D.; Wijesinghe, M. R, The Popham Arboretum: A refuge for grey slender loris (Loris lydekkerianus) in an urbanized landscape in Sri Lanka. WILDLANKA 2019, 7, 1–12. [Google Scholar]
- Thatcher, H.R.; Downs, C.T.; Koyama, N.F. Primates in the Urban Mosaic: Terminology, Flexibility, and Management. In Primates in Anthropogenic Landscapes; Developments in Primatology: Progress and Prospects; McKinney, T., Waters, S., Rodrigues, M.A., Eds.; Springer: Cham, Switzerland, 2023. [Google Scholar]
- Scheun, J.; Bennett, N.C.; Ganswindt, A.; Nowack, J. The hustle and bustle of city life: Monitoring the effects of urbanisation in the African lesser bushbaby. Sci. Nat. 2015, 102, 57. [Google Scholar] [CrossRef]
- Gordo, M.; Calleia, F.O.; Vasconcelos, S.A.; Leite, J.J.F.; Ferrari, S.F. The Challenges of Survival in a Concrete Jungle: Conservation of the Pied Tamarin (Saguinus bicolor) in the Urban Landscape of Manaus, Brazil. In Primates in Fragments; Developments in Primatology: Progress and Prospects; Marsh, L., Chapman, C., Eds.; Springer: New York, NY, USA, 2013. [Google Scholar]
- Gregory, T.; Carrasco-Rueda, F.; Alonso, A.; Kolowski, J.; Diechmann, J.L. Natural canopy bridges effectively mitigate tropical forest fragmentation for arboreal mammals. Sci. Rep. 2017, 7, 3892. [Google Scholar] [CrossRef]
- Hidalgo-Mihart, M.G.; González-Gallina, A.; Iglesias-Hernández, J.A.; Mendoza-Cárdenas, N.; Pérez-Garduza, F.; Oliveras de Ita, A.; Chacón-Hernández, A.; Vázquez-Zúñiga, O. Mammal use of canopy bridges along the Nuevo Xcan-Playa del Carmen highway, Quintana Roo, Mexico. Folia Primatol. 2022, 93, 371–381. [Google Scholar] [CrossRef]
- Flatt, E.; Basto, A.; Pinto, C.; Ortiz, J.; Navarro, K.; Reed, N.; Brumberg, H.; Chaverri, M.H.; Whitworth, A. Arboreal wildlife bridges in the tropical rainforest of Costa Rica’s Osa Peninsula. Folia Primatol. 2022, 93, 419–435. [Google Scholar] [CrossRef]
- Ow, S.; Chan, S.; Toh, Y.H.; Chan, S.H.; Lakshminarayanan, J.; Jabbar, S.; Ang, A.; Loo, A. Bridging the gap: Assessing the effectiveness of rope bridges for wildlife in Singapore. Folia Primatol. 2022, 93, 287–298. [Google Scholar] [CrossRef]
- Moffat, D.; White, I.; Béga, S.; Aburrow, K. Structural re-design of the Animex Wildlife Bridge for the Hazel Dormouse (Muscardinus avellanarius): Lessons learnt from two connectivity mitigation case studies in the UK. Folia Primatol. 2022, 93, 205–216. [Google Scholar] [CrossRef]
- Bryson-Morrison, N.; Tzanopoulos, J.; Matsuzawa, T.; Humle, T. Activity and habitat use of chimpanzees (Pan troglodytes verus) in the anthropogenic landscape of Bossou, Guinea, West Africa. Int. J. Primatol. 2017, 38, 282–302. [Google Scholar] [CrossRef] [PubMed]
- Meade, J.; Martin, J.M.; Welbergen, J.A. Fast food in the city? Nomadic flying-foxes commute less and hang around for longer in urban areas. Behav. Ecol. 2021, 32, 1151–1162. [Google Scholar] [CrossRef]
- Teixeira, B.; Hirsch, A.; Goulart, V.D.L.R.; Passos, L.; Teixeira, C.P.; James, P.; Young, R. Good neighbours: Distribution of black-tufted marmoset (Callithrix penicillata) in an urban environment. Wildl. Res. 2016, 42, 579–589. [Google Scholar] [CrossRef]
- Nekaris, K.A.I.; Campera, M.; Nijman, V.; Birot, H.; Rode-Margono, E.J.; Fry, B.G.; Weldon, A.; Wirdateti, W.; Imron, M.A. Slow lorises use venom as a weapon in intraspecific competition. Curr. Biol. 2020, 30, R1252–R1253. [Google Scholar] [CrossRef]
- Hämäläinen, S.; Fey, K.; Selonen, V. Search strategies in rural and urban environment during natal dispersal of the red squirrel. Behav. Ecol. Sociobiol. 2020, 74, 124. [Google Scholar] [CrossRef]
- Rémy, A.; Le Galliard, J.-F.; Gundersen, G.; Steen, H.; Andreassen, H.P. Effects of individual condition and habitat quality on natal dispersal behaviour in a small rodent. J. An. Ecol. 2011, 80, 929–937. [Google Scholar] [CrossRef]
- Barry, T.; Gurarie, E.; Cheraghi, F.; Kojola, I.; Fagan, W.F. Does dispersal make the heart grow bolder? Avoidance of anthropogenic habitat elements across wolf life history. Anim. Behav. 2020, 166, 219–231. [Google Scholar] [CrossRef]
- Maibeche, Y.; Moali, A.; Yahi, N.; Ménard, N. Is diet flexibility an adaptive life trait for relictual and peri-urban populations of the endangered primate Macaca sylvanus? PLoS ONE 2015, 10, e0118596. [Google Scholar] [CrossRef]
- Fransson, L. Fine Scale Habitat and Movement Patterns of Javan Slow Loris (Nycticebus javanicus) in Cipaganti, West Java, Indonesia. Master’s Thesis, Uppsala University, Uppsala, Sweden, 2018. [Google Scholar]
- Moore, R.S. Ethics, Ecology and Evolution of Indonesian Slow Lorises (Nycticebus spp.) Rescued from the Pet Trade. Master’s Thesis, Oxford Brookes University, Oxford, UK, 2012. [Google Scholar]
- Chamberlain, J.R. Calliandra calothyrsus: An Agroforestry Tree for the Humid Tropics; Tropical Forestry Papers No 40; Oxford Forestry Institute: Oxford, UK, 2001. [Google Scholar]
- Camp, J.V.; Desvars-Larrive, A.; Nowotny, N.; Walzer, C. Monitoring urban zoonotic virus activity: Are city rats a promising surveillance tool for emerging viruses? Viruses 2022, 14, 1516. [Google Scholar] [CrossRef]
- Morcatty, T.Q.; Pereyra, P.E.R.; Ardiansyah, A.; Imron, M.A.; Hedger, K.; Campera, M.; Nekaris, K.A.-I.; Nijman, V. Risk of viral infectious diseases from live bats, primates, rodents and carnivores for sale in Indonesian wildlife markets. Viruses 2022, 14, 2756. [Google Scholar] [CrossRef]
- Horwich, R.H.; Lyon, J. Community conservation: Practitioners’ answer to critics. Oryx 2007, 41, 376–385. [Google Scholar] [CrossRef]
- Abondano, L.A.; Webber, A.D.; Valencia, L.M.; Gómez-Posada, C.; Hending, D.; Cortes, F.A.; Fuentes, N. Community-Based Strategies to Promote Primate Conservation in Agricultural Landscapes: Lessons Learned from Case Studies in South America. In Primates in Anthropogenic Landscapes; Developments in Primatology: Progress and Prospects; McKinney, T., Waters, S., Rodrigues, M.A., Eds.; Springer: Cham, Switzerland, 2023. [Google Scholar]
- Horwich, R.H.; Islari, R.; Bose, A.; Dey, B.; Moshahary, M.; Dey, N.K.; Das, R.; Lyon, J. Community protection of the Manas Biosphere Reserve in Assam, India, and the Endangered golden langur Trachypithecus geei. Oryx 2010, 44, 252–260. [Google Scholar] [CrossRef]
- Shanee, S.; Shanee, N. 2015. Measuring success in a community conservation project: Local population increase in a critically endangered primate, the yellow-tailed woolly monkey (Lagothrix flavicauda) at la Esperanza, northeastern Peru. Trop. Conserv. Sci. 2015, 8, 169–186. [Google Scholar]
- Savage, A.; Guillen, R.; Lamilla, I.; Soto, L. Developing an effective community conservation program for cotton-top tamarins (Saguinus oedipus) in Colombia. Am. J. Primatol. 2010, 72, 379–390. [Google Scholar] [CrossRef] [PubMed]


Disclaimer/Publisher’s Note: The statements, opinions and data contained in all publications are solely those of the individual author(s) and contributor(s) and not of MDPI and/or the editor(s). MDPI and/or the editor(s) disclaim responsibility for any injury to people or property resulting from any ideas, methods, instructions or products referred to in the content. |
© 2023 by the authors. Licensee MDPI, Basel, Switzerland. This article is an open access article distributed under the terms and conditions of the Creative Commons Attribution (CC BY) license (https://creativecommons.org/licenses/by/4.0/).