Article

Changes in the Occurrence of Five Invasive Plant Species in Different Ecosystem Types between 2009–2018 in Hungary

by
Márton Bence Balogh
1,
Miklós Kertész
2,
Katalin Török
2,3,
Georgina Veronika Visztra
1 and
Péter Szilassi
1,*
1
Department of Geoinformatics, Physical and Environmental Geography, University of Szeged, H-6720 Szeged, Hungary
2
Centre for Ecological Research, Institute of Ecology and Botany, H-2163 Vácrátót, Hungary
3
National Laboratory for Health Security, Centre for Ecological Research, 29 Karolina Street, H-1113 Budapest, Hungary
*
Author to whom correspondence should be addressed.
Land 2023, 12(9), 1784; https://doi.org/10.3390/land12091784
Submission received: 22 June 2023 / Revised: 9 September 2023 / Accepted: 12 September 2023 / Published: 14 September 2023
(This article belongs to the Special Issue Species Vulnerability and Habitat Loss)

Abstract

:
Modelling and analysis of spatiotemporal characteristics of plant invasion can help in mapping and predicting the spread of invasive plants. The aim of our research was to investigate the spatiotemporal variability of five common invasive plant species (Ailanthus altissima, Asclepias syriaca, Elaeagnus angustifolia, Robinia pseudoacacia, and Solidago spp.) within different land cover (ecosystem)-type categories. The basis of the study was the National Geospatial Database of Invasive Plants (NGDIP) of Hungary, and the ecosystem types of the Ecosystem Map of Hungary (EMH). The GIS-based analysis of the detailed occurrence database of the invasive species (NGDIP) and the thematic land-cover (ecosystem)-type maps (EMH) examined allow us to answer the question of in which habitat types the occurrence and distribution of the given invasive plant has stagnated, decreased, or increased between 2006 and 2018. We developed a methodology with relevant data sources and demonstrated invasion variation, which can be used for future management planning and invasive biology research. Our results show that Asclepias syriaca and Robinia pseudoacacia are increasingly threatening grasslands and are also spreading more intensively in complex cultivated areas. The occurrences of Ailanthus altissima and Asclepias syriaca are declining in built-up areas due to the increasingly extreme environmental conditions of cities or modified urban planning. The spread of Solidago spp. is increasingly common in wetlands, threatening the biodiversity of floodplain (riparian) vegetation.

1. Introduction

The dramatic spread of invasive plant species is a worldwide problem for nature conservation. In addition to causing the decline in the abundance of native species [1], invasive plants often pose a threat to human health due to their allergenic characteristics [2] and, in many cases, are reasons for soil degradation [3,4].
The extension of biological invasion can be extremely rapid, causing changes in ecosystem functions and conditions over a few years; this effect might fade with time in the long-term [1]. The maps of the National Geospatial Database of Invasive Plants (NGDIP) of Hungary, based on the Land Use and Coverage Area Frame Survey (LUCAS) point-cover photo data collections (2009, 2012, 2015, and 2018), showed significant changes in the extent of invasive plant distribution of Hungary [5]. Ecosystem types mean land cover and habitat types with functions related to ecosystem services.
Research to date has already identified major anthropogenic processes that influence the distribution and spread of invasive plants. According to a study [6], various linear landscape features (railways, roads, watercourses, ecological corridors), the National Ecological Network, and NATURA 2000 sites may provide potential dispersal routes for certain invasive plants. In addition, there is a significant statistical connection between recent land-cover changes and the distribution of specific invasive species [7,8].
GIS (Geographic Information System) tools offer excellent opportunities to detect and analyse these very rapid vegetation dynamics. It is possible to study the spreading trends of invasive plant species over the last decade and predict potentially threatened habitat types.
The detailed thematic Ecosystem Map of Hungary (EMH), covering the whole territory of Hungary, has a high spatial resolution (20 × 20 m raster size as the minimal mapping unit). It offers a potential basis to evaluate the spreading trends in relation to ecosystem types when overlaid with the distribution of invasive plants of each type in Hungary [9,10,11].
In our research, we will answer the following questions based on changes between 2009–2012, 2012–2015, and 2015–2018 in the occurrence data of the five examined noxious invasive plants:
  • What has been the trend in the level of invasion of different types of land cover (ecosystems) in Hungary between 2006 and 2018?
  • Which types of ecosystems of conservation importance are most threatened by the biological invasion of the studied species?
To answer these questions, we calculated the proportions of invaded LUCAS points relative to the total LUCAS points for each year (2009, 2012, 2015, and 2018) and, then, determined the proportion in the distribution of invasion for each ecosystem type for 2009, 2012, 2015, and 2018, respectively. Based on the frequency of invasion of these four samplings in a ten-year period, we were able to identify those land-cover (ecosystem) types where the occurrence of the species in question changed significantly between 2009 and 2018.

2. Materials and Methods

2.1. Studied Invasive Species

Approximately 70 species (about 3%) of Hungarian flora are invasive weed species [12]. Included in the list are 24 terrestrial plant species (European Alien Species Information Network) [13] of the most dangerous invasive species with the highest risk of spreading compiled by the European Union [14,15].
Ailanthus altissima (Mill.) Swingle (tree of heaven) originates in China and the Korean Peninsula. It was introduced in Hungary in the 19th century [16] and was planted as a forest in the late 20th century [17]. Specialists originally planted it as an ornamental tree because of its undemanding nature and drought tolerance [18]. It prefers sandy soils but is widely spread also in disturbed habitats, urban areas, and along roadsides. Ailanthus altissima has the ability to resprout and that makes it difficult to eradicate. In Hungary, its allelopathic compounds in the soil make it particularly harmful to biodiversity [19].
Asclepias syriaca L. (common milkweed) is a plant of Canadian origin [20], which was initially cultivated in Hungary for its beneficial effects. It is a melliferous plant as a homoeopathic remedy, and its pod is known in floriculture. It has several physiological characteristics that support its success. Asclepias syriaca is perennial and capable of reproduction by rhizomes [20], and it has allelopathic effects. All parts of the plant are abundant in white milk, which is toxic [21,22]. Results from a study [23] show a clear relationship between the physical properties (soil texture) of the habitat and the occurrence of Asclepias syriaca.
In addition to physical properties, the current land cover of the area is also a factor that significantly influences the presence of Asclepias syriaca [23,24]. The areas that are most at risk of its spread in Hungary are grasslands and woody environments on sandy or other coarse-textured soils, especially where habitats are degraded or the topsoil is subjected to disturbance (e.g., logging and road construction) [23]. Mowing or any other means of stem removal only results in intense regrowth of the plant from the rhizomes next year [20,21]. In Hungary, its spread accelerated mainly after the collapse of socialism, due to land-use conversions and the decline of grazing livestock [23].
The Elaeagnus angustifolia L. (Russian olive) is native to parts of Asia and was brought to Hungary during the Ottoman period. Due to its tolerance, nitrogen fixation, and excellent regeneration capacity, it was planted for erosion control, but also for reclamation plantations, field protection forest strips, roadside windbreaks, lowland forest edges, live vegetation, and highway green strips. It can provide shade for light-demanding and rare protected species, and its nitrogen-fixing radicle helps weeds establish themselves [25].
The Robinia pseudoacacia L. (black locust) is originally from the eastern part of North America. The first large Robinia pseudoacacia forest areas were planted in the early 18th century, after which it became the most common tree species in Hungary [26]. Today, its largest populations occur in the sandy areas of the Great Hungarian Plain. Robinia pseudoacacia holds notable economic value [27], as it is an excellent firewood and honey-producing plant and is often planted in vineyards as a vine stalk. Robinia pseudoacacia was mainly used to bind moving sand dunes and gullies but also to cover barren hillsides. Robinia pseudoacacia enriches the nitrogen content of the soil with the help of the Rhizobium bacteria in their root systems, transforming the species composition of the grassland. Its deciduous foliage has an allelopathic effect [27]. It is the only species in this study that is deliberately planted in plantation forestry (Figure 1).
Solidago spp., S. canadensis, and S. gigantea (goldenrod species) are native to North America and were introduced to Hungary in the 19th century [28,29]. Solidago spp. tends to spread characteristically on loose, not too moist, and rapidly warming soils [29,30,31]
The two Solidago spp. are difficult to distinguish in the field when not in flower and, due to their similar behaviours, are treated together. Solidago spp. are frequent invasive plants in disturbed areas, for example in clearcut areas, near pipelines, in empty fields, and along roads mainly in the Western part of Hungary [30,32]. Due to neglected mowing and the cessation of grazing, Solidago spp. can easily appear on abandoned land in the absence of other competitors, and its eradication is mainly recommended by chemical methods [28].
Solidago spp. is an excellent melliferous plant and is used as a medicinal herb [33], but its pollen contains allergenic substances [29,30]. Its rapid spread has a direct negative impact on native vegetation [31]. Solidago spp. forms homogeneous patches and its roots prevent soil nitrification processes [29], thus hindering the growth and development of native plants [34].
Overall, the findings suggest that invasive species have detrimental biodiversity-related effects and ecological consequences. The spread of Ailanthus altissima, Robinia pseudoacacia [6,27], and Elaeagnus angustifolia [25] cause soil degradation because of nitrogen enrichment in the soil [4,35], and the pollen of Solidago spp. [28] can cause pollen allergy. All these species threaten the biodiversity of the Carpathian Basin.
Among the plant species that we have studied are some that cause yield loss in agricultural areas (e.g., Asclepias syriaca). Non-native species could reshape the whole landscape structure and its services [36]. The environmental damage caused by these plants decreases the provisioning and regulating of ecosystem services.

2.2. Used Databases

2.2.1. National Geospatial Database of Invasive Plants (NGDIP) of Hungary

The National Geospatial Database of Invasive Plants (referred to in later stages as NGDIP) of Hungary is part of the invasive plant monitoring initiative of the Department of Geoinformatics, Physical, and Environmental Geography at the University of Szeged, based on the LUCAS point dataset [37]. The LUCAS (Land Use/Cover Area Survey) data collection project is a survey of land use, land cover, and agricultural statistics for all European Union member states [5,38]. Every three years, it provides freely available data [6] on the land cover, land use, and, in some cases, soil type of field-survey points [23] located at an average distance of 3 km from each other. For each predefined, systematically positioned LUCAS field-survey point, identified by geographic coordinates, photographs are taken by handheld GPS geodetic survey equipment in the direction of the four cardinal points (and of the point itself) [38]. The surveyor indicates the actual position of the LUCAS survey points by photographic images with GPS coordinates accurate to a few meters. The database provides an excellent opportunity to produce point-based vegetation maps and to assess the invasion infestation of the area around the points [6,23].
The investigated invasive plants were identified by the ecologists of the Department of Ecology of the University of Szeged through visual interpretation of more than 100,000 LUCAS photos from all the field observation points of 2009, 2012, 2015, and 2018 of LUCAS surveys in Hungary. The analysts aimed to identify invasive plants based on their phenological (morphological) characteristics [5,23].
A LUCAS point was marked as invaded with a given plant if at least one of the five photographs taken at a given LUCAS point showed an organ of the plant (flower, leaf, seedpod, etc.). If there were no identifiable invasive plant species in the photo, that LUCAS point was marked as noninvaded. During visual interpretation, carried out by biologists with field experience, great care was taken to only register invasive plants in the picture when the identification was certain. This means invaded points can be rather underrepresented.
Regarding the reliability and usability of the LUCAS field-survey database, it is important to point out that 95% of the field photographs were taken within the vegetation period (April to August).
Each species has a different spatial distribution, and, in some cases, we managed to identify some typical invaded landscapes; e.g., Asclepias syriaca tends to spread more easily in sandy soils of Central Hungary (Figure 1). The figures show the aggregated invaded points of the four (2009, 2012, 2015, and 2018) surveys per species.
The 2009, 2012, 2015, and 2018 LUCAS data are suitable for time-series analysis of biological invasion of easily identifiable species. The country-scale proportion of invaded and noninvaded LUCAS points varies significantly between species and years (Table 1).
The fluctuations between the national-level occurrence of the investigated species per year beside their change in cover may result partly from the fact that LUCAS points could not be recovered with a high precision each year, and the accuracy of the field GPS measurements conducted every three years have a certain error. To reduce error as much as possible, the field GSP coordinates were used for the analyses instead of the regularly distributed LUCAS designation points.
Therefore, despite the mentioned inconsistency, the database is well suited to analyse the level of invasion (occurrence of the investigated invasive plants) within habitat types, as the national cover of the high number of LUCAS survey points (4600–5000 point/year) can level out the eventual shortfalls of the database.

2.2.2. Ecosystem Map of Hungary (EMH)

The Ecosystem Map of Hungary (referred to in later stages as EMH) was published in 2018 as an open-access land-cover database of Hungary. This mapping service is part of the National Ecosystem Services Mapping and Evaluation Program, integrated into the European Union-wide Mapping and Assessment of Ecosystems and their Services (MAES-HU) initiative [11,39,40].
EMH shows the ecosystem types of Hungary in detail at a fine scale, providing an excellent tool for conservation biology, landscape ecology, and geographic research [39]. The 20 × 20 m raster resolution base map is a hierarchical system, corresponding to MAES Level 2 types of ecosystems or habitats [41]. The map is based on an automated classification of Sentinel optical and radar satellite images using the random forest algorithm. After automated image processing, the resulting map was then intersected with other highly detailed datasets, like the Land Parcel Identification System (LPIS-HU), the Hungarian Habitat Mapping Database (MÉTA), the DoSoRemi soil database, forestry, hydrographic databases, and other datasets were merged to create a topographic cover database with a spatial resolution and thematic detail that is unique in Hungary. The map has been validated at more than 1000 field points [10,40].
EMH shows the characteristics of the landscape structure on a sufficiently fine scale, as it even shows the road surfaces and the linear landscape features of green and blue infrastructure.
For the analysis, we have regrouped EMH Level 3 ecosystem subtypes to Level 2 ecosystem types (Table A1). The aim was to ensure that they occur in statistically assessable quantities within each polygon and to reduce the likelihood of autocorrelation between them.

2.3. GIS and Statistical Methods

The inclusion of a vector data layer, which consisted of over ten million polygons, was derived from the Ecosystem Map of Hungary, initially in raster format. An organization of the National Geospatial Database of Invasive Plants (NGDIP) points by species was necessary, differentiating whether they were invaded or noninvaded with the given species.
We conducted a spatial intersection between the polygons of EMH and the LUCAS points from the NGDIP dataset, then summed the number of points within each habitat type that were invaded and noninvaded with the given species. To allow time-series analysis, we had to treat the data separately by species and years.
To avoid large fluctuations in the LUCAS survey-based NGDIP occurrence data between years (2009, 2012, 2015, and 2018), and to ensure comparability, we did not use the raw invaded/uninvaded proportion of LUCAS points within land-cover (ecosystem) type to express the level of biological invasion of each habitat. Rather, we subtracted this ratio from the national averages of invaded points for a given year per species.
To determine the temporal changes in invasion of the ecosystem types, we subtracted the percentage of the national average invasion rate of each species from the infection percentage of the given ecosystem types in the examined year.
Using Microsoft Excel, we calculated the relative proportion of invaded versus noninvaded points per ecosystem type using the formula below:
P R ( 1 17 ) = ( I N V 1 17       L U C A S 1 17 ) × 100 ( I N V H L H ) × 100
Number of Level 2 ecosystem types: 17 (listed in Appendix A Table A1).
PR—invasion percentage of the ecosystem types; i.e., the proportion of LUCAS points invaded with the given species in the given year within the EMH ecosystem types (%).
INV—Total number of LUCAS points invaded with a given species within a given EMH ecosystem type in the survey year (2009, 2012, 2015, and 2018).
LUCAS—Total number of LUCAS points within a given EMH ecosystem type each year (2009, 2012, 2015, and 2018).
INVH—Total number of invaded LUCAS points in Hungary each year (2009, 2012, 2015, and 2018).
LH—Total number of LUCAS points in Hungary each year (2009, 2012, 2015, and 2018).
The primary ecosystem types shown in following Tables are those where the deviation from the national average number of invaded points for the year was positive in all four sampling years (2009, 2012, 2015, and 2018). It is possible that there was no major change in infestation in these main ecosystem types, but these ecosystems had high invasion values between 2009 and 2018. The ecosystem types listed for each species as highly invaded indicate the conservation threat in that area or habitat.
Since the number of invaded and noninvaded LUCAS points within each ecosystem subtype (Level 3 subtypes) did not reach a statistically meaningful level in the studied years, we have summarized the points per species of land-cover (ecosystem) types in each year using the Level 2 grouping of the EMH nomenclature (Table A1).
We calculated the percentage of LUCAS points invaded with the species each year within the EMH ecosystem types (Table A3, Table A4, Table A5, Table A6 and Table A7). Using the PR values of the survey years (2009, 2012, 2015, and 2018), we calculated trends of change for each ecosystem type using linear, logarithmic, exponential, and power regression (R2), and plotted the most significant changes on graphs. If the R2 value of the trend line for the study years was greater than or equal to 0.7 R2, then the change in invasion rate within the ecosystem type was considered a strong determination value. Although there is no definitive limit on what counts as a strong correlation, say |r| > 0.70, it is assumed to indicate a strong determination value. [42],
The direction of change within the studied period (2009–2018) could decrease if the proportion of infection of an EMH ecosystem type with a given species decreased significantly. An increasing trend can also be distinguished if the proportion of invasion of an EMH ecosystem type with a given species increased significantly with a coefficient of determination above 0.7 R2.
For the calculation of linear and logarithmic trends, we have considered the deviation from the yearly national average of the originally calculated invasion rate of a particular species in each EMH ecosystem type. However, when calculating the exponential and power regressions, it was necessary to normalize the percentages obtained, as negative values cannot be interpreted for these trends.
The annual results from the national average were therefore normalized to 0; i.e., the value of the year with the lowest percentage was taken and added to the deviation of the infection of a particular species in the other years from the national average for that year. This value is shown in the tables (Table A3, Table A4, Table A5, Table A6 and Table A7) as ‘Deviation due to normalization’.
In certain cases, notable outliers were identified. The invasion rates could show a significant deviation from the reported value related to the previous studied year. For instance, nonwooded areas registered as forests, or areas under reforestation. Plantations (Table 2) had strange invasion rates in 2015, which we consider to be outliers.
It needs to be stated that these values are acceptable. However, it should be noted that the 2015 values are considered outliers due to adjustments in the proportion of invaded and noninvaded points associated with the specified species (Table A2). For example, in 2012, the plantation ecosystem type had 8 Ailanthus altissima invaded points (which meant 2.17% of all points within plantations). However, in 2015, this number was 50 (which meant 13.93% of all points within plantations). These findings indicate the presence of outliers is not an error or inconsistency but rather reflects a significant change in the number and percentage of invaded points (Table A2).

3. Results

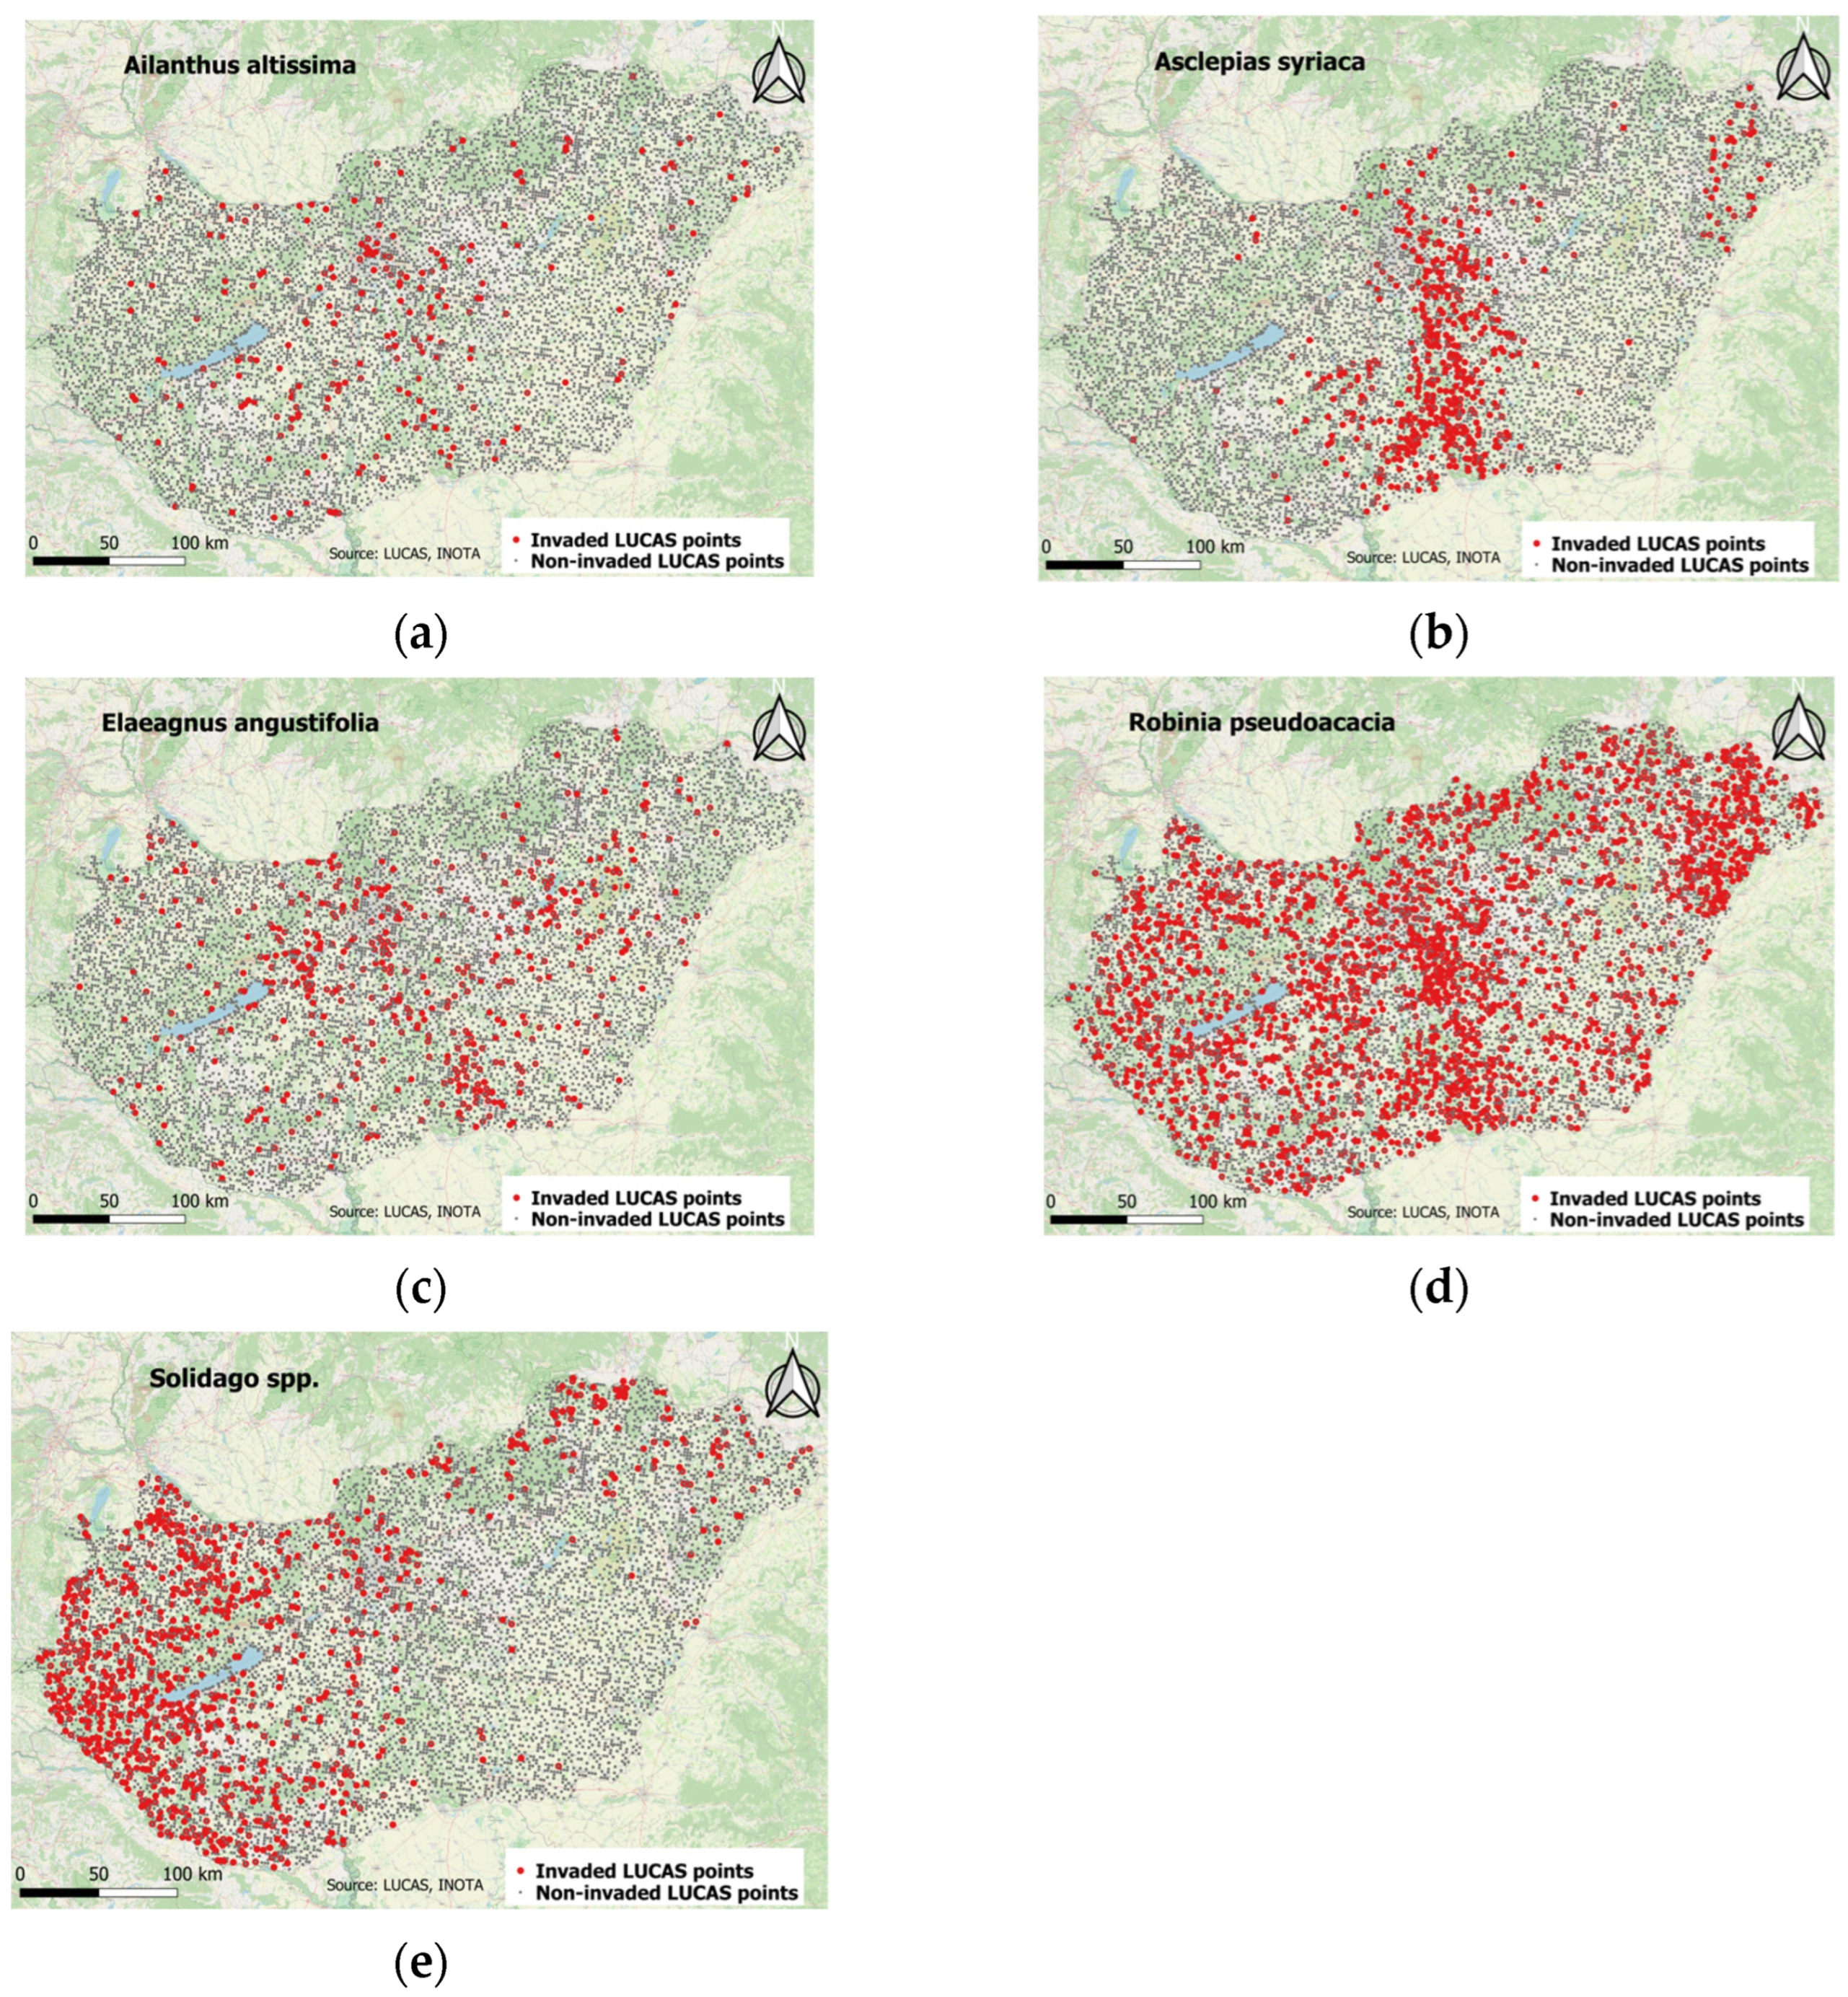
3.1. SpatioTemporal Characterestics of Occurence of Ailanthus altissima in Different Ecosystem Types

The main ecosystem types highly invaded throughout the measured years by Ailanthus altissima are indicated in Table 2.
For some major ecosystem types (e.g., agricultural land, forests, and water-related habitats), R2 values are zero or close to zero (Table A3), indicating that there was no significant change in the proportion of invaded LUCAS points between 2009 and 2018. Calculated regression values do not necessarily indicate the numerical extent to which a given habitat type is invaded, but rather trends in the invasion.
Analysis of the regression values reveals that the change in the proportion of points invaded with Ailanthus altissima is more significant in artificial surfaces. Near built-up areas, as we have highlighted around roads and railways (Table 2 and Table A3), the trend increased significantly (R2 = 0.92) over the studied period, as shown in the graph of linear regression values (Figure 2a).
The change in the Ailanthus altissima invasion was the most significant in the roads and railways main ecosystem type (Figure 2), with all four regression-trend values (R2) being higher than 0.7 (Table A3). In the ecosystem type of other herbaceous vegetation, the invasion increased exponentially (R2 = 0.84) between 2009 and 2018 (Figure 2b). However, in other ecosystem types, the change in Ailanthus altissima invasion was also significant; around buildings (R2 = 0.86) the trend was decreasing (Figure 2c).

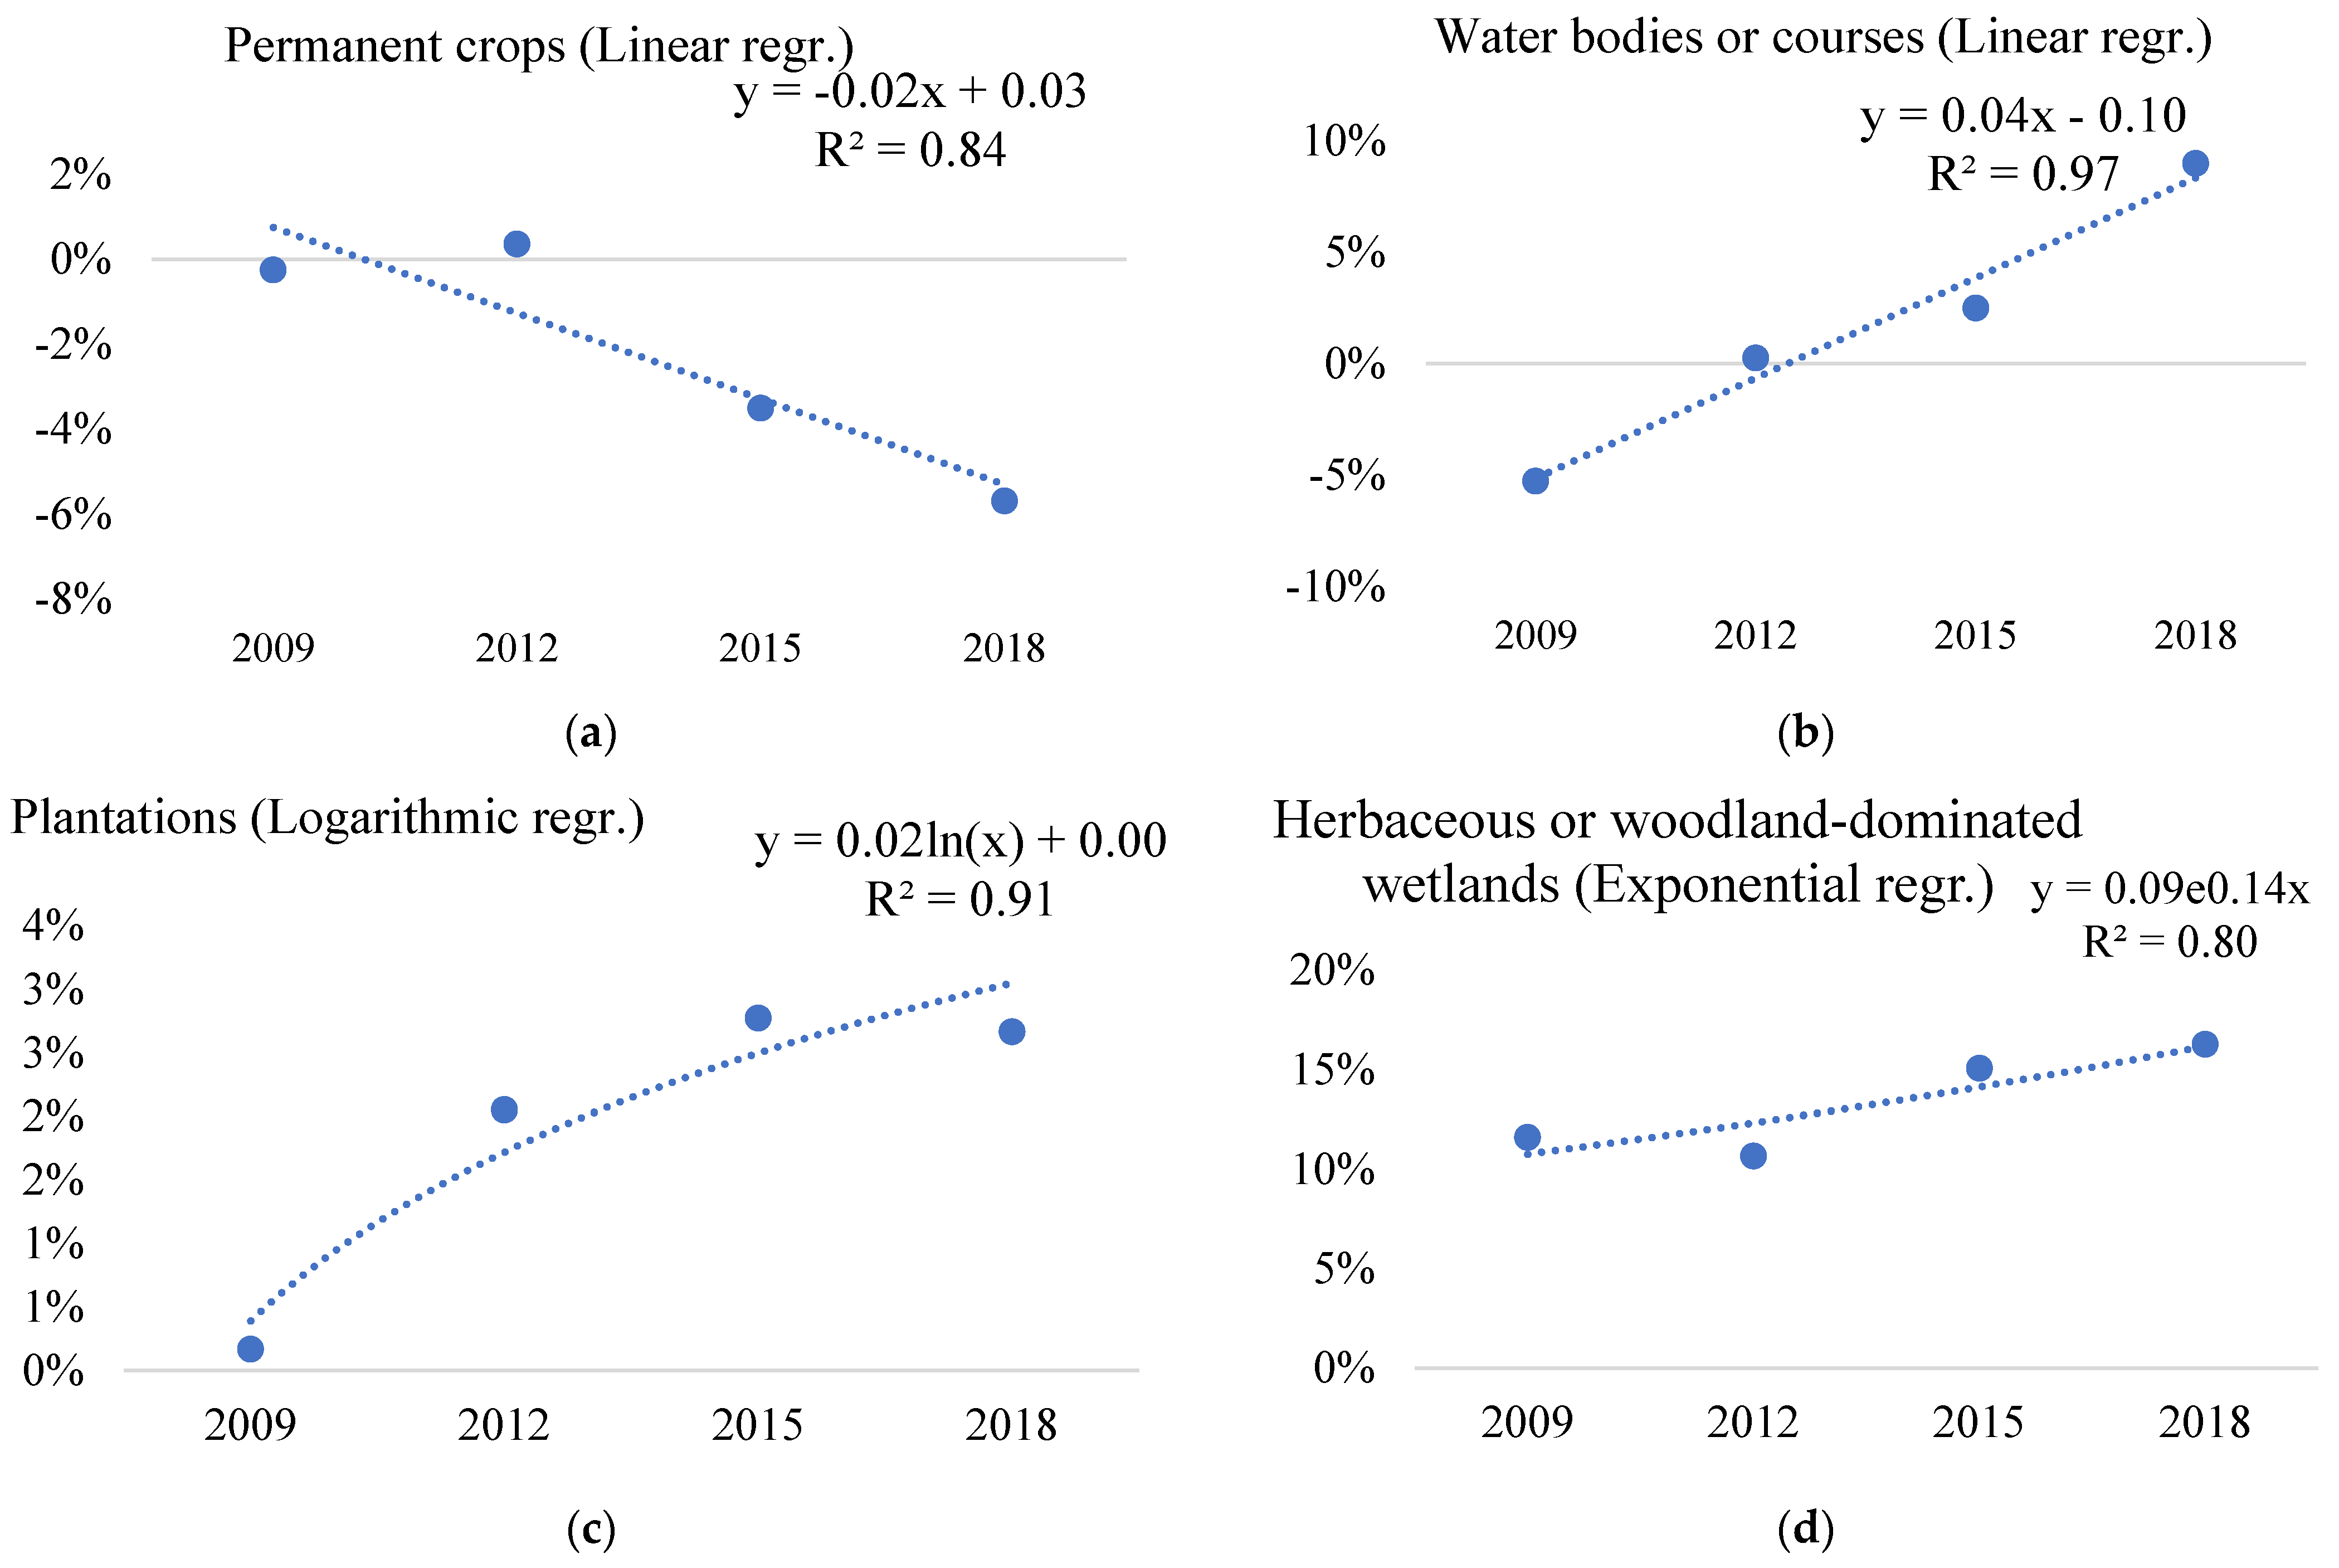
3.2. SpatioTemporal Characteristics of Occurrence Asclepias syriaca in Different Ecosystem Types

The ecosystem types listed for Asclepias syriaca as highly invaded throughout the measured years are indicated in Table 3.
The biological invasion and increasing spread of Asclepias syriaca in the complex cultivation pattern category (mosaic habitats) (Figure 3b) and grasslands (Figure 3c) have great conservation concerns, as their regression value is more than 0.7 R2. The native communities of sensitive sand grasslands are exposed to the intensive encroachment of the Asclepias syriaca [17].
The change in the proportion of points invaded by Asclepias syriaca in the main ecosystem types of buildings (Figure 3a) and natural riverine (gallery) forests showed a decreasing trend (Table A4). Around buildings, this value has decreased from about −1% to −5% (Figure 3a). In herbaceous or woodland-dominated wetlands and water bodies or courses, the occurrence of Asclepias syriaca is rare and no increasing or decreasing trend is present. In these water-influenced ecosystem types, the difference in the invasion of Asclepias syriaca from the country-scale average each year has stagnated between 2009 and 2018. Therefore, there is no evidence of an increasing invasion risk (Table A4).
All the calculated regression values for the ecosystem type of grassland showed a significant increase (Table 3 and Figure 3c).
The level of invasion of complex cultivation patterns tended to increase, as the annual deviation of the 2009 infestation data from the national average was around −1%, while in 2018 this value was close to 6% (Figure 3b). These areas include, for example, kitchen gardens and enclosed gardens in the open countryside, as well as small areas with mosaic land use [40].
The percentages of plantations do not indicate a marked trend of change (Table 3 and Table A4). However, the difference values obtained by comparing the invasion with the annual national average show a consistently high constant status of around 10% in the plantation ecosystem type.
Thus, during the period under study, 2009–2018, the invasion of Asclepias syriaca was significant in plantations; this ecosystem type was likewise invaded by other invasive, woody species (e.g., Ailanthus altissima, Elaeagnus angustifolia, and Robinia pseudoacacia) (Table A3, Table A5 and Table A6).
The results show a decrease in the percentage of points invaded with Asclepias syriaca near the main ecosystem type of buildings (Figure 3a). This suggests that Asclepias syriaca becomes less abundant in urban environments.

3.3. Spatiotemporal Characteristics of the Occurrence of Elaeagnus angustifolia in Different Ecosystem Types

The main ecosystem types listed for Elaeagnus angustifolia as highly invaded throughout the measured years are indicated in Table 4.
The changing tendency of the invasion of the Russian olive does not show significant regression values for any of the EMH ecosystem types (Table A5).
The water-dependent ecosystems showed a high invasion of Elaeagnus angustifolia throughout the study period (Table A5). Points invaded with Elaeagnus angustifolia in wetlands (Herbaceous or woodland-dominated wetlands) averaged around 6% of all points of the ecosystem type and showed an increasing trend over the years (Table 4). In near surface waters (water bodies or courses) the average was 8.8% (Table 4), and, after an initial increase in invasion rates between 2009 and 2012, the percentage of Elaeagnus angustifolia infestations steadily decreased (Table 4 and Table A5).
The invasion rates indicate that Elaeagnus angustifolia is most abundant in areas close to surface water (Table A5) and that wetlands have seen the most significant increase in the occurrence of this species. However, in this habitat type, the change in the infestation of Elaeagnus angustifolia (R2 = 0.69) did not reach the minimum of the coefficient of determination and was, therefore, not considered significant and not plotted.

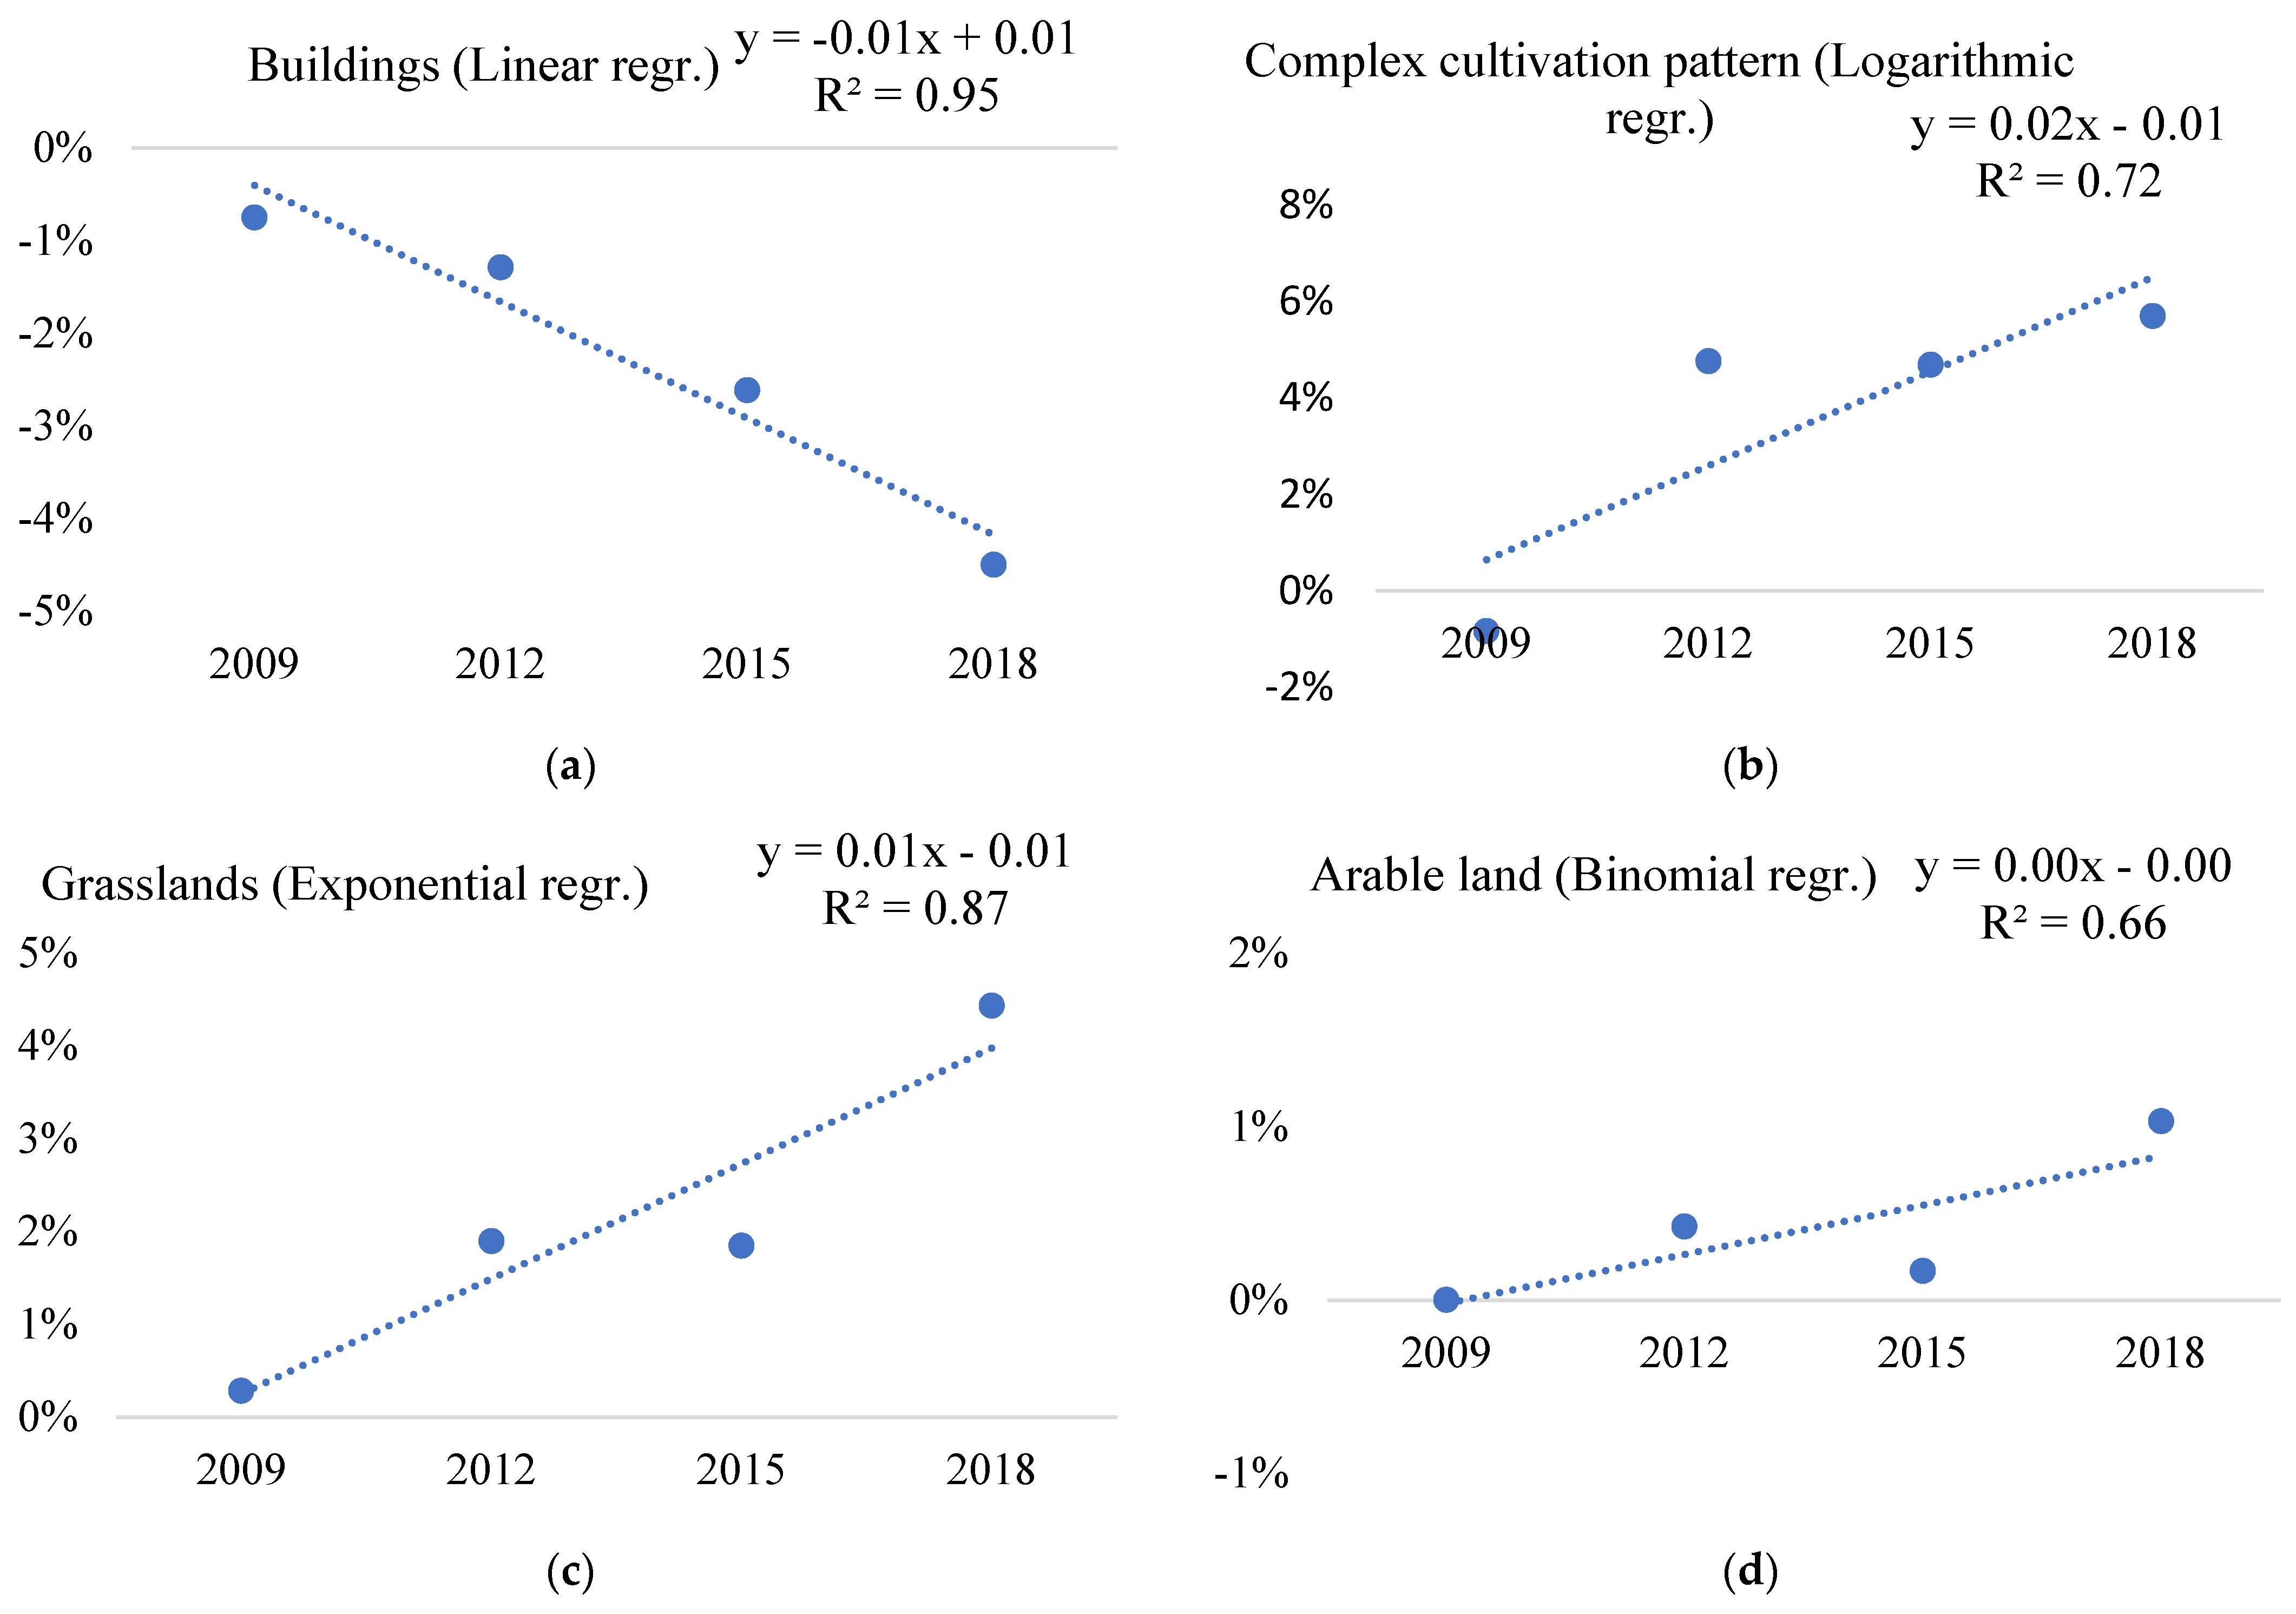
3.4. Spatiotemporal Characteristics of Occurrence of Robinia pseudoacacia in Different Ecosystem Types

The ecosystem types listed for Robinia pseudoacacia as highly invaded throughout the sampled years are indicated in Table 5.
Robinia pseudoacacia is an increasing threat within complex cultivation patterns (Figure 4a), grasslands (Figure 4b), and near water bodies or courses (Figure 4c) EMH ecosystem types (Table A6). These ecosystem types showed a constant increase in the proportion of points invaded by Robinia pseudoacacia over the nine years of data examined (2009–2018), as indicated by the mainly linear and logarithmic R2 values close to one.
Considering the five species studied, Robinia pseudoacacia was the most abundant species, with significantly high regression values along with common milkweed. Five out of the seventeen ecosystem types we examined showed significant change in the proportion of invasion (Table A6). Also, the ‘The average deviation of invasion rates among EMH ecosystem types’ showed incredibly high values: plantations (33.81%); other ligneous vegetation, (21.9%) woodlands; nonwooded areas registered as forest, or areas under reforestation (14.06%) (Table 5). That means the relative proportion of invaded versus noninvaded points was high; the invasion is significant in these ecosystem types.
Plantations, nonwooded areas registered as forest or areas under reforestation, other ligneous vegetation, and woodlands are the main ecosystem types that are proportionally dominated by Robinia pseudoacacia (Table 5 and Table A6). However, there was no significant increase or decrease in Robinia pseudoacacia invasion between 2009 and 2018 in these main ecosystem types. Other ligneous vegetation, woodlands include areas that are not managed but identified as forests and shrubby parts of abandoned areas. Therefore Robinia pseudoacacia tends to highly invade these areas [40].
The high percentage of plantations (mean value of 33.8%) is not surprising, since there is already a specific Robinia pseudoacacia-dominated plantation habitat type at EMH Level 3, and it is intentionally planted in many regions of Hungary [26]. Within these plantations, the proportion of Robinia pseudoacacia is as high as 50% or more [40].
The most varying ecosystem types for Robinia pseudoacacia were complex cultivation patterns and grasslands (Figure 4a,b). The R2 values of the linear and logarithmic regression are above 0.9, showing a very significant increasing trend (Figure 3). The complex cultivation pattern also had a high percentage of invaded points, increasing from around −7.06% in 2009 to 20.74% in 2018 (Table A6 and Figure 4a).
Native plant communities near the water bodies or courses are also increasingly at risk, with a rise in the proportion of invaded points with Robinia pseudoacacia (Table A6 and Figure 4c). Infestation within the buildings main ecosystem type EMH has decreased over the study period (2009–2018) (Table A6).
It is interesting to note that, although the trend of variation was increasing for water-related habitats (Herbaceous or woodland-dominated wetlands and water bodies or courses), but these main ecosystem types still have a negative rate of deviation of sampling points, which means the relative proportion of invaded versus noninvaded points were low, below zero (Table A6). Considering all species, Robinia pseudoacacia had the highest number of invaded points and proportionally had the highest invaded–noninvaded ratio (Table 1).

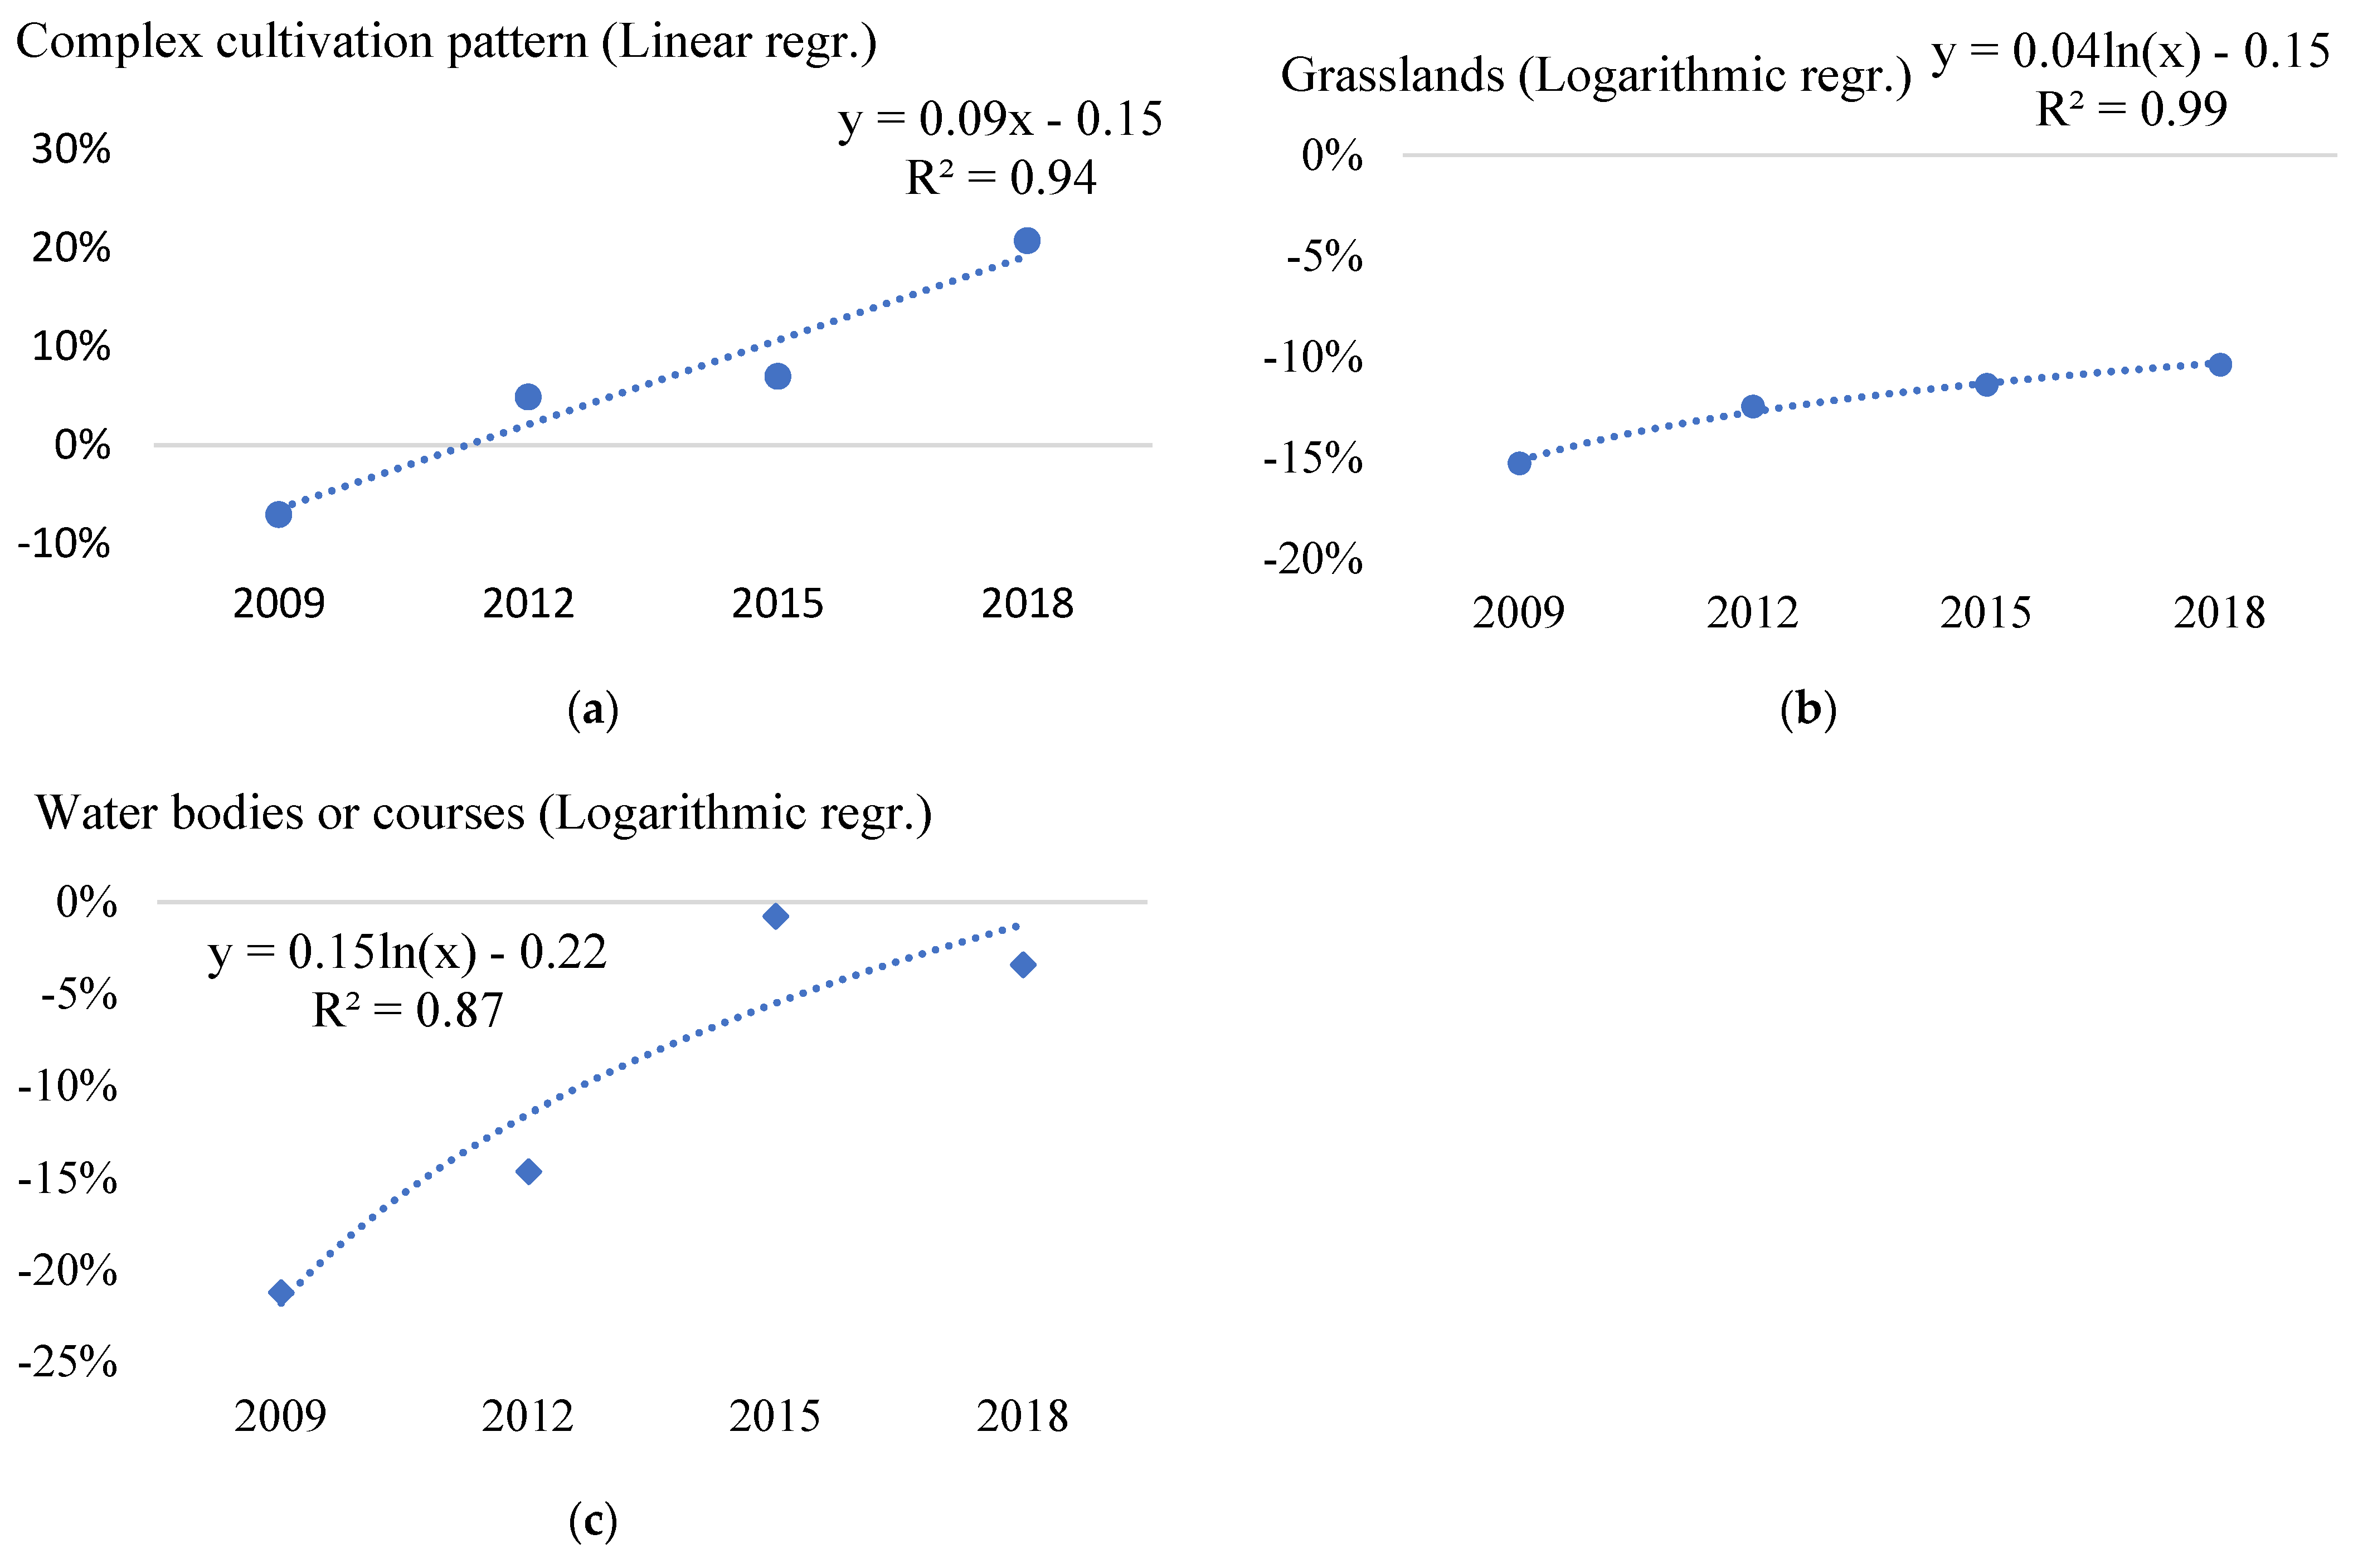
3.5. Spatiotemporal Characteristics of the Occurrence of Solidago spp. in Different Ecosystem Types

The main land-cover (ecosystem) types listed for Solidago spp. as highly invaded throughout the measured years are indicated in Table 6.
Water bodies or courses had the most significant change in the infestation of Solidago spp. The ratio of invaded points to noninvaded points increased significantly (Figure 5b) between 2009 and 2018. The value in 2009 was around −5%, but by 2018, this proportion increased to approximately +9%, indicating that native plant communities near surface waters have become more invaded by Solidago spp.
If we add Herbaceous or woodland-dominated wetlands to water bodies or courses, the threat to native vegetation around Solidago spp. is even more significant, as the percentage of invaded points in the Herbaceous or woodland-dominated wetlands ecosystem type with Solidago spp. increased (Figure 5d) to 16% by 2018 (Table 6 and Table A7).
The invasion rate of Solidago spp. in the case of permanent crops showed a decreasing trend (Figure 5a). This ecosystem type includes, for example, vineyards, other orchards, and plantations (Table A7) [40]. In the main ecosystem type of plantations, the deviation of Solidago spp. invasion from the national average each year increased between 2009 and 2018 (Figure 5c). The augmented presence of Solidago spp. poses potential implications for agriculture.

4. Discussion

This study revealed the importance of ecosystem types regarding the level of invasion by the five investigated species based on a thorough, national-level analysis. It was already demonstrated in other studies that the invasibility (susceptibility to invasion), or the degree of invasion of habitat types can be very different [43], and mostly driven by human processes [44]. We have demonstrated these differences in the degree of invasion over a period of ten years.
Mostly disturbed and human-impacted ecosystems are invaded at a higher level, like other ligneous vegetation, woodlands; other herbaceous vegetation; green urban areas; complex cultivation patterns; or plantations. Grasslands, herbaceous or woodland-dominated wetlands, waterbodies or courses, and natural riverine (gallery) forests are the natural ecosystems mostly affected by an important invasion of the studied species. This raises conservation concerns. In grasslands (mainly sandy grasslands) Asclepias syriaca and Elaeagnus angustifolia (mainly halophytic grasslands) are impacting the ecosystems. Slowing down and preventing the invasion of the Duna–Tisza interflow sandbar and the Nyírség sandbars by Asclepias syriaca is a key conservation task.
Water bodies and courses are invaded by Eleagnus a., and in gallery forests, Solidago spp. Are causing a disturbance; herbaceous or woodland-dominated wetlands are invaded by Elaeagnus angustifolia and Solidago spp.
This general picture shows that the studied species mainly invade intensively human-impacted ecosystems (disturbed, cultivated, and urban); out of eleven types, only three are seminatural, native ecosystems. This demonstrates that if the structural stability ensured by species interactions (competitions and facilitations) is disturbed, newly arriving invasive species can more easily gain importance [45]. The type and intensity of land use have been recorded to influence the severity of invasion by different organisms [46].
Ailanthus altissima is spreading rapidly near linear transportation routes (railways and roads) but also tends to be highly present near artificial surfaces [8].
Exploring the reasons for invasion success in the four seminatural communities requires further ecological studies on species interaction and options for the reduction of their vulnerability [45,47]. The high infection rate of grasslands and ecosystems dependent on surface water is a warning of their vulnerability that requires additional attention. We assume that the high invasibility of certain seminatural ecosystems is a consequence of a higher disturbance level [48].
The data sources allowed the study of temporal changes of invasion extension over a ten-year period. Significant temporal changes occurred not only in highly invaded ecosystems but also in cases when invasion rates were lower than the average at the national level. In most studied cases, an increase in the frequency of invaded points was detected. This increase is most pronounced in the case of intensively used ecosystems, like arable land, roads and railways, other herbaceous vegetation, permanent crops, complex cultivation areas, and plantations. The higher invasibility of disturbed (mainly human-affected) ecosystems was reported elsewhere [49,50].
The increase in the invasion rate of two species (Asclepias syriaca and Robinia pseudoacacia) in seminatural grasslands is worrying from a conservation viewpoint; however, the latter species increased from a lower-than-average level. The greatest temporal change was detected in areas with a complex cultivation pattern, where Asclepias syriaca and Robinia pseudoacacia increased from 0% to 6% and minus 7% to 20%, respectively. Grasslands, especially sandy grasslands, were found to be the most vulnerable to invasion in the Pannonian region (where Hungary lies) in a thorough European study [50].
Water bodies and herbaceous or woodland-dominated wetlands also suffer a major increase, according to our study. However, in the case earlier, only zero or below average levels and even decreasing trends were detected (Solidago spp.). Wetlands are prone to Solidago spp. invasion; the level reached a rate of 17% by the end of the study period. This invasibility and increasing trend of invasion is in accordance with other studies; wet grasslands were also found to be prone to invasion, less so than rocky and alpine grasslands [50].
This study has determined the level of invasion and its trends during ten years for five invasive species at a national level as a first survey. The data and the knowledge gained can improve awareness of the process of invasion, which has huge socioeconomic and health impacts [47]. Knowledge of the levels of invasion can help to explore how the abundance of invasive species affects species and communities and discover eventual saturation processes [1]. Shedding light on the invasibility of different ecosystems is also of great importance because it can help to identify the most vulnerable ecosystems for proactive management [51] and support further studies on which characteristics of communities influence the vulnerability against invaders [45]. As the level and the trend of invasion can vary among regions and might be different at finer scales that also influence the cost of invasion impact [47], the national-level survey must be complemented by further investigations.

5. Conclusions

We identified the main Ecosystem Map of Hungary (EMH) land-use (ecosystem) types within which the infestation rate of the five invasive species under study varied between 2009 and 2018 above a significant trend (R2 ≥ 0.7). We plotted significant decreasing or increasing changes on graphs.
After completing the analysis, we can state that Ailanthus altissima is spreading rapidly near roads and railways. Asclepias syriaca occurrence is increasing in diverse, mosaic, so-called complex landscapes (where the land-cover heterogeneity is high), and in natural grassland habitats.
It can be concluded that grasslands are the most threatened ecosystems by plant invasion in Hungary, as Asclepias syriaca and Robinia pseudoacaciaa. are increasingly covered in these areas. It would be important to find the best conservation management technologies (for instance, an increase in grazing livestock) to reduce the spread of these plants. Wetlands are also prone to invasion by the investigated species, especially Solidago spp and Robinia pseudoacacia. Solidago spp. species spread in wetlands, posing a growing threat to floodplain habitats around water bodies.
The results presented in our research can contribute to the conservation of biodiversity, to understanding the spread and geographical background of invasive plants, and to the development of appropriate conservation management methods.

Author Contributions

Conceptualization, M.B.B. and P.S.; Methodology, M.K. and P.S.; Software, M.B.B.; Formal analysis, M.B.B.; Investigation, M.B.B.; Data curation, M.K. and G.V.V.; Writing–review & editing, K.T., G.V.V. and P.S.; Visualization, M.B.B.; Supervision, M.K. and K.T.; Project administration, P.S. All authors have read and agreed to the published version of the manuscript.

Funding

This research received no external funding.

Data Availability Statement

Data is contained within the article.

Conflicts of Interest

The authors declare no conflict of interest.

Appendix A

Table A1. The nomenclature of the Ecosystem Map of Hungary (Level 2) and (Level 3) ecosystem types.
L2 CodeLevel 2 (Ecosystem Type)L3 CodeLevel 3 (Ecosystem Sub-Type)
11Buildings1110Low buildings
1120High buildings
12Roads and railways1210Paved roads
1220Dirt roads
1230Railways
13Other paved or nonpaved artificial areas1310Other paved or nonpaved artificial areas
14Green urban areas1410Green urban areas with trees
1420Green urban areas without trees
21Arable land2100Arable land
22Permanent crops2210Vineyards
2220Fruit and berry, and other plantations
2230Energy crops
23Complex cultivation pattern2310Complex cultivation patterns with scattered buildings
2320Complex cultivation patterns without scattered buildings
30Grasslands3110Open sand steppes
3120Closed sand steppes
3200Salt steppes and meadows (grasslands affected by salinisation included)
3310Calcareous open rocky grasslands
3320Siliceous open rocky grasslands
3400Closed grasslands in hills and mountains or on cohesive soil
35Other herbaceous vegetation 3500Other herbaceous vegetation
41Forests without excess water4101Beech forests
4102Sessile oak-hornbeam forests
4103Turkey oak forests
4104Downy oak forests
4105Scots pine stands of Western Transdanubia
4106Deciduous stands of Western Transdanubia mixed with Scots pine
4107Native poplar-dominated forests
4108Pioneer forests of hilly and mountainous regions
4109Pedunculate oak-hornbeam forests
4110Pedunculate oak forests, monospecific or mixed with ash
4111Forests dominated by other native tree species without excess water
4112Other mixed deciduous forests
42Natural riverine (gallery) forests4201Riverine willow-poplar woodlands
4202Riverine hardwood forests
43Other forests with excess water4301Pedunculate oak forests, monospecific or mixed with ash
4302Alder forests
4304Willow woods outside the floodplain
4305Poplar woods outside the floodplain
4306Birch woodland
4307Turkey oak forests with excess water
4308Forests dominated by other native tree species (WEW)
4309Other mixed deciduous forests with excess water
44Plantations4401Conifer-dominated plantations
4402Black locust-dominated mixed plantations
4403Plantations dominated by non-native poplar and willow species
4404Plantations of other nonnative tree species
45Nonwooded areas registered as forest or areas under reforestation4501Clearcut
4502Forest stand under regeneration
46Other ligneous vegetation, woodlands4600Other ligneous vegetation, woodlands
50Herbaceous or woodland-dominated wetlands5110Tall-herb vegetation of marshes and fens standing in water
5120Fens and mesotrophic wet meadows, grasslands with periodic water effect
5200Swamp woodlands
60Water bodies or courses6100Water bodies
6200Watercourses
Table A2. The explanation of outliers by numbers and percentages of LUCAS points invaded with. Ailanthus altissima.
EMH Ecosystem TypesNumbers and Percentages of LUCAS Points Invaded with Ailanthus altissimaNational Average of Ailanthus altissima InvasionRegression Values = Invasion Percentages − National Average
20092012201520182009 2012201520182009201220152018
Num.Per.Num.Per.Num.Per.Num.Per.
Plantations123.02%82.17%5013.93%8 2.86%1.64%1.05%1.56%1.96%1.38%1.12%12.37%0.90%
Nonwooded areas registered as forest or areas under reforestation25.41%25.41%414.29%13.57%1.64%1.05%1.56%1.96%3.77%4.36%12.73%1.61%
Table A3. The level of Ailanthus altissima invasion in different ecosystem types in Hungary in 2009. 2012, 2015, and 2018. Coefficients of determination over 0.7 R2 are highlighted.
EMH L2 CodesEMH Ecosystem TypesRate of Deviation of Sampling Points Over the National Average Infection Level Per YearCoefficient of Determination for Linear TrendCoefficient of Determination for Logarithmic TrendDeviation Due to NormalizationCoefficient of Determination for Exponential TrendCoefficient of Determination for Binomial Trend
2009201220152018
11Buildings6.69%2.23%0.40%2.26%0.530.720%0.730.86
12Roads and railways1.25%1.44%1.94%2.83%0.920.780%0.970.86
13Other paved or nonpaved artificial areas2.21%11.45%−1.56%1.07%0.140.071.56%0.020
14Green urban areas1.33%0.79%1.58%2.10%0.540.360%0.620.42
21Arable land−1.25%−0.70%0.22%−1.50%00.031.50%0.130.13
22Permanent crops−1.64%0.40%10.35%0.04%0.130.21.64%0.040.01
23Complex cultivation pattern2.44%−1.05%7.14%2.12%0.080.071.05%0.030.08
30Grasslands−0.04%−0.59%4.37%−0.94%0.010.040.94%00.05
35Other herbaceous vegetation0.16%−1.05%0.88%2.74%0.620.431.05%0.840.67
41Forests without excess water−0.01%−0.25%1.85%0.83%0.390.40.25%0.150.33
42Natural riverine (gallery) forests−1.64%7.29%−1.56%2.80%0.020.051.64%0.020.01
43Other forests with excess water−0.34%−1.05%2.73%−0.37%0.080.11.05%0.020.08
44Plantations1.38%1.12%12.37%0.90%0.050.090%0.040.08
45Nonwooded areas registered as forest or areas under reforestation3.77%4.36%12.73%1.6%00.020%0.010.03
46Other ligneous vegetation woodlands3.36%1.82%7.46%1.12%000%00
50Herbaceous or woodland-dominated wetlands−1.16%−1.05%0.24%−0.76%0.250.321.16%00.02
60Water bodies or courses−1.64%−1.05%−1.56%−1.96%0.250.111.96%00
Table A4. The level of Asclepias syriaca invasion in different ecosystem types in Hungary in 2009, 2012, 2015, and 2018. Coefficients of determination over 0.7 R2 are highlighted.
EMH L2 CodesEMH Ecosystem TypesRate of Deviation of Sampling Points over the National Average Infection Level Per YearCorrelation Coefficient Value for Linear TrendCorrelation Coefficient Value for Logarithmic TrendDeviation Due to NormalizationCorrelation Coefficient Value for Exponential TrendCorrelation Coefficient Value for Binomial Trend
2009201220152018
11Buildings−0.75%−1.29%−2.62%−4.50%0.950.824.50%0.450.41
12Roads and railways−2.35%−1.94%−0.94%−2.45%0.020.072.45%0.150.15
13Other paved or nonpaved artificial areas−4.92%−2.93%−4.40%−4.50%00.024.92%0.070.07
14Green urban areas−2.25%−2.32%−1.24%−2.06%0.180.232.32%0.030.13
21Arable land−2.75%−2.34%−2.59%−1.73%0.650.572.76%0.840.80
22Permanent crops6.71%11.56%8.93%−0.50%0.370.190.50%00
23Complex cultivation pattern−0.84%4.76%4.69%5.70%0.720.860.84%0.270.31
30Grasslands0.28%1.90%1.85%4.43%0.870.800%0.910.89
35Other herbaceous vegetation4.09%2.82%−1.93%0.21%0.620.681.93%0.670.56
41Forests without excess water−0.72%0.25%−0.93%−0.91%0.160.070.93%00
42Natural riverine (gallery) forests6.85%5.40%−4.40%−4.50%0.850.824.50%0.470.44
43Other forests with excess water−4.92%−2.93%0.08%−2.91%0.320.464.92%00.01
44Plantations12.71%8.72%11.17%10.86%0.060.150%0.060.16
45Nonwooded areas registered as forest or areas under reforestation11.30%−0.23%10.98%2.64%0.110.150.23%0.090.15
46Other ligneous vegetation woodlands4.25%2.80%4.97%0.88%0.320.250%0.240.21
50Herbaceous or woodland-dominated wetlands−3.01%−1.33%−2.57%−3.90%0.220.083.90%0.010.02
60Water bodies or courses−4.92%−2.93%−4.40%−4.50%00.024.92%0.070.07
Table A5. The level of Elaeagnus angustifolia invasion of different ecosystem types in Hungary in 2009, 2012, 2015, and 2018. Coefficients of determination over 0.7 R2 are highlighted.
EMH L2 CodesEMH Ecosystem TypesRate of Deviation of Sampling Points over the National Average Infection Level Per YearCoefficient of Determination for Linear TrendCoefficient of Determination for Logarithmic TrendDeviation Due to NormalizationCoefficient of Determination for Exponential TrendCoefficient of Determination for Binomial Trend
2009201220152018
11Buildings−2.86%1.77%−3.77%−1.74%0.0103.77%00.03
12Roads and railways−0.44%−0.52%−1.29%−0.71%0.280.351.29%0.390.34
13Other paved or nonpaved artificial areas−4.94%−1.51%0.58%−1.74%0.440.624.94%00.01
14Green urban areas−0.19%0.94%2.24%−0.38%0.010.060.38%0.180.18
21Arable land−0.38%−0.72%−1.34%−0.81%0.390.511.34%0.580.58
22Permanent crops−0.29%−1.51%−3.77%−1.74%0.350.473.77%0.560.55
23Complex cultivation pattern−4.94%−1.51%−3.77%−1.74%0.330.414.94%0.250.24
30Grasslands7.26%0.79%3.87%5.15%0.020.110%0.020.13
35Other herbaceous vegetation−3.14%−0.36%2.40%−1.74%0.140.273.14%0.010
41Forests without excess water−3.77%−1.25%−3.00%−1.74%0.240.323.77%0.150.14
42Natural riverine (gallery) forests−4.94%−1.51%1.49%−1.74%0.380.554.94%00
43Other forests with excess water−4.94%−0.32%−3.77%−1.74%0.150.234.94%0.090.08
44Plantations−2.67%0.12%−1.90%−1.74%0.010.062.67%0.020.02
45Nonwooded areas registered as forest or areas under reforestation−2.24%−1.51%0.08%−1.74%0.160.262.24%0.010
46Other ligneous vegetation, woodlands−0.77%1.36%2.09%−0.58%0.010.090.77%0.150.10
50Herbaceous or woodland-dominated wetlands2.68%3.28%9.65%7.84%0.680.690%0.580.69
60Water bodies or courses1.31%16.35%11.23%6.60%0.050.160%00.03
Table A6. The level of Robinia pseudoacacia invasion in different ecosystem types in Hungary in 2009, 2012, 2015, and 2018. Coefficients of determination over 0.7 R2 are highlighted.
EMH L2 CodesEMH Ecosystem TypesRate of Deviation of Sampling Points over the National Average Infection Level Per YearCorrelation Coefficient Value for Linear TrendCorrelation Coefficient Value for Logarithmic TrendDeviation Due to NormalizationCorrelation Coefficient Value for Exponential TrendCorrelation Coefficient Value for Binomial Trend
2009201220152018
11Buildings−0.38%−0.17%−1.48%−8.80%0.700.528.80%0.170.16
12Roads and railways1.47%4.69%−0.92%1.51%0.100.060.92%0.040.01
13Other paved or nonpaved artificial areas−12.08%−18.20%−11.42%−17.04%0.090.1218.20%0.090.12
14Green urban areas3.10%6.65%5.75%1.07%0.130.030%0.050.01
21Arable land−15.75%−11.81%−11.62%−11.30%0.700.8515.75%0.210.25
22Permanent crops−11.19%−10.95%−5.10%−14.07%0.01014.07%0.030.02
23Complex cultivation pattern−7.06%4.88%6.96%20.75%0.940.907.06%0.730.77
30Grasslands−15.27%−12.45%−11.37%−10.38%0.930.9915.27%0.460.53
35Other herbaceous vegetation4.96%10.54%15.09%4.64%0.010.070%0.050.01
41Forests without excess water−8.59%−7.59%−3.80%−7.72%0.150.248.59%0.010
42Natural riverine (gallery) forests−9.82%−1.53%21.07%−1.02%0.230.339.82%0.010
43Other forests with excess water−6.69%−0.34%8.11%−10.55%00.0110.55%0.110.11
44Plantations32.48%30.99%39.68%32.07%0.060.090%0.060.09
45Nonwooded areas registered as forest or areas under reforestation4.96%8.83%30.38%12.07%0.240.320%0.140.25
46Other ligneous vegetation, woodlands20.87%22.30%26.42%18.01%0.0300%0.020
50Herbaceous or woodland-dominated wetlands−16.99%−7.56%−8.45%−11.69%0.210.3916.99%00
60Water bodies or courses−21.22%−14.63%−0.77%−3.40%0.820.8721.22%0.250.32
Table A7. The level of Solidago spp. invasion of different ecosystem types in Hungary in 2009, 2012, 2015, and 2018. Coefficients of determination over 0.7 R2 are highlighted.
EMH L2 CodesEMH Ecosystem TypesRate of Deviation of Sampling Points over the National Average Infection Level Per YearCoefficient of Determination Value for Linear TrendCoefficient of Determination for Logarithmic TrendDeviation Due to NormalizationCoefficient of Determination for Exponential TrendCoefficient of Determination for Binomial Trend
2009201220152018
11Buildings−8.40%−6.89%−5.72%−7.69%0.140.278.40%0.020
12Roads and railways−0.04%−0.92%0.41%−2.56%0.380.292.56%0.160.15
13Other paved or nonpaved artificial areas−4.55%−2.73%−7.51%−7.69%0.580.467.69%0.120.10
14Green urban areas1.69%2.00%4.20%0.98%00.020%00.02
21Arable land−4.71%−4.81%−4.29%−4.86%00.014.86%0.030.02
22Permanent crops−0.26%0.35%−3.51%−5.69%0.840.695.69%0.280.25
23Complex cultivation pattern5.89%11.06%1.58%8.63%000%00
30Grasslands0.60%0.23%−0.80%0.22%0.220.330.80%0.370.40
35Other herbaceous vegetation9.62%5.75%6.07%8.78%0.020.120%0.020.13
41Forests without excess water−1.64%0%−0.56%−2.51%0.140.032.51%0.040.05
42Natural riverine (gallery) forests9.25%1.44%3.02%20.88%0.280.130%0.420.17
43Other forests with excess water9.79%10.96%13.39%9.77%0.030.100%0.030.09
44Plantations0.17%2.05%2.77%2.66%0.770.910%0.450.60
45Nonwooded areas registered as forest or areas under reforestation−0.29%3.92%−7.51%10.16%0.120.077.51%0.050.03
46Other ligneous vegetation, woodlands8.83%9.95%9.29%8.08%0.230.090%0.210.08
50Herbaceous or woodland-dominated wetlands11.60%10.66%15.05%16.26%0.780.650%0.800.69
60Water bodies or courses−5.27%0.25%2.49%8.97%0.970.935.27%0.730.78

References

  1. Vilà, M.; Espinar, J.L.; Hejda, M.; Hulme, P.E.; Jarošík, V.; Maron, J.L.; Pergl, J.; Schaffner, U.; Sun, Y.; Pyšek, P. Ecological Impacts of Invasive Alien Plants: A Meta-Analysis of Their Effects on Species, Communities and Ecosystems. Ecol. Lett. 2011, 14, 702–708. [Google Scholar] [CrossRef]
  2. Lake, I.R.; Jones, N.R.; Agnew, M.; Goodess, C.M.; Giorgi, F.; Hamaoui-Laguel, L.; Semenov, M.A.; Solomon, F.; Storkey, J.; Vautard, R.; et al. Climate Change and Future Pollen Allergy in Europe. Environ. Health Perspect. 2017, 125, 385–391. [Google Scholar] [CrossRef] [PubMed]
  3. Ehrenfeld, J.G.; Scott, N. Invasive Species and the Soil: Effects on Organisms and Ecosystem Processes. Ecol. Appl. 2001, 11, 1259–1260. [Google Scholar] [CrossRef]
  4. Bielecka, A.; Borkowska, L.; Królak, E. Environmental Changes Caused by the Clonal Invasive Plant Solidago Canadensis. Ann. Bot. Fenn. 2020, 57, 33. [Google Scholar] [CrossRef]
  5. Kitka, D.; Szilassi, P. Geographic Factors Influencing the Spreading of Invasive Species: A Gis-Based Case Study in the Southern Great Plain of Hungary. J. Landsc. Ecol. 2016, 14, 155–169. [Google Scholar]
  6. Szilassi, P.; Soóky, A.; Bátori, Z.; Hábenczyus, A.A.; Frei, K.; Tölgyesi, C.; van Leeuwen, B.; Tobak, Z.; Csikós, N. Natura 2000 Areas, Road, Railway, Water, and Ecological Networks May Provide Pathways for Biological Invasion: A Country Scale Analysis. Plants 2021, 10, 2670. [Google Scholar] [CrossRef]
  7. Chytrý, M.; Wild, J.; Pyšek, P.; Jarošík, V.; Dendoncker, N.; Reginster, I.; Pino, J.; Maskell, L.C.; Vilà, M.; Pergl, J.; et al. Projecting Trends in Plant Invasions in Europe under Different Scenarios of Future Land-Use Change. Glob. Ecol. Biogeogr. 2012, 21, 75–87. [Google Scholar] [CrossRef]
  8. Szilassi, P.; Visztra, G.V.; Soóky, A.; Bátori, Z.; Hábenczyus, A.A.; Frei, K.; Tölgyesi, C.; Balogh, M.B. Towards an Understanding of the Geographical Background of Plants Invasion as a Natural Hazard: A Case Study in Hungary. Geogr. Pannonica 2022, 26, 176–183. [Google Scholar] [CrossRef]
  9. Kovács-Hostyánszki, A.; Bereczki, K.; Czúcz, B.; Fabók, V.; Fodor, L.; Kalóczkai, Á.; Kiss, M.; Koncz, P.; Kovács, E.; Rezneki, R.; et al. Nemzeti Ökoszisztéma-Szolgáltatás Térképezés És Értékelés, Avagy a Természetvédelem Országos Programja. Természetvédelmi Közlemények 2019, 25, 80–90. [Google Scholar] [CrossRef]
  10. Tanács, E.; Belényesi, M.; Lehoczki, R.; Pataki, R.; Petrik, O.; Standovár, T.; Pásztor, L.; Laborczi, A.; Szatmári, G.; Molnár, Z.; et al. Országos, Nagyfelbontású Ökoszisztéma-Alaptérkép: Módszertan, Validáció És Felhasználási Lehetőségek. Természetvédelmi Közlemények 2019, 25, 34–58. [Google Scholar] [CrossRef]
  11. Tanács, E.; Bede-Fazekas, Á.; Csecserits, A.; Fodor, L.K.; Pásztor, L.; Somodi, I.; Varga, A.; Vári, Á. Assessing Ecosystem Condition at the National Level in Hungary-Indicators, Approaches, Challenges. One Ecosyst. 2022, 7, e81543. [Google Scholar] [CrossRef]
  12. Botta-Dukat, Z.; Balogh, L.; Szigetvári, C.; Bagi, I.; Dancza, I.; Udvardy, L. A Növényi Invázióhoz Kapcsolódó Fogalmak Áttekintése, Egyben Javaslat a Jövőben Használandó Fogalmakra És Azok Definícióira. In Biológiai inváziók Magyarországon: Özönnövények/[Biological Invasions in Hungary: Invasive Plants] Chapter: II; Botond, M., Botta-Dukat, Z., Eds.; A KvVM Természetvédelmi Hivatalának tanulmánykötetei 9, TermészetBÚVÁR Alapítvány Kiadó: Budapest, Hungary, 2004; pp. 35–59. ISBN 963 86107 5 1. [Google Scholar]
  13. European Alien Species Information Network—Species Explorer. Available online: https://easin.jrc.ec.europa.eu/spexplorer/search/ (accessed on 21 June 2023).
  14. Roy, D.; Alderman, D.; Anastasiu, P.; Arianoutsou, M.; Augustin, S.; Bacher, S.; Başnou, C.; Beisel, J.; Bertolino, S.; Bonesi, L.; et al. DAISIE-Inventory of Alien Invasive Species in Europe. 2020, Version 1.7. Research Institute for Nature and Forest (INBO). Available online: https://www.gbif.org/dataset/39f36f10-559b-427f-8c86-2d28afff68ca (accessed on 9 September 2023).
  15. Katsanevakis, S.; Deriu, I.; D’amico, F.; Nunes, A.L.; Sanchez, S.P.; Crocetta, F.; Arianoutsou, M.; Bazos, I.; Christopoulou, A.; Curto, G.; et al. European Alien Species Information Network (EASIN): Supporting European Policies and Scientific Research. Manag. Biol. Invasions 2015, 6, 147–157. [Google Scholar] [CrossRef]
  16. András, D.; Szilárd, C. A Mirigyes Bálványfa (Ailanthus altissima (Mill.) Swingle) Hazai Kutatásainak Áttekintése És Inváziójának Mértéke a Hazai Élőhelyeken. Természetvédelmi Közlemények 2016, 22, 20–32. [Google Scholar]
  17. Balogh, L.; Dancza, I.; Király, G. Preliminary Report on the Grid-Based Mapping of Invasive Plants in Hungary. Neobiota 2008, 7, 105–114. [Google Scholar]
  18. Sladonja, B.; Sušek, M.; Guillermic, J. Review on Invasive Tree of Heaven (Ailanthus altissima (Mill.) Swingle) Conflicting Values: Assessment of Its Ecosystem Services and Potential Biological Threat. Environ. Manag. 2015, 56, 1009–1034. [Google Scholar] [CrossRef] [PubMed]
  19. Kowarik, I.; Säumel, I. Biological Flora of Central Europe: Ailanthus altissima (Mill.) Swingle. Perspect. Plant Ecol. Evol. Syst. 2007, 8, 207–237. [Google Scholar] [CrossRef]
  20. Bhowmik, P.C.; Bandeen, J.D. The Bilogy of Canadian Weeds: 19. Asclepias syriaca L. Can. J. Plant Sci. 1976, 56, 579–589. [Google Scholar] [CrossRef]
  21. Bakacsy, L.; Bagi, I. Survival and Regeneration Ability of Clonal Common Milkweed (Asclepias syriaca L.) after a Single Herbicide Treatment in Natural Open Sand Grasslands. Sci. Rep. 2020, 10, 14222. [Google Scholar] [CrossRef]
  22. Follak, S.; Bakacsy, L.; Essl, F.; Hochfellner, L.; Lapin, K.; Schwarz, M.; Tokarska-Guzik, B.; Wołkowycki, D. Monograph of Invasive Plants in Europe N 6: Asclepias syriaca L. Bot. Lett. 2021, 168, 422–451. [Google Scholar] [CrossRef]
  23. Szilassi, P.; Szatmári, G.; Pásztor, L.; Árvai, M.; Szatmári, J.; Szitár, K.; Papp, L. Understanding the Environmental Background of an Invasive Plant Species (Asclepias syriaca) for the Future: An Application of LUCAS Field Photographs and Machine Learning Algorithm Methods. Plants 2019, 8, 593. [Google Scholar] [CrossRef]
  24. Papp, L.; Van Leeuwen, B.; Szilassi, P.; Tobak, Z.; Szatmári, J.; Árvai, M.; Mészáros, J.; Pásztor, L. Monitoring Invasive Plant Species Using Hyperspectral Remote Sensing Data. Land 2021, 10, 29. [Google Scholar] [CrossRef]
  25. Csiszár, Á.; Korda, M. Russian Olive (Elaeagnus angustifolia). In Practical Experiences in Invasive Alien Plant Control; Duna–Ipoly National Park Directorate: Esztergom, Hungary, 2015; pp. 214–215. [Google Scholar]
  26. Redei, K.; Osvath-Bujtas, Z.; Veperdi, I. Black Locust (Robinia pseudoacacia L.) Improvement in Hungary: A Review. Acta Silv. Et Lignaria Hung. 2008, 4, 127–132. [Google Scholar]
  27. Csiszár, Á.; Korda, M. Black Locust (Robinia pseudoacacia). In Practical Experiences in Invasive Alien Plant Control; Duna–Ipoly National Park Directorate: Esztergom, Hungary, 2015; pp. 208–210. [Google Scholar]
  28. Csiszár, Á.; Korda, M. Giant and Canadian Goldenrod (Solidago gigantea, Solidago canadensis). In Practical Experiences in Invasive Alien Plant Control; Duna–Ipoly National Park Directorate: Esztergom, Hungary, 2015; pp. 231–233. [Google Scholar]
  29. Botta-Dukát, Z.; Dancza, I. Giant and Canadian Goldenrod (Solidago gigantea Ait., S. canadensis L.). In The Most Important Invasive Plants in Hungary; Institute of Ecology and Botany, Hungarian Academy of Sciences: Vácrátót, Hungary, 2008; pp. 167–177. [Google Scholar]
  30. Botta-Dukát, Z.; Dancza, I. Aranyvessző Fajok (Solidago spp.). In Inváziós növényfajok Magyarországon; Csiszár, Á., Ed.; Nyugat-magyarországi Egyetemi Kiadó: Sopron, Hungary, 2012. [Google Scholar]
  31. Šutovská, M.; Capek, P.; Kocmálová, M.; Fraňová, S.; Pawlaczyk, I.; Gancarz, R. Characterization and Biological Activity of Solidago Canadensis Complex. Int. J. Biol. Macromol. 2013, 52, 192–197. [Google Scholar] [CrossRef] [PubMed]
  32. Bölöni, J.; Molnár, Z.; Kun, A.; Biró, M. Általános Nemzeti Élőhely-Osztályozási Rendszer (Á-NÉR 2007). Kézirat MTA Öbki Vácrátót 2007, 184. [Google Scholar]
  33. Werner, P.A.; Bradbury, I.K.; Gross, R.S. The Biology of Canadian Weeds.: 45. Solidago canadensis L. Can. J. Plant Sci. 1980, 60, 1393–1409. [Google Scholar] [CrossRef]
  34. Fenesi, A.; Vágási, C.I.; Beldean, M.; Földesi, R.; Kolcsár, L.P.; Shapiro, J.T.; Török, E.; Kovács-Hostyánszki, A. Solidago Canadensis Impacts on Native Plant and Pollinator Communities in Different-Aged Old Fields. Basic. Appl. Ecol. 2015, 16, 335–346. [Google Scholar] [CrossRef]
  35. Varga, Z. A BIOLÓGIAI INVÁZIÓ ÁLTALÁNOS KÉRDÉSEI. Magy. Tudomány 2017, 178, 388–394. [Google Scholar]
  36. With, K.A. The Landscape Ecology of Invasive Spread. Conserv. Biol. 2002, 16, 1192–1203. [Google Scholar] [CrossRef]
  37. National Geospatial Database of Invasive Plants (NGDIP). Available online: http://www.geo.u-szeged.hu/invasive/ (accessed on 21 June 2023).
  38. d’Andrimont, R.; Yordanov, M.; Martinez-Sanchez, L.; Eiselt, B.; Palmieri, A.; Dominici, P.; Gallego, J.; Reuter, H.I.; Joebges, C.; Lemoine, G.; et al. Harmonised LUCAS In-Situ Land Cover and Use Database for Field Surveys from 2006 to 2018 in the European Union. Sci. Data 2020, 7, 352. [Google Scholar] [CrossRef]
  39. Tanács, E.; Vári, Á.; Bede-Fazekas, Á.; Báldi, A.; Csákvári, E.; Endrédi, A.; Fabók, V.; Kisné Fodor, L.; Kiss, M.; Koncz, P.; et al. Finding the Green Grass in the Haystack? Integrated National Assessment of Ecosystem Services and Condition in Hungary, in Support of Conservation and Planning. Sustainability 2023, 15, 8489. [Google Scholar] [CrossRef]
  40. Agrárminisztérium Ökoszisztéma Alaptérkép És Adatmodell Kialakítása. 2019. Budapest. Available online: http://okoszisztema-miniszter.hu/Magyarorszag-Okoszisztema-alapterkepe (accessed on 9 September 2023).
  41. Maes, J.; Teller, A.; Erhard, M.; Liquete, C.; Braat, L.; Berry, P.; Egoh, B.; Puydarrieux, P.; Fiorina, C.; Santos, F.; et al. Mapping and Assessment of Ecosystems and Their Services: An Analytical Framework for Ecosystem Assessments under Action. 5 of the EU Biodiversity Strategy to 2020; Publications Office of the European Union: Luxembourg, 2013. [Google Scholar]
  42. Anscombe, F.J. Graphs in Statistical Analysis. Am. Stat. 1973, 27, 17. [Google Scholar] [CrossRef]
  43. Guo, Q.; Fei, S.; Dukes, J.S.; Oswalt, C.M.; III, B.V.I.; Potter, K.M. A Unified Approach for Quantifying Invasibility and Degree of Invasion. Ecology 2015, 96, 2613–2621. [Google Scholar] [CrossRef] [PubMed]
  44. Chytrý, M.; Jarošík, V.; Pyšek, P.; Hájek, O.; Knollová, I.; Tichý, L.; Danihelka, J. Separating Habitat Invasibility by Alien Plants from the Actual Level of Invasion. Ecology 2008, 89, 1541–1553. [Google Scholar] [CrossRef]
  45. Godoy, O. Coexistence Theory as a Tool to Understand Biological Invasions in Species Interaction Networks: Implications for the Study of Novel Ecosystems. Funct. Ecol. 2019, 33, 1190–1201. [Google Scholar] [CrossRef]
  46. Liu, D.; Semenchuk, P.; Essl, F.; Lenzner, B.; Moser, D.; Blackburn, T.M.; Cassey, P.; Biancolini, D.; Capinha, C.; Dawson, W.; et al. The Impact of Land Use on Non-Native Species Incidence and Number in Local Assemblages Worldwide. Nat. Commun. 2023, 14, 2090. [Google Scholar] [CrossRef] [PubMed]
  47. Turbelin, A.J.; Cuthbert, R.N.; Essl, F.; Haubrock, P.J.; Ricciardi, A.; Courchamp, F. Biological Invasions Are as Costly as Natural Hazards. Perspect. Ecol. Conserv. 2023, 21, 143–150. [Google Scholar] [CrossRef]
  48. Hobbs, R.J.; Huenneke, L.F. Disturbance, Diversity, and Invasion: Implications for Conservations. Conserv. Biol. 1992, 6, 324–337. [Google Scholar] [CrossRef]
  49. Nielson, K.G.; Gill, K.M.; Springer, A.E.; Ledbetter, J.D.; Stevens, L.E.; Rood, S.B. Springs Ecosystems: Vulnerable Ecological Islands Where Environmental Conditions, Life History Traits, and Human Disturbance Facilitate Non-Native Plant Invasions. Biol. Invasions 2019, 21, 2963–2981. [Google Scholar] [CrossRef]
  50. Axmanová, I.; Kalusová, V.; Danihelka, J.; Dengler, J.; Pergl, J.; Pyšek, P.; Večeřa, M.; Attorre, F.; Biurrun, I.; Boch, S.; et al. Neophyte Invasions in European Grasslands. J. Veg. Sci. 2021, 32, e12994. [Google Scholar] [CrossRef]
  51. Ibáñez, I.; Petri, L.; Barnett, D.T.; Beaury, E.M.; Blumenthal, D.M.; Corbin, J.D.; Diez, J.; Dukes, J.S.; Early, R.; Pearse, I.S.; et al. Combining Local, Landscape, and Regional Geographies to Assess Plant Community Vulnerability to Invasion Impact. Ecol. Appl. 2023, 33, e2821. [Google Scholar] [CrossRef]
Figure 1. The aggregated distribution of (a) Ailanthus altissima in; (b) Asclepias syriaca; (c) Elaeagnus angustifolia; (d) Robinia pseudoacacia; (e) Solidago spp. in Hungary between 2009–2018. Red dots indicate invaded points, while grey dots show noninvaded LUCAS points.
Land 12 01784 g001
Figure 2. Significant trends of change of Ailanthus altissima invasion in the main land-cover (ecosystem) types (ac) of EMH in the period 2009–2018, based on the difference from national averages of the distribution of LUCAS points invaded with Ailanthus altissima within land-cover (ecosystem) types (where 0% is the level of national average invasion of Ailanthus altissima in a given year).
Land 12 01784 g002
Figure 3. Significant trends of change of Asclepias syriaca occurrence in the main land-cover (ecosystem) types (ad) of EMH in the period 2009–2018 based on the difference from national averages of the distribution of LUCAS points invaded with Asclepias syriaca within land-cover (ecosystem) types (where 0% is the level of national average invasion of Asclepias syriaca in a given year).
Land 12 01784 g003
Figure 4. Significant trends of change of black locust (Robinia pseudoacacia) invasion in the main ecosystem types (ac) of EMH in the period 2009–2018 based on the difference from national averages of the distribution of LUCAS points invaded with Robinia pseudoacacia. within land-cover (ecosystem) types (where 0% is the level of national average invasion of Robinia pseudoacacia in a given year).
Land 12 01784 g004
Figure 5. Significant trends of change of goldenrod species (Solidago spp.) invasion in the main land-cover (ecosystem) types (ad) of EMH in the period 2009–2018 based on the difference from national averages of the distribution of LUCAS points invaded with Solidago spp. within land-cover (ecosystem) types (where 0% is the level of national average invasion of a Solidago spp. given year).
Land 12 01784 g005
Table 1. Occurrence of invasive species on the National Invasive Species Database (INOTA) of Hungary.
Invasive SpeciesInvaded LUCAS Points in 2009Invaded LUCAS Points in 2012Invaded LUCAS Points in 2015Invaded LUCAS Points in 2018
(N)Average Invasion(N)Average Invasion(N)Average Invasion(N)Average Invasion
Ailanthus altissima861.64%481.05%711.56%801.96%
Asclepias syriaca2504.92%1322.93%1954.40%1754.50%
Eleaeagnus angustifolia2514.94%691.51%1683.77%711.74%
Robinia pseudoacacia114927.47%71418.20%63015.77%69520.08%
Solidago spp.4138.40%2996.89%3237.51%2977.70%
All LUCAS points in HungaryLUCAS points in 2009LUCAS points in 2012LUCAS points in 2015LUCAS points in 2018
5332 = 100%4637 = 100%4625 = 100%4156 = 100%
Table 2. Permanent Ailanthus altissima occurrence between 2009 and 2018 in the land-cover (ecosystem) types of EMH.
EMH Ecosystem TypesRate of Deviation of Sampling Points over the National Average Infection Level Per YearThe Average Deviation of Invasion Rates among EMH Ecosystem Types
2009201220152018
Nonwooded areas registered as forest or areas under reforestation3.77%4.36%12.73%1.61%5.62%
Plantations1.38%1.12%12.37%0.90%3.94%
Other ligneous vegetation, woodlands3.36%1.82%7.46%1.12%3.44%
Buildings6.69%2.23%0.40%2.26%2.90%
Roads and railways1.25%1.44%1.94%2.83%1.87%
Green urban areas1.33%0.79%1.58%2.10%1.45%
Table 3. Permanent Asclepias syriaca occurrence between 2009 and 2018 in the ecosystem types of EMH.
EMH Ecosystem TypesRate of Deviation of Sampling Points over the National Average Infection Level Per YearThe Average Deviation of Invasion Rates among EMH Ecosystem Types
2009201220152018
Plantations12.71%8.72%11.17%10.86%10.87%
Other ligneous vegetation, woodlands4.25%2.80%4.97%0.88%3.23%
Grasslands0.28%1.90%1.85%4.43%2.11%
Table 4. Permanent Elaeagnus angustifolia occurrence between 2009 and 2018 in the ecosystem types of EMH.
EMH Ecosystem TypesRate of Deviation of Sampling Points over the National Average Infection Level Per YearThe Average Deviation of Invasion Rates among EMH Ecosystem Types
2009201220152018
Water bodies or courses1.31%16.35%11.23%6.60%8.87%
Herbaceous or woodland-dominated wetlands2.68%3.28%9.65%7.84%5.86%
Grasslands7.26%0.79%3.87%5.15%4.27%
Table 5. Permanent Robinia pseudoacacia invasion between 2009 and 2018 in the main ecosystem types of EMH.
EMH Ecosystem TypesRate of Deviation of Sampling Points over the National Average Infection Level Per YearThe Average Deviation of Invasion Rates among EMH Ecosystem Types
2009201220152018
Plantations32.48%30.99%39.68%32.07%33.81%
Other ligneous vegetation, woodlands20.87%22.30%26.42%18.01%21.90%
Nonwooded areas registered as forest or areas under reforestation4.96%8.83%30.38%12.07%14.06%
Other herbaceous vegetation 4.96%10.54%15.09%4.64%8.81%
Green urban areas3.10%6.65%5.75%1.07%4.14%
Table 6. Permanent Solidago spp. occurrence between 2009 and 2018 in the ecosystem types of EMH.
EMH Ecosystem TypesRate of Deviation of Sampling Points over the National Average Infection Level Per YearThe Average Deviation of INVASION Rates among EMH Ecosystem Types
2009201220152018
Herbaceous or woodland-dominated wetlands11.60%10.66%15.05%16.26%13.39%
Other forests with excess water9.79%10.96%13.39%9.77%10.98%
Other ligneous vegetation, woodlands8.83%9.95%9.29%8.08%9.04%
Natural riverine (gallery) forests9.25%1.44%3.02%20.88%8.65%
Other herbaceous vegetation 9.62%5.75%6.07%8.78%7.56%
Complex cultivation pattern5.89%11.06%1.58%8.63%6.79%
Green urban areas1.69%2.00%4.20%0.98%2.22%
Plantations0.17%2.05%2.77%2.66%1.91%
Disclaimer/Publisher’s Note: The statements, opinions and data contained in all publications are solely those of the individual author(s) and contributor(s) and not of MDPI and/or the editor(s). MDPI and/or the editor(s) disclaim responsibility for any injury to people or property resulting from any ideas, methods, instructions or products referred to in the content.

