Article

Cost Analysis of Various Factors for Geopolymer 3D Printing of Construction Products in Factories and on Construction Sites

Fiber Composite Laboratory, LUT School of Energy Systems, Lappeenranta-Lahti University of Technology, 53850 Lappeenranta, Finland
*
Author to whom correspondence should be addressed.
Recycling 2021, 6(3), 60; https://doi.org/10.3390/recycling6030060
Submission received: 29 July 2021 / Revised: 23 August 2021 / Accepted: 2 September 2021 / Published: 8 September 2021
(This article belongs to the Special Issue Feature Papers in Recycling 2021)

Abstract

:
The utilization of geopolymer 3D printing for construction products in recent years has been exceptionally substantial, owing to their low carbon dioxide emissions, high-performance properties such as durability, and good thermal and mechanical properties. This automated manufacturing process reduces the need for additional formworks, capital investments, and human resources. Geopolymer 3D printing development is emerging because of its advanced use in construction applications. However, high costs of the initial stages of geopolymer production and 3D printing has inhibited the development of this technology in many countries. This research presents a comprehensive economic evaluation of the investment for each principal stage that facilitates a better deployment of the resources. The study investigated all phases of geopolymer production, from the extraction of raw materials to printing. The cost for the four fundamental stages, namely raw material availability and transportation, pretreatments for raw materials, parameter selection and strength requirements, and printing in factories and on construction sites, were analyzed. The results show that 3D printing of a geopolymer on a construction site is economically more advantageous compared to printing in the factory. The study also verified that raw material transportation cost has the least effect on the finished product cost, whereas pretreatments of raw material and mixing parameters significantly influenced the ultimate cost of the product. Finally, research work suggested the need for future tasks to make geopolymer 3D printing a viable construction approach.

1. Introduction

The construction industry encounters many hindrances in production costs. Excessive amounts of nonreusable waste materials are generated by adopting conventional formworks (temporary structures that facilitate molding of concrete in desired shape), whereas the higher production cost of reusable shuttering limits its adaptation in the industry [1,2]. Traditional construction procedures have limitations with geometrically complex shapes and insufficient manufacturing precision [3,4]. The construction industry uses a significant number of natural resources such as sand, clay, limestone (a major component of cement), rock, and gravel. The increased global urbanization and world population have amplified the demand for construction materials [5]. The largest amount of waste generated in Europe comes from the construction industry (36%), along with mining and quarrying (26.2%) [6]. Improvements in the construction procedures and usage of greener products are the key considerations that are closely tied to the avoidance of waste.
Concrete is the most widely used material worldwide in the construction industry [7]. High cost, surplus waste generation, non-environmentally-friendly materials, and modes adopted to generate concrete are the dominant issues in construction activity [8]. The entire construction approach, including material transportation, parameter selection, strength requirements, off-site manufacturing, assembly, and installation, dissipates a prodigious extent of energy and greenhouse gases. To make conventional concrete, the most fundamental element is ordinary Portland cement (OPC), which is a high carbon and energy-demanding material [9]. Increasing demand for cement in the construction industry generated CO2 emissions of nearly 1599 Mt in 2017 [10]. Sustainable usage of waste produced as by-products from diverse industries can provide an alternative to Portland cement. The utilization of reusable sustainable materials to preserve raw material is what the present era requires [11,12].
Geopolymers are known as green materials for the construction industry, having almost 80–90% less CO2 discharge [13]. Asim et al. [14] revealed the sustainable material usage and economical, reliable manufacturing techniques in the construction industry increase energy efficiency, generate employment, and boost competitiveness. According to Abdollahnejad et al. [15], energy demand enhancement around the globe is a leading reason for unsustainable development on our planet. Geopolymer concretes (GPC), having significant acid resistance [16,17], adequate adhesion to steel and iron [18], is considered a viable and eco-friendly substitute for OPC [19,20]. Ultimately, the energy required to produce GPC can be 43–59% lower in comparison with OPC [21]. Using industrial by-products for the synthesis of GPC results in cost-effective and sustainable concrete [22]. GPC has excellent heat resistance, low permeability, and good mechanical properties, which has been gaining increasing attention in the construction industry [23]. Geopolymer 3D printing for construction products seems to be a promising technology that decreases the labor requirements, reduces the construction costs, and increases the safety level [24,25,26].
Geopolymer 3D printing is among the emerging techniques applied for the precise formulation of frameworks from a digital design. Additive manufacturing (AM) is considered an innovative technology that realizes the construction automation concept [27,28]. AM is a fast-growing industrial sector that has many potential advantages in terms of flexibility, efficiency, labor reduction, construction in a harsh environment, safety, geometrical flexibility, and sustainability in the construction sector [29,30]. Currently, in the industry, two different 3D printers (framed and nonframed) are in use. Framed printers, limited by difficulties in their assembly outside the factories and transportation, are only used inside factories. Raw material availability and transportation, material pretreatments, machining cost, and framework setup are major factors that influence 3D printing optimization. The adoption of 3D printing techniques can reduce costs by 30–65% in the construction industry [31].
Typically, constructing a house using a traditional method takes months. Conventional approaches of construction are slow and often comprise many time-consuming steps, such as transportation, material production, formwork manufacturing, labor demand, and safety matters [32,33,34]. In a traditional construction process, formworks may account for 35–54% of the total construction cost and consume 50–75% of the total construction time [4]. Mobile construction 3D printers have the potential of printing houses economically. The ultimate cost of 3D geopolymer printed houses directly depends upon the availability of raw materials, transportation, pretreatment techniques, and parameter selection. Although corroboration of GP 3D printing practices in countries such as Finland is scarce in literature, there are many countries where these practices have reached an industrial scale, such as “the office of future” assembled in Dubai and printed in China, the canal house printed in Amsterdam, the Apis Cor printed house in Russia [35], a five-story building printed in China, just to mention a few [36]. The size of the printed articles is one of the constraints related to 3D printing [37,38,39]. Other barriers to the adoption of 3D printing are building regulations [40], cementitious printing material limitations [41], and workforce requirements [35].
Three-dimensional printing technology for construction products is still in its early stages. It is becoming popular in the construction sector worldwide [42]. According to [43], in 2020 the 3D printing market globally grew by 21% compared to 2019, which has an estimated value of $12.6 billion. In recent years, enormous efforts have been accomplished to incorporate geopolymer compounds into digital fabrication. Voney et al. [44] found the use of waste stone as mineral aggregates in terms of printing accuracy does not alter the mechanical behaviour of printed materials. According to Chauhan et al. [45], the functionalization with polyvinyl-alcohol-reinforced fibers and nanoclay additives enhances strength performance (49%) of printable geopolymer mortars. Similarly, Lie et al. [46] investigated, the automated incorporation of steel microcable lends higher bond strength (19% enhancement), greater tensile strength (82.5% increase) in comparison with non-reinforced configuration, and lower structural impact of inadequate planes among the printed layers. However, the economics of geopolymer 3D printing on an industrial scale is the key question that is limiting this green material’s adoption on an industrial scale. In fact, in Finland, geopolymer 3D printing in the construction industry has not yet started commercially, and either there is no 3D prototype printed house in the country, or it is not officially documented. This acknowledges an interesting gap in literature that needs significant consideration to analyze the economics of using this advanced technology.
This research aimed to investigate the cost analysis of geopolymer 3D printing for construction products on construction sites and in factories. The economics of geopolymers formulated from locally sourced waste materials was investigated. The study analyzed the effect of pretreatment, mixing and printing of geopolymer under one operational unit on final product cost. This project work identified different stages involved in the 3D printing of geopolymers and the required investment needed to perform all stages economically. This work is focused on a cost analysis of the most crucial parameters of geopolymer 3D printing: raw material availability, transportation, pretreatments, parameter selection, and strength requirements. In addition, we investigated the required time, cost, and quality of a 50 m2 geopolymer 3D printed house in Finland.

2. Materials and Methods

To show the potential of geopolymer 3D printing for housing projects in Finland, this study illustrates the economics of the prerequisite steps, such as raw material availability for 3D printing on construction sites and in factories. The research also examines the snags in 3D printing adoption. The financial aspects of the four principal stages, namely raw material availability for geopolymers, pretreatments, parameter selection, and printing on construction sites and in factories are taken into consideration. In this study, locally available waste as side streams from various industries (green liquor sludge, rejected fiber, fly ash, construction and demolition waste, and flotation sand) provided 32,000 tons of material annually used to synthesize geopolymers. Waste substances were displaced from industrial locations to the warehouse for further refining. Figure 1 shows the steps involved from raw material transportation to the geopolymer 3D printing of the product. Different pretreatment procedures involve waste material usage before 3D printing. The five different wastes used in this study needed various treatment techniques that required operating area, equipment, energy, and machinery with the corresponding associated cost. The materials and cost estimates adopted in this study for each stage are illustrations and cannot accurately be extrapolated to every condition. The primary purpose of the inspection is to derive a formula to calculate the economics of geopolymer printing for each stage.

2.1. Raw Material Transportation and Storage

Five different wastes were used to produce geopolymers. These wastes were collected from various industrial areas located in Finland (south Karelia region) and transported to the warehouse for purification processes. The distance between industrial area to warehouse is 50 km. For raw material transportation, five-axle trucks are considered to carry 20 tons of raw material in one trip. In Finland, eight- and nine-axle truck units are allowed, with a maximal weight of 68 and 76 tons, respectively, and 4.4 m in height [47]. The speed limit on the primary road is 60 km/h and on the secondary road it is 50 km/h, and these were used to calculate trip time. Several requirements and packaging procedures were necessary for each raw material transportation. Means of transportation, product specification, taxes, cost of loading and unloading, and labor and management costs are the main parameters taken into consideration to calculate the overall required logistics cost. Table 1 shows all the important factors considered while calculating the material transportation cost from an industrial site to the warehouse. The distance between the endpoints plays a significant role in logistical cost, as fuel consumption increases with the distance.
Similarly, in transportation, product sophistication is an important factor that affects the decisive improvement in transportation cost. Table 2 presents all the factors and required investment related to transport management and operational tasks. The higher labor cost in the freight, carrier, and shipment sectors increases the overall price of transport management (52%). Activities performed in a warehouse and their costs are illustrated in Table 3. The total operating time and cost estimates can vary in practice. The calculated cost illustrates the required annual investment needed for the warehouse, whereas transportation management and organization cost calculations are based on monthly expenses.

2.2. Pretreatment Techniques

Different pretreatment techniques are required for waste material usage before 3D printing. The data considered for calculating the pretreatment costs are shown in Table 4. These values are constant for all waste types. The pretreatment costs were obtained from the literature [48]. The cast needed to perform pretreatment techniques for the various wastes is presented in Table 5. For each raw material, the cost was calculated considering the sum of labor, maintenance, plant, equipment, installations, insurances, cement solidification, energy costs, and contingency (an incidental/uncertain cost: in calculations some of the expenses are predicted based on previous experience, therefore contingency of about 10% of the whole investment is considered in case of uncertainty).

2.3. Parameter Selection and Strength Requirements

The geopolymer strength depends upon the selection of various parameters such as curing temperature, concentration of chemicals, ratio of solid solution, curing time, alkali solution molar ratio, elementary materials containing silica and aluminum concentration, type of additives, admixtures, and alkali solution type. To identify the effect of mix and particle size on the compression strength of a geopolymer, M30 (concrete standard grade) is considered. Concrete grades M20, M25 and M30 are considered suitable for mild, moderate, and severe weather conditions. In Finland, the average temperatures range in winter are from −25 °C to −50 °C, and 30 to 90 cm of snow is recorded, each year [49]. The concrete surface is exposed to extreme weather conditions. Therefore, M30 concrete is considered an ideal option for durability and extreme exposure conditions. The mix proportion, required material, coarse aggregate size, and unit price needed to produce 1 m3 of geopolymer concrete are calculated as explained in Table 6.

2.4. Factory Site 3D Printing

Construction product printing on factory sites has four primary stages: 3D printing of components, transportation, assembly, and postprocessing techniques. The total cost of the printed product on a factory site comprises the cost of net printing, transportation, assembly, and postprocessing techniques. Factory printing depends on many factors, as shown in Table 7. The 3D net printing cost of components is calculated by adding the sum of material, energy, manufacturing, and labor costs. While calculating manufacturing cost, detailed design, equipment depreciation, machine maintenance, and environmental protection factors are considered.
The labor and material costs of 3D printing of the components in the factory were calculated separately from the labor and equipment costs associated to the assembly stage. Therefore, the assembly costs were calculated by summing the costs of labor, installation, energy, and safety measures.

2.5. Construction Site 3D Printing

As there are no related standards nor 3D printed houses in Finland, the cost estimation of 3D printed houses was based on the data obtained from a 3D printed house manufactured by Apis Cor in 2016 [50]. To calculate the labor and material costs needed for the 3D printing of a house in Finland, Apis Cor manufacturing prices for labor and material were replaced by the local Finnish market prices. The 3D printed house manufactured by Apis Cor was selected because it provides all fundamental cost details and technical information. In addition, Apis Cor built houses at −35 °C, a temperature suitable for the Finnish climate. The Apis Cor manufactured house had a 38 m2 area, whereas in this study, a 50 m2 area is considered for calculating the cost of a 3D printed house. Table 8 shows the required estimated cost needed to build a 3D printed house on the construction site. The number of hours, labor cost, material cost, and printing time can vary. The investment needed for purchasing 3D printers is not included in this cost estimation of a 3D printed house. According to the Apis Cor, less than one day is required to complete the required partitions, self-bearing walls and building envelope, with a total cost estimation of € 8330.94. (On the company website costs are given in dollars which were converted into euros.) A list of costs was summarized according to Apis Cor: floor and roof cost, €2000.25; wiring, €98.63; traditional foundation, €227.36; windows and doors, €2912.13; printed walls, €1347.72; interior finishing, €966.88; and exterior finishing, €682.07.

3. Results and Discussion

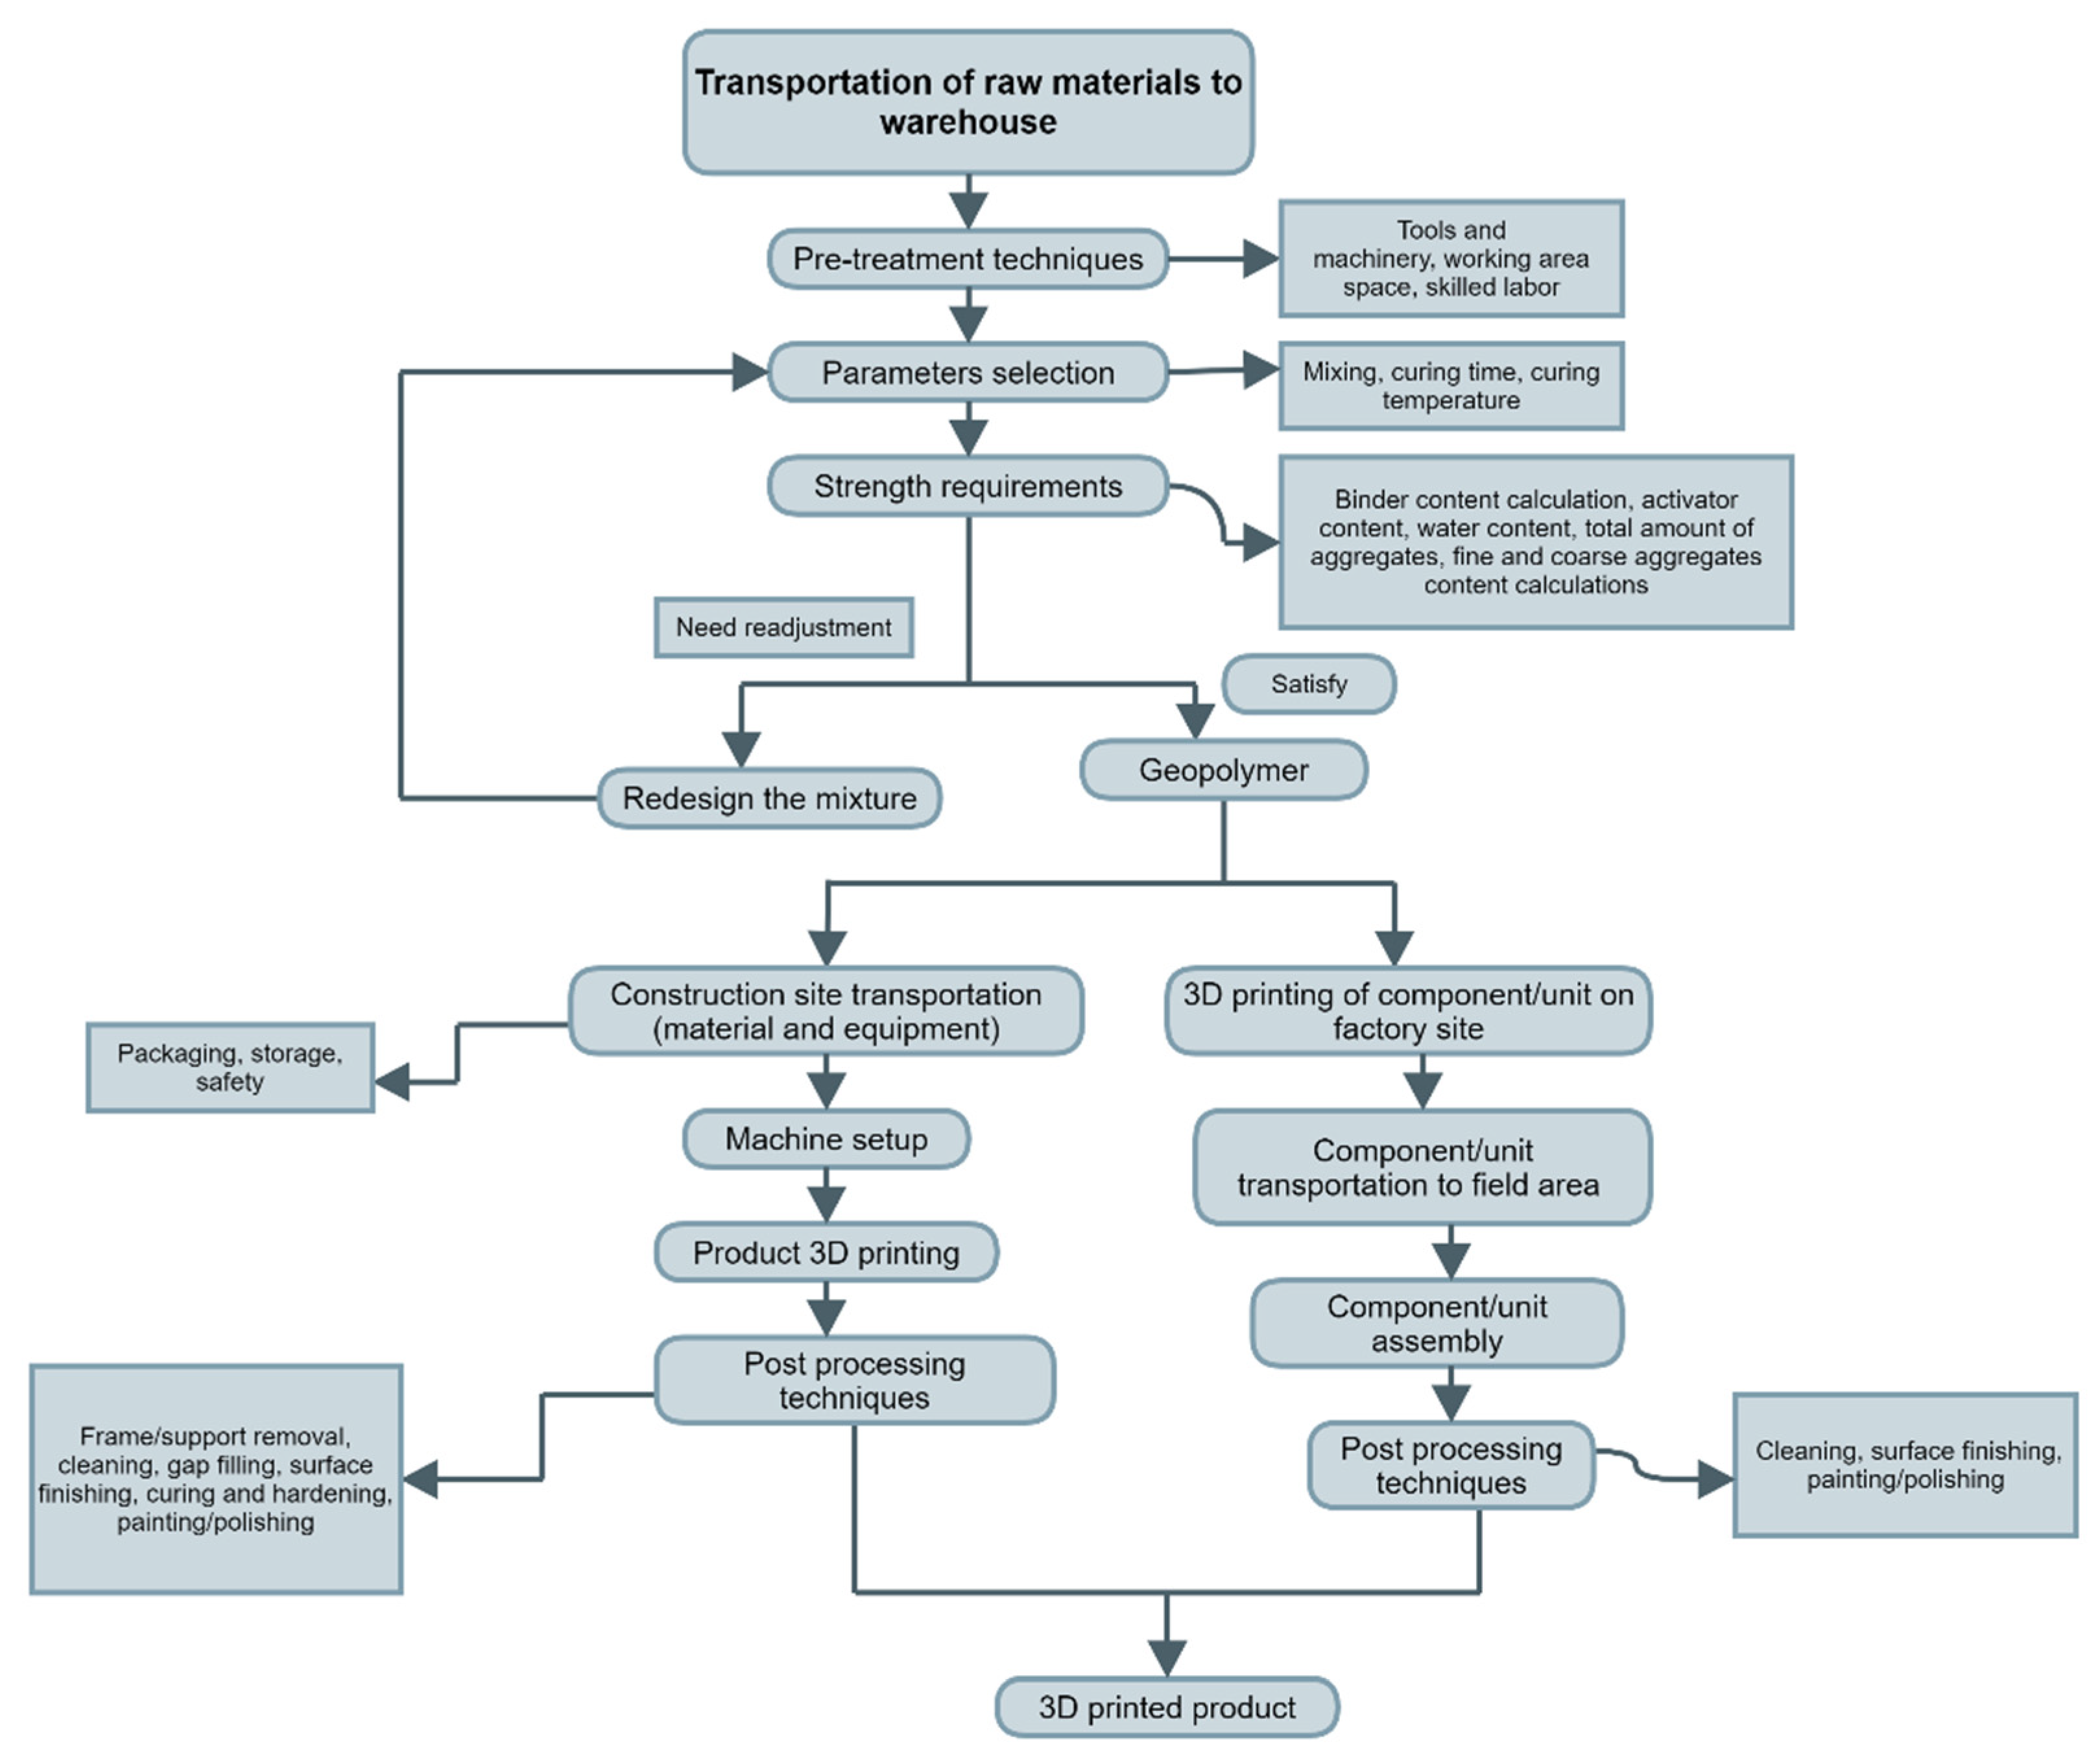
The prerequisites for 3D printing of geopolymers is the availability of raw materials and their transportation to warehouses for pretreatment. Approximately 32,000 tons of raw material annually require further processing for printing. Economical and sustainable functions and processes are determined to establish a continuous flow of materials. The transportation cost of raw materials for geopolymer synthesis is a significant element of the overall cost. The financial aspects of transportation depend on time, accessibility, and distance. Transport is an integral constituent of any production process from an economic frame of reference. 
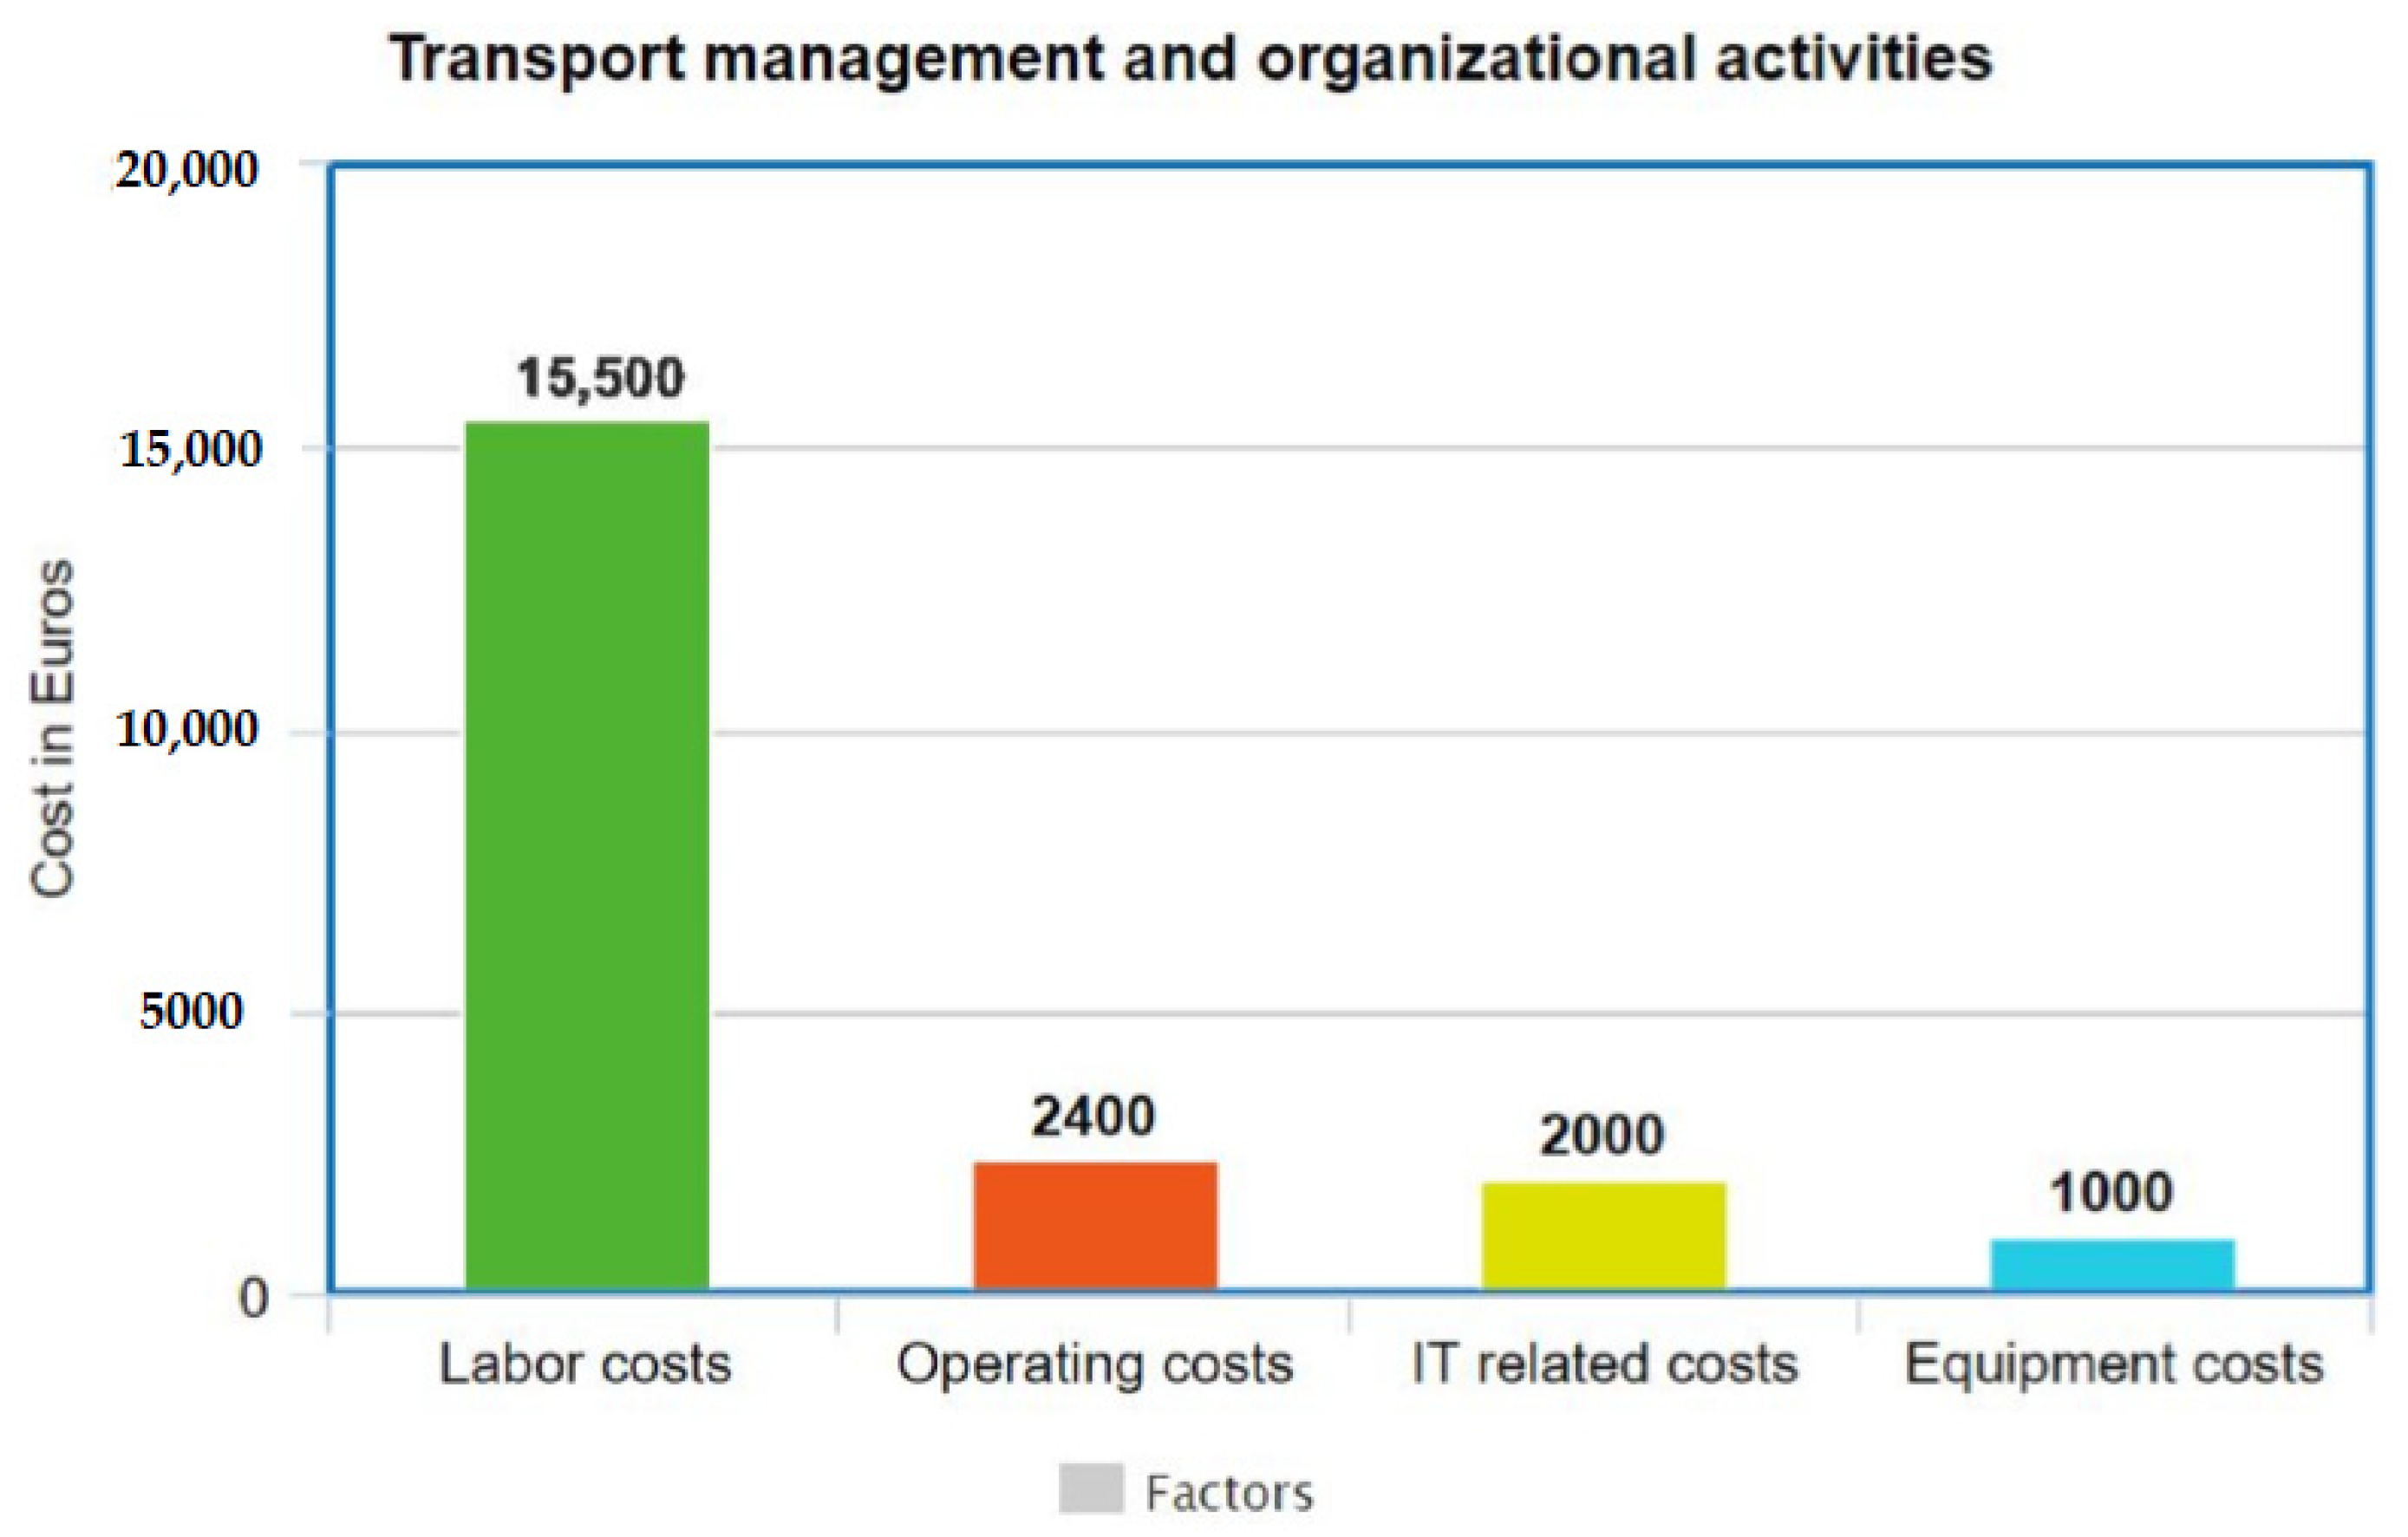
Table 9 illustrates the components which were considered to calculate the cost of various functions perform under transport organizational and operational activities. Factors such as labor, equipment, IT, and operating costs are key specifications for transport expenditure. Labor cost, having the highest value, seems to be the most prominent aspect altering the value of the final product, as shown in Figure 2. The IT-related cost has the second largest value, whereas the equipment cost has the least effect on the final values.
The effect of labor cost in the freight, carrier, and shipment sectors is significant. Wages, extra time payment, and payroll taxes are the factors considered for calculating labor costs. Besides IT-related expenses, labor cost is the most essential factor affecting the overall price of transport management. Monthly expenses of transport management and organizational activities are illustrated in Table 2, which shows that over 70% of total expenditures are spent by an employer for employing staff, because of the higher salary rate. The estimated monthly expenditures needed for organizational and management activities are €20,900. Therefore, annually €250,800 are needed for management activities to perform transportation of 32,000 tons of raw materials. The Table 2 also shows that transport management represents 52%, whereas transport operation and organization represent 48% of the overall transportation cost.
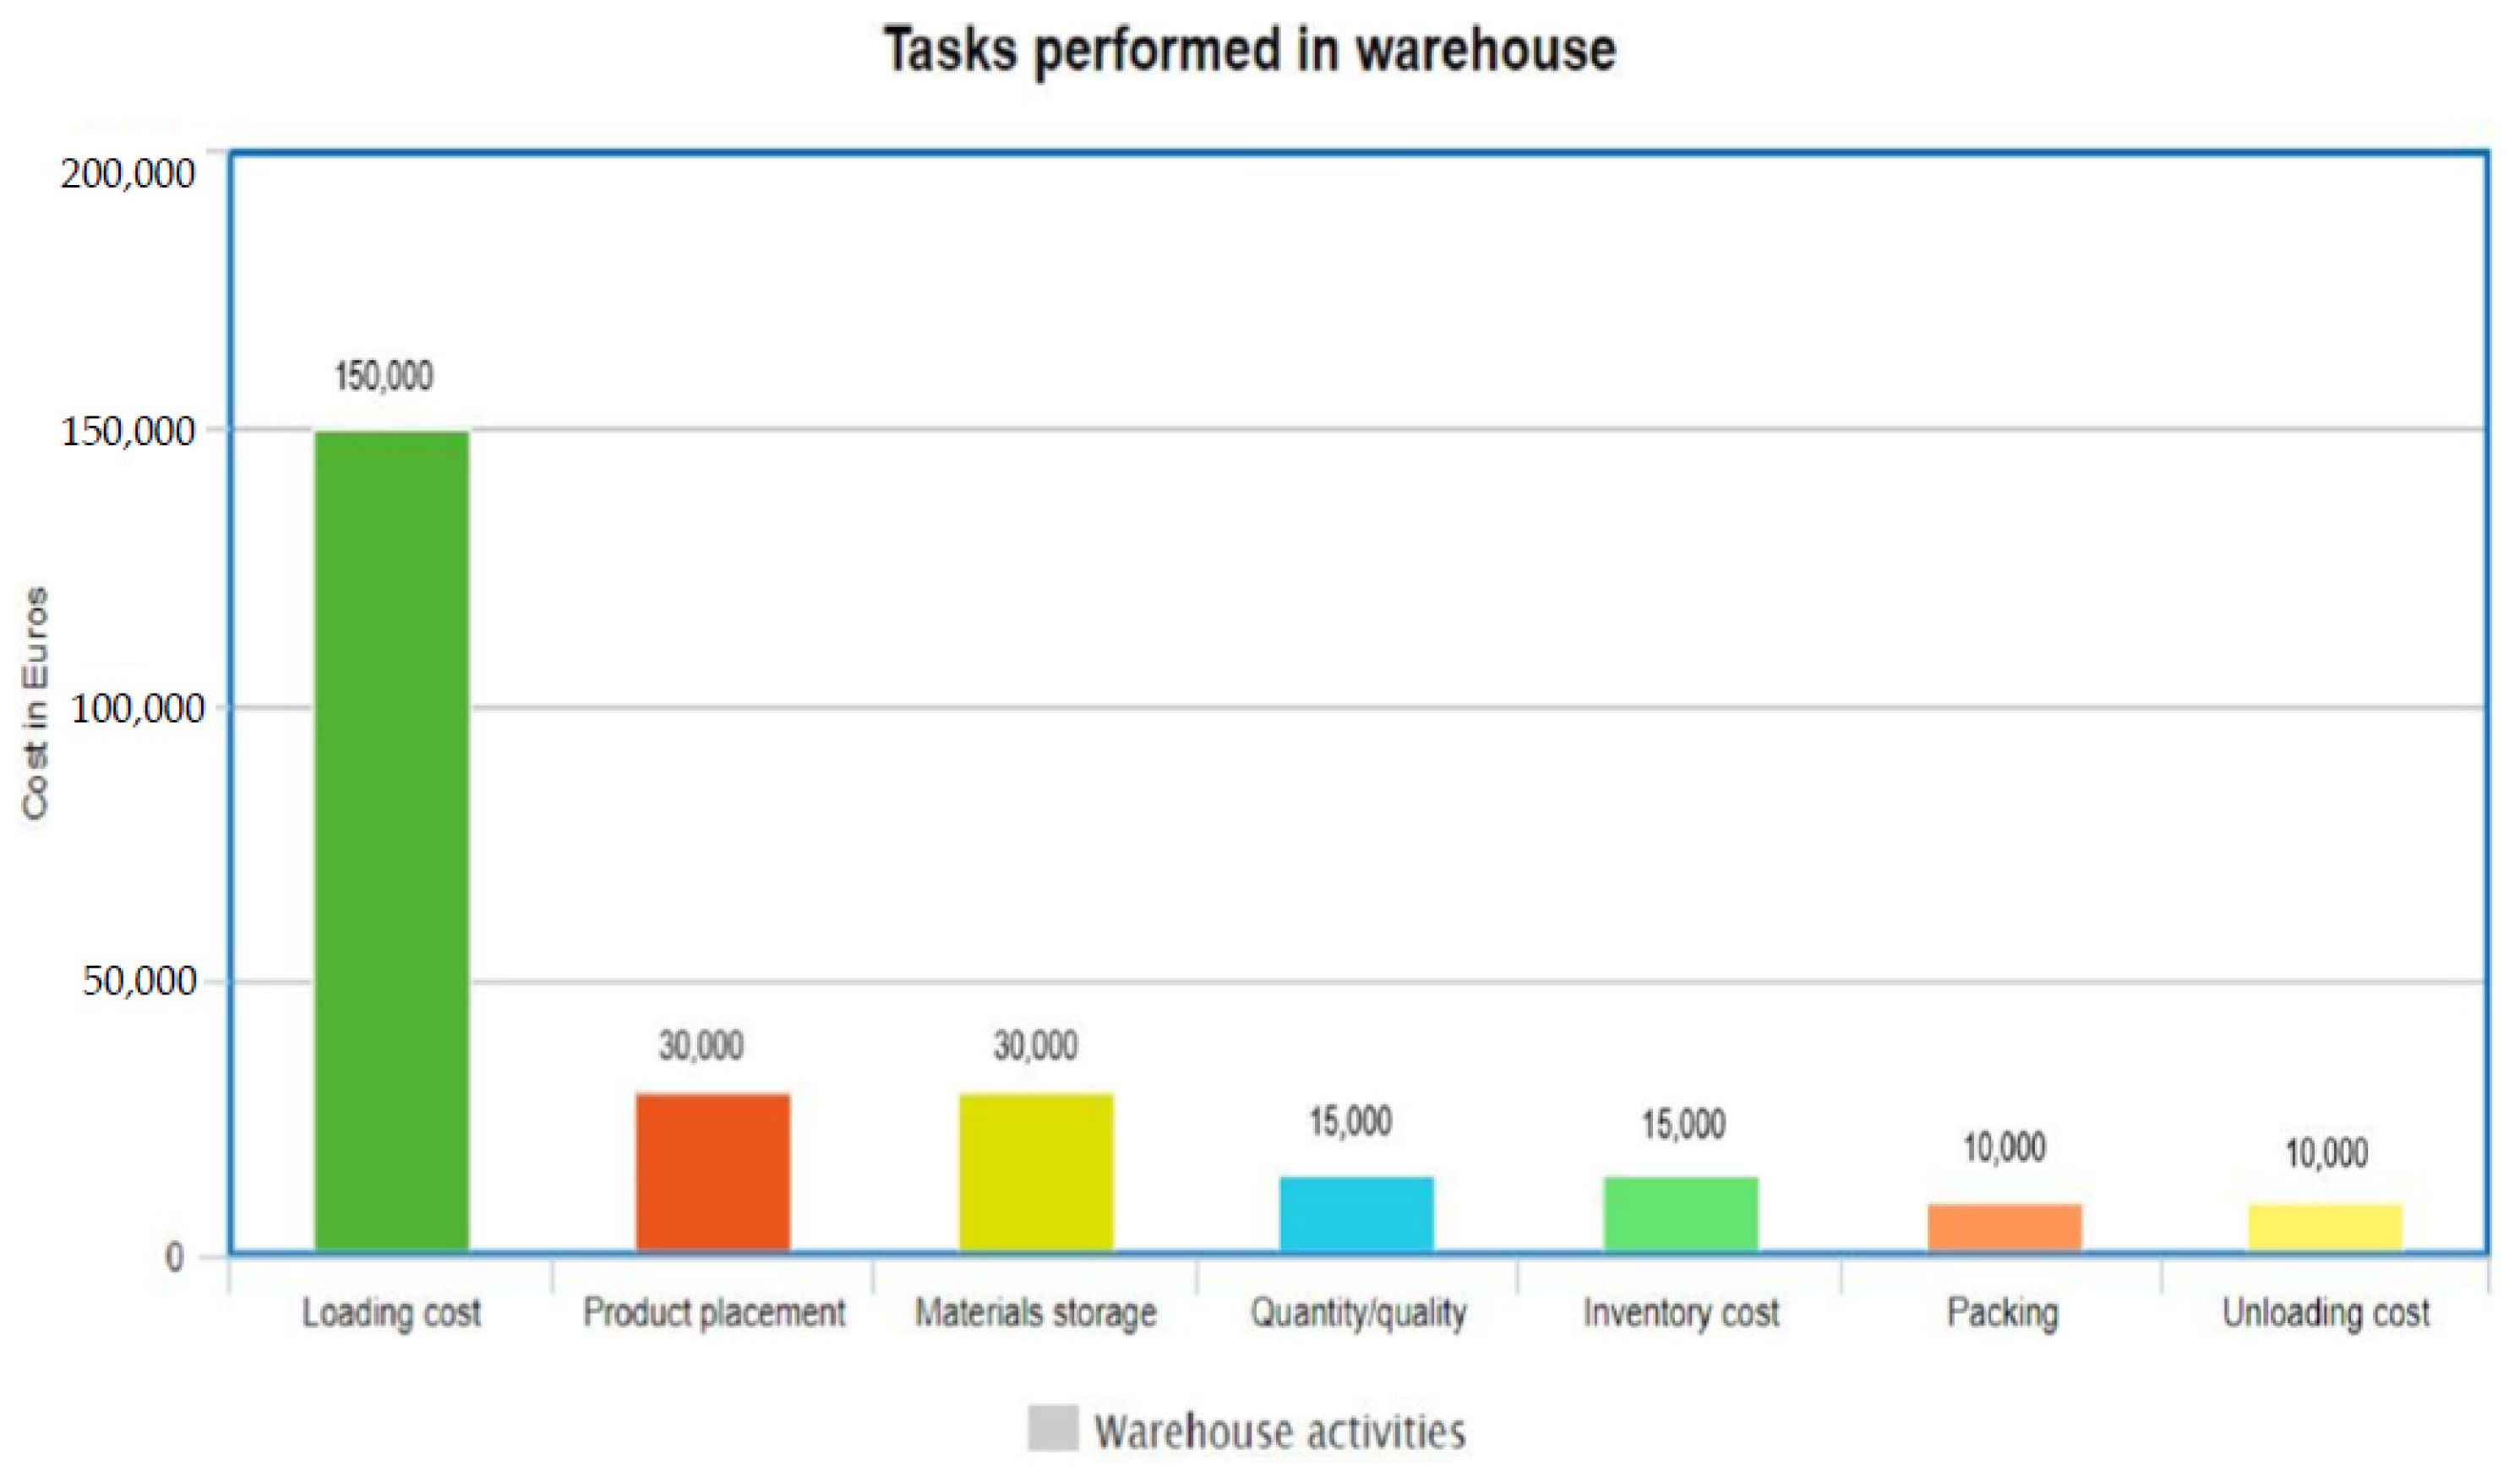
The cost calculation of a warehouse is based on labor, operating, IT-related, equipment, and area utilization costs. Labor cost is the biggest factor, representing 79% of the overall cost of a warehouse, as shown in Table 3. Each raw material needs different packaging, storage space, equipment, and operating conditions. Processes considered for warehousing cost calculation are loading/unloading, quality and quantity of material, packing, material storage, product placement, and inventory cost, as presented in Figure 3. In addition to storage, loading is a vital process affecting the entire warehousing cost significantly. The estimated investment cost needed for warehouse activities is €328,500. Therefore, the total estimated amount of investment needed for transportation and warehouse activities of 32,000 tons of raw material annually is €579,300.

3.1. Pretreatment Cost

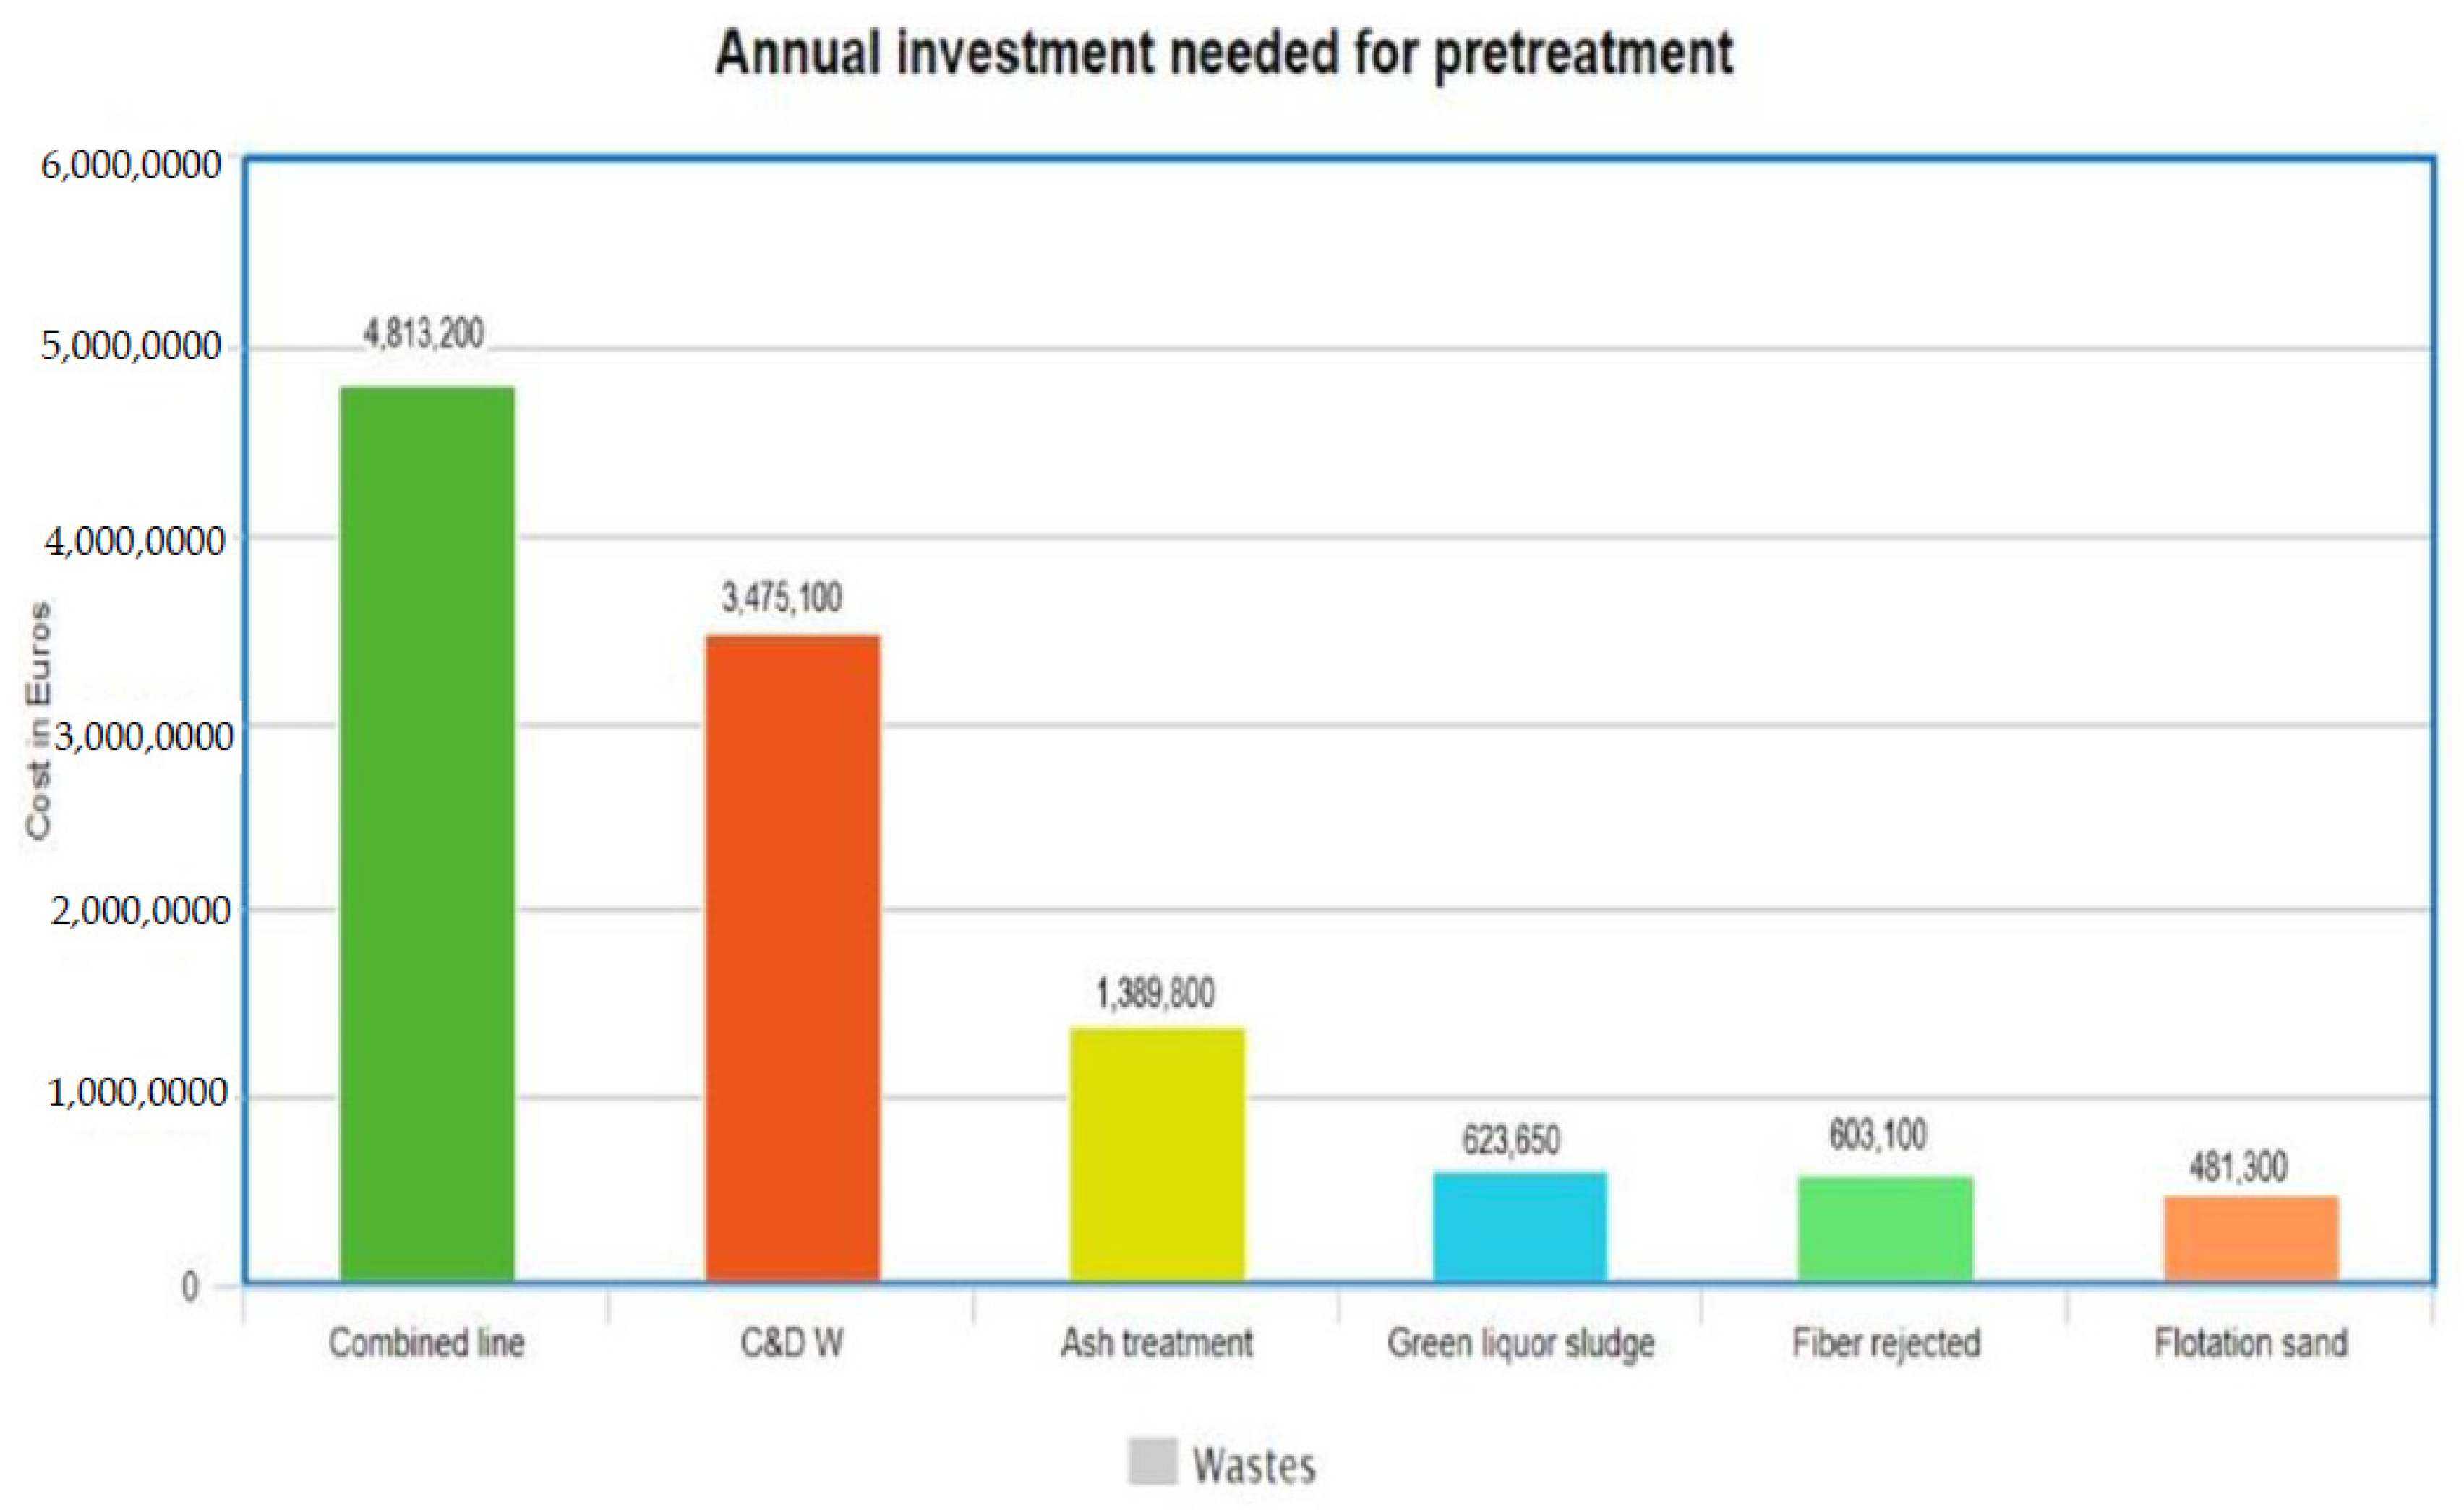
After waste material transportation, the second most crucial step is the specific treatment technique for each waste. These treatment techniques make the raw material useful for 3D printing purposes. Many studies have already been conducted on construction and demolition waste (C&D W) and ash utilization for concrete production, but green liquor sludge and rejected fiber are not as widely used as recycled materials. The annual investment required to perform pretreatment techniques is presented in Figure 4.
Machinery, plant area, maintenance, installation, and labor costs are crucial parameters to investigate annual investment costs for pretreatments. Construction and demolition waste require the highest amount of total investment for pretreatment techniques. The largest plant area (2000 m2) is needed for 8000 tons of C&D W. Similarly, a greater amount of energy is needed for C&D W pretreatments.

3.2. Strength Requirements and Parameter Selection

The geopolymer strength depends upon the selection of various parameters such as curing temperature, concentration of chemicals, ratio of solid solution, curing time, alkali solution molar ratio, elementary materials containing silica and aluminum concentration, type of additives, admixtures, and alkali solution type. In addition to material selection, the strength of geopolymer concrete relies on the curing temperature conditions.
A study conducted by V. Patil et al. [51] showed that the compressive strength of geopolymer concrete is higher at oven curing temperature compared to that at ambient curing temperature, as dissolution of alumina and silica in an alkaline solution is better at high temperatures. Similarly, as the concrete ages, a slightly higher compression strength can be attained. After curing the concrete for 28 days, 30, 40 and 50 MPa strength should be achieved for M30, M40, and M50 grades of concrete, respectively.
The compression strength after seven days of curing must be 70% of the total required compression strength. The enhancement in the percentage of fine aggregates and coarse aggregates increased the strength to the optimum level. Based on the calculations shown in Table 6, the production cost of geopolymer concrete is higher than that of OPC because of the raw material pretreatment techniques. A study conducted by Rajini et al. [52] illustrated that the initial material cost of GPC (M45) was almost 32% higher than that of conventional concrete (M45). However, natural resources, environment, sustainability, cost of maintenance, and GPC properties offset the initial cost production of GPC.

3.3. Factory 3D Printing

Components in the form of batches are printed inside the factory. Components such as walls, foundations, floor, roofs, windows, and doors are printed separately and assembled at the construction site. The formula explained in Table 10 presents the cost calculation of the printed components. The manufacturing cost of the printed components includes all the steps required inside the company to produce the printed components. In manufacturing, labor is one of the most crucial factors that has a significant impact on the final product cost. Industry experiences illustrate that the labor cost effect may be up to 60% of the final product cost. The cost structure of components printed in a factory is divided into labor, material, and equipment expenses. All components such as internal walls, external walls, foundation, floor, roof, ceiling, doors, and windows are printed separately and assembled on-site. Major factors of the cost composition at the assembly stage of 3D printed components include sub engineering, measuring, and project-related costs.

3.4. Construction Site 3D Printing

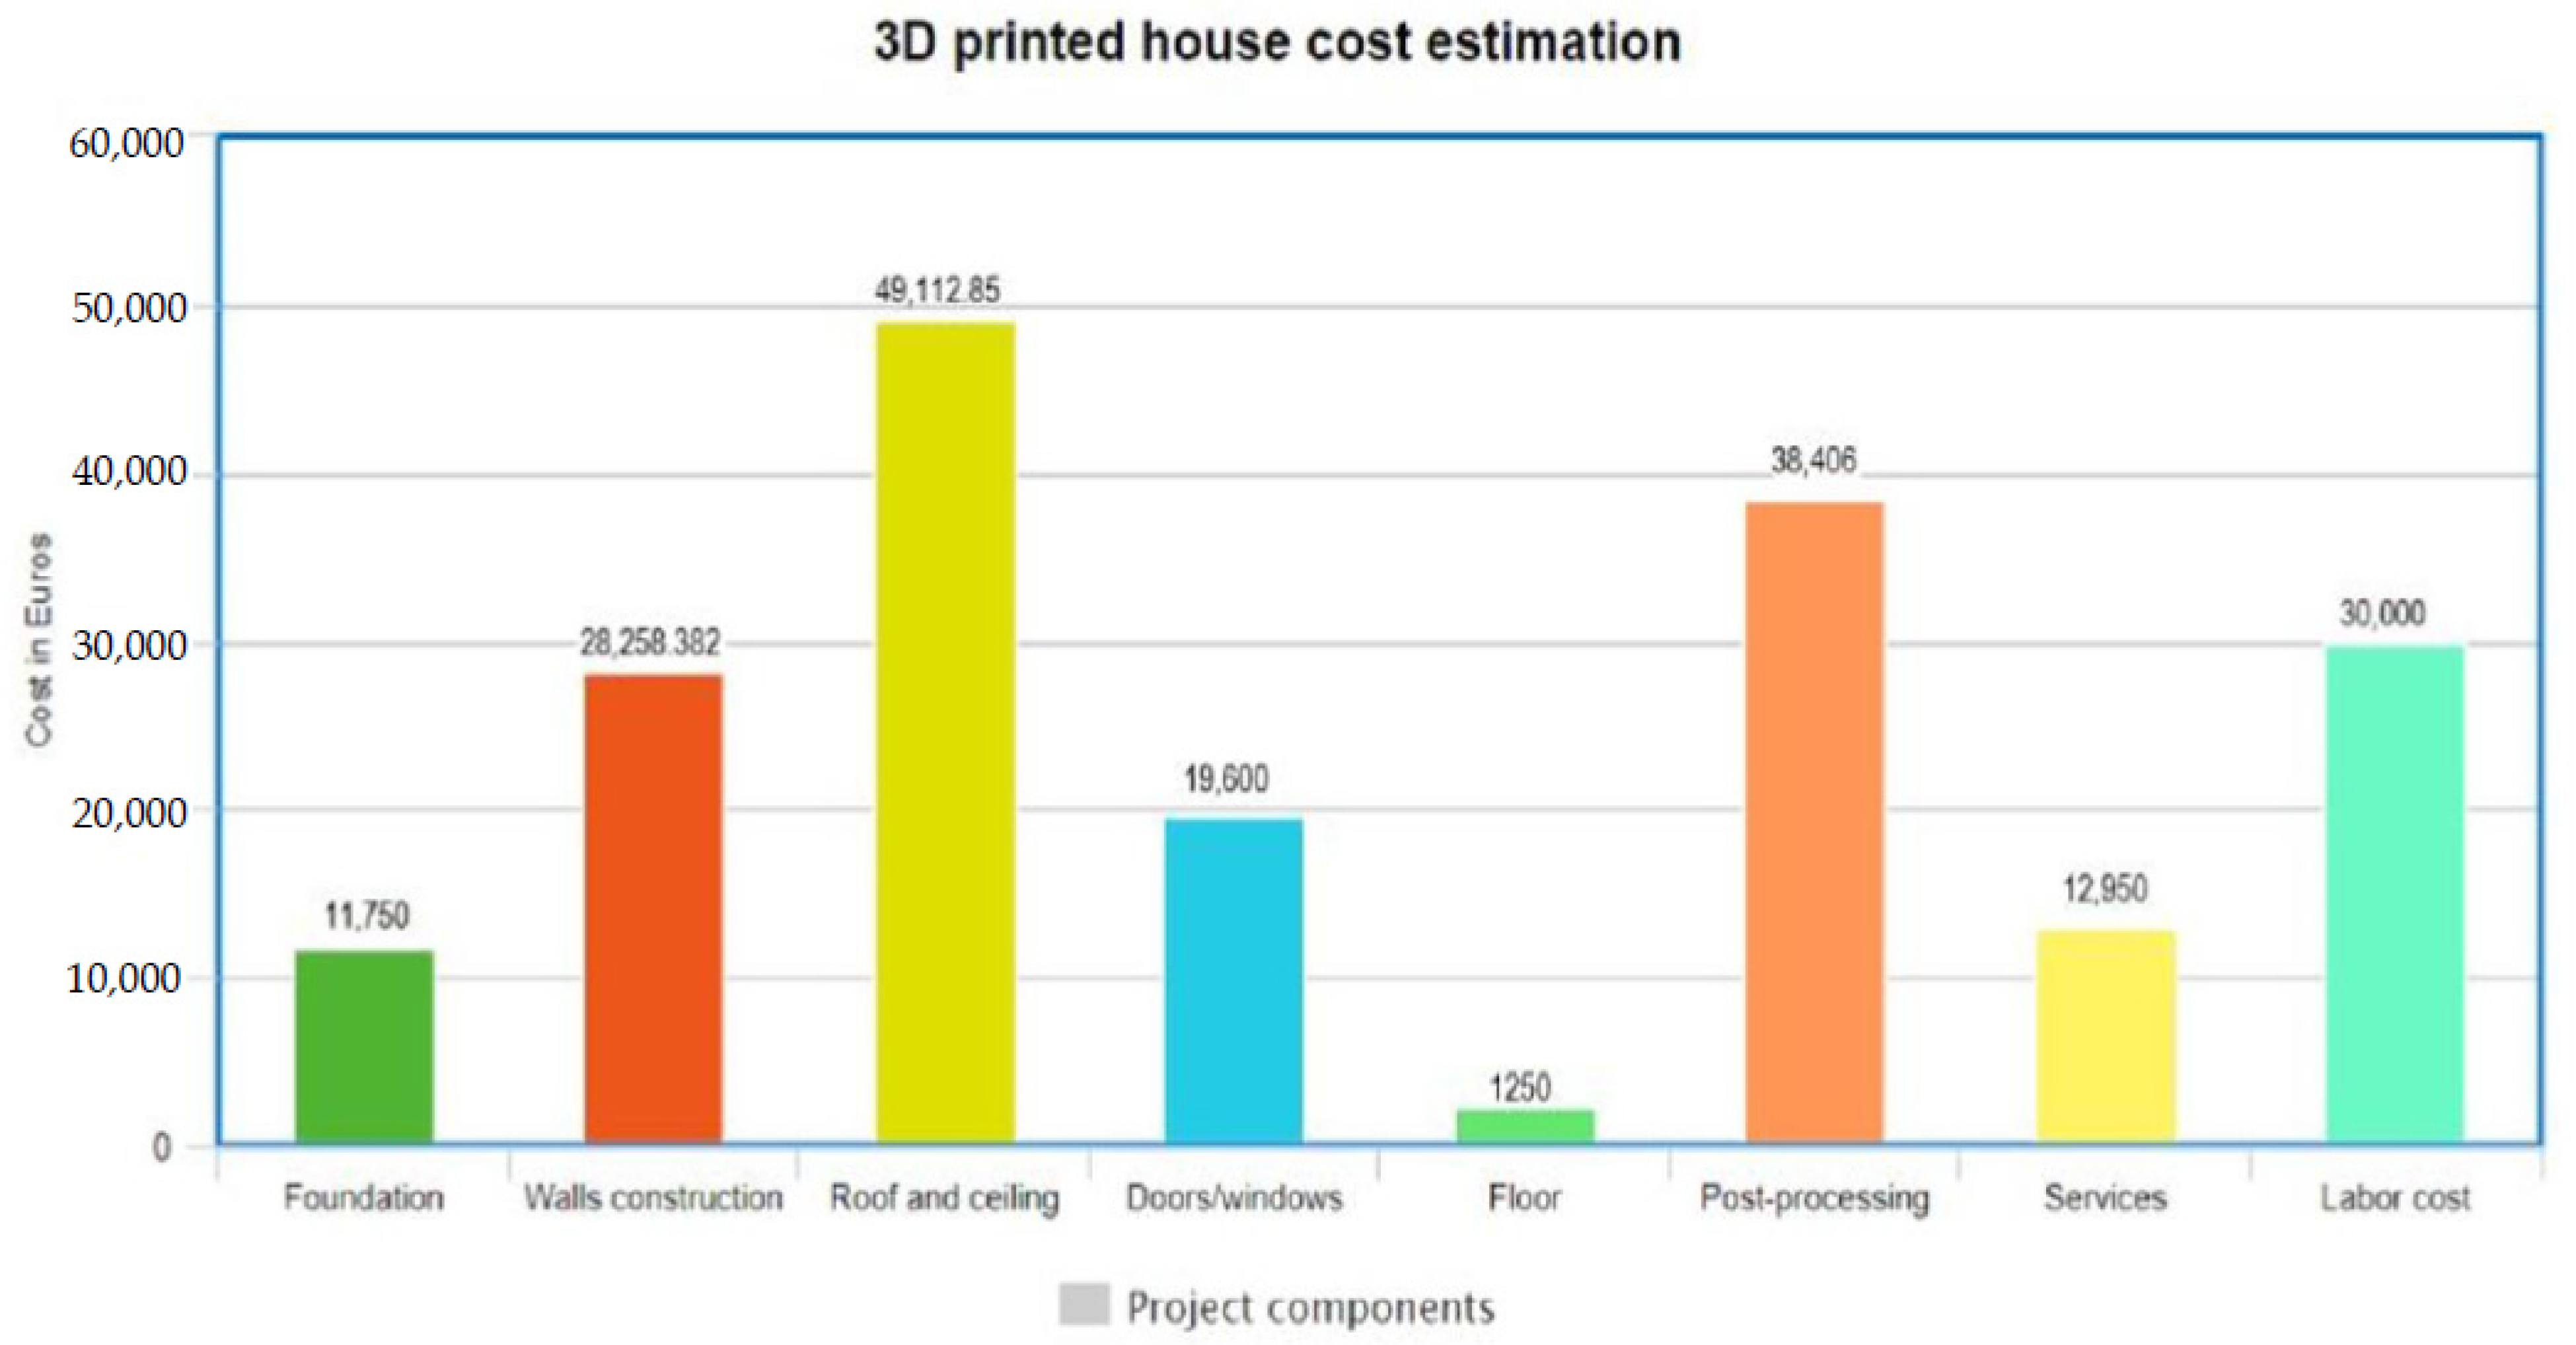
The 3D printed house elemental estimate varies significantly from the traditional construction method, as explained in Table 8. It can also be noticed that the 3D printed house requires less time for manufacturing compared to traditional manufacturing techniques. The cost composition of all the construction products includes installation, equipment, postprocessing, health, safety, and services-related factors of the project. Figure 5 shows that roof and ceiling account for the highest cost, with a value of €49,112.85, compared to other factors.
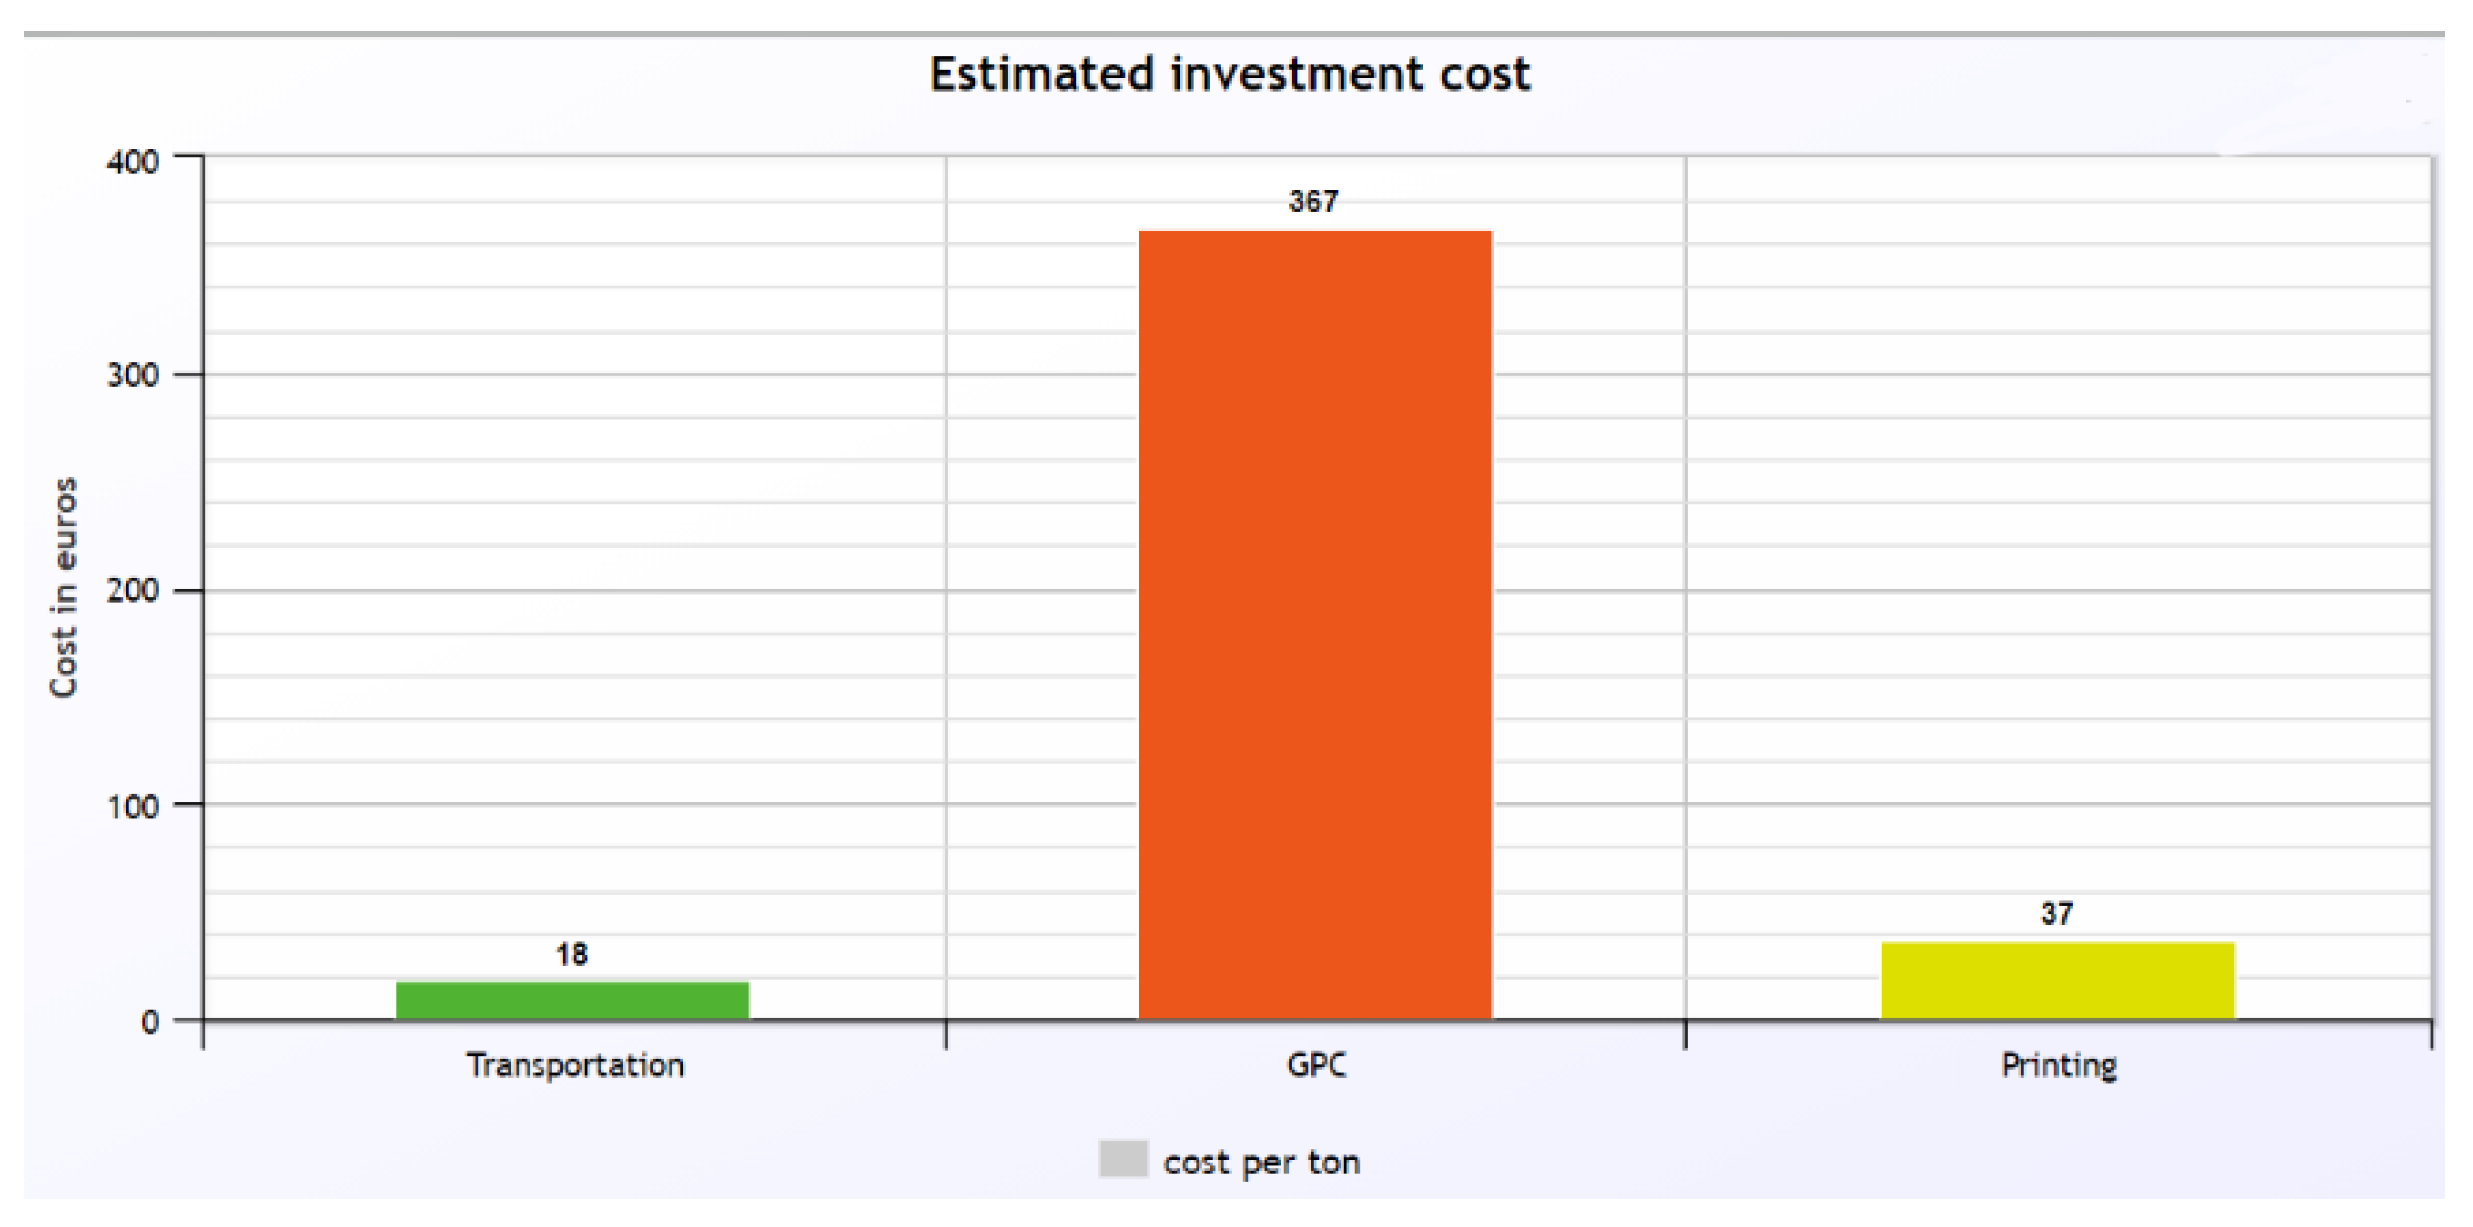
The estimated time needed to build a complete house is between 13 and 16 weeks. The investment cost per ton needed for each stage is presented in Figure 6. The raw material used after pretreatment to produce geopolymer concrete is the most vital stage that affects the overall cost significantly, whereas transportation has the least effect on the cost structure. To calculate the cost per ton at each stage, the required initial investment is divided by the total amount of material. To transport 32,000 tons of raw material, a €579,300 initial investment is needed for management and operational activities. The transportation cost required for one ton of raw material is €18. Similarly, for pretreatments and geopolymer concrete production the cost is €367 and the costs of planning, sourcing, printing, and finishing are estimated at €37 per ton. Therefore, an estimated total of €422 is required for one ton of geopolymer 3D printing. The 3D printing and labor costs are not included in the total cost.
The total capital expenditures (CAPEX) and operating expenditures (OPEX) required for geopolymer 3D printing on construction sites is shown in Table 11. The capital expenditures reflect the cost needed to buy or purchase physical assets, such as machineries, installations of machineries and contingency costs. The operating expenditures show the required investment needed to perform various tasks on a monthly basis.
Geopolymer 3D printing cost estimation analysis illustrates that raw materials pretreatment techniques are the most important stage which affects the overall product cost significantly. The raw materials pretreatment techniques consume almost 87% of final product cost. The total estimated cost needed to build a 50 m2 3D printed house in Finland using the traditional and 3D printed techniques are shown in Table 12. GPC strength lies in the waste material used because it promises sustainability and consume less energy compared to the same amount of OPC production. The production cost of M30 GPC is slightly higher than the same grade of OPC. Therefore, houses built through GPC 3D printing have marginally higher costs than OPC printed houses.

4. Conclusions

Through this research, the evaluation of the possibility of using industrial wastes for geopolymer 3D printing in factories and on construction sites has provided a complete understanding of the construction time, cost, and energy demand. Our geopolymer 3D printing cost analysis showed that the use of sustainable materials through reliable and economical manufacturing techniques in the construction industry reduced the construction time and decreased nearly 50% energy demand, compared to traditional manufacturing techniques. A GPC 3D-printed house has almost 32% less production cost than a house built through conventional manufacturing techniques with OPC. Geopolymer technology gives a reasonable promise of reduction in global warming and CO2 emissions, for the construction industry as an alternative binder to OPC.
Construction site geopolymer 3D printing presents many benefits, due to their potential to reduce construction time, waste materials, energy, complexity of framework, and required tools. The study also found that the production cost of M30 GPC is slightly higher than the same grade of OPC. Therefore, houses built through GPC 3D printing have marginally (1.7%) higher costs than OPC printed houses. However, the benefits such as sustainability, natural resource-saving, maintenance cost, better mechanical and durable properties can be obtained through the production of geopolymer, which would offset the initial material cost.
The research results demonstrated the energy cost needed to carry out pretreatment processes for waste materials is approximately 2–3% of the total annual investment required for pretreatment techniques. The profitability of waste materials’ pretreatment is highly dependent on the processing capacity. The combined line treatment shows the annual investment cost per ton for pretreatment can significantly decreased through the utilization of higher processing capacity. However, in the future, developments in new technologies for waste material pretreatments, curing conditions, and new digital design workflow for the industry are required to reduce the cost and increase efficiency.

Author Contributions

Conceptualization, Q.M.; methodology, Q.M.; validation, Q.M. and T.K.; investigation, Q.M. and T.K.; data curation, Q.M. and T.K.; writing—original draft preparation, Q.M. and T.K.; visualization T.K. Both authors have read and agreed to the published version of the manuscript.

Funding

This research received no external funding.

Institutional Review Board Statement

Not applicable.

Informed Consent Statement

Not applicable.

Data Availability Statement

The data presented in this study are available on request from the corresponding author.

Conflicts of Interest

The authors declare no conflict of interest.

References

  1. Lafhaj, Z.; Rabenantoandro, A.Z.; El Moussaoui, S.; Dakhli, Z.; Youssef, N. Experimental Approach for Printability Assessment: Toward a Practical Decision-Making Framework of Printability for Cementitious Materials. Buildings 2019, 9, 245. [Google Scholar] [CrossRef] [Green Version]
  2. Rehman, A.U.; Sglavo, V.M. 3D printing of geopolymer-based concrete for building applications. Rapid Prototyp. J. 2020, 26, 1783–1788. [Google Scholar] [CrossRef]
  3. Lim, S.; Buswell, R.; Le, T.; Austin, S.; Gibb, A.; Thorpe, T. Developments in construction-scale additive manufacturing processes. Autom. Constr. 2012, 21, 262–268. [Google Scholar] [CrossRef] [Green Version]
  4. Paul, S.C.; Van Zijl, G.P.; Tan, M.J.; Gibson, I. A review of 3D concrete printing systems and materials properties: Current status and future research prospects. Rapid Prototyp. J. 2018, 24, 784–798. [Google Scholar] [CrossRef] [Green Version]
  5. Ralli, Z.G.; Pantazopoulou, S.J. State of the art on geopolymer concrete. Int. J. Struct. Integr. 2021, 12, 511–533. [Google Scholar] [CrossRef]
  6. Eurostat. 2018, Eurostat Statistics Explained. Waste Statistics. Available online: https://ec.europa.eu/eurostat/statistics-explained/pdfscache/1183.pdf (accessed on 10 July 2019).
  7. Wangler, T.; Roussel, N.; Bos, F.P.; Salet, T.A.; Flatt, R.J. Digital Concrete: A Review. Cem. Concr. Res. 2019, 123, 105780. [Google Scholar] [CrossRef]
  8. Xia, M.; Sanjayan, J. Method of formulating geopolymer for 3D printing for construction applications. Mater. Des. 2016, 110, 382–390. [Google Scholar] [CrossRef]
  9. Naqi, A.; Jang, J.G. Recent Progress in Green Cement Technology Utilizing Low-Carbon Emission Fuels and Raw Materials: A Review. Sustainability 2019, 11, 537. [Google Scholar] [CrossRef] [Green Version]
  10. Andrew, R.M. Global CO2 emissions from cement production, 1928–2018. Earth Syst. Sci. Data 2019, 11, 1675–1710. [Google Scholar] [CrossRef] [Green Version]
  11. Meddah, M.S.; Al-Harthy, A.; Ismail, M.A. Recycled Concrete Aggregates and Their Influences on Performances of Low and Normal Strength Concretes. Buildings 2020, 10, 167. [Google Scholar] [CrossRef]
  12. Ho, F.H.; Abdul-Rashid, S.H.; Ghazilla, R.A.R.; Woo, Y.L. Resources Sustainability through Material Efficiency Strategies: An Insight Study of Electrical and Electronic Companies. Resources 2019, 8, 117. [Google Scholar] [CrossRef] [Green Version]
  13. Saeli, M.; Novais, R.; Seabra, M.; Labrincha, J. Green geopolymeric concrete using grits for applications in construction. Mater. Lett. 2018, 233, 94–97. [Google Scholar] [CrossRef]
  14. Asim, N.; Badiei, M.; Torkashvand, M.; Mohammad, M.; Alghoul, M.A.; Gasaymeh, S.S.; Sopian, K. Wastes from the petroleum industries as sustainable resource materials in construction sectors: Opportunities, limitations, and directions. J. Clean. Prod. 2021, 284, 125459. [Google Scholar] [CrossRef]
  15. Abdollahnejad, Z.; Pacheco-Torgal, F.; Félix, T.; Tahri, W.; Aguiar, J. Mix design, properties and cost analysis of fly ash-based geopolymer foam. Constr. Build. Mater. 2015, 80, 18–30. [Google Scholar] [CrossRef] [Green Version]
  16. Nematollahi, B.; Sanjayan, J.; Shaikh, F. Synthesis of heat and ambient cured one-part geopolymer mixes with different grades of sodium silicate. Ceram. Int. 2015, 41, 5696–5704. [Google Scholar] [CrossRef]
  17. Nematollahi, B.; Sanjayan, J. Effect of different superplasticizers and activator combinations on workability and strength of fly ash based geopolymer. Mater. Des. 2014, 57, 667–672. [Google Scholar] [CrossRef]
  18. Ueng, T.-H.; Lyu, S.-J.; Chu, H.-W.; Lee, H.-H.; Wang, T.-T. Adhesion at interface of geopolymer and cement mortar under compression: An experimental study. Constr. Build. Mater. 2012, 35, 204–210. [Google Scholar] [CrossRef]
  19. Ma, C.-K.; Awang, A.Z.; Omar, W. Structural and material performance of geopolymer concrete: A review. Constr. Build. Mater. 2018, 186, 90–102. [Google Scholar] [CrossRef]
  20. Panda, B.; Tan, M.-J. Experimental study on mix proportion and fresh properties of fly ash based geopolymer for 3D concrete printing. Ceram. Int. 2018, 44, 10258–10265. [Google Scholar] [CrossRef]
  21. Davidovits, J. Geopolymer Cement. 2013. Available online: https://www.geopolymer.org/fichierspdf/GPCement2013.pdf (accessed on 19 October 2018).
  22. Topark-Ngarm, P.; Cao, T.; Chindaprasirt, P.; Sata, V. Strength and Behaviour of Small-Scale Reinforced High Calcium Fly Ash Geopolymer Concrete Beam with Short Shear Span. Key Eng. Mater. 2016, 718, 191–195. [Google Scholar] [CrossRef]
  23. He, R.; Dai, N.; Wang, Z. Thermal and Mechanical Properties of Geopolymers Exposed to High Temperature: A Literature Review. Adv. Civ. Eng. 2020, 2020, 1–17. [Google Scholar] [CrossRef] [Green Version]
  24. Al-Qutaifi, S.; Nazari, A.; Bagheri, A. Mechanical properties of layered geopolymer structures applicable in concrete 3D-printing. Constr. Build. Mater. 2018, 176, 690–699. [Google Scholar] [CrossRef]
  25. Yao, Y.; Hu, M.; Di Maio, F.; Cucurachi, S. Life cycle assessment of 3D printing geo-polymer concrete: An ex-ante study. J. Ind. Ecol. 2019, 24, 116–127. [Google Scholar] [CrossRef] [Green Version]
  26. Shah, N.A. Comparative Study of Strength of Fibre Reinforced Geo polymer Concrete and Conventional OPC Concrete. Int. J. Trend Sci. Res. Dev. 2018, 2, 378–383. [Google Scholar] [CrossRef]
  27. Mechtcherine, V.; Nerella, V.N.; Will, F.; Näther, M.; Otto, J.; Krause, M. Large-scale digital concrete construction–CONPrint3D concept for on-site, monolithic 3D-printing. Autom. Constr. 2019, 107, 102933. [Google Scholar] [CrossRef]
  28. Zhang, X.; Li, M.; Lim, J.H.; Weng, Y.; Tay, Y.W.D.; Pham, H.; Pham, Q.-C. Large-scale 3D printing by a team of mobile robots. Autom. Constr. 2018, 95, 98–106. [Google Scholar] [CrossRef]
  29. Panda, B.; Tan, M.-J. Rheological behavior of high volume fly ash mixtures containing micro silica for digital construction application. Mater. Lett. 2019, 237, 348–351. [Google Scholar] [CrossRef]
  30. Nematollahi, B.; Vijay, P.; Sanjayan, J.; Nazari, A.; Xia, M.; Nerella, V.N.; Mechtcherine, V. Effect of Polypropylene Fibre Addition on Properties of Geopolymers Made by 3D Printing for Digital Construction. Materials 2018, 11, 2352. [Google Scholar] [CrossRef] [Green Version]
  31. Lloret, E.; Shahab, A.R.; Linus, M.; Flatt, R.; Gramazio, F.; Kohler, M.; Langenberg, S. Complex concrete structures. Comput. Des. 2015, 60, 40–49. [Google Scholar] [CrossRef]
  32. Allouzi, R.; Al-Azhari, W.; Allouzi, R. Conventional Construction and 3D Printing: A Comparison Study on Material Cost in Jordan. J. Eng. 2020, 2020, 1424682. [Google Scholar] [CrossRef]
  33. Elfatah, A.S.A. 3D Printing in Architecture, Engineering and Construction (Concrete 3D printing). Eng. Res. J. 2019, 162, 119–137. [Google Scholar] [CrossRef]
  34. Hossain, A.; Zhumabekova, A.; Paul, S.; Kim, J. A Review of 3D Printing in Construction and its Impact on the Labor Market. Sustainability 2020, 12, 8492. [Google Scholar] [CrossRef]
  35. Sakin, M.; Kiroglu, Y.C. 3D Printing of Buildings: Construction of the Sustainable Houses of the Future by BIM. Energy Procedia 2017, 134, 702–711. [Google Scholar] [CrossRef]
  36. Aghimien, D.; Aigbavboa, C.; Aghimien, L.; Thwala, W.D.; Ndlovu, L. Making a case for 3D printing for housing delivery in South Africa. Int. J. Hous. Mark. Anal. 2020, 13, 565–581. [Google Scholar] [CrossRef]
  37. Zhao, D.; Guo, W.; Zhang, B.; Gao, F. Research on key technique of line forming for 3D sand mould printing based on quantitative analysis of binder content. Rapid Prototyp. J. 2019, 25, 62–75. [Google Scholar] [CrossRef]
  38. Yuan, Q.; Li, Z.; Zhou, D.; Huang, T.; Huang, H.; Jiao, D.; Shi, C. A feasible method for measuring the buildability of fresh 3D printing mortar. Constr. Build. Mater. 2019, 227, 116600. [Google Scholar] [CrossRef]
  39. Khajavi, S.; Tetik, M.; Mohite, A.; Peltokorpi, A.; Li, M.; Weng, Y.; Holmström, J. Additive Manufacturing in the Construction Industry: The Comparative Competitiveness of 3D Concrete Printing. Appl. Sci. 2021, 11, 3865. [Google Scholar] [CrossRef]
  40. Poullain, P.; Paquet, E.; Garnier, S.; Furet, B. On site deployment of 3D printing for the building construction–The case of YhnovaTM. MATEC Web Conf. 2018, 163, 01001. [Google Scholar] [CrossRef]
  41. Tobi, A.L.M.; A Omar, S.; Yehia, Z.; Al-Ojaili, S.; Hashim, A.; Orhan, O. Cost viability of 3D printed house in UK. IOP Conf. Ser. Mater. Sci. Eng. 2018, 319, 012061. [Google Scholar] [CrossRef]
  42. Nematollahi, B.; Xia, M.; Sanjayan, M.X.A.J. Current Progress of 3D Concrete Printing Technologies. In Proceedings of the 34th International Symposium on Automation and Robotics in Construction (ISARC), Taipei, Taiwan, 28 June–1 July 2017; Volume 34, pp. 260–267. [Google Scholar]
  43. Hanaphy, P.; Everett, H. 3D Hubs AM Trends Report Reveals 3D Printing Grew 21% despite Covid-19-3D Printing Industry. Available online: https://3dprintingindustry.com/news/3d-hubs-am-trends-report-reveals-3d-printing-grew-21-despite-covid-19-189087/ (accessed on 18 August 2021).
  44. Voney, V.; Odaglia, P.; Schenker, F.; Brumaud, C.; Dillenburger, B.; Habert, G. Powder bed 3D printing with quarry waste. IOP Conf. Ser. Earth Environ. Sci. 2020, 588, 042056. [Google Scholar] [CrossRef]
  45. Chougan, M.; Ghaffar, S.H.; Sikora, P.; Chung, S.-Y.; Rucinska, T.; Stephan, D.; Albar, A.; Swash, M.R. Investigation of additive incorporation on rheological, microstructural and mechanical properties of 3D printable alkali-activated materials. Mater. Des. 2021, 202, 109574. [Google Scholar] [CrossRef]
  46. Li, Z.; Wang, L.; Ma, G. Mechanical improvement of continuous steel microcable reinforced geopolymer composites for 3D printing subjected to different loading conditions. Compos. Part B Eng. 2020, 187, 107796. [Google Scholar] [CrossRef]
  47. Liimatainen, H.; Pöllänen, M.; Nykänen, L. Impacts of increasing maximum truck weight–Case Finland. Eur. Transp. Res. Rev. 2020, 12, 1–12. [Google Scholar] [CrossRef] [Green Version]
  48. Afshariantorghabeh, S. Technical, Environmental, and Economic Analysis of Required Pre-Treatments for Recycling Different Wastes to Be Utilized as Raw Material for Producing Geocomposite. Master’s Thesis, Lappeenranta University of Technology (LUT), Lappeenranta, Finland, 2019. Available online: https://lutpub.lut.fi/handle/10024/160176 (accessed on 22 April 2020).
  49. Seasons in Finland–Finnish Meteorological Institute. Available online: https://en.ilmatieteenlaitos.fi/seasons-in-finland (accessed on 7 June 2021).
  50. Arch2O.com. 3D Printed House by Apis Cor Entirely Created in One Day–Arch2o.Com. 2021. Available online: https://www.arch2o.com/3d-printed-house-apis-cor/ (accessed on 11 January 2021).
  51. Patil, S.V.; Chabbi, S.; Chabbi, S.; Pudakalkatti, N.; Patil, P. Experimental Analysis of Non-Destructive Testing (NDT) on Ground Granulated Blast-Furnace Slag (GGBS) based Geopolymer Concrete. Int. J. Adv. Sci. Eng. Inf. Technol. 2019, 4, 1137–1145. [Google Scholar] [CrossRef]
  52. Rajini, B.; Rao, A.V.; Sashidhar, C. Cost Analysis of Geopolymer Concrete Over Conventional Concrete. Int. J. Civ. Eng. 2020, 11, 23–30. [Google Scholar]
  53. Anderson, J. Purchasing Real Estate in Finland: A Slice of Happiness. Available online: https://secondshelters.com/2018/04/04/purchasing-real-estate-in-finland-a-slice-of-happiness/ (accessed on 23 August 2021).
  54. Ultimate Guide to Construction 3D Printers in 2021. Available online: https://www.aniwaa.com/buyers-guide/3d-printers/house-3d-printer-construction/ (accessed on 23 August 2021).
Figure 1. Flow chart illustrating the steps involved from raw material transportation to the 3D printed product.
Recycling 06 00060 g001
Figure 2. Factors affecting transport management cost.
Recycling 06 00060 g002
Figure 3. Processes affecting warehouse cost.
Recycling 06 00060 g003
Figure 4. Required annual cost for pretreatment of each wastes.
Recycling 06 00060 g004
Figure 5. Project component effect on cost calculation.
Recycling 06 00060 g005
Figure 6. Investment cost needed per ton for each stage.
Recycling 06 00060 g006
Table 1. Transportation cost calculation factors.
FactorsConsidered Factors
Distance50 km
Waste materialConstruction and demolition wastes (C&DW), fly ash, green liquor sludge, rejected fiber, flotation sand
Transport managementCarrier, freight, and shipment
Transport organization/operationOperative, management, and organization
Area utilizationNeeded for 32,000 tons
Packaging costMaterial sophistication
Time needed for one trip3 h 20 min
Maximum weight carried in one trip20 tons
Table 2. Cost [EUR] associated with transport management, organization, and operative activities.
FunctionsLabor Costs
[EUR]
Operating Costs
[EUR]
IT-Related Costs [EUR]Equipment Costs [EUR]Labor Quantity Total Cost [EUR]
Transport management
costs
Carrier300050050050014500
Freight3000400500 13400
Shipment2500 13000
Total transport management cost85009001000500 10,900
Operational organization/costs
Transport documents2500500500 3500
Operative contacts3000500 50014000
Other documentation1500500500 2500
Total operational organization/cost700015001000500 10,000
Total cost10,900 + 10,000 = 20,900
Management cost% 52.15%
Operational organization/cost%47.84%
Table 3. Cost [EUR] needed for warehouse activities.
FunctionsTotal Labor Cost [EUR]Operating Cost [EUR]IT-Related Cost [EUR]Equipment Cost [EUR]Area Utilization Cost [EUR]Labor QuantityTotal Cost [EUR]
Warehouse cost
Loading cost150,00012,500 10162,500
Quantity/quality of material15,000 500 115,500
Packing10,0002000 1000 13,000
Unloading cost10,000 10,000
Product placement30,000 500 30,500
Material storage30,000 500100050,000281,500
Inventory cost15,000 500 115,500
Total cost260,00014,5002000200050,000 328,500
Warehouse cost%79.15%4.41%0.61%0.61%15.22% 100%
Table 4. Data used to calculate pretreatment operation cost.
FactorsCost Calculation
Labor cost30 EUR/h
Supervision and accountant3500 EUR/month
Energy cost0.15 EUR/kWh
Process capacity20 tons/h
Processing hours per year1000/year
Insurance cost1% of total capital cost
Table 5. Annual investment [EUR] needed for pretreatment of waste materials.
Item Cost [EUR]Green Liquor SludgeAshFiber RejectedFlotation SandC&D WCombined Line
Considered Plant area/m240080040030020002500
Equipment147,350199,000132,000112,000674,000789,000
Cement solidification process 400,000 400,000
Installations14,70020,00013,20011,20061,50073,000
Maintenance900011,2009500700049,50058,200
Labor174,000204,000174,000144,000276,000426,000
Plant cost200,000400,000200,000150,0002,000,0002,500,000
Insurance360063003500270027,00033,000
Contingency55,000114,00053,20043,000303,000412,000
Energy cost for Machineries980014,9007500370033,10058,300
Energy cost for building services10,20020,40010,200770051,00063,700
Total annual cost [EUR]623,6501,389,800603,100481,3003,475,1004,813,200
Table 6. Cost production [EUR] of 1 m3 geopolymer concrete.
Concrete GradeMix ProportionMaterialsCoarse Aggregate [mm]Price [EUR]UnitQuantity [kg]Amount [EUR]Total Price [EUR]
M30 (Concrete standard grade)Design MixAsh2–4156.8t35054.88860.07
C&D W<4416.4t610254
Green liquor sludge 75.5t26220
Flotation sand2–459.1t58334.5
Fiber rejected 73.2t42030.8
Sodium silicate 4L116.36465.44
Water 10m3450.45
Table 7. Factory site 3D printing cost factors.
Net Printing CostManufacturing and Management CostAssembly CostPostprocessing Techniques
Labor costDetailed design costLabor costSurface finishing cost
Material costEquipment depreciation costInstallation costPainting/polishing, cleaning cost
Energy costMachine maintenance costEnergy cost
Manufacturing costEnvironmental protection costMeasure taking cost
Management costAccounting, management, and sales cost
Table 8. Cost estimation of geopolymer 3D printed house on a construction site.
Project ComponentsAmountUnitNumber of WeeksNumber of HoursMaterial Cost (€)Estimated Cost (€)
Primary cost of construction
Home area50m2
Foundation/structure 11,750
Land preparation50m2 351750
Basic unit formation50m2 20010,000
Walls construction 28,258.382
Walls printing154m21 to 23657.758893.5
Insulation material for walls
Liquid polyurethane composition84m2 161344
Polystyrene45.32m2 23.851080.882
Plaster154m22 to 310411016,940
Roof and ceiling 49,112.85
Roof frame121m2137168.4520,382.45
Roof Installation71.2m213024217,230.4
Celling Installation50m212523011,500
Doors/windows 19,600
Wooden and glass window8m2 2010008000
Main door1m2 428002800
Internal door (wooden)4m2 2422008800
Floor 2250
Wooden floor tiles9m21 2502250
Postprocessing techniques 38,406
Floor finishing50m2 25 3500
Roof finishing72m21 24217,424
Ceiling finishing50m21 23011,500
Window and door finishing13m2 20 3500
Walls painting39m21 381482
Frame removal121m2 10 1000
Services 12,950
Sanitary services 50m21 1507500
Electrical services 50m21 753750
Drainage50m21 341700
Labor cost 30,000
Total cost 192,327.232
Table 9. Cost factors and roles.
FactorsRoles
Equipment costOffice equipment, leasing and capital costs, maintenance cost of equipment, warehouse costs
Labor costDirect labor cost, personal training cost, bonuses
Operating costFuel cost, water, electricity, heating, cleaning, security, waste services,
insurances, copying, printing, office accessories
IT costSoftware cost, software programming, maintenance
Area specific costFurniture cost, office area cost
Table 10. Cost calculation factors in the factory.
S. NoFactorsPrice Calculation
1Printed componentsLabor cost + material cost
2Manufacturing cost(a) design (b) planning (c) sourcing (d) machining (e) testing (f) quality control (g) electricity + water charges (h) equipment (I) Environmental + labor protection cost (J) maintenance cost (k) components finishing l) packing (m) transportation inside factory (internal transportation)
3Transportation costDistance per mile × unit price
4Management costOrganization + accountant + sale
5Value added cost24%
Total cost of printed components1 + 2 + 3 + 4 + 5
Table 11. Capital and operating expenditures needed for geopolymer 3D printing.
Capital Expenditures (CAPEX)
ParticularsCost [EUR]
Equipment (green liquor sludge, ash, fiber rejected, flotation sand, C&D W, and combined line)2,053,350
Cement solidification process400,000
Installations of machineries193,600
Contingency980,200
Operating expenses (OPEX) per month
ParticularsCost [EUR]
Transportation cost
Transport management10,900
Operational organization10,000
Loading and unloading14,375
Quantity/quality of material1292
Packing1083
Product placement2541
Material storage6791
Inventory cost1291
Pretreatment
Maintenance cost12,033
Labor116,500
Plant cost454,166
Insurance6341
Energy cost for machineries10,608
Energy cost for building services13,600
Construction site 3D printing for 50 m2 house
Foundation/structure, walls, roof and ceiling, doors/windows, floor, postprocessing techniques, and labor cost192,327.232
Table 12. Estimated cost comparison between traditional and 3D printed house.
Construction MethodArea m2Average Price [€]
Traditional technology and OPC50 m2280,000 [53]
Traditional technology using GPC50 m2284,760
3D printed house using OPC50 m2189,000 [54]
3D printed house using GPC50 m2192,327.232
Publisher’s Note: MDPI stays neutral with regard to jurisdictional claims in published maps and institutional affiliations.

