1. Introduction
The irreversible consequences of climate change are one of the greatest challenges facing society today. Since the Industrial Revolution, human activities have led to a steady increase in GHG emissions, particularly carbon dioxide (CO
2) [
1]. In response to the effects of climate change, various measures have been taken to reduce GHG emissions into the atmosphere [
2].
Urban waste management is a significant source of GHG emissions [
3,
4]. Organic waste from green waste, agriculture, food industry, household consumption and catering is of particular interest. Firstly, it is of significant quantity: it is estimated that one-third of the food produced in the world is thrown away, accounting for over 40% of total solid waste [
5,
6]. Secondly, the decomposition of organic waste in open landfills is responsible for 20% of global anthropogenic methane (CH
4) emissions [
7]. Finally, organic waste can be converted into potential resources such as energy [
8,
9] and soil amendments or plant fertilisers [
10,
11].
1.1. Composting and Vermicomposting Household Biowaste
Given the enormous volume of organic waste, four treatment methods are commonly used: incineration, methanisation, composting and vermicomposting. In France, the volume of composted waste has increased significantly over the last 15 years [
12], while incineration and methanisation have shown little change. Vermicomposting remains mainly a domestic or experimental practice.
This study focuses on composting and vermicomposting as these are the methods promoted by municipalities for the recovery of household biowaste. It examines the GHG emissions generated during the transformation of biowaste into compost or vermicompost, in particular CO2, CH4 and nitrous oxide (N2O). The assessment considers direct emissions associated with the biochemical transformation process as well as emissions associated with waste collection.
This article focuses on biowaste as defined in Article L. 541-1-1 of the French Environmental Code. In practice, the household biowaste considered here is kitchen waste (vegetable peelings, fruit residues, etc.) and plate waste (leftovers, meat residues, etc.). The particularities of household biowaste are the seasonal heterogeneity of its composition, which reduces its potential use for biogas production [
13]. Because of the diffuse nature of its production (produced by each household), the active participation of residents is essential to mobilize this source.
1.2. Composting and Vermicomposting Biowaste: A Little Studied Subject
Biowaste composting is an ancient practice. It involves the decomposition of biowaste by microorganisms under aerobic conditions. The result is a stable, nutrient-rich organic product (compost) [
14,
15] that improves soil structure and fertility [
16].
So far, the scientific literature has mainly examined composting from the perspective of local initiatives and their social and educational externalities [
17,
18], as well as their integration into more global collective experiments (e.g., food, education) [
19,
20,
21]. Few biochemical studies have examined pathogen survival during different composting processes (domestic, industrial) [
22,
23,
24,
25,
26] or nutrient inputs to soil and plants [
27,
28]. In most cases, compost is studied after sowing, which leads to the integration of soil-related variables, making it difficult to compare results taking into account specific soil characteristics. Belgium is an exception in Europe, as composting has long been included in discussions on its importance for agricultural and economic transition [
29,
30].
Vermicomposting (or worm composting) is relatively new and not well-developed in France. Local vermicomposting is still experimental and has been promoted by the Eisenia association in the Lyon area [
31]. It gained popularity in the 1980s through a ‘pyramid’ commercial system in which earthworm breeders provided a starting stock and instructions for reproduction [
32] and through Marcel Bouché’s work on the role of earthworms in soil activity [
33]. Although it was the subject of several publications in the 1980s and 1990s, vermicomposting of urban biowaste is currently under-researched in France [
34,
35]. Some French research looks at vermicomposting in Mexico, describing its origins in an alternative agroecosystem in Indigenous communities [
36] and its relative normalisation in schools [
37]. Outside of French studies, vermicomposting research includes case studies in Canada [
38], Senegal [
39], Madagascar [
40], and Vietnam [
41,
42].
1.3. Biochemistry of the Composting and Vermicomposting Processes
The basic principle of composting is to treat organic waste according to three main principles.
- -
Principle 1: Alternating between wet nitrogenous waste (household biowaste) and dry carbonaceous materials (green waste, wood, dead leaves, cardboard). Nitrogenous waste, which is rich in organic matter, often comes from our meals, vegetable peelings and grass. The balance between these two types of waste is essential to obtain a mixture that promotes decomposition, creating a favourable environment for the microorganisms that facilitate the composting process.
- -
Principle 2: Regular aeration of the compost. This step ensures a constant supply of oxygen, a vital element for the aerobic microorganisms responsible for decomposing the waste. It promotes air circulation within the compost, helping to maintain optimum conditions for the biological reactions needed to convert organic waste into compost.
- -
Principle 3: Carefully monitor the moisture content of the compost. While the presence of water is essential for the survival of microorganisms, excess moisture can compromise the process. Compost that is too moist runs the risk of lowering the temperature, thereby disrupting the necessary thermophilic dynamics. Maintaining the right balance of moisture helps to create an optimal environment for microorganisms and promotes the efficient decomposition of organic waste.
Vermicomposting differs from traditional composting in that it uses earthworms to accelerate the decomposition of organic matter and improve soil conditions. The worms increase the surface area exposed to microorganisms, speeding up the process [
43]. Unlike composting, vermicomposting is a mesophilic process (occurring at ambient temperatures), stabilised by interactions between worms, microorganisms and other composting agents [
44] (
Table 1). Suitable vermicomposting worms must have high rates of organic matter consumption, tolerance to environmental stress, high reproductive rates and rapid growth [
45]. The most commonly used species are Eisenia fetida and Eisenia Andrei [
46].
1.4. The Carbon Footprint: A Tool for Local Policy Guidance and Evaluation
Many French municipalities are not yet in compliance with the 2020 AGEC law, which requires them to offer biowaste recycling solutions to every household. GHGs are rarely considered in territorial biowaste management strategies. Comparing the carbon footprints of composting and vermicomposting provides information that can influence local public policy decisions.
The carbon footprint is a tool for calculating the GHG emissions of a public or private organisation. Since the Grenelle 2 law of 2010, it has become a tool for guiding and evaluating local public policies. For example, local climate and energy plans are based on carbon footprints, which have become mandatory for certain companies, public institutions and local authorities. More specifically, they are required to draw up a carbon footprint, publish it and update it every three years (article 75 of the Grenelle 2 law).
However, few of these structures are in compliance (compliance rate of 35% in 2021) [
50]. When the data are published, they are often not very detailed and truncated for Scope 3 (optional from a regulatory perspective), which is often the most emissive. In addition to the strategic and political issues faced by these organisations, there are methodological and financial challenges to conducting a carbon audit, particularly in terms of identifying emission factors and collecting data. The availability of local data on carbon emissions and sequestration is therefore an important issue for local public policy.
2. Methodology
The carbon footprint assesses the amount of GHGs emitted into the atmosphere when processing 1 metric ton of biowaste for each biowaste recovery sector. Two choices are essential in the methodology: the scope of the emissions to be counted and the data to be included.
2.1. Presentation of the Biowaste Recovery Systems
The carbon footprint compares four biowaste recovery systems that differ in terms of decomposition process (composting and vermicomposting) and management (community management and industrial management).
Community management is a management method based on the participation of households (sorting, voluntary collection, turning of compost piles, etc.). Community composting and vermicomposting take place in collective bins managed by associations near housing estates in dense urban fabric. Industrial composting is carried out on a platform on which a large volume of shredded biowaste is decomposed. The processes differ in terms of the space required, the type of facilities and the way they are managed.
Industrial composting involves several stages: sorting to eliminate unwanted waste, shredding, adding pruning waste (shredded woody green waste such as tree branches) and maturing. After 6 or 8 months of decomposition, the compost is sieved to remove the last undesirable elements (source: interviews).
Table 2 shows the four systems assessed.
Community composting and vermicomposting take place in wooden bins located near residential buildings. They require no energy to operate. In contrast, management of industrial composting requires energy during the process, which has an impact on indirect GHG emissions. In fact, industrial composting management involves the collection of a significant volume of biowaste (by truck) and the mechanical turning of rotting biowaste. Industrial composting is carried out on concrete slabs to avoid infiltration of the ‘juices’ into the soil, which can pollute the soil at high levels. Industrial vermicomposting is carried out in windrows directly on agricultural soils. So, unlike composting, there is a question mark over the massive infiltration of “juice” into agricultural soils, with a potential risk of contamination.
2.2. Principles of Carbon Accounting: Gases Studied and Units of Measurement
The carbon balance methodology used is that defined by Ademe in France [
51]. It is regulated by law. Emissions must be expressed in ton of carbon dioxide equivalent (art. R. 229-45, Environmental Code) and are based on conversion factors. The GHGs considered in the carbon footprint are CH
4, N
2O, CO
2, carbon monoxide and fluorinated gases. GHG emissions are divided into three scopes according to their proximity to the activity studied: direct emissions from biowaste recovery processes (Scope 1), indirect emissions related to energy demand (Scope 2) and other indirect emissions (Scope 3).
Establishing GHG inventories requires taking into account a choice of components linked to the six main gases mentioned in the Kyoto Protocol. In order to carry out the inventory in France, the ADEME relies on the two international standards [
52,
53] as well as the European directives in force [
54] and other national standards [
55].
The exhaustive list of GHGs covered includes carbon dioxide (CO2), nitrous oxide (N2O), methane (CH4), sulphur hexafluoride (SF6), hydrofluorocarbons (HFCs) and perfluorocarbons (PFCs). This reflects a concern about capturing the largest emissions with the greatest potential impact on climate change. CO2, as the main GHG resulting from the combustion of fossil fuels, represents the direct carbon footprint of human activities. N2O and CH4, produced by agricultural and industrial activities, add an important dimension to the sources of emissions, being associated with soil management and organic decomposition processes, respectively. SF6, HFCs and PFCs are more specific but no less important gases. Their inclusion highlights the need to consider emissions from specific sectors and, thus, the importance of understanding the specific sources contributing to the accumulation of these gases in the atmosphere.
2.3. Application of the Carbon Footprint Method to Composting and Vermicomposting
The sources of emissions to be taken into account in the carbon footprint were adapted to the specific composting and vermicomposting processes based on a field survey of stakeholders in the Lyon agglomeration, where three of the studied processes were established: community composting, vermicomposting and industrial composting [
31]. Ten interviews and three site visits were carried out with institutional actors in biowaste management, companies and composting associations. The study identified and quantified the sources of indirect emissions (Scope 2 and 3) depending on the type of composting (community or industrial): collection by lorry and its energy (diesel, electricity, mechanical or manual turning of biowaste, building lighting, energy consumed by sorting machines, etc.). An analysis of the scientific literature was then used to obtain data on emission factors related to biochemical degradation processes (Scope 1).
Scopes 1, 2, and 3 emissions are calculated for each biowaste recovery system studied, as well as avoided emissions. Scope 1 includes direct emissions of CO2, CH4 and N2O from the analysed process and direct emissions from combustion engine-driven mobile sources in the case of facility processes. The assessment takes into account the addition of carbonaceous materials during the process of the four systems (pruning waste, cardboard, etc.). Scope 2 includes indirect emissions related to the consumption of electricity, steam, heat or cooling.
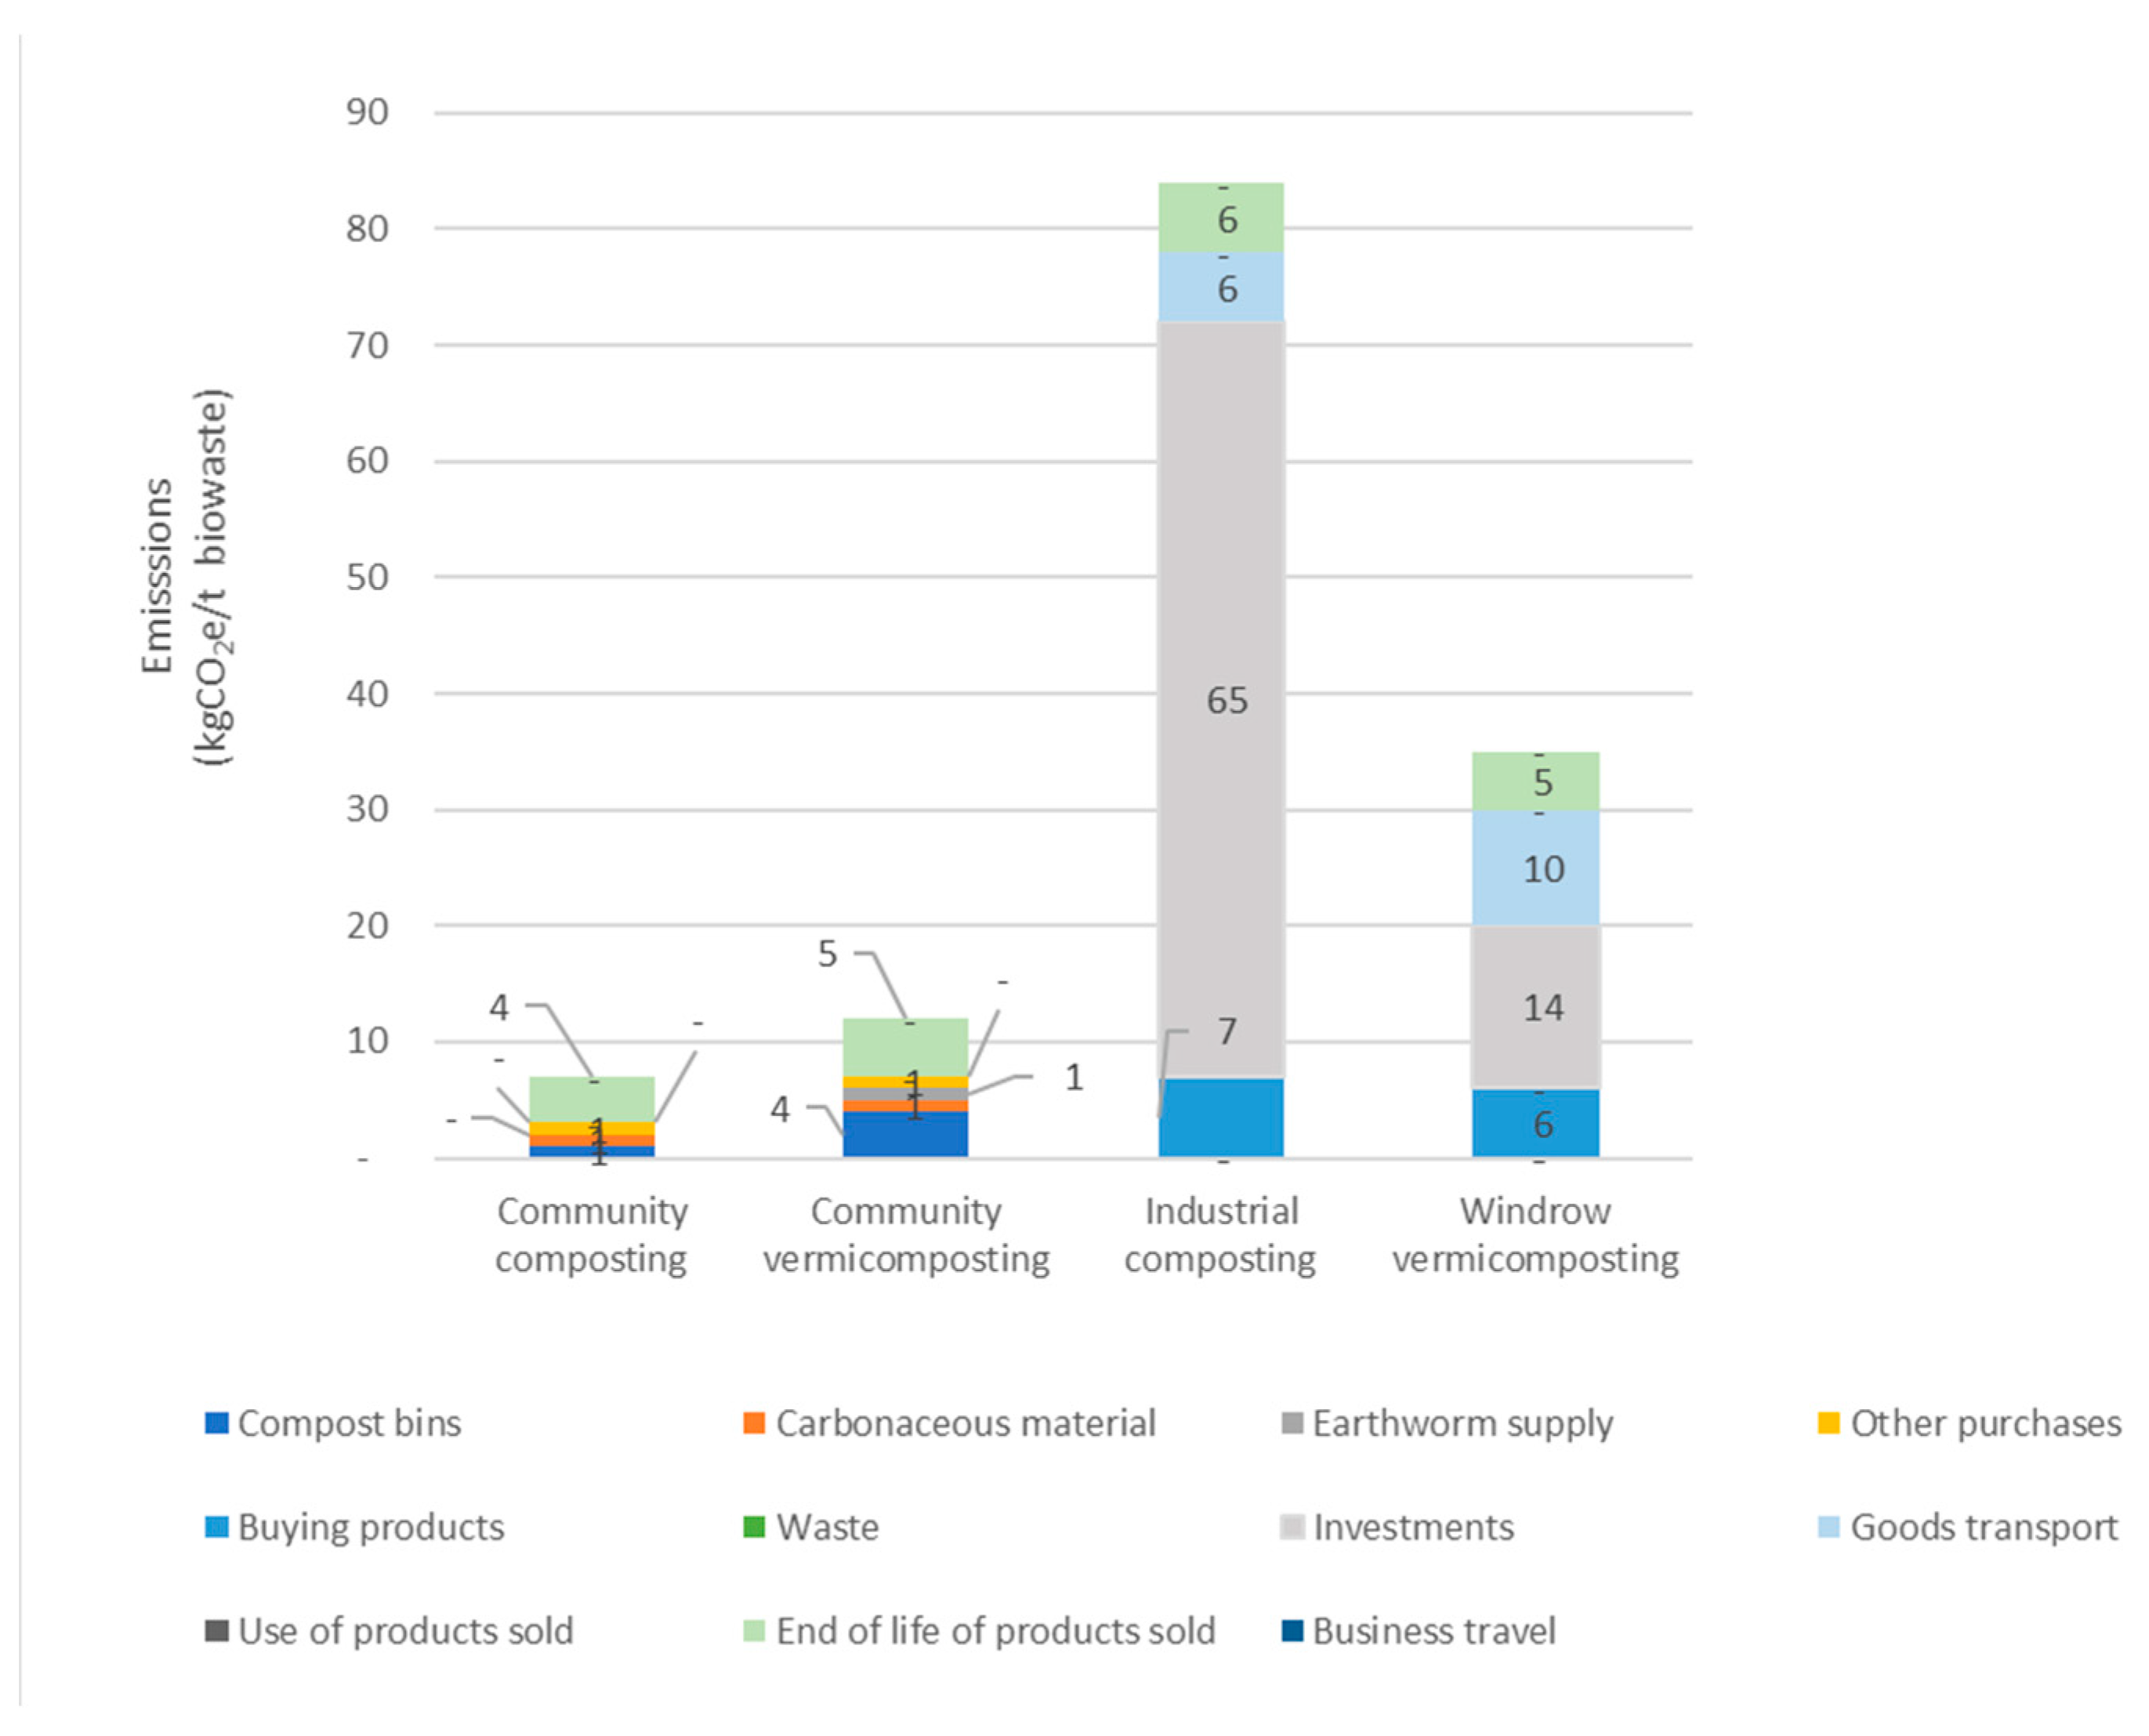
Given the differences in processes between community management and the industrial management of biowaste, it is important to include the third (optional) scope in the carbon footprint in order to include the emissions associated with waste collection and the composting processes. Scope 3 includes, for community composting and vermicomposting, the purchase of products or services and the end-of-life of products sold; for composting and windrow composting, the purchase of products or services, waste, investments, downstream transport of goods, the use of products sold, the end-of-life of products sold and business travel.
Table 3 shows the activities that emit GHGs included in the carbon footprint for each scope for composting and vermicomposting.
2.4. Inclusion of Biogenic Carbon in Process Emission Factors
Biogenic carbon is defined in the ADEME carbon database as “the carbon contained in biomass of agricultural or forest origin that is emitted during its combustion or decomposition, as well as that contained in soil organic matter”. In other words, fossil carbon and biogenic carbon are both emitted into the atmosphere, but biogenic carbon is subsequently absorbed by nature through the process of photosynthesis, thus creating a cycle. Biogenic carbon, derived from organic matter, is inherent in many activities and processes and plays an important role in the natural balance of the carbon cycle.
There is a scientific debate on the potential carbon neutrality of biogenic CO
2 [
56,
57,
58,
59], particularly for the composting of biowaste, considering their organic origin [
3,
60]. In political decision-making, there is currently a consensus in France and several other countries that biogenic CO
2 should not be included in the calculations, as carbon is of natural, non-fossil origin and is therefore part of a cycle [
61].
However, biogenic carbon has a climate impact: before being captured by biomass growth, CO
2 molecules remain in the atmosphere and contribute to global warming [
56]. There is therefore a time lag between the flux of emissions and the sequestration of biogenic CO
2 in the biosphere and anthroposphere. The term “rotation period” is used to describe the time it takes for a plant to grow before it is used as bioenergy [
56]. Therefore, 1 unit of biocarbon stored over a time horizon is not always equivalent to 1 unit of CO
2eq [
62]. The time lag varies with vegetation type [
62] and decomposition conditions (temperature, humidity) [
63]. Adetona and Layzell (2023) [
63] identified biomass decomposition profiles based on a criterion of material and duration: biowaste corresponds to the rapid decomposition of agricultural residues. This is the profile that releases carbon into the atmosphere the fastest, releasing up to 90% of its carbon into the atmosphere in the first year of decomposition.
Biogenic carbon is not taken into account in Ademe’s carbon balance methodology (Documentation Base Carbone), which is justified by the capacity of French forests to absorb biogenic CO2. We have chosen to include biogenic carbon among the GHGs emitted during the process. Although biogenic carbon is less harmful than fossil carbon, its emissions are still harmful to the environment and contribute to the greenhouse effect. There is no guarantee that the carbon sequestered by photosynthesis will offset this effect. The impact of biogenic carbon on the carbon balance results of the sectors studied is crucial: excluding this component is tantamount to eliminating carbon dioxide emissions altogether. Such an omission would undoubtedly be an aberration in a robust and scientifically based environmental analysis. Omitting them from the emissions calculation would mean ignoring an essential dimension of the carbon footprint, thereby distorting the reality of the environmental impacts associated with a given entity or activity.
2.5. Choice of Emission Factors
Emissions were calculated using reference units from the Base Carbone® and scientific literature, as well as variables from the field survey. The field survey provided data not widely available in the literature, such as the rate of carbon addition, which varies from sector to sector.
For community composting, the values from Nordahl et al. [
64] were used, as they refer to the same type of waste and come from a relatively recent study from 2023. For industrial composting, CH
4 and N
2O emission factors were taken from ADEME, as these are the official data used in France [
65]. CO
2 was estimated using data from UpCycle and the scientific literature [
66]. The range used is between 15 and 25 kg/t of waste. However, there is no scientific consensus on emission factors for vermicomposting, as they depend on the type of waste processed and various factors such as temperature, humidity, ventilation, etc. We therefore decided to use the emission factors reported in the literature. We decided to use the data from Nigussie et al. [
67] because, although it is a less recent study, the data are presented as a percentage of composting, which makes it easier to compare the four processes. We cross-referenced these data with the review carried out by Zhang et al. [
68].
The emission factors for community vermicomposting are calculated on the basis of those for community composting, and the emission factors for windrow vermicomposting are calculated on the basis of those for industrial composting. In addition, as there are different values in the scientific literature, we have constructed a range of values and chosen an average scenario.
Table 4 shows the emission factors used.
Table 5 and
Table 6 specify the minimum, maximum and average data for each biowaste recovery system.
3. Results
The carbon footprint analysis assesses and compares the GHG emissions of different composting and vermicomposting methods. The results suggest that the biochemical transformation process has less impact on emissions than the type of management (community or industrial).
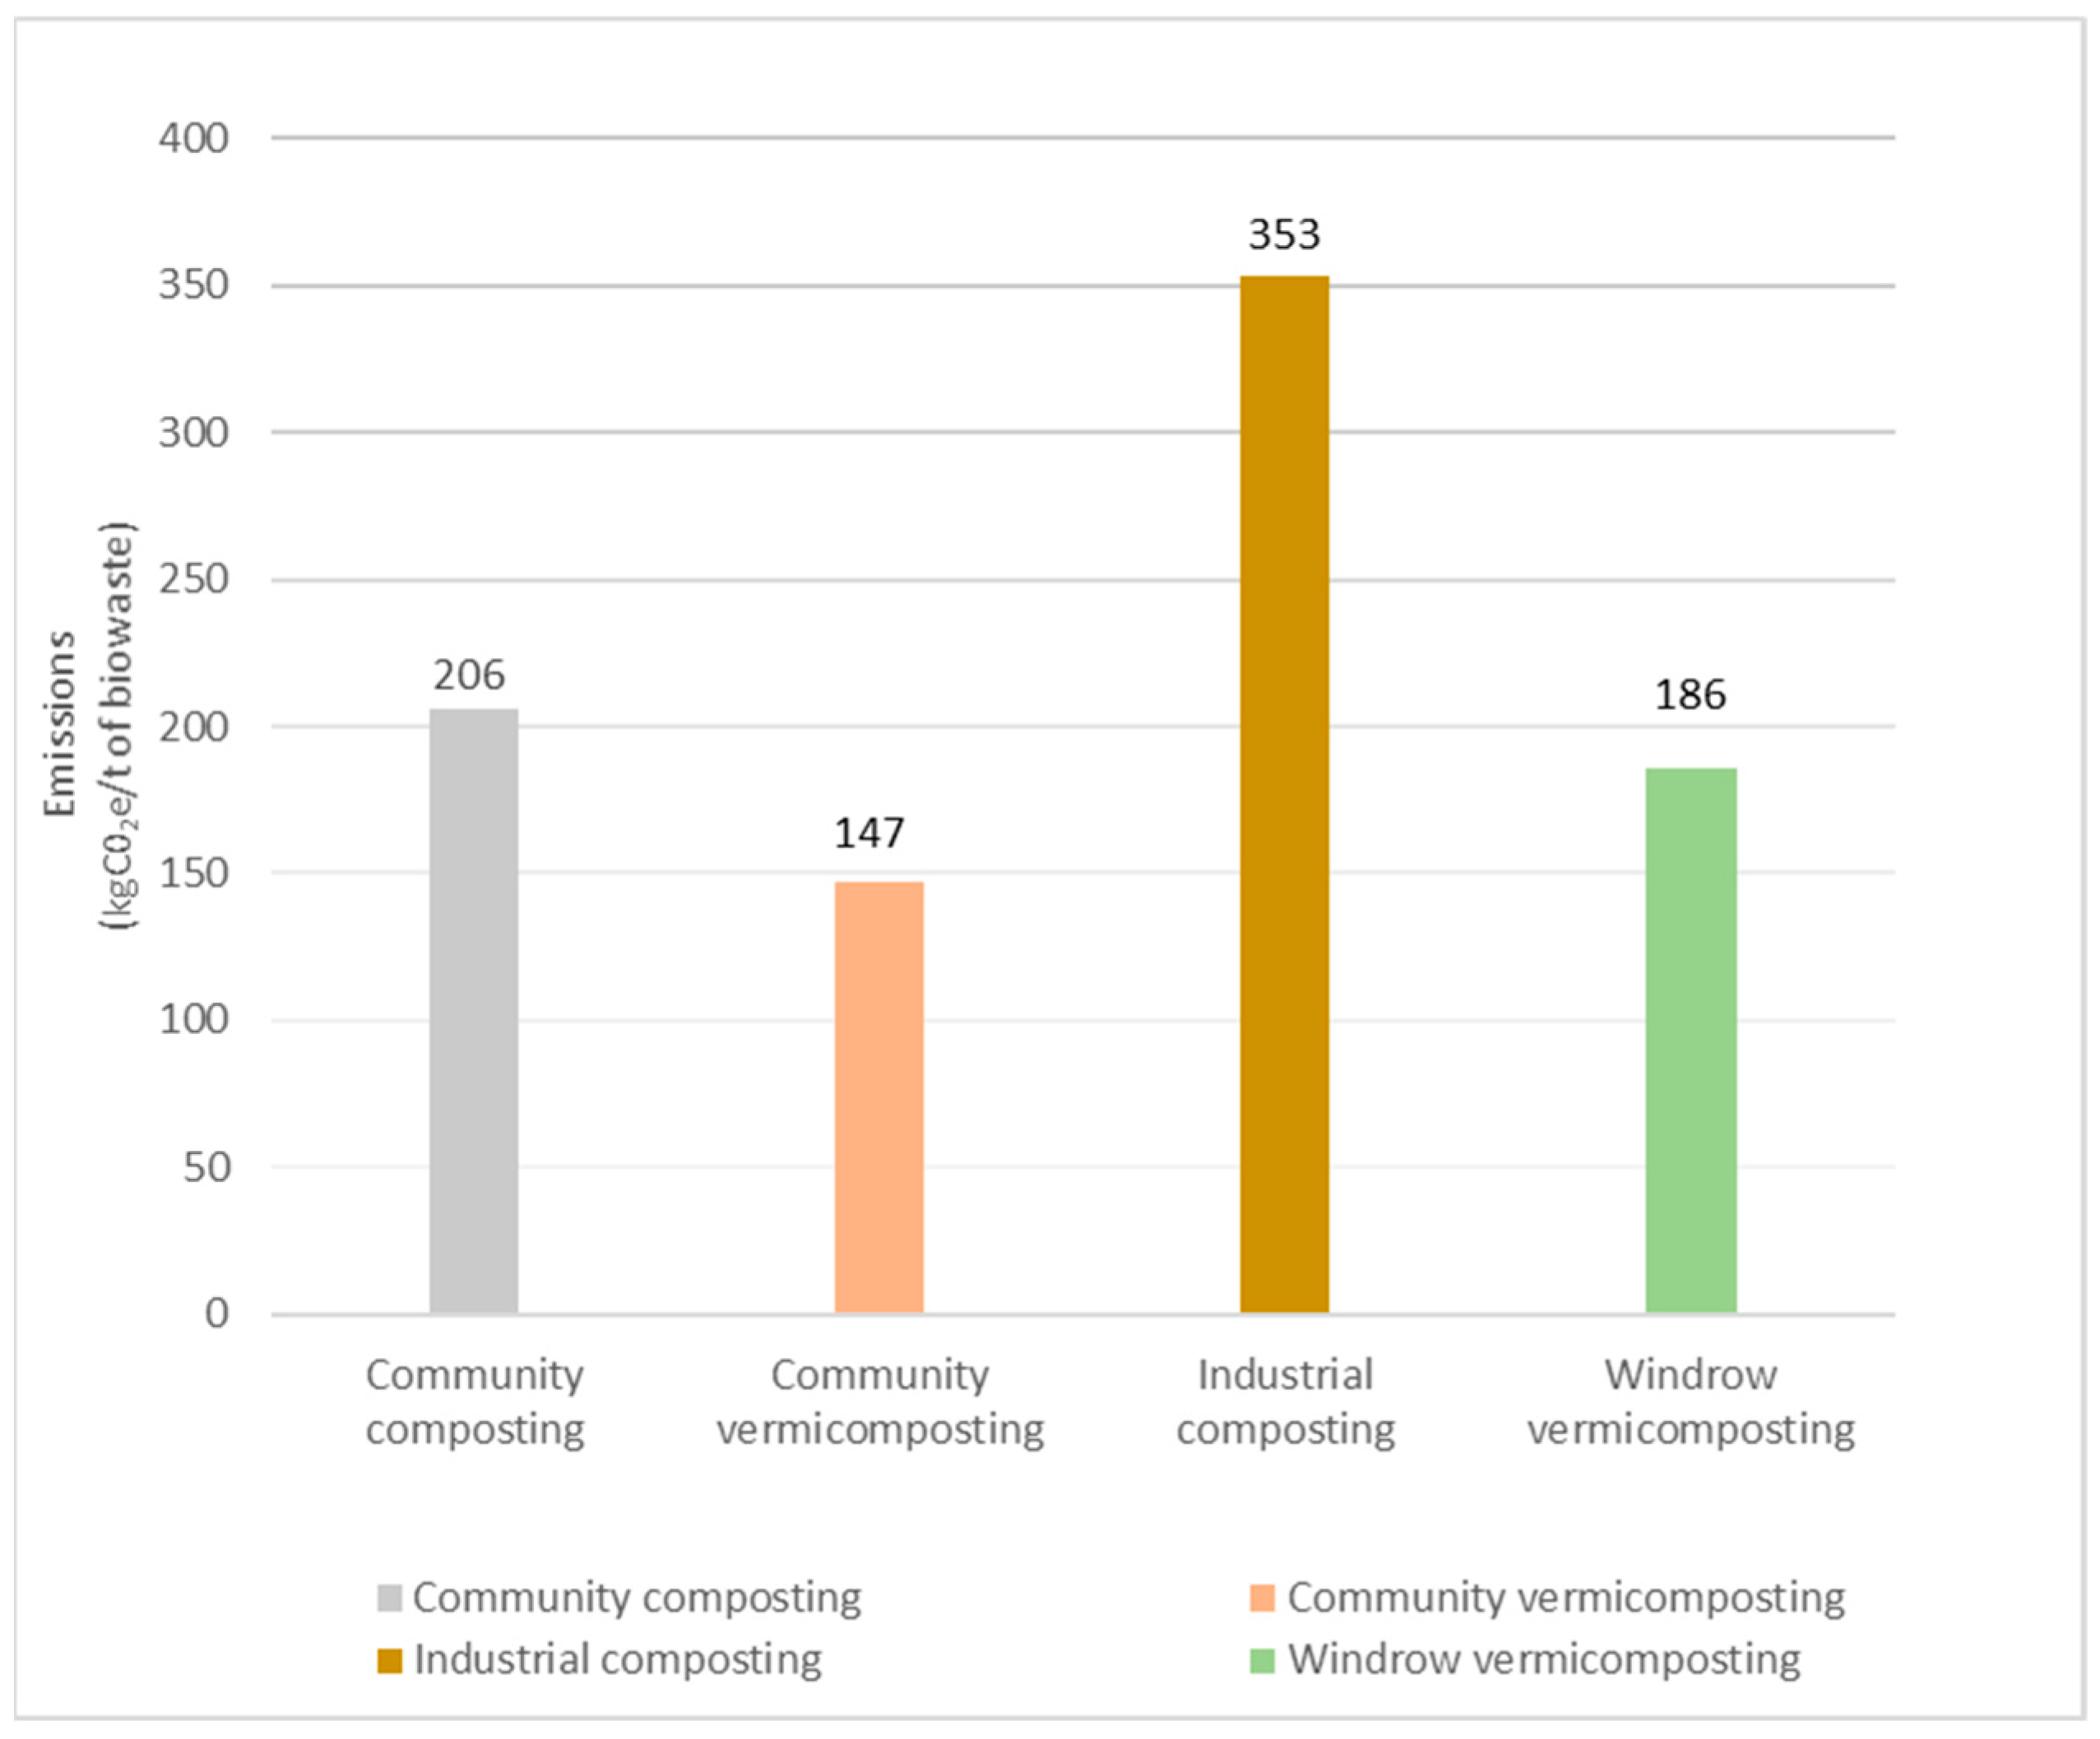
Figure 1 compares the CO
2 equivalent emissions of the different processes, taking into account biogenic carbon. Industrial composting appears to be the solution with the highest emissions. Total emissions by the composting method (
Figure 1) are calculated on the basis of an average.
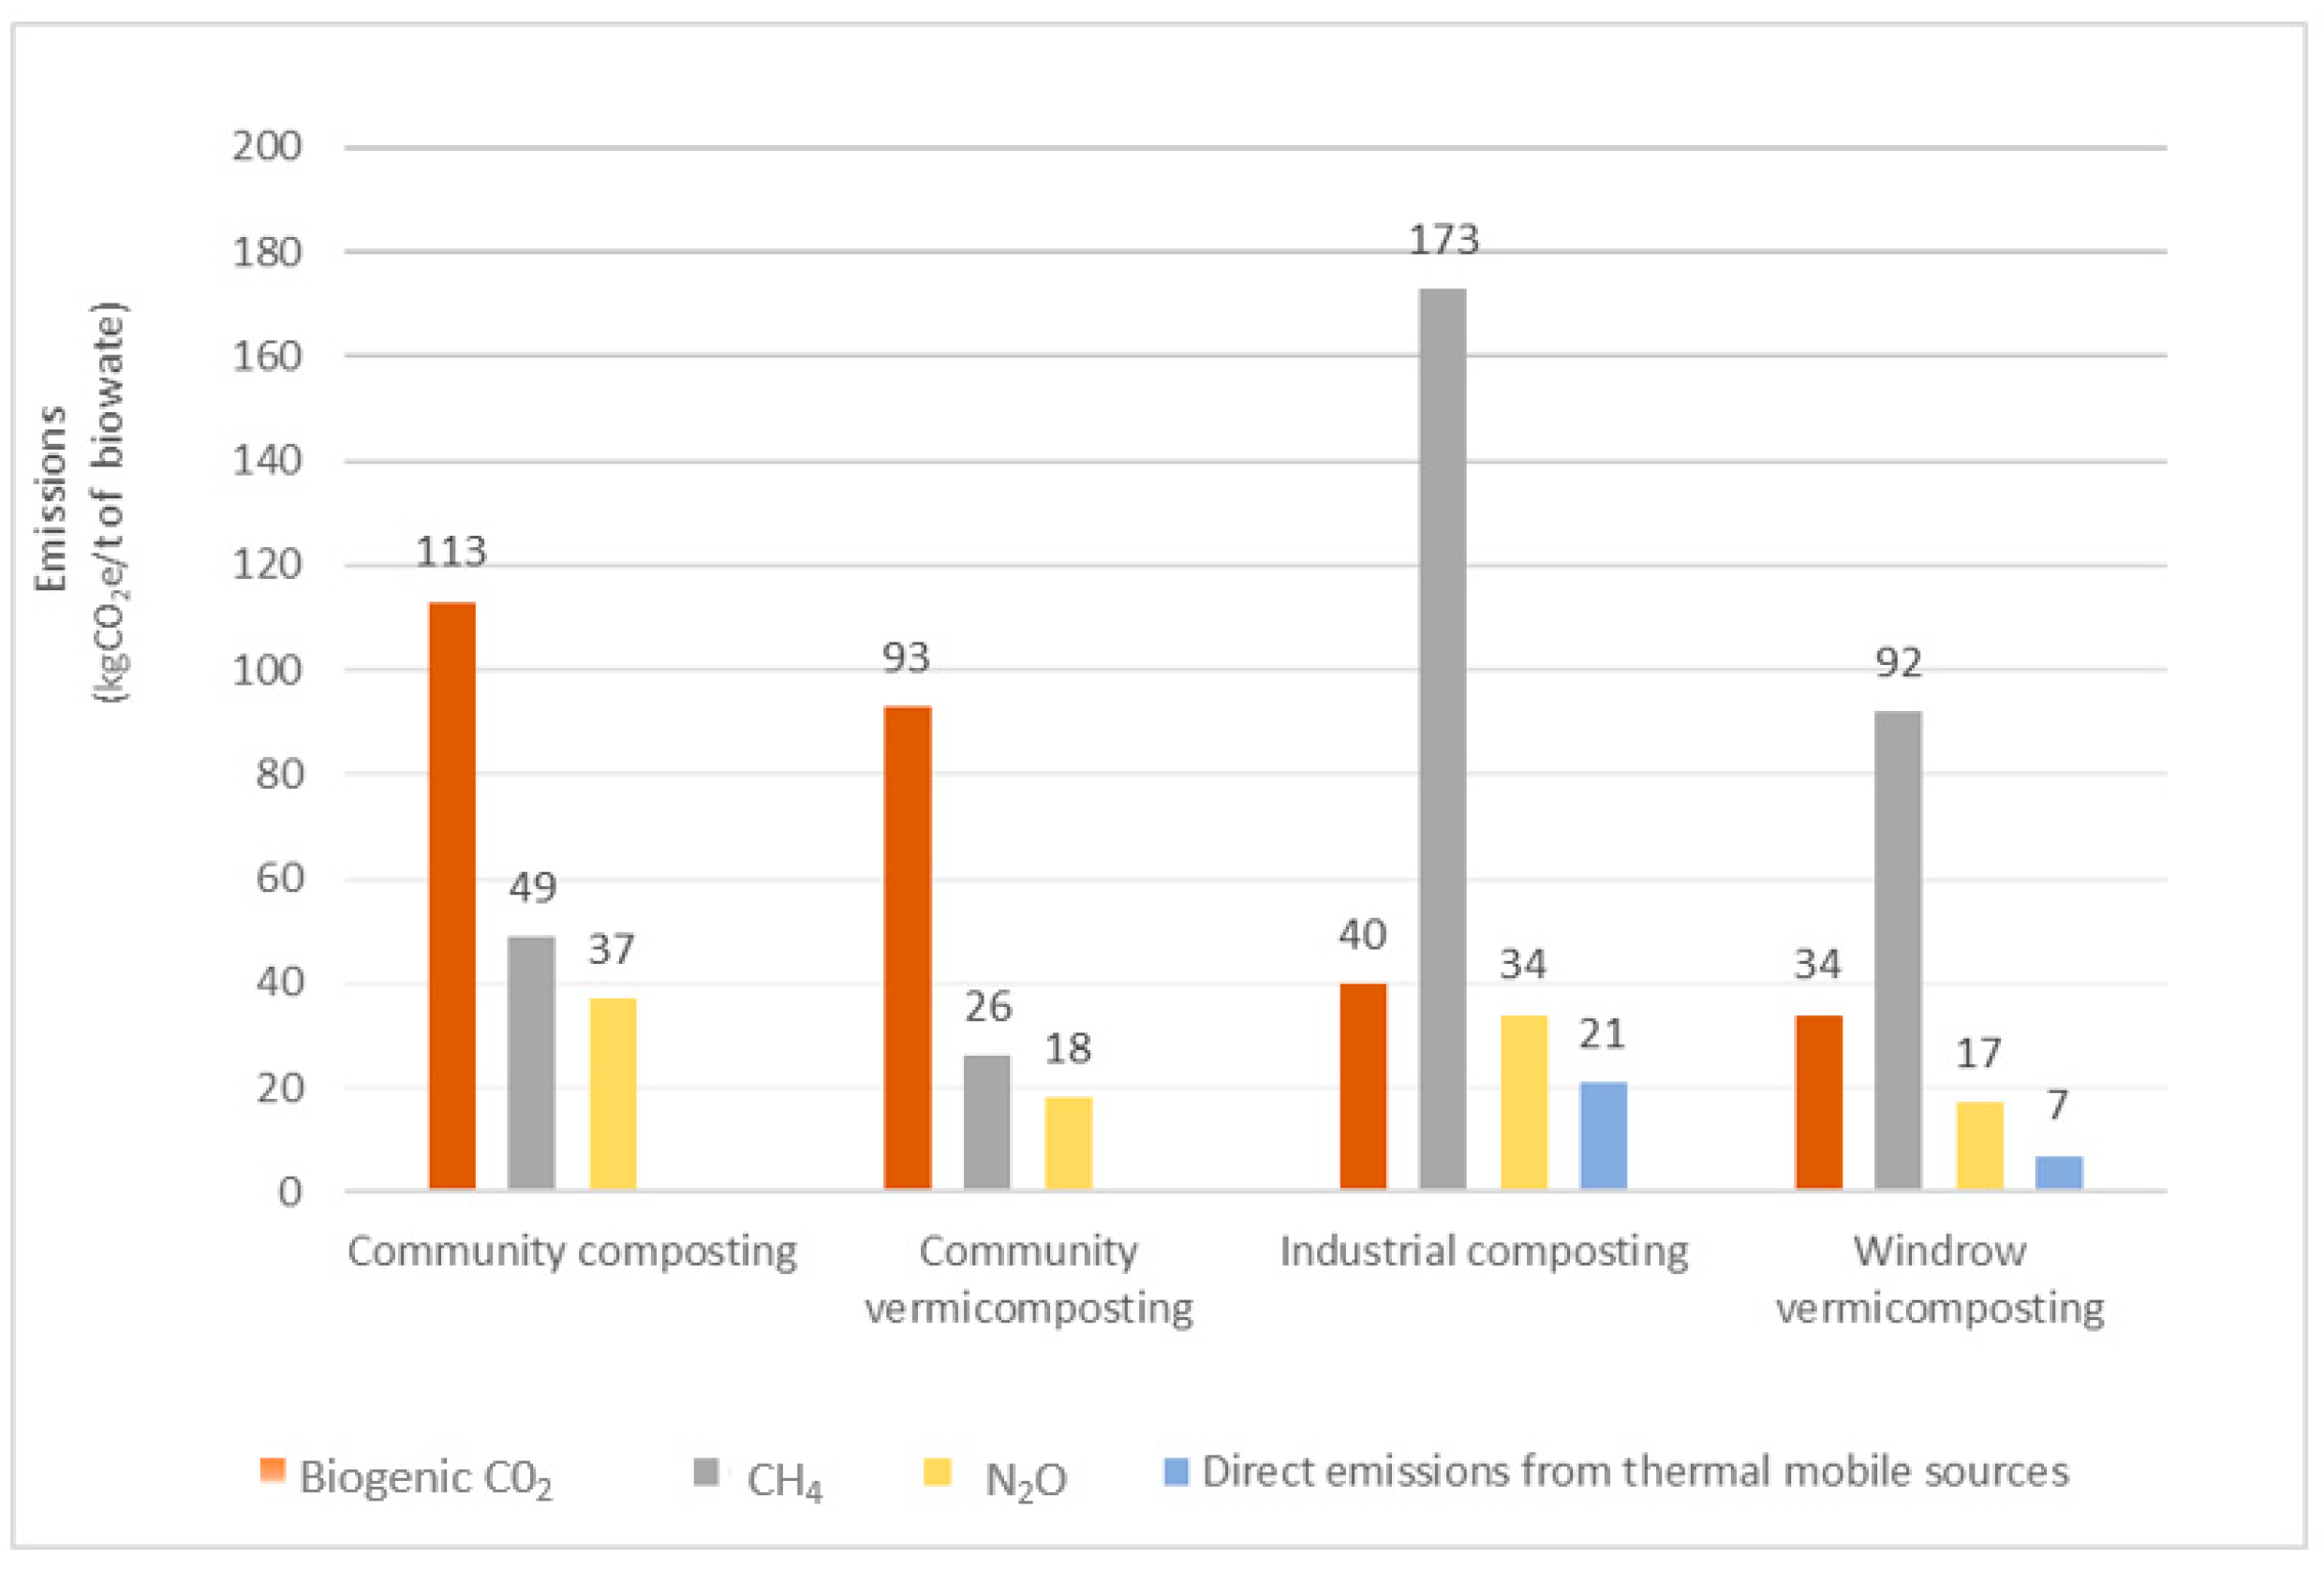
Vermicomposting processes have lower emissions than composting processes, which is consistent with the results obtained by Komakech et al. (2014) [
70] and Lleó et al. (2013) [
60]. This can be explained by the Scope 1 direct emissions, which are lower for vermicomposting for all three gases (CO
2, CH
4 and N
2O). In addition, the CH
4 and N
2O emission factors considered are lower for vermicomposting than for composting (
Table 4), so it is natural that their direct emissions are lower for the former case. However, direct CO
2 emissions are lower for vermicomposting despite its higher emission factor. This is due to the fact that vermicomposting uses less bulking materials (0.4 metric ton of shredded material for 1 metric ton of biowaste compared to 1 metric ton of shredded material for 1 metric ton of biowaste in composting), which increases the direct emissions of composting by about 40% compared to the direct emissions of vermicomposting. There is no precise information in the literature on the amount of shredded material that should be used in the composting and vermicomposting processes. The proportions used in this article were estimated on the basis of interviews with stakeholders in the Lyon area. The results could therefore vary if these proportions were changed.
According to the literature, the reduction in GHG emissions from vermicomposting compared to composting can be explained by two main factors. First, earthworms increase air circulation in the compost, which maintains aerobic conditions and therefore reduces emissions [
71]. Another explanation is that vermicomposting is a process that takes place at ambient temperature, unlike traditional composting, which is a thermophilic process. Chukwudi et al. [
16] analysed the composting process and found that the rate of CO
2 and CH
4 emissions was directly proportional to temperature.
Emissions by scope are very uneven across all sectors (see
Figure 2). Scope 1 accounts for the majority of emissions. There are very few Scope 2 GHG emissions. Community management (composting and vermicomposting) generates very few Scope 3 emissions.
GHG emissions vary according to the solution (see
Figure 3). Community processes (composting and vermicomposting) emit more biogenic carbon, almost three times more.
If biogenic carbon is included in the emissions, industrial composting is the highest emitting process compared to community composting and windrow vermicomposting (see
Figure 4). If biogenic carbon is excluded, the order from highest to lowest emitter is industrial composting, windrow vermicomposting, community composting and community vermicomposting. When biogenic CO
2 is included, Scope 1 emissions are higher for all processes, with composting processes emitting more than vermicomposting processes, both for industrial and community processes. On the other hand, if biogenic CO
2 emissions are not taken into account, Scope 1 emissions are reduced and Scope 3 becomes more important. The result is the industrial or community nature of the processes: industrial processes emit more than community processes.
4. Discussion
Finally, we compare the carbon footprint results with emissions reported in the scientific literature. We discuss the potential for incorporating carbon footprints into local waste management policies, as well as local climate change adaptation and agricultural development policies.
4.1. Compare and Contrast the Results with the Scientific Literature
Our results are based on average emissions and tend to support the view that overall GHG emissions from vermicomposting are lower [
71]. Industrial composting is probably the biowaste recovery process that emits the most GHGs due to the high temperature of the process and its large-scale mechanisation [
49,
65].
The main gas emitted during composting and vermicomposting is CO
2, and these emissions occur mainly at the beginning of the process, which may be related to high temperatures [
3,
72,
73]. Although CO
2 emissions are higher, their global warming potential is about 273 and 28 times lower than that of N
2O and CH
4, respectively, making the emissions of these two gases quite significant [
3,
74].
There is no consensus in academic circles on the comparison between composting and vermicomposting in terms of GHG emissions. For example, Komakech et al. (2015) [
70] conducted a life cycle assessment study with municipal biowaste and found that vermicomposting emitted approximately 78% less CO
2eq than conventional composting. Lleó et al. (2013) [
60] also found that vermicomposting emits less, reducing NH
3, CH
4 and N
2O emissions by up to three times compared to composting.
Nigussie et al. (2016) [
67] found that vermicomposting emitted 25–26% less N
2O and 22–26% less CH
4 than traditional composting but 3–14% more CO
2. A study by Lv et al. (2018) [
72] analysed emissions from both processes using sewage sludge waste and found that vermicomposting emitted less CH
4 and more N
2O than composting, with no significant difference in CO
2 emissions between the two processes. On the other hand, Zhang et al. (2023) [
69] analysed N
2O emissions from composting and vermicomposting of biowaste and found that there was no significant difference between the emission rate of the two processes.
4.2. Discussing Emission Factors
In order to consider the GHG emissions of biowaste management systems, it is first necessary to ensure that the methodological conditions for comparing recovery systems are in place. Comparison is difficult because the emission factors produced in the scientific literature vary widely, reflecting the different conditions under which they were produced.
As far as our research is concerned, the diversity of information available in the literature is a major limitation. The lack of a standard reference makes it difficult to compare our results with previous work and highlights the need to define a common protocol for each recovery method. There is a relative consensus that vermicomposting is more likely to emit CO
2 than composting [
75,
76,
77,
78]. Hobson et al. (2005) [
79] showed that vermicomposting emits less CH
4 than composting due to the aeration effect of earthworms in biowaste compost heaps. These results are shared by Chan et al. (2011) [
77], Lubbers et al. (2013) [
80], Nigussi et al. (2016) [
67] and Dume et al. (2021) [
78]. However, the literature diverges for N
2O emissions. Chan (2011) [
77], Wang et al. (2014) [
81] and Nigussi et al. (2016) [
67] found that the presence of earthworms would reduce N
2O emissions. Conversely, several studies have found a much higher emission rate from vermicomposting [
77,
78,
79]. Many factors affect N
2O emissions. For example, the gut of earthworms contains denitrifying bacteria that affect the nitrogen/carbon ratio of the substrate [
80,
82]. Vermicomposting conditions also play an important role in N
2O emissions. Climatic conditions and maturation time vary the moisture content of the substrate [
82]. N
2O emissions from vermicomposting are therefore difficult to control [
82].
4.3. Methodological Limitations of the Comparison
In addition to the methodological construction of the carbon footprint, there are difficulties in the comparison due to the unequal conditions under which the processes were set up.
The data vary according to factors related to the nature of the biowaste and the composting process. The composition of biowaste varies according to urban location, season and weather conditions; its moisture content varies, which has an impact on Scope 1. Composting processes also have a significant impact on Scope 1 emissions: aeration practices and the addition of carbonaceous materials, as well as ambient temperature [
3,
65]. Finally, biowaste management policies influence Scopes 2 and 3 (e.g., collection methods). Measuring the moisture content of the compost produced by companies and associations in Lyon would have reduced the uncertainties in this carbon footprint. Unfortunately, only industrial composting companies carry out controls as they comply with the NFU-44051 standard [
83]. Products from community composting and community vermicomposting have not been tested.
Community composting, vermicomposting and industrial composting are not equivalent recovery solutions. Although vermicomposting has a lower carbon footprint than composting, these results need to be put into perspective, given the differences between the two systems. There are significant technical challenges to implementing vermicomposting, requiring a thorough understanding of the life cycle of earthworms and the optimum conditions to keep them healthy. Another limiting factor is the sensitivity of earthworms to certain types of food [
84]. These organisms are intolerant of waste products such as dairy products, meat and fish offal, fats and oils, and foods rich in salt or vinegar. This restriction may limit the variety of waste that can be effectively processed by vermicomposting.
Another major challenge is the lack of standards for vermicomposting, unlike composting, which is standardised. The lack of hygiene increases the risk of microbes (
Aspergillus) and bacteria (
Salmonella,
Escherichia coli) developing: this problem is one of the disadvantages of implementing vermicomposting on an industrial scale” [
80]. It also makes vermicomposting particularly difficult to implement, especially for agricultural uses where regulations are often more restrictive. These technical and regulatory limitations, combined with the specific requirements of earthworms, make vermicomposting less practical to implement on a large scale.
4.4. Soil Carbon Capture, Storage and Release
If biogenic carbon is included in emissions, it is interesting to place the issue in the context of agricultural practices, in particular (1) the need for inputs to fertilise crops and amend soils and (2) carbon sequestration by soils.
The production of compost from biowaste has a potential impact on agricultural practices. Farmers need inputs to nourish their crops and soils. Biowaste compost, if standardised, can be used for this purpose and can increase yields three times compared to untreated crops [
85]. This avoids the emissions associated with the production of chemical nitrogen fertilisers [
86] and reduces the use of livestock effluent, which has high emissions [
87].
The agricultural sector has great potential for carbon sequestration by soils and biomass, i.e., the absorption of atmospheric CO
2 by plants and the storage of carbon in soil organic matter [
88]. Most agricultural emissions are nitrous oxide and methane [
79], mainly associated with the livestock sector [
87]. Soil absorbs carbon from the atmosphere through plant photosynthesis and stores it in the form of organic matter [
89].
Since the creation of the PCAETs in 2016, local and regional authorities have been responsible for public policies on soil carbon. They have at their disposal a tool (Aldo) that allows them to estimate the storage capacity of agricultural soils and the emissions to the atmosphere associated with the artificialisation of soils or changes in land use [
90]. It is based, in particular, on standard values (developed by Ademe) for variations in storage capacity per hectare as a function of agricultural activity.
The logic of sequestering and storing carbon in the soil implies changing agricultural practices, in particular ploughing, which releases the sequestered carbon, and promoting practices that store it, such as planting grass and hedges, crop species and fertilisation regime [
74,
82]. Local and regional climate policies cannot be developed without involving the agricultural sector.
4.5. An Opportunity for the Development of Local Policies in the Field of Agriculture, Food and Biowaste?
The carbon balance proposes an analysis of composting processes in terms of GHG emissions, but other criteria could be used to evaluate the processes (social, educational, energy, economic, agricultural, etc.).
The collection and processing of biowaste is often considered from the perspective of a territorial biowaste cycle through energy or agricultural recovery of compost or vermicompost. The aim would be to treat biowaste locally and turn it into a resource for the local area, either energy produced by methanisation, soil improver or fertiliser for the fields. Initial studies have shown the beneficial effects of compost and vermicompost as soil improvers or fertilisers. Ducasse (2023), who carried out studies and comparative measurements on the use of compost and vermicompost as soil improvers and fertilisers, concluded that vermicompost is more beneficial than compost [
49]. However, the agricultural use of compost and vermicompost depends on economic conditions (selling price, local use to reduce transport costs), social conditions (social acceptance of agricultural use of household biowaste), agricultural conditions (type and age of crops, farming practices) and regulatory conditions (hygiene) [
91]. Currently, the regulatory framework does not allow vermicompost to be used for agricultural purposes (in the community or in windrows) because these processes do not guarantee that the compost produced is safe. As far as industrial compost is concerned, if biowaste is to be used in agriculture, support measures need to be put in place, for example, by setting up a network for discussions with farmers and composting facilities.
However, community management of composting and vermicomposting provides the conditions for social facilitation and the teaching of environmental and educational issues [
17,
18]. This is why some municipalities opt for a mixed management policy, combining different mechanisms in order to benefit from their complementary externalities. In the Lyon metropolitan area, several measures have been implemented: the support for local associative composting for approximately ten years, the installation of composting bins in public spaces for two years and experimentation with community vermicomposting in “urban policy” districts for several years.
4.6. Environmental Assessment of Biowaste Management
The carbon footprint of composting facilities is a first step in the environmental assessment of biowaste management. It allows the GHG emissions of each process to be compared by estimating the equivalent CO
2 per ton of biowaste treated. However, it could be refined to include the emissions avoided by reducing the amount of waste incinerated (as biowaste is wet, the energy consumption is higher than for other wastes). Industrial composting emits fewer GHGs than landfilling but can be as polluting as incineration [
92,
93]. Composting and vermicomposting are environmentally beneficial waste treatment processes compared to traditional methods (landfilling, incineration).
Indeed, the combustion of biowaste results in an instantaneous release of CO
2 (pulse) into the atmosphere [
56,
63]. Cherubini et al. (2011) [
56] proposed the formula of “global warming potential of biogenic CO
2 (GWP
bCO2)” to describe the impact of burning biomass for energy compared to burning fossil fuels. For rapidly decomposing biomass from agricultural residues, the GWP
bCO2 is approximately 0.014 g CO
2e/g
bCO2.
In addition, the field study provided information on the agricultural use of compost from the industrial process [
91], which reduces emissions associated with the production of nitrogen fertilisers [
86] and reliance on high-emission livestock manure [
93]. The reuse of biowaste in agriculture through composting appears to be a lever for regional policies that rethink waste as a resource, thereby reducing emissions associated with the production of new resources.
Furthermore, biowaste management is not only an environmental issue. The creation of scenarios for reducing emissions associated with biowaste management, as can be achieved in health policy [
94], would need to take into account the social and economic orientations of the local authority, as well as its resources in terms of equipment, funding and skills.
5. Conclusions
In France, the AGEC law encourages local authorities to set up biowaste collection systems, particularly for households. While these systems have been studied in terms of their efficiency, location of bins and management systems, few studies have been concerned with the issue of carbon impacts. One of the main drawbacks of these systems is the emission of GHGs: CO2, CH4 and N2O.
The analysis carried out in this article proposes a carbon balance for biowaste based on a combination of two biowaste decomposition processes (composting and vermicomposting) and a management criterion (community or industrial management). The results obtained using the Ademe carbon balance methodology show that emissions by scope are very uneven across all sectors, with the majority of emissions falling under Scope 1. There are very few Scope 2 GHG emissions. Community management (composting and vermicomposting) also generates very few Scope 3 emissions.
However, these results need to be put into perspective. The amount of GHGs emitted during the composting and vermicomposting process is highly dependent on several factors: type of waste processed and its composition, aeration, moisture content, temperature, carbon/nitrogen ratio, pH, blowing agents, etc.
Further research is needed to broaden the analysis criteria to include variables related to the specificities of the processes used by operators (e.g., rate and nature of bulking materials) and changes in treatment conditions during the year (e.g., weather, composition of biowaste, etc.). This would provide local authorities with a more informed view so that they can make informed environmental choices about biowaste management solutions.
Biowaste management is not only a question of environmental criteria. For example, the sorting behaviour of households, the spatial configuration of housing, contracts linking local authorities and private operators, and the hygienic quality of compost (standardisation) are all parameters that can influence the choice of biowaste management methods.
Author Contributions
C.B.: Literature review, carbon assessment of composting processes (emission factors, scope, data), analysis of results, co-writing, and proofreading. M.M.: Contextualising the issues surrounding composting and vermicomposting, field research, sustainability issues and public policy, co-writing, and proofreading. M.G.: Field survey, analysis of carbon footprint results, comparison of results with environmental assessment methodology and climate policy issues; literature review, co-writing, and proofreading. All authors have read and agreed to the published version of the manuscript.
Funding
This research has not received any external funding.
Data Availability Statement
The quantified data used in this article come from surveys of composting and vermicomposting operators and reports from the Lyon metropolitan area. The emission factors are taken from the carbon base of the French Agency for Ecological Transition (ADEME). For technical equipment (shredders, motors, etc.), the data are taken from the manufacturers’ data sheets.
Conflicts of Interest
The authors declare that they have no known competing financial interests or personal relationships that could have appeared to influence the work reported in this paper.
References
- Zandalinas, S.I.; Fritschi, F.B.; Mittler, R. Global Warming, Climate Change, and Environmental Pollution: Recipe for a Multifactorial Stress Combination Disaster. Trends Plant Sci. 2021, 26, 588–599. [Google Scholar] [CrossRef]
- Dias, A.C.; Arroja, L. Comparison of methodologies for estimating the carbon footprint–case study of office paper. J. Clean. Prod. 2012, 24, 30–35. [Google Scholar] [CrossRef]
- Yasmin, N.; Jamuda, M.; Panda, A.K.; Samal, K.; Nayak, J.N. Emission of greenhouse gases (GHGs) during composting and vermicomposting: Measurement, mitigation, and perspectives. Energy Nexus 2022, 7, 100092. [Google Scholar] [CrossRef]
- Behera, S.; Samal, K. Sustainable approach to manage solid waste through biochar assisted composting. Energy Nexus 2022, 7, 100121. [Google Scholar] [CrossRef]
- Food and Agriculture Organization of the United Nations. Global Initiative on Food Loss and Waste Reduction. 2015, p. 8. Available online: https://openknowledge.fao.org/server/api/core/bitstreams/57f76ed9-6f19-4872-98b4-6e1c3e796213/content (accessed on 19 December 2024).
- Kaza, S.; Yao, L.; Bhada-Tata, P.; Van Woerden, F. What a Waste 2.0: A Global Snapshot of Solid Waste Management to 2050; World Bank Publications: Washington, DC, USA, 2018; p. 295. Available online: https://openknowledge.worldbank.org/entities/publication/d3f9d45e-115f-559b-b14f-28552410e90a (accessed on 19 December 2024).
- UNEP. Beyond an Age of Waste. Turning Rubbish into a Resource; UNEP: Nairobi, Kenya, 2024; p. 116. [Google Scholar]
- Marcoux, M.-A.; Buffiere, P.; Germain, P. Méthanisation de déchets organiques. In Déchets et Économie Circulaire; Marcoux, M.-A., Olivier, F., Théry, F., Eds.; Lavoisier: Paris, France, 2016; pp. 297–328. [Google Scholar]
- Fontaine, A.; Rocher, L. Géographies de la chaleur. L’énergie de récupération comme ressource territoriale. Espaces Sociétés 2021, 182, 113–129. [Google Scholar] [CrossRef]
- Hamelin, L.; Thomsen, M.; Teigiserova, D. Review of high-value food waste and food residues biorefineries with focus on unavoidable wastes from processing. Resour. Conserv. Recycl. 2019, 149, 413–426. [Google Scholar]
- Cong, R.-G.; Thomsen, M. Review of ecosystem services in a bio-based circular economy and governance mechanisms. Ecosyst. Serv. 2021, 50, 101298. [Google Scholar] [CrossRef]
- Ademe. Le Traitement des Déchets Ménagers et Assimilés–ITOM 2020. Available online: https://librairie.ademe.fr/dechets-economie-circulaire/5646-le-traitement-des-dechets-menagers-et-assimiles-itom-2020.html (accessed on 19 December 2024).
- Morales-Polo, C.; Cledera-Castro, M.M.; Soria, M. Reviewing the Anaerobic Digestion of Food Waste: From Waste Generation and Anaerobic Process to Its Perspectives. Appl. Sci. 2018, 10, 1804. [Google Scholar] [CrossRef]
- Francou, C. Stabilisation de la Matière Organique au Cours du Compostage de Déchets Urbains: Influence de la Nature des Déchets et du Procédé. Ph.D. Thesis, Institut National Agronomique Paris-Grignon, Paris, France, 2004; p. 289. [Google Scholar]
- Tahsini, M.J.; Nikaeen, M.; Nafez, A.H. Biological treatment of compost leachate: Assessing the efficacy of composting process and bioaugmentation of composting piles. Environ. Technol. Innov. 2024, 36, 103859. [Google Scholar] [CrossRef]
- Onwosi, C.O.; Igbokwe, V.C.; Odimba, J.N.; Eke, C.D.; Nwankwoala, M.O.; Iroh, N.I.; Ezeogu, L.I. Composting technology in waste stabilization: On the methods, challenges and future prospects. J. Environ. Manag. 2017, 190, 140–157. [Google Scholar] [CrossRef]
- Dumain, A.; Rocher, L. Des pratiques citoyennes en régime industriel: Les courts-circuits du compost. Flux 2017, 108, 22–35. [Google Scholar] [CrossRef]
- Boespflug, M.; Carré, C.; Lamarche, T. Biodéchets: Retour d’expériences de commoning autour du compostage de proximité. Flux 2021, 124–125, 12–26. [Google Scholar] [CrossRef]
- Leménager, T.; Ehrenstein, V. Des principes agroécologiques à leur mise en pratique. Quels effets environnementaux en Zambie et quels enseignements pour les bailleurs de fonds? Rev. Tiers Monde 2016, 226–227, 65–93. [Google Scholar] [CrossRef]
- Cirelli, C.; Maccaglia, F.; Melé, P. L’incinérateur est trop près, la poubelle trop loin »: Gérer les déchets en régime de proximité. Flux 2017, 109–110, 61–72. [Google Scholar] [CrossRef]
- Iacovidou, E.; Zorpas, A.A. Exploratory research on the adoption of composting for the management of biowaste in the Mediterranean island of Cyprus. Clean. Circ. Bioeconomy 2022, 1, 100007. [Google Scholar] [CrossRef]
- Smith, S.R. Un examen critique de la biodisponibilité et des impacts des métaux lourds dans les composts de déchets solides municipaux par rapport aux boues d’épuration. Environ. Int. 2009, 35, 142–156. [Google Scholar] [CrossRef]
- Wu, H.; Liu, B.; Pan, S. Thermoactinomyces guangxiensis sp. nov. un actinomycète thermophile isolé du compost de champignons. Int. J. Syst. Evol. Microbiol. 2015, 65, 2859–2864. [Google Scholar] [CrossRef]
- Epelde, L.; Jauregi, L.; Urra, J.; Ibarretxe, L.; Romo, J.; Goikoetxea, I.; Garbisu, C. Characterization of Composted Organic Amendments for Agricultural Use. Front. Sustain. Food Syst. 2018, 2, 44. [Google Scholar] [CrossRef]
- Planchon, M.; Déportes, I.; Chouvenc, S.; Koite, A.; Plantivaux, A. Survie des micro-organismes pathogènes alimentaires pendant le traitement des déchets organiques. Que savons-nous, quels manques demeurent? Environ. Risques Santé 2020, 19, 7–19. [Google Scholar]
- Zhang, S.; Wang, J.; Chen, X.; Gui, J.; Sun, Y.; Wu, D. Industrial-scale food waste composting: Effects of aeration frequencies on oxygen consumption, enzymatic activities and bacterial community succession. Bioresour. Technol. 2021, 320, 124357. [Google Scholar] [CrossRef]
- Sharma, A.; Saha, T.N.; Arora, A.; Shah, R.; Nain, L. Efficient Microorganism Compost Benefits Plant Growth and Improves Soil Health in Calendula and Marigold. Hortic. Plant J. 2017, 3, 67–72. [Google Scholar] [CrossRef]
- Luo, G.; Li, L.; Friman, V.-P.; Guo, J.; Guo, S.; Shen, Q.; Ling, N. Organic amendments increase crop yields by improving microbe-mediated soil functioning of agroecosystems: A meta-analysis. Soil Biol. Biochem. 2018, 124, 105–115. [Google Scholar] [CrossRef]
- Martynow, A. Agrinergie, agro-alimentaire: Ressources et initiatives. Courr. Hebd. CRISP 1982, 958, 1–27. [Google Scholar] [CrossRef]
- Kampelmann, S. Mesurer l’économie circulaire à l’échelle territoriale Une analyse systémique de la gestion des matières organiques à Bruxelles. Rev. l’OFCE 2016, 145, 161–184. [Google Scholar]
- Maillefert, M.; Berdier, C. The challenges of composting household biowaste. From the construction of a value chain to a metabolic approach of flows. The case of the Greater Lyon (France). J. Reg. Urban Econ. 2024, 4, 481–509. [Google Scholar]
- Bertolini, G.; Brakez, M. Gestion des déchets, innovations et territoires Retours d’expériences et recherche contextuelle. Marché Organ. 2008, 7, 92–113. [Google Scholar] [CrossRef]
- Bouché, M.; Ferriere, G.; Soto, P. The role of earthworms in the decomposition and nitrogen nutrition of plants in a grassland. In Earthworms; Bonvicini Pagliai, A.M., Omodeo, P., Eds.; Selected Symposia and Monographs; Mucchi: Modena, Italy, 1987; pp. 113–129. [Google Scholar]
- Ducasse, V.; Watteau, F.; Kowalewski, I.; Ravelojaona, H.; Capowiez, Y.; Peigné, J. The amending potential of vermicompost, compost and digestate from urban biowaste: Evaluation using biochemical, Rock-Eval® thermal analyses and transmission electronic microscopy. Bioresour. Technol. Rep. 2023, 22, 101405. [Google Scholar] [CrossRef]
- Costa, S.; Donner, M.; Duquennoi, C.; Savary, V. Les start-ups de collecte et valorisation des biodéchets en ville: Une étude de leurs modèles d’affaires. Agric. Econ. Search 2024, 2024, 1–4. [Google Scholar]
- Foyer, J.; Dumoulin, K. L’environnementalisme social mexicain: Une version endémique de l’écologie politique. Écologie Polit. 2013, 46, 83–94. [Google Scholar] [CrossRef]
- Pallandre, A. Lombricompostage à Mexico. Cah. Pédagogiques 2020, 560, 27. [Google Scholar] [CrossRef]
- Schmid, M.T. Decentralized Management of Urban Food Waste: A Proof of Concept with Neighborhood-Scale Vermicomposting in Montreal, Canada. Master’s Thesis, McGill University (Canada), Montreal, QC, Canada, 2022. [Google Scholar]
- Ndiaye, I.A.; Tendeng, E.; Sylla, E.H.L.; Balde, A.; Seydi, O.; Diarra, K. Efficacité de l’espèce locale Eudrilus eugenia (Haplotaxida: Eudrilidae) dans le processus de conversion des déchets organiques en vermiculture au Sénégal. Afr. Sci. 2022, 21, 25–33. [Google Scholar]
- Rakotobe, R.; Razafindrakoto, M.; Ravonjiarison, N.; Blanchart, E.; Andriamifidy, T.; Bernard, L.; Raminoarison, M.; Rakotomalala, H.H.; Ratsiatosika, O.; Autfray, P. Recherche-action en partenariat et ressources végétales mobilisables pour la production de lombricompost dans les Hautes Terres de Madagascar. Rev. BASE-Biotechnol. Agron. Société Et Environ./Biotechnol. Agron. Soc. Environ. 2024, 28, 131–146. [Google Scholar] [CrossRef]
- Francis, F.; Haubruge, E.; Thang, P.T.; Van Kinh, L.; Lebailly, P.; Gaspar, C. Technique de lombriculture au Sud Vietnam. Biotechnol. Agron. Société Environ. 2003, 7, 171–175. [Google Scholar]
- Francis, F.; Haubruge, E.; Thang, P.T.; Van Kinh, L.; Lebailly, P.; Gaspar, C. Perspectives de développement de la lombriculture au Sud Vietnam. Notes Fauniques Gembloux 2005, 58, 7–10. [Google Scholar]
- Lim, S.L.; Lee, L.H.; Wu, T.Y. Sustainability of using composting and vermicomposting technologies for organic solid waste biotransformation: Recent overview, greenhouse gases emissions and economic analysis. J. Clean. Prod. 2016, 111, 262–278. [Google Scholar] [CrossRef]
- Gomez-Brandon, M.; Lores, M.; Dominguez, J. Species-Specific Effects of Epigeic Earthworms on Microbial Community Structure during First Stages of Decomposition of Organic Matter. PLoS ONE 2012, 7, e31895. [Google Scholar] [CrossRef]
- Singh, R.P.; Araujo, A.S.F.; Ibrahim, M.H.; Sulaiman, O. Management of urban solid waste: Vermicomposting a sustainable option. Resour. Conserv. Recycl. 2011, 55, 719–729. [Google Scholar] [CrossRef]
- Al-Ghussain, L. Global warming: Review on driving forces and mitigation. Environ. Program. Sustain. Energy 2019, 38, 13–21. [Google Scholar] [CrossRef]
- Gage, J. Checklist for odor management at compost facilities. BioCycle 2003, 44, 42. [Google Scholar]
- Monroy, F.; Aira, M.; Dominguez, J. Changes in density of nematodes, protozoa and total coliforms after transit through the gut of four epigeic earthworms (Oligochaeta). Appl. Soil Ecol. 2008, 39, 127–132. [Google Scholar] [CrossRef]
- Ducasse, V. Valorisation des Biodéchets Urbains par Vermicompostage sur des Sols de Grandes Cultures Conduits en AB: Une Pratique Agroécologique Pour Préserver la Biodiversité des Sols? Ph.D. Thesis, AgroParisTech, Lyon, France, 2023; p. 309. [Google Scholar]
- Ademe. Evaluation 2021 de la Règlementation des Bilans D’émissions de gaz à Effet de Serre. Available online: https://librairie.ademe.fr/changement-climatique/5919-evaluation-2021-de-la-reglementation-des-bilans-d-emissions-de-gaz-a-effet-de-serre.html (accessed on 19 December 2024).
- Pallez, F. L’élaboration d’une politique publique environnementale, le Bilan Carbone®. Ann. Des Mines-Gérer Compr. 2017, 129, 13–19. [Google Scholar] [CrossRef]
- World Business Council for Sustainable Development; World Resources Institute. The Greenhouse Gas Protocole. A corporate Accouting and Reporting Standard, 116. Available online: https://ghgprotocol.org/sites/default/files/standards/ghg-protocol-revised.pdf (accessed on 14 January 2025).
- ISO 14064-1; Greenhouse Gases. Part 1: Specification with Guidance at the Organization Level for Quantification and Reporting of Greenhouse Gas Emissions and Removals. ISO: Geneva, Switzerland, 2018.
- European Parliament and the Council of the European Union. Directive 2003/87/EC of the European Parliament and of the Council of 13 October 2003 establishing a scheme for greenhouse gas emission allowance trading within the Community and amending Council Directive 96/61/EC. Off. J. Europ. Union 2003, L 275/32, 32–46.
- Ministère de la Transition écologique (Ministry of Ecological Transition). Décret n° 2022-982 of 1 July 2022 on Greenhouse Gas Emission Assessments. 2022. Available online: https://www.legifrance.gouv.fr/jorf/id/JORFTEXT000046006338 (accessed on 14 January 2025).
- Cherubini, F.; Bright, R.M.; Strømman, A.H. Site-specific global warming potentials of biogenic CO2 for bioenergy: Contributions from carbon fluxes and albedo dynamics. Environ. Res. Lett. 2012, 7, 045902. [Google Scholar] [CrossRef]
- Rodin, V.; Lindorfer, J.; Böhm, H.; Vieira, L. Assessing the potential of carbon dioxide valorisation in Europe with focus on biogenic CO2. J. CO2 Util. 2020, 41, 101219. [Google Scholar] [CrossRef]
- Buchholz, T.; Hurteau, M.D.; Gunn, J.; Saah, D. A global meta-analysis of forest bioenergy greenhouse gas emission accounting studies. Glob. Change Biol. Bioenergy 2015, 8, 281–289. [Google Scholar] [CrossRef]
- Liu, W.; Hou, Y.; Liu, W.; Yang, M.; Yan, Y.; Peng, C.; Yu, Z. Global estimation of the climate change impact of logging residue utilization for biofuels. For. Ecol. Manag. 2020, 462, 118000. [Google Scholar] [CrossRef]
- Lleó, T.; Albacete, E.; Barrena, R.; Font, X.; Artola, A.; Sánchez, A. Home and vermicomposting as sustainable options for biowaste management. J. Clean. Prod. 2013, 47, 70–76. [Google Scholar] [CrossRef]
- Intergovernmental Panel of Climate Change (IPCC). Climate Change 2014: Mitigation of Climate Change; Cambridge University Press: Cambridge, UK, 2015. [Google Scholar]
- Guest, G.; Bright, R.M.; Cherubini, F.; Strømman, A.H. Consistent quantification of climate impacts due to biogenic carbon storage across a range of bio-product systems. Environ. Impact Assess. Rev. 2013, 43, 21–30. [Google Scholar] [CrossRef]
- Adetona, A.B.; Layzell, D.B. Diverting residual biomass to energy use: Quantifying the global warming potential of biogenic CO2 (GWPbCO2). Glob. Change Biol. Bioenergy 2023, 15, 697–709. [Google Scholar] [CrossRef]
- Nordahl, S.; Preble, C.V.; Kirchstetter, T.W.; Scown, C.D. Greenhouse Gas and Air Pollutant Emissions from Composting. Environ. Sci. Technol. 2023, 57, 2235–2247. [Google Scholar] [CrossRef]
- Ademe. Compostage Industriel. 2025. Available online: https://prod-basecarbonesolo.ademe-dri.fr/documentation/UPLOAD_DOC_FR/index.htm?compostage-domestique.htm (accessed on 25 February 2025).
- Upcycle. Gestion des Biodéchets: Adoptez une Solution SOBRE en Carbone! 2022. Available online: https://www.upcycle.org/bilan-carbone-le-composteur-industriel-upcycle-sort-en-tete/ (accessed on 25 February 2025).
- Nigussie, A.; Kuyper, T.W.; Bruun, S.; Neergaard, A. Vermicomposting as a technology for reducing nitrogen losses and greenhouse gas emissions from small-scale composting. J. Clean. Prod. 2016, 139, 429–439. [Google Scholar] [CrossRef]
- Andersen, J.K.; Boldrin, A.; Samuelsson, J.; Christensen, T.H.; Scheutz, C. Quantification of Greenhouse Gas Emissions from Windrow Composting of Garden Waste. J. Environ. Qual. 2010, 39, 713–724. [Google Scholar] [CrossRef] [PubMed]
- Zhang, C.; Liu, J.; Zhu, Y.; Raza, S.T.; Chen, Z. Nitrous oxide emissions from vermicompost preparation and application phases: Emission factors based on a meta-analysis. Appl. Soil Ecol. 2023, 183, 104769. [Google Scholar] [CrossRef]
- Komakech, A.J.; Sundberg, C.; Jönsson, H.; Vinneras, B. Life cycle assessment of biodegradable waste treatment systems for sub-Saharan African cities. Resour. Conserv. Recycl. 2015, 99, 100–110. [Google Scholar] [CrossRef]
- Yang, F.; Li, G.; Zang, Z. The maturity and CH4, N2O, NH3. Emissions from vermicomposting with agricultural waste. Compost. Sci. Util. 2017, 25, 262–271. [Google Scholar] [CrossRef]
- Lv, B.; Zhang, D.; Cui, Y.; Yin, F. Effects of C/N ratio and earthworms on greenhouse gas emissions during vermicomposting of sewage sludge. Bioresour. Technol. 2018, 268, 408–414. [Google Scholar] [CrossRef]
- Samal, K.; Dash, R.R. Modelling of pollutants removal in Integrated Vermifilter (IVmF) using response surface methodology. Clean. Eng. Technol. 2021, 2, 100060. [Google Scholar] [CrossRef]
- US EPA. Understanding Global Warming Potentials. 2023. Available online: https://www.epa.gov/ghgemissions/understanding-global-warming-potentials (accessed on 19 December 2024).
- Speratti, A.B.; Whalen, J.K. Carbon dioxide and nitrous oxide fluxes from soil as influenced by anecic and endogeic earthworms. Appl. Soil Ecol. 2008, 38, 27–33. [Google Scholar] [CrossRef]
- Chapuis-Lardy, L.; Brauman, A.; Bernard, L.; Pablo, A.L.; Toucet, J.; Mano, M.J.; Weber, L.; Brunet, D.; Razafimbelo, T.; Chotte, J.L. Effect of the endogeic earthworm Pontoscolex corethrurus on the microbial structure and activity related to CO2 and N2O fluxes from a tropical soil (Madagascar). Appl. Soil Ecol. 2010, 45, 201–208. [Google Scholar] [CrossRef]
- Chan, Y.C.; Sinha, R.K.; Wang, W. Emission of greenhouse gases from home aerobic composting, anaerobic digestion and vermicomposting of household wastes in Brisbane (Australia). Waste Manag. Resour. 2011, 29, 540–548. [Google Scholar] [CrossRef]
- Dume, B.; Hanc, A.; Svehla, P.; Míchal, P.; Chane, A.D.; Nigussie, A. Carbon Dioxide and Methane Emissions during the Composting and Vermicomposting of Sewage Sludge under the Effect of Different Proportions of Straw Pellets. Atmosphere 2021, 12, 1380. [Google Scholar] [CrossRef]
- Hobson, A.M.; Frederickson, J.; Dise, N.B. CH4 and N2O from mechanically turned windrow and vermicomposting systems following in-vessel pre-treatment. Waste Manag. 2005, 25, 345–352. [Google Scholar] [CrossRef] [PubMed]
- Lubbers, I.M.; van Groenigen, K.J.; Fonte, S.J.; Six, J.; Brussaard, L.; van Groenigen, J.W. Greenhouse gas emissions from soils increased by earthworms. Nat. Clim. Change 2013, 3, 187–194. [Google Scholar] [CrossRef]
- Wang, J.; Hu, Z.; Xu, X.; Jiang, X.; Zheng, B.; Liu, X.; Kardol, P. Emissions of ammonia and greenhouse gases during combined pre-composting and vermicomposting of duck manure. Waste Manag. 2014, 34, 1546–1552. [Google Scholar] [CrossRef]
- Raza, S.T.; Rong, L.; Rene, E.R.; Ali, Z.; Iqbal, H.; Sahito, Z.A.; Chen, Z. Effects of vermicompost preparation and application on waste recycling, NH3, and N2O emissions: A systematic review on vermicomposting. Environ. Technol. Innov. 2024, 35, 103722. [Google Scholar] [CrossRef]
- NF U44-051, 2006; Organic Soil Improvers—Designations, Specifications and Marking. AFNOR (Association Française de Normalisation): Saint-Denis, France, 2006.
- Lohri, C.R.; Diener, S.; Zabaleta, I.; Mertenat, A.; Zurbrrügg, C. Treatment technologies for urban solid biowaste to create value products: A review with focus on low- and middle-income setting. Environ. Sci. Biotechnol. 2017, 16, 81–130. [Google Scholar] [CrossRef]
- Cannavo, P.; Herbreteau, A.; Juret, D.; Martin, M.; Guénon, R. Short-term effets of food waste composts on physicochemical soil quality and horticultural crop production. J. Plan Nutr. Soil Sci. 2024, 188, 31–44. [Google Scholar] [CrossRef]
- Ministère de L’agriculture et de la Souveraineté alimentaire. Fiche Préparatoire à la Concertation en Groupe de Travail. Tendances Facteurs de Production: Engrais azotés. Concertation pour le Pacte et la loi D’orientation et D’avenir Agricole, 2022, 3. Available online: https://agriculture.gouv.fr/pacte-et-loi-dorientation-et-davenir-agricoles-les-fiches-reperes (accessed on 14 January 2025).
- Woolery, S.; Osei, E.; Yu, M.; Güney, S.; Lovell, A.; Jafri, H. The Carbon Footprint of a 5000-Milking-Head Dairy Operation in Central Texas. Agriculture 2023, 13, 2109. [Google Scholar] [CrossRef]
- Treyer, S.; Aubert, P.; Rankovic, A.; Schwoob, M. Assurer la transition de l’ensemble du système agricole et alimentaire vers la neutralité carbone: Des trajectoires de long terme et des pistes pour le court terme. Ann. Des Mines-Responsab. Environ. 2018, 89, 25–29. [Google Scholar] [CrossRef]
- Arrouays, D.; Balesdent, J.; Germon, J.C.; Jayet, P.A.; Soussana, J.F.; Stengel, P. Contribution à la lutte contre l’effet de serre: Stocker du carbone dans les sols agricoles de France? Expertise Scientifique Collective INRA pour le MEDD. INRA 2002, 334, hal-02832401. [Google Scholar] [CrossRef]
- Leclerc, R. Le carbone des sols et son public L’outil Aldo au service de la politique climatique locale? Réseaux 2024, 244, 83–115. [Google Scholar] [CrossRef]
- Berdier, C.; Girault, M.; Maillefert, M. Du métabolisme territorial des biodéchets ménagers à leur valorisation en compost pour l’agriculture. Le cas de l’aire métropolitaine lyonnaise. In Proceedings of the 60ème Colloque de l’ASRDLF, Strasbourg, France, 27 June 2024. [Google Scholar]
- Sobieraj, K.; Stegenta-Dąbrowska, S.; Zafiu, C.; Binner, E.; Białowiec, A. Carbon Monoxide Production during Bio-Waste Composting under Different Temperature and Aeration Regimes. Materials 2023, 16, 4551. [Google Scholar] [CrossRef] [PubMed]
- Lou, X.F.; Nair, J. The impact of landfilling and composting in greenhouse gas emission. A review. Bioresour. Technol. 2009, 100, 3792–3798. [Google Scholar] [CrossRef] [PubMed]
- Mermillod, B.; Tornare, R.; Jochum, B.; Ray, N.; Flahault, A. Estimating the Carbon Footprint of Healthcare in the Canton of Geneva and Reduction Scenarios for 2030 and 2040. Int. J. Environ. Responsaibility Public Health 2024, 21, 690. [Google Scholar] [CrossRef]
| Disclaimer/Publisher’s Note: The statements, opinions and data contained in all publications are solely those of the individual author(s) and contributor(s) and not of MDPI and/or the editor(s). MDPI and/or the editor(s) disclaim responsibility for any injury to people or property resulting from any ideas, methods, instructions or products referred to in the content. |
© 2025 by the authors. Licensee MDPI, Basel, Switzerland. This article is an open access article distributed under the terms and conditions of the Creative Commons Attribution (CC BY) license (https://creativecommons.org/licenses/by/4.0/).


